Embed Size (px)
Citation preview


2 ALASKA ECONOMIC TRENDSAUGUST 2017
AUGUST 2017Volume 37 Number 8
ISSN 0160-3345
Alaska Economic Trends is a monthly publica on whose purpose is to objec vely inform the public about a wide variety of economic issues in the state. Trends is funded by the Employment and Training Services Division of the Alaska Department of Labor and Workforce Development and is published by the department’s Research and Analysis Sec on. Trends is printed and distributed by Assets, Inc., a voca onal training and employment program, at a cost of $1.37 per copy. Material in this publica on is public informa on, and with appropriate credit may be reproduced without permission.
Sam DapcevichCover Ar st
Sara WhitneyEditor
To request a free electronic or print subscrip on, e-mail [email protected] or call (907) 465-4500.Trends is on the Web at labor.alaska.gov/trends.
Dan RobinsonChief, Research and Analysis
Bill WalkerGovernor
Heidi DrygasCommissioner
ON THE COVER: Unalaska, photo by Ryan SchuesslerON PAGE 10: Heavy oil wellhead gauge, photo by Flickr user Colby Cosh
ALASKA DEPARTMENTof LABOR
and WORKFORCEDEVELOPMENT
HOW to MONITOR the ECONOMY
MILITARY SPENDING in ALASKA
The 2017 RENTAL MARKET
PAGE 10
PAGE 9
PAGE 4
By DAN ROBINSON
By CONOR BELL
By KARINNE WIEBOLD
Rolling out a new regular feature in Trends
Alaska is third among states for per capita defense spending
Vacancy up in most places, average rent up slightly
GAUGING ALASKA’s ECONOMY PAGE 14
3ALASKA ECONOMIC TRENDS AUGUST 2017
Heidi DrygasCommissioner
Follow the Alaska Department of Labor and Workforce Development on Facebook (facebook.com/alaskalabor) and Twi er (twi er.com/alaskalabor) for the latest news about jobs, workplace safety, and workforce development.
New order supports worker safety and labor rightsGovernor Bill Walker recently issued Administrative Order 286 to improve the effi ciency and fairness of public contracts. The order directs our depart-ment and the Department of Adminis-tration to propose regulations to create a pre-qualifi cation process that incen-tivizes worker safety and labor rights compliance.
This order, and the regulations we will develop, will improve working condi-tions in Alaska and ensure Alaska-based companies have a level playing fi eld for winning state government contracts.
The government has a responsibility to invest money effi ciently and align public spending with our shared val-ues. Governor Walker’s Administrative Order 286 will improve the contracting process by ensuring public contracts go to businesses that abide by the law. It also expresses our values, including respect for workers’ safety and labor rights.
This administrative order will reform the way state contracts are awarded. Right now, law-abiding Alaska compa-nies can be undercut by low bids that are premised on worker exploitation and unsafe working conditions. Instead of encouraging a race to the bottom, state procurement practices should encourage safe workplaces and compli-ance with existing labor rights laws.
Most Alaska businesses strive to com-ply with the law, improve workplace safety, and honor their employees’ la-bor rights. These high-road companies should be at the front of the line for
state contracts. They certainly should not be at a competitive disadvantage because they invest in workplace safety, and we should ensure their employees receive the wages they have earned.
Other states and localities have insti-tuted policies like the pre-qualifi cation process being established by Gover-nor Walker. Unfortunately, the federal government has not, and we have seen the consequences of that fi rst-hand in Alaska. A few years ago, a company notorious for abusing labor rights won a low-bid pre-commercial tree-thinning contract in Southeast Alaska.
The employer, who traffi cked illegal immigrants for cheap labor, was able to submit low bids because he underpaid his employees and failed to provide basic safety equipment. One of his em-ployees, who was from Mexico, was killed on the job due to faulty equip-ment and unsafe workplace practices.
This was a lose-lose-lose situation. The federal government had an irrespon-sible contractor, Alaska workers lost jobs to illegal immigrants whose labor rights were being exploited, and a man lost his life due to his employer’s repre-hensible behavior.
In reforming the state procurement process to ensure companies with egregious labor rights violations do not receive state contracts, we are ensuring smart investment of Alaska’s public re-sources — with law-abiding businesses. For many decades, Alaska has been a state that values workers’ rights and safety. This administrative order builds on that legacy.

4 ALASKA ECONOMIC TRENDSAUGUST 2017
Notes: Infl a on adjustment uses 2016 dollars, as 2017 is not yet available. Source: Alaska Department of Labor and Workforce Development, Research and Analysis Sec on and Alaska Housing Finance Corpo-ra on, 2017 Rental Market Survey
1 A , 2000 2017Average Rent Plus U li es Remains Fairly Steady
The rental housing market hasn’t suff ered signifi -cant setbacks as a result of the recession and area markets vary, but the overarching trend of
near-fl at rents and increased vacancies indicate the market is so ening.
According to the March 2017 rental survey, Alaska’s average rent for all unit types plus u li es increased by just $7, or 0.6 percent, from last year. The overall vacancy rate rose from 5.8 percent to 7.3 percent.
(See exhibits 1 and 2.)
Overall vacancy above averageVacancy rates have been trending upward since 2010, reaching a decade high this year (7.3 percent) that’s well above the 10-year average of 5.8 percent. But for historical perspec ve, the current rate is also about what it was in 2009 and 2007, years Alaska was not in a recession.
Vacancy increased in most areas, and when combined
Vacancy rates up in most places, average rent increases slightly
THE 2017RENTALMARKET
By KARINNE WIEBOLD
$500$600$700$800$900
$1,000$1,100$1,200$1,300
2000 2001 2002 2003 2004 2005 2006 2007 2008 2009 2010 2011 2012 2013 2014 2015 2016 2017
Adjusted to 2016 dollars

5ALASKA ECONOMIC TRENDS AUGUST 2017
Rental Costs and Vacancy Rates by Area2 A , 2017
Average Rent Number of Units
Percentage of Units with UtilitiesIncluded in Contract Rent
Survey Area Contract* Adjusted* Total VacantVac
Rate Heat LightHot
Water Water Trash Sewer Snow
Anchorage, Municipality $1,143 $1,269 8,306 422 5.1% 75% 22% 79% 49% 95% 49% 88%Fairbanks North Star Borough $1,066 $1,208 3,001 367 12.2% 89% 15% 77% 91% 84% 91% 77%Juneau, City and Borough $1,174 $1,305 1,003 57 5.7% 55% 22% 52% 99% 93% 97% 81%Kenai Peninsula Borough $891 $1,054 1,107 125 11.3% 66% 28% 63% 86% 73% 85% 75%Ketchikan Gateway Borough $1,006 $1,110 473 47 9.9% 80% 29% 74% 47% 43% 48% 73%Kodiak Island Borough $1,302 $1,433 375 26 6.9% 76% 10% 69% 97% 94% 97% 66%Matanuska-Susitna Borough $1,103 $1,253 1,212 92 7.6% 51% 17% 50% 90% 65% 86% 70%Sitka, City and Borough $1,039 $1,319 345 26 7.5% 36% 9% 36% 13% 20% 22% 55%Valdez-Cordova Census Area $1,179 $1,337 258 12 4.7% 70% 34% 61% 78% 77% 78% 80%Wrangell Borough/Petersburg CA $744 $944 158 20 12.7% 44% 9% 31% 41% 46% 41% 53%Survey wide $1,111 $1,245 16,654 1,222 7.3% 73% 20% 72% 66% 85% 66% 81%
*Contract rent is the amount paid to the landlord each month, which may or may not include some u li es. Adjusted rent is rent plus all u li es.
Source: Alaska Department of Labor and Workforce Development, Research and Analysis Sec on and Alaska Housing Finance Corpora on, 2017 Rental Market Survey
with near-fl at rents it indicates diminished demand for rental units.
While the state’s popula on con nued to grow over-all through 2016, the most recent year available, more people le Alaska than moved in for the last four years, which likely aff ected the pool of poten al renters.
Vacancy rates in Anchorage and Juneau, two tra-di onally ght markets, remain well below the statewide average at 5.1 percent and 5.7 percent respec vely, but both rates are up signifi cantly from 2016, when they were in the 3 percent range. Both ci es have been hit by job losses, led by state govern-ment declines in Juneau and losses in the oil and gas industry and in professional and business services in Anchorage.
Vacancy rates ranged from 9.9 percent to 12.7 per-cent in Ketchikan, Kenai, Fairbanks, and the Wrangell-Petersburg area. All four areas’ vacancies increased from 2016, and all but Ketchikan are above their 10-year averages. Vacancy rates in small areas can be par cularly vola le from year to year, though, so lon-ger periods are necessary to establish a trend.
Average rent up 0.6 percentIn 2017, average rent including u li es was $1,245, up just 0.6 percent from 2016. The slight increase was in line with prior years, as rent increases have been mini-mal over the last eight years.1 (See Exhibit 1.)1All rents in this ar cle are adjusted for infl a on.
Rent jumped by $51 from 2008 to 2009, but since then, increases have averaged just $5, which factors in two years of rent declines over that period (by less than $10 in 2011 and 2012).
This year, rent went up in half of the 10 surveyed ar-eas, with the largest rent increases in Sitka (7 percent) and Wrangell-Petersburg (6 percent). The Matanuska-Susitna Borough’s average rent went up 2 percent, and Anchorage and Fairbanks saw small rent increases of less than 1 percent.
Rent fell in fi ve areas in 2017. Juneau and Valdez-Cordova rents declined by 2 percent and Ketchikan, Kenai, and Kodiak rents dipped by about 1 percent or less.
How many paychecksneeded to aff ord rent The rent and u lity aff ordability index es mates how
About the yearly rental surveyEach March, in cooperation with the Alaska Housing Finance Corporation, the Alaska Department of Labor and Workforce Development surveys thousands of landlords across the state to gather residential rental unit information. Data on approximately 16,500 units provide insight into statewide and local market condi-tions.

6 ALASKA ECONOMIC TRENDSAUGUST 2017
4 A ,
Number of PaychecksNeeded to Aff ord Rent
many average wage earners it takes to aff ord the average rent, including u li es, assuming 30 percent of gross income is available for rent. (See Exhibit 4.) Households are considered cost-burdened if they spend more than 30 percent of total income on rent and u li es.
Aff ording the average rent statewide requires less than one average monthly paycheck, but aff ordabil-ity ranges from a low of nine-tenths of a paycheck in Anchorage to a high of one full paycheck plus an addi- onal third in Kodiak. Kodiak, the Matanuska-Susitna
Borough, and Sitka require substan ally more than a single average paycheck to aff ord rent. However,
ren ng in Mat-Su requires less than a single paycheck for workers who commute to Anchorage, which has higher average wages.
Fairbanks and Juneau aff ordability values have shi ed considerably since 2000, but in diff erent direc ons.
A single Fairbanks wage earner had more wiggle room in 2000, when 83 percent of an average pay-check could pay the rent, but now it’s almost a full monthly wage. Fairbanks rent increased by 25 per-cent over that period, when adjusted for infl a on, while income growth lagged at 9 percent.
In Juneau, a single wage earner can now aff ord the average rent, down from 1.12 paychecks in 2000. Income has grown by 9 percent in Juneau since 2000 as well, but average rent was 2 percent lower in 2017 than in 2000, when adjusted for infl a on.
Overview of area rental markets
Anchorage The typically ght Anchorage rental market loosened up in 2017. Vacancy increased from 3.8 percent to 5.1 percent, and rent went up by less than 1 percent ($10).
Anchorage had a building boom between 2002 and 2007, during which it added nearly 3,300 new mul -family units. A er that, construc on slowed to an average of just under 200 new mul -family units per year. The vacancy rate hit a low of 1.8 percent in 2010, then began to climb again and has been on the rise since. This year’s rate is the highest in the past 10 years and well above Anchorage’s decade average of 3.5 percent.
The recent rise in vacancy is likely ed to the city’s
Source: Alaska Department of Labor and Workforce Development, Research and Analysis Sec on and Alaska Housing Finance Corpora on, 2017 Rental Mar-ket Survey
3 A , M 2017
Average Rent Plus U li es in Higher and Lower Cost Markets
$1,946$1,748 $1,632
$1,814$2,152
$1,301 $1,219 $1,219 $1,256 $1,235
$1,433 $1,337 $1,319 $1,305 $1,269
JuneauKodiak Valdez-Cordova Sitka Anchorage
Single-family Apartment Combined
$1,652 $1,766
$1,199 $1,323$1,022
$1,133 $1,126$1,105
$979
$936
$1,253 $1,208
$1,110$1,054
$944
Matanuska-Susitna
FairbanksNorth Star
KetchikanGateway
Kenai Peninsula Wrangell-Petersburg
Single-family Apartment Combined
2000 2010 2017Anchorage, Municipality 0.82 0.88 0.90Fairbanks North Star Borough 0.83 0.98 0.95Juneau, City and Borough 1.12 1.04 1.01Kenai Peninsula Borough 0.83 0.88 0.89Ketchikan Gateway Borough 1.01 0.99 0.98Kodiak Island Borough 1.26 1.32 1.33Matanuska-Susitna Borough 1.10 1.08 1.18Live in Mat-Su, work in Anchorage 0.83 0.79 0.89Sitka, City and Borough 1.19 1.20 1.22Valdez-Cordova Census Area 0.95 1.00 1.00Wrangell Borough-Petersburg CA 0.98 0.97 0.98
Survey wide 0.87 0.92 0.92
Note: Index factors in an area’s average wages and aver-age rent plus u li es.
Source: Alaska Department of Labor and Workforce Development, Research and Analysis Sec on

7ALASKA ECONOMIC TRENDS AUGUST 2017
job losses. Anchorage’s average monthly employment in 2016 was down by about 3,000 from the previous year.
Anchorage’s average rent for all unit types combined has re-mained near fl at for the past decade, with the last signifi cant increase in 2009.
Matanuska-SusitnaRent and vacancies both in-creased in the Matanuska-Susitna Borough in 2017, sending mixed signals.
Mat-Su, which leads the state in new housing construc on, built approximately 250 new mul -family units each year from 2014 to 2016, which likely led to more vacancies.
The vacancy rate more than doubled this year, from 3.6 percent to 7.6 percent. The current rate is well above the decade average of 5.1 percent but lower than it was in 2005 and 2006, when it exceeded 9 percent.
Average rent has been on the rise in Mat-Su over the past 10 years, and it increased 2.4 percent this year, to $1,253.
Kenai PeninsulaThe rental market in the Kenai Peninsula Borough has so ened, with vacancies up and rents down. Average rent decreased by $5 this year, or half a percent, a er a jump of $60 in 2016 that followed nearly a decade of mostly moderate increases.
The vacancy rate increased from 8.8 percent to 11.3 percent, which is the area’s highest rate since the mid-2000s and well above the decade average of 7.6 percent. Kenai’s vacancy rate topped out at 13 per-cent in 2004.
Kenai lost about 400 jobs from 2015 to 2016, which likely contributed to its higher vacancy rate and dec-crease in average rent.
KodiakKodiak’s short-term indicators seem contradictory, with fewer vacancies in 2017 plus a decrease in rent, although the longer-term trend is a weaker market with higher vacancy and lower rent.
The vacancy rate fell to 6.9 percent in 2017 from 8.0 percent the year before, but it’s s ll above the decade average of 4.3 percent and has been rising since 2010.
Kodiak is one of the few places in the U.S. where the Coast Guard provides a signifi cant amount of its own housing and requires it to be fi lled before service people can rent in the local market. The Coast Guard buckled down on that requirement a couple of years ago and last year added about 20 units to its housing inventory.
Kodiak also lost 200 jobs between 2015 and 2016, and the military popula on decreased by about 7 percent between 2012 and 2016. These factors, combined with the new Coast Guard housing units and shi s in housing requirements, are likely contributors to the area’s long-term rise in vacancy.
Average rent fell by $5 in 2017, although at $1,443 it remains the highest among surveyed areas. Infl a on-adjusted rent in Kodiak has declined by 1.9 percent since the 2010 peak of $1,472.
FairbanksThe average rent in Fairbanks — $1,208, including u li es — increased by nearly a percent a er falling in 2016, but it’s 2.4 percent lower now than when it peaked in 2010, when adjusted for infl a on.
Fairbanks’ vacancy rate has swung widely over the past decade. The rate rose to 12.2 percent in 2017, up a full percentage point from 2016 but lower than in 2014 and 2015 when it hovered near 16 percent, its most recent peak. At the opposite extreme, vacancy hit a low of 5 percent in 2010. The 10-year average is near 11 percent, but in the past fi ve years it’s been closer to 13 percent.
Fairbanks, whose rental market is infl uenced by the millitary and the university, lost popula on for several years un l growing slightly in 2016. The area’s total popula on declined by about 1,700 people from 2012 to 2016, the most recent period available.
5 M 2017Vacancy Rates by Area
Source: Alaska Department of Labor and Workforce Development, Research and Analysis Sec on and Alaska Housing Finance Corpora on, 2017 Rental Market Survey
12.7%12.2%
11.3%9.9%
7.6%7.5%
7.3%6.9%
5.7%5.1%
4.7%
Wrangell Borough-Petersburg CAFairbanks North Star Borough
Kenai Peninsula BoroughKetchikan Gateway BoroughMatanuska-Susitna Borough
Sitka, City and BoroughSurvey wide
Kodiak Island BoroughJuneau, City and Borough
Anchorage, MunicipalityValdez-Cordova Census Area

8 ALASKA ECONOMIC TRENDSAUGUST 2017
The borough also lost 600 jobs from 2015 to 2016.
JuneauJuneau’s rental market, which is generally ght, opened up somewhat over the past year as rents went down and the vacancy rate went up. Juneau’s rent fell by 2.1 percent, to $1,305, and the vacancy rate rose from 3.3 percent to 5.7 percent.
Vacancy had been in the 3 percent range for the past six years, although the rate was higher in 2005 and 2009 than it is now.
New construc on is one likely factor in the shi ing rates. Permits for new mul -family units increased signifi cantly in both 2014 and 2016, totaling more than 300 new units, and those permi ed in 2016 could further aff ect the vacancy rate, depending on when they become available.
Employment loss is also a likely contributor, as the area lost about 300 jobs from 2015 to 2016.
SitkaUnlike most areas, Sitka’s rental market appears to be ghtening despite the loss of 300 jobs from 2015 to 2016. Sitka’s vacancy rate declined by nearly a per-centage point in 2017 and rents went up 7.2 percent, more than any other surveyed area.
Sitka’s vacancy rate of 7.5 percent is below its 10-year average of 8.5 percent and down from 8.3 percent in 2016.
Rent has bounced around in the past decade, from below $1,200 for several years to as high as $1,310 in 2006. Rents have been on an upward trend since 2014.
This year’s increase of nearly $90 is a large jump, but rent fell by a nearly equal amount from 2010 to 2011. Small areas like Sitka can be par cularly sensi ve to annual swings.
Valdez-CordovaThe rental market in Valdez-Cordova sent mixed signals in 2017, with rents and vacancies both down from the year before. Rent fell 2.1 percent, to $1,337, and the vacancy rate dropped from 5.9 percent to 4.7 percent, the lowest in the survey this year.
Rents in Valdez-Cordova have been up and down nearly every other year for the past decade. Rents and vacancies are more vola le in smaller areas, as a small number of units can spur large percent changes.
While the decade average for vacancies is 5.6 per-cent, the area’s rate has also been vola le, spiking over 9 percent twice in the last decade and falling be-low the current rate in four of the last 10 years.
KetchikanThe rental market in Ketchikan, which typically has low rents and rela vely high vacancy rates, appears to be so ening in the short term but the long-term indicators are harder to read. The vacancy rate rose slightly in 2017 and average rent decreased 1.1 per-cent, to $1,110.
Ketchikan’s infl a on-adjusted rent hit a high of $1,123 in 2010, then fell below $1,100 and remained there for the next fi ve years.
While the 2017 vacancy rate of 9.9 percent is consid-erably above the statewide average, it’s lower than
6 B , M 2017Average Rent Plus U li es by Unit Type
Source: Alaska Department of Labor and Workforce Development, Research and Analysis Sec on and Alaska Housing Finance Corpora on, 2017 Rental Mar-ket Survey
$952$1,020$1,025
$1,152$1,209
$1,283$1,301$1,321
$1,355$1,424
Wrangell-PetersburgMatanuska-Susitna
Kenai PeninsulaKetchikan Gateway
Fairbanks North StarSitka
Valdez-CordovaAnchorage
JuneauKodiak Island
Not disclosable
$2,123$2,072$2,071
$2,039$1,968
$1,750$1,446
$1,445$1,088
Ketchikan Gateway
AnchorageValdez-Cordova
JuneauFairbanks North Star
SitkaKodiak Island
Kenai PeninsulaMatanuska-Susitna
Wrangell-Petersburg
Apartment, two bedrooms House, three bedrooms
Con nued on page 13
9ALASKA ECONOMIC TRENDS AUGUST 2017
Alaska’s natural resources are its most promi-
nent economic drivers, but its strategic loca- on for the military
has also brought a lot of money and an enormous amount of infrastructure into the state.
The federal govern-ment spent $3.3 bil-lion on defense in Alaska during fi scal year 2015, which in-cluded wages for ac- ve duty and civilian
military employees as well as contrac ng for construc on, main-tenance, and other services.
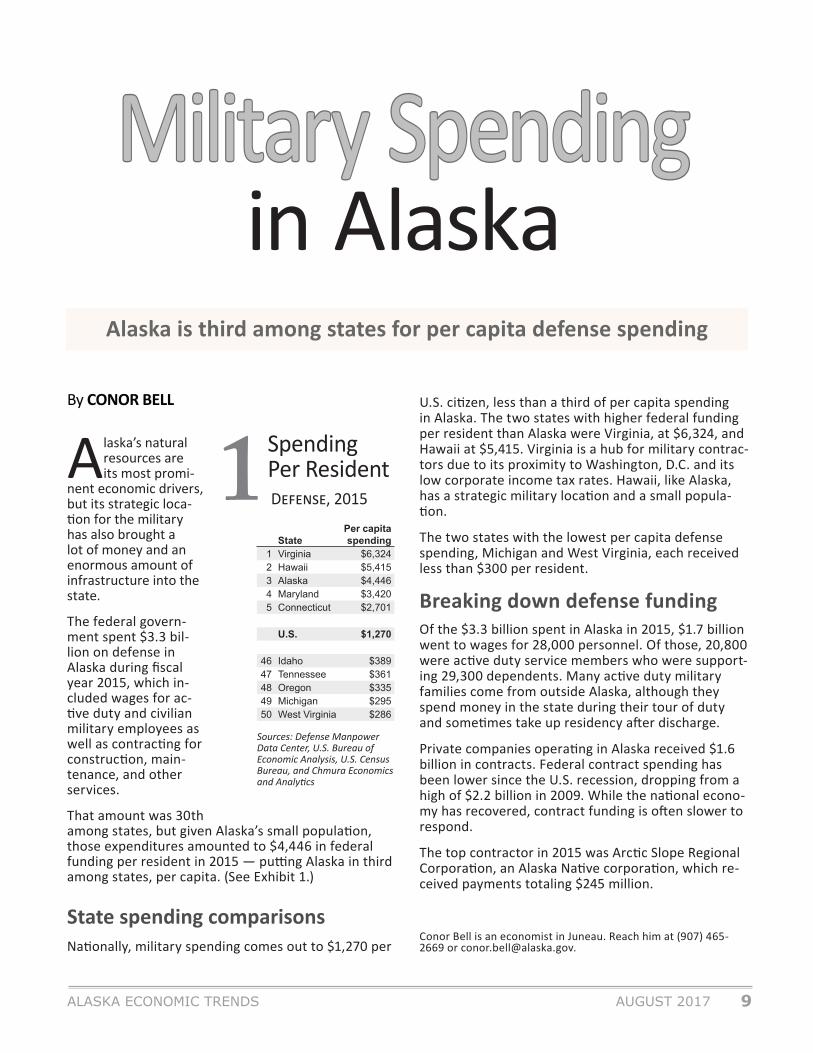
That amount was 30th among states, but given Alaska’s small popula on, those expenditures amounted to $4,446 in federal funding per resident in 2015 — pu ng Alaska in third among states, per capita. (See Exhibit 1.)
State spending comparisonsNa onally, military spending comes out to $1,270 per
U.S. ci zen, less than a third of per capita spending in Alaska. The two states with higher federal funding per resident than Alaska were Virginia, at $6,324, and Hawaii at $5,415. Virginia is a hub for military contrac-tors due to its proximity to Washington, D.C. and its low corporate income tax rates. Hawaii, like Alaska, has a strategic military loca on and a small popula- on.
The two states with the lowest per capita defense spending, Michigan and West Virginia, each received less than $300 per resident.
Breaking down defense fundingOf the $3.3 billion spent in Alaska in 2015, $1.7 billion went to wages for 28,000 personnel. Of those, 20,800 were ac ve duty service members who were support-ing 29,300 dependents. Many ac ve duty military families come from outside Alaska, although they spend money in the state during their tour of duty and some mes take up residency a er discharge.
Private companies opera ng in Alaska received $1.6 billion in contracts. Federal contract spending has been lower since the U.S. recession, dropping from a high of $2.2 billion in 2009. While the na onal econo-my has recovered, contract funding is o en slower to respond.
The top contractor in 2015 was Arc c Slope Regional Corpora on, an Alaska Na ve corpora on, which re-ceived payments totaling $245 million.
Conor Bell is an economist in Juneau. Reach him at (907) 465-2669 or [email protected].
Sources: Defense Manpower Data Center, U.S. Bureau of Economic Analysis, U.S. Census Bureau, and Chmura Economics and Analy cs
1 D , 2015
SpendingPer Resident
StatePer capita spending
1 Virginia $6,3242 Hawaii $5,4153 Alaska $4,4464 Maryland $3,4205 Connecticut $2,701
U.S. $1,270
46 Idaho $38947 Tennessee $36148 Oregon $33549 Michigan $29550 West Virginia $286
Alaska is third among states for per capita defense spending
Military SpendingMilitary Spendingin Alaska
By CONOR BELL

10 ALASKA ECONOMIC TRENDSAUGUST 2017
HOW TO MONITORTHE ECONOMY
By DAN ROBINSON
Picture how complicated the instrument panel looks when you glance into the cockpit of an airplane. A few main screens are prominent in
the middle of a pilot’s viewing area, but the rest of the surface is covered with dozens of other gauges.
An economy is similar in that no one measure can tell you everything you need to know, but a handful of rel-evant indicators warrant constant a en on and many more should be regularly monitored.
Star ng with this issue, Alaska Economic Trends will include an expanded set of economic measures, each of which off ers insight into a key aspect of the state’s economic health. (See page 14.) The measures are presented as “economic gauges” that show at a glance whether the most recent data put the state above or below its 10-year average, with some providing ad-di onal context through historical benchmarks and comparisons to the U.S. economy.
The three major gaugesAs with a cockpit dashboard, the three big, detailed gauges — job growth, the unemployment rate, and gross domes c product growth — provide some of the most fundamental informa on about the health of Alaska’s economy.
In most economies, jobs are front and center when assessing economic health, and how many is general-ly less important than whether the number is increas-ing or decreasing.
Second, the unemployment rate is a related but com-plicated measure of the percentage of people who aren’t working but are ac vely seeking work, mean-ing it excludes those who re re or enter college, for example. Although the unemployment rate can send mixed signals about economic health, it has long been one of the most prominent economic measures.
The third gauge, state gross domes c product, is similar to job growth in that its relevance lies more in whether the value of what the economy produces is increasing or decreasing than in the value itself.
The upper and lower limits of the gauges give some sense of how high and low the measures could move based primarily on history. Some of those telling moments in history, both for Alaska and the United States, are iden fi ed on the le side of the gauges. On the right side are the most current data point for Alaska and, for comparison, the same data point for the U.S.
Timing is an issueWhen interpre ng what the individual measures are saying, especially collec vely, it’s important to keep in mind that unlike airline pilots, economic analysts
Rolling out a newregular feature in Trends
11ALASKA ECONOMIC TRENDS AUGUST 2017
Individuals’ stories often differfrom the story the numbers tellEconomic data showing the relative health of an econo-my are frequently met with the very human response of, “Nonsense. Things are much worse (or better) than that for me and my neighbors.” A person who has just lost a job or had to lay off employees because of an econom-ic downturn may not want to hear that things aren’t that bad or that they were much worse back in the day.
The nature of economic data is to provide informa-tion in aggregate for an economy. Anecdotes about individuals’ experiences with job loss, lower wages, foreclosures, or bankruptcy, for example, humanize the information and make it more real and comprehensible for general interest newspaper and magazine readers. However, the fact that some people’s experiences are better or worse than what the aggregate economic data show for the population as a whole doesn’t mean the data are faulty.
Knowing to what extent the economy as a whole is under stress is key information for businesses, policy makers, and job seekers. An individual story of eco-nomic hardship may have more emotional punch, but the aggregated data — all of those individual stories rolled up into one more complete picture — are the foundation for good economic decision-making.
o en have to wait months to more than a year for reliable informa on on key economic indicators.
A steep drop in jobs, for example, would typically precipitate declines in popula on and aff ect house prices. But because job numbers are available month-ly and popula on numbers only annually, there will be periods when an economic shock or an economic boost will be visible in one indicator but not yet in another.
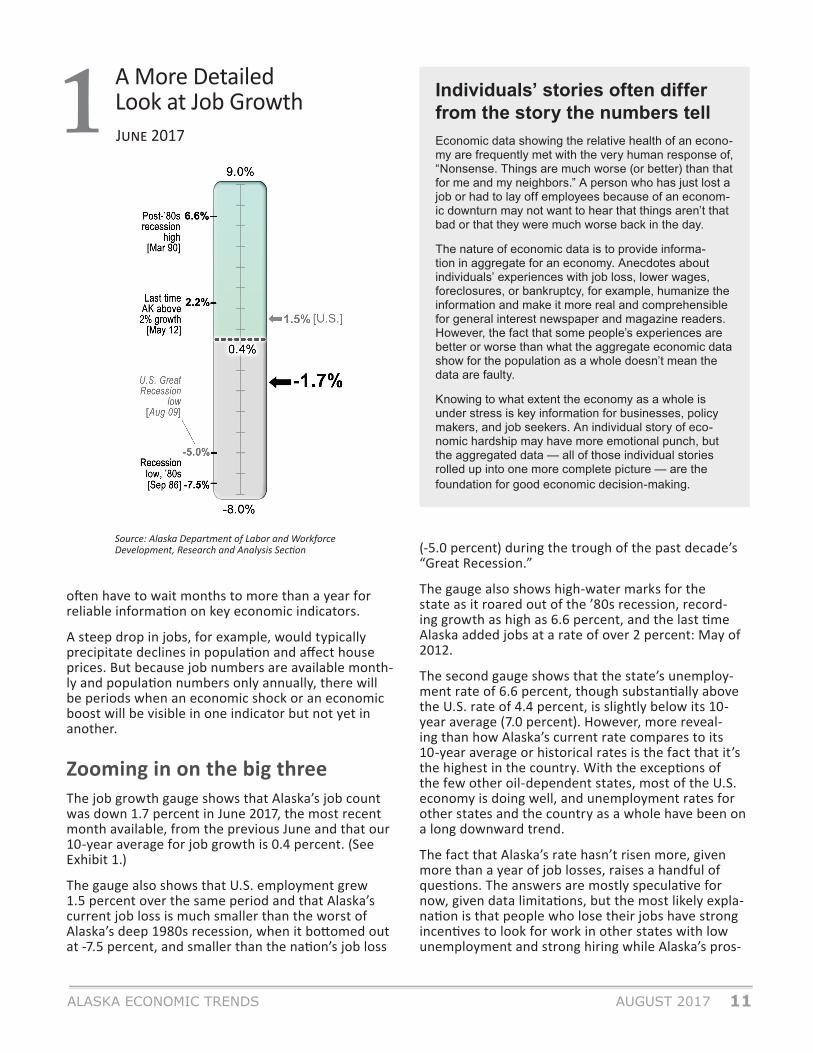
Zooming in on the big threeThe job growth gauge shows that Alaska’s job count was down 1.7 percent in June 2017, the most recent month available, from the previous June and that our 10-year average for job growth is 0.4 percent. (See Exhibit 1.)
The gauge also shows that U.S. employment grew 1.5 percent over the same period and that Alaska’s current job loss is much smaller than the worst of Alaska’s deep 1980s recession, when it bo omed out at -7.5 percent, and smaller than the na on’s job loss
Source: Alaska Department of Labor and Workforce Development, Research and Analysis Sec on
1 J 2017
A More DetailedLook at Job Growth
(-5.0 percent) during the trough of the past decade’s “Great Recession.”
The gauge also shows high-water marks for the state as it roared out of the ’80s recession, record-ing growth as high as 6.6 percent, and the last me Alaska added jobs at a rate of over 2 percent: May of 2012.
The second gauge shows that the state’s unemploy-ment rate of 6.6 percent, though substan ally above the U.S. rate of 4.4 percent, is slightly below its 10-year average (7.0 percent). However, more reveal-ing than how Alaska’s current rate compares to its 10-year average or historical rates is the fact that it’s the highest in the country. With the excep ons of the few other oil-dependent states, most of the U.S. economy is doing well, and unemployment rates for other states and the country as a whole have been on a long downward trend.
The fact that Alaska’s rate hasn’t risen more, given more than a year of job losses, raises a handful of ques ons. The answers are mostly specula ve for now, given data limita ons, but the most likely expla-na on is that people who lose their jobs have strong incen ves to look for work in other states with low unemployment and strong hiring while Alaska’s pros-

12 ALASKA ECONOMIC TRENDSAUGUST 2017
pects remain uncertain at best.
The third gauge shows Alaska’s gross domes c product growth. Because GDP data at the state lev-el can be vola le, the gauge gives a four-quarter moving average, not adjusted for infl a on.
As of the fourth quarter of 2016, the value of the goods and servic-es produced in the state was down 0.5 percent from the prior year, well below the 3.0 percent GDP growth in the U.S. economy when using a comparable calcula on.
Alaska’s most recent decline is much more moderate than both the low point during the state’s cur-rent recession — a drop of 8.4 per-cent in the fourth quarter of 2015 — and the U.S. declines during the worst part of the Great Recession.
What the gauge doesn’t show is that it represents the fourth year in a row of decline and the fi rst me in the state GDP’s modern history that the value has decreased for more than a year. For more detail on the state GDP, see the July issue of Trends.
Seven addi onal measuresPage 15 provides seven addi onal measures — ini al claims for unemployment insurance, wage growth, personal income growth, change in house prices, fore-closure rates, popula on growth, and net migra on — using simple gauges displaying the most recent data, the state’s 10-year average, and highs and lows that roughly correspond with historical highs and lows.
In fi ve of these seven measures, Alaska is below its 10-year averages. In two, though — ini al claims for unemployment insurance and the foreclosure rate — Alaska is on the posi ve side of the decade average.
Up usually means strength,and down shows weaknessFor all of the gauges, the top half represents rela- ve economic strength and the bo om half indicates
weakness. Some of the measures demand a closer look, though, especially when they don’t seem to mesh with what the others suggest.
For example, ini al claims for unemployment insur-ance, an indicator where more claims generally sig-
nals economic distress and fewer claims means the opposite, are substan ally lower than the state’s 10-year average.
That might refl ect fewer-than-normal layoff s in re-cent weeks, but because ini al claims have been low throughout the state’s current recession, it might also mean people aren’t fi ling for unemployment insurance, despite losing their jobs. As discussed above, that could be because people who lose their jobs in Alaska are quickly fi nding work in other states and not fi ling. But it also raises the ques on of whether eligible people in the state, for whatever reason, are choosing not to fi le for benefi ts.
This highlights one of the objec ves of presen ng the informa on this way: to show how complex econo-mies are, with many moving parts and informa on that can appear contradictory. O en, those apparent contradic ons are opportuni es for closer examina- on in accompanying or future Trends ar cles.
On the other hand, foreclosure rates, the other mea-sure showing that Alaska is in a posi on of rela ve economic strength, is refreshingly simple. Fewer foreclosures are nearly always posi ve.
Foreclosures and housing prices have both a racted a lot of a en on during the current recession be-cause both showed such drama c change during the state’s 1980s recession. This me, though, foreclo-sures have remained very low and housing prices have held up well, although a decline in the fi rst quarter of 2017 suggests the recession is beginning to aff ect the housing market.
Old gauges, by Felix Padrosa Photography

13ALASKA ECONOMIC TRENDS AUGUST 2017
Monitoring doesn’tnecessarily mean controllingFinally, with all the comparisons to control panels, it’s important to note that the ability of policy makers, businesses, or anyone else to move the measures in the short term is limited. Sound policy making, wise investments, and an entrepreneurial ci zenry can help create long-term economic health, but state economies are far too large, stable, and complicated to either crash or soar in the short term based on the pull of this or that lever.
In that sense, our economy is more like a glider than a plane. If it’s well constructed and maintained, it’s much more likely to fl y well in a variety of condi ons, many of which are largely out of our control.
Dan Robinson is an economist in Juneau and the chief of Re-search and Analysis. Reach him at (907) 465-6040 [email protected].
RENTAL MARKETContinued from page 8
average for Ketchikan and lower than it was in fi ve of the last 10 years. Ketchikan’s decade av-erage vacancy rate is 10.4 percent.
Wrangell-PetersburgWrangell-Petersburg’s survey results were mixed, with rent and vacancies both spiking in 2017. Average rent was $944, up 6.3 percent, which was the second-largest rent increase this year, a er Sitka.
Un l 2016, Wrangell-Petersburg’s rent had been on a slow decline for much of the last 10 years. The area has the lowest rent but also the lowest average wages of surveyed areas.
The area vacancy rate hit 12.7 percent this year, up from 9.7 percent in 2016 and far above the decade average of 6.9 percent. This year’s rate is also the highest since it topped out at nearly 19 percent in 2005, a er which it remained el-evated for the next two years.
Wrangell-Petersburg is the smallest area sur-veyed, and small areas tend to have large swings in vacancy rates.
Karinne Wiebold is an economist in Juneau. Reach her at (907) 465-6039 or [email protected].

14 ALASKA ECONOMIC TRENDSAUGUST 2017
Gauging Alaska’s Economy

15ALASKA ECONOMIC TRENDS AUGUST 2017
Gauging Alaska’s Economy

16 ALASKA ECONOMIC TRENDSAUGUST 2017
Seasonally adjusted
Prelim. Revised6/17 5/17 6/16
Interior Region 6.9 6.7 6.5 Denali Borough 4.1 6.1 3.8 Fairbanks N Star Borough 6.3 6.0 5.7 Southeast Fairbanks Census Area
8.8 8.9 9.7
Yukon-Koyukuk Census Area
17.5 16.9 18.6
Northern Region 14.0 12.9 12.9 Nome Census Area 15.0 13.8 14.8 North Slope Borough 8.5 7.5 7.7 Northwest Arc c Borough 19.5 18.8 16.9
Anchorage/Mat-Su Region 6.5 6.3 6.2 Anchorage, Municipality 5.9 5.7 5.6 Mat-Su Borough 8.6 8.2 8.3
Prelim. Revised6/17 5/17 6/16
Southeast Region 5.6 5.4 5.5 Haines Borough 6.6 7.3 7.6 Hoonah-Angoon Census Area
8.2 10.0 8.3
Juneau, City and Borough 4.5 4.1 4.4 Ketchikan Gateway Borough
5.4 5.7 5.4
Petersburg Borough 8.2 8.3 8.2 Prince of Wales-Hyder Census Area
10.3 10.0 10.5
Sitka, City and Borough 4.6 4.3 4.3 Skagway, Municipality 3.5 4.0 3.8 Wrangell, City and Borough 6.9 6.4 6.9 Yakutat, City and Borough 8.3 7.0 6.8
Prelim. Revised6/17 5/17 6/16
United States 4.4 4.3 4.9Alaska, Statewide 6.8 6.7 6.7
Prelim. Revised6/17 5/17 6/16
Southwest Region 11.4 12.6 11.8 Aleu ans East Borough 2.7 5.0 3.0 Aleu ans West Census Area
3.8 5.8 3.5
Bethel Census Area 15.9 14.9 15.9 Bristol Bay Borough 4.4 5.3 4.9 Dillingham Census Area 7.8 10.2 9.0 Kusilvak Census Area 23.7 21.0 24.7 Lake and Peninsula Borough
11.5 12.0 13.0
Gulf Coast Region 7.0 7.2 7.1 Kenai Peninsula Borough 7.6 7.7 7.7 Kodiak Island Borough 5.3 4.9 5.3 Valdez-Cordova 6.0 7.0 6.3 Census Area
Prelim. Revised6/17 5/17 6/16
United States 4.5 4.1 5.1Alaska, Statewide 7.0 6.8 6.8
Regional, not seasonally adjusted
Not seasonally adjusted
Unemployment Rates
Percent changeJune 2016 to June 2017
Northern Region
Anchorage/Mat-SuRegion
Bristol Bay
InteriorRegion
Kodiak Island
KenaiPeninsula
Matanuska-Susitna
Anchorage
Valdez-Cordova
SoutheastFairbanksDenali
FairbanksYukon-Koyukuk
North Slope
NorthwestArctic
Nome
Kusilvak
Bethel
Dillingham
AleutiansEast
AleutiansWest
Lake &Peninsula
SouthwestRegion Gulf Coast
Region
Yakutat
Sitka
Hoonah-
Prince of Wales-Hyder
Haines Skagway
Juneau
Ketchikan
Petersburg
Wrangell
SoutheastRegion
-9.7%
+0.5%-2.0%
0%
-0.4%
-1.7%Anchorage/
Mat-Su
-1.6%Statewide
Employment by Region

17ALASKA ECONOMIC TRENDS AUGUST 2017
1June seasonally adjusted unemployment rates2June employment, over-the-year percent change3June 20174First quarter 201752016
Current Year ago Change
Anchorage Consumer Price Index (CPI-U, base yr 1982=100) 218.616 1st half 2016 216.999 +0.75%
Commodity prices Crude oil, Alaska North Slope,* per barrel $43.63 April 2017 $32.02 +36.26% Natural gas, residential, per thousand cubic ft $11.38 April 2017 $9.65 +17.93% Gold, per oz. COMEX $1,273.20 8/2/2017 $1,372.60 -7.24% Silver, per oz. COMEX $16.64 8/2/2017 $20.70 -19.61% Copper, per lb. COMEX $287.65 8/2/2017 $220.90 +30.22% Zinc, per MT $2,780.00 8/1/2017 $2,275.00 +22.20% Lead, per lb. $1.04 8/1/2017 $0.81 +28.40%
Bankruptcies 130 Q2 2017 115 +13% Business 8 Q2 2017 13 -38% Personal 122 Q2 2017 102 +20%
Unemployment insurance claims Initial fi lings 5,022.00 June 2017 4,818.00 +4.23% Continued fi lings 33,544.00 June 2017 41,035.00 -18.26% Claimant count 8,934.00 June 2017 10,638.00 -16.02%
Other Economic Indicators
*Department of Revenue es mate
Sources for pages 14 through 17 include Alaska Department of Labor and Workforce Development, Research and Analysis Sec on; U.S. Bureau of Labor Sta s cs; U.S. Bureau of Economic Analysis; U.S. Census Bureau; COMEX; Alaska Department of Revenue; and U.S. Courts, 9th Circuit
How Alaska Ranks

18 ALASKA ECONOMIC TRENDSAUGUST 2017

19ALASKA ECONOMIC TRENDS AUGUST 2017
Employer ResourcesHiring workers with disabilities benefi ts business, communityThe U.S. Department of Labor’s Offi ce of DisabilityEmployment Policy contains comprehensive resources foremployers who recognize the signifi cant return on investingin an inclusive workforce.
ODEP states: “Today more than ever, businesses need people with a demonstrated ability to adapt to different situations and circumstances. And perhaps more than any other group, people with disabilities possess precisely these attributes. On a daily basis, people with disabilities must think creatively about how to solve problems and accomplish tasks. In the workplace, this resourcefulness translates into innovative thinking, fresh ideas, and varied approaches to confronting business challenges and achiev-ing success. What’s more, research shows that consumers both with and without disabilities favor businesses that em-ploy people with disabilities. But while research shows that a workplace inclusive of people with disabilities is good for business, not all employers know how to effectively recruit, retain, and advance such individuals.”
ODEP topics include building an inclusive workforce, dis-ability etiquette, tax incentives, accommodations and accessibility, and how an inclusive workplace is good for business by demonstrating leadership to community, stake-
holders, and competitors. These resources are available at: http://www.dol.gov/odep/topics/Employers.
Alaska employers benefi t from the collaborative effortsof several state and federal agencies that specializein disability awareness, recruitment, and employment.The Department of Labor and Workforce Development’sdivisions of Vocational Rehabilitation and Employmentand Training Services are foremost among the agenciesemployers partner with to learn about recruiting andemploying qualifi ed Alaskans with disabilities. LocalAlaska Job Center staff will guide you as you develop yourdisability employment strategy and fi nd applicants to meetyour business needs. Federal contractors in particular may benefi t from this partnership by hiring people with disabili-ties (including veterans) as they strive to reach affi rmativeaction goals.
Be a hero to your staff, an innovator in your community,and a leader among competitors. Get started today bycontacting your nearest Alaska Job Center at (877) 724-2539 or http://jobs.alaska.gov/offi ces.
Employer Resources is wri en by the Employment and Training Services Division of the Alaska Department of Labor and Workforce Development.
Safety Minute
Steps to recognize and mitigate wildlife hazardsIn Alaska, workers at outdoor sites are often exposed to potential wildlife encounters, and the number of recent bear attacks is a good reminder to employers to review their re-sponsibilities when it comes to wildlife hazards and employ-ee safety. Employers are responsible for training employees to recognize and avoid all workplace hazards, whether from bears, electricity, or chemicals.
The following workplace guidelines are a starting point:
• Assess any actual or potential hazards in the work-place, and involve employees in the evaluation and dis-cussion, when feasible. Make hazard identifi cation part of the job planning process, integrate hazard control or elimination at the onset of the work, and continue that vigilance throughout the task, project, or season.
• Train employees to recognize and avoid unsafe condi-tions, using recognized safety strategies and techniques to control or eliminate any identifi ed hazards.
• Develop and enforce company policies specifi c to wild-life safety. Employer safety programs often overlook
written programs and associated employee training.
• Provide fi rst aid training. AKOSH/OSHA standards dictate that if hazardous fl ora or fauna are present, em-ployees must know what to do in the event of an injury.
A number of resources on safety around wildlife, and specifi -cally bears, are available to employers. For more on bear safety, visit:
http://dnr.alaska.gov/parks/safety/bears.htmhttp://www.adfg.alaska.gov/?adfg=livingwithbears.bearcountryhttp://dnr.alaska.gov/parks/units/kodiak/kodbears.htm
Report any wildlife encounter to the Alaska Department of Fish and Game via the Wildlife Encounter Report Form at: https://www.adfg.alaska.gov/index.cfm?adfg=reportwildlifeencounter.main. Within the Municipality of Anchorage, contact http://bears.muni.org/reportsighting.aspx.
Safety Minute is wri en by the Labor Standards and Safety Division of the Alaska Department of Labor and Workforce Development.

20 ALASKA ECONOMIC TRENDSAUGUST 2017