Embed Size (px)
Citation preview
Larsen, H.C., Duncan, R.A., Allan, J.F., Brooks, K. (Eds.), 1999Proceedings of the Ocean Drilling Program, Scientific Results, Vol. 163
2. ALTERATION EFFECTS ON PETROPHYSICAL PROPERTIES OF SUBAERIAL FLOOD BASALTS: SITE 990, SOUTHEAST GREENLAND MARGIN1
Sverre Planke,2 Brian Cerney,3 Christian J. Bücker,4 and Odd Nilsen2
ABSTRACT
Ocean Drilling Program Hole 990A penetrated 131 m of subaerially emplaced Paleocene flood basalts on the SoutheastGreenland margin with a recovery of 74%. Shipboard P-wave velocity (Vp), density, and magnetic susceptibility were mea-sured with 2- to 15-cm intervals on the core. Individual flow units were divided into four zones based on the observed petro-physical characteristics. From the top, these are Zone I (<7 m thick with a Vp of ~2.5 km/s), Zone II (3–5 m thick with astrongly increasing Vp from 2.5 to 5.5 km/s), Zone III (up to 20 m thick with a Vp of ~5.5–6.0 km/s), and Zone IV (<2 m thickwith a strongly decreasing Vp from 6.0 to 2.5 km/s). Eighteen samples were selected from three of the fourteen penetratedbasalt units for geochemical, petrological, and petrophysical studies focusing on the altered, low-velocity upper lava Zones Iand II. Zone I is strongly altered to >50% clay minerals (smectite) and iron hydroxides, and the petrophysical properties areprimarily determined by the clay properties. Zone II is intermediately altered with 5%–20% clay minerals, where the petro-physical properties are a function of both the degree of alteration and porosity variations. Shipboard and shore-based measure-ments of the same samples show that storage permanently lowers the elastic moduli of basalt from Zones I to III. This isrelated to the presence of even small quantities of swelling clays. The data show that alteration processes are important indetermining the overall seismic properties of flood basalt constructions. The degree and depth of alteration is dependent on theprimary lava flow emplacement structures and environment. Thus, the interplay of primary emplacement and secondary alter-ation structures determine the elastic properties of basalt piles. Rock property theories for sand-clay systems are further used tomodel the physical property variations in these altered crystalline rocks.
INTRODUCTION
Wireline log data recorded in subaerial flood basalt constructionsshow a characteristic cyclic pattern, with large variations in elasticparameters within individual basalt units (Planke, 1994; Delius etal., 1995; Planke and Cambray, 1998). Typically, the P-wave veloc-ity (Vp) is as low as 2–3 km/s in the basalt top, but increases to 5.5–6 km/s in the interior of lavas thicker than 5–10 m and decreases rap-idly near the lava base. This three-part flow zonation is very similarto observations of textural characteristics revealed by field studies ofinflated flood basalt lavas, with an upper vesicular crust, a centralmassive and fractured core, and a thin basal vesicular crust (Self etal., 1997, 1998).
Continental breakup is frequently associated with voluminousvolcanism. Seismic data are essential for mapping the aerial distri-bution of the volcanic constructions along rifted margins. Seismicimaging of intra- and sub-basalt features is generally difficult. Thelarge variations in seismic properties in single subaerial lava flowsgive rise to numerous high-impedance boundaries within the floodbasalt constructions. Because the dominant wavelength of 50–100 mused in conventional seismic experiments is much larger than thetypical thickness of a flood basalt unit, a reflected wave field in theseterrains will consist of strong reverberations and tuned waves(Planke and Eldholm, 1994). However, well-defined intra- and sub-basalt reflectivity is imaged on modern seismic reflection profiles(e.g., Symonds et al., 1998). Improved understanding of the seismic
1Larsen, H.C., Duncan, R.A., Allan, J.F., Brooks, K. (Eds.), 1999. Proc. ODP, Sci.Results, 163: College Station, TX (Ocean Drilling Program).
2Department of Geology, University of Oslo, Box 1047 Blindern, 0316 Oslo, Nor-way. [email protected]
3Department of Geology and Geophysics, Texas A&M University, College Station,TX 77843-3114, U.S.A.
4Joint Geoscientific Institute of the State Geological Surveys, Stilleweg 2, D-30655Hannover, Federal Republic of Germany.
properties of individual basalt flows may help to improve the seismicimaging capability in volcanic terrains.
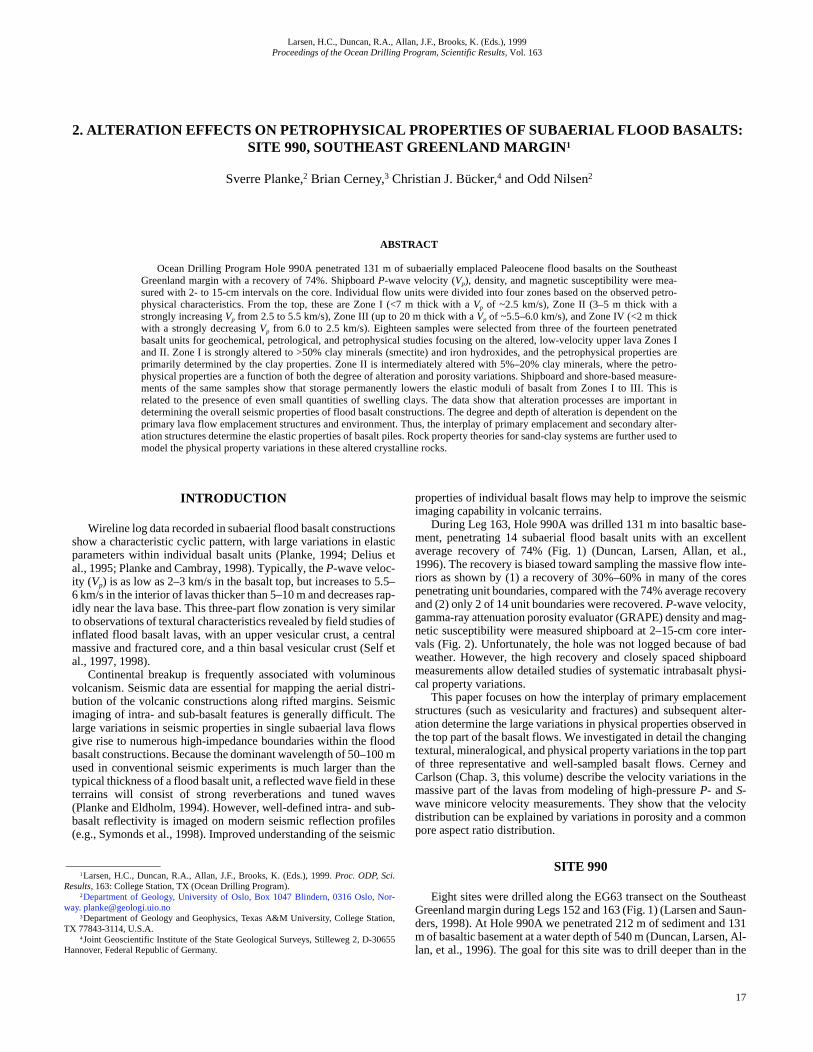
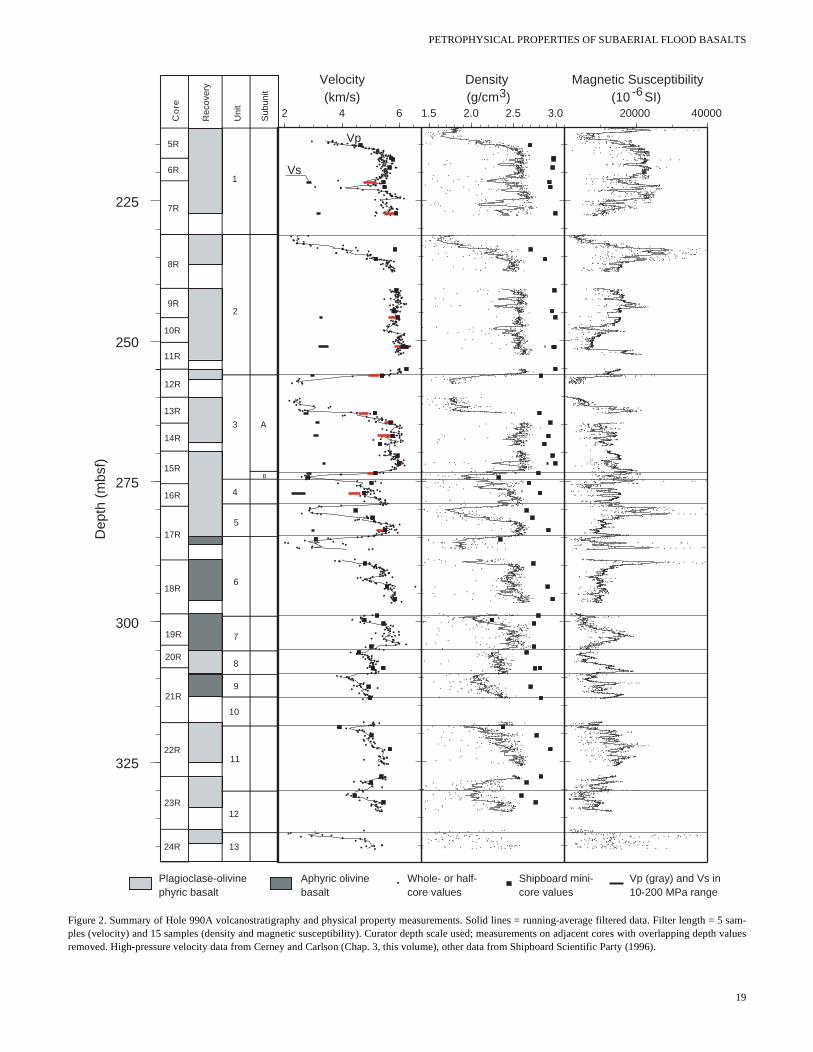
During Leg 163, Hole 990A was drilled 131 m into basaltic base-ment, penetrating 14 subaerial flood basalt units with an excellentaverage recovery of 74% (Fig. 1) (Duncan, Larsen, Allan, et al.,1996). The recovery is biased toward sampling the massive flow inte-riors as shown by (1) a recovery of 30%–60% in many of the corespenetrating unit boundaries, compared with the 74% average recoveryand (2) only 2 of 14 unit boundaries were recovered. P-wave velocity,gamma-ray attenuation porosity evaluator (GRAPE) density and mag-netic susceptibility were measured shipboard at 2–15-cm core inter-vals (Fig. 2). Unfortunately, the hole was not logged because of badweather. However, the high recovery and closely spaced shipboardmeasurements allow detailed studies of systematic intrabasalt physi-cal property variations.
This paper focuses on how the interplay of primary emplacementstructures (such as vesicularity and fractures) and subsequent alter-ation determine the large variations in physical properties observed inthe top part of the basalt flows. We investigated in detail the changingtextural, mineralogical, and physical property variations in the top partof three representative and well-sampled basalt flows. Cerney andCarlson (Chap. 3, this volume) describe the velocity variations in themassive part of the lavas from modeling of high-pressure P- and S-wave minicore velocity measurements. They show that the velocitydistribution can be explained by variations in porosity and a commonpore aspect ratio distribution.
SITE 990
Eight sites were drilled along the EG63 transect on the SoutheastGreenland margin during Legs 152 and 163 (Fig. 1) (Larsen and Saun-ders, 1998). At Hole 990A we penetrated 212 m of sediment and 131m of basaltic basement at a water depth of 540 m (Duncan, Larsen, Al-lan, et al., 1996). The goal for this site was to drill deeper than in the
17
S. PLANKE, B. CERNEY, C.J. BÜCKER, O. NILSEN
60˚
65˚
310˚ 320˚ 330˚ 340˚
917 916 915 9140
1
2
Dep
th (
km)
500 1000 1500989
NW
Shotpoint
SE
1:2.5
4.0 km/s
2.2 km/s1.7 km/s
4.0 km/s
Pre-riftbasement
Seafloor multiple EG92-24
2.5 km
EG63 transectG
RE
EN
LAN
D990
Floodbasalts
Figure 1. Depth-converted interpretative line drawing of the inner part of the EG63 transect showing Legs 152 and 163 drill sites. Based on Duncan, Larsen,Allan, et al. (1996).
nearby Site 915 to obtain a complete volcanostratigraphic section atthe inner part of the EG63 transect. Fourteen subaerially emplacedbasaltic flow units were identified, consisting of a mixture of domi-nantly plagioclase-olivine phyric basalt and aphyric basalt (Fig. 2).The units are classified as aa (four upper units), transitional (fourmiddle units) and pahoehoe (five lower units). A downhole decreasein unit thickness was observed.
The core recovery in the massive interior of the lavas was oftencomplete. A number of cores actually had a recovery of >100%, beingrelated to inaccuracies in the driller’s depth, spaces in the curatedcore, and possible recovery of core drilled during the previous drill-ing. In contrast, recovery in the top and base of the flow units is lower,frequently 30%–60%.
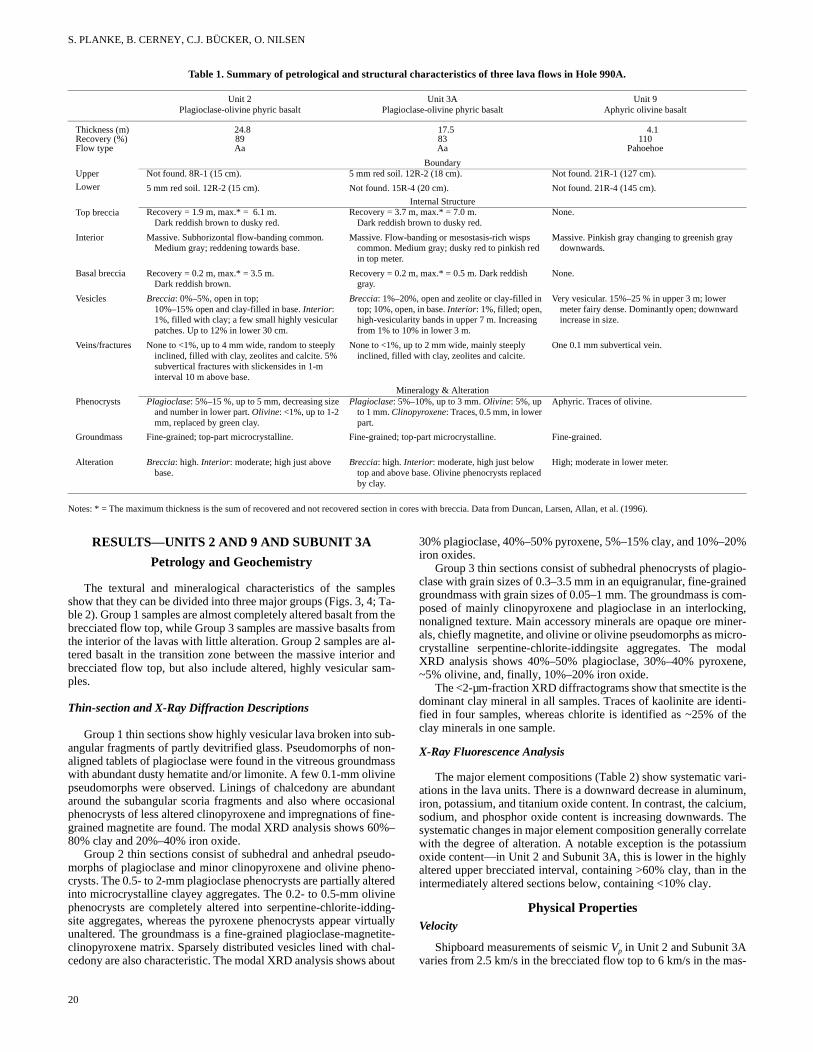
Units 2 and 9 and Subunit 3A were chosen for detailed studies ofpetrophysical properties near the flow boundaries. Unit 2 and Subunit3A are thick aa basalts with well-defined weathered flow tops; Unit9 is a very vesicular pahoehoe basalt (Fig. 2; Table 1). The massiveinterior of the units was almost completely recovered. Based on thegeneral high recovery of the massive part of the units, we interpret themissing section in Cores 8R and 12R (Fig. 2) to belong to the stronglyaltered flow top. Eighteen minicore samples were selected from thesethree units for further studies.
DATA ANALYSIS
Shipboard Measurements
Bulk GRAPE density and magnetic susceptibility were measuredon whole-round cores at a 2-cm sampling interval on the multisensortrack (MST) immediately after the core was brought on deck (Dun-can, Larsen, Allan, et al., 1996). P-wave velocities were then mea-sured on split cores at 5–15-cm intervals in the Hamilton Frame ve-locimeter as soon as possible after the core was split to ensure watersaturation and minimum relaxation cracking. In addition, Vp, density,and porosity were measured later in 51 minicores using standardshipboard procedures described by Larsen, Saunders, Clift, et al.(1994).
18
Physical Properties
P- and S-wave velocity, density, and porosity were measured on14 of the samples by the Norwegian Geotechnical Institute (NGI)(Table 2). Dry and saturated weights were initially measured. Aver-age bulk volume was determined from water-saturated samples by(1) averaging volume estimates from vernier measurements of theaverage of three diameters and three lengths and (2) measuring theimmersed weight of the cores. Bulk and dry densities were calculatedfrom the saturated and dry weights, respectively, divided by theaverage volume. The porosity was obtained from the difference inbulk and dry density. Velocities were measured on water-saturatedcores using contact transducers under atmospheric conditions. A 500-kHz P-wave transducer and a 250-kHz S-wave transducer were used,and transit times were picked manually. Velocities were also mea-sured under 10–200-MPa confining pressure on 13 other minicorescollected from the massive basalt interior (Cerney and Carlson, Chap.3, this volume). The altered samples analyzed in this study were re-garded as too fragile to obtain reliable high-pressure velocity mea-surements. Finally, magnetic properties were measured by NorgesGeologiske Undersøkelser (NGU) on ten minicores. Magnetic rema-nence was measured using a JR5 magnetometer; volume susceptibil-ity, using a Bartington MS2; and Curie temperature, using a horizon-tal translation balance.
Petrology and Geochemistry
Unpolished thin sections and powder were made from the 18 sam-ples. Eight thin sections from massive minicores were subsequentlypolished for identification of magnetic minerals. Major element X-ray fluorescence (XRF) and bulk normal and clay-sized (<2 µm frac-tion) X-ray diffraction (XRD) analyses were carried out at the Uni-versity of Oslo using standard procedures. XRD runs on the clay-sized fractions were done on bulk, heat-treated (550°C), and ethyleneglycol-treated filtrate. Mineral identification and modal analysis ofthe diffractograms (Table 2) were done using the MacDiff software(Petschink, 1997).
PETROPHYSICAL PROPERTIES OF SUBAERIAL FLOOD BASALTS
225
250
275
300
325
Dep
th (
mbs
f)
Co
re
Rec
over
y
Uni
t
Sub
unit
5R
6R
7R
8R
9R
10R
11R
1
2
12R
3
13R
14R
15R
16R
17R
4
B
A
18R
5
6
21R
20R
19R 7
8
24R
23R
22R
9
10
13
12
11
2 4 6 1.5 2.0 2.5 3.0 20000 40000
Velocity Magnetic Susceptibility Density (g/cm )3 (10 SI)-6(km/s)
Vp
Vs
Plagioclase-olivine phyric basalt
Aphyric olivine basalt
Shipboard mini-core values
Vp (gray) and Vs in 10-200 MPa range
Whole- or half-core values
Figure 2. Summary of Hole 990A volcanostratigraphy and physical property measurements. Solid lines = running-average filtered data. Filter length = 5 sam-ples (velocity) and 15 samples (density and magnetic susceptibility). Curator depth scale used; measurements on adjacent cores with overlapping depth valuesremoved. High-pressure velocity data from Cerney and Carlson (Chap. 3, this volume), other data from Shipboard Scientific Party (1996).
19
S. PLANKE, B. CERNEY, C.J. BÜCKER, O. NILSEN
Table 1. Summary of petrological and structural characteristics of three lava flows in Hole 990A.
Notes: * = The maximum thickness is the sum of recovered and not recovered section in cores with breccia. Data from Duncan, Larsen, Allan, et al. (1996).
Unit 2Plagioclase-olivine phyric basalt
Unit 3APlagioclase-olivine phyric basalt
Unit 9Aphyric olivine basalt
Thickness (m) 24.8 17.5 4.1Recovery (%) 89 83 110Flow type Aa Aa Pahoehoe
BoundaryUpper Not found. 8R-1 (15 cm). 5 mm red soil. 12R-2 (18 cm). Not found. 21R-1 (127 cm).
Lower 5 mm red soil. 12R-2 (15 cm). Not found. 15R-4 (20 cm). Not found. 21R-4 (145 cm).
Internal StructureTop breccia Recovery = 1.9 m, max.* = 6.1 m.
Dark reddish brown to dusky red.Recovery = 3.7 m, max.* = 7.0 m.
Dark reddish brown to dusky red. None.
Interior Massive. Subhorizontal flow-banding common. Medium gray; reddening towards base.
Massive. Flow-banding or mesostasis-rich wisps common. Medium gray; dusky red to pinkish red in top meter.
Massive. Pinkish gray changing to greenish gray downwards.
Basal breccia Recovery = 0.2 m, max.* = 3.5 m. Dark reddish brown.
Recovery = 0.2 m, max.* = 0.5 m. Dark reddish gray.
None.
Vesicles Breccia: 0%–5%, open in top; 10%–15% open and clay-filled in base. Interior: 1%, filled with clay; a few small highly vesicular patches. Up to 12% in lower 30 cm.
Breccia: 1%–20%, open and zeolite or clay-filled in top; 10%, open, in base. Interior: 1%, filled; open, high-vesicularity bands in upper 7 m. Increasing from 1% to 10% in lower 3 m.
Very vesicular. 15%–25 % in upper 3 m; lower meter fairy dense. Dominantly open; downward increase in size.
Veins/fractures None to <1%, up to 4 mm wide, random to steeply inclined, filled with clay, zeolites and calcite. 5% subvertical fractures with slickensides in 1-m interval 10 m above base.
None to <1%, up to 2 mm wide, mainly steeply inclined, filled with clay, zeolites and calcite.
One 0.1 mm subvertical vein.
Mineralogy & AlterationPhenocrysts Plagioclase: 5%–15 %, up to 5 mm, decreasing size
and number in lower part. Olivine: <1%, up to 1-2 mm, replaced by green clay.
Plagioclase: 5%–10%, up to 3 mm. Olivine: 5%, up to 1 mm. Clinopyroxene: Traces, 0.5 mm, in lower part.
Aphyric. Traces of olivine.
Groundmass Fine-grained; top-part microcrystalline. Fine-grained; top-part microcrystalline. Fine-grained.
Alteration Breccia: high. Interior: moderate; high just above base.
Breccia: high. Interior: moderate, high just below top and above base. Olivine phenocrysts replaced by clay.
High; moderate in lower meter.
RESULTS—UNITS 2 AND 9 AND SUBUNIT 3A
Petrology and Geochemistry
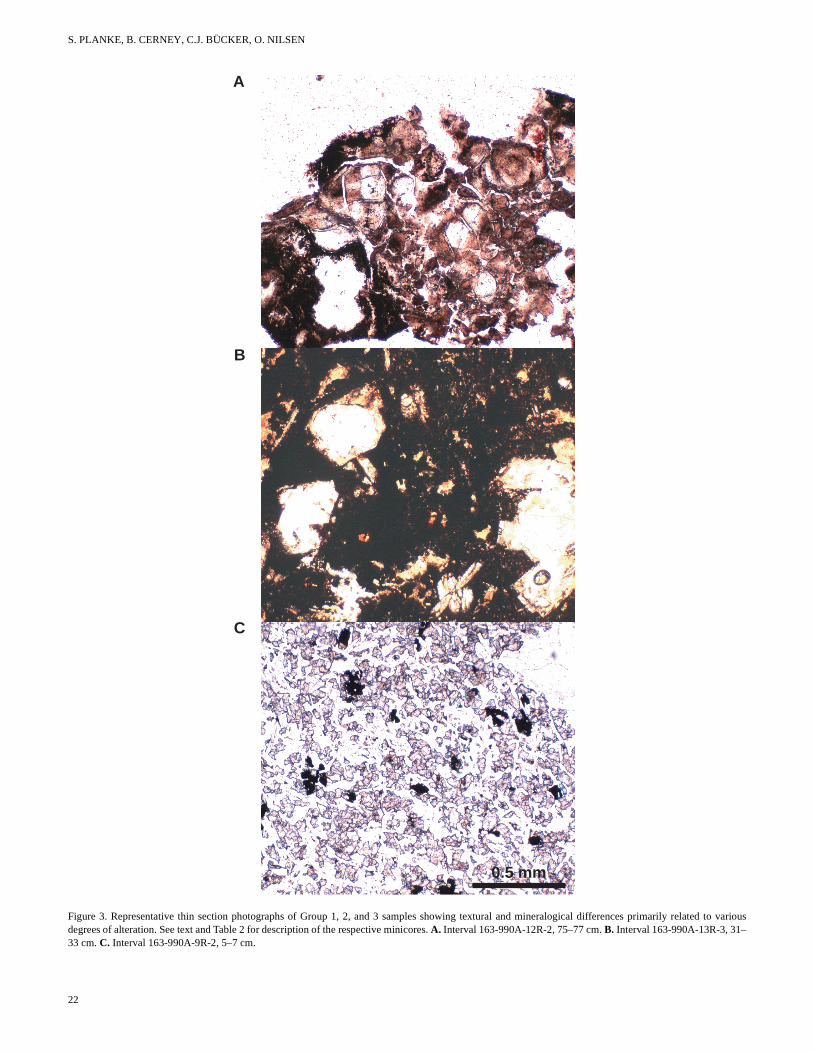
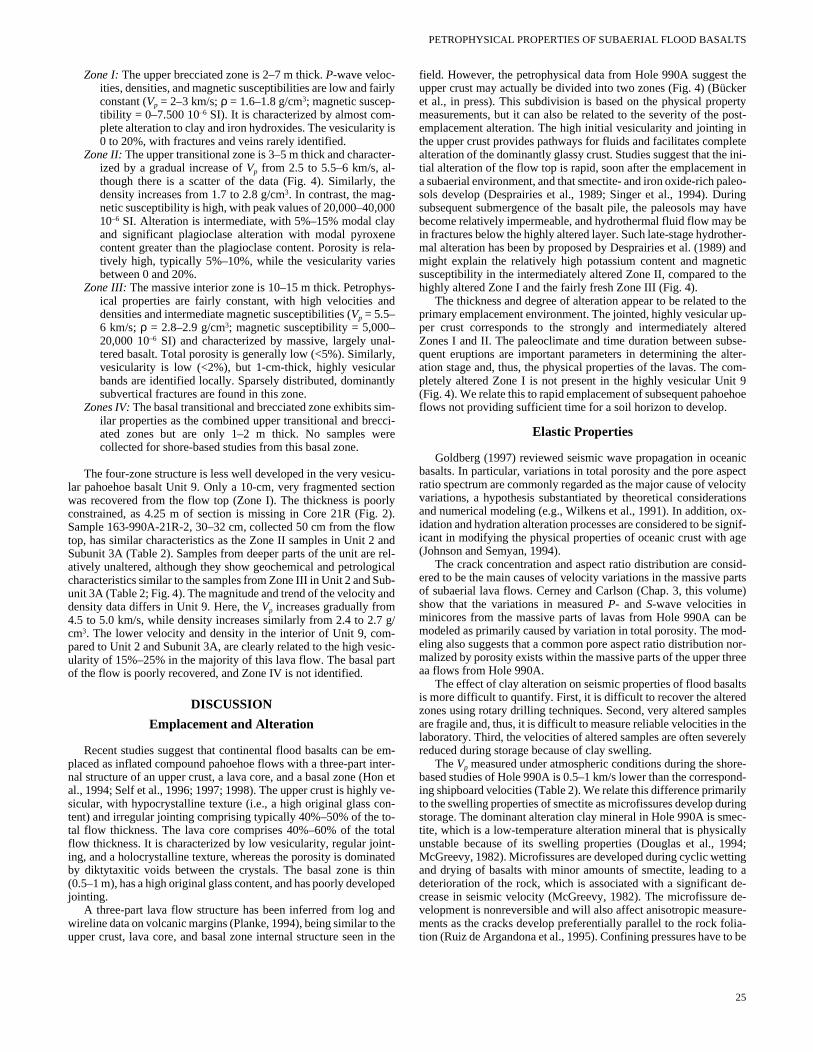
The textural and mineralogical characteristics of the samplesshow that they can be divided into three major groups (Figs. 3, 4; Ta-ble 2). Group 1 samples are almost completely altered basalt from thebrecciated flow top, while Group 3 samples are massive basalts fromthe interior of the lavas with little alteration. Group 2 samples are al-tered basalt in the transition zone between the massive interior andbrecciated flow top, but also include altered, highly vesicular sam-ples.
Thin-section and X-Ray Diffraction Descriptions
Group 1 thin sections show highly vesicular lava broken into sub-angular fragments of partly devitrified glass. Pseudomorphs of non-aligned tablets of plagioclase were found in the vitreous groundmasswith abundant dusty hematite and/or limonite. A few 0.1-mm olivinepseudomorphs were observed. Linings of chalcedony are abundantaround the subangular scoria fragments and also where occasionalphenocrysts of less altered clinopyroxene and impregnations of fine-grained magnetite are found. The modal XRD analysis shows 60%–80% clay and 20%–40% iron oxide.
Group 2 thin sections consist of subhedral and anhedral pseudo-morphs of plagioclase and minor clinopyroxene and olivine pheno-crysts. The 0.5- to 2-mm plagioclase phenocrysts are partially alteredinto microcrystalline clayey aggregates. The 0.2- to 0.5-mm olivinephenocrysts are completely altered into serpentine-chlorite-idding-site aggregates, whereas the pyroxene phenocrysts appear virtuallyunaltered. The groundmass is a fine-grained plagioclase-magnetite-clinopyroxene matrix. Sparsely distributed vesicles lined with chal-cedony are also characteristic. The modal XRD analysis shows about
20
30% plagioclase, 40%–50% pyroxene, 5%–15% clay, and 10%–20%iron oxides.
Group 3 thin sections consist of subhedral phenocrysts of plagio-clase with grain sizes of 0.3–3.5 mm in an equigranular, fine-grainedgroundmass with grain sizes of 0.05–1 mm. The groundmass is com-posed of mainly clinopyroxene and plagioclase in an interlocking,nonaligned texture. Main accessory minerals are opaque ore miner-als, chiefly magnetite, and olivine or olivine pseudomorphs as micro-crystalline serpentine-chlorite-iddingsite aggregates. The modalXRD analysis shows 40%–50% plagioclase, 30%–40% pyroxene,~5% olivine, and, finally, 10%–20% iron oxide.
The <2-µm-fraction XRD diffractograms show that smectite is thedominant clay mineral in all samples. Traces of kaolinite are identi-fied in four samples, whereas chlorite is identified as ~25% of theclay minerals in one sample.
X-Ray Fluorescence Analysis
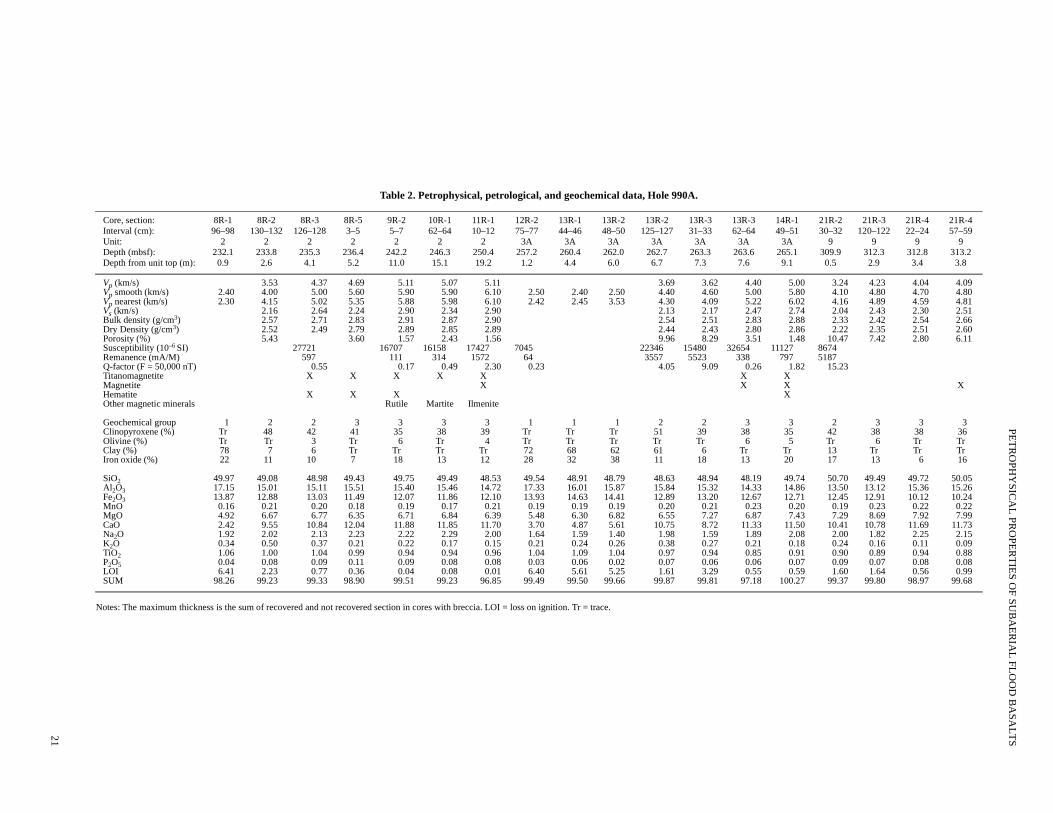
The major element compositions (Table 2) show systematic vari-ations in the lava units. There is a downward decrease in aluminum,iron, potassium, and titanium oxide content. In contrast, the calcium,sodium, and phosphor oxide content is increasing downwards. Thesystematic changes in major element composition generally correlatewith the degree of alteration. A notable exception is the potassiumoxide content—in Unit 2 and Subunit 3A, this is lower in the highlyaltered upper brecciated interval, containing >60% clay, than in theintermediately altered sections below, containing <10% clay.
Physical PropertiesVelocity
Shipboard measurements of seismic Vp in Unit 2 and Subunit 3Avaries from 2.5 km/s in the brecciated flow top to 6 km/s in the mas-
PE
TR
OP
HY
SIC
AL
PR
OP
ER
TIE
S O
F S
UB
AE
RIA
L F
LO
OD
BA
SA
LT
S21
data, Hole 990A.
Notes: The maximum t
Core, section:Interval (cm):Unit:Depth (mbsf):Depth from unit top (
20
13R-2125–127
3A262.76.7
13R-331–33
3A263.37.3
13R-362–64
3A263.67.6
14R-149–51
3A265.19.1
21R-230–32
9309.90.5
21R-3120–122
9312.32.9
21R-422–24
9312.83.4
21R-457–59
9313.23.8
Vp (km/s) 3.69 3.62 4.40 5.00 3.24 4.23 4.04 4.09Vp smooth (km/s) 0 4.40 4.60 5.00 5.80 4.10 4.80 4.70 4.80Vp nearest (km/s) 4.30 4.09 5.22 6.02 4.16 4.89 4.59 4.81Vs (km/s) 2.13 2.17 2.47 2.74 2.04 2.43 2.30 2.51Bulk density (g/cm3) 2.54 2.51 2.83 2.88 2.33 2.42 2.54 2.66Dry Density (g/cm3) 2.44 2.43 2.80 2.86 2.22 2.35 2.51 2.60Porosity (%) 9.96 8.29 3.51 1.48 10.47 7.42 2.80 6.11Susceptibility (10–6 S 22346 15480 32654 11127 8674Remanence (mA/M) 3557 5523 338 797 5187Q-factor (F = 50,000 4.05 9.09 0.26 1.82 15.23Titanomagnetite X XMagnetite X X XHematite XOther magnetic mine
Geochemical group 2 2 3 3 2 3 3 3Clinopyroxene (%) 51 39 38 35 42 38 38 36Olivine (%) Tr Tr 6 5 Tr 6 Tr TrClay (%) 61 6 Tr Tr 13 Tr Tr TrIron oxide (%) 11 18 13 20 17 13 6 16
SiO2 9 48.63 48.94 48.19 49.74 50.70 49.49 49.72 50.05Al2O3 7 15.84 15.32 14.33 14.86 13.50 13.12 15.36 15.26Fe2O3 1 12.89 13.20 12.67 12.71 12.45 12.91 10.12 10.24MnO 9 0.20 0.21 0.23 0.20 0.19 0.23 0.22 0.22MgO 2 6.55 7.27 6.87 7.43 7.29 8.69 7.92 7.99CaO 1 10.75 8.72 11.33 11.50 10.41 10.78 11.69 11.73Na2O 0 1.98 1.59 1.89 2.08 2.00 1.82 2.25 2.15K2O 6 0.38 0.27 0.21 0.18 0.24 0.16 0.11 0.09TiO2 4 0.97 0.94 0.85 0.91 0.90 0.89 0.94 0.88P2O5 2 0.07 0.06 0.06 0.07 0.09 0.07 0.08 0.08LOI 5 1.61 3.29 0.55 0.59 1.60 1.64 0.56 0.99SUM 6 99.87 99.81 97.18 100.27 99.37 99.80 98.97 99.68
Table 2. Petrophysical, petrological, and geochemical
hickness is the sum of recovered and not recovered section in cores with breccia. LOI = loss on ignition. Tr = trace.
m):
8R-196–98
2232.10.9
8R-2130–132
2233.82.6
8R-3126–128
2235.3
4.1
8R-53–52
236.45.2
9R-25–72
242.211.0
10R-162–64
2246.315.1
11R-110–12
2250.419.2
12R-275–77
3A257.21.2
13R-144–46
3A260.44.4
13R-48–5
3A262.06.0
3.53 4.37 4.69 5.11 5.07 5.112.40 4.00 5.00 5.60 5.90 5.90 6.10 2.50 2.40 2.52.30 4.15 5.02 5.35 5.88 5.98 6.10 2.42 2.45 3.53
2.16 2.64 2.24 2.90 2.34 2.902.57 2.71 2.83 2.91 2.87 2.902.52 2.49 2.79 2.89 2.85 2.895.43 3.60 1.57 2.43 1.56
I) 27721 16707 16158 17427 7045597 111 314 1572 64
nT) 0.55 0.17 0.49 2.30 0.23X X X X X
XX X X
rals Rutile Martite Ilmenite
1 2 2 3 3 3 3 1 1 1Tr 48 42 41 35 38 39 Tr Tr TrTr Tr 3 Tr 6 Tr 4 Tr Tr Tr78 7 6 Tr Tr Tr Tr 72 68 6222 11 10 7 18 13 12 28 32 38
49.97 49.08 48.98 49.43 49.75 49.49 48.53 49.54 48.91 48.717.15 15.01 15.11 15.51 15.40 15.46 14.72 17.33 16.01 15.813.87 12.88 13.03 11.49 12.07 11.86 12.10 13.93 14.63 14.40.16 0.21 0.20 0.18 0.19 0.17 0.21 0.19 0.19 0.14.92 6.67 6.77 6.35 6.71 6.84 6.39 5.48 6.30 6.82.42 9.55 10.84 12.04 11.88 11.85 11.70 3.70 4.87 5.61.92 2.02 2.13 2.23 2.22 2.29 2.00 1.64 1.59 1.40.34 0.50 0.37 0.21 0.22 0.17 0.15 0.21 0.24 0.21.06 1.00 1.04 0.99 0.94 0.94 0.96 1.04 1.09 1.00.04 0.08 0.09 0.11 0.09 0.08 0.08 0.03 0.06 0.06.41 2.23 0.77 0.36 0.04 0.08 0.01 6.40 5.61 5.2
98.26 99.23 99.33 98.90 99.51 99.23 96.85 99.49 99.50 99.6
S. PLANKE, B. CERNEY, C.J. BÜCKER, O. NILSEN
0.5 mm
A
B
C
Figure 3. Representative thin section photographs of Group 1, 2, and 3 samples showing textural and mineralogical differences primarily related to variousdegrees of alteration. See text and Table 2 for description of the respective minicores. A. Interval 163-990A-12R-2, 75–77 cm. B. Interval 163-990A-13R-3, 31–33 cm. C. Interval 163-990A-9R-2, 5–7 cm.
22
PETROPHYSICAL PROPERTIES OF SUBAERIAL FLOOD BASALTS
0 10 0 10000Porosity (%) Remanent Magnetism
50 100 2 4 6 1.5 2.0 2.5 3.0 20000 40000
XRD Petrology Velocity(km/s)
Density(g/cm )3
Magnetic Susceptibility(10 SI)-6
13R
14R
15R
21R
8R
9R
10R
11R
0
4
0
10
0
10
20
Unit 2
Unit 3A
Unit 9
Thi
ckne
ss (
m)
Thi
ckne
ss (
m)
Clay FeO
Plag Px Ol
Vp
Vs
Halfround coreVp (Shipboard)
MinicoreVp (Shipboard)Vp (NGI)Vs (NGI)Vp (10-200 MPa)Vs (10-200 MPa)
Whole coreρ (Shipboard GRAPE)
Minicoreρ (Shipboard)ρ (NGI)ρ (dry-saturated)Porosity (NGI)
Whole coreSus. (Shipboard MST)
MinicoreMag. Sus. (NGU)Rem. Mag. (NGU)
Rec
over
y
I
II
III
IV
I
II
III
IV
II
III
Zon
e
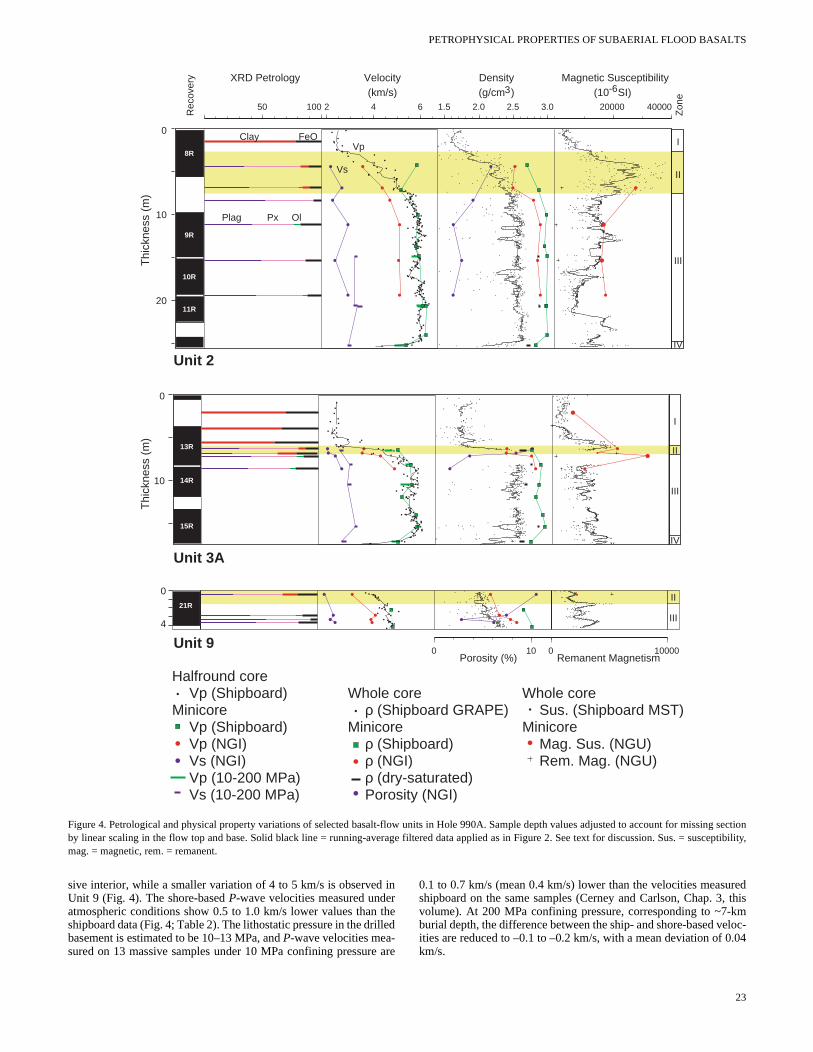
Figure 4. Petrological and physical property variations of selected basalt-flow units in Hole 990A. Sample depth values adjusted to account for missing sectionby linear scaling in the flow top and base. Solid black line = running-average filtered data applied as in Figure 2. See text for discussion. Sus. = susceptibility,mag. = magnetic, rem. = remanent.
sive interior, while a smaller variation of 4 to 5 km/s is observed inUnit 9 (Fig. 4). The shore-based P-wave velocities measured underatmospheric conditions show 0.5 to 1.0 km/s lower values than theshipboard data (Fig. 4; Table 2). The lithostatic pressure in the drilledbasement is estimated to be 10–13 MPa, and P-wave velocities mea-sured on 13 massive samples under 10 MPa confining pressure are
0.1 to 0.7 km/s (mean 0.4 km/s) lower than the velocities measuredshipboard on the same samples (Cerney and Carlson, Chap. 3, thisvolume). At 200 MPa confining pressure, corresponding to ~7-kmburial depth, the difference between the ship- and shore-based veloc-ities are reduced to –0.1 to –0.2 km/s, with a mean deviation of 0.04km/s.
23
S. PLANKE, B. CERNEY, C.J. BÜCKER, O. NILSEN
The S-wave velocities are less reliable than the P-wave velocitiesbecause of the greater difficulties involved in picking the first arriv-als. S-wave velocities measured under atmospheric conditions are inthe range 2.0 to 2.9 km/s, with Vp/Vs values of 1.6 to 2.2 (mean 1.77).S-wave velocities measured on massive samples under 200 MPa con-fining pressure are in the range 2.7–3.5 km/s, with Vp/Vs values of1.72–1.87 (Cerney and Carlson, Chap. 3, this volume).
The Vp data show that thermal and pressure relaxation and dryingof the samples permanently change their elastic properties. The ship-board Vp measurements appear to be the most reliable, although mi-crocracks may have already formed during drilling and recovery ofthe core. At later times the same samples have to be submitted to un-realistically high pressures (~200 MPa) to obtain results comparablewith those measured immediately after the recovery.
Density and Porosity
The shipboard GRAPE bulk density varies systematically withinthe flow units in a pattern similar to the P- and S-wave velocities (Fig.4). However, there is a large scatter in the unedited GRAPE densitydata, and very low values are related to gaps between individual corepieces and variations in core diameter as well as to mineralogical andporosity changes. The GRAPE data were calibrated for cores withina lining. A recalibration and editing is required for hard-rock samplesmeasured on the MST without a lining (Shipboard Scientific Party,1996; Bücker et al., Chap. 5, this volume).
The shipboard bulk density minicore measurements are 0.3–0.4 g/cm3 higher than the GRAPE bulk density data (Fig. 4). The subse-quent shore-based density measurements provide intermediate val-ues, typically 0.2–0.3 g/cm3 higher than the shipboard GRAPE den-sity values. The difference is attributed to variations in core diameterand that the GRAPE was calibrated for quartz (grain density = 2.67g/cm3) rather than for plagioclase and pyroxene (grain density ~3.0 g/cm3).
The porosity values are generally low (2%–5%) in the massivelava interior, but increase to 10% just above the massive interval (Fig.4). The porosity values in the vesicular Unit 9 are particularly high,decreasing downhole from 10% to 2%–6%.
Magnetic Susceptibility
There is an overall good fit between the MST data and the mini-core magnetic susceptibility values (Figs. 2, 4). The raw MST data arenoisy, partly related to gaps between core pieces. The running-averagesmoothed susceptibility curve shows a distinctly different trend thanthe velocity and density data, a trend particularly well developed inUnit 2 and Subunit 3A. A susceptibility peak of ~30,000 10–6 SI isfound in the transition zone between the brecciated flow top and themassive interior. Low susceptibility values (<10,000 10–6 SI) are re-corded above the peak in the brecciated flow top, while intermediatesusceptibility values of 10,000–25,000 10–6 SI are found in the mas-sive basalt interior. In addition, less well-defined peaks are sometimesapparent near the brecciated base of the flow units.
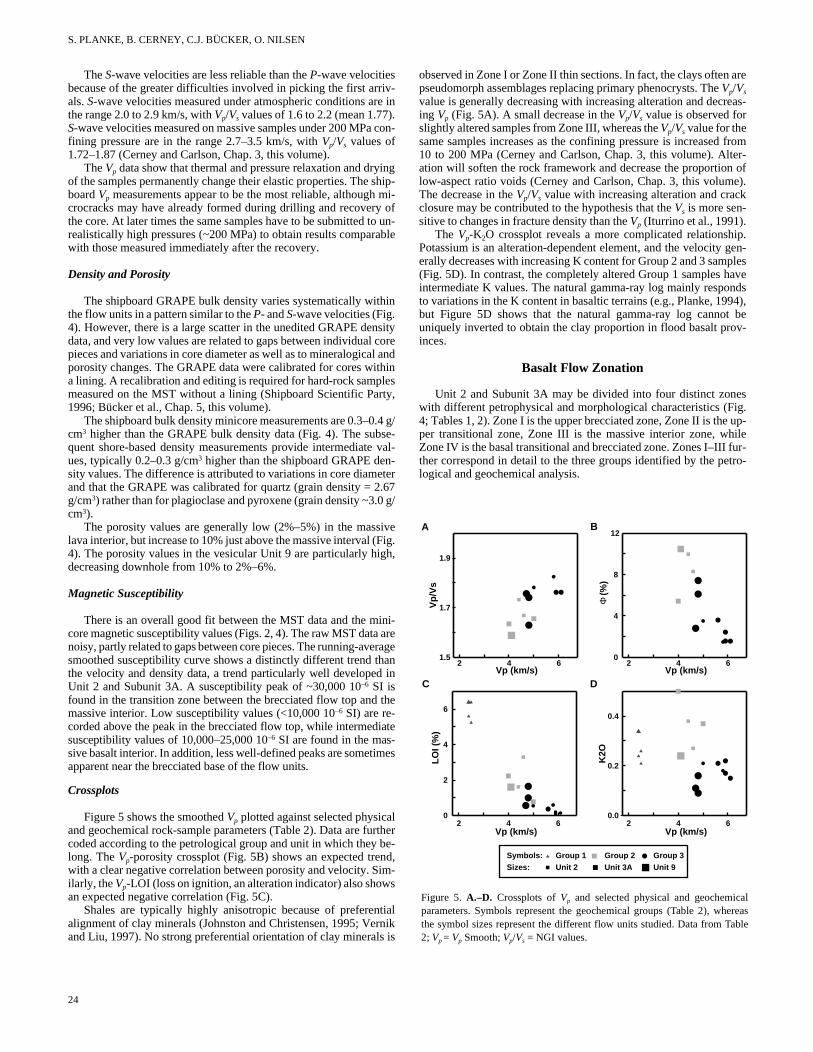
Crossplots
Figure 5 shows the smoothed Vp plotted against selected physicaland geochemical rock-sample parameters (Table 2). Data are furthercoded according to the petrological group and unit in which they be-long. The Vp-porosity crossplot (Fig. 5B) shows an expected trend,with a clear negative correlation between porosity and velocity. Sim-ilarly, the Vp-LOI (loss on ignition, an alteration indicator) also showsan expected negative correlation (Fig. 5C).
Shales are typically highly anisotropic because of preferentialalignment of clay minerals (Johnston and Christensen, 1995; Vernikand Liu, 1997). No strong preferential orientation of clay minerals is
24
observed in Zone I or Zone II thin sections. In fact, the clays often arepseudomorph assemblages replacing primary phenocrysts. The Vp/Vs
value is generally decreasing with increasing alteration and decreas-ing Vp (Fig. 5A). A small decrease in the Vp/Vs value is observed forslightly altered samples from Zone III, whereas the Vp/Vs value for thesame samples increases as the confining pressure is increased from10 to 200 MPa (Cerney and Carlson, Chap. 3, this volume). Alter-ation will soften the rock framework and decrease the proportion oflow-aspect ratio voids (Cerney and Carlson, Chap. 3, this volume).The decrease in the Vp/Vs value with increasing alteration and crackclosure may be contributed to the hypothesis that the Vs is more sen-sitive to changes in fracture density than the Vp (Iturrino et al., 1991).
The Vp-K2O crossplot reveals a more complicated relationship.Potassium is an alteration-dependent element, and the velocity gen-erally decreases with increasing K content for Group 2 and 3 samples(Fig. 5D). In contrast, the completely altered Group 1 samples haveintermediate K values. The natural gamma-ray log mainly respondsto variations in the K content in basaltic terrains (e.g., Planke, 1994),but Figure 5D shows that the natural gamma-ray log cannot beuniquely inverted to obtain the clay proportion in flood basalt prov-inces.
Basalt Flow Zonation
Unit 2 and Subunit 3A may be divided into four distinct zoneswith different petrophysical and morphological characteristics (Fig.4; Tables 1, 2). Zone I is the upper brecciated zone, Zone II is the up-per transitional zone, Zone III is the massive interior zone, whileZone IV is the basal transitional and brecciated zone. Zones I–III fur-ther correspond in detail to the three groups identified by the petro-logical and geochemical analysis.
0.0
0.2
0.4
K2O
2 4 6Vp (km/s)
0
2
4
6
2 4 6
LO
I (%
)
Vp (km/s)
1.5
1.7
1.9
2 4 6
Vp
/Vs
Vp (km/s)
A
0
4
8
12
2 4 6
Φ (
%)
Vp (km/s)
B
C D
Sizes: Unit 2 Unit 3A Unit 9Symbols: Group 1 Group 2 Group 3
Figure 5. A.–D. Crossplots of Vp and selected physical and geochemicalparameters. Symbols represent the geochemical groups (Table 2), whereasthe symbol sizes represent the different flow units studied. Data from Table2; Vp = Vp Smooth; Vp/Vs = NGI values.
PETROPHYSICAL PROPERTIES OF SUBAERIAL FLOOD BASALTS
Zone I: The upper brecciated zone is 2–7 m thick. P-wave veloc-ities, densities, and magnetic susceptibilities are low and fairlyconstant (Vp = 2–3 km/s; ρ = 1.6–1.8 g/cm3; magnetic suscep-tibility = 0–7.500 10–6 SI). It is characterized by almost com-plete alteration to clay and iron hydroxides. The vesicularity is0 to 20%, with fractures and veins rarely identified.
Zone II: The upper transitional zone is 3–5 m thick and character-ized by a gradual increase of Vp from 2.5 to 5.5–6 km/s, al-though there is a scatter of the data (Fig. 4). Similarly, thedensity increases from 1.7 to 2.8 g/cm3. In contrast, the mag-netic susceptibility is high, with peak values of 20,000–40,00010–6 SI. Alteration is intermediate, with 5%–15% modal clayand significant plagioclase alteration with modal pyroxenecontent greater than the plagioclase content. Porosity is rela-tively high, typically 5%–10%, while the vesicularity variesbetween 0 and 20%.
Zone III: The massive interior zone is 10–15 m thick. Petrophys-ical properties are fairly constant, with high velocities anddensities and intermediate magnetic susceptibilities (Vp = 5.5–6 km/s; ρ = 2.8–2.9 g/cm3; magnetic susceptibility = 5,000–20,000 10–6 SI) and characterized by massive, largely unal-tered basalt. Total porosity is generally low (<5%). Similarly,vesicularity is low (<2%), but 1-cm-thick, highly vesicularbands are identified locally. Sparsely distributed, dominantlysubvertical fractures are found in this zone.
Zones IV: The basal transitional and brecciated zone exhibits sim-ilar properties as the combined upper transitional and brecci-ated zones but are only 1–2 m thick. No samples werecollected for shore-based studies from this basal zone.
The four-zone structure is less well developed in the very vesicu-lar pahoehoe basalt Unit 9. Only a 10-cm, very fragmented sectionwas recovered from the flow top (Zone I). The thickness is poorlyconstrained, as 4.25 m of section is missing in Core 21R (Fig. 2).Sample 163-990A-21R-2, 30–32 cm, collected 50 cm from the flowtop, has similar characteristics as the Zone II samples in Unit 2 andSubunit 3A (Table 2). Samples from deeper parts of the unit are rel-atively unaltered, although they show geochemical and petrologicalcharacteristics similar to the samples from Zone III in Unit 2 and Sub-unit 3A (Table 2; Fig. 4). The magnitude and trend of the velocity anddensity data differs in Unit 9. Here, the Vp increases gradually from4.5 to 5.0 km/s, while density increases similarly from 2.4 to 2.7 g/cm3. The lower velocity and density in the interior of Unit 9, com-pared to Unit 2 and Subunit 3A, are clearly related to the high vesic-ularity of 15%–25% in the majority of this lava flow. The basal partof the flow is poorly recovered, and Zone IV is not identified.
DISCUSSION
Emplacement and Alteration
Recent studies suggest that continental flood basalts can be em-placed as inflated compound pahoehoe flows with a three-part inter-nal structure of an upper crust, a lava core, and a basal zone (Hon etal., 1994; Self et al., 1996; 1997; 1998). The upper crust is highly ve-sicular, with hypocrystalline texture (i.e., a high original glass con-tent) and irregular jointing comprising typically 40%–50% of the to-tal flow thickness. The lava core comprises 40%–60% of the totalflow thickness. It is characterized by low vesicularity, regular joint-ing, and a holocrystalline texture, whereas the porosity is dominatedby diktytaxitic voids between the crystals. The basal zone is thin(0.5–1 m), has a high original glass content, and has poorly developedjointing.
A three-part lava flow structure has been inferred from log andwireline data on volcanic margins (Planke, 1994), being similar to theupper crust, lava core, and basal zone internal structure seen in the
field. However, the petrophysical data from Hole 990A suggest theupper crust may actually be divided into two zones (Fig. 4) (Bückeret al., in press). This subdivision is based on the physical propertymeasurements, but it can also be related to the severity of the post-emplacement alteration. The high initial vesicularity and jointing inthe upper crust provides pathways for fluids and facilitates completealteration of the dominantly glassy crust. Studies suggest that the ini-tial alteration of the flow top is rapid, soon after the emplacement ina subaerial environment, and that smectite- and iron oxide-rich paleo-sols develop (Desprairies et al., 1989; Singer et al., 1994). Duringsubsequent submergence of the basalt pile, the paleosols may havebecome relatively impermeable, and hydrothermal fluid flow may bein fractures below the highly altered layer. Such late-stage hydrother-mal alteration has been by proposed by Desprairies et al. (1989) andmight explain the relatively high potassium content and magneticsusceptibility in the intermediately altered Zone II, compared to thehighly altered Zone I and the fairly fresh Zone III (Fig. 4).
The thickness and degree of alteration appear to be related to theprimary emplacement environment. The jointed, highly vesicular up-per crust corresponds to the strongly and intermediately alteredZones I and II. The paleoclimate and time duration between subse-quent eruptions are important parameters in determining the alter-ation stage and, thus, the physical properties of the lavas. The com-pletely altered Zone I is not present in the highly vesicular Unit 9(Fig. 4). We relate this to rapid emplacement of subsequent pahoehoeflows not providing sufficient time for a soil horizon to develop.
Elastic Properties
Goldberg (1997) reviewed seismic wave propagation in oceanicbasalts. In particular, variations in total porosity and the pore aspectratio spectrum are commonly regarded as the major cause of velocityvariations, a hypothesis substantiated by theoretical considerationsand numerical modeling (e.g., Wilkens et al., 1991). In addition, ox-idation and hydration alteration processes are considered to be signif-icant in modifying the physical properties of oceanic crust with age(Johnson and Semyan, 1994).
The crack concentration and aspect ratio distribution are consid-ered to be the main causes of velocity variations in the massive partsof subaerial lava flows. Cerney and Carlson (Chap. 3, this volume)show that the variations in measured P- and S-wave velocities inminicores from the massive parts of lavas from Hole 990A can bemodeled as primarily caused by variation in total porosity. The mod-eling also suggests that a common pore aspect ratio distribution nor-malized by porosity exists within the massive parts of the upper threeaa flows from Hole 990A.
The effect of clay alteration on seismic properties of flood basaltsis more difficult to quantify. First, it is difficult to recover the alteredzones using rotary drilling techniques. Second, very altered samplesare fragile and, thus, it is difficult to measure reliable velocities in thelaboratory. Third, the velocities of altered samples are often severelyreduced during storage because of clay swelling.
The Vp measured under atmospheric conditions during the shore-based studies of Hole 990A is 0.5–1 km/s lower than the correspond-ing shipboard velocities (Table 2). We relate this difference primarilyto the swelling properties of smectite as microfissures develop duringstorage. The dominant alteration clay mineral in Hole 990A is smec-tite, which is a low-temperature alteration mineral that is physicallyunstable because of its swelling properties (Douglas et al., 1994;McGreevy, 1982). Microfissures are developed during cyclic wettingand drying of basalts with minor amounts of smectite, leading to adeterioration of the rock, which is associated with a significant de-crease in seismic velocity (McGreevy, 1982). The microfissure de-velopment is nonreversible and will also affect anisotropic measure-ments as the cracks develop preferentially parallel to the rock folia-tion (Ruiz de Argandona et al., 1995). Confining pressures have to be
25
S. PLANKE, B. CERNEY, C.J. BÜCKER, O. NILSEN
increased to 200 MPa to match the original shipboard P-wave veloc-ities (Cerney and Carlson, Chap. 3, this volume). Thus, to provide re-liable data, velocity data from altered basalt cores should be mea-sured on board ship as soon as possible after recovery or kept satur-ated under confining pressure.
The large mineralogical changes within Unit 2 and Subunit 3A(Fig. 4) correspond to changes in the elastic properties within the ba-salt units. The Vp in Zone I is very low (~2.5 km/s) and fairly con-stant. This zone is clay dominated (>50% smectite; Fig. 4). Velocitylogs in smectite-rich intervals in the North Sea show similar low ve-locities (~2 km/s) and insignificant velocity changes with depth(Thyberg et al., unpubl. data).
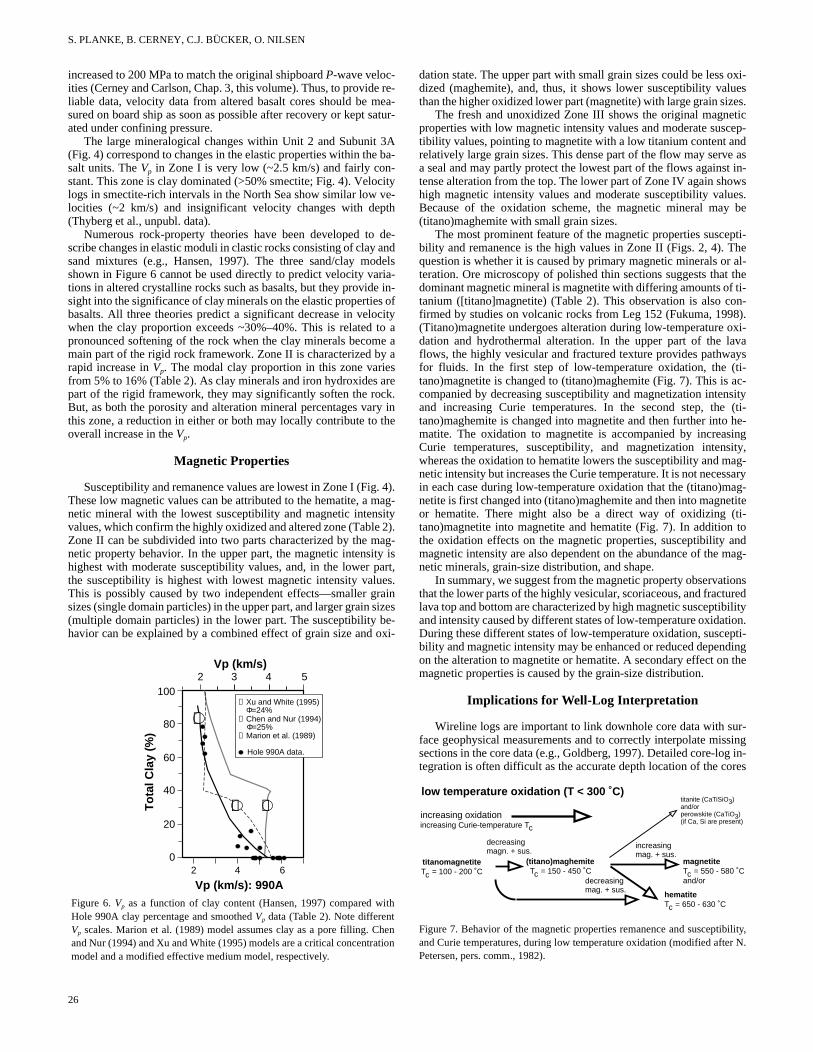
Numerous rock-property theories have been developed to de-scribe changes in elastic moduli in clastic rocks consisting of clay andsand mixtures (e.g., Hansen, 1997). The three sand/clay modelsshown in Figure 6 cannot be used directly to predict velocity varia-tions in altered crystalline rocks such as basalts, but they provide in-sight into the significance of clay minerals on the elastic properties ofbasalts. All three theories predict a significant decrease in velocitywhen the clay proportion exceeds ~30%–40%. This is related to apronounced softening of the rock when the clay minerals become amain part of the rigid rock framework. Zone II is characterized by arapid increase in Vp. The modal clay proportion in this zone variesfrom 5% to 16% (Table 2). As clay minerals and iron hydroxides arepart of the rigid framework, they may significantly soften the rock.But, as both the porosity and alteration mineral percentages vary inthis zone, a reduction in either or both may locally contribute to theoverall increase in the Vp.
Magnetic Properties
Susceptibility and remanence values are lowest in Zone I (Fig. 4).These low magnetic values can be attributed to the hematite, a mag-netic mineral with the lowest susceptibility and magnetic intensityvalues, which confirm the highly oxidized and altered zone (Table 2).Zone II can be subdivided into two parts characterized by the mag-netic property behavior. In the upper part, the magnetic intensity ishighest with moderate susceptibility values, and, in the lower part,the susceptibility is highest with lowest magnetic intensity values.This is possibly caused by two independent effects—smaller grainsizes (single domain particles) in the upper part, and larger grain sizes(multiple domain particles) in the lower part. The susceptibility be-havior can be explained by a combined effect of grain size and oxi-
2 3 4
40
60
80
100
20
0
To
tal C
lay
(%)
Vp (km/s)
❶
❷ ❸
➌ Marion et al. (1989)
Hole 990A data.
➋ Chen and Nur (1994) Φ=25%
➊ Xu and White (1995) Φ=24%
5
2 4 6
Vp (km/s): 990AFigure 6. Vp as a function of clay content (Hansen, 1997) compared withHole 990A clay percentage and smoothed Vp data (Table 2). Note differentVp scales. Marion et al. (1989) model assumes clay as a pore filling. Chenand Nur (1994) and Xu and White (1995) models are a critical concentrationmodel and a modified effective medium model, respectively.
26
dation state. The upper part with small grain sizes could be less oxi-dized (maghemite), and, thus, it shows lower susceptibility valuesthan the higher oxidized lower part (magnetite) with large grain sizes.
The fresh and unoxidized Zone III shows the original magneticproperties with low magnetic intensity values and moderate suscep-tibility values, pointing to magnetite with a low titanium content andrelatively large grain sizes. This dense part of the flow may serve asa seal and may partly protect the lowest part of the flows against in-tense alteration from the top. The lower part of Zone IV again showshigh magnetic intensity values and moderate susceptibility values.Because of the oxidation scheme, the magnetic mineral may be(titano)maghemite with small grain sizes.
The most prominent feature of the magnetic properties suscepti-bility and remanence is the high values in Zone II (Figs. 2, 4). Thequestion is whether it is caused by primary magnetic minerals or al-teration. Ore microscopy of polished thin sections suggests that thedominant magnetic mineral is magnetite with differing amounts of ti-tanium ([titano]magnetite) (Table 2). This observation is also con-firmed by studies on volcanic rocks from Leg 152 (Fukuma, 1998).(Titano)magnetite undergoes alteration during low-temperature oxi-dation and hydrothermal alteration. In the upper part of the lavaflows, the highly vesicular and fractured texture provides pathwaysfor fluids. In the first step of low-temperature oxidation, the (ti-tano)magnetite is changed to (titano)maghemite (Fig. 7). This is ac-companied by decreasing susceptibility and magnetization intensityand increasing Curie temperatures. In the second step, the (ti-tano)maghemite is changed into magnetite and then further into he-matite. The oxidation to magnetite is accompanied by increasingCurie temperatures, susceptibility, and magnetization intensity,whereas the oxidation to hematite lowers the susceptibility and mag-netic intensity but increases the Curie temperature. It is not necessaryin each case during low-temperature oxidation that the (titano)mag-netite is first changed into (titano)maghemite and then into magnetiteor hematite. There might also be a direct way of oxidizing (ti-tano)magnetite into magnetite and hematite (Fig. 7). In addition tothe oxidation effects on the magnetic properties, susceptibility andmagnetic intensity are also dependent on the abundance of the mag-netic minerals, grain-size distribution, and shape.
In summary, we suggest from the magnetic property observationsthat the lower parts of the highly vesicular, scoriaceous, and fracturedlava top and bottom are characterized by high magnetic susceptibilityand intensity caused by different states of low-temperature oxidation.During these different states of low-temperature oxidation, suscepti-bility and magnetic intensity may be enhanced or reduced dependingon the alteration to magnetite or hematite. A secondary effect on themagnetic properties is caused by the grain-size distribution.
Implications for Well-Log Interpretation
Wireline logs are important to link downhole core data with sur-face geophysical measurements and to correctly interpolate missingsections in the core data (e.g., Goldberg, 1997). Detailed core-log in-tegration is often difficult as the accurate depth location of the cores
low temperature oxidation (T < 300 ˚C)
increasing oxidation
titanomagnetiteTc = 100 - 200 ˚C
(titano)maghemiteTc = 150 - 450 ˚C
titanite (CaTiSiO3)and/orperowskite (CaTiO3)(if Ca, Si are present)
magnetiteTc = 550 - 580 ˚Cand/or
hematiteTc = 650 - 630 ˚C
increasing Curie-temperature Tc
increasingmag. + sus.
decreasingmagn. + sus.
decreasingmag. + sus.
Figure 7. Behavior of the magnetic properties remanence and susceptibility,and Curie temperatures, during low temperature oxidation (modified after N.Petersen, pers. comm., 1982).
PETROPHYSICAL PROPERTIES OF SUBAERIAL FLOOD BASALTS
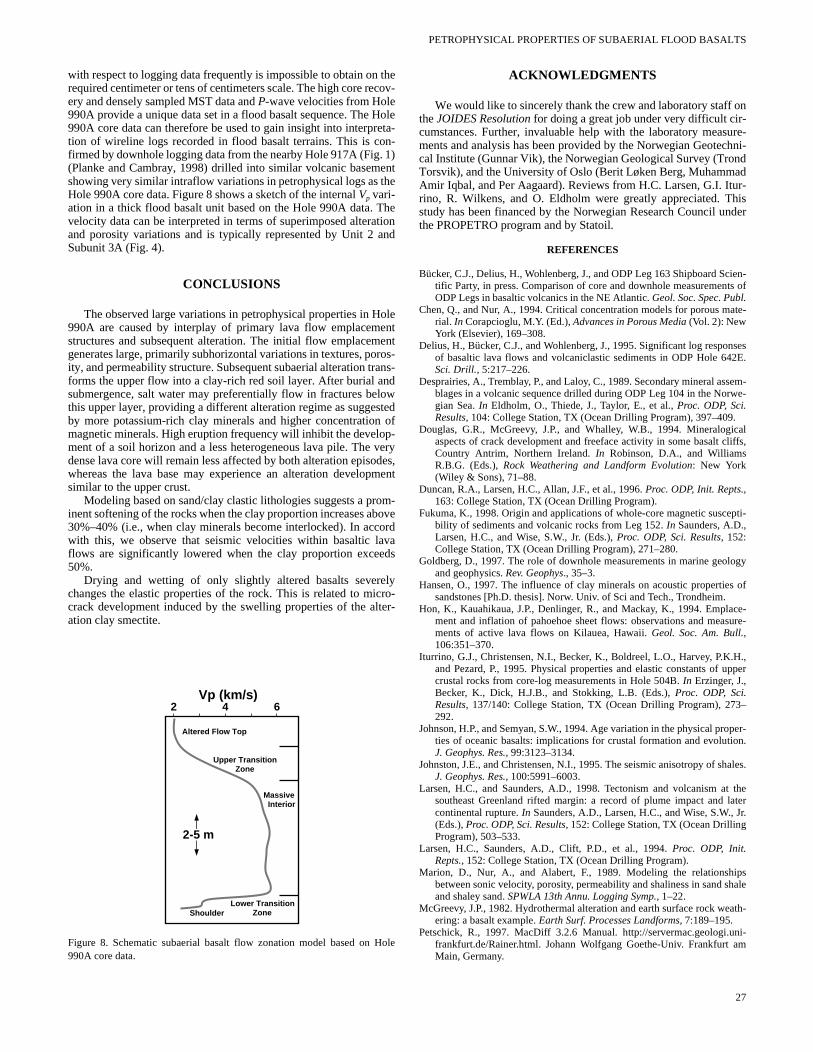
with respect to logging data frequently is impossible to obtain on therequired centimeter or tens of centimeters scale. The high core recov-ery and densely sampled MST data and P-wave velocities from Hole990A provide a unique data set in a flood basalt sequence. The Hole990A core data can therefore be used to gain insight into interpreta-tion of wireline logs recorded in flood basalt terrains. This is con-firmed by downhole logging data from the nearby Hole 917A (Fig. 1)(Planke and Cambray, 1998) drilled into similar volcanic basementshowing very similar intraflow variations in petrophysical logs as theHole 990A core data. Figure 8 shows a sketch of the internal Vp vari-ation in a thick flood basalt unit based on the Hole 990A data. Thevelocity data can be interpreted in terms of superimposed alterationand porosity variations and is typically represented by Unit 2 andSubunit 3A (Fig. 4).
CONCLUSIONS
The observed large variations in petrophysical properties in Hole990A are caused by interplay of primary lava flow emplacementstructures and subsequent alteration. The initial flow emplacementgenerates large, primarily subhorizontal variations in textures, poros-ity, and permeability structure. Subsequent subaerial alteration trans-forms the upper flow into a clay-rich red soil layer. After burial andsubmergence, salt water may preferentially flow in fractures belowthis upper layer, providing a different alteration regime as suggestedby more potassium-rich clay minerals and higher concentration ofmagnetic minerals. High eruption frequency will inhibit the develop-ment of a soil horizon and a less heterogeneous lava pile. The verydense lava core will remain less affected by both alteration episodes,whereas the lava base may experience an alteration developmentsimilar to the upper crust.
Modeling based on sand/clay clastic lithologies suggests a prom-inent softening of the rocks when the clay proportion increases above30%–40% (i.e., when clay minerals become interlocked). In accordwith this, we observe that seismic velocities within basaltic lavaflows are significantly lowered when the clay proportion exceeds50%.
Drying and wetting of only slightly altered basalts severelychanges the elastic properties of the rock. This is related to micro-crack development induced by the swelling properties of the alter-ation clay smectite.
2 4 6Vp (km/s)
2-5 m
Shoulder
Massive Interior
Altered Flow Top
Upper Transition Zone
Lower Transition Zone
Figure 8. Schematic subaerial basalt flow zonation model based on Hole990A core data.
ACKNOWLEDGMENTS
We would like to sincerely thank the crew and laboratory staff onthe JOIDES Resolution for doing a great job under very difficult cir-cumstances. Further, invaluable help with the laboratory measure-ments and analysis has been provided by the Norwegian Geotechni-cal Institute (Gunnar Vik), the Norwegian Geological Survey (TrondTorsvik), and the University of Oslo (Berit Løken Berg, MuhammadAmir Iqbal, and Per Aagaard). Reviews from H.C. Larsen, G.I. Itur-rino, R. Wilkens, and O. Eldholm were greatly appreciated. Thisstudy has been financed by the Norwegian Research Council underthe PROPETRO program and by Statoil.
REFERENCES
Bücker, C.J., Delius, H., Wohlenberg, J., and ODP Leg 163 Shipboard Scien-tific Party, in press. Comparison of core and downhole measurements ofODP Legs in basaltic volcanics in the NE Atlantic. Geol. Soc. Spec. Publ.
Chen, Q., and Nur, A., 1994. Critical concentration models for porous mate-rial. In Corapcioglu, M.Y. (Ed.), Advances in Porous Media (Vol. 2): NewYork (Elsevier), 169–308.
Delius, H., Bücker, C.J., and Wohlenberg, J., 1995. Significant log responsesof basaltic lava flows and volcaniclastic sediments in ODP Hole 642E.Sci. Drill., 5:217–226.
Desprairies, A., Tremblay, P., and Laloy, C., 1989. Secondary mineral assem-blages in a volcanic sequence drilled during ODP Leg 104 in the Norwe-gian Sea. In Eldholm, O., Thiede, J., Taylor, E., et al., Proc. ODP, Sci.Results, 104: College Station, TX (Ocean Drilling Program), 397–409.
Douglas, G.R., McGreevy, J.P., and Whalley, W.B., 1994. Mineralogicalaspects of crack development and freeface activity in some basalt cliffs,Country Antrim, Northern Ireland. In Robinson, D.A., and WilliamsR.B.G. (Eds.), Rock Weathering and Landform Evolution: New York(Wiley & Sons), 71–88.
Duncan, R.A., Larsen, H.C., Allan, J.F., et al., 1996. Proc. ODP, Init. Repts.,163: College Station, TX (Ocean Drilling Program).
Fukuma, K., 1998. Origin and applications of whole-core magnetic suscepti-bility of sediments and volcanic rocks from Leg 152. In Saunders, A.D.,Larsen, H.C., and Wise, S.W., Jr. (Eds.), Proc. ODP, Sci. Results, 152:College Station, TX (Ocean Drilling Program), 271–280.
Goldberg, D., 1997. The role of downhole measurements in marine geologyand geophysics. Rev. Geophys., 35–3.
Hansen, O., 1997. The influence of clay minerals on acoustic properties ofsandstones [Ph.D. thesis]. Norw. Univ. of Sci and Tech., Trondheim.
Hon, K., Kauahikaua, J.P., Denlinger, R., and Mackay, K., 1994. Emplace-ment and inflation of pahoehoe sheet flows: observations and measure-ments of active lava flows on Kilauea, Hawaii. Geol. Soc. Am. Bull.,106:351–370.
Iturrino, G.J., Christensen, N.I., Becker, K., Boldreel, L.O., Harvey, P.K.H.,and Pezard, P., 1995. Physical properties and elastic constants of uppercrustal rocks from core-log measurements in Hole 504B. In Erzinger, J.,Becker, K., Dick, H.J.B., and Stokking, L.B. (Eds.), Proc. ODP, Sci.Results, 137/140: College Station, TX (Ocean Drilling Program), 273–292.
Johnson, H.P., and Semyan, S.W., 1994. Age variation in the physical proper-ties of oceanic basalts: implications for crustal formation and evolution.J. Geophys. Res., 99:3123–3134.
Johnston, J.E., and Christensen, N.I., 1995. The seismic anisotropy of shales.J. Geophys. Res., 100:5991–6003.
Larsen, H.C., and Saunders, A.D., 1998. Tectonism and volcanism at thesoutheast Greenland rifted margin: a record of plume impact and latercontinental rupture. In Saunders, A.D., Larsen, H.C., and Wise, S.W., Jr.(Eds.), Proc. ODP, Sci. Results, 152: College Station, TX (Ocean DrillingProgram), 503–533.
Larsen, H.C., Saunders, A.D., Clift, P.D., et al., 1994. Proc. ODP, Init.Repts., 152: College Station, TX (Ocean Drilling Program).
Marion, D., Nur, A., and Alabert, F., 1989. Modeling the relationshipsbetween sonic velocity, porosity, permeability and shaliness in sand shaleand shaley sand. SPWLA 13th Annu. Logging Symp., 1–22.
McGreevy, J.P., 1982. Hydrothermal alteration and earth surface rock weath-ering: a basalt example. Earth Surf. Processes Landforms, 7:189–195.
Petschick, R., 1997. MacDiff 3.2.6 Manual. http://servermac.geologi.uni-frankfurt.de/Rainer.html. Johann Wolfgang Goethe-Univ. Frankfurt amMain, Germany.
27
S. PLANKE, B. CERNEY, C.J. BÜCKER, O. NILSEN
Planke, S., 1994. Geophysical response of flood basalts from analysis ofwireline logs: Ocean Drilling Program Site 642, Vøring volcanic margin.J. Geophys. Res., 99:9279–9296.
Planke, S., and Cambray, H., 1998. Seismic properties of flood basalts fromHole 917A downhole data, southeast Greenland volcanic margin. InSaunders, A.D., Larsen, H.C., and Wise, S.W., Jr. (Eds.), Proc. ODP, Sci.Results, 152: College Station, TX (Ocean Drilling Program), 453–462.
Planke, S., and Eldholm, O., 1994. Seismic response and construction of sea-ward dipping wedges of flood basalts: Vøring volcanic margin. J. Geo-phys. Res., 99:9263–9278.
Ruiz de Argandoña, V.G. Calleja, L., and Suárez del Río, L.M., 1995. Acous-tic emission during swelling and contraction tests. Eng. Geol., 39:147–150.
Self, S., Keszthelyi, L., and Thordarson, T., 1998. The importance of pahoe-hoe. Annu. Rev. Earth Planet. Sci, 26:81–110.
Self, S., Thordarson, T., and Keszthelyi, L., 1997. Emplacement of continen-tal flood basalt lava flows. In Mahoney, J.J., and Coffin, M. (Eds.), LargeIgneous Provinces: Continental, Oceanic, and Planetary Flood Volcan-ism. Am. Geophys. Union., Geophys. Monogr., 100:381–410.
Self, S., Thordarson, T., Keszthelyi, L., Walker, G.P.L., Hon, K., Murphy,M.T., Long, P., and Finnemore, S., 1996. A new model for the emplace-ment of Columbia River Basalts as large, inflated pahoehoe lava flowfields. Geophys. Res. Lett., 23:2689–2692.
28
Shipboard Scientific Party, 1996. Site 990. In Duncan, R.A., Larsen, H.C.,Allan, J.F., et al., Proc. ODP, Init. Repts., 163: College Station, TX(Ocean Drilling Program), 47–68.
Singer, A., Wieder, M., and Gvirtzman, G., 1994. Paleoclimate deduced fromsome early Jurassic basalt-derived paleosols form northern Israel.Palaeogeogr., Palaeoclimatol., Palaeoecol., 111:73–82.
Symonds, P.A., Planke, S., Frey, Ø., and Skogseid, J., 1998. Volcanic erup-tion of the Western Australian continental margin and its implications forbasin development. West. Austral. Basin Symp.
Vernik, L., and Liu, X., 1997. Velocity anisotropy in shales: a petrophysicalstudy. Geophysics, 62:521–532.
Wilkens, R.H., Fryer, G.J., and Karsten, J., 1991. Evolution of porosity andseismic structure of upper oceanic crust: importance of aspect ratios. J.Geophys. Res., 96:17891–17995.
Xu, S., and White, R.E., 1995. A new velocity model for clay-sand mixtures.Geophys. Prospect., 43:91–118.
Date of initial receipt: 12 January 1998Date of acceptance: 13 November 1998Ms 163SR-105