Embed Size (px)
Citation preview
Metabolic effects of cold exposure
1
The potential role of irisin in the thermoregulatory responses to mild cold exposure 1
in adults. 2
3
Emily K Calton1 4
Mario J Soares1, 3 5
Anthony P James1 6
Richard J Woodman2 7
8
1 Directorate of Nutrition, Dietetics & Food Technology 9
School of Public Health, Curtin Health Innovation Research Institute-Metabolic Health, 10
Faculty of Health Sciences, 11
Curtin University, Perth, Western Australia 6845. 12
13
2Flinders Centre for Epidemiology and Biostatistics 14
School of Medicine, Faculty of Medicine, Nursing and Health Sciences 15
Flinders University of South Australia, Adelaide, GPO Box 2100, SA 5001. 16
17
3Correspondence & reprints: 18
Associate Professor Mario J Soares 19
Directorate of Nutrition, Dietetics & Food Technology, School of Public Health, 20
Curtin Health Innovation Research Institute-Metabolic Health, 21
Curtin University, Perth, Western Australia 6845. 22
Email: [email protected] 23
Tel: +61-892663220 24
Fax: + 61-8-92662958 25
26
Number of pages: 19 27
Number of tables: 3 28
Number of figures: 0 29
30
Disclosure statement: The authors have no conflict of interest to disclose. 31
Australian New Zealand Clinical Trials Registry (ANZCTR). http://www.actr.org.au 32
ACTRN12612000509864 33
34
Metabolic effects of cold exposure
2
Abstract 35
Objectives: To determine the acute effect of a mild cold exposure on thermoregulatory 36
thermogenesis and the role of circulating irisin in the process. 37
Methods: We studied twenty two adults (9 males, 13 females) aged 57.7 10.07 years and 38
body mass index 27.8 4.52 kg/m2. Participants experienced a 90 min exposure to 20°C 39
and 25°C In a randomized cross-over design. Resting metabolic rate (RMR), forearm to 40
finger-tip gradient (FFG), blood pressure (BP), in-the-ear temperature (IET), and fasting 41
bloods were measured on each occasion. 42
Results: There were significant increases in FFG [mean SD: +3.8 3.0oC, p< 0.001], SBP 43
[+8 13 mmHg, p = 0.015] and DBP [+4 6 mmHg, p=0.005] and decreases in IET [-0.24 44
0.29oC, p=0.001]. Overall, RMR [+190 570 kJ/d, p=0.135], irisin, glucose or insulin did 45
not differ between temperatures. There were no significant between-gender differences, but 46
males significantly increased SBP (+12 ± 16, p= 0.02) and DBP (+6 ± 7, p= 0.02) with 47
decreases in heart rate (-4 ± 3, p= 0.002), while females did not. Moreover men had ~50% 48
higher thermogenic response while women had a ~25% greater vasoconstrictor response. 49
Adjusted for age, gender, insulin sensitivity and body composition, fold changes in irisin 50
was inversely related to RQ (r= -0.54, P=0.048), while IET was related to FFG (r= -0.55, 51
p=0.043). 52
Conclusions: Mild cold exposure increased vasoconstriction with a drop in IET and these 53
were related. Greater irisin was related to a greater fasting fat oxidation in the absence of 54
shivering. A potential gender bias in thermoregulation was noted. 55
56
Word count: 250 57
58
Key words: resting metabolic rate; cold-induced thermogenesis; vasoconstriction; irisin 59
Metabolic effects of cold exposure
3
Introduction 60
There is a pandemic of obesity and its associated co-morbidities. At the population level, 61
current recommendations to prevent weight gain through dietary modification and exercise 62
are not having their desired effect, as overweight and obesity is still on the rise (Ng et al., 63
2014) There is an urgent need for novel prevention and treatment strategies to help reverse 64
these detrimental trends. On exposure to a cold environment, humans respond by decreasing 65
heat loss via increased vasoconstriction, increasing RMR or both (Milan, 1980; Young et 66
al., 1996). Resting metabolic rate (RMR) makes the greatest contribution to total energy 67
expenditure in man. The demonstration that mild cold exposure is able to activate brown 68
adipose tissue and thereby increase RMR in adults, suggests cold exposure may be a 69
potential novel strategy in obesity prevention and treatment (Chen et al., 2013; van Marken 70
Lichtenbelt et al., 2009; Yoneshiro et al., 2013). Even small increases in cold-induced 71
thermogenesis have the potential to significantly impact on long-term energy expenditure if 72
sustained during both day and night (van Marken Lichtenbelt and Schrauwen, 2011). 73
74
Cold-induced thermogenesis is one form of adaptive thermogenesis and represents the 75
increase in heat production in response to ambient temperatures below the thermo-neutral 76
range. The spectrum of cold-induced thermogenesis includes non-shivering thermogenesis 77
and shivering thermogenesis. In defense of a drop in core body temperature, the body 78
increases non-shivering thermogenesis. This stimulation of energy expenditure is mostly at 79
the site of skeletal muscle and brown adipose tissue, whereby heat production occurs via 80
mitochondrial uncoupling of oxygen consumption and adenosine triphosphate production 81
(Wijers et al., 2008). In an acute setting, when the required demand for heat production 82
cannot be met, ST is activated to dramatically increase heat production through vigorous 83
muscle contractions. Irisin, is a newly discovered myokine that was first described as being 84
Metabolic effects of cold exposure
4
stimulated by exercise. Very recently it has been demonstrated that irisin secretion is also 85
increased on exposure to low ambient temperatures and closely follows the degree of 86
shivering; hence contributing to ST (Lee et al., 2014). Hence, irisin may represent a cold-87
activated thermogenic factor that is potentially exploitable toward obesity prevention and 88
treatment. Various factors such as age (Charkoudian, 2010; Kingma et al., 2011), gender 89
(Graham, 1988), and adiposity (Ooijen et al., 2006) have been shown to influence the 90
physiological response to cold stress. The current study was designed to determine the effect 91
of a mild cold exposure on thermoregulatory variables, RMR and vasoconstriction, in adults 92
who span a spectrum of age, gender and body composition. To the best of our knowledge 93
the response of irisin to mild cold induced thermoregulation has not be studied before. 94
95
Methods 96
Study design and participants 97
Participants were recruited via flier advertisement, radio advertisement, community 98
newspapers and social media websites. Interested participants were assessed for eligibility 99
by means of a short screening questionnaire. Inclusion criteria were as follows: Australians 100
of European origin; aged between 20–70 years; body mass index (BMI) ≥ 20 kg/m2, 101
weight stable (< ± 2 kg) in the previous 3 months with no intention for weight loss within 102
the next 3 months and absence of the following by self-report: fever, thyroid disease, 103
polycystic ovarian syndrome, type 2 diabetes, previous heart attack; current pregnancy, 104
lactation, peri-menopausal status, smoking, use of thermogenic agents, hormonal 105
contraception and hormone replacement therapy. This study was conducted according to the 106
guidelines laid down in the Declaration of Helsinki and all procedures involving human 107
subjects/patients were approved by the Curtin University Ethics Committee [HREC number 108
Metabolic effects of cold exposure
5
20/2012] and registered at www.ANZCTR.org.au (ACTRN12612000509864). Written 109
informed consent was obtained from all participants. 110
111
Intervention 112
The study took place in the environmental chamber housed at the School of Public Health, 113
Curtin University, Western Australia, between September and November 2012. The 114
chamber is a purpose built structure within a large room of the building. It has a volume of 115
57.75 m3, insulated walls and roof and is independently controlled for temperature range 116
from 4°C to 50°C. The study used a randomized crossover design, and participants were 117
studied at two temperatures, mean (within day SD) 20°C (0.37)°C (the intervention) and 118
25°C (0.4)°C (the control temperature). Exposure to each temperature was for 90 mins. 119
Randomization to the first temperature condition was determined using block randomization 120
with random block sizes and randomly generated codes for each block (Random Allocation 121
Software, version 1.0, Isfahan University of Medical Sciences, Isfahan, Iran). The two 122
measurement sessions were separated by no more than 2 weeks. Participants arrived at the 123
laboratory by car or public transportation and were instructed not to perform any strenuous 124
activity the day before the experiment to avoid any effects of activity on RMR. Participants 125
presented in the fasting state, 10-12 hours after a standardized evening meal (2010 kJ; 126
15.73% protein, 31.85% total fat, 14.73% saturated fat, 52.43% carbohydrate), which we 127
provided in advance, to avoid any effects of previous evening meal on the next day’s 128
metabolic measurements. 129
130
Physical characteristics and body composition 131
Participants voided their bladder and changed into a provided gown with only their under 132
garments, for weight, height and waist circumference measurements. Weight was measured 133
Metabolic effects of cold exposure
6
using an electronic platform balance (CW-11, Precision Balances Pty Ltd). Height was 134
measured using a stadiometer fixed to a wall (Seca, Hamburg, Germany). Waist 135
circumference was measured midway between the lowest rib of the ribcage and the iliac 136
crest (Ashwell and Browning, 2011). Body composition was assessed by bioelectrical 137
impedance analysis with the InBody 3.0 Body Composition Analyzer and software 138
(Biospace, Korea). 139
140
Clothing, shivering response and comfort levels 141
Clothing worn by participants in the chamber was standardized to within 0.5 clo. All 142
participants were provided with a gown (0.46 clo), females wore their own bra and 143
underwear (0.04 clo) and males wore their own briefs (0.04 clo). Participants were asked to 144
verbally notify the investigators if they started to shiver. At 30 minutes in the chamber, a 145
10mm visual analogue scale (VAS) questionnaire was administered to determine comfort 146
levels at 20°C and 25°C, similar to the VAS used by others (Westerterp-Plantenga et al., 147
2002b). Question 1 (VASQ1) asked the participant “How agreeable do you find the room 148
temperature right now?” (anchored; very agreeable/not agreeable at all). Question 2 149
(VASQ2) asked the participant “Do you feel comfortable?” (anchored; very comfortable/not 150
comfortable at all). 151
152
Body temperature 153
To assess peripheral vasoconstriction, iButtons (iButton type DS1921H-F#, Maxim 154
Integrated Products, Inc., USA) were placed on the left middle fingertip on the 155
ventral side and the dorsal left forearm, midway between the elbow and wrist using 156
fixomull tape (BSN, Hamburg, Germany). The iButtons measured skin temperatures 157
continuously during the experimental days and have been recently validated for this use (van 158
Metabolic effects of cold exposure
7
Marken Lichtenbelt et al., 2006). Peripheral vasoconstriction was measured as the forearm 159
to fingertip temperature gradient (FFG) (Rubinstein and Sessler, 1990). Core temperature 160
is generally defined as the temperature measured within the pulmonary artery. IET 161
measurements have been known as accurate, valid and reproducible measurements of core 162
body temperature, reflecting temperature changes within the pulmonary artery (Benzinger, 163
1969; Erickson and Kirklin, 1993; Hasper et al., 2011). Thus, IET measurements were made 164
after 50 minutes in the chamber using a standard in the ear thermometer (Omron Model 165
MC-510). Three measurements of IET were made with the average of the two closest 166
measurements recorded. 167
168
Resting metabolic rate 169
Participants rested in the supine position for 30 minutes to equilibrate with the temperature 170
of the environmental chamber. RMR was measured via indirect calorimetry (Deltatrac II, 171
Datex Instrumentarium, Finland), according to a standardized protocol that emphasized 30 172
minute rest (Piers et al., 2002). A trial RMR measurement was made for 20 minutes for 173
participants to become accustomed to the canopy. After a 20 minute rest period, RMR was 174
again measured as described above. The RMRs reported represent the value after a 90 min 175
exposure to that temperature. RMR in kJ/d was derived from CO2 production and O2 176
consumption according to the Weir’s formula, neglecting protein oxidation in the 177
fasting state (Weir, 1990). Substrate oxidation was calculated as volume CO2/volume O2. 178
The Deltatrac II apparatus was calibrated with gas mixtures of known composition (95% 179
O2, 5% CO2) before each measurement session and regularly checked by 30 minute ethanol 180
burn tests (mean and SD for six tests during the study was RQ = 0.66 ± 0.02). 181
Blood pressure and heart rate 182
Metabolic effects of cold exposure
8
Systolic blood pressure (SBP) and diastolic blood pressure (DBP) were measured after 50 183
minutes in the chamber using an automatic blood pressure monitor (IA2, Omron Healthcare 184
Co., Ltd Japan). The average of two consecutive measurements was recorded. Heart rate 185
was recorded in the same fashion (Pulse Trace, Viasys, Pa, USA). 186
187
Blood collection and analysis 188
A fasting venous sample was obtained after 90 mins exposure to the set temperature by 189
experienced phlebotomists in EDTA-containing tubes to prevent clotting, centrifuged for 10 190
minutes and stored at -80°C for analysis 2 months later. Briefly, triglyceride, total 191
cholesterol, high-density lipoprotein cholesterol and fasting blood glucose were determined 192
using routine automated procedures on an Architect c16000 analyzer that used specific 193
enzyme-based colorimetric reagents (Abbott Diagnostics; CV < 2%). Low-density 194
lipoprotein cholesterol was estimated using the Friedewald equation (Friedewald et al., 195
1972). Fasting insulin was determined by Pathwest Laboratories Perth Australia using an 196
Architect i2000SR Analyser (Abbott Diagnostics; CV < 3%). McAuley’s index for insulin 197
resistance was calculated from triglyceride and insulin concentrations (Hettihewa et al., 198
2006). Plasma irisin, was measured using an ELISA kit (AdipoGen, AG-45A-0046PP-KI01; 199
inter-assay CV<7%). Due to technical reasons, we could not obtain complete blood samples 200
from three participants. 201
202
Repeatability Trial 203
To examine repeatability of measurements, 6 subjects returned for a second measure of the 204
protocol at 20°C. 205
206
Primary study outcomes 207
Metabolic effects of cold exposure
9
Primary study outcomes were RMR, irisin and FFG. 208
209
Statistical analysis 210
Our sample size of 22 provided more than 80% power at a two-tailed alpha level = 0.05, to 211
detect a moderate effect size of 0.53 in RMR. Our sample size was similar to previous studies 212
examining physiological responses to cold exposure (Celi et al., 2010; Westerterp-Plantenga 213
et al., 2002a; Wijers et al., 2010). Normally distributed data are presented as mean (SD). 214
Paired t tests were used to assess the effect of temperature on clinical characteristics and 215
thermoregulatory variables. We used IET, as the proxy variable for core temperature since 216
previous research had established its validity (Benzinger, 1969; Erickson and Kirklin, 1993; 217
Hasper et al., 2011).Univariate analysis was performed using a Spearman’s rho correlation 218
matrix to examine factors associated with fold changes in IET, RMR FFG, BP and irisin. 219
All statistics were analyzed using SPSS for Windows version 22.0 (SPSS, Chicago, IL). 220
Statistical significance was accepted at p < 0.05. 221
222
Results 223
Baseline demographics, body composition and key MetS variables 224
Twenty two Australians of European origin (9 males, 13 females) were recruited into the 225
study and there were no dropouts. Participants had a mean SD (range) age of 57.73 10.07 226
years (29-68 years), weight 79.80 17.82 kg (49.65-109.1 kg), BMI of 27.80 4.52 kg/m2 227
(19.89-33.73 kg/m2), fat mass of 60.54 14.06 kg (41.7-87.3 kg) and fat-free mass of 20.88 228
7.93 kg (7.9-36.5 kg) (Table 1). 229
230
[Table 1 here] 231
Repeatability 232
Metabolic effects of cold exposure
10
Test-retest values at 20°C were non-significant for all parameters (paired t test) and intra-233
individual CV% were as follows: IET 0.6% [35.68 0.42 °C vs 35.4 0.34 °C], RMR 4.0% 234
[5457 2104 kJ/d vs 5274 1933 kJ/d], substrate oxidation 2.7% [0.84 0.049 vs 0.84 235
0.034], FFG 15.2% [5.31 1.43 °C vs 5.09 1.13 °C], fat mass 1.1% [15.62 6 kg vs 236
15.92 6 kg], fat-free mass 4.5% [54.15 17.49 kg vs 53.40 17.10 kg], SBP 2.6% [129 237
19 mmHg vs 128 21 mmHg], and DBP 2.8% [70 8 mmHg vs 61 10 mmHg]. 238
239
IET, RMR, and FFG 240
IET at 20°C was significantly lower than 25°C (Table 2; p = 0.001, Fig.1A). We detected a 241
3.1% increase in RMR at 20oC compared to 25oC (range 10.01% decrease to a 20.62% 242
increase), although this was non-significant (Table 2, Fig. 1B). Removal of the 6 243
participants in whom RMR dipped below the paired value at 25°C, resulted in a significant 244
increase in RMR by 444 442 kJ/d (p=0.001). The FFG, reflecting vasoconstriction, was 245
significantly higher at 20°C than at 25°C (Table 2; change=3.75 3.02 °C, p < 0.001, Fig. 246
1C). There was no significant gender difference in IET, RMR or FFG, however there was 247
a sizeable difference in FFG response with females showing a 0.96 oC greater 248
vasoconstriction and males showing a greater thermogenic response by 80 kJ (Table 3). 249
250
[Table 2 here] 251
252
[Table 3 here] 253
254
255
256
Correlations - Change in IET, RMR, FFG and irisin 257
Metabolic effects of cold exposure
11
Gender was not associated with fold change in IET (r=100, p=0.658), RMR (r=0.053, 258
p=0.815), FFG (r=-0.250, p=0.263) or irisin (r=-0.248, p=0.306). Fold change in IET 259
showed a trend towards an association with the change in RMR (r=0.41, p=0.058), but this 260
was firmly non-significant after adjustment for age, FM(%) and FFM(kg) (r=0.429, 261
p=0.126). Unadjusted fold change in irisin showed a trend towards an association with fold 262
change in RMR (r=0.396, p=0.094). On adjustment for age, gender, McA and body 263
composition, fold change in irisin was inversely correlated with RQ (r= -0.54, p=0.048), 264
while fold change in IET was significantly related to changes in FFG ( r = -0.55, P=0.043) 265
No other significant associations were observed. 266
267
Bloods, heart rate, blood pressure and thermal comfort 268
Both SBP and DBP were higher at 20°C than at 25°C (Table 2, p < 0.015 and p < 0.005, 269
respectively) while heart rate tended to be lower (p = 0.053). There were no differences in 270
plasma glucose, insulin, triglyceride and irisin concentrations between the different 271
temperatures (data not shown). VAS questions addressing thermal comfort, showed a 272
significant preference for 25°C compared to 20°C (VASQ1: [1.4 1.8 cm at 25°C vs 3.4 273
3.1 cm at 20°C, p = 0.009]; VASQ2: [1.1 1.3 cm at 25°C vs 3.3 2.5 cm at 20°C, p = 274
0.001). None of the participants reported shivering during the protocol, nor was any 275
physical signs of shivering observed. 276
277
Gender bias 278
There were no significant differences in responses between genders, however there was a 279
trend for a gender bias in RMR response with males showing ~50% higher change related 280
to females (Table 3; males 233 773 kJ/d vs females 160 418 kJ/d, p = 0.087). In contrast 281
females had a ~25% greater vasoconstrictor response relative to males (Table 3). Moreover 282
Metabolic effects of cold exposure
12
males significantly increased their SBP 3 times more than the females (Table 3) and 283
decreased their HR 4-fold compared to the females (Table 3). Overall, male subjects 284
responded by increased SBP 12 mmHg (p = 0.02) and DBP 6 mmHg (p = 0.02), 285
while female subjects responded mainly through vasoconstriction (Table 3; 4.16 °C 286
p < 0.001). 287
288
Discussion 289
The current study examined the effect of mild cold exposure on thermoregulatory variables 290
and investigated whether irisin played a role in thermoregulation. Our RMR measures at 291
25oC are lower than predicted from FFM, based on a published equation (Cunningham, 292
1991). This is possibly due to a significant overestimation of FFM by the BIA device used 293
in this study rather than errors in RMR. Unpublished observations in our laboratory suggest 294
a ~10% (~4.7 kg) overestimation of FFM compared to DEXA, despite an excellent 295
correlation coefficient of 0.97 between the two techniques. Other authors have also noted 296
similar outcomes for a comparable BIA model (Bolanowski and Nilsson, 2001). In this 297
paired design, the ability to detect changes in RMR due to temperature was critical. We 298
obtained an intra-individual CV in RMR of 4%, which if separated from technical error (1.5-299
3%), is well within the expected range for variations in RMR (Adriaens et al., 2003; Adzika 300
Nsatimba et al., 2015; Soares and Shetty, 1986). 301
302
We detected a 3.1% non-significant increase in RMR upon exposure to 20°C (Table 2), 303
which was approximately half the increase reported by others (Celi et al., 2010; Westerterp-304
Plantenga et al., 2002a; Wijers et al., 2010). The stimulation of RMR in response to mild 305
cold exposure has been reported (Celi et al., 2010; Maeda et al., 2007; Wijers et al., 2010) 306
but it is not a consistent observation in every individual. Cold-induced thermogenesis is 307
Metabolic effects of cold exposure
13
highly variable between individuals (Ooijen et al., 2006). In fact a lower RMR in response 308
to cold is noted in several studies (Celi et al., 2010; van Marken Lichtenbelt et al., 2002) and 309
6 of 22 participants in the current trial showed no change or a lower RMR to cold exposure. 310
Some authors have explained this observation on the basis of a Q10 effect, where a decrease 311
in energy expenditure accompanies a drop in tissue temperature (van Marken Lichtenbelt 312
and Schrauwen, 2011). Another likely explanation is that our participants were acclimatized 313
to mild cold, as the study was conducted towards the end of winter where an average 314
maximum of 18-20 °C in Perth was reached. Hence prior cold exposure could have blunted 315
thermogenic responses to mild cold (Armstrong and Thomas, 1991; Young, 1996). There is 316
a re-emergence of the role of BAT in human thermoregulation (van Marken Lichtenbelt et 317
al., 2009; Yoneshiro et al., 2013). It is hence possible that some participants had minimal 318
BAT, and therefore increases in energy expenditure were less than expected. Previous 319
studies have found an elevated metabolic rate only in those with high levels of BAT (Muzik 320
et al., 2013). Clearly future trials need to include measurements of BAT activity. 321
322
Similar to findings by previous investigators, we observed that core temperature 323
significantly decreased (van Marken Lichtenbelt et al., 2002), with an increase in peripheral 324
vasoconstriction (Table 2). Moreover, a decrease in heart rate (Celi et al., 2010; van Marken 325
Lichtenbelt and Schrauwen, 2011) and an increase in SBP and DBP (Celi et al., 2010) were 326
also noted (Table 2). Overall, such data are probably indicative of an increased sympathetic 327
nervous system activity that is seen with cold-induced thermogenesis and suggest that our 328
participants favored a vasoconstriction response to minimize heat loss. This study was not 329
specifically designed to examine gender differences in the physiological response to mild 330
cold stress. However some interesting but non-significant observations emerged. There were 331
greater decreases in heart rate, increases in blood pressure and a greater thermogenic 332
Metabolic effects of cold exposure
14
response in males relative to females (Table 3). Similar findings have been previously 333
observed by others (Graham, 1988; Pettit et al., 1999; Stevens et al., 1987). 334
335
There were no differences between temperatures, in the circulating levels of the myokine 336
irisin, and participants did not complain of shivering nor was it observed. Collectively, these 337
observations would indicate that the adaptive increases in RMR observed in our participants, 338
represent NST. Plasma irisin was not different between temperatures but was inversely 339
related to adjusted RQ. These data suggest that circulating irisin may play a role in fat 340
oxidation in the fasted state. The conditions for RMR measurement in a thermo-neutral 341
range mandates the absence of small muscle activity and fidgeting, so that subjects are 342
completely relaxed. However on exposure to cold, a pre-shivering increase in muscular tone 343
is a physiological response (Meigal, 2002). Such changes can be expected to contribute to 344
RMR, since forearm resting oxygen consumption makes a significant contribution to RMR 345
even on adjusting for body composition (Zurlo et al., 1990). It remains to be determined 346
whether irisin increases in response to heightened muscular tone as monitored by EMG 347
recordings. The latter would indicate a more subtle role for irisin in human metabolism, 348
other than its stated role in shivering thermogenesis. 349
350
There are several strengths of the present study including its randomized cross-over design. 351
We used temperatures that were mild, and reflected the seasonality in ambient temperatures 352
encountered by participants living in Perth, Australia. We conducted repeatability studies 353
for the cold exposure and obtained very good precision for all variables. We addressed the 354
potential shivering response by inquiring about thermal comfort and monitoring plasma 355
irisin. However the lack of EMG recordings meant that increased muscle tone or shivering 356
per se could not be objectively confirmed in our participants. Further, we acknowledge that 357
Metabolic effects of cold exposure
15
participants are unlikely to detect the increased muscle tone which precedes shivering. 358
However, given the mild temperature used in this study, and that VAS scores reflected only 359
minor levels of discomfort, an increased pre-shivering muscle tone and shivering is unlikely. 360
An unanticipated outcome was that a fairly large proportion of our participants (6 of 22) 361
were non-responders in RMR. Whether this is due to a Q10 effect or lack of BAT needs 362
confirmation. Future studies examining thermoregulatory responses to mild cold must keep 363
the possibility of no-responders in mind while determining the sample size of their study 364
design. 365
366
In conclusion, the response to a mild cold exposure favored vasoconstriction to reduce heat 367
loss and did not induce a statistically significant stimulation of RMR. Hence our data 368
suggests that mild cold exposure may be an effective way to increase energy expenditure in 369
some people, but may not be effective in others. The precise role of irisin in 370
thermoregulatory thermogenesis needs confirmation. Our findings raise the possibility that 371
subtle increases in irisin may increase fasting fat oxidation and hence play a role well before 372
shivering has developed. As humans spends most of their time in a postprandial state, future 373
studies could investigate whether food consumption is able to stimulate a greater 374
thermogenic response to mild cold exposure through diet-induced thermogenesis. 375
376
377
Metabolic effects of cold exposure
16
Conflicts of interest 378
The authors have no conflict of interest to disclose based on the ICMJE guidelines. 379
380
381
Author’s contributions 382
EKC, MJS, and APJ planned the study. EKC conducted all aspects of the data collection. 383
EKC, MJS and RW conducted the statistical analyses. EKS and MJS wrote the draft 384
manuscript. TPJ and RW critically reviewed and co-wrote the manuscript. 385
386
387
Acknowledgments 388
The authors thank Dr. Veronica Miller for useful discussions on the study and the reviewers 389
of the manuscript for their valuable advice. MJS gratefully acknowledges the School of 390
Public Curtin University for the research facilities. 391
392
393
394
395
396
397
Metabolic effects of cold exposure
17
Literature cited 398
Adriaens MP, Schoffelen PF, Westerterp KR. 2003. Intra-individual variation of basal 399
metabolic rate and the influence of daily habitual physical activity before testing. 400
Br J Nutr 90(2):419-423. 401
Adzika Nsatimba PA, Pathak K, Soares MJ. 2015. Ethnic differences in resting metabolic 402
rate, respiratory quotient and body temperature: A comparison of africans and 403
european australians. Eur J Nutr. 404
Armstrong DW, Thomas JR. 1991. Alterations in resting oxygen consumption in women 405
exposed to 10 days of cold air. FASEB J 5(4):393. 406
Ashwell M, Browning L. 2011. The increasing importance of waist-to-height ratio to 407
assess cardiometabolic risk: A plea for consistent terminology. Open Obes J(3):70-408
77. 409
Benzinger M. 1969. Tympanic thermometry in surgery and anesthesia. JAMA 410
209(8):1207-1211. 411
Bolanowski M, Nilsson BE. 2001. Assessment of human body composition using dual-412
energy x-ray absorptiometry and bioelectrical impedance analysis. Med Sci Monit 413
7(5):1029-1033. 414
Celi FS, Brychta RJ, Linderman JD, Butler PW, Alberobello AT, Smith S, Courville AB, 415
Lai EW, Costello R, Skarulis MC, Csako G, Remaley A, Pacak K, Chen KY. 2010. 416
Minimal changes in environmental temperature result in a significant increase in 417
energy expenditure and changes in the hormonal homeostasis in healthy adults. Eur 418
J Endocrinol 163(6):863-872. 419
Charkoudian N. 2010. Mechanisms and modifiers of reflex induced cutaneous vasodilation 420
and vasoconstriction in humans. J Appl Physiol (1985) 109(4):1221-1228. 421
Chen KY, Brychta RJ, Linderman JD, Smith S, Courville A, Dieckmann W, Herscovitch 422
P, Millo CM, Remaley A, Lee P, Celi FS. 2013. Brown fat activation mediates 423
cold-induced thermogenesis in adult humans in response to a mild decrease in 424
ambient temperature. J Clin Endocrinol Metab 98(7):E1218-1223. 425
Cunningham JJ. 1991. Body composition as a determinant of energy expenditure: A 426
synthetic review and a proposed general prediction equation. Am J Clin Nutr 427
54(6):963-969. 428
Erickson RS, Kirklin SK. 1993. Comparison of ear-based, bladder, oral, and axillary 429
methods for core temperature measurement. Crit Care Med 21(10):1528-1534. 430
Friedewald WT, Levy RI, Fredrickson DS. 1972. Estimation of the concentration of low-431
density lipoprotein cholesterol in plasma, without use of the preparative 432
ultracentrifuge. Clin Chem 18(6):499-502. 433
Graham TE. 1988. Thermal, metabolic, and cardiovascular changes in men and women 434
during cold stress. Med Sci Sports Exerc 20(5 Suppl):S185-192. 435
Hasper D, Nee J, Schefold JC, Krueger A, Storm C. 2011. Tympanic temperature during 436
therapeutic hypothermia. Emerg Med J 28(6):483-485. 437
Hettihewa LM, Palangasinghe S, Jayasinghe SS, Gunasekara SW, Weerarathna TP. 2006. 438
Comparison of insulin resistance by indirect methods - homa, quicki and mcauley - 439
with fasting insulin in patients with type 2 diabetes in galle, sri lanka: A pilot 440
study. . Online J Health Allied Sci 5(1):1-8. 441
Kingma BR, Frijns AJ, Saris WH, van Steenhoven AA, Lichtenbelt WD. 2011. Increased 442
systolic blood pressure after mild cold and rewarming: Relation to cold-induced 443
thermogenesis and age. Acta Physiol (Oxf) 203(4):419-427. 444
Lee P, Linderman Joyce D, Smith S, Brychta Robert J, Wang J, Idelson C, Perron 445
Rachel M, Werner Charlotte D, Phan Giao Q, Kammula Udai S, Kebebew E, Pacak 446
Metabolic effects of cold exposure
18
K, Chen Kong Y, Celi Francesco S. 2014. Irisin and fgf21 are cold-induced 447
endocrine activators of brown fat function in humans. Cell Metabolism 19(2):302-448
309. 449
Maeda T, Fukushima T, Ishibashi K, Higuchi S. 2007. Involvement of basal metabolic rate 450
in determination of type of cold tolerance. J Physiol Anthropol 26(3):415-418. 451
Meigal A. 2002. Gross and fine neuromuscular performance at cold shivering. 2002 61(2). 452
Milan FA. 1980. The human biology of circumpolar populations. New York: Cambridge 453
University Press. 454
Muzik O, Mangner TJ, Leonard WR, Kumar A, Janisse J, Granneman JG. 2013. 15o pet 455
measurement of blood flow and oxygen consumption in cold-activated human 456
brown fat. J Nucl Med 54(4):523-531. 457
Ng M, Fleming T, Robinson M, Thomson B, Graetz N, Margono C, Mullany EC, 458
Biryukov S, Abbafati C, Abera SF, Abraham JP, Abu-Rmeileh NM, Achoki T, 459
AlBuhairan FS, Alemu ZA, Alfonso R, Ali MK, Ali R, Guzman NA, Ammar W, 460
Anwari P, Banerjee A, Barquera S, Basu S, Bennett DA, Bhutta Z, Blore J, Cabral 461
N, Nonato IC, Chang JC, Chowdhury R, Courville KJ, Criqui MH, Cundiff DK, 462
Dabhadkar KC, Dandona L, Davis A, Dayama A, Dharmaratne SD, Ding EL, 463
Durrani AM, Esteghamati A, Farzadfar F, Fay DF, Feigin VL, Flaxman A, 464
Forouzanfar MH, Goto A, Green MA, Gupta R, Hafezi-Nejad N, Hankey GJ, 465
Harewood HC, Havmoeller R, Hay S, Hernandez L, Husseini A, Idrisov BT, Ikeda 466
N, Islami F, Jahangir E, Jassal SK, Jee SH, Jeffreys M, Jonas JB, Kabagambe EK, 467
Khalifa SE, Kengne AP, Khader YS, Khang YH, Kim D, Kimokoti RW, Kinge 468
JM, Kokubo Y, Kosen S, Kwan G, Lai T, Leinsalu M, Li Y, Liang X, Liu S, 469
Logroscino G, Lotufo PA, Lu Y, Ma J, Mainoo NK, Mensah GA, Merriman TR, 470
Mokdad AH, Moschandreas J, Naghavi M, Naheed A, Nand D, Narayan KM, 471
Nelson EL, Neuhouser ML, Nisar MI, Ohkubo T, Oti SO, Pedroza A, Prabhakaran 472
D, Roy N, Sampson U, Seo H, Sepanlou SG, Shibuya K, Shiri R, Shiue I, Singh 473
GM, Singh JA, Skirbekk V, Stapelberg NJ, Sturua L, Sykes BL, Tobias M, Tran 474
BX, Trasande L, Toyoshima H, van de Vijver S, Vasankari TJ, Veerman JL, 475
Velasquez-Melendez G, Vlassov VV, Vollset SE, Vos T, Wang C, Wang X, 476
Weiderpass E, Werdecker A, Wright JL, Yang YC, Yatsuya H, Yoon J, Yoon SJ, 477
Zhao Y, Zhou M, Zhu S, Lopez AD, Murray CJ, Gakidou E. 2014. Global, 478
regional, and national prevalence of overweight and obesity in children and adults 479
during 1980-2013: A systematic analysis for the global burden of disease study 480
2013. Lancet 384(9945):766-781. 481
Ooijen AMJC-v, Westerterp KR, Wouters L, Schoffelen PFM, van Steenhoven AA, van 482
Lichtenbelt WDM. 2006. Heat production and body temperature during cooling 483
and rewarming in overweight and lean men. Obesity 14(11):1914-1920. 484
Pettit SE, Marchand I, Graham T. 1999. Gender differences in cardiovascular and 485
catecholamine responses to cold-air exposure at rest. Canadian Journal of Applied 486
Physiology 24(2):131-147. 487
Piers LS, Walker KZ, Stoney RM, Soares MJ, O'Dea K. 2002. The influence of the type of 488
dietary fat on postprandial fat oxidation rates: Monounsaturated (olive oil) vs 489
saturated fat (cream). Int J Obes Relat Metab Disord 26(6):814-821. 490
Rubinstein EH, Sessler DI. 1990. Skin-surface temperature gradients correlate with 491
fingertip blood flow in humans. Anesthesiology 73(3):541-545. 492
Soares MJ, Shetty PS. 1986. Intra-individual variations in resting metabolic rates of human 493
subjects. Hum Nutr Clin Nutr 40(5):365-369. 494
Stevens GH, Graham TE, Wilson BA. 1987. Gender differences in cardiovascular and 495
metabolic responses to cold and exercise. Can J Physiol Pharmacol 65(2):165-171. 496
Metabolic effects of cold exposure
19
van Marken Lichtenbelt WD, Daanen HA, Wouters L, Fronczek R, Raymann RJ, Severens 497
NM, Van Someren EJ. 2006. Evaluation of wireless determination of skin 498
temperature using ibuttons. Physiol Behav 88(4-5):489-497. 499
van Marken Lichtenbelt WD, Schrauwen P. 2011. Implications of nonshivering 500
thermogenesis for energy balance regulation in humans. Am J Physiol Regul Integr 501
Comp Physiol 301(2):R285-296. 502
van Marken Lichtenbelt WD, Schrauwen P, van De Kerckhove S, Westerterp-Plantenga 503
MS. 2002. Individual variation in body temperature and energy expenditure in 504
response to mild cold. Am J Physiol Endocrinol Metab 282(5):E1077-1083. 505
van Marken Lichtenbelt WD, Vanhommerig JW, Smulders NM, Drossaerts JM, Kemerink 506
GJ, Bouvy ND, Schrauwen P, Teule GJ. 2009. Cold-activated brown adipose tissue 507
in healthy men. N Engl J Med 360(15):1500-1508. 508
Weir JB. 1990. New methods for calculating metabolic rate with special reference to 509
protein metabolism. 1949. Nutrition 6(3):213-221. 510
Westerterp-Plantenga MS, van Marken Lichtenbelt WD, Cilissen C, Top S. 2002a. Energy 511
metabolism in women during short exposure to the thermoneutral zone. Physiol 512
Behav 75(1-2):227-235. 513
Westerterp-Plantenga MS, van Marken Lichtenbelt WD, Strobbe H, Schrauwen P. 2002b. 514
Energy metabolism in humans at a lowered ambient temperature. Eur J Clin Nutr 515
56(4):288-296. 516
Wijers SL, Saris WH, van Marken Lichtenbelt WD. 2010. Cold-induced adaptive 517
thermogenesis in lean and obese. Obesity (Silver Spring) 18(6):1092-1099. 518
Wijers SL, Schrauwen P, Saris WH, van Marken Lichtenbelt WD. 2008. Human skeletal 519
muscle mitochondrial uncoupling is associated with cold induced adaptive 520
thermogenesis. PLoS One 3(3):e1777. 521
Yoneshiro T, Aita S, Matsushita M, Kayahara T, Kameya T, Kawai Y, Iwanaga T, Saito 522
M. 2013. Recruited brown adipose tissue as an antiobesity agent in humans. J Clin 523
Invest 123(8):3404-3408. 524
Young A, Sawka M, Pandolf K. 1996. Physiology of cold exposure. Nutritional needs in 525
cold and in high-altitude environments: Applications for military personnel in field 526
operations. Washington (DC): National Academies Press (US). 527
Young AJ. 1996. Human adapatations to cold stress. The Netherlands: SPB Academic 528
Publishing. 529
Zurlo F, Larson K, Bogardus C, Ravussin E. 1990. Skeletal muscle metabolism is a major 530
determinant of resting energy expenditure. J Clin Invest 86(5):1423-1427. 531
532
533
534
535
536
537
538
539
540
541
542
543
544
545
546
Metabolic effects of cold exposure
20
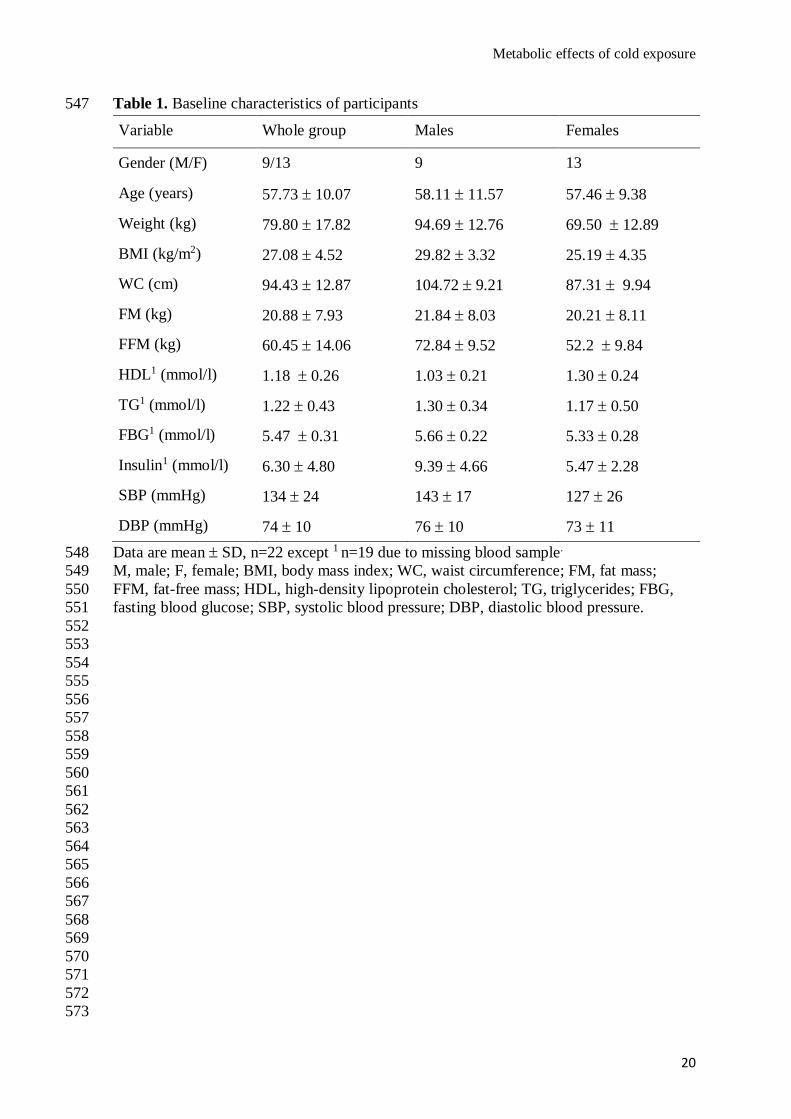
Table 1. Baseline characteristics of participants 547
Data are mean SD, n=22 except 1 n=19 due to missing blood sample. 548
M, male; F, female; BMI, body mass index; WC, waist circumference; FM, fat mass; 549
FFM, fat-free mass; HDL, high-density lipoprotein cholesterol; TG, triglycerides; FBG, 550
fasting blood glucose; SBP, systolic blood pressure; DBP, diastolic blood pressure. 551
552
553
554
555
556
557
558
559
560
561
562
563
564
565
566
567
568
569
570
571
572
573
Variable Whole group Males Females
Gender (M/F) 9/13 9 13
Age (years) 57.73 10.07 58.11 11.57 57.46 9.38
Weight (kg) 79.80 17.82 94.69 12.76 69.50 12.89
BMI (kg/m2) 27.08 4.52 29.82 3.32 25.19 4.35
WC (cm) 94.43 12.87 104.72 9.21 87.31 9.94
FM (kg) 20.88 7.93 21.84 8.03 20.21 8.11
FFM (kg) 60.45 14.06 72.84 9.52 52.2 9.84
HDL1 (mmol/l) 1.18 0.26 1.03 0.21 1.30 0.24
TG1 (mmol/l) 1.22 0.43 1.30 0.34 1.17 0.50
FBG1 (mmol/l) 5.47 0.31 5.66 0.22 5.33 0.28
Insulin1 (mmol/l) 6.30 4.80 9.39 4.66 5.47 2.28
SBP (mmHg) 134 24 143 17 127 26
DBP (mmHg) 74 10 76 10 73 11
Metabolic effects of cold exposure
21
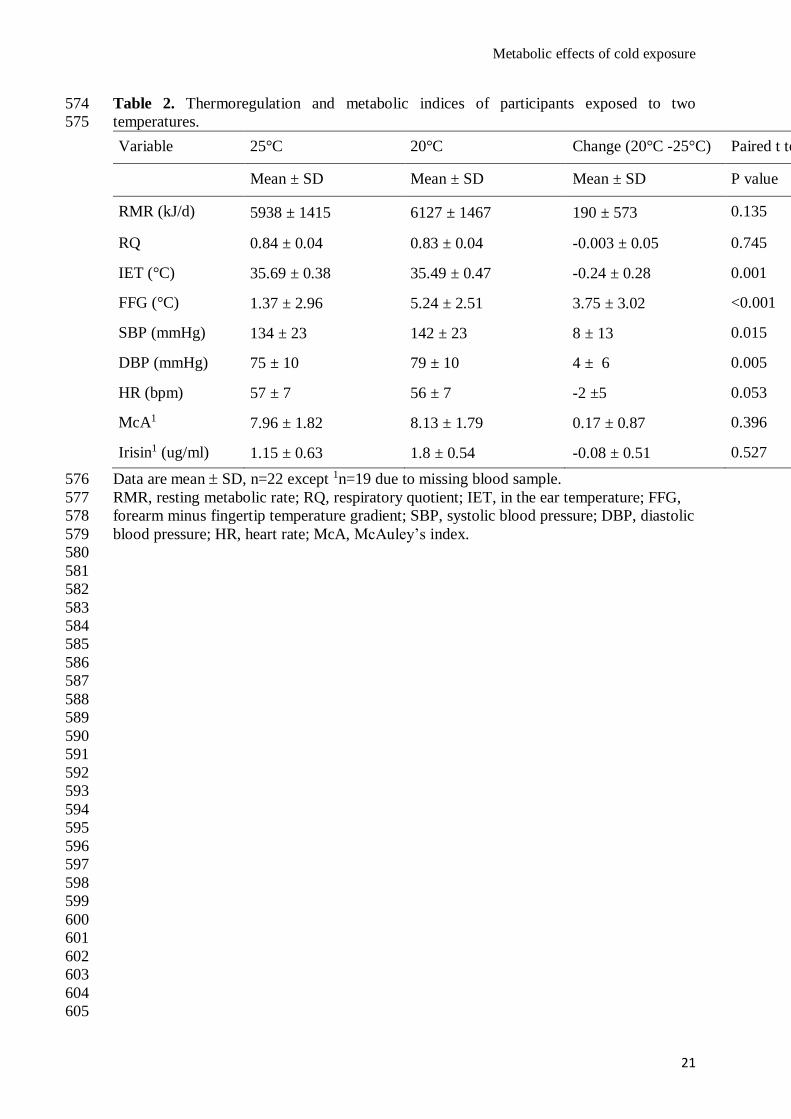
Table 2. Thermoregulation and metabolic indices of participants exposed to two 574
temperatures. 575
Variable 25°C 20°C Change (20°C -25°C) Paired t test
Mean ± SD Mean ± SD Mean ± SD P value
RMR (kJ/d) 5938 ± 1415 6127 ± 1467 190 ± 573 0.135
RQ 0.84 ± 0.04 0.83 ± 0.04 -0.003 ± 0.05 0.745
IET (°C) 35.69 ± 0.38 35.49 ± 0.47 -0.24 ± 0.28 0.001
FFG (°C) 1.37 ± 2.96 5.24 ± 2.51 3.75 ± 3.02 <0.001
SBP (mmHg) 134 ± 23 142 ± 23 8 ± 13 0.015
DBP (mmHg) 75 ± 10 79 ± 10 4 ± 6 0.005
HR (bpm) 57 ± 7 56 ± 7 -2 ±5 0.053
McA1 7.96 ± 1.82 8.13 ± 1.79 0.17 ± 0.87 0.396
Irisin1 (ug/ml) 1.15 ± 0.63 1.8 ± 0.54 -0.08 ± 0.51 0.527
Data are mean SD, n=22 except 1n=19 due to missing blood sample. 576
RMR, resting metabolic rate; RQ, respiratory quotient; IET, in the ear temperature; FFG, 577
forearm minus fingertip temperature gradient; SBP, systolic blood pressure; DBP, diastolic 578
blood pressure; HR, heart rate; McA, McAuley’s index. 579
580
581
582
583
584
585
586
587
588
589
590
591
592
593
594
595
596
597
598
599
600
601
602
603
604
605
Metabolic effects of cold exposure
22
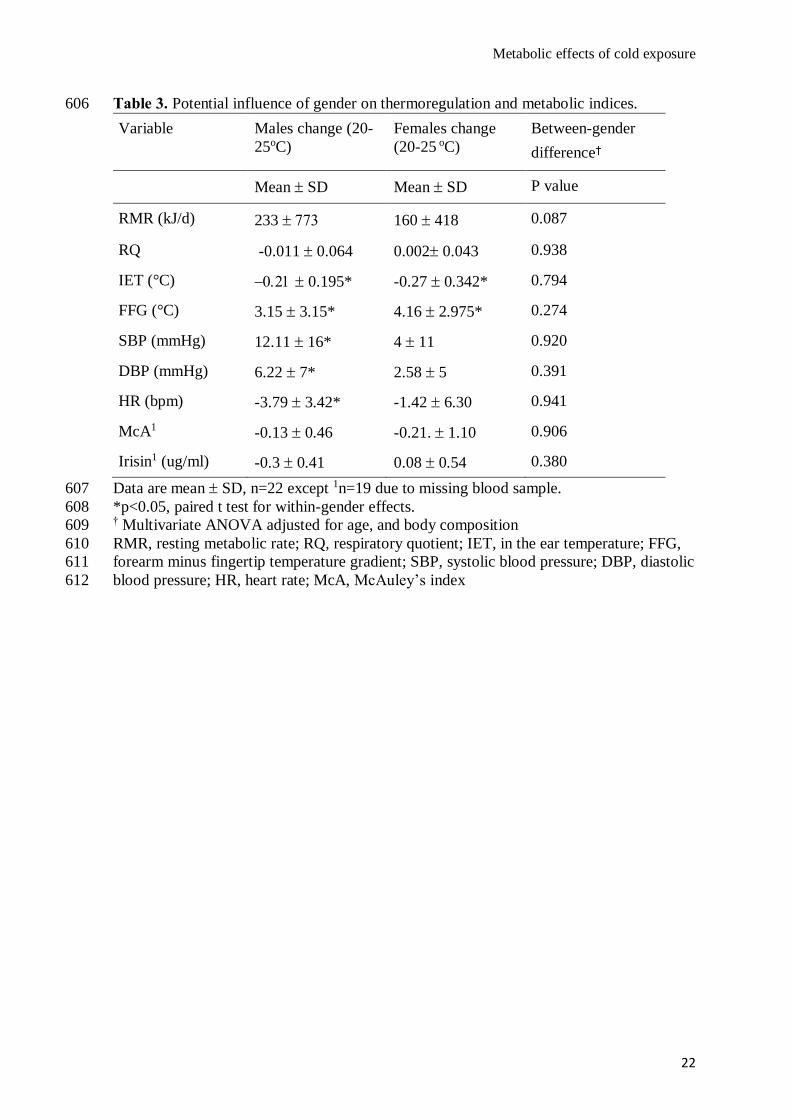
Table 3. Potential influence of gender on thermoregulation and metabolic indices. 606
Data are mean SD, n=22 except 1n=19 due to missing blood sample. 607
*p<0.05, paired t test for within-gender effects. 608 † Multivariate ANOVA adjusted for age, and body composition 609
RMR, resting metabolic rate; RQ, respiratory quotient; IET, in the ear temperature; FFG, 610
forearm minus fingertip temperature gradient; SBP, systolic blood pressure; DBP, diastolic 611
blood pressure; HR, heart rate; McA, McAuley’s index 612
Variable Males change (20-
25oC)
Females change
(20-25 oC)
Between-gender
difference†
Mean SD Mean SD P value
RMR (kJ/d) 233 160 418 0.087
RQ -0.011 0.064 0.0020.043 0.938
IET (°C) 0.195* -0.27 0.342* 0.794
FFG (°C) 3.15 3.15* 4.16 2.975* 0.274
SBP (mmHg) 12.11 16* 4 11 0.920
DBP (mmHg) 6.22 7* 2.58 5 0.391
HR (bpm) -3.79 3.42* -1.42 6.30 0.941
McA1 -0.13 0.46 -0.21. 1.10 0.906
Irisin1 (ug/ml) -0.3 0.41 0.08 0.54 0.380


![GW Adults Modals [2]](https://img.pdfslide.net/doc/110x75/563db8c0550346aa9a9699ce/gw-adults-modals-2.jpg)