Embed Size (px)
Citation preview
2. Infrastructure Growth Map in India
2.1 Assessing Past Growth
2.2 Mapping Infrastructure Growth Need for India
2.3 Major Infrastructure Growth Bottleneck in India
2. Infrastructure Growth Map in India
2.1 Assessing Past Growth
2.2 Mapping Infrastructure Growth Need for India
2.3 Major Infrastructure Growth Bottleneck in India
1© SNP Infra Research

Infrastructure in India 2014: Evaluating Existing and Upcoming Opportunities
IntroductionThe global competition among the various geographies of the world is heating up fast and theeconomies are struggling hard to be at the top of this hot cake of economic growth &infrastructure development. The need and urge for infrastructural development is mountingmore pressure especially on the both the developed & developing economies to be in theleague. The litany of infrastructure challenges confronting nations around the world is wellknown . Advanced economies face the challenge of maintaining & upgrading theirinfrastructural facilities as growth flags where as the developing economies dedicate asignificant percentage of their national income just to meet the basic human needs likeaccess to water & sanitation, meeting the electricity requirements, strengthening the roadsconnectivity etc . China’s infrastructure investment of nearly 20% (2013) as a share of GDPbears a testimony to this. Whereas the country like US invests an amount of 5-6% of its GDPfor infrastructure activities.
The correct approach in delivering and maintaining all the facets of infrastructure areessential to create a strong and competitive economy. On the contrary, a weak infrastructurecan badly impede its growth. Hence it may not be incorrect to mention that if infrastructurepresents unique challenges, it also offers wide opportunities for growth.
In India too, infrastructural development has always been a challenging issue. The challengeis becoming even more daunting as the need for rapid growth of the Indian economy isswelling more pressure on the government in meeting the infrastructural needs of thecountry. As a resultant, the 12th Five Year Plan (FYP) is targeting an investment of 10% Indianinfra as a percentage share of GDP. It is pertinent to note that an investment of close to INR55.7 lakh crore is planned covering all facets of infrastructure in 12th FYP. Out of the totalclose to 48% of the investment is to be induced by the private sector . Hence, a great marketopportunity exits for the private players both of the domestic and international origin in theinfrastructure domain. Along with India, many other developing countries of the world havepulled their socks up and are offering wide opportunities for private players to invest in theirinfrastructure sector. Geographies like China, Brazil, Indonesia etc are all focusing on theirinfrastructure expansion to support their growing economies. Given below in Figure 2.1 is thecurrent status of investment in infrastructure in some of the developed & developingeconomies of the world.
© SNP Infra Research2
The global competition among the various geographies of the world is heating up fast and theeconomies are struggling hard to be at the top of this hot cake of economic growth &infrastructure development. The need and urge for infrastructural development is mountingmore pressure especially on the both the developed & developing economies to be in theleague. The litany of infrastructure challenges confronting nations around the world is wellknown . Advanced economies face the challenge of maintaining & upgrading theirinfrastructural facilities as growth flags where as the developing economies dedicate asignificant percentage of their national income just to meet the basic human needs likeaccess to water & sanitation, meeting the electricity requirements, strengthening the roadsconnectivity etc . China’s infrastructure investment of nearly 20% (2013) as a share of GDPbears a testimony to this. Whereas the country like US invests an amount of 5-6% of its GDPfor infrastructure activities.
The correct approach in delivering and maintaining all the facets of infrastructure areessential to create a strong and competitive economy. On the contrary, a weak infrastructurecan badly impede its growth. Hence it may not be incorrect to mention that if infrastructurepresents unique challenges, it also offers wide opportunities for growth.
In India too, infrastructural development has always been a challenging issue. The challengeis becoming even more daunting as the need for rapid growth of the Indian economy isswelling more pressure on the government in meeting the infrastructural needs of thecountry. As a resultant, the 12th Five Year Plan (FYP) is targeting an investment of 10% Indianinfra as a percentage share of GDP. It is pertinent to note that an investment of close to INR55.7 lakh crore is planned covering all facets of infrastructure in 12th FYP. Out of the totalclose to 48% of the investment is to be induced by the private sector . Hence, a great marketopportunity exits for the private players both of the domestic and international origin in theinfrastructure domain. Along with India, many other developing countries of the world havepulled their socks up and are offering wide opportunities for private players to invest in theirinfrastructure sector. Geographies like China, Brazil, Indonesia etc are all focusing on theirinfrastructure expansion to support their growing economies. Given below in Figure 2.1 is thecurrent status of investment in infrastructure in some of the developed & developingeconomies of the world.
Figure 2.1: Investment in Infrastructure Across the Globe (As a Percentage Share of Global GDP) in 2013
11%
6.7%
7.5 %
Asian region is the world’slargest investor ininfrastructure
Investment below 3%
Investment 5-8%
Investment 3-5%
Investment Above 8%
35-40%
Source: HIS Global Insight, Mc Kinsey,SNP Infra Analysis
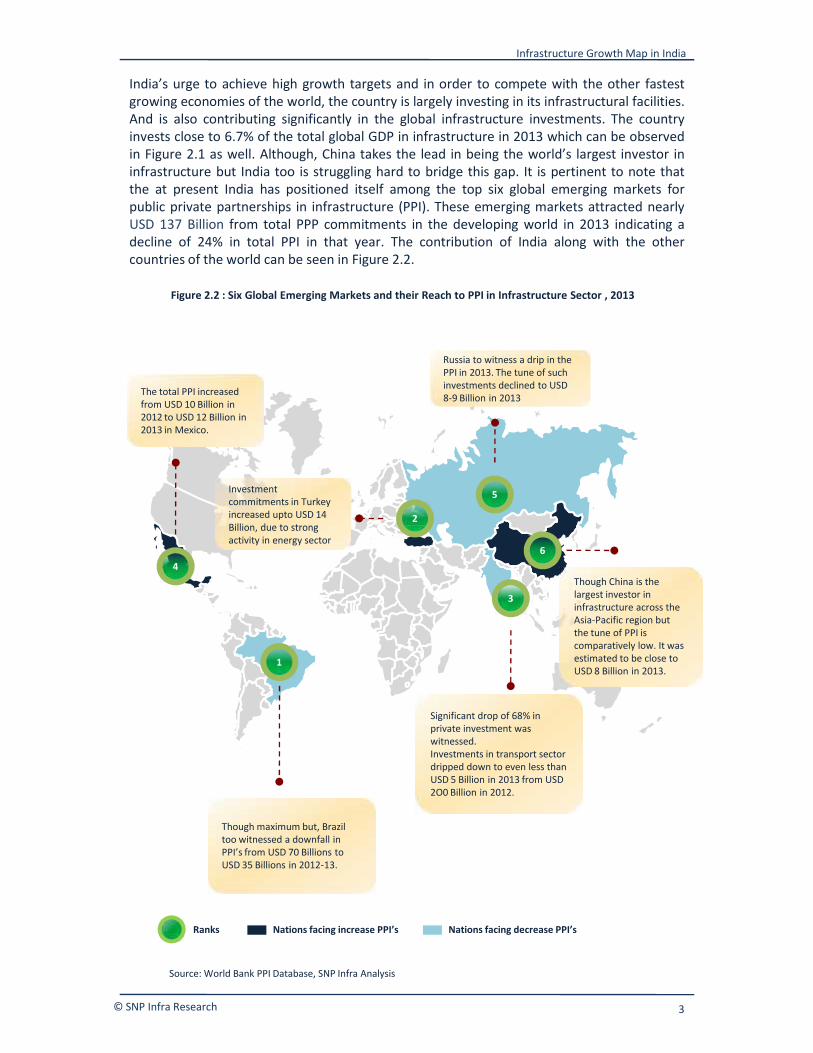
India’s urge to achieve high growth targets and in order to compete with the other fastestgrowing economies of the world, the country is largely investing in its infrastructural facilities.And is also contributing significantly in the global infrastructure investments. The countryinvests close to 6.7% of the total global GDP in infrastructure in 2013 which can be observedin Figure 2.1 as well. Although, China takes the lead in being the world’s largest investor ininfrastructure but India too is struggling hard to bridge this gap. It is pertinent to note thatthe at present India has positioned itself among the top six global emerging markets forpublic private partnerships in infrastructure (PPI). These emerging markets attracted nearlyUSD 137 Billion from total PPP commitments in the developing world in 2013 indicating adecline of 24% in total PPI in that year. The contribution of India along with the othercountries of the world can be seen in Figure 2.2.
Figure 2.2 : Six Global Emerging Markets and their Reach to PPI in Infrastructure Sector , 2013
7.5 %
5
2
Investmentcommitments in Turkeyincreased upto USD 14Billion, due to strongactivity in energy sector
The total PPI increasedfrom USD 10 Billion in2012 to USD 12 Billion in2013 in Mexico.
Russia to witness a drip in thePPI in 2013. The tune of suchinvestments declined to USD8-9 Billion in 2013
Infrastructure Growth Map in India
© SNP Infra Research 3
6.7%
7.5 %
3
64
1
Significant drop of 68% inprivate investment waswitnessed.Investments in transport sectordripped down to even less thanUSD 5 Billion in 2013 from USD2O0 Billion in 2012.
Investmentcommitments in Turkeyincreased upto USD 14Billion, due to strongactivity in energy sector
Though China is thelargest investor ininfrastructure across theAsia-Pacific region butthe tune of PPI iscomparatively low. It wasestimated to be close toUSD 8 Billion in 2013.
Though maximum but, Braziltoo witnessed a downfall inPPI’s from USD 70 Billions toUSD 35 Billions in 2012-13.
Source: World Bank PPI Database, SNP Infra Analysis
Ranks Nations facing increase PPI’s Nations facing decrease PPI’s

2.1 Assessing Past Growth
India’s struggle in competing with the fastest growing economies across the globe is still on asthe country is focusing hard on strengthening its infrastructural set up. The country isinvesting big time in creating , maintaining and upgrading its infrastructure facilities and forthe country to lead the league is no distant dream now. The infrastructure investments in thecountry has witnessed an increase of more than INR 20 lakh crores in past 10 years bears atestimony to the above statement. A further expansion in the tune of investments isprojected for the upcoming years and is expected to increase by close to INR 30 lakh crore by2017. The infrastructure sector in the country has grown tremendously over the years andthe investment into the sector has increased at a CAGR of 28% from 2007-2013. The pasttrends indicates that of the total infrastructure investments in the country, expenditure onboosting the power sector has always remain of utmost importance. In the 12th FYP as wellthe sector shares a huge percentage of 31% in terms of overall investments. Apart frompower, significant tune of investments have been made in strengthening the transportnetwork of the country. It is noteworthy that more than double expenditure has been donein constructing and maintaining the roads & bridges infra of the country in past 6 years andthe investment has reached upto a level of INR 1.6 lakh crores in 2013 from INR 51.8thousand crores in 2007. At the global level too, to efforts made by India in face-lifting thequality of infra is duly recognized. As along with government, many private investors haveshown their keen interest in the sector. The public private participation in Indianinfrastructure at the global platform can be observed from Figure 2.3.
Figure 2.3: Past Trends in Global PPI: Investment Trajectory in India Coupled with Rest FiveEmerging Markets, 2013
Infrastructure in India 2014: Evaluating Existing and Upcoming Opportunities
20102011
20122013
© SNP Infra Research 3
6.7%
0
20
40
USD
Bill
ion
India
0
50
100
USD
Bill
ion
Brazil0
5
10
15
USD
Bill
ion
Mexico
0
10
20
USD
Bill
ion
Russia
0
5
10
USD
Bill
ion
China
0
10
20
USD
Bill
ion
Turkey
Source: World Bank Infrastructure Database, SNP InfraResearch
Year 2012 has proved to a turning stone in theinvestment trajectory of above mentionedgeographies. As observed ,post 2012 the PPIhas either increased significantly or hasdropped down notably.

Figure 2.4: Ratings of the Infrastructure Quality in India at Global Platform: Observing the Past Trends
1
5
3
87
46
76
12
4
6100
Assessment of infrastructure facilities considering the quality of transport, telecomand energy infrastructure on a scale of 1-10.
India’s rank has deterioratedfrom 84 to 87 because ofsevere under penetration inmost of the sectors such as:
24
USA
Russia
Japan
Hong-Kong
Switzerland
Finland
UK
FranceChina
India
Infrastructure Growth Map in India
© SNP Infra Research 5
Source: World, Economic Forum, BCG, SNP Infra Research Analysis
1 2 3 4 6 7 85 9 10
276
India’s rank has deterioratedfrom 84 to 87 because ofsevere under penetration inmost of the sectors such as:
173
848
0
500
1000
Elec
tric
ity
38
16
0
10
20
30
40
Road
Tra
nspo
rt
IndiaChina
Installed Generating Capacity Per Thousand People,2013 Proportion of Unpaved Roads,2013
Scale
SingaporeBrazil
Ranks

Figure 2.5: Infrastructure Investment in India : Plan Wise Statement
0
10
20
30
40
50
60
XthPlan
XIthPlan
XIIthPlan*
Inve
stm
ents
in IN
R La
kh C
rore
s
Total
Private
Public
An upward trend in the Indian Infra investmentshave been witnessed as a percentage share of GDP.During Xth FYP close to 5.2% of the GDP was spendfor infrastructural development which increased to7.5% in XIth FYP . And is further expected to increaseupto 10% by the end of XIIth FYP.
Note: * signifies projected
With increasing need of the growing population, an expansion in all infrastructure facets iscontinuously taking place in India. To further support this growing trend huge expenditureacross the infrastructure segment is required. The government of India has been constantlypouring in large volume of money to fasten the rate of infrastructure activities in the country.A planned increase in the government spending of INR 23 lakh crores from 2007 to 2017bears a testimony to the fact which can be observed from Figure 2.4 as well.
Infrastructure in India 2014: Evaluating Existing and Upcoming Opportunities
© SNP Infra Research6
Source: Planning Commission , SNP Infra Analysis
Note: * signifies projected
Figure 2.6: Past Trends on Infrastructure Spending in India: Covering its Key Facets
0
50
100
150
200
250
300
350
400
Inve
stm
ents
in IN
R Th
ousa
nd C
rore
s Road & Bridges Power Airport
Railways Ports Telecom
2007 2008 2009 2010 2011 2012 2013 2014
In order to meet the soaring power demand of thecountry, maximum percentage of GDP is spend onfulfilling the electricity needs. The investments tostrengthen the power infrastructure in India has grownat a CAGR of 23.17% from 2007-2014. Where as ports &airports still struggle cater much attention and haswitnessed a dwindling growth trajectory.
Source: Planning Commission
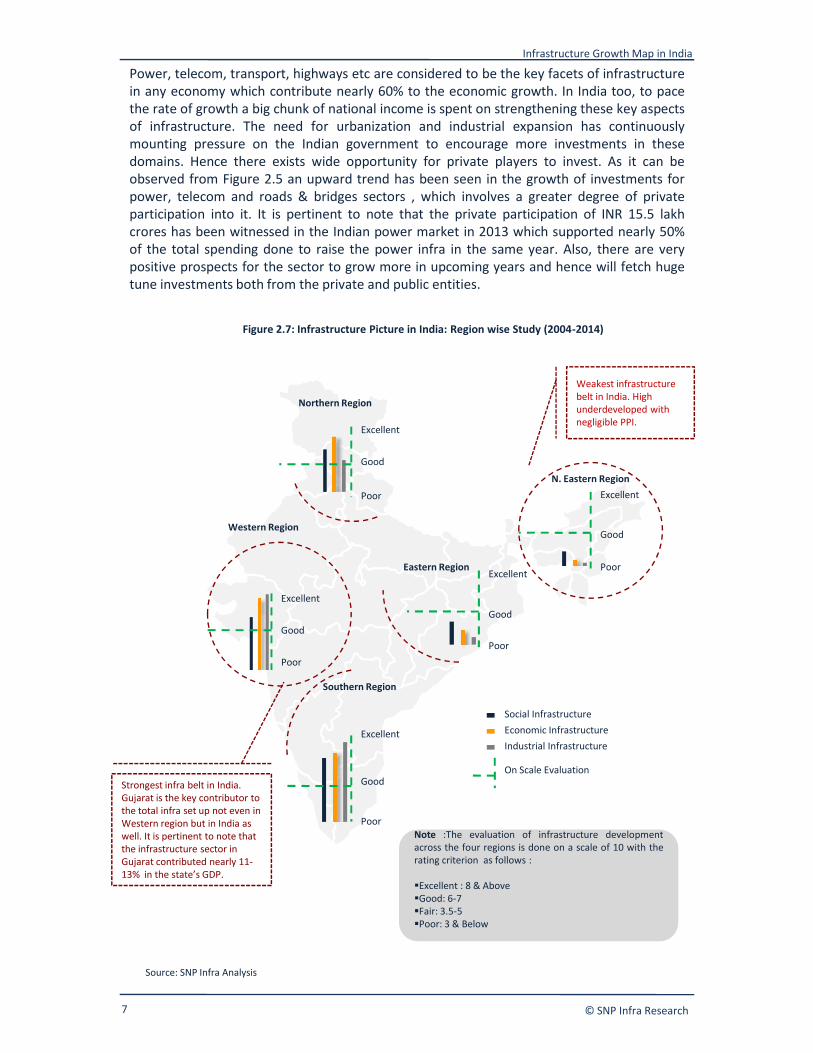
Power, telecom, transport, highways etc are considered to be the key facets of infrastructurein any economy which contribute nearly 60% to the economic growth. In India too, to pacethe rate of growth a big chunk of national income is spent on strengthening these key aspectsof infrastructure. The need for urbanization and industrial expansion has continuouslymounting pressure on the Indian government to encourage more investments in thesedomains. Hence there exists wide opportunity for private players to invest. As it can beobserved from Figure 2.5 an upward trend has been seen in the growth of investments forpower, telecom and roads & bridges sectors , which involves a greater degree of privateparticipation into it. It is pertinent to note that the private participation of INR 15.5 lakhcrores has been witnessed in the Indian power market in 2013 which supported nearly 50%of the total spending done to raise the power infra in the same year. Also, there are verypositive prospects for the sector to grow more in upcoming years and hence will fetch hugetune investments both from the private and public entities.
Figure 2.7: Infrastructure Picture in India: Region wise Study (2004-2014)
Western Region
Weakest infrastructurebelt in India. Highunderdeveloped withnegligible PPI.
ExcellentPoor
Excellent
N. Eastern Region
Good
Good
Northern Region
Infrastructure Growth Map in India
© SNP Infra Research7
Source: SNP Infra Analysis
Western Region
Southern Region
Strongest infra belt in India.Gujarat is the key contributor tothe total infra set up not even inWestern region but in India aswell. It is pertinent to note thatthe infrastructure sector inGujarat contributed nearly 11-13% in the state’s GDP.
Eastern Region
Poor
Excellent
Poor
Excellent
Poor
ExcellentPoor
Good
Good
Good
Good
Note :The evaluation of infrastructure developmentacross the four regions is done on a scale of 10 with therating criterion as follows :
Excellent : 8 & AboveGood: 6-7Fair: 3.5-5Poor: 3 & Below
Social InfrastructureEconomic InfrastructureIndustrial Infrastructure
On Scale Evaluation
Infrastructure in India 2014: Evaluating Existing and Upcoming Opportunities
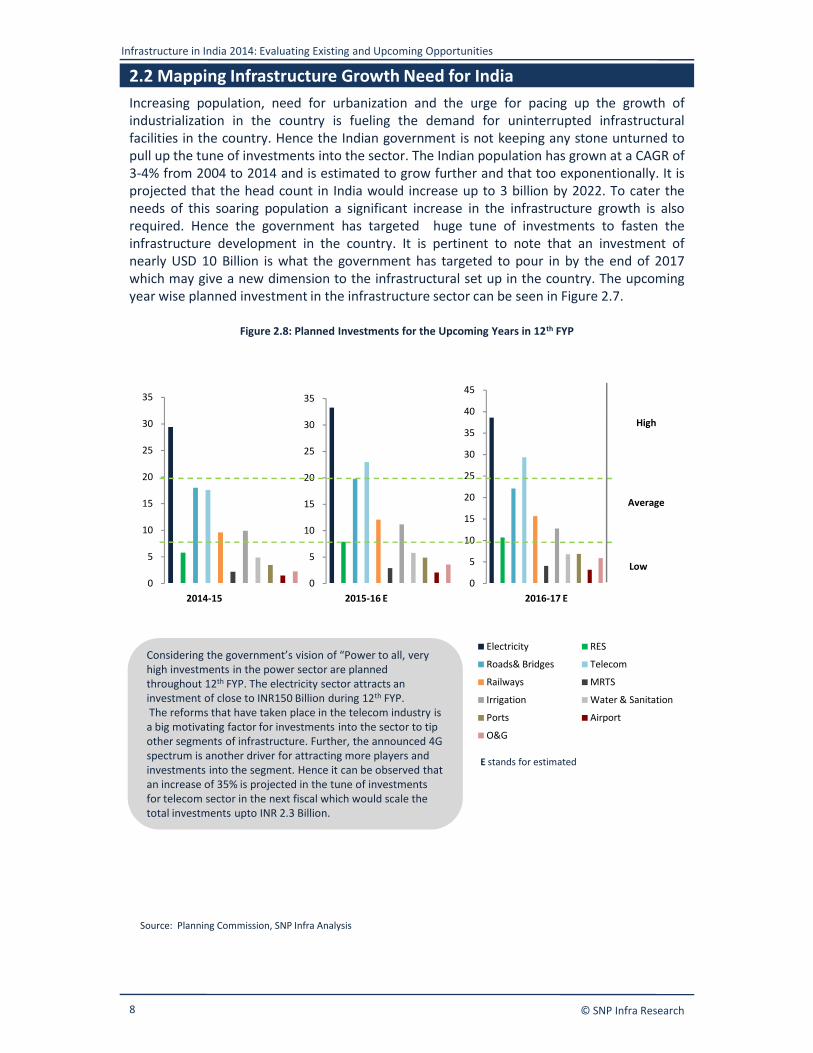
2.2 Mapping Infrastructure Growth Need for IndiaIncreasing population, need for urbanization and the urge for pacing up the growth ofindustrialization in the country is fueling the demand for uninterrupted infrastructuralfacilities in the country. Hence the Indian government is not keeping any stone unturned topull up the tune of investments into the sector. The Indian population has grown at a CAGR of3-4% from 2004 to 2014 and is estimated to grow further and that too exponentionally. It isprojected that the head count in India would increase up to 3 billion by 2022. To cater theneeds of this soaring population a significant increase in the infrastructure growth is alsorequired. Hence the government has targeted huge tune of investments to fasten theinfrastructure development in the country. It is pertinent to note that an investment ofnearly USD 10 Billion is what the government has targeted to pour in by the end of 2017which may give a new dimension to the infrastructural set up in the country. The upcomingyear wise planned investment in the infrastructure sector can be seen in Figure 2.7.
Figure 2.8: Planned Investments for the Upcoming Years in 12th FYP
10
15
20
25
30
35
10
15
20
25
30
35
15
20
25
30
35
40
45
Average
High
© SNP Infra Research8
Source: Planning Commission, SNP Infra Analysis
0
5
10
0
5
10
0
5
10
Electricity RES
Roads& Bridges Telecom
Railways MRTS
Irrigation Water & Sanitation
Ports Airport
O&G
Low
2014-15 2015-16 E 2016-17 E
Considering the government’s vision of “Power to all, veryhigh investments in the power sector are plannedthroughout 12th FYP. The electricity sector attracts aninvestment of close to INR150 Billion during 12th FYP.The reforms that have taken place in the telecom industry isa big motivating factor for investments into the sector to tipother segments of infrastructure. Further, the announced 4Gspectrum is another driver for attracting more players andinvestments into the segment. Hence it can be observed thatan increase of 35% is projected in the tune of investmentsfor telecom sector in the next fiscal which would scale thetotal investments upto INR 2.3 Billion.
E stands for estimated
Infrastructure Growth Map in India
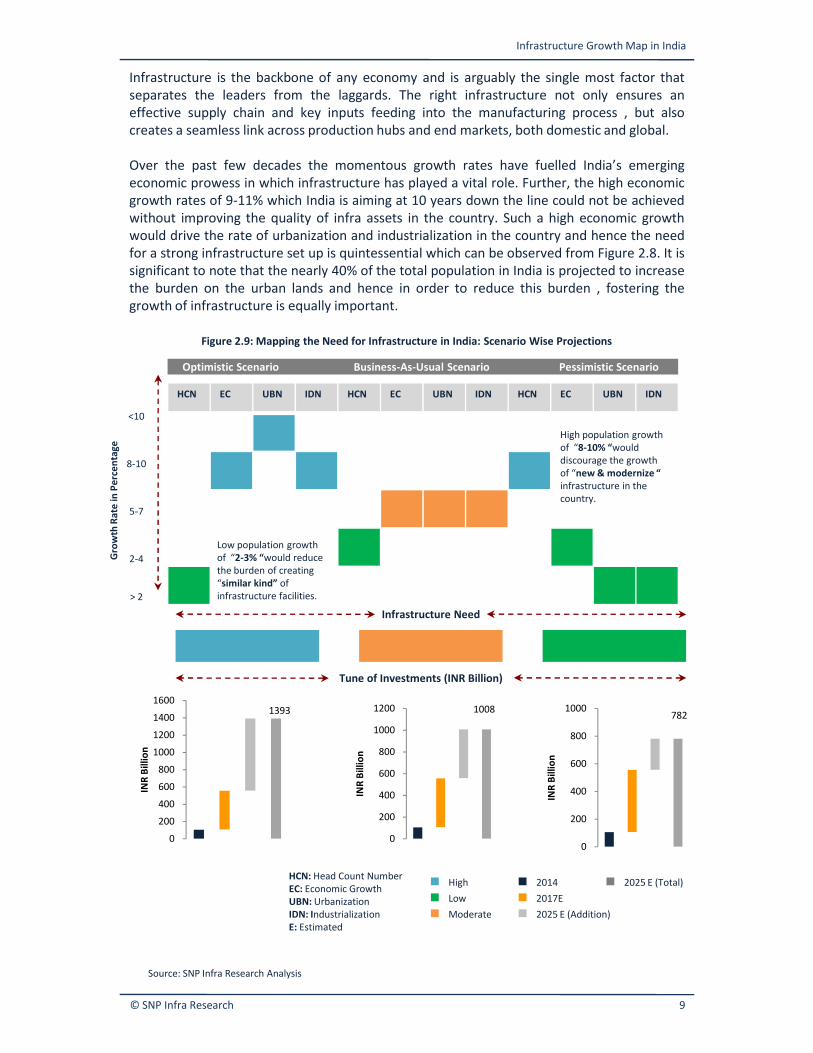
Infrastructure is the backbone of any economy and is arguably the single most factor thatseparates the leaders from the laggards. The right infrastructure not only ensures aneffective supply chain and key inputs feeding into the manufacturing process , but alsocreates a seamless link across production hubs and end markets, both domestic and global.
Over the past few decades the momentous growth rates have fuelled India’s emergingeconomic prowess in which infrastructure has played a vital role. Further, the high economicgrowth rates of 9-11% which India is aiming at 10 years down the line could not be achievedwithout improving the quality of infra assets in the country. Such a high economic growthwould drive the rate of urbanization and industrialization in the country and hence the needfor a strong infrastructure set up is quintessential which can be observed from Figure 2.8. It issignificant to note that the nearly 40% of the total population in India is projected to increasethe burden on the urban lands and hence in order to reduce this burden , fostering thegrowth of infrastructure is equally important.
HCN EC UBN IDN HCN EC UBN IDN HCN EC UBN IDN
Figure 2.9: Mapping the Need for Infrastructure in India: Scenario Wise Projections
Optimistic Scenario Business-As-Usual Scenario Pessimistic Scenario
5-7
8-10
<10
Gro
wth
Rat
e in
Per
cent
age
High population growthof “8-10% “woulddiscourage the growthof “new & modernize “infrastructure in thecountry.
© SNP Infra Research 9
> 2
2-4Gro
wth
Rat
e in
Per
cent
age
1393
0
200
400
600
800
1000
1200
1400
1600
INR
Billi
on
1008
0
200
400
600
800
1000
1200
INR
Billi
on
782
0
200
400
600
800
1000
INR
Billi
on
Infrastructure Need
Tune of Investments (INR Billion)
HCN: Head Count NumberEC: Economic GrowthUBN: UrbanizationIDN: IndustrializationE: Estimated
HighLowModerate
20142017E2025 E (Addition)
2025 E (Total)
Source: SNP Infra Research Analysis
Low population growthof “2-3% “would reducethe burden of creating“similar kind” ofinfrastructure facilities.
Undoubtedly, increasing population growth pumps the requirement for more infrastructurefacilities but also impedes the quality of infrastructure assets. It is so because, with swellingpopulation , need for similar infra assets would also increase and hence more expenditurewould be done on creating such assets and less emphasis would be given on creating newand developed infrastructure facilities. Hence , increasing head count number could hamperthe growth of infrastructure in India which can be observed from Figure 2.8 as well. Thefigure describes the scenario wise projections for infrastructure requirements in India.
Optimistic Scenario: This scenario is considered to be a case when there exits “ Higheconomic growth, high urbanization along with paced industrialization”. The “ Make inIndia” vision of the Indian government , if becomes reality would upbeat the economicgrowth of the country in a bracket of 9-11% in upcoming years. Such a high growth woulddrive the rate of urbanization and would scale up the level of industrial expansion in thecountry providing a wide market space to the players to invest. Hence, such a manufacturingled transformation would pump the infrastructure development in the country. Thus, wouldincrease the tune of infrastructure investments 2.5 times more than the current spendings bythe end of 2025.
Pessimistic Scenario: This scenario is considered to be a case when there exits “ Loweconomic growth with low urbanization & weak industrial expansion”. Undoubtedly, Indiais having high aspiration in out casting itself to be among the global leaders. Butunfortunately, the country presently lags behind in providing even the basic infra facilities toits inhabitants. Further, with a continuous increase in the population the situation isbecoming more challenging. If such a trend follows in future as well, it may badly hit theeconomic growth of the country. Under such a situation , the growth prowess of India maycome down to 2-4%, impeding the growth of urbanization and industrial set up in thecountry. Hence, a decline in the infrastructure activities would be witnessed in suchsituations as it may disinterest the players to invest into the sector. Thus, a decline of close to50% could be witnessed in 2025 from the current spendings.
Business- As-Usual Scenario: This scenario is considered to a case when “ Same economicgrowth, with similar rate of urbanization and industrialization” exits. There are possibilitiesfor India to grow at the current rate of 5-6% in 2025 as well due to the same course ofregulatory and policy mechanism followed by the Indian government. This may not fuel therate of industrial expansion to a higher level but would also not deviate the country from thecurrent growth of industrialization. Hence, in such situation the requirement forinfrastructure development could considered to be moderate in 2025.
Infrastructure in India 2014: Evaluating Existing and Upcoming Opportunities
© SNP Infra Research10
Undoubtedly, increasing population growth pumps the requirement for more infrastructurefacilities but also impedes the quality of infrastructure assets. It is so because, with swellingpopulation , need for similar infra assets would also increase and hence more expenditurewould be done on creating such assets and less emphasis would be given on creating newand developed infrastructure facilities. Hence , increasing head count number could hamperthe growth of infrastructure in India which can be observed from Figure 2.8 as well. Thefigure describes the scenario wise projections for infrastructure requirements in India.
Optimistic Scenario: This scenario is considered to be a case when there exits “ Higheconomic growth, high urbanization along with paced industrialization”. The “ Make inIndia” vision of the Indian government , if becomes reality would upbeat the economicgrowth of the country in a bracket of 9-11% in upcoming years. Such a high growth woulddrive the rate of urbanization and would scale up the level of industrial expansion in thecountry providing a wide market space to the players to invest. Hence, such a manufacturingled transformation would pump the infrastructure development in the country. Thus, wouldincrease the tune of infrastructure investments 2.5 times more than the current spendings bythe end of 2025.
Pessimistic Scenario: This scenario is considered to be a case when there exits “ Loweconomic growth with low urbanization & weak industrial expansion”. Undoubtedly, Indiais having high aspiration in out casting itself to be among the global leaders. Butunfortunately, the country presently lags behind in providing even the basic infra facilities toits inhabitants. Further, with a continuous increase in the population the situation isbecoming more challenging. If such a trend follows in future as well, it may badly hit theeconomic growth of the country. Under such a situation , the growth prowess of India maycome down to 2-4%, impeding the growth of urbanization and industrial set up in thecountry. Hence, a decline in the infrastructure activities would be witnessed in suchsituations as it may disinterest the players to invest into the sector. Thus, a decline of close to50% could be witnessed in 2025 from the current spendings.
Business- As-Usual Scenario: This scenario is considered to a case when “ Same economicgrowth, with similar rate of urbanization and industrialization” exits. There are possibilitiesfor India to grow at the current rate of 5-6% in 2025 as well due to the same course ofregulatory and policy mechanism followed by the Indian government. This may not fuel therate of industrial expansion to a higher level but would also not deviate the country from thecurrent growth of industrialization. Hence, in such situation the requirement forinfrastructure development could considered to be moderate in 2025.
1
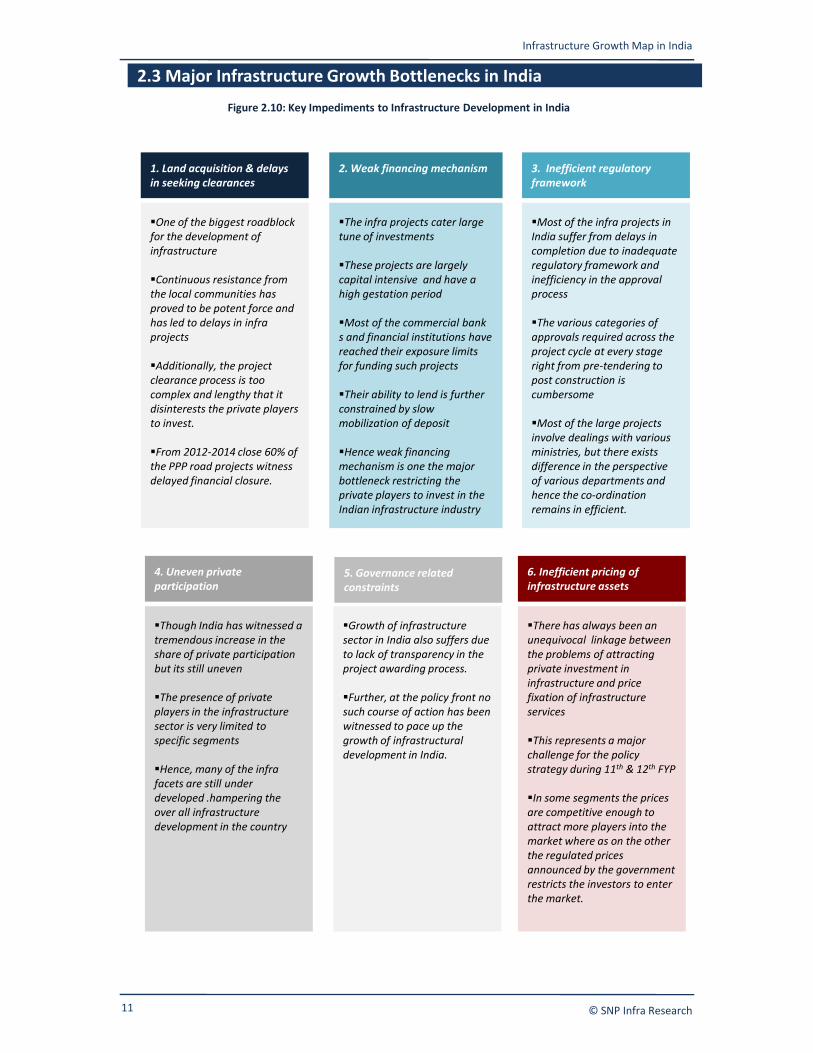
1. Land acquisition & delaysin seeking clearances
One of the biggest roadblockfor the development ofinfrastructure
Continuous resistance fromthe local communities hasproved to be potent force andhas led to delays in infraprojects
Additionally, the projectclearance process is toocomplex and lengthy that itdisinterests the private playersto invest.
From 2012-2014 close 60% ofthe PPP road projects witnessdelayed financial closure.
2. Weak financing mechanism
The infra projects cater largetune of investments
These projects are largelycapital intensive and have ahigh gestation period
Most of the commercial banks and financial institutions havereached their exposure limitsfor funding such projects
Their ability to lend is furtherconstrained by slowmobilization of deposit
Hence weak financingmechanism is one the majorbottleneck restricting theprivate players to invest in theIndian infrastructure industry
2
3. Inefficient regulatoryframework
3
Most of the infra projects inIndia suffer from delays incompletion due to inadequateregulatory framework andinefficiency in the approvalprocess
The various categories ofapprovals required across theproject cycle at every stageright from pre-tendering topost construction iscumbersome
Most of the large projectsinvolve dealings with variousministries, but there existsdifference in the perspectiveof various departments andhence the co-ordinationremains in efficient.
2.3 Major Infrastructure Growth Bottlenecks in IndiaFigure 2.10: Key Impediments to Infrastructure Development in India
Infrastructure Growth Map in India
© SNP Infra Research11
The infra projects cater largetune of investments
These projects are largelycapital intensive and have ahigh gestation period
Most of the commercial banks and financial institutions havereached their exposure limitsfor funding such projects
Their ability to lend is furtherconstrained by slowmobilization of deposit
Hence weak financingmechanism is one the majorbottleneck restricting theprivate players to invest in theIndian infrastructure industry
4
4. Uneven privateparticipation
Though India has witnessed atremendous increase in theshare of private participationbut its still uneven
The presence of privateplayers in the infrastructuresector is very limited tospecific segments
Hence, many of the infrafacets are still underdeveloped .hampering theover all infrastructuredevelopment in the country
Growth of infrastructuresector in India also suffers dueto lack of transparency in theproject awarding process.
Further, at the policy front nosuch course of action has beenwitnessed to pace up thegrowth of infrastructuraldevelopment in India.
6. Inefficient pricing ofinfrastructure assets
6
There has always been anunequivocal linkage betweenthe problems of attractingprivate investment ininfrastructure and pricefixation of infrastructureservices
This represents a majorchallenge for the policystrategy during 11th & 12th FYP
In some segments the pricesare competitive enough toattract more players into themarket where as on the otherthe regulated pricesannounced by the governmentrestricts the investors to enterthe market.
5. Governance relatedconstraints