Embed Size (px)
Citation preview

2 METHODOLOGICAL AND INSTRUMENTAL INVESTIGATIONS

21 SEISMIC
The m ost im portan t area of seismic reflexion methodological research in 1970 was unalterably the N y í r s é g area. The geological task was the exploration of eventual sedim entary formations under the volcanic complex and of their structure. The survey was carried out w ith stacking (CDP-method), w ith analog recording. The 1970 results point to the possibility to improve inform ation-gathering even in the analog way. Especially m uch can be expected, however, from digital techniques. The in te rpretation results of waveform- and pressure investigations m ade in previous years will be published in our ,,Geophysical Transactions66.
Reflexion m easurem ents made on the m argin of the T r a n s d a n u b i a n
C e n t r a l R a n g e can also be regarded partly as methodological research. Our aim has been here to obtain inform ations from under the Mesozoic basin-floor. The prim ary scope has been the separation of Cretaceous and Triassic formations, since their boundary is the m ain horizon of bauxite deposition. Its determ ination meets difficulties, if also the Cretaceous consists of limestones. The results obtained are discussed in connection w ith the geophysical exploration of the T ransdanubian Central Range.
The s e i s m i c c r u s t a l i n v e s t i g a t i o n s had, in 1970, a character of m ethodological-instrum ental research. The m easurem ents themselves were carried out w ith the digital field eqipm ent type SU-24, constructed for the Hungarian Academy of Sciences, and w ith a frequency-m odulation equipm ent SM -24-f6 of special sensitivity. W ith these m easurem ents, the question was approached, whether it was possible to follow the excellent quality reflexion obtained a t Hajdúszoboszló also w ith magnetic tape recording. In the first experiments, both shotpoint and spreads were located near Hajdúszoboszló. Also this tim e the reflexion p a tte rn known from earlier recording was obtained. In the course of further recordings,
1 5 7

shotpoint and spreads were arranged in such a way th a t the reflexions he recorded always from the same depth point (aht. from under K aba village). Similarly to earlier experiments, the Moho-reflexion was found on the records in traces only. For the sake of orientation, some records m ade w ith the SU-24 equipm ent were processed on the com puter MINSK-2. The com puter succeeded in enhancing the Moho-reflexion from the background of disturbing waves (Fig. 32). Three characteristic seismograms were selected from the survey m aterial according to the field playback. On record A , the reflexion from the M oho-discontinuity can be traced in full length, on record C, however, it is visible only on the half of the channels, on record E it cannot be picked a t all. The two-dimensional filtering was applied w ith the following param eters:
velocity passed w ith an attenuation of 3 d B :vmm = 8500 m/s,
3 dB points of the frequency characteristics:fm in -{-1 4 c / s
fm a x - |-2 2 c/s.
The filter-generator was of 9 x 4 1 points (on 9 channels in 41 time- instants).
On th e filtered records B, D, JF, the reflexions equivocally emerge from the noise level of the waves present on records A , С, E and can easily be picked.
Our in tention is to carry out detailed processing of th e data on the com puter MINSK-32 of th e In stitu te .
The methodological field exploration carried out in the Nyirség area, fu rther the corresponding instrum ent development will be discussed in detail.
211 SEISMIC REFLEXION METHODOLOGICAL EXPLORATION IN THENYÍRSÉG AREA
The seismic deep structural exploration in N E-H ungary (Nyirség area) in 1970, contracted by the N ational Oil and Gas T rust (NOGT), had a double aim. P artly the reconnaissance reflexion survey of this geological un it continued, partly th e seismic preparation of param eter-drilling, indispensable in the interests of geological-geophysical data-gathering,
1 5 8

began. In 1970, only reflexion m easurem ents were made, as mentioned before, exclusively w ith stacking in common depth-point systems. The seismic extended from the Kállosem jén-N yirbátor, Nagyecsed line to th e border. W ith these recent m easurem ents, the existing base network has been broadened by profiles of a to ta l length of 140 km (Fig. 33.).
The m ain location aspects of the profiles were as follows: connecting th e structural indications of Nyirlugos, resp. Aporliget (see Profile 8/b in the Annual Report for 1969);closing up the network on W along the refraction profile BoR-14;tying th e structural indication a t Nyirlugos to the borehole Nyirm árton-falva-1,the exploration of a zone relatively free of magnetic anomalies in general for the preparation of the drilling, 3 ex tra profiles were m easured, to th e E of Nagyecsed.
The methodological preparation of the measurem ents was m ade according to the experiences gathered in 1969: everything had to be done in the interest of a b e tte r signal-to-noise ratio and a deeper penetration. The num ber of GF-9R seismometers (made in Poland) was raised to 30 for each channel. Areal groups were formed from 3 parallel seismometer- c h a in s 66, each chain containing 10 seismometers. The seismometer in terval was 5 m, the distance between two chains 3 m.
Fig. 34 shows a disturbing wave pattern , characteristic for the survey area. The apparent wave-length lies between 16 and 42 m. The disturbing waves were well a ttenuated by the 30-seismometer groups.
Beyond all these, im portance was given to the investigation of the geom etrical characteristics of stacking spreads. From the results obtained w ith the expanding spread system of D i x a n d M u s g r a v e it can be stated th a t it is not advisable to plan the offset distance between shotpoint and the nearest seismometer of the spread solely according to literary data and to choose a too long spread in this way. I t is well visible in Fig. 35 th a t th e energy and correlation possibility of the seismic signal deteriorates beyond a distance of 1.2 km. An offset distance w ithin 0-1.2 km shows the greatest advantage. This observation agrees w ith the results of analyses m ade concerning the efficiency of common depth point system s in other countries. L iterary data emphasize the advantage of short spread system s: „A lthough long spreads are economical, it appears th a t the optim um length has already been exceeded. Shorter spreads of ap propriate design can produce b e tte r results in all respects w ith appreciably lowered possibilities for inaccuracies. The only disadvantage of the shorte r spreads is somewhat higher co s ts /6 (The common-reflexion-point m ethod, Oil and Gas Journal 30. 9. 1968 p. 85-86.).
1 5 9

In 1970, recording was m ade in two different systems. On areas w ith unfavourable energy conditions, the offset distance did not exceed half a spread (15 m), while on deeper parts w ith good energy conditions it was 345 m long (half spread). The distance between channels was 30 m (within a spread of 690 m) everywhere, except the region of Nagyecsed, where it was increased to 40 m.
The shot systems were, w ith a m inim um of exceptions, unidirectional; the coverage was 6x100% everywhere, except the No-3/70 profile w ith 12x100% .
As generally known, the Nyírség survey area is poor in energy. For generating it 50 kg of P axit-IY explosive was used in each 18-21 m deep boreholes. On account of very strict security-technical regulations, m any difficulties arose in the field-work; therefore we tried to experim ent also w ith other energy-generating procedures. In itial experiments were carried out w ith a special explosive, promising good results from literary examples, the exploding fuse (Geoflex). An exploding fuse fabricated in H ungary (N IPE N T E X ) was used. Its detonation velocity is over 6000 m/sec, its explosive-content is 11 g/m, fabrication length 100 m. W ith the aid of an agricultural plough we ploughed it 45 cm deep into the ground. A rrangem ents w ith various param eters were formed from the ploughed-in individual threads. On account of eventual acoustic wave effect, the distance between the shot and the nearest seismometer was chosen for 700 m. The resulting records are shown in Fig. 36. According to the results of the experim ent, one has every hope for being able to use the Geoflex procedure as an effective energy-source in the Nyírség area.
The reflexion m aterial recorded on megnetic tape was referred, by a static correction com puted w ith indicatrix-type procedures, to a level of -{-100 m. a.s.l. Our experience in connection w ith the static correction has been th a t the goodness of correction is strongly dependent also on the shotpoint-distance of the channels. I t is much more difficult to apply a good correction to the reflexion signals of d istant channels, th an to those of channels nearer the shotpoint. This phenomenon arises on account of the noise-sensitivity of the channels w ith lower energy.
The dynamical correction has been com puted from velocity surveys and T0— A T data. Average-velocity com putations in the Dix-system yielded results com paratively near each other.
Velocities have been com puted not only basing on special shooting system s, b u t also com putations from the channels of common depth-point stacking systems begán. Velocity com putations on this principle are of high im portance, since they can be carried out by com puter directly on r o u t i n e r e c o r d s w ith suitable programming, along one profile, w ith the required density. Fig. 37. shows the velocity spectrum cum putation results
1 6 0
of six channels belonging to a common depth point, in a VRMSj—T0 coordinate system w ith tim e-gates of 60 msec a t every 30 milliseconds. By connecting the points of m axim um energy, found by the program itself, the course of the time-weighted square m ean velocity function (VRMS) according to T0 is obtained.
On the right side of the diagram , the tem poral variations of the relative channel-energy are presented. The example shown originates from the neighbourhood of the point 8500 of the reflexion profile No-10/70. Even the deeper horizons display a good energy, contrary to the p art of the area screened by magnetic anomalies.
An extended application of the m ethod will furnish valuable data for our methodological research.
The reflexion records have been m ostly processed on the analog center CS-621 of the NOGT; some of the m aterial,— on the so-called “ m inicenter” SDC-1 of the Institu te .
Some time-sections from the more interesting types of areas are shown in a few figures.
Fig. 38 shows a six-fold stacking section along profile No-15/70, traversing the nearly N-S directed magnetic anomaly a t Nagyecsed. On both ends of the section, the presence of instrusions disturbing the even course of layers is clearly visible. A characteristic p a tte rn w ithin the range of the m agnetic anomaly is shown by the double elevation with a quiet course of sedim entary beds between them , Over the m agnetic anomalies, even the s tructural froms of the loose sediments are somewhat bent.
A similar p a rt is shown also on Fig. 39, representing the Kállósemjén section of the sixfold stacking profile No-5/70, recorded with a short offset system. Until 1,1 second, arrivals from horizons w ith an excellent signal-to-noise ratio have been recorded. Under these, diffraction events referring to a fractured character occur.
The 3 x 1 0 0 % variety of the stacking-section No-10/70, running parallel to the frontier, originates from one of the most interesting parts of the survey area. A horizon starts a t abt. 1,2 sec, then it deepens first gradually, later steeply and reaches a depth of 2 sec around the point 700 of the profile (Fig. 40). This profile furnishes a good picture of the young sedim ent-deposition of considerable thickness of the area. This m ay be in teresting from the point of view of prospecting for hydrocarbons. Its importance is raised by the fact th a t the screening effects, detectable by magnetic and complex electric survey and characterizing a great part of the Nyírség area, disappears in this part.
1 6 1

212 DEVELOPMENT OF A SEISMIC DIGITAL FIELD EQUIPMENT
In connection w ith the development of the seismic digital field equipm ent, several contracts (in H ungary and w ith partners abroad) have been made, related to phases of different requirem ents of the research.
As for th e H ungarian contract (with the Hungarian Academy of Sciences), th e m ain purpose was a rapid construction of an experim ental equipm ent w ith a com paratively broad dynamical range and com puter processing possibility (SU-24), in order to utilize its favourable param eters m ainly in crustal investigations and in prospecting as soon as possible.
In the finishing phase of the equipm ent SU-24, several units have been rebuilt, resp. improved for the sake of operational safety.
The pre-amplifiers have a symm etrical toroidal-transform er inpu t of 1400 ohm, w ith a high-pass filter of a limiting frequency of 15 cps and of a slope of 24 dB/о, w ith a notch-filter of pole-frequencies of 49.4 and 50.6 and an a ttenuation of 40 dB, further w ith an antialiasing filter of an a tten u ation of 40 dB.
The noise calculated for the inpu t of the amplifiers is, w ith filters off,0.2 ^Veff. Their m axim um voltage gain is 30 dB. Maximum operable signal level: 21 m Veff.
The dynam ic range of the binary amplifiers is 42 dB. Instead of the m edium level A/D converter, a zero-level converter has been applied and th e dynam ic range increased to 72 dB (11 bits + sign). The overall dynamic range of the equipm ent is consequently 114 dB (1 : 500,000), its accuracy 72 dB (1 : 400). The m axim um gain is 91 dB (1 : 30,000), thus the own noise of the amplifiers is sensed already by the A/D converter. In our first experim ental digital equipm ent no higher binary gain was endeavoured, since it would be utilizable only when the aim were an operation of m ultiple (50-100-fold) stack. For large charges used in crustal surveys, no such aim has been set; such a requirem ent does no t seem in place, in lack of suitable energy-source, even for other surveys w ith the digital field equipm ent.
O ther reconstructions were made in the digital magnetic tape unit, in the control un it, in the playback and testing unit, fu rther in the supply in order to increase th e stability and to exploit earlier experiences.
W ith th e equipm ent SU-24, system atic crustal investigations for a m onth around Hajdúszoboszló, further m ultiple stacking experiments similarly for a m onth in th e Nyírség area were carried out.
1 6 2
213 SETTING THE GEOLOGICAL COMPUTER CENTER INTO OPERATION AND DEVELOPING PROCESSING UNITS
In 1970, the basic units of th e com puter MINSK-32 were purchased and their setting into operation began. For map- and diagram -drawing p u rposes, anincrem ental p lo tter Type 6011 of Computer Instrum entationca L td . was bought and a seismic section p lo tter built. Under the consideration of m ultiprogram m ing possibilities, a tape-puncher. Type Facit 4070 and 2 high-reliability m agnetic-tape storage units Ampex TM-7 were acquired, and the m atching of peripheries started.
During 1970, the m inicenter was operated first in the continuous- profiling operation mode adjusted in 1969, w ith good section quality. L ater in th e year, also the im proved varian t of the new seismic, digital- controlled section plotter, containing also the necessary control, was ready and operated in routine.
Today m ultiple stacking sections are m ade only in digital way. For this purpose, the records of the frequency-m odulation equipm ent SM -24+6 are transcribed into record w ith SDT-1 type recording. The transcrip tor un it operates in the following m odes:
analog-digital conversion, digital-digital conversion,mixing and playback for the m inicenter SDC-1 control of th e above-mentioned operation modes.Also the control unit for plotting m ultiple-stack reflexion cross-sections
has been built and tested on 300% and 600% stack profiles. The technical system of the un it is good; as to full reliability, especially to its sensitivity to external noise, further im provem ent is necessary.
214 DEVELOPMENT OF ENGINEERING-SEISMIC EQUIPMENTS
The optical system for UV-recording w ith th e Pioneer-3 equipm ent has been built, in cooperation w ith th e MOM, w ith a 75 ¥ Xenon bulb as a light-source. The la tte r has the advantage against the m ercury-vapour lam p, th a t it does not require pre-heating (and, on this account, a higher capacity current source).
The experiences gathered in this work have been utilized in the construction of the UV recorder of the digital field equipm ent. The recorder is driven by the synchro-m otor of the Pioneer-1 type equipm ent, bu t the
163

500 cps generator unit can be synchronized with the digital m agnetic tape equipm ent.
Plans for a shallow seismic field equipm ent with stacking system have been prepared w ith the aim of being able to carry out seismic surveys also in such places, where the single seismic signal does not emerge from the level of ground unrest.
215 SEISMIC THEORETICAL RESEARCH
Experim ental seismic da ta processing began with the com puter MINSK-32, using the first p a rt of the six-fold stacking m aterial from the profile No-69/8a measured in the Nyirség area. The main steps of processing are:
1. inpu t of frequency-m odulated records through an A/D converter, w ith control printing
2. static and dynam ic corrections,3. common depth-point channel-selection (TG),4. stacking,5. autom atic im provem ent of static corrections,6. digital frequency filtering,7. two-dimensional (velocity-) filtering.Also the program for true am plitude recovery (TAR) has been prepared
in several varieties.This firs t variety , giving inform ations also about seismic energy con
ditions, separates and individually investigates the factors causing energy changes: the course of the program, resp. of the BGC, spherical dispersion and absorption losses.
The second variety of the TAR is a digital modelling of the AGC functions.
The th ird variety compensates the decrease in average energy by sections, w ith linearly varying gain.
For theoretical work, a program system of the autom atic processing of pressure-wave records, and a program for modelling of wave-propagation in inhomogeneous media were prepared. In the analysis of pressure-wave records, the mechanism of ghosting, the laws of signal-shape propagation and the effects of charge weight were studied.
1 6 4

W ith the wave-propagation modelling programs, propagation of u ltra sonic waves in porous model media, generated with the Monte Carlo m ethod, were studied, in order to examine the validity of porosity-velocity relations of W y l l i e , so im portan t in acoustic in terpretation.
Besides these, controlling punched tapes, in terpretation nomograms and dominant-frequency finding programs were prepared for the correction unit of the minicenter.
1 6 5

22 GEOELECTRIC
221 GEOELECTRIC METHODOLOGICAL FIELD RESEARCH (NYÍRSÉG AREA)
The program of geoelectric deep-structural exploration of the ELG I for 1970 was determ ined, in the first place, by methodological problems arisen earlier in th e Nyírség area. DE-soundings indicated in the sedimenta ry complex a high-resistivity horizon, the depth of which correspondsto th a t of the upper seismic refraction boundary w ith a velocity of 4200-----4,300 m/s (Fig. 41). The geological identification of this boundary is not simple: it m ay be a compact lavatic member of the Miocene volcanic complex, or the Miocene-flysch boundary itself. The first MT soundings in 1968 indicated, however, th a t a good conducting complex and another high-resistivity horizon exist under this high-resistivity „screening” layer. A low-resistivity complex between two high-resistivity horizons m ay be im portant for oil-prospecting. I t can be assumed, namely, th a t the Miocene volcanic rocks are not everywhere directly overlying the basin floor, b u t the la tte r is covered by clastic sedim entary reservoir rock series of v a ry ing thickness. Our methodological research continued therefore w ith the aim of gathering as m any inform ations about this low-resistivity complex as possible.
Our first in terpretation ten tatives for th e determ ination of the th ick ness of th e screening layer were m ade by assuming homogeneous, isotropic layers lim ited by horizontal planes.
As known, the screening of a high-resistivity layer imbedded in a conducting medium is determ ined not only by the thickness of the layer and the period of the electromagnetic wave, b u t also by the angle of incidence of the wave and by the dip angle and polarization of the layer. Consequently a th in bu t inclined high-resistivity layer m ay exert a screening effect in a com paratively broad frequency band. In such a case, dip-directed currents yield inform ation about the complex down to the screening layer, while strike-directed currents reveal the to ta l effect of the conducting complex.
W ithout going into details of the m ethods used, it can be stated th a t we
1 6 6

succeeded, in certain areas, in determ ining the value of longitudinal conductivity (S) down to the top of the screening layer (S1mt), resp. to the basin-floor (S2me) Fig. 41). By the way, the S1mt values agree w ith the S1mt values obtained from dipole-sounding. A control has been needed, however, also for the S9 values.
Since th e BEM F-method (build-up of the electromagnetic field) can ,,transillum inate“ not too th ick screening layers, we introduced the BEMF- measurem ents in the Nyirség area in 1969 already, b u t we had to overcome numerous methodological and instrum ental problems which were mostly solved in 1970. This has been supported also by the experiences gained over the horst a t Biharnagybajom , well disclosed by drilling and geophysical exploration. Here, the S values obtained w ith BEM F agreed w ithin error limits w ith the m agnetotelluric S2mt values.
Most of our 1970 survey points were placed along the seismic refraction profile NoR-1/69. The com paratively high A S values on the southern and middle p art of the profile refer to a thickening of the lower good conducting complex. Between these two sections, however, only the Sa value was furnished by all m easurem ents. This can be interpreted so th a t no conducting layer of considerable thickness exists here between the screening layer and the basin-floor. Since this section coincides w ith a magnetic A T m axim um , the im mediate surroundings of an effusion center seems to be in question. On the northern p art of the profile, the A S values lie within the error limits, being therefore no t interpretable.
222 COMPUTER PROCESSING OF GEOELECTRIC DATA
Our aims in com puter processing of geoelectric survey data were laid down in the Annual Report for 1969. Since our capacity in this regard is m oderate, we w ant to solve, as a first phase, data-processing for two m ethods, m ost im portan t a t present: resistivity measurements and m agnetotelluric frequency-sounding.
In resistivity m easurem ents, com putation of theoretical curves of vertical electric sounding (VES) has become routine-work already, meeting always the requirem ents of the field survey. Programs for curves, resp, families of curves for any num ber of layers are available, autom atic p lo tting and reproduction of these are also solved.
The procedure m ost favourable for field parties is briefly described as follows:
In a given area, first a few orientating soundings are made, in the knowledge of the geological pattern . W ith these, the geoelectric models valid
1 6 7

for the area determ ined and a few corresponding characteristic curves concerning the geoelectric models are checked for correctness, then the list of families of curves to be com puted handed over to the com puter center.
A basic condition of such solution is, of course, to considerably lower com puter and plo tter costs, and to assure sending the families of curves to the field party within a few days after the dem and was presented.
A t present, families of curves are drawn by a Bryens-plotter controlled by a com puter MINSK-2. These curves have an accuracy of + 0 .3 mm only, satisfying, however, field requirem ents. P lotting w ith an accuracy of ± 0 .1 mm with Graphom at, fu rther reproduction w ith X erox or by printing is m ade only in case of frequently occuring families of curves.
One of the greatest problems of the in terpretation of YES-curves is the equivalence of curves, i. e. th a t several different geoelectric sections m ay correspond to the same sounding curve. In this field, research work, s ta rted in the previous year, has continued, the equivalence-investigation of all H -type curves, besides Hco , has been solved and an in terpretation procedure developed satisfying also practical requirem ents. N aturally this does not m ean an autom atic elimination of ambiguities due to the equivalence, b u t the possibility to decide, for a measured curve, w hat limits and w hat values m ay be taken by the param eters of the layers (thickness, resistivity).
For each basic type, the equivalent curves can be system atized in such a family of curves, where the resistivity of the th ird layer is given (i. e — is known, the remaining param eters: m 1? m 2 and varying).
Fig. 42 represents family of equivalent curves of the type H 2. Equivalence nom ogram (Fig. 43) belonging to this family of curves gives the possible thickness ratio A2 = ̂ for any curve, m arked w ith a num ber on the curve, as a function of the resistivity ratio [ i2 = ̂ . The dotted line on the nomogram indicates the upper lim it of the equivalence-range. The lower lim it is (л2 0.
I f the curve measured in the field belongs to this basic type and is equivalent, it m ust coincide w ith one of the curves of the equivalence curve- family (resp. it can be in terpolated between two curves). The field curve shown on the figure corresponds to the theoretical curve No. 6. W ith the aid of curve 6 of the equivalence-nomogram, [л2max and V2? further 1̂ 2 belonging to a given 2 can be determ ined (Fig. 42). On the lower p art of the figure the value of correction factor b can be read off and the correct value of nq com puted w ith its aid.
W ith the equivalence family of curves H 2 presented and w ith the nomogram, the evaluation of the curve for the upper and lower lim it of the
1 6 8
equivalence-range and for a given value g 2 can be performed (in about 2 min).
The above-discussed families of curves and nomograms have been computed, up to now, for the basic types H°o, H 5, H 2, H, H x H 0,5 H0,25 fu r ther tentatively for the type K0,25.
As to the com puter processing of m agnetotelluric frequency-sounding data, we w ant to apply this to digital field records. In 1970, as a preliminary study, analog records were processed. Out of these, digitized sections were m ade w ith a converter type KAD-69, then the frequency desired was enhanced w ith m athem atical filtering. Finally the impedance was determ ined w ith the m ethod of least squares. Fig. 44 shows an original and two filtered records. I t is observable th a t even this simple procedure permits to interprete such sections th a t are of no use on the original record.
223 DEVELOPMENT OF AUTOMATICALLY COMPUTING AC INSTRUMENTS
W ith the further development of autom atically computing AC instru ments, we wanted to solve two problems.
W ith the instrum ent type GE-50, it has been possible to a tta in , a t a value of £a = 10 ohmm, an electrode-distance ABmax = 800 m.
Az ABmax = 800 m, the considerable error occurring so far (and depending on oa) was caused by m utual inductivity between measuring and supply- electrode lines, similar, as for wave-form distortion, to the skin-effect. In a first approxim ation, this error voltage is a function of the AB-MN distances only; consequently the error considerably increased a t an a rrangem ent AMNB (£max = 10 ohmm), bu t remained within the limit of error ( A q = ±3 %) at a higher pa-value (around 50 ohmm) even at AB = 640 m.
W ith shifting the MN-lines by 50 m perpendicularly to the original line, this induction effect practically ceased to exist, and the experiences of several field measurem ents resulted in the conclusion th a t the spread distance can be increased to AB = 800 even at £a = 10 ohmm (Fig. 45).
In the equipment GE-60 the input impedance in the highest sensitivity stage has been increased from the previous 10 kohm to 100 kohm.
By increasing the selectivity of the instrum ent, also the spread system could be simplified. I t became possible, namely, to shorten the 50 m cable- offset used w ith the GE-50, to 25 m at a 100m MN distance and to 8 m at an 8 m MN distance (Fig. 46).
1 6 9

W ith the solution of these two problems, a very im portant experience has been gained for further developm ent: the selective circuitry of the AC instrum ent m ust provide a minimum suppression of 60 dB not only on the industrial frequency, b u t even on the th ird harmonic of th e square- wave supply current.
170
23 W ELL-LOGGING
231 M E T H O D O L O G IC A L R E S E A R C H IN W E L L -L O G G IN G
I n v e s t i g a t i o n o f a p u l s e - s y s t e m b o r e h o l e n e u t r o n - g e n e r a t o r o n a l a b o r a t o r y
m o d e l
The Soviet-made borehole neutron generator IGN-4 has been adapted to th e Hungarian well-logging equipm ents. Digital recording and data processing has been provided by a recording and control system developed in th e Institu te . A utom atic norm alization of measured data and the adjustm ent of the optim um width of tim e gates was realized by presetting the neutron-num ber. Previous to application in boreholes, stability and sensitivity indices have been determ ined under laboratory conditions for concentration variations of aqueous solutions of various chemicals.
In case of series consisting of a great num ber of recordings, stability is characterized by the scattering of observed values. The upper limit for m easurem ents w ith the same duration, ± 11 ^see. Presetting the system to neutron pulses, the upper lim it of scattering, using pairs of tim e gates, descended to ± 5 ^sec. Optim um results are obtained when the five tim e gates a t disposal cover nearly the entire decay period of the neutrons. Here, the maxim um empirically determ ined scattering is ± 1 /xsec.
Em pirical data from investigations w ith various salt-solutions deviated, on account of the lim ited size of the model used, from the calculated (resp. literary) values, b u t the character of variations agreed w ith them (Fig. 47), making an estim ate of expectable results possible. The neutron life-time of oil and salt-free w ater measured as 115 ,usec/80.4% of the calculated, resp. literary value.
This is regarded as basic level and the form ation waters w ith NaCl and boron content m ust be separated from this. The limit of characteristic separation of practical measurements, fixing it as a threefold of the upper value of the experim entally observed scattering, is assumed as the 0.5% NaCl content w ith a value of 109 ^sec. According to our experim ental measurements, a borax content of 0 .018+ decreases the value of neutron life-time in a measure equal to a decrease caused by a 2 + solution. The separation of salt-w ater and oil is made more distinct by the boron conten t of form ation waters in Hungary.
171

V o l u m e - w e i g h t d e t e r m i n a t i o n w i t h g a m m a - g a m m a m e t h o d
In 1970, the accuracy of the calibration techniques of two-detector gamma-gamma logging has been further increased.
For this purpose, the prototype of the radiom etric equipm ent KRG-2-120 -60 was developed. I t is equally suitable for model and field m easurements. The experim ental m easurem ents began in 1969; the equipm ent has been transform ed in 1970 and made suitable for weight determ inations under model and field conditions.
In the etalons different weights, built up at the model site, the optim um size of short and long sondes, the intensity and type of radiation source have been established, allowing the determ ination of the bulk-weight w ith the required accuracy (0.05 g/cm3). During the m easurem ents, the sonde was pressed against the wall, and the radiation source shielded by lead towards the mud. From the final results of the experimental measurements, following measuring param eters are given here
1. sonde-lengths2. distance of lead shield
between source and detector distance between source and m ud
3. radiation source
ar + 20 cm and ah-)-50 cm
5 cm
4 cm7.28 mC Cs137
From the calibration results obtained with short and long sondes, after dead-time correction, the calibration curve of the equipm ent has been constructed (Fig. 48). The straight line on the figure is the calibration diagram of the radiom etric equipment, Type KRG-2-120-60, determined by the different volume weight values.
As to its character, the calibration diagram agrees w ith similar diagrams of the Schlumberger-type compensated systems. The gam m a-gam ma system elaborated by us permits to determine the volume-weight of rocks (at present for mud-cakes of small thickness: t mc^ 1-1.5 cm).
W ith the radiom etric equipm ent, calibrated for volume weight, several boreholes were logged. As an example, the gamma-gamma logs obtained in the borehole KF-9 at Gyöngyösvisonta (Fig. 49) and the corresponding volume-weight values calculated for a few beds are presented (Table I) For the sandy formations interbedded in the lignite-layers, porosity v a lues have also been calculated; for the tim e being no com parative data are available.
1 7 2

V o l u m e - w e i g h t v a l u e s c a l c u l a t e d f r o m t w o - d e t e c t o r g a m m a - g a m m a
l o g s o f th e b o r e h o l e N o . K F — 9 at G y ö n g y ö s v i s o n t a
Table I.
Investigations for the determ ination of H-porosity were made on the H- model of the In stitu te w ith the neutron-sonde KRN-2-150-85 and w ith the scintillation probe SSD 1526-B.
The porosity was investigated w ithin the range 5.2-40% . The probe- length varied by 5 cms in an in terval of 35-90 cm. The relation between pulse ra te and porosity was established. On the basis of the obtained results, considering also th e m athem atical derivations known from lite rature, optim um probe-lengths were chosen and optim um measuring conditions, valid for the given model-conditions were determ ined. A calibration diagram w ith a num ber of points, characteristic for the probe, has been drawn (Fig. 50), where the ratio of H-porosity and pulse ra te related to w ater has been plo tted for a model diam eter of 159 mm. Theoretical calibration curves have been calculated for the same diam eter (plus a characteristic oil well diam eter, 216 mm). According to these, the slope of the measured curves is, for any of the proble-lengths, higher th an th a t of the calculated ones. The reason lies in the difference of the initial conditions of calculation and modelling. I t is out intention to find a closer relation between calculated and measured curves in th e next year.
The com puter program for th e calculations permits to extend the calibration curves obtained to all borehole diam eters occuring in practice.
The procedure includes m ethods for both single and double probe- lengths, and the family of curves involving hole-diameter effects can be used in bo th cases.
The factors influencing the m easurem ent in the course of corrections were taken into consideration by means of families of deviation curves.
1 7 3
Digital interpretation of well-logs
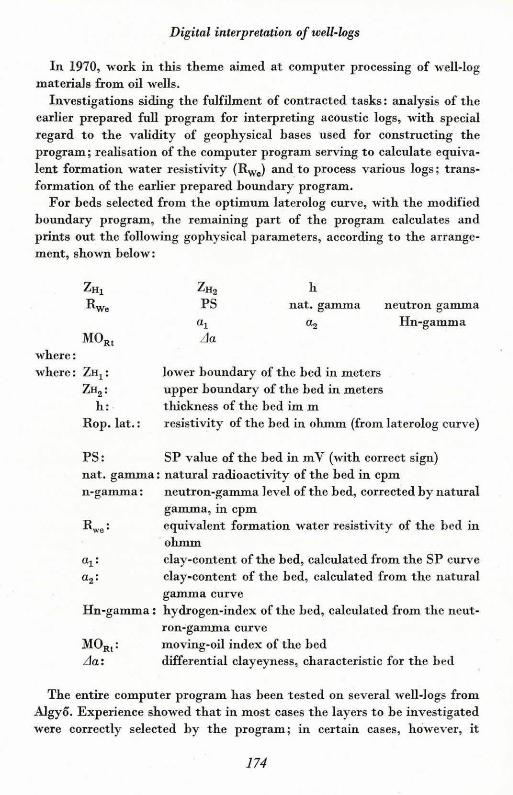
In 1970, work in this them e aimed a t com puter processing of well-log materiaJs from oil wells.
Investigations siding the fulfilm ent of contracted tasks: analysis of the earlier prepared full program for interpreting acoustic logs, w ith special regard to th e validity of geophysical bases used for constructing the program ; realisation of the com puter program serving to calculate equivalent form ation w ater resistivity (RWe) and to process various logs; tran sform ation of the earlier prepared boundary program .
For beds selected from the optim um laterolog curve, w ith the modified boundary program , the remaining p art of the program calculates and prints out th e following gophysical param eters, according to the arrangem ent, shown below:
The entire com puter program has been tested on several well-logs from Algyo. Experience showed th a t in m ost cases the layers to be investigated were correctly selected by th e program ; in certain cases, however, it
174

appointed the lower boundary incorrectly (its cause will be cleared up after a great num ber of logs will have been processed by computers. Geophysical param eters com puted for individual layers have been checked by m anual com putation.
Well-logging methodological field experiments
The selective gam ma-gamma m ethod has already been used for years to indicate ore-bearing layers. The unam biguous indication of ore-bearing sections was lim ited by rock density. Our task was to minimize the density effects. Our related methodological experiments partly aimed a t m odifying th e proble-length. The new sonde-arrangem ent perm its also to achieve very short sonde-lengths (4-10 cm source-detector distances). On the other hand, type and in tensity of the radiation source and the quality of the tool case have been investigated.
Fig. 51 shows a selective gam ma-gamma log recorded w ith two different sonde-lengths in siliceous andesite breccia. As constated, the log recoderd w ith the greater (25 cm) sonde-length is strongly affected by rock density variations, while the one recorded w ith the smaller length (10 cm) is less influenced, giving also a be tte r resolution.
By choosing a source-detector distance of 8 cm, the density effect becomes still weaker and the resolution still b e tte r (Fig. 52). I t can be seen th a t th e selective gam m a-gam ma log is not sensitive to rock density variations, while the density log recorded w ith Co60 indicates rock density variations.
The m ethod in its present form is also suitable for indicating the to ta l m etal content. The selective gam ma-gamma log and the d ata obtained from core analysis show a good agreement (see corresponding figures). Certain deviations m ay be caused partly by an insufficient core recovery or by the lack of inform ation about the accurate position of the core, partly by the presence of caverns affecting the logging itself.
Geological results of logging im ply the indication of ore-bearing sections and the separation of im productive rocks within them ; the elimination of uncertainties in sections w ith insufficient core recovery.
The selective gam ma-gamma m ethod has also been employed for determining ore-bearing sections in a hole drilled w ith the purpose of prospecting for manganese (Fig. 53). As it can be seen on the figure, the section containing manganese-ore can be reliably appointed on the selective gamma-gamma log only.
175
232 N U C L E A R W E L L -L O G G IN G
In 1970, the solution of problems of the national oil industry stood in the foreground. As our m ain task the development of high-tem perature logging tools has been regarded. The tool of type KRG-2-250-70 contains two gam ma-photon-sensitive detector groups, i.e. it belongs to the two param eter gamma-tools. I ts m axim um operation tem perature is 250° C (with this tool, radiom etric logging was made in the deep drilling a t Makó). Two similar tools (of a diam eter of 86 mm), with corresponding surface units type KRF-2-12B-220, have been built for the H ungarian oil industry.
In cooperation w ith our oil-industrial partners, efforts have been m ade in order to raise the tem perature limit to 270° C (occasionally to 300° C), and the sonde-head, packing and case for the tool type KRG-2-300-86 have been built. The electronic parts of the tool have been tested under laboratory conditions.
For the N ational Oil and Gas Trust, a small-diameter (43 mm), high- tem perature (180° C) logging tool (type KRNG-2-200-43) has been built, which is suitable for detecting oil-, water- and gas-bearing layers behind m ultiple iron and concrete casing in producing oil wells.
In order to m aintain a good layer-resolution w ith this sm all-diam eter tool, a proportional tube filled w ith Texlium 9339 type H e3 gas up to 10 atm and 20 Geiger-Miiller tubes type SzBM-14 in four successive packets have been built in the former as a neutron detector and the la tte r as a device for transferring gamma-rays. W ith these detectors, a com paratively high ray-sensitivity has been obtained even w ith small dimensions.
The electronic parts of the tool are all transistorized. They are m ounted in a steel case of high pressure-resistance, fitted w ith О-rings. The case can be coupled to a 5000 m long single core sheathed steel cable.
In the past year, two such equipments were built and laboratory- tested. Field tests will follow in the next year.
A part from these, a logging tool of the type KRN-2-150-86 and a surface un it of the type KRF-2-12 have been built for the Well-logging Methodological D epartm ent of the ELGI. Both the sonde and the surface unit are all transistorized. As a neutron-detector, a proportional tube of the type BF3 has been used. The full electronic design of the experim enta l sonde has been published in the Annual Report for 1968. Fig. 54 shows a log recorded w ith this tool.
O ther units b u ilt: a linear ratem eter type LR-63-50, a universal supply un it type TPS-4-50 and a complete downhole electronic system type KRG-2-250-70.
176

*
As to the scintillation radiom etric equipments, the program for the past year included the introduction of nuclear tools with scintillation detector system of types SSD-1015 (single-channel, 60 mm diameter, 100° C tem perature-resistance) and SDD-1526 (two-channel, 85 mm diameter, 150° C tem perature-resistance).
We changed the electronic design and constructional techniques in order to ensure the stability of the tool in routine work, too. The energy-resolution of energy-selective tools has been increased by a more up-to-date and better quality phot о-electron-multiplier and crystal. W ithin the So- v iet-H ungarian cooperation, the borehole-tool SYGS has been built. In this work we utilized our experiences concerning the application of the Soviet-made metal-case Dewar bottles. In this way we succeeded in raising the m axim um operation tem perature of scintillation tools to 200° C.
233 ELECTRONIC WELL-LOGGING
The experim ental development of the resistivity-logging spectrum-frequency basic circuits of the m edium -depth (3000 m) well-logging equipm ent has begun, with 4 + 1 channel (two-frequency-channel) measuring circuits and two square wave current generators. These units provide m atched connections to the digital m agnetic-tape recording system. Its analog photorecorder contains 9 galvanometers. Basing on the circuitry solutions developed for the spectrum-frequency well-logging system, about 50% of the laboratory models of the experim ental circuits are finished already.
A null-series of three spectrum-frequency m oderate-depth well-logging trucks was delivered for our Czechoslovakian partner. Against earlier equipments of the same type, it contains a digital voltage output, an inclinometer surface unit and an induced potential surface unit, too. According to the wishes of the Czechoslovakian partner, the equipments have been provided w ith special complex resistivity-logging and directed- field borehole tools.
The SSP-SPP and capacitance m ethods have been studied and laboratory investigations were made for the specification of the instrum ent. Steps have been taken for patenting it in Swedish, French and Canadian relations.
177
L aboratory m easurements, tem perature-characteristics investigations and field m easurem ents were made in order the develop the induction calibration system, resp. to test the individual borehole-tool types and surface units. The tem perature-resistant type of the calibrating switch was longperiod-tested in laboratory up to 240° C. The investigation of the outer system, resp. characteristics of our induction tools was carried out in co-operation w ith the metholological group. I t has been constated th a t the six-coil system is properly compensated up to a m ud resistivity of 0.2 ohm. The Soviet-made tem perature-resistant constructions, calibration and modelling m aterials were studied. Under consideration of these and of our own experim ental results, plans for the production technology have been prepared and circuitry experiments carried out in order to be able to develop a great-depth type of the induction tools for 210° C and 1000 atm in 1971. Two six-coil borehole-tools have been designed; their main coil systems have been constructed, according to the need of the oil industry, w ith 40 cm and 1 m intervals, providing inform ation w ith different penetrations. The case of the tool is finished, the stability and sensitivity tests in laboratory have been carried out. The zero stability is better th an 20 mS.
Experim ental field measurements were made with the induction system designed for the oil industry. On the la tte r’s request, the surface un it has been constructed in the system of the deep electronic logging equipm ent, w ith a 4500 m long cable and w ith a coil-system of a main-coil distance of 1 m for the sake of greater penetration required. The calibrating switch system has three positions: for two calibrating voltages and one operation switching. Its sensitivity is about 20 mV/100 mS. Three successful loggings were made anyway in logging depths smaller th an 2000 m.
Also the tests with the induction surface unit of the m oderate-depth logging equipm ent were finished. This equipm ent will be presented, in co-operation with N IK E X , in the GDR. Its six-coil system is properly compensated up to a m ud resistivity of 0.2. The coil system is built on a solid plastic body, the downhole electronic units specified for 150° C and 600 atm . Main coil distance: 40 cm; sensitivity: 20 mV/100mS; the zero stability b etter th an 1 mV. Its calibrating switch system contains two electric calibrating m arks (0.5 and 5 ohm) and an operation position.
For ore-logging purposes, a small-diameter (60 mm) four-coil induction borehole-tool has been designed. Its construction is a task for 1971.
The experim ental field borehole electronic unit for 210° C is finished in 50%. Its resin cover, with its basic m aterial of glass-fibre-reinforced eporosite, obtains a heat-treatm ent on 240° C. Its design-, mo delhiig-and log-material is included in the detailed report of the In stitu te ( A r c h i v e s ) .
234 IN D U C T IO N C O N D U C T IV IT Y LO G G ING
178

235 D IG IT A L W E L L -L O G G IN G D E V E L O P M E N T
At present, a common feature of the various digital logging procedures and equipm ents, known in well-logging practice, is, th a t all of them are suitable for processing very slow signals only and they sample the individual inform ation channels in the function of depth or tim e in such a way th a t each sampling furnishes a single numerical data. The equipments used a t present are suitable for recording only one-variable functions by channels, not satisfying the fu ture technical and economical requirements, not even exploiting the possibilities a t disposal.
Beyond the digital recording of continuous one-variable (e.g. resistivity) functions, the complex digital well-logging equipm ent perm its a simultaneous digital recording, on several channels, of rapidly varying functions or function-pairs with two or more variables (e.g. acoustic wave- pattern , decaying signal form of induced polarization measurements, proton-precession m easurements), fu rther of m ultivariable functions, resp. function-pairs comprising statistical elem entary events (e.g. energy-selective measurem ent of natu ra l and gamma spectra, created by elastic scattering of neutrons or radiation capture, measurem ent of neutron-lifespan, etc.). D ata arriving from the individual inform ation channels are processed in a tim e-m ultiplex system, with a m ulti-program m ed solution arranged in a priority sequence.
At present the equipm ent is being constructed, in co-operation with the National Oil and Gas Trust, w ith six priority levels and eight different programs. The individual programs can be operated also in suitable combinations, w ith such a restriction for the tim e being, th a t each sampling m ay result in a data block consisting of a maxim um of 256 words. The concept of sampling has been generalized in the equipm ent so th a t each sampling represents the to ta l of all the inform ations required from a single depth-point (interval). The depth value, i.e. the address-like inform ation, is contained in two words by every block; apart from this, e.g. it m ay contain the data obtained from six one-variable continuous function and a single energy-selective spectrum (eventually gated in time, too) from two gamma-detectors.
The construction of the equipm ent permits connection to the borehole- tools, surface units and adapters used in present logging practice, not excluding the borehole-converter solution either. The equipm ent is built up according to the m ost up-to-date design and constructional principles, mostly of integrated circuits.
F urther details of the equipm ent and the possible application fields have been discussed in a separate paper (Magyar Geofizika, X II. 1., 1971).
179

In 1970, the technical plans of the system and circuitry of the experim ental equipm ent were completed. The construction work advanced to about 70% of the laboratory phase.
The main outlines of the specification set as an aim for the experim ental type:
1. simultaneous six-channel recording with a power of resolution of 1% for slowly varying one-variable functions (e.g. resistivity, SP);
2. recording of the upper 2 x 1 2 1 channels of a simultaneous digital analysis of 128 channels of each of two nuclear detectors;
3. recording of the energy-window data of further four single-channel digital energy-analyzer placeable in arbitrary grouping on any of the two detectors, w ith an accuracy and resolution determ ined by the 128-channel analyzer;
4. recording of the decaying signal form of induced potential measure- rem ent simultaneously on seven channels, w ith the recording of 121 points of each channel with an accuracy of 2% . The sampling ra te is 1 0 0 /Lis or l m s .
5. Digital recording of the w ave-pattern of acoustic m easurem ents, for a system w ith two transm itters and one erceiver; recording of 242 data of each wave-package one by one, w ith an accuracy of 2% ; with a sampling ra te of 5 p sec.
6. sampling rates (taking the concept of sampling in the earlier, generalized sense) are: 5 cm, 10 cm, 20 cm or 50 cm;
7. The equipm ent yields the observed depth of the address data of the blocks formed of the individual samples in a system perm itting the autom atic depth correction for the com puter program.
T h e e x p e r i m e n t a l t y p e o f th e e q u i p m e n t consists of two m ain units: the digital field recording equipm ent and the digital playback unit operating a t the field base.
The experim ental field recorder is built up of a data input unit, a data sorter and arithm etic unit, a digital m agnetic-tape data storage un it and a display unit. A part from these, it includes the central control unit providing for m ulti-program m ing the above m entioned units and for m aintaining the priority sequence, as well as for tim e-dependent m easurem ents. In tim e-dependent measurements, sampling, starting and stopping of the m easurem ent is m ade not in the function of depth b u t of time. The d ata input un it contains also the converter and m ultiplexer. The data sorter and arithm etic unit contains also a ferrit-m em ory of 256 words (with 16 bits in each word). The display unit provides the driving of the visual galvanom eter-recorder and contains an oscilloscope un it for visual presentation of spectra, w ave-patterns and signal forms.
The functions of the d i g i t a l p l a y b a c k u n i t on the basis are:
180

1. section-wise drawing of logs from field digital records, according to wish, b u t from a m aterial sampled at a ra te equal to th a t used during recording; at most, scale, calibration and starting point can be schosen by the in terpreter;in a single step, the log or logs can be plotted from 1024 data.
2. Drawing, resp. oscilloscope display of spectra and wave patterns (on the oscilloscope, also the log sections to be drawn can be displayed).
3. P artia l data reduction and processing, preceding the plotting of logs (e.g. of various radiom etric energy-logs).
4. D ata are received by the equipm ent from m agnetic tape or punched- tape and presents data, beyond those m entioned above also on punched tape or printer.
The construction of both the field recorder and the playback units will follow the laboratory and field m easurem ents to be made in 1971. The main tasks, in this regard, will be represented by design and construction work necessary partly for the final construction of the field equipm ent, partly for the realization of such operation modes which are still missing in the experim ental type (e.g. pulsed neutron-generator measurements).
181