Embed Size (px)
Citation preview
2 September 2013
FY2013 roadshow presentation
Attached is a presentation by ERM Power Managing Director and CEO Philip St Baker to investors in Australia, New Zealand and Asia this month.
Peter Jans Group General Counsel & Company Secretary ERM Power Limited

Full Year ResultsFY2013
Roadshow Presentation.
September 2013 Australia, New Zealand, Asia
Important notice - disclaimer.
2
DisclaimerThis presentation contains certain forward-looking statements with respect to the financial condition, results of operations and business of ERM Power Limited (ERM Power) and certain plans and objectives of the management of ERM Power. Such forward-looking statements involve both known and unknown risks, uncertainties, assumptions and other important factors which are beyond the control of ERM Power and could cause the actual outcomes to be materially different from the events or resultsexpressed or implied by such statements. None of ERM Power, its officers, advisers or any other person makes any representation, assurance or guarantee as to the accuracy or likelihood of fulfilment of any forward-looking statements or any outcomes expressed or implied by any forward-looking statements. The information contained in this presentation does not take into account investors investment objectives, financial situation or particular needs. Before making an investment decision, investors should consider their own needs and situation and, if necessary, seekprofessional advice. To the maximum extent permitted by law, none of ERM Power, its directors, employees or agents, nor any other person accepts any liability for any loss arising from the use of this presentation or its contents or otherwise arising out of, or in connection with it.
Non-IFRS informationThis document may contain certain non-IFRS financial measures and other defined financial terms. The directors believe the presentation of certain non-IFRS financial measures is useful for the users of this document as they reflect the underlying financial performance of the business. The non-IFRS financial measures include but are not limited to:• EBITDAIF - Earnings before interest, tax, depreciation, amortisation, impairment and net fair value gains / losses on financial
instruments designated at fair value through profit and loss and gains/losses on onerous contracts, including profit from associates.• Statutory NPAT - Statutory net profit after tax attributable to equity holders of ERM Power Limited unless otherwise stated. • Underlying profit or Underlying NPAT- Statutory net profit after tax attributable to equity holders of the Company after excluding the
after tax effect of unrealised marked to market changes in the fair value of financial instruments, impairment and gains/losses on onerous contracts.
The above non-IFRS financial measures have not been subject to review or audit. However, the Company’s auditors, PricewaterhouseCoopers, have separately undertaken a set of procedures to agree the non-IFRS financial measures disclosed to thebooks and records of the consolidated entity.All reference to $ is a reference to Australian dollars unless otherwise stated. Individual items and totals are rounded to the nearest appropriate number or decimal. Some totals may not add down the page due to rounding of individual components.

Safety, environment & community.
3
• Excellent safety performance with no recordable or lost time injuries
• No reportable environmental incidents or breaches of environmental licence conditions
• Broad based sponsorship of local community groups and events with focus on education, arts and sport
• Sponsored Brisbane International tennis tournament
2013 Brisbane International winner Andy Murray
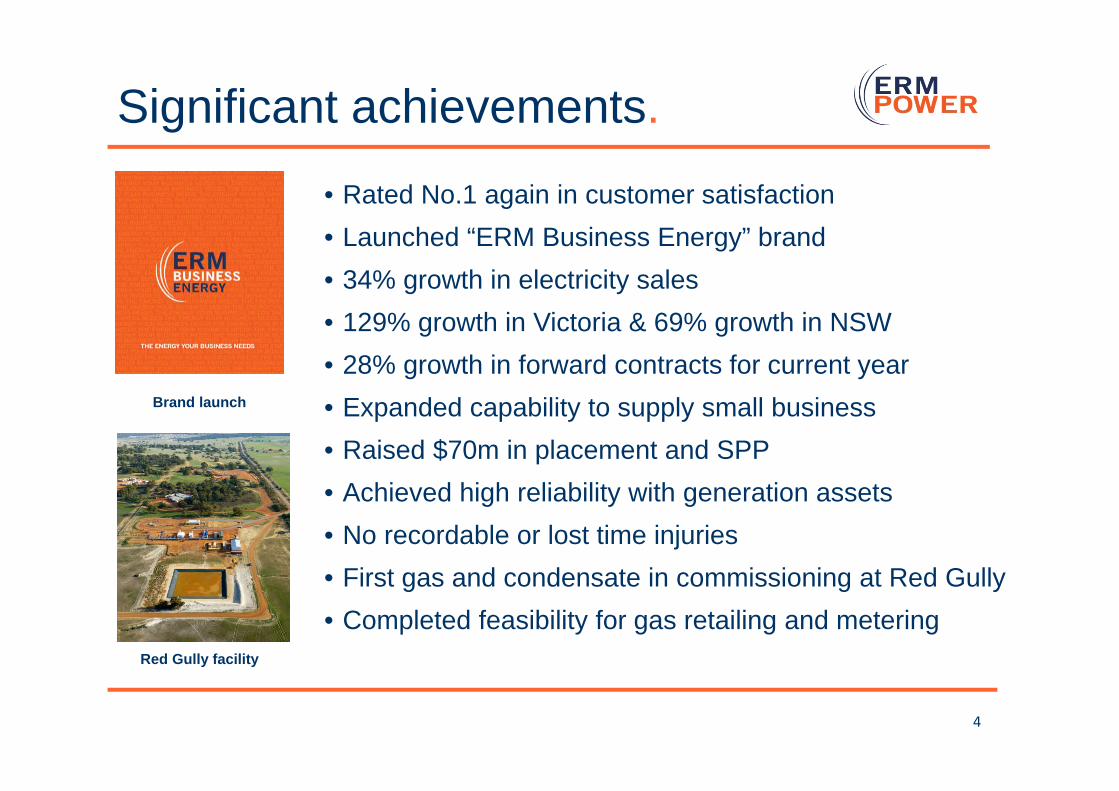
Significant achievements.
• Rated No.1 again in customer satisfaction• Launched “ERM Business Energy” brand• 34% growth in electricity sales• 129% growth in Victoria & 69% growth in NSW• 28% growth in forward contracts for current year• Expanded capability to supply small business• Raised $70m in placement and SPP• Achieved high reliability with generation assets• No recordable or lost time injuries• First gas and condensate in commissioning at Red Gully• Completed feasibility for gas retailing and metering
4
Brand launch
Red Gully facility
Full year results.
5
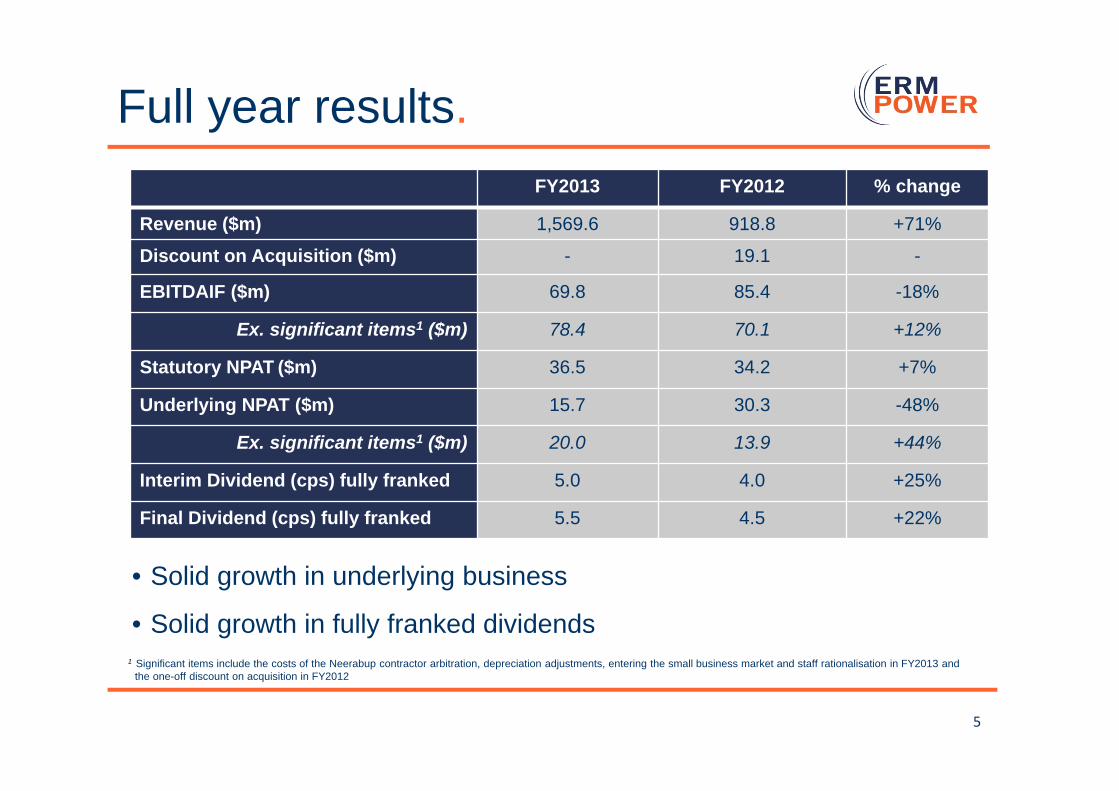
1 Significant items include the costs of the Neerabup contractor arbitration, depreciation adjustments, entering the small business market and staff rationalisation in FY2013 and the one-off discount on acquisition in FY2012
FY2013 FY2012 % change
Revenue ($m) 1,569.6 918.8 +71%
Discount on Acquisition ($m) - 19.1 -
EBITDAIF ($m) 69.8 85.4 -18%
Ex. significant items1 ($m) 78.4 70.1 +12%
Statutory NPAT ($m) 36.5 34.2 +7%
Underlying NPAT ($m) 15.7 30.3 -48%
Ex. significant items1 ($m) 20.0 13.9 +44%
Interim Dividend (cps) fully franked 5.0 4.0 +25%
Final Dividend (cps) fully franked 5.5 4.5 +22%
• Solid growth in underlying business
• Solid growth in fully franked dividends

Dividend growth.
Strong fully franked dividend growth
63% Total shareholder return (TSR) over past 2½ years (since IPO) at close of business Wednesday 21 August 2013
6
0.0
1.0
2.0
3.0
4.0
5.0
6.0
FY2011 final FY2012interim
FY2012 final FY2013interim
FY2013 final
cents per share
Dividend Growth
Underlying earnings growth.
7
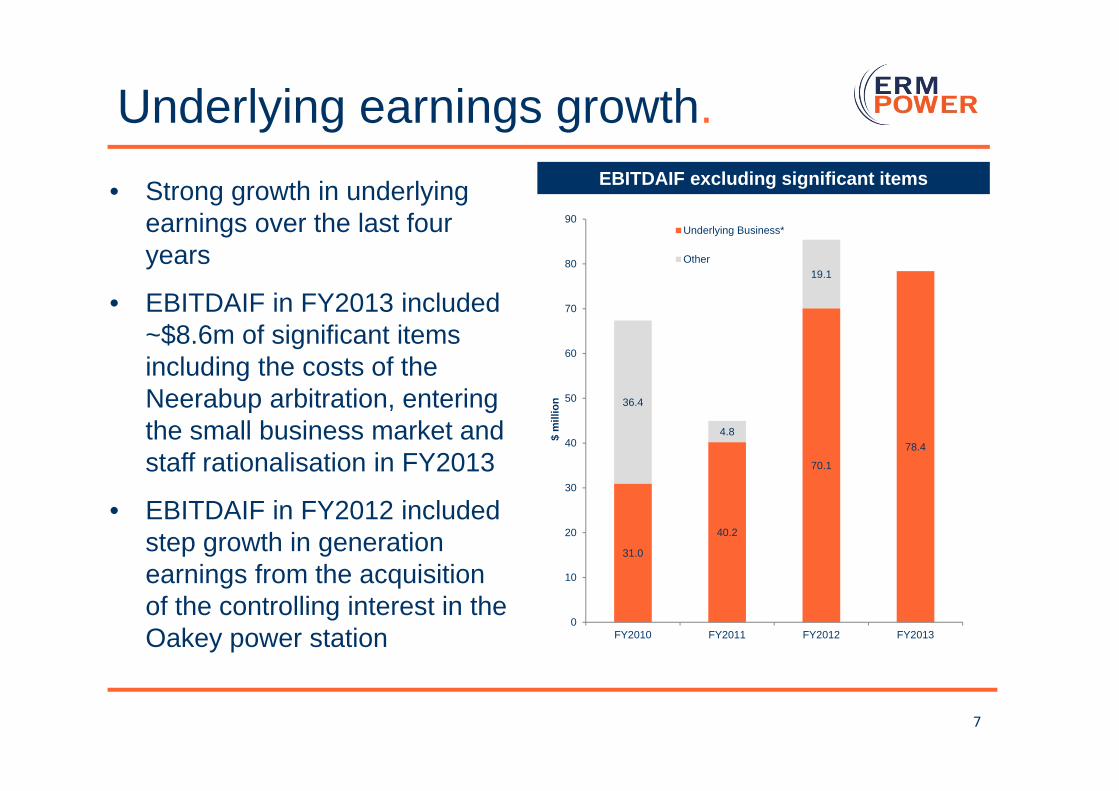
EBITDAIF excluding significant items• Strong growth in underlying earnings over the last four years
• EBITDAIF in FY2013 included ~$8.6m of significant items including the costs of the Neerabup arbitration, entering the small business market and staff rationalisation in FY2013
• EBITDAIF in FY2012 included step growth in generation earnings from the acquisition of the controlling interest in the Oakey power station
31.0
40.2
70.1
78.4
36.4
4.8
19.1
0
10
20
30
40
50
60
70
80
90
FY2010 FY2011 FY2012 FY2013
$ m
illio
n
Underlying Business*
Other
Electricity sales.
8
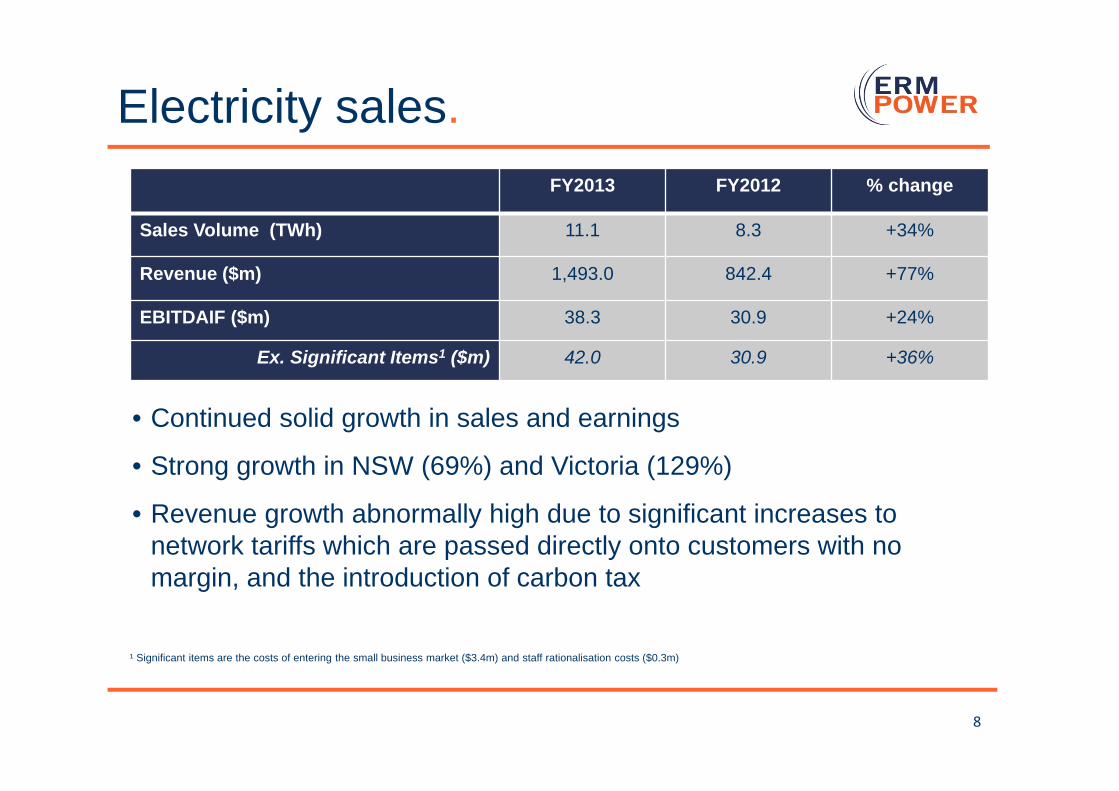
FY2013 FY2012 % change
Sales Volume (TWh) 11.1 8.3 +34%
Revenue ($m) 1,493.0 842.4 +77%
EBITDAIF ($m) 38.3 30.9 +24%
Ex. Significant Items1 ($m) 42.0 30.9 +36%
• Continued solid growth in sales and earnings
• Strong growth in NSW (69%) and Victoria (129%)
• Revenue growth abnormally high due to significant increases to network tariffs which are passed directly onto customers with no margin, and the introduction of carbon tax
¹ Significant items are the costs of entering the small business market ($3.4m) and staff rationalisation costs ($0.3m)
0
20
40
60
80
100
120
140
160
Jul-0
8
Jan-
09
Jul-0
9
Jan-
10
Jul-1
0
Jan-
11
Jul-1
1
Jan-
12
Jul-1
2
Jan-
13
Jul-1
30
1,000
2,000
3,000
4,000
5,000
6,000
7,000
8,000
9,000
10,000
Jul-0
8
Jan-
09
Jul-0
9
Jan-
10
Jul-1
0
Jan-
11
Jul-1
1
Jan-
12
Jul-1
2
Jan-
13
Jul-1
3
0
100
200
300
400
500
600
700
800
900
1000
1100
Jul-0
8
Jan-
09
Jul-0
9
Jan-
10
Jul-1
0
Jan-
11
Jul-1
1
Jan-
12
Jul-1
2
Jan-
13
Jul-1
3
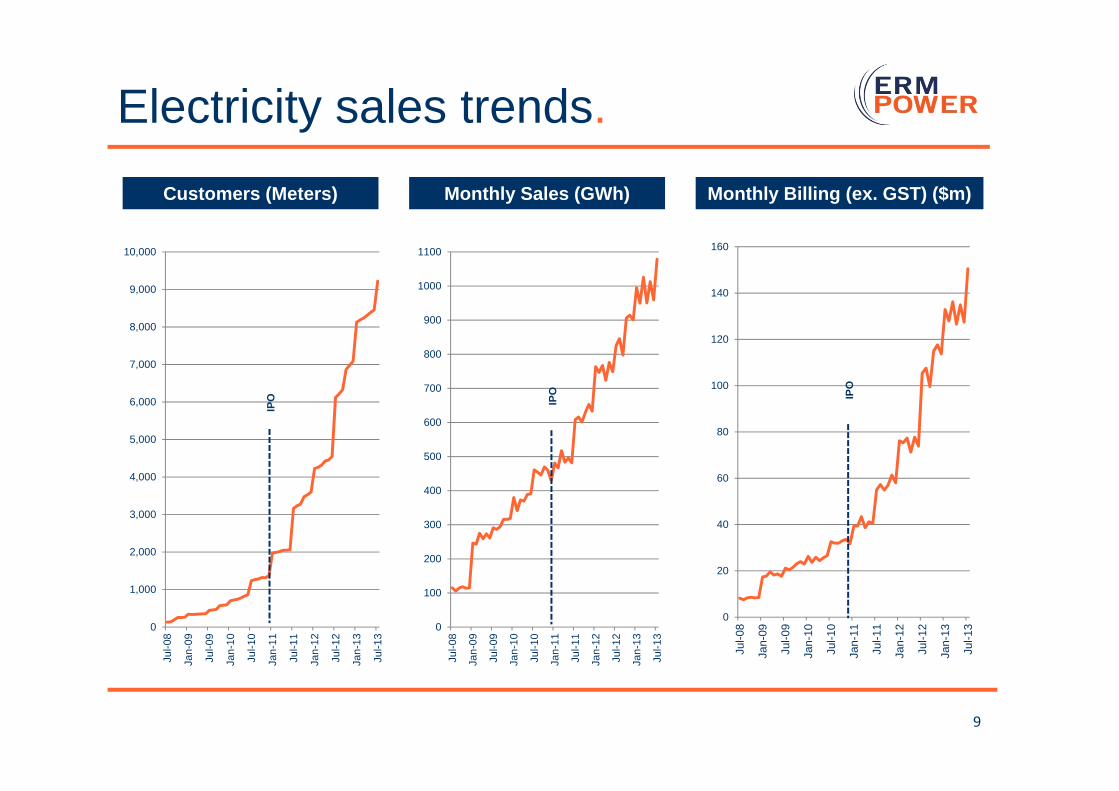
Electricity sales trends.
9
Customers (Meters) Monthly Sales (GWh) Monthly Billing (ex. GST) ($m)
IPO
IPO IP
O
Small business expansion update.
10
• On track with funds raised being deployed
• Customer transfer processes fully operational
• NSW contract customers transferred seamlessly
• Started supplying on schedule on July 1
• Billing processes fully operational
• Started billing customers with the usual high accuracy in August
• Finishing touches on single site capability underway
• Single site customer launch on track for October
• Marketing campaign ready with single site launch
• Maintaining EBITDAIF forecast of >$30 million p.a. in 3-5 years
Diversified customer base.
11
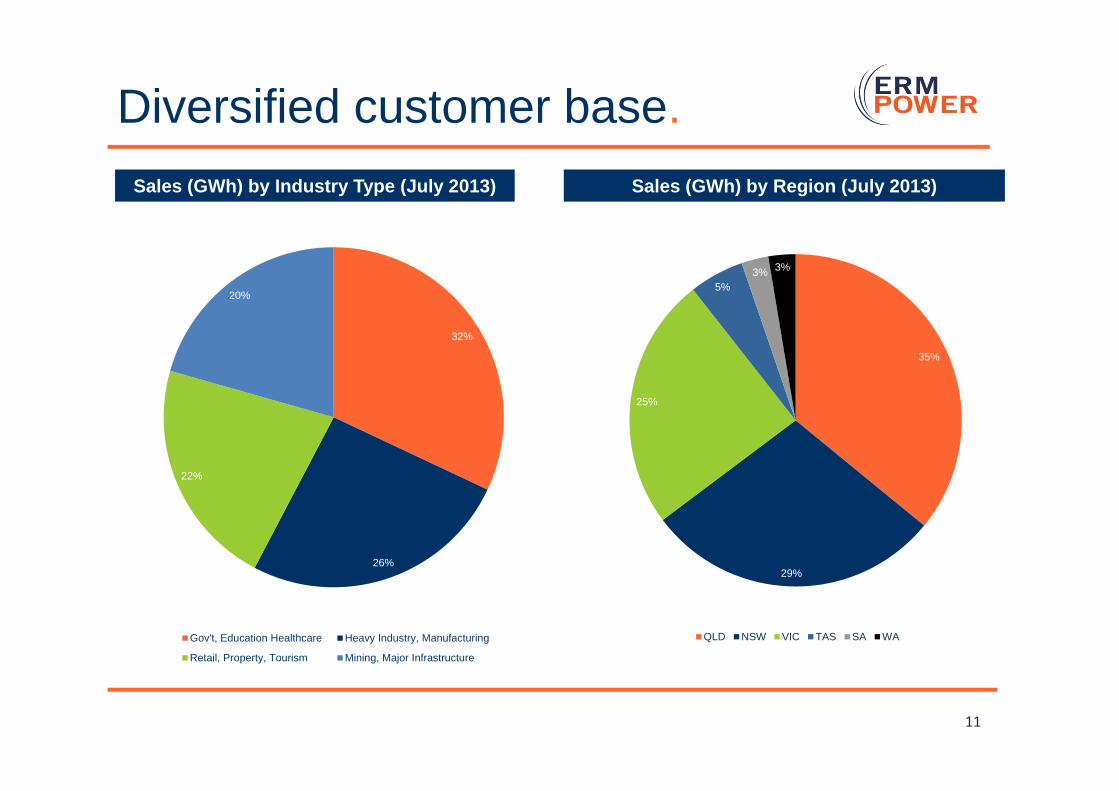
Sales (GWh) by Industry Type (July 2013) Sales (GWh) by Region (July 2013)
35%
29%
25%
5%3% 3%
QLD NSW VIC TAS SA WA
32%
26%
22%
20%
Gov't, Education Healthcare Heavy Industry, Manufacturing
Retail, Property, Tourism Mining, Major Infrastructure
Forecast growth.
12
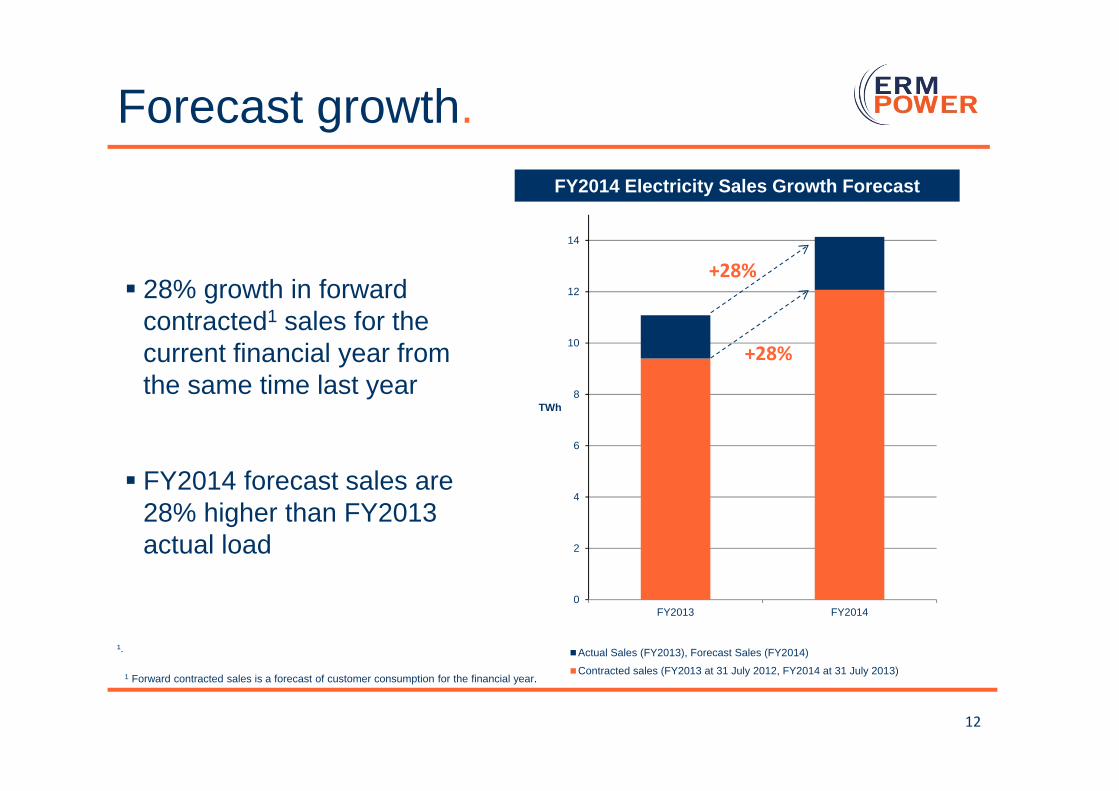
FY2014 Electricity Sales Growth Forecast
28% growth in forward contracted1 sales for the current financial year from the same time last year
FY2014 forecast sales are 28% higher than FY2013 actual load
¹.
1 Forward contracted sales is a forecast of customer consumption for the financial year.
0
2
4
6
8
10
12
14
FY2013 FY2014
TWh
Actual Sales (FY2013), Forecast Sales (FY2014)
Contracted sales (FY2013 at 31 July 2012, FY2014 at 31 July 2013)
+28%
+28%

Marketing campaign.
13
Operational excellence.
14
• Highly accurate and efficient operations enable market leadership in customer satisfaction, service and value – a major competitive advantage for ERM Power
• Outstanding operational performance
• Billing accuracy of 99.94%, and
• Billing collection rate 99.98%
• We have achieved this industry leading performance level by designing, building, owning and operating our own retailing systems and processes
• We are maintaining and improving operational performance while growing at a high but sustainable rate
15
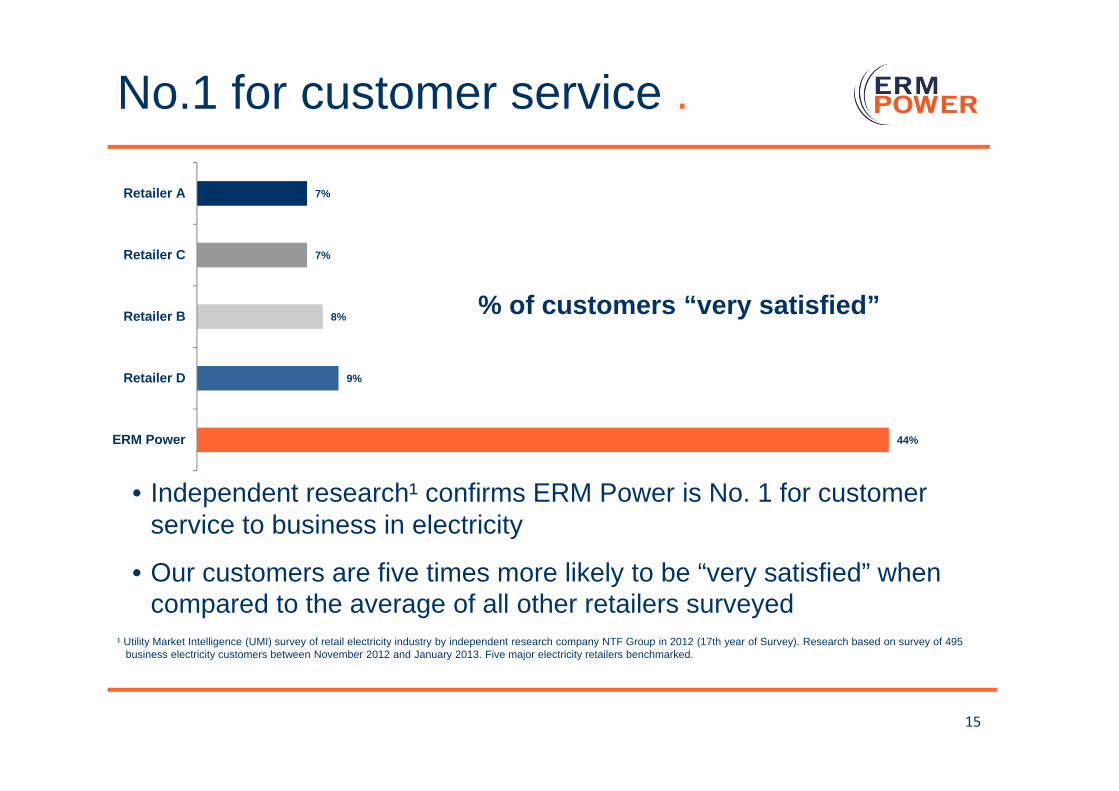
44%
9%
8%
7%
7%
ERM Power
Retailer D
Retailer B
Retailer C
Retailer A
% of customers “very satisfied”
¹ Utility Market Intelligence (UMI) survey of retail electricity industry by independent research company NTF Group in 2012 (17th year of Survey). Research based on survey of 495 business electricity customers between November 2012 and January 2013. Five major electricity retailers benchmarked.
No.1 for customer service .
• Independent research¹ confirms ERM Power is No. 1 for customer service to business in electricity
• Our customers are five times more likely to be “very satisfied” when compared to the average of all other retailers surveyed
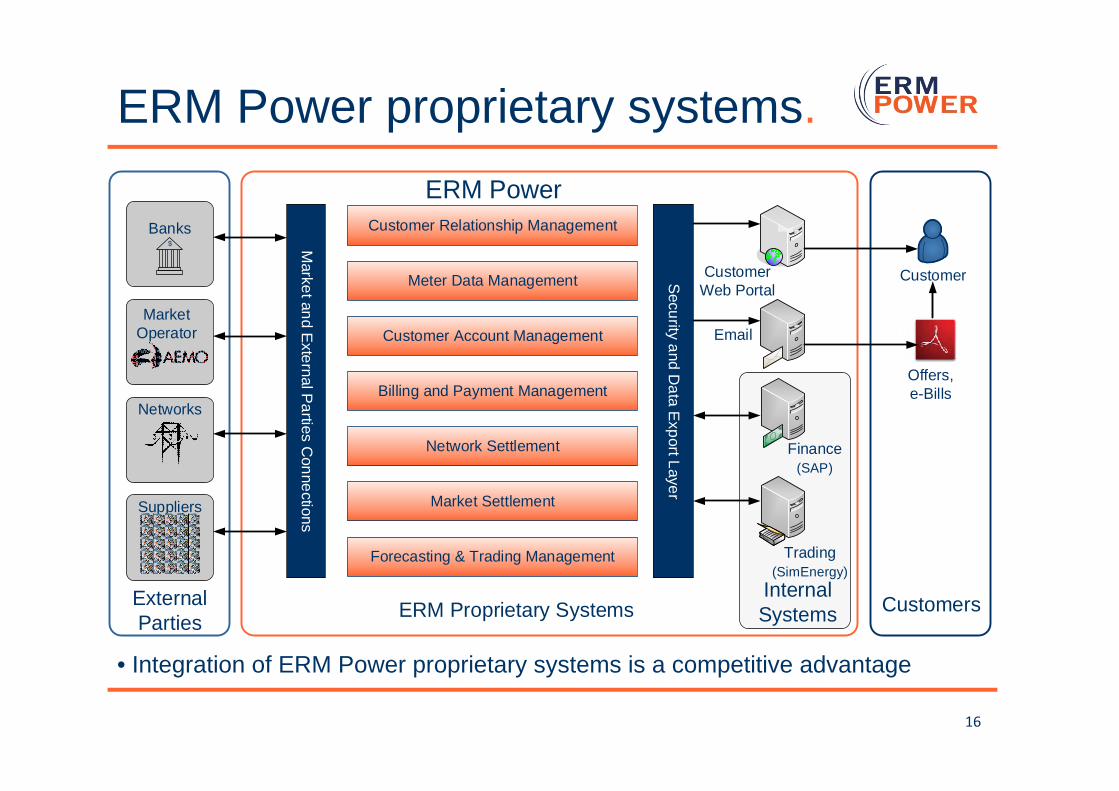
ERM Power proprietary systems.
16
• Integration of ERM Power proprietary systems is a competitive advantage
External System
Offers, e-Bills
Market Settlement
Customer Account Management
Network Settlement
Meter Data Management CustomerWeb Portal
CustomerSecurity and D
ata Export Layer
Customer Relationship Management
Networks
Suppliers
Market Operator
Market and E
xternal Parties C
onnections
Finance(SAP)
Trading(SimEnergy)
Forecasting & Trading Management
Billing and Payment Management
ERM Proprietary SystemsExternalParties
CustomersInternal Systems
ERM Power
$
Banks

End to end customer management .
17
Integrated end-to-end systems and management ensure exceptional customer service, tightly managed risk and efficient operations.
Offer Self Serve Sign Up (For SME Segment)
C&I Contract Acceptance Forecast
Automated Transfer Trading Data
Management Bill
Settlement Receivables Reporting Customer Support
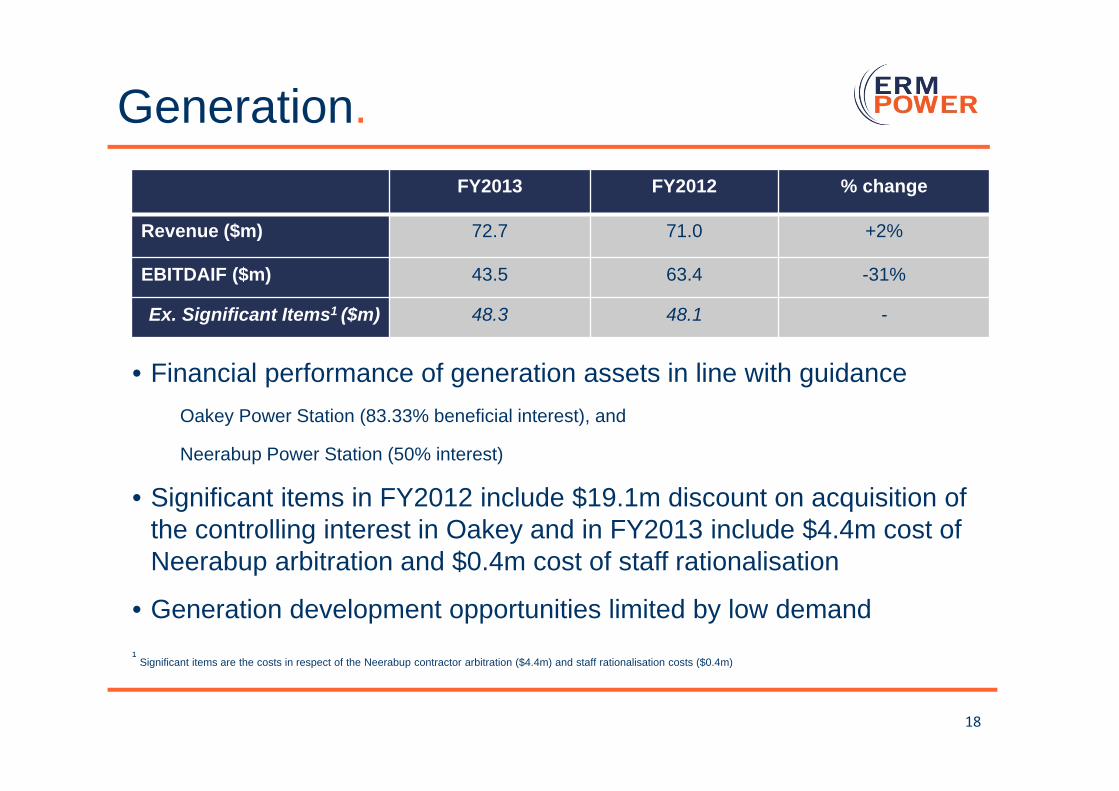
Generation.
18
FY2013 FY2012 % change
Revenue ($m) 72.7 71.0 +2%
EBITDAIF ($m) 43.5 63.4 -31%
Ex. Significant Items1 ($m) 48.3 48.1 -
• Financial performance of generation assets in line with guidanceOakey Power Station (83.33% beneficial interest), and
Neerabup Power Station (50% interest)
• Significant items in FY2012 include $19.1m discount on acquisition of the controlling interest in Oakey and in FY2013 include $4.4m cost of Neerabup arbitration and $0.4m cost of staff rationalisation
• Generation development opportunities limited by low demand¹ Significant items are the costs in respect of the Neerabup contractor arbitration ($4.4m) and staff rationalisation costs ($0.4m)

Generation operations.Oakey (332MW) Peaker• Outstanding availability and reliability
Availability¹ 99.2% & Forced Outage Rate¹ 0.02%
• Inspection reaffirmed excellent condition
Neerabup (330MW) Peaker• Outstanding availability and reliability
Availability¹ 98.2% & Forced Outage Rate¹ 0.05%
• WA electricity market improvements created potential for additional revenue
Kwinana (320MW) Baseload• ERM Power operates this asset for
others
• Outstanding availability and reliability
19
Oakey Power Station - Queensland
Neerabup Power Station – Western Australia ¹IEEE Standard used for calculation of Availability and Forced Outage Rate
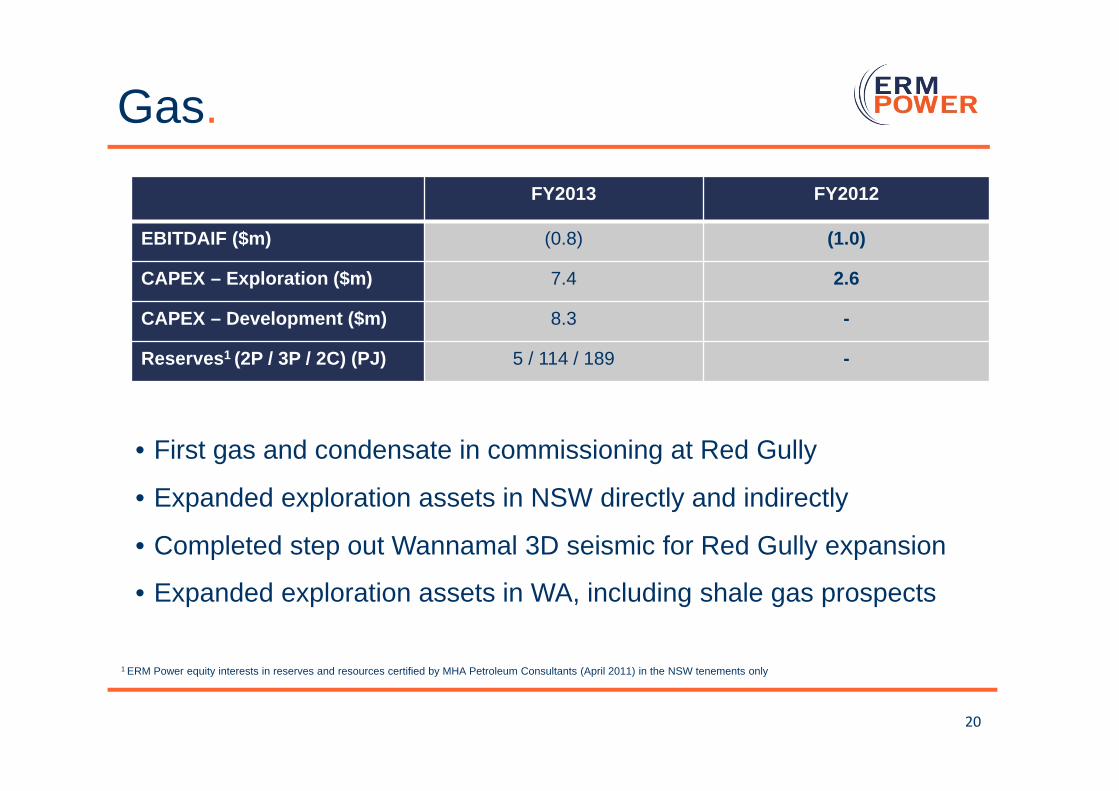
Gas.
20
FY2013 FY2012
EBITDAIF ($m) (0.8) (1.0)
CAPEX – Exploration ($m) 7.4 2.6
CAPEX – Development ($m) 8.3 -
Reserves1 (2P / 3P / 2C) (PJ) 5 / 114 / 189 -
• First gas and condensate in commissioning at Red Gully
• Expanded exploration assets in NSW directly and indirectly
• Completed step out Wannamal 3D seismic for Red Gully expansion
• Expanded exploration assets in WA, including shale gas prospects
1 ERM Power equity interests in reserves and resources certified by MHA Petroleum Consultants (April 2011) in the NSW tenements only
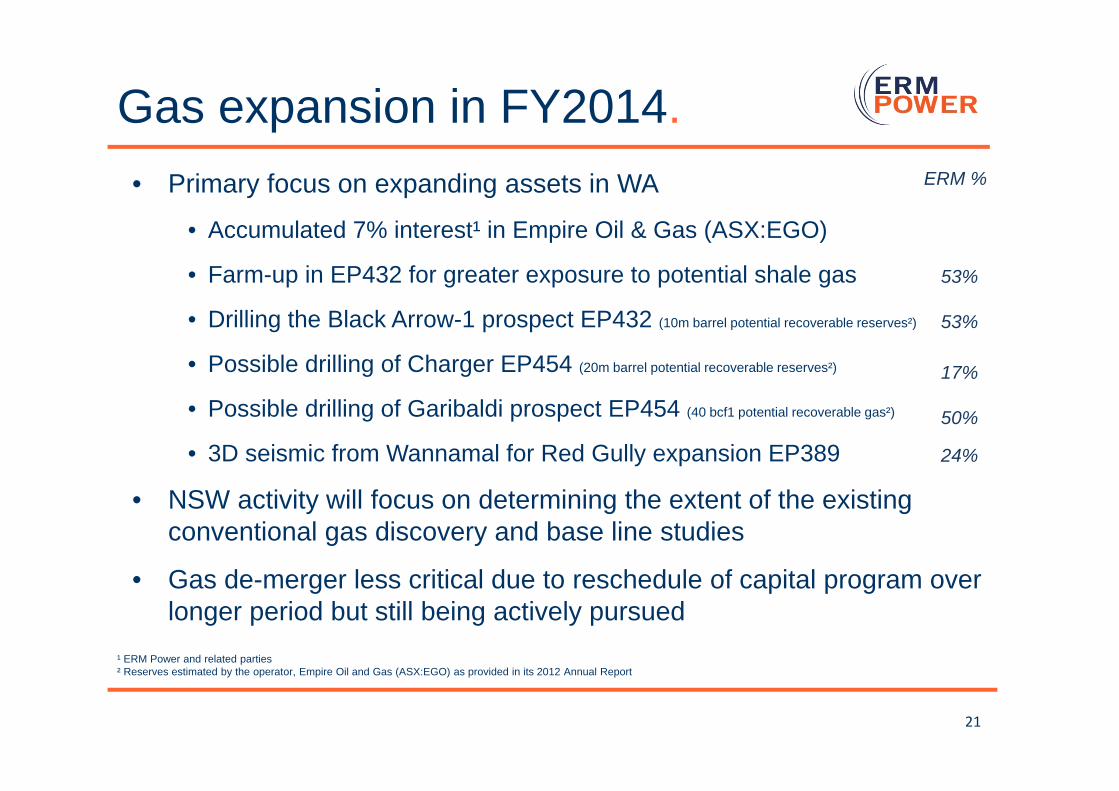
Gas expansion in FY2014.
21
• Primary focus on expanding assets in WA
• Accumulated 7% interest¹ in Empire Oil & Gas (ASX:EGO)
• Farm-up in EP432 for greater exposure to potential shale gas
• Drilling the Black Arrow-1 prospect EP432 (10m barrel potential recoverable reserves²)
• Possible drilling of Charger EP454 (20m barrel potential recoverable reserves²)
• Possible drilling of Garibaldi prospect EP454 (40 bcf1 potential recoverable gas²)
• 3D seismic from Wannamal for Red Gully expansion EP389
• NSW activity will focus on determining the extent of the existing conventional gas discovery and base line studies
• Gas de-merger less critical due to reschedule of capital program over longer period but still being actively pursued
¹ ERM Power and related parties² Reserves estimated by the operator, Empire Oil and Gas (ASX:EGO) as provided in its 2012 Annual Report
ERM %
53%
53%
17%
50%
24%

Gas & condensate production.
• Closest gas supply to Perth
• Commercial operation is expected from August 2013
• Selling gas to Alcoa, condensate to BP
• Significant expansion prospects
22
Red Gully Gas and condensate processing facility in Western Australia (Source: Empire Oil and Gas)
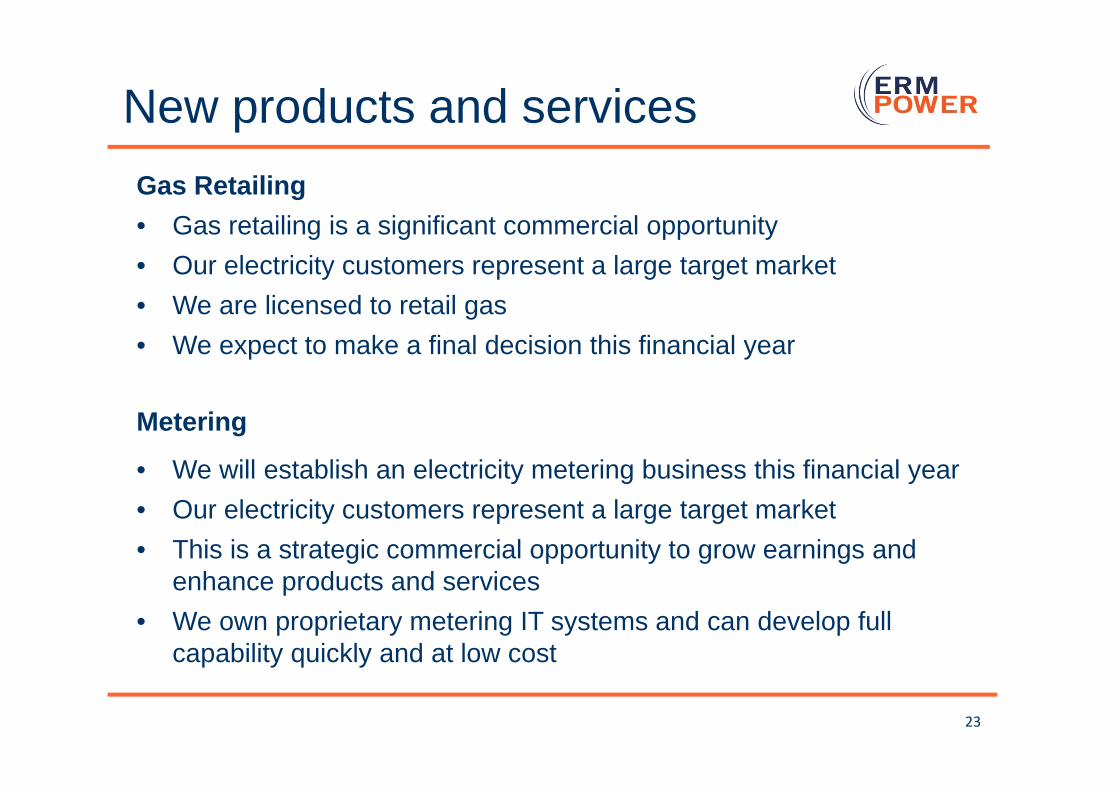
New products and servicesGas Retailing • Gas retailing is a significant commercial opportunity• Our electricity customers represent a large target market• We are licensed to retail gas• We expect to make a final decision this financial year
Metering
• We will establish an electricity metering business this financial year• Our electricity customers represent a large target market• This is a strategic commercial opportunity to grow earnings and
enhance products and services• We own proprietary metering IT systems and can develop full
capability quickly and at low cost
23
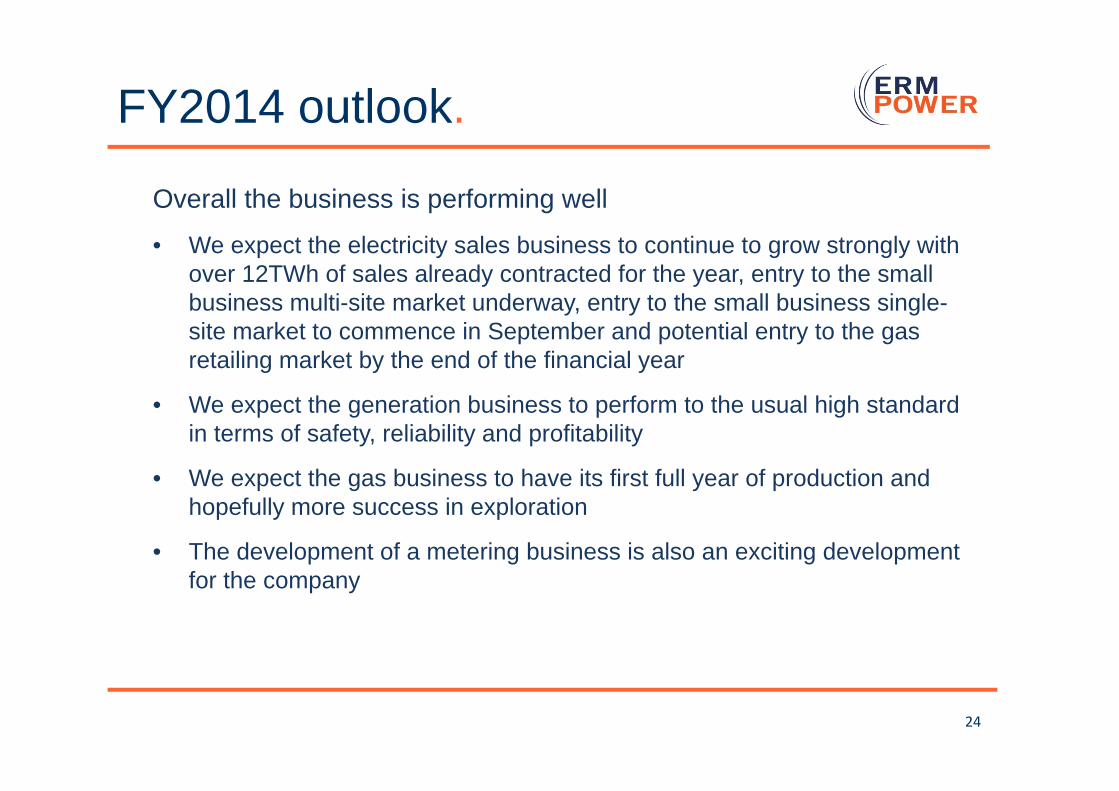
FY2014 outlook.
24
Overall the business is performing well
• We expect the electricity sales business to continue to grow strongly with over 12TWh of sales already contracted for the year, entry to the small business multi-site market underway, entry to the small business single-site market to commence in September and potential entry to the gas retailing market by the end of the financial year
• We expect the generation business to perform to the usual high standard in terms of safety, reliability and profitability
• We expect the gas business to have its first full year of production and hopefully more success in exploration
• The development of a metering business is also an exciting development for the company

FY2014 priorities.
25
In order of priority
1. Growing electricity sales to large business customers
a) 28% growth in forward sales contracts
2. Growing electricity sales to small business customers
a) Contesting multi-site deals
b) Start contesting single sites in October
3. Expanding our offering to existing customers
a) Providing the metering service ourselves
b) Offering gas as well as electricity
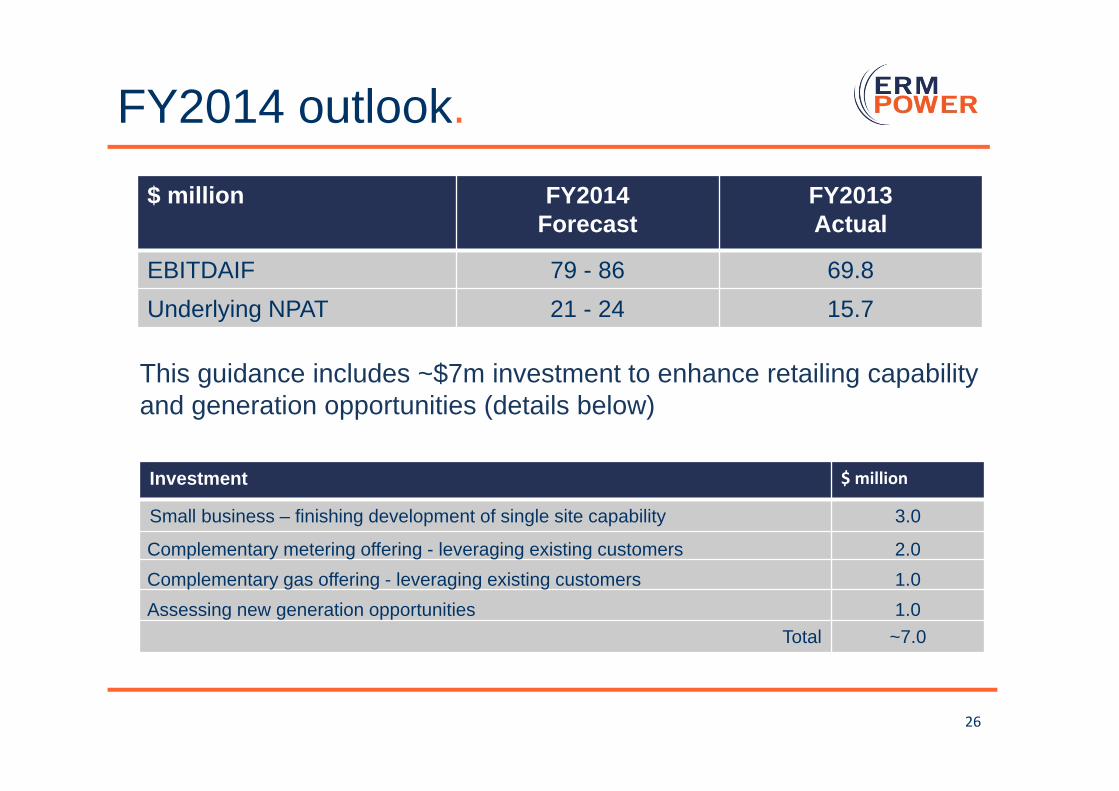
FY2014 outlook.
26
$ million FY2014Forecast
FY2013Actual
EBITDAIF 79 - 86 69.8Underlying NPAT 21 - 24 15.7
This guidance includes ~$7m investment to enhance retailing capability and generation opportunities (details below)
Investment $ million
Small business – finishing development of single site capability 3.0
Complementary metering offering - leveraging existing customers 2.0Complementary gas offering - leveraging existing customers 1.0Assessing new generation opportunities 1.0
Total ~7.0
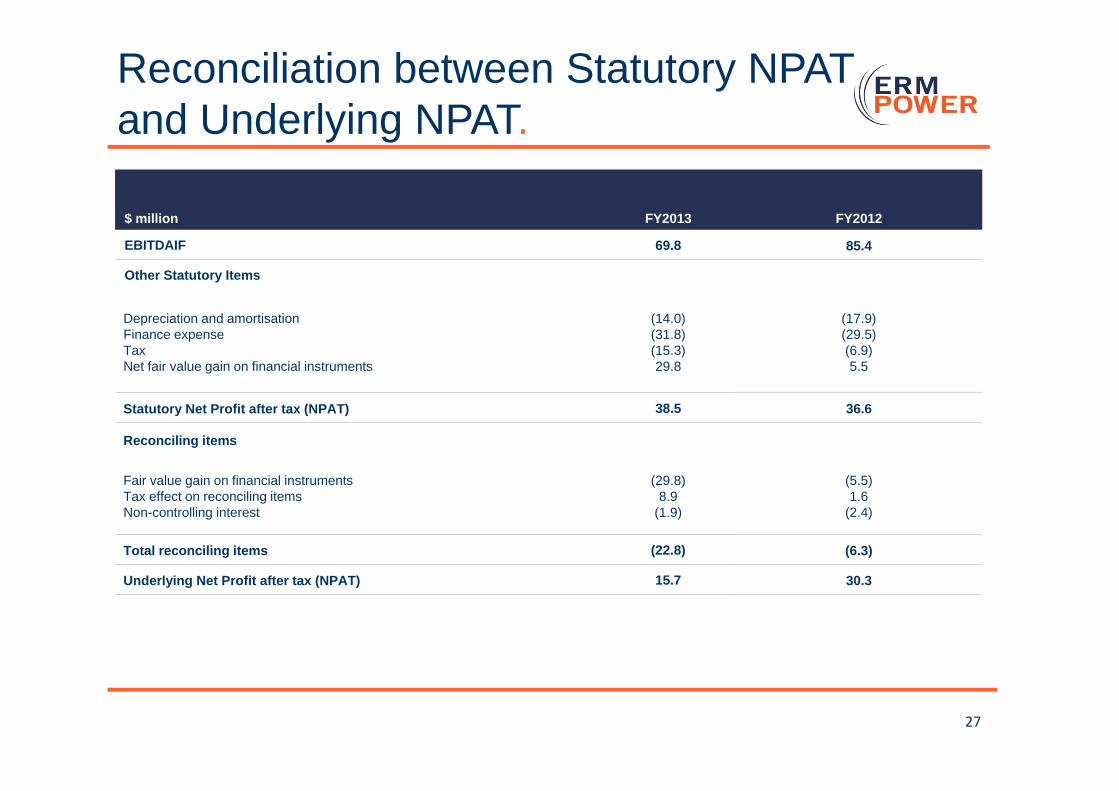
Reconciliation between Statutory NPAT and Underlying NPAT.
27
$ million FY2013 FY2012
EBITDAIF 69.8 85.4
Other Statutory Items
Depreciation and amortisationFinance expenseTaxNet fair value gain on financial instruments
(14.0)(31.8)(15.3)29.8
(17.9)(29.5)(6.9)5.5
Statutory Net Profit after tax (NPAT) 38.5 36.6
Reconciling items
Fair value gain on financial instrumentsTax effect on reconciling itemsNon-controlling interest
(29.8)8.9
(1.9)
(5.5)1.6
(2.4)
Total reconciling items (22.8) (6.3)
Underlying Net Profit after tax (NPAT) 15.7 30.3
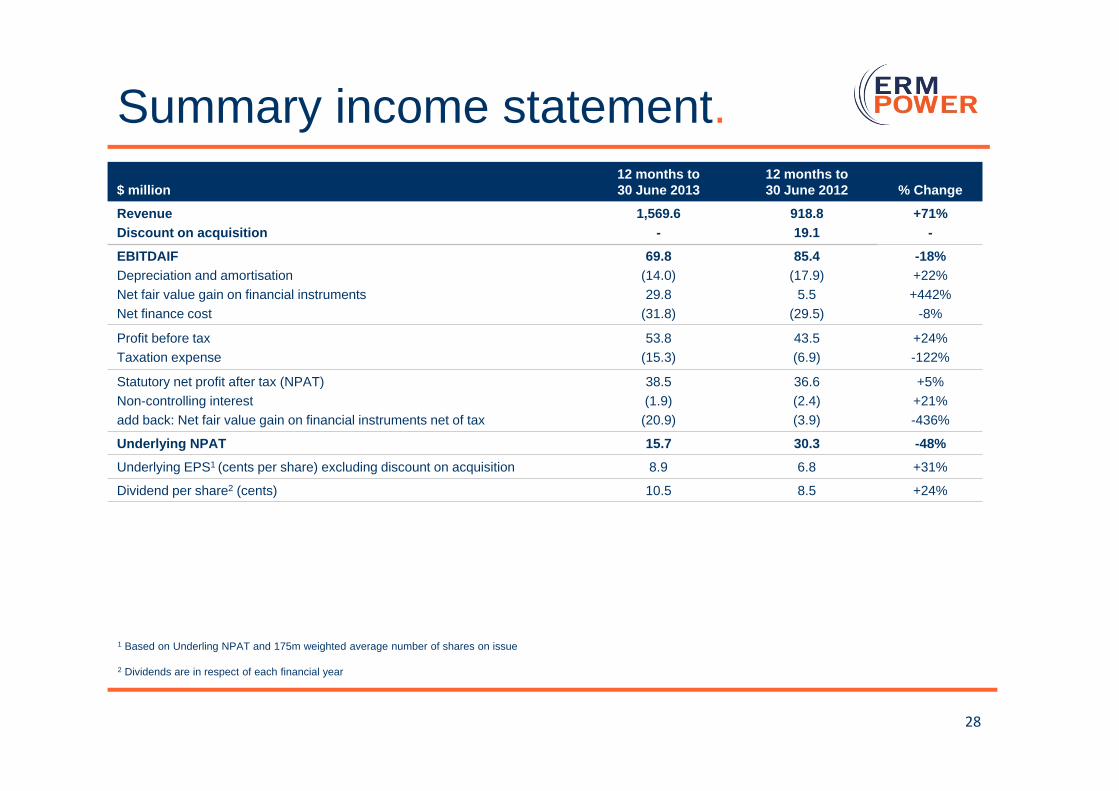
Summary income statement.
28
1 Based on Underling NPAT and 175m weighted average number of shares on issue
2 Dividends are in respect of each financial year
$ million12 months to30 June 2013
12 months to30 June 2012 % Change
RevenueDiscount on acquisition
1,569.6-
918.819.1
+71%-
EBITDAIFDepreciation and amortisationNet fair value gain on financial instrumentsNet finance cost
69.8(14.0)29.8
(31.8)
85.4(17.9)
5.5(29.5)
-18%+22%+442%
-8%
Profit before taxTaxation expense
53.8(15.3)
43.5(6.9)
+24%-122%
Statutory net profit after tax (NPAT)Non-controlling interestadd back: Net fair value gain on financial instruments net of tax
38.5(1.9)(20.9)
36.6(2.4)(3.9)
+5%+21%-436%
Underlying NPAT 15.7 30.3 -48%
Underlying EPS1 (cents per share) excluding discount on acquisition 8.9 6.8 +31%
Dividend per share2 (cents) 10.5 8.5 +24%
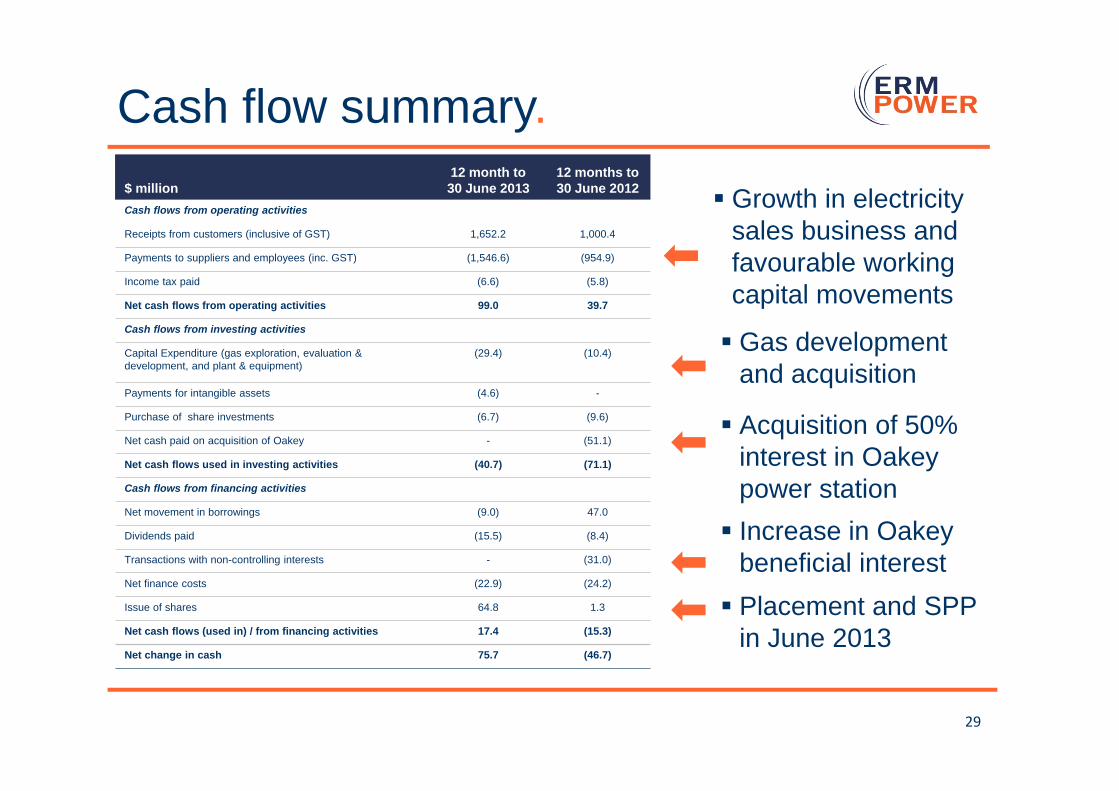
Cash flow summary.
29
$ million12 month to30 June 2013
12 months to30 June 2012
Cash flows from operating activities
Receipts from customers (inclusive of GST) 1,652.2 1,000.4
Payments to suppliers and employees (inc. GST) (1,546.6) (954.9)
Income tax paid (6.6) (5.8)
Net cash flows from operating activities 99.0 39.7
Cash flows from investing activities
Capital Expenditure (gas exploration, evaluation & development, and plant & equipment)
(29.4) (10.4)
Payments for intangible assets (4.6) -
Purchase of share investments (6.7) (9.6)
Net cash paid on acquisition of Oakey - (51.1)
Net cash flows used in investing activities (40.7) (71.1)
Cash flows from financing activities
Net movement in borrowings (9.0) 47.0
Dividends paid (15.5) (8.4)
Transactions with non-controlling interests - (31.0)
Net finance costs (22.9) (24.2)
Issue of shares 64.8 1.3
Net cash flows (used in) / from financing activities 17.4 (15.3)
Net change in cash 75.7 (46.7)
Growth in electricity sales business and favourable working capital movements
Acquisition of 50% interest in Oakey power station
Gas development and acquisition
Placement and SPP in June 2013
Increase in Oakey beneficial interest
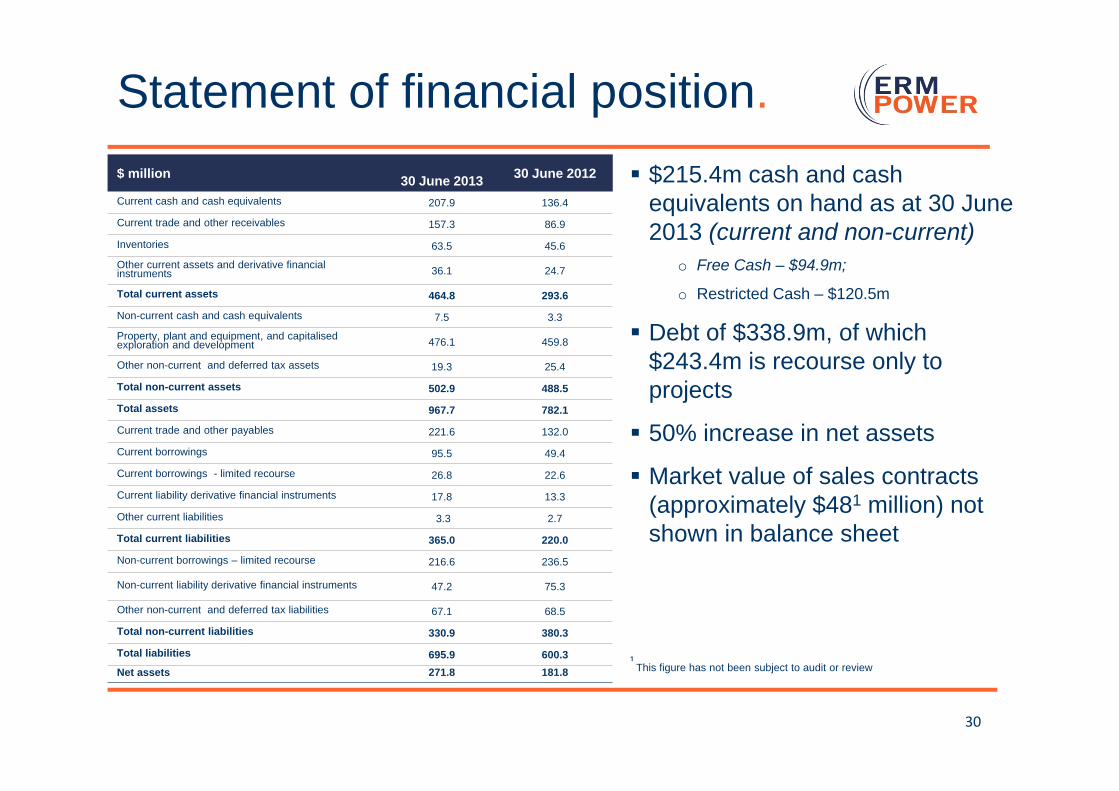
Statement of financial position.
30
$ million 30 June 2013 30 June 2012
Current cash and cash equivalents 207.9 136.4
Current trade and other receivables 157.3 86.9
Inventories 63.5 45.6
Other current assets and derivative financial instruments 36.1 24.7
Total current assets 464.8 293.6
Non-current cash and cash equivalents 7.5 3.3
Property, plant and equipment, and capitalisedexploration and development 476.1 459.8
Other non-current and deferred tax assets 19.3 25.4
Total non-current assets 502.9 488.5
Total assets 967.7 782.1
Current trade and other payables 221.6 132.0
Current borrowings 95.5 49.4
Current borrowings - limited recourse 26.8 22.6
Current liability derivative financial instruments 17.8 13.3
Other current liabilities 3.3 2.7
Total current liabilities 365.0 220.0
Non-current borrowings – limited recourse 216.6 236.5
Non-current liability derivative financial instruments 47.2 75.3
Other non-current and deferred tax liabilities 67.1 68.5
Total non-current liabilities 330.9 380.3
Total liabilities 695.9 600.3Net assets 271.8 181.8
$215.4m cash and cash equivalents on hand as at 30 June 2013 (current and non-current)
o Free Cash – $94.9m;
o Restricted Cash – $120.5m
Debt of $338.9m, of which $243.4m is recourse only to projects
50% increase in net assets
Market value of sales contracts (approximately $481 million) not shown in balance sheet
¹ This figure has not been subject to audit or review
Financing facilities.• At 30 June 2013: $95.5m corporate debt and $243.4m of debt with
recourse only to power stations
Corporate debt: $59.1m drawn from $100m receivables financing facility with recourse only to electricity sales business; and $36.4m associated with sale and repurchase financing in respect of renewable energy certificates
Project debt: related to Oakey and Neerabup power stations and supported by contract revenue from sovereign and investment-rated corporations
31
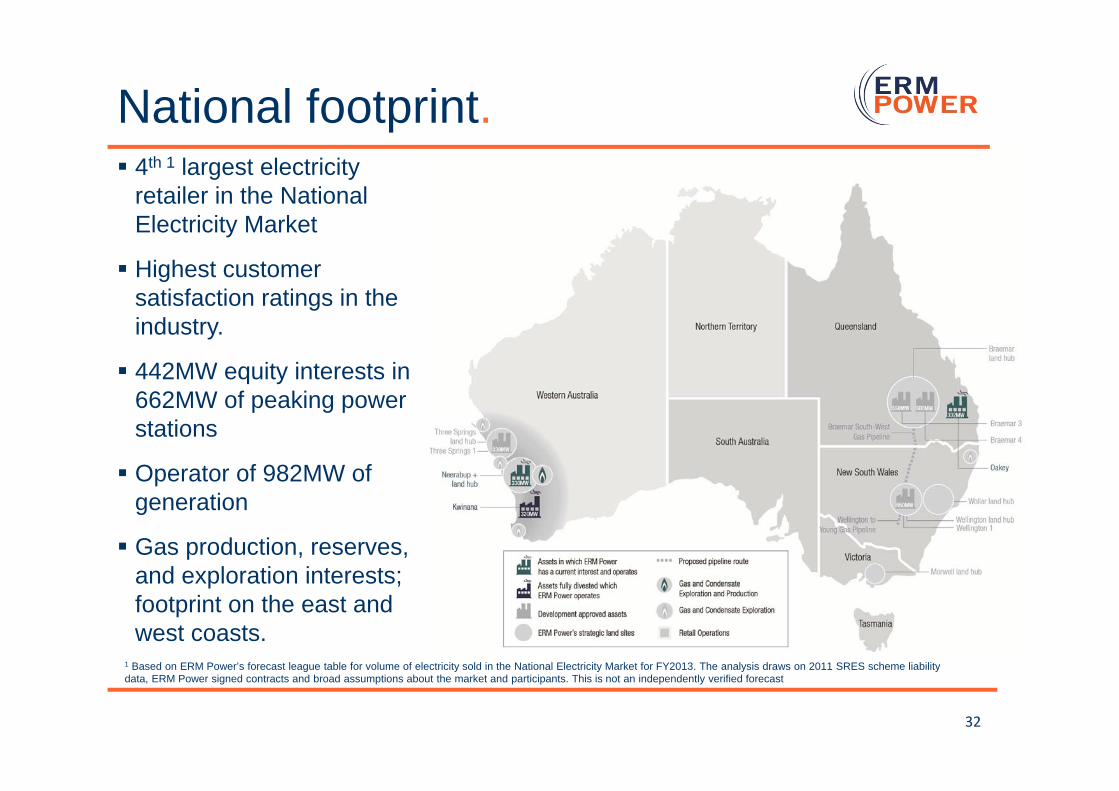
National footprint. 4th 1 largest electricity
retailer in the National Electricity Market
Highest customer satisfaction ratings in the industry.
442MW equity interests in 662MW of peaking power stations
Operator of 982MW of generation
Gas production, reserves, and exploration interests; footprint on the east and west coasts.
32
1 Based on ERM Power’s forecast league table for volume of electricity sold in the National Electricity Market for FY2013. The analysis draws on 2011 SRES scheme liability data, ERM Power signed contracts and broad assumptions about the market and participants. This is not an independently verified forecast

More Information:
Garry WestCorporate Communications ManagerEmail: [email protected] Ph: 61-7 3020 5165Mobile: 61- 457 140 650
Website: www.ermpower.com.au
33