Embed Size (px)
Citation preview

2. The Income Statement
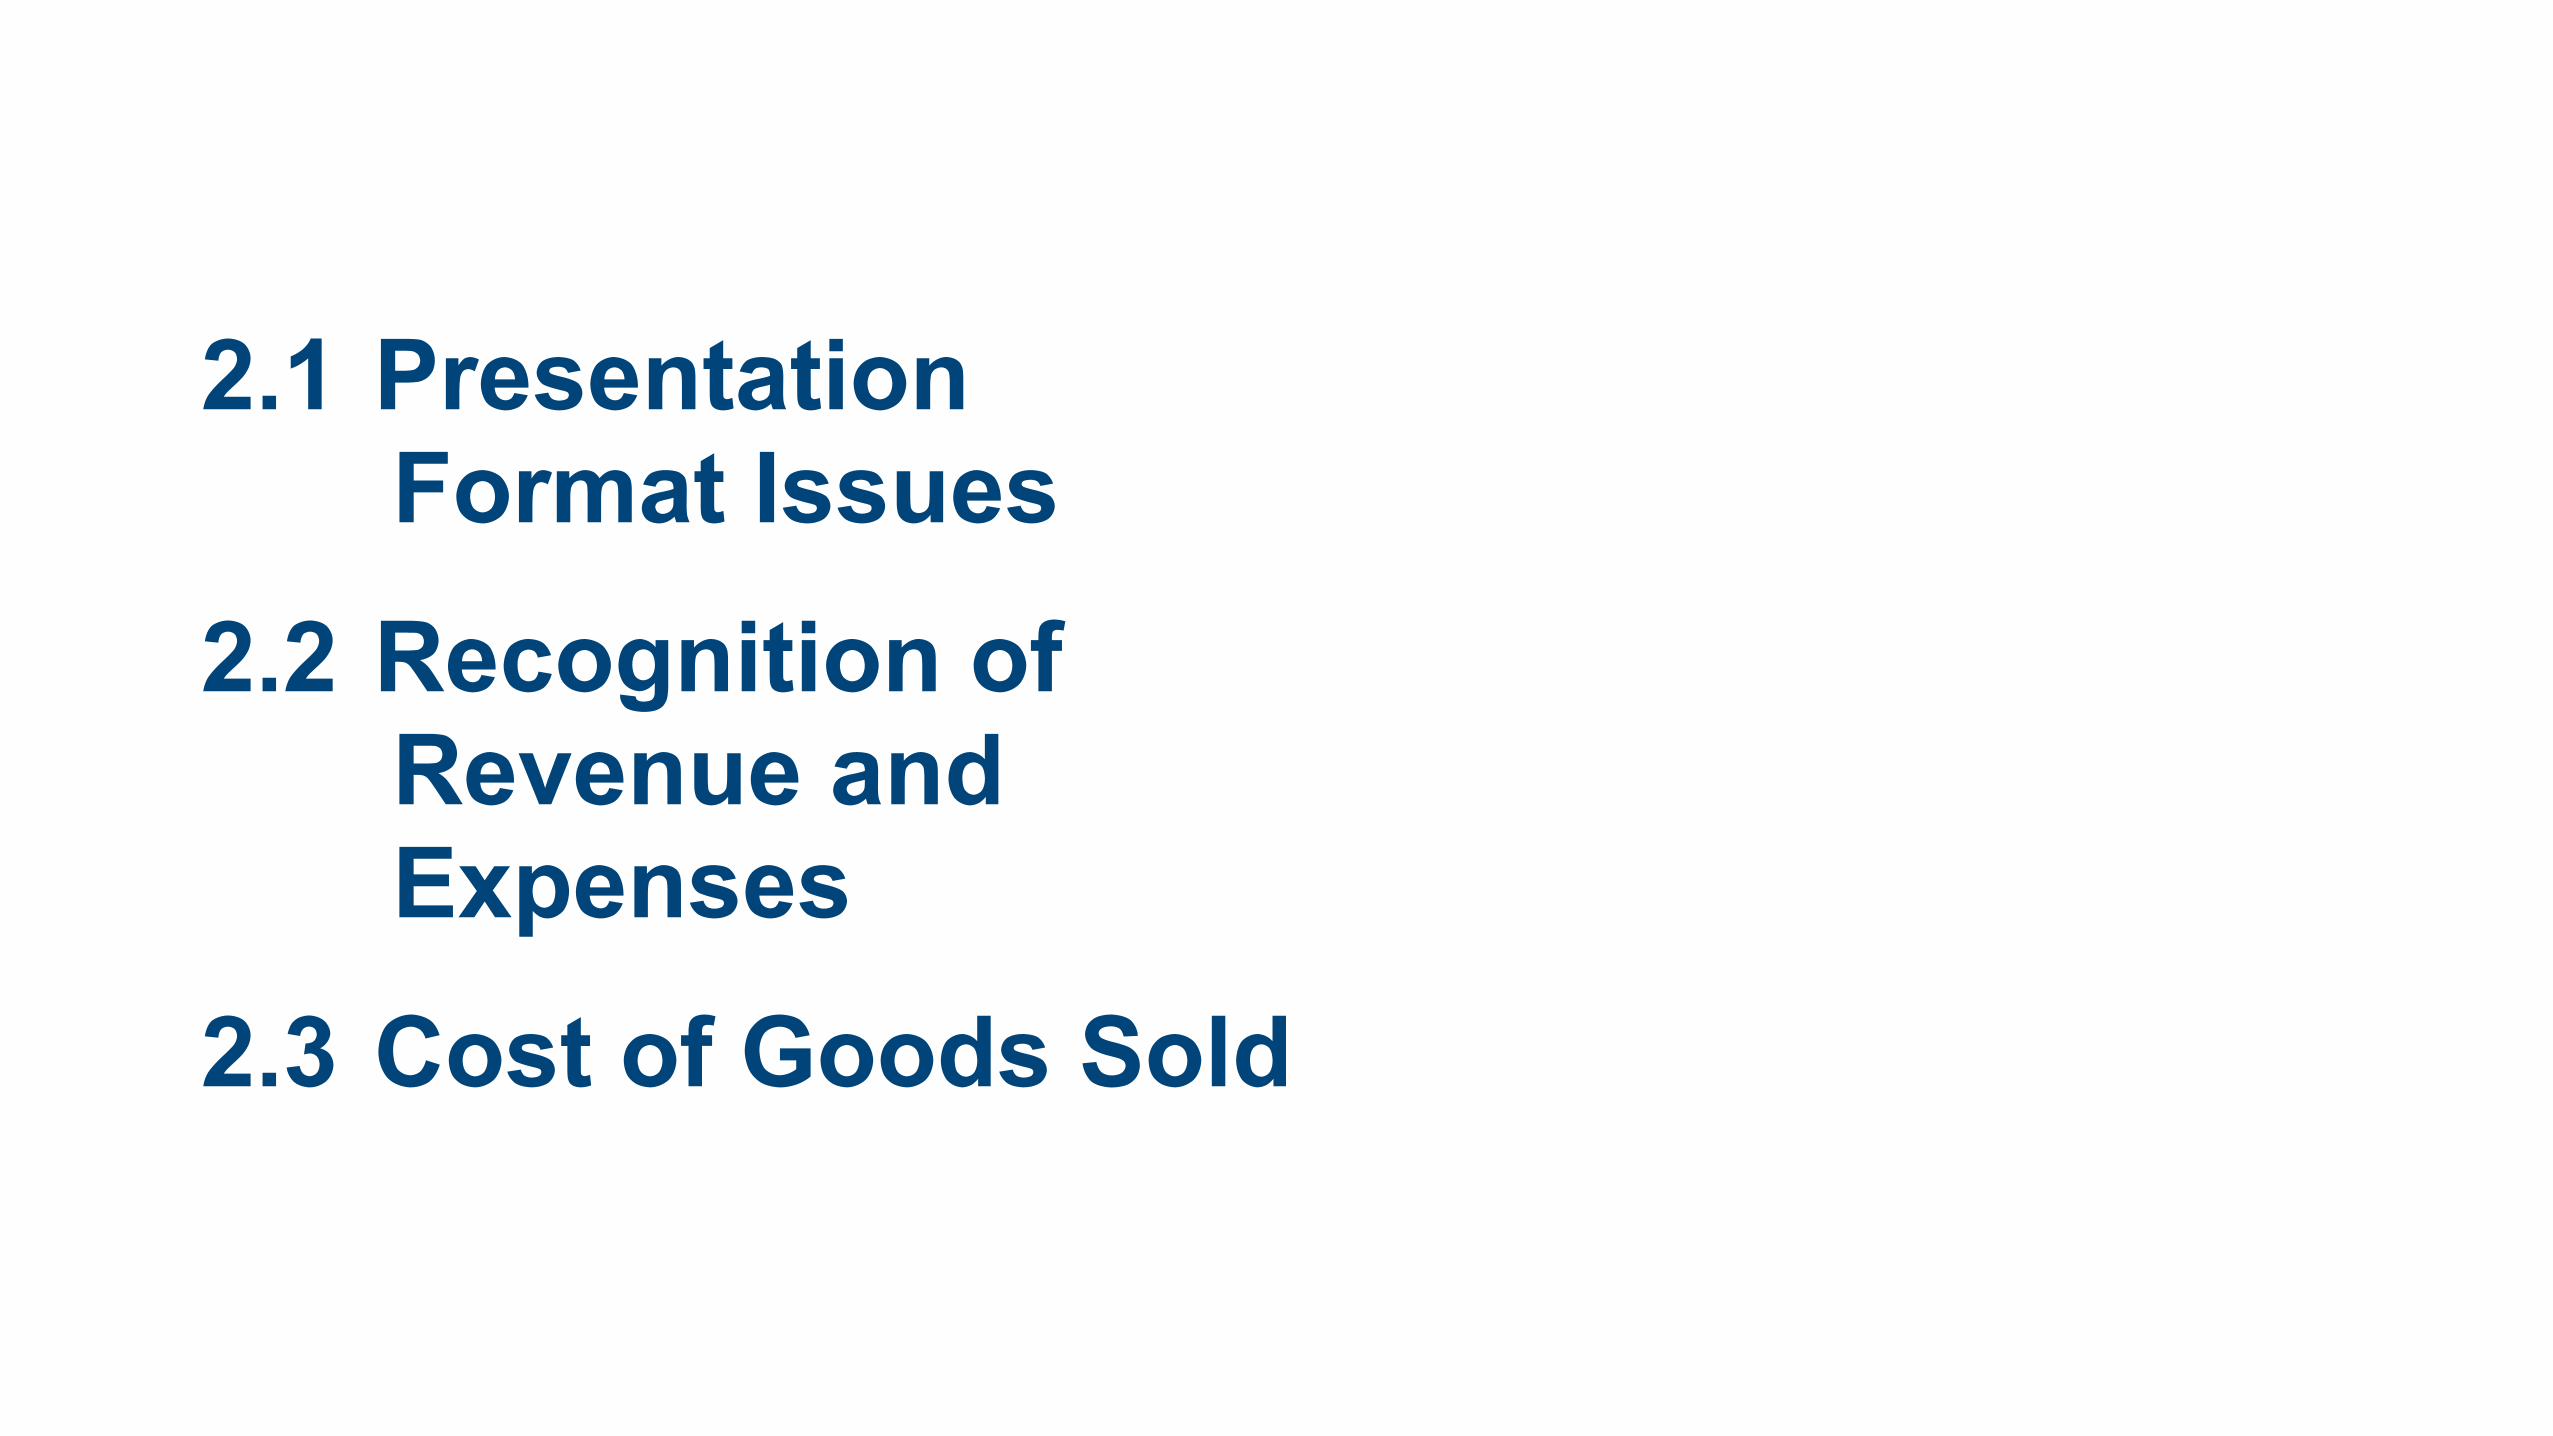
2.1 Presentation Format Issues
2.2 Recognition of Revenue and Expenses
2.3 Cost of Goods Sold
2.4 Irregular Items (e.g. Discontinued Operations, Extraordinary Items, etc.)
2.5 Profitability Analysis
2.6 Summary

2.1 Presentation Format Issues

• Multiple components of formatting accounting Income Statements, and other financial statements
• All of which affect the Income Statement, based on performance
• Affecting the Business itself, as an entity

• Organization and Alignment = Key Factor
• Accounting = Oversight
• To re-iterate:
• Financial Accounting = Business Operations, not Individual Owners

• Income Statement
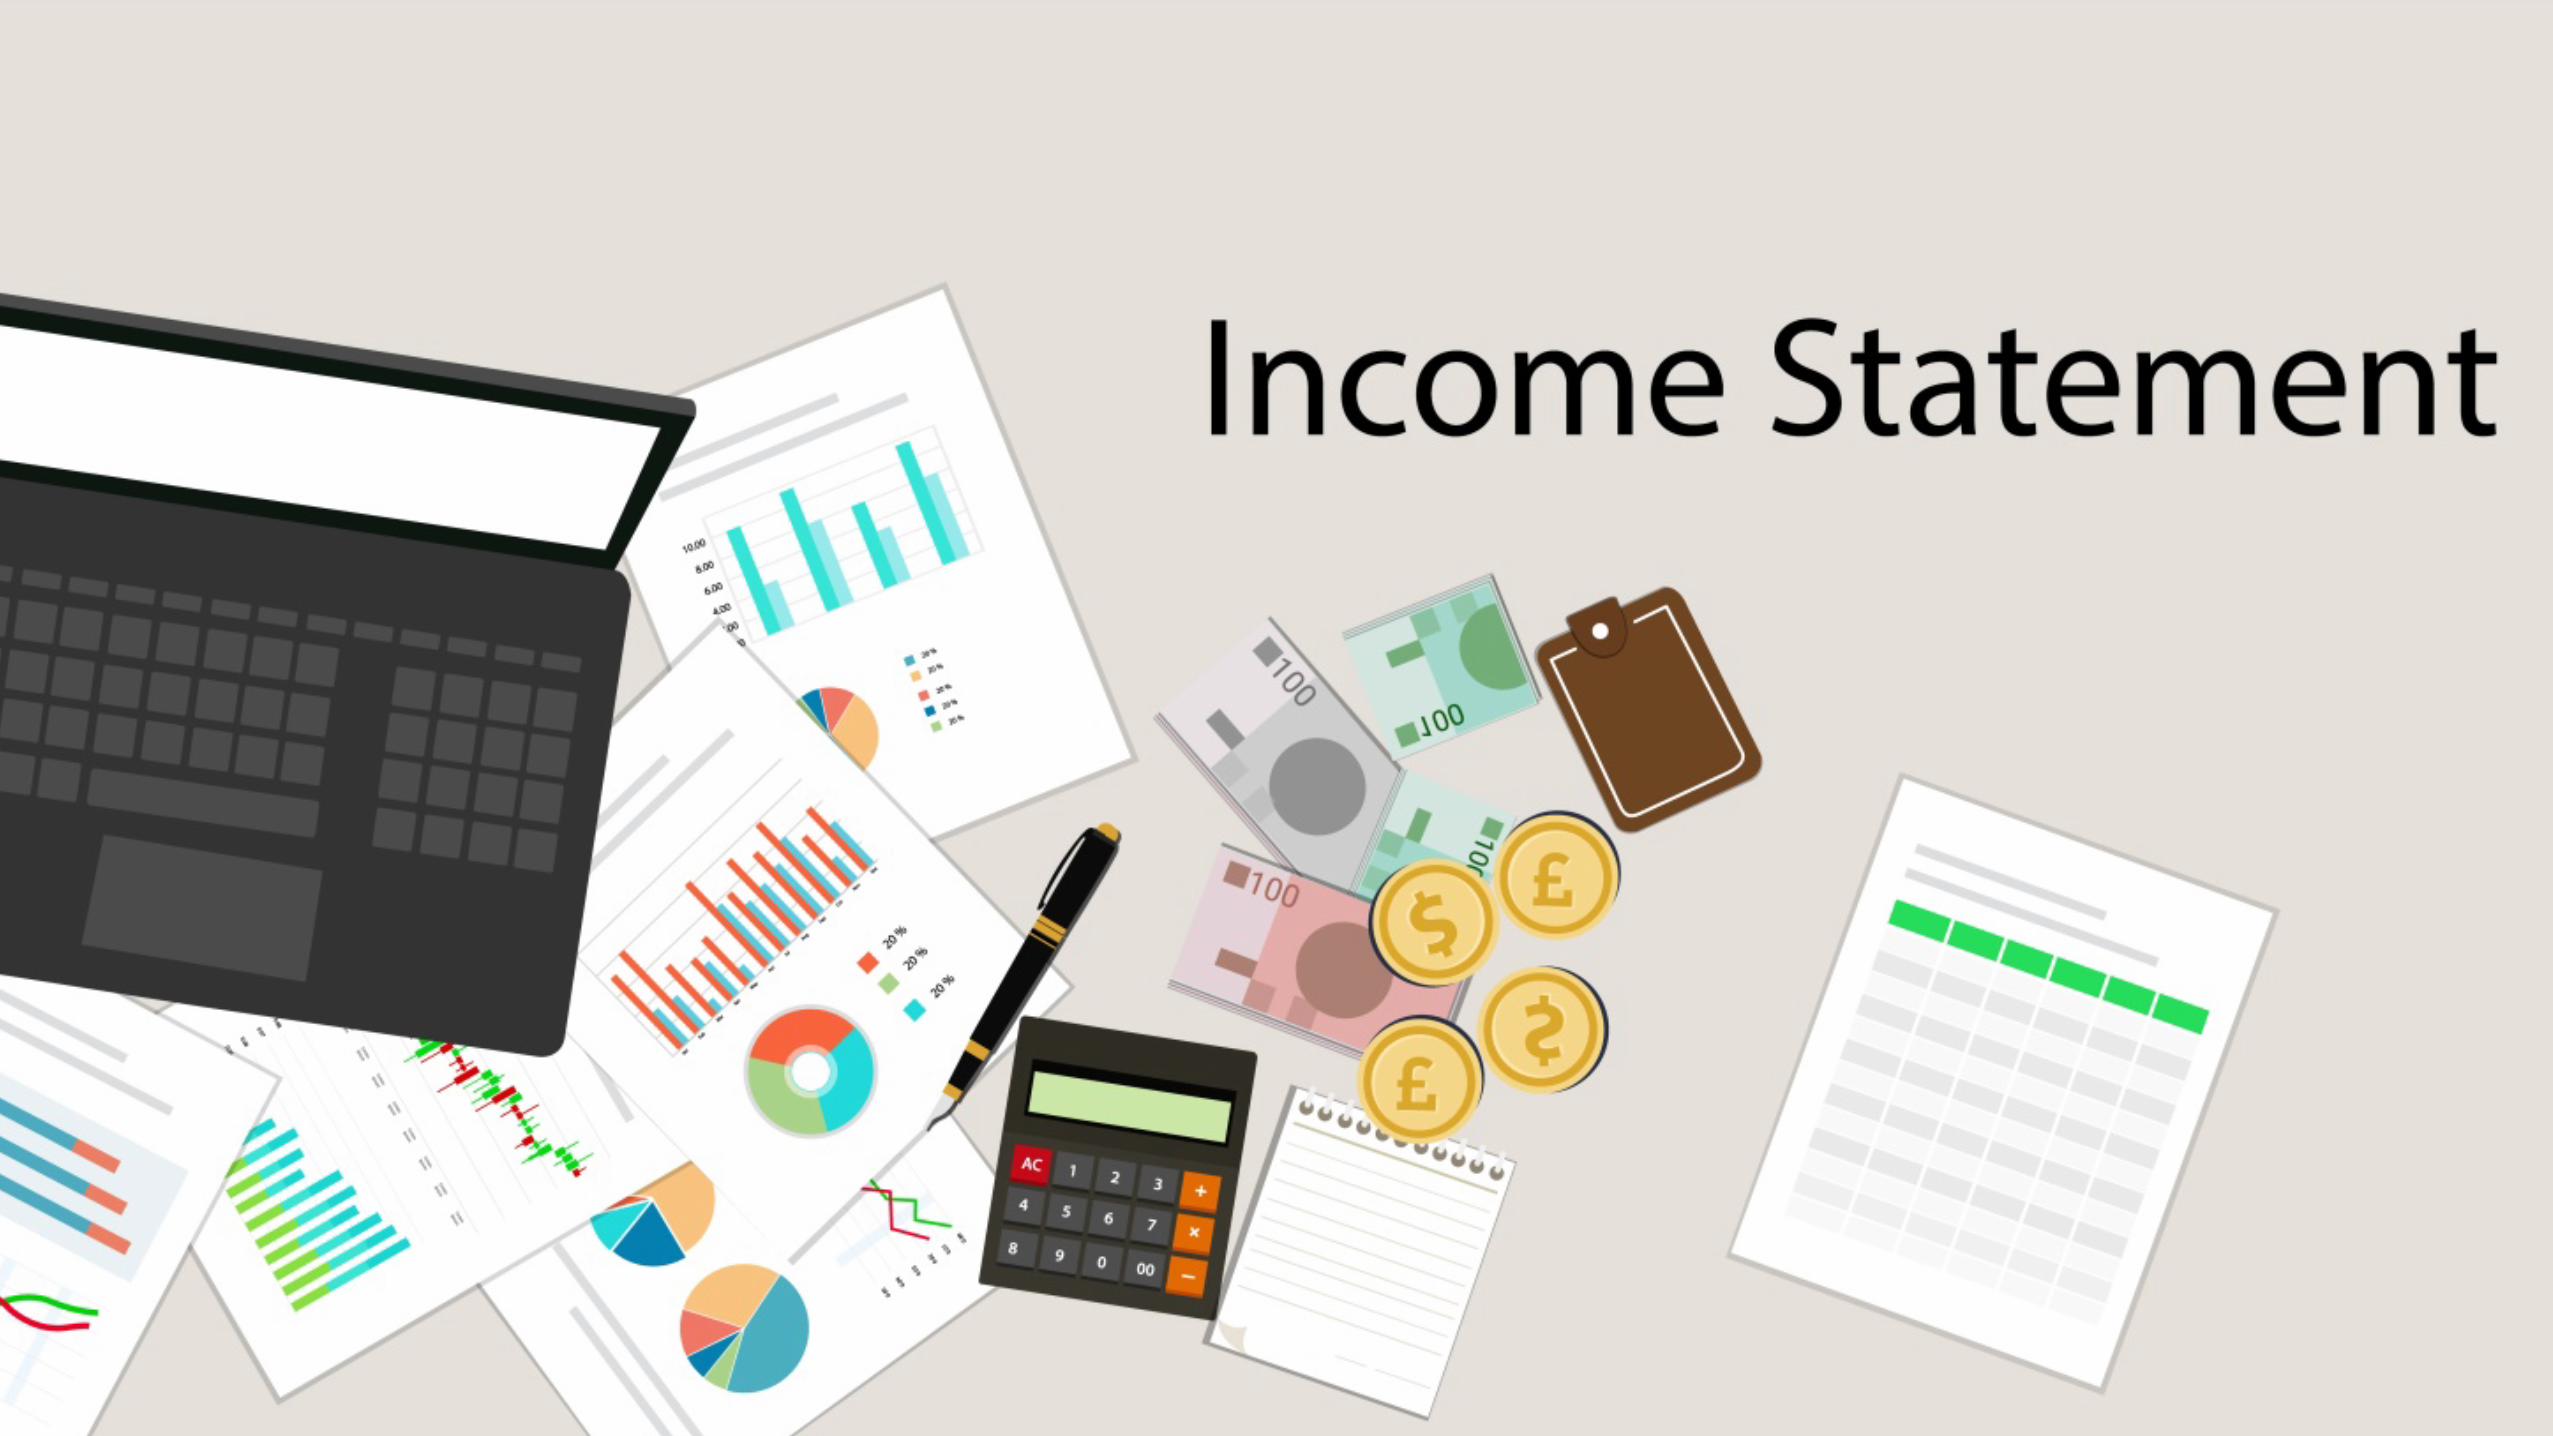
• The financial report that shows the results of business operations over a period of time.

• This period of time can vary: Owner’s discretion, or Fiscal Period

• A month, a quarter or a year.
• Statement that measures the outcomes
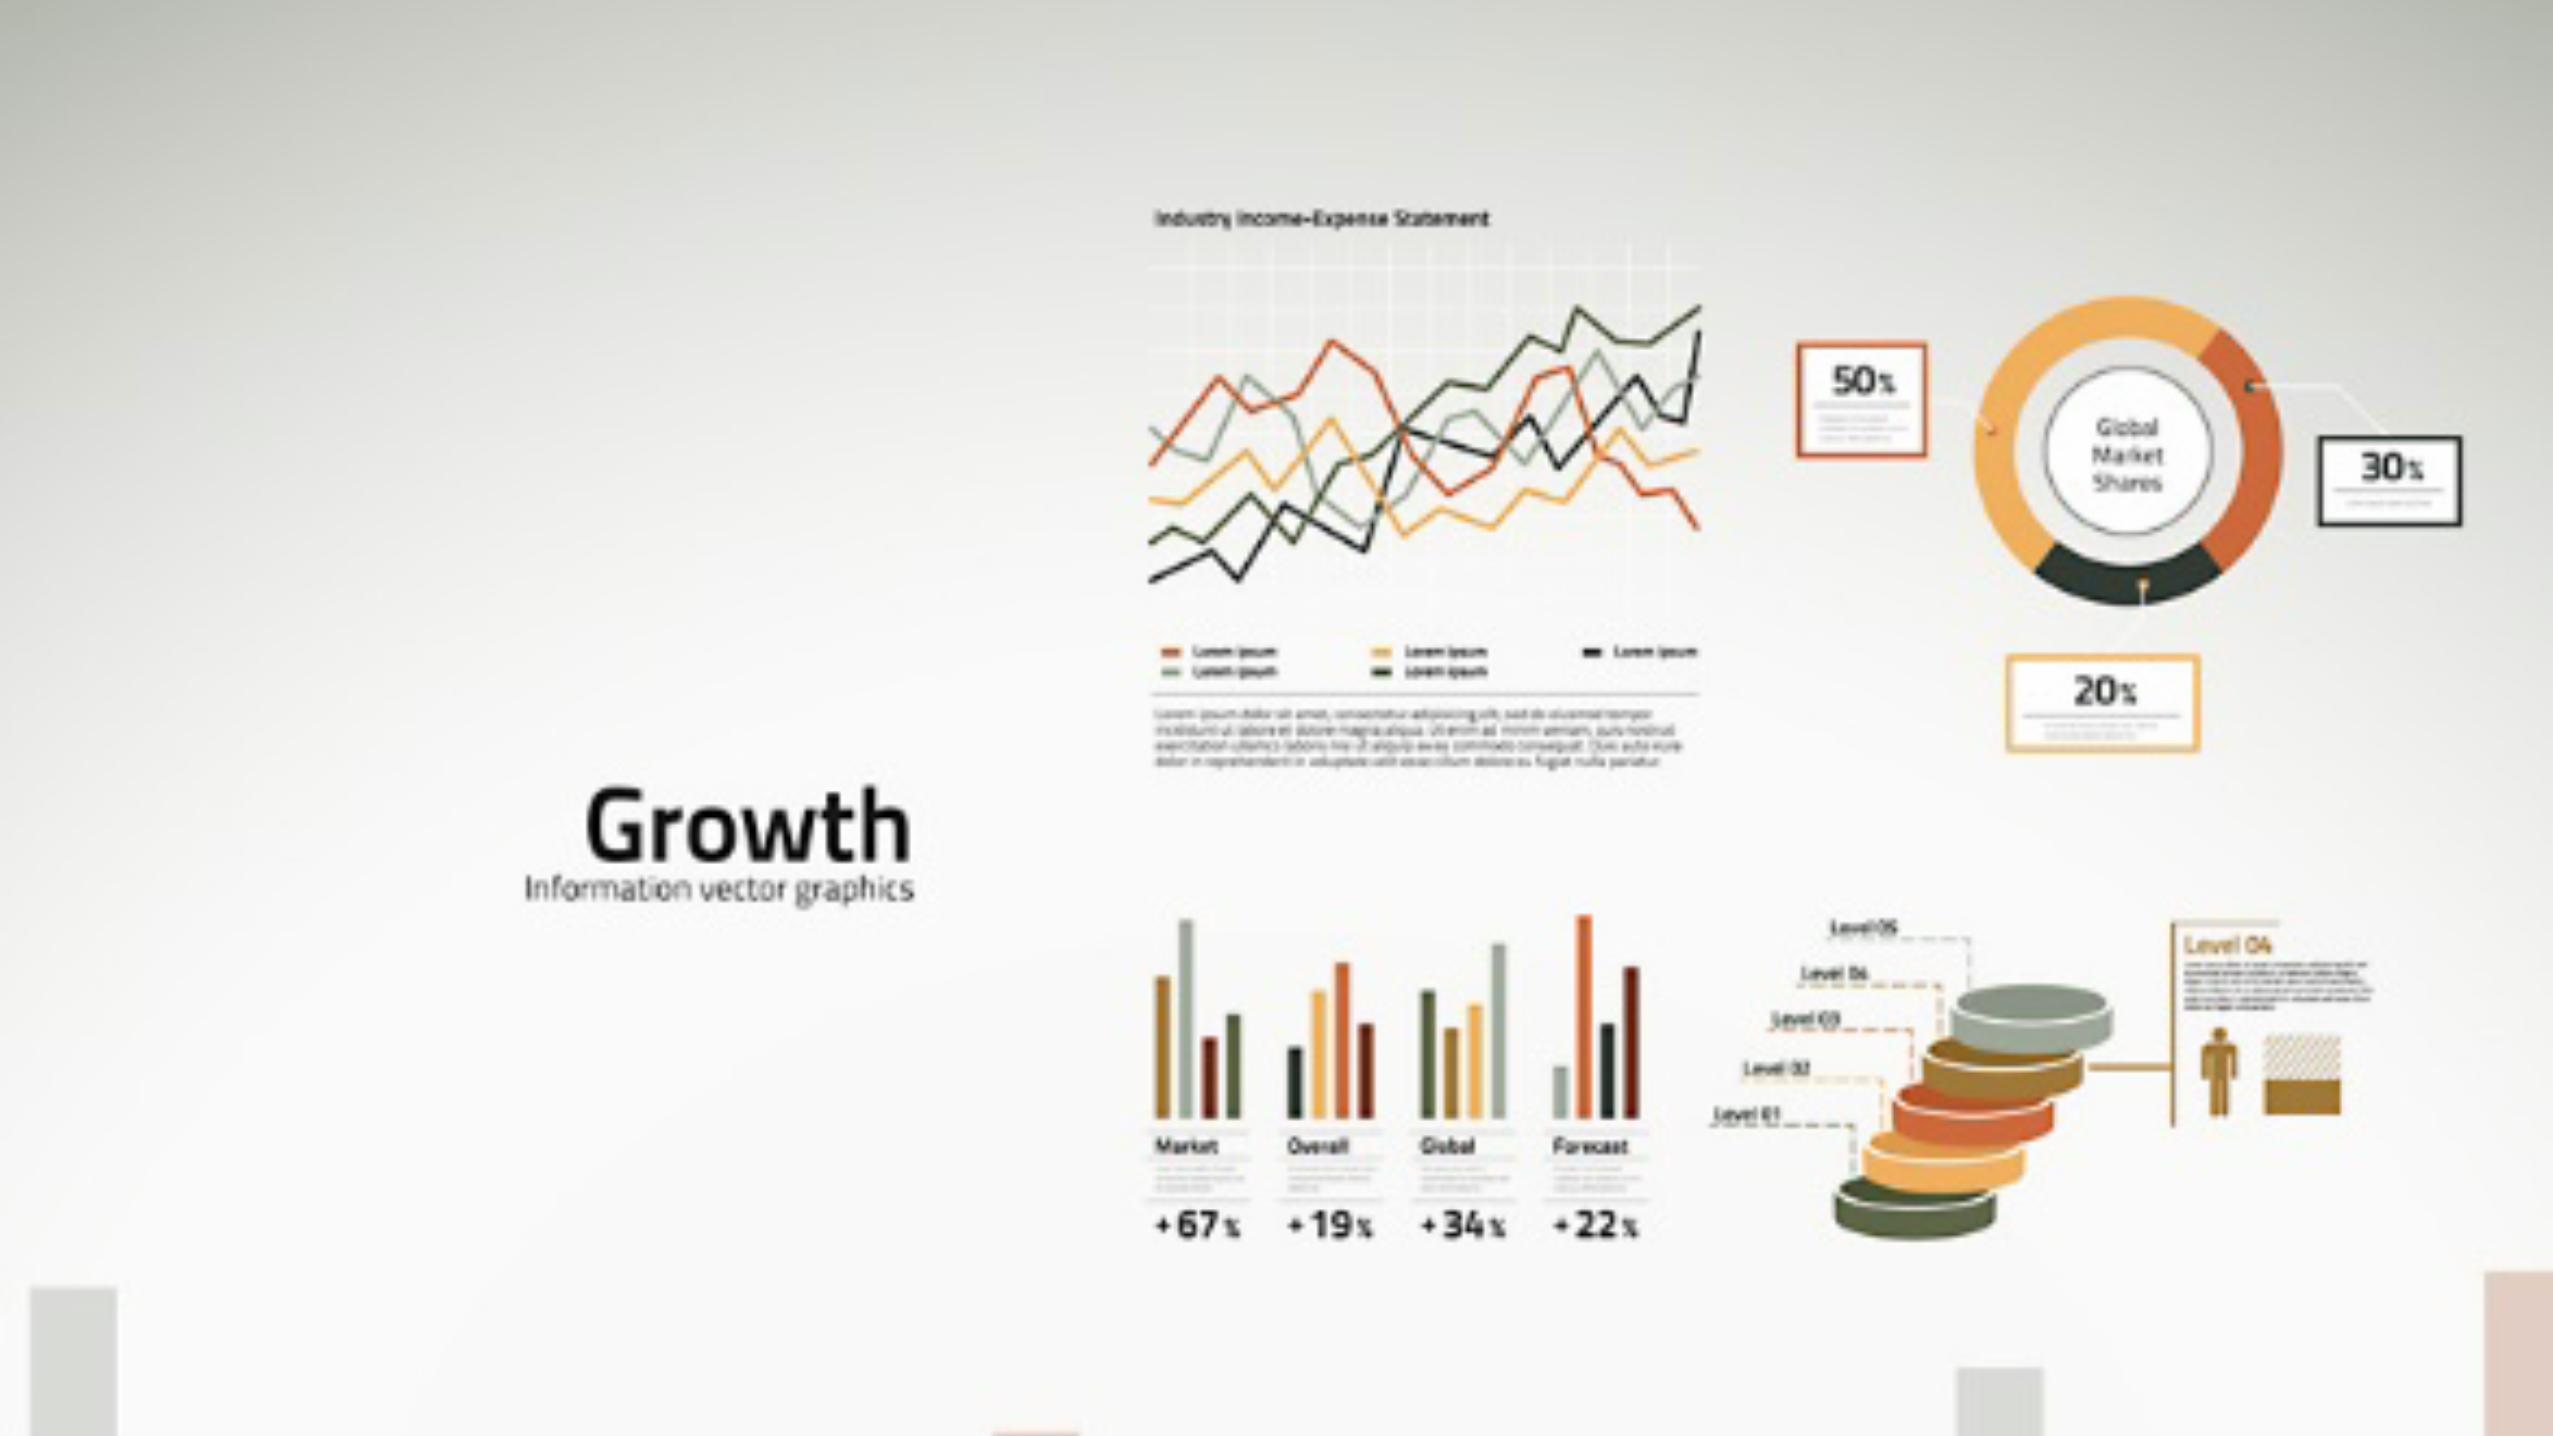
• Gauges Growth
• Growth occurs over time

• Time period documentation:
• Can conflict with a Balance Sheet

• Balance Sheet: account balances for one exact date, by majority.

• Hence, a formatting “issue”

• Book keeping = Paramount


• Net Income:

• Core of the Income Statement


• Accounts that explain why Assets went Up

• Stems from business operations

• Assets “Up”:

• Profit Sales


• Liquidity

• And even possibly:

• Investments


• Another account goes up as well:

• Owner’s Equity
• Must be accounted for
• Most important: Owner/Investors

• Both accounts = Value


• Alleviating formatting issues
• Accountants simply use a historical, yet traditional diagram, or chart, of sorts:


• T-Account

• This is a tool to keep track of the ups and downs in accounts, often called a:


• General ledger

• Debtor’s ledger

• Wage Expense ledger

• Payroll ledger
• The Ups go on one side of the T
• The Downs on the other side of the T
• Here’s an example:
2.2 Recognition of Revenue and Expenses

• The income statement is essentially, as Summary.
• It summarizes all the revenue, and expense accounts, into a single number.

• This number is vital, as previously mentioned:

• “Net Income” = Revenue

• Income and Expense accounts are actually just part of Owner’s Equity

• Each help explain increases in Equity, based on earnings

• Income Statement: • Take the number
that appears in the Statement of Owner’s Equity
• Income Statement: • gets combined into
the Final number for Income and Expenses
• Income Statement: • called “owner’s
equity—end of period”
• “Owner’s equity—End of period”
• Appears in the Balance Sheet simultaneously

• Liability section
• Expenses are accounts that explain why assets went down from operations.
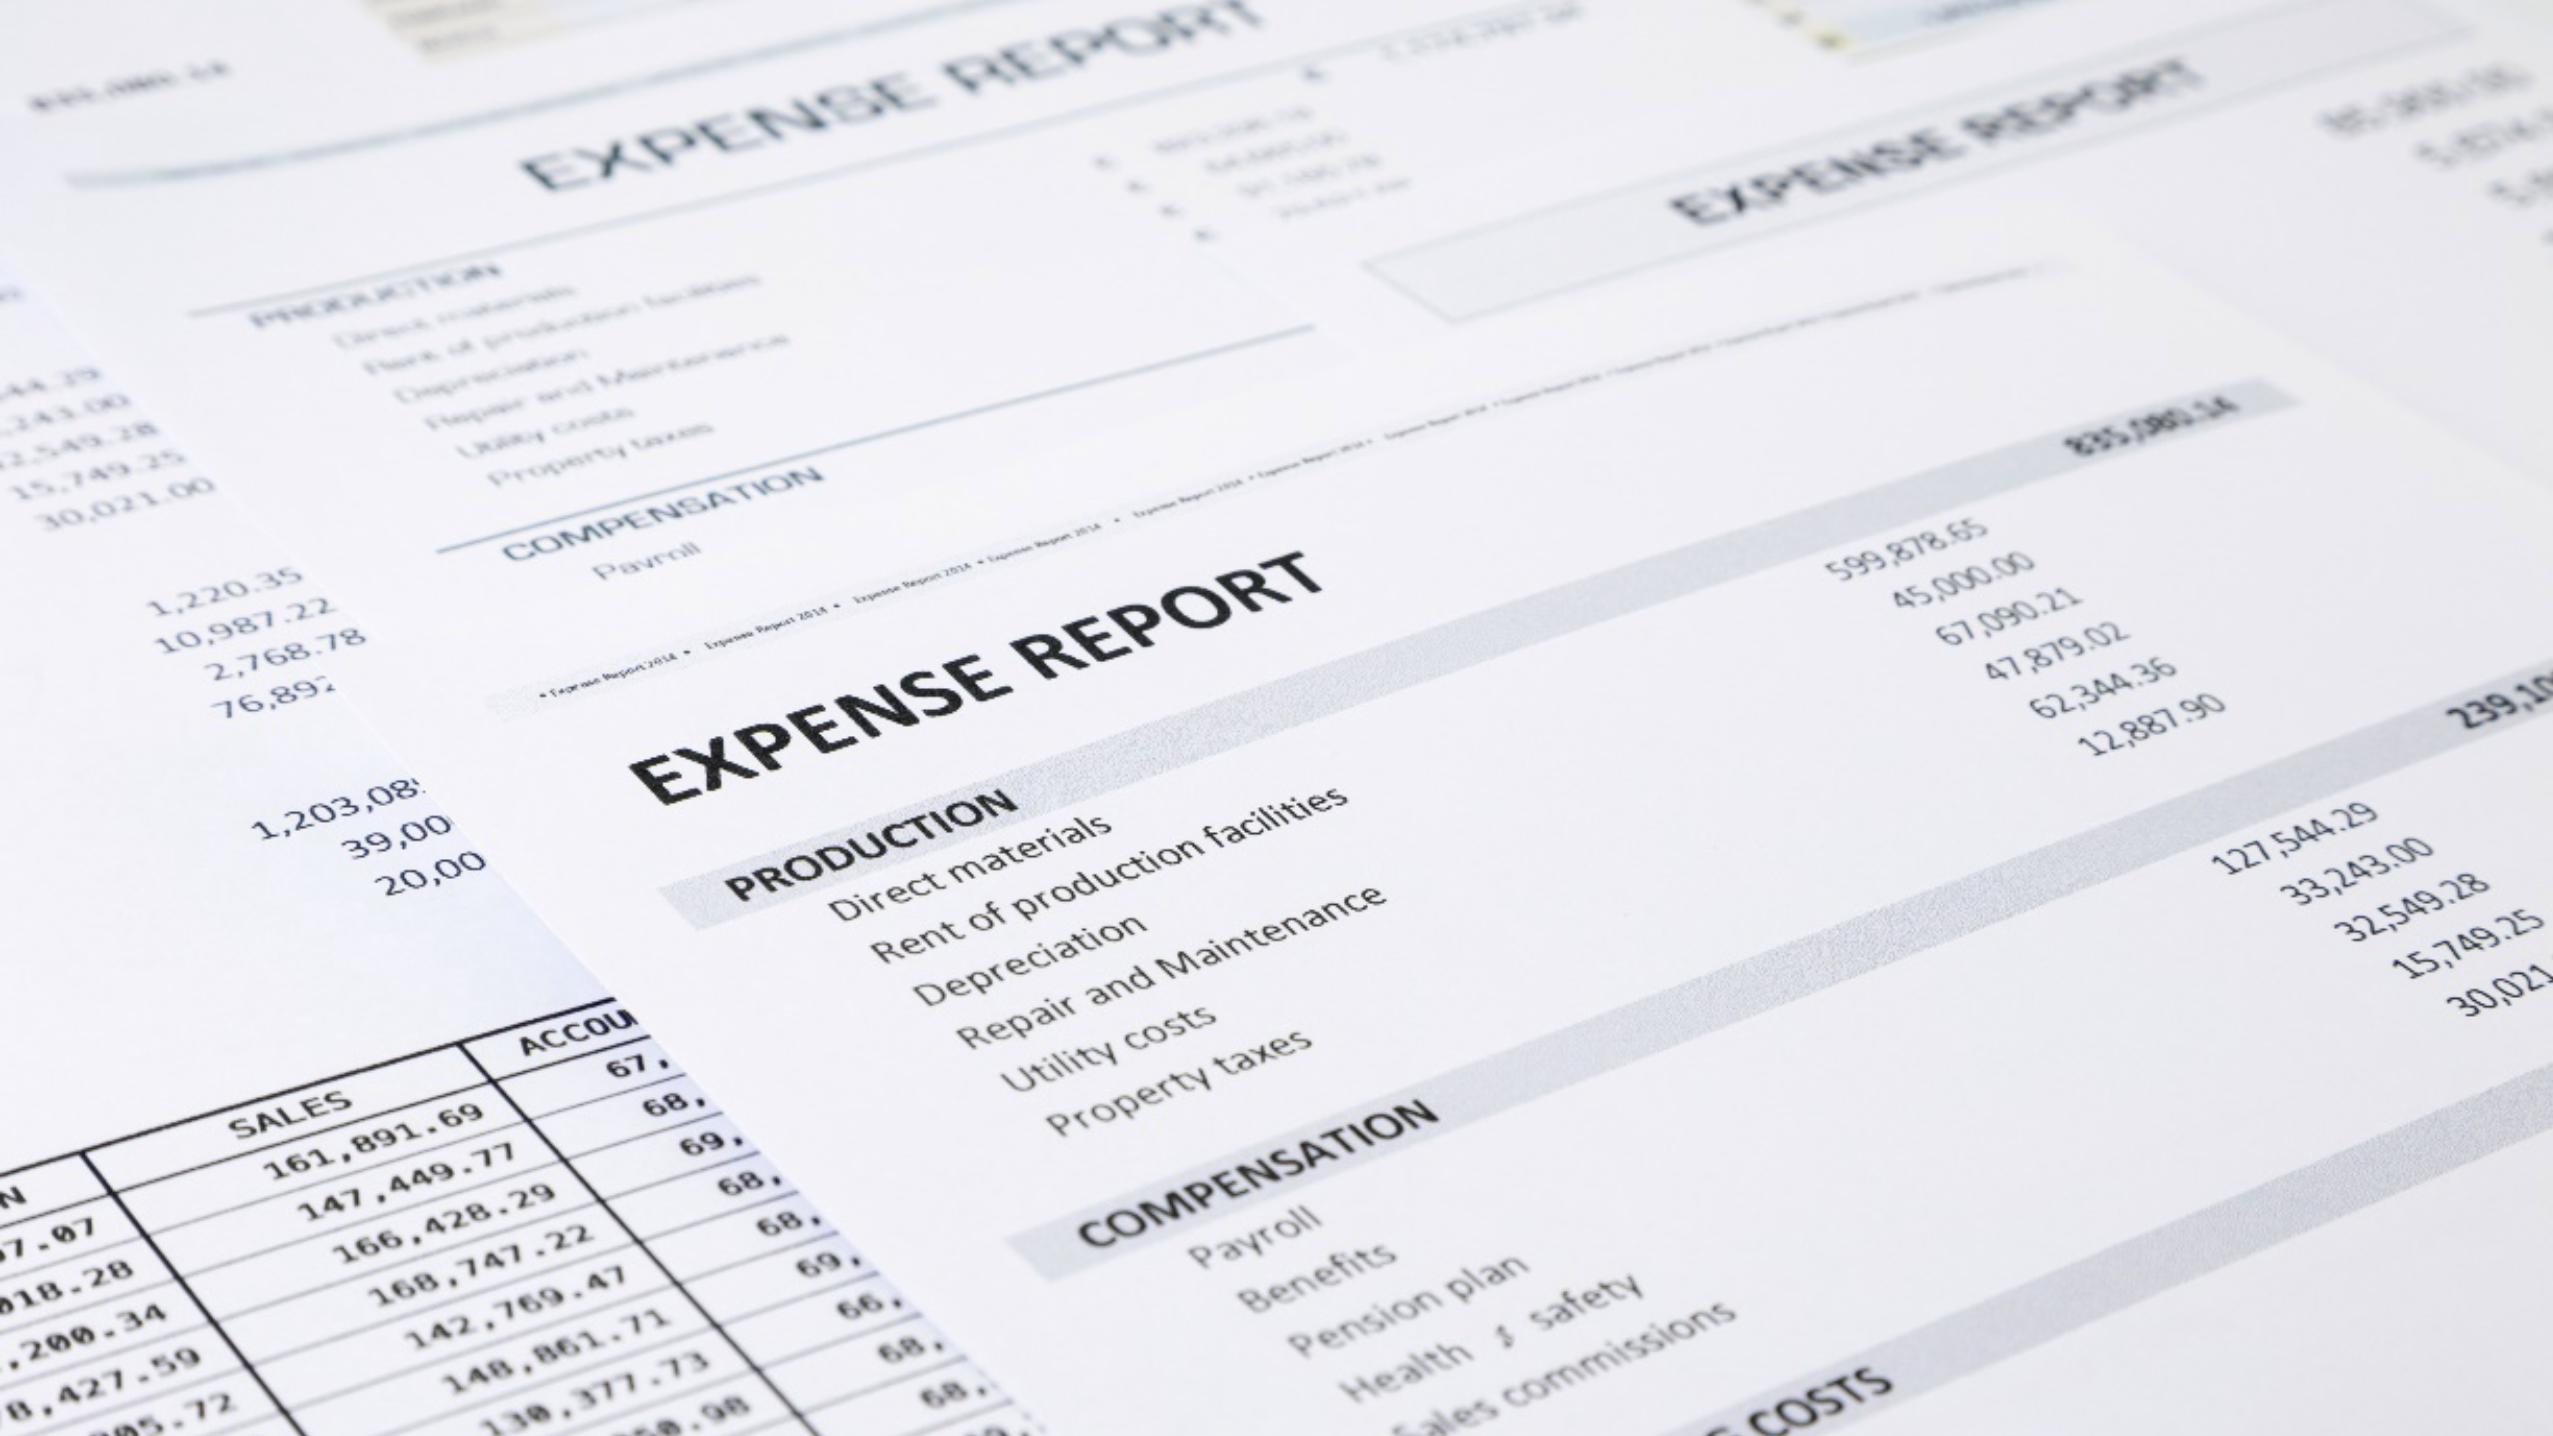
• Expense accounts explain the decreases in equity as a result of using up assets.
• The final part of the liability section includes accounts called Deferred Revenues
• Deferred Revenues are liabilities that result from receiving cash prior to earning the income.

• Annuities

• Charges


• Other income
2.3 Cost of Goods Sold

• Cost of goods sold (CGS)
• Accounting concept
• Businesses calculate on the Income Statement
• For businesses that buy and resell goods
• Cost of goods sold
• A single number on the Income Statement
• Cost of goods sold
• The actual cost to the business =
• “Goods” that it sells
• Other Businesses
• Doctors and Lawyers
• Sell services
• They do not calculate cost of goods sold
• Manufacturers
• Cost of goods sold usually includes:
• Three amounts (3)

• Materials

• Labor

• Overhead
• Cost of Goods Sold:
• Two (2) important formulas
1. Gross Profit Formula:

2. Income Statement Formula:
2.4 Irregular Items (e.g. Discontinued Operations, Extraordinary Items, etc.)


• Discontinued operations:
• Both the income and expenses from discontinued operations =
• Netted into a single number
• Then reduced by income tax expense, or income tax savings.

• Extraordinary gains and losses:

• Losses lower income taxes at a certain point
• In this section, gains and losses:
• On business equipment, or;
• Per results of lawsuits:
• NOT included
2.5 Profitability Analysis


• Profitability analysis

• Allows businesses to forecast the lucrativeness of an existing project
• Profitability analysis also:
• Permits an anticipation of sales potential specific to such elements, like:

• Customer age

• Geography

• Product types

• 3 Types of Profitability Analysis

• Horizontal Analysis

• Ratio Analysis


• Vertical Analysis

2.6 Summary
• PROFITABILITY ANALYSIS
• Allows businesses to forecast the lucrativeness of an existing project
• Permits an anticipation of sales potential specific to such elements
• BOTH are applicable to Financial Statements and Business Operations

Sales potential: 1. Specific to formula
that I will display for the exam in a few minutes, and;
2. Three particular Elements
Customer Age
• Trends per ages (toys, technology, clothing) • Needs (infants, toddlers, pre-teen, adult,
elderly) • Motivations (based: Education level/Social
Status)
Geography: • Urban • Suburban • Rural
Each type of jurisdiction has the potential to drive sales, and allow for forecasting
Product Types
• What business activity is geared towards
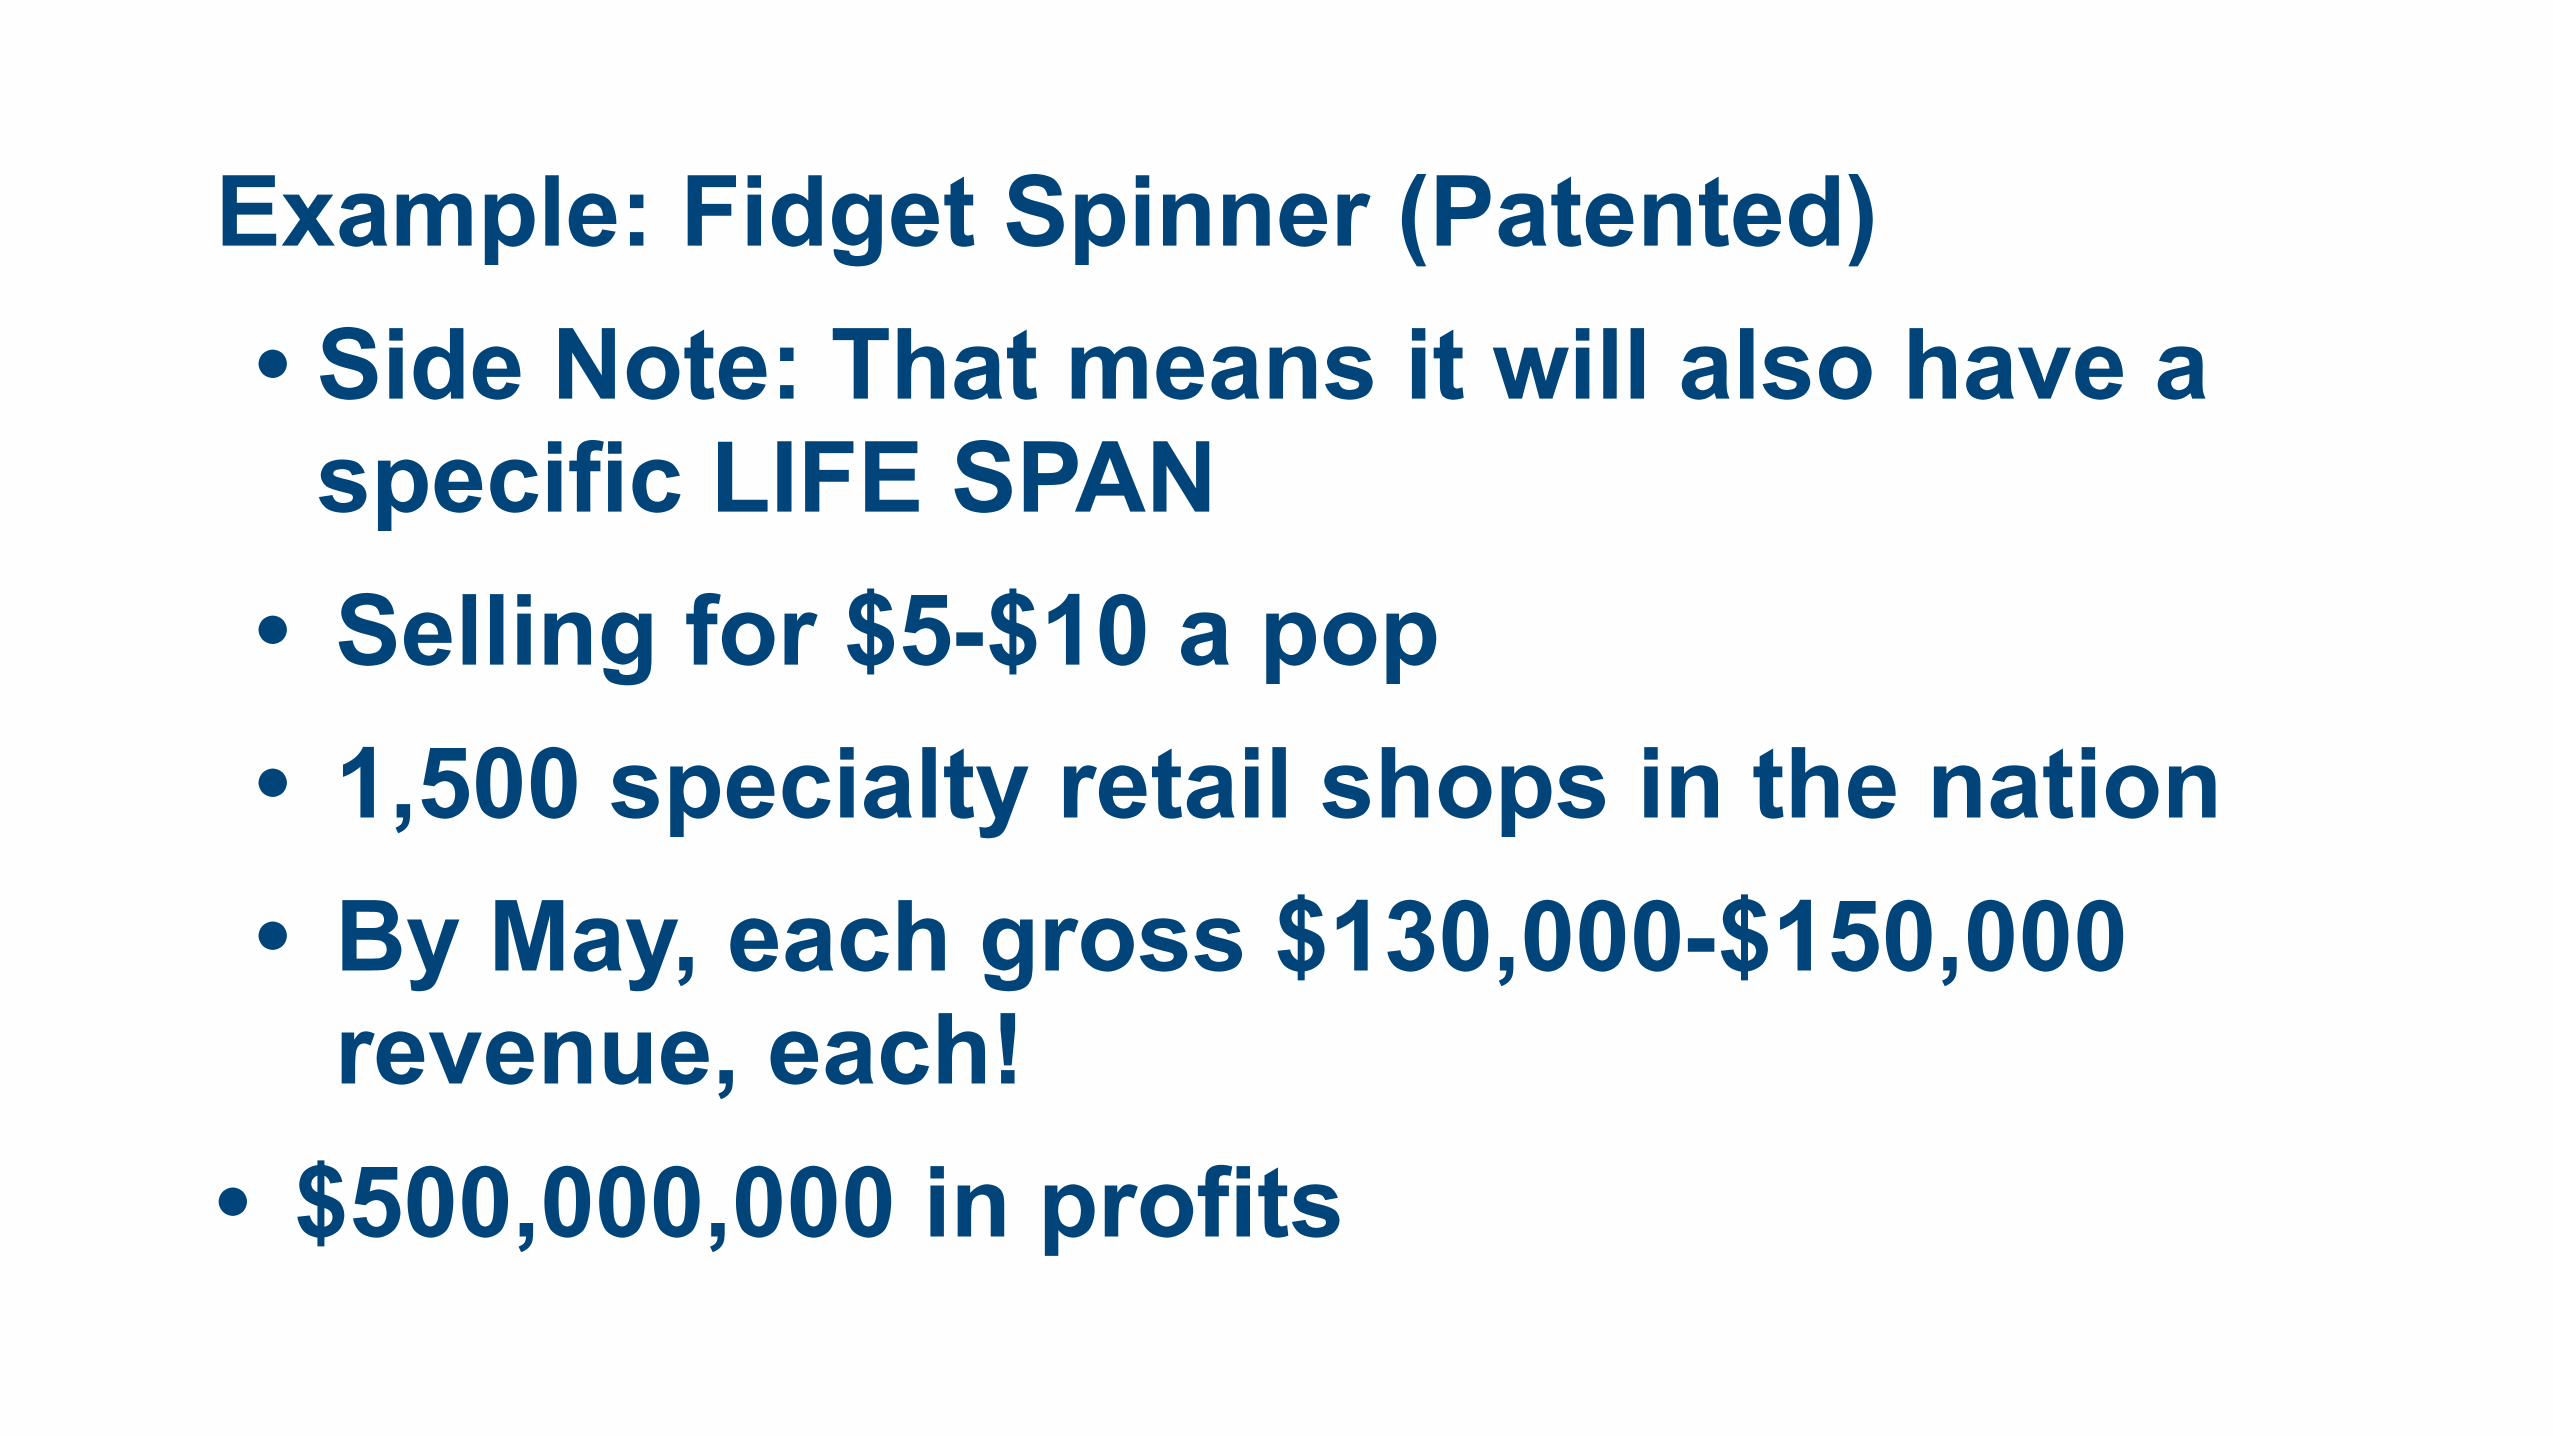
Example: Fidget Spinner (Patented) • Side Note: That means it will also have a
specific LIFE SPAN • Selling for $5-$10 a pop • 1,500 specialty retail shops in the nation • By May, each gross $130,000-$150,000
revenue, each! • $500,000,000 in profits
3 Types of Profitability Analysis
Horizontal analysis: • Used when a company compares its
current results to a previous year • LESS COMPUTATION
Ratio analysis: • Used when a company computes a ratio
from various numbers on the financial statements in order to analyze results. • INVOLVES THE MOST MATH AND
COMPUTATION
Vertical analysis: • Used when a company compares all the
numbers of a financial report with a key number from the report
• SECOND MOST COMPUTATION
Gross margin tells you about the profitability of your goods and services. It tells you how much it costs you to produce the product. It is calculated by dividing your gross profit (GP) by your net sales (NS) and multiplying the quotient by 100:
Exam Question: Gross profit margin is useful for
evaluating….?
Answer: Profitability
Gross Margin = Gross Profit/Net Sales * 100
GM = GP / NS * 100
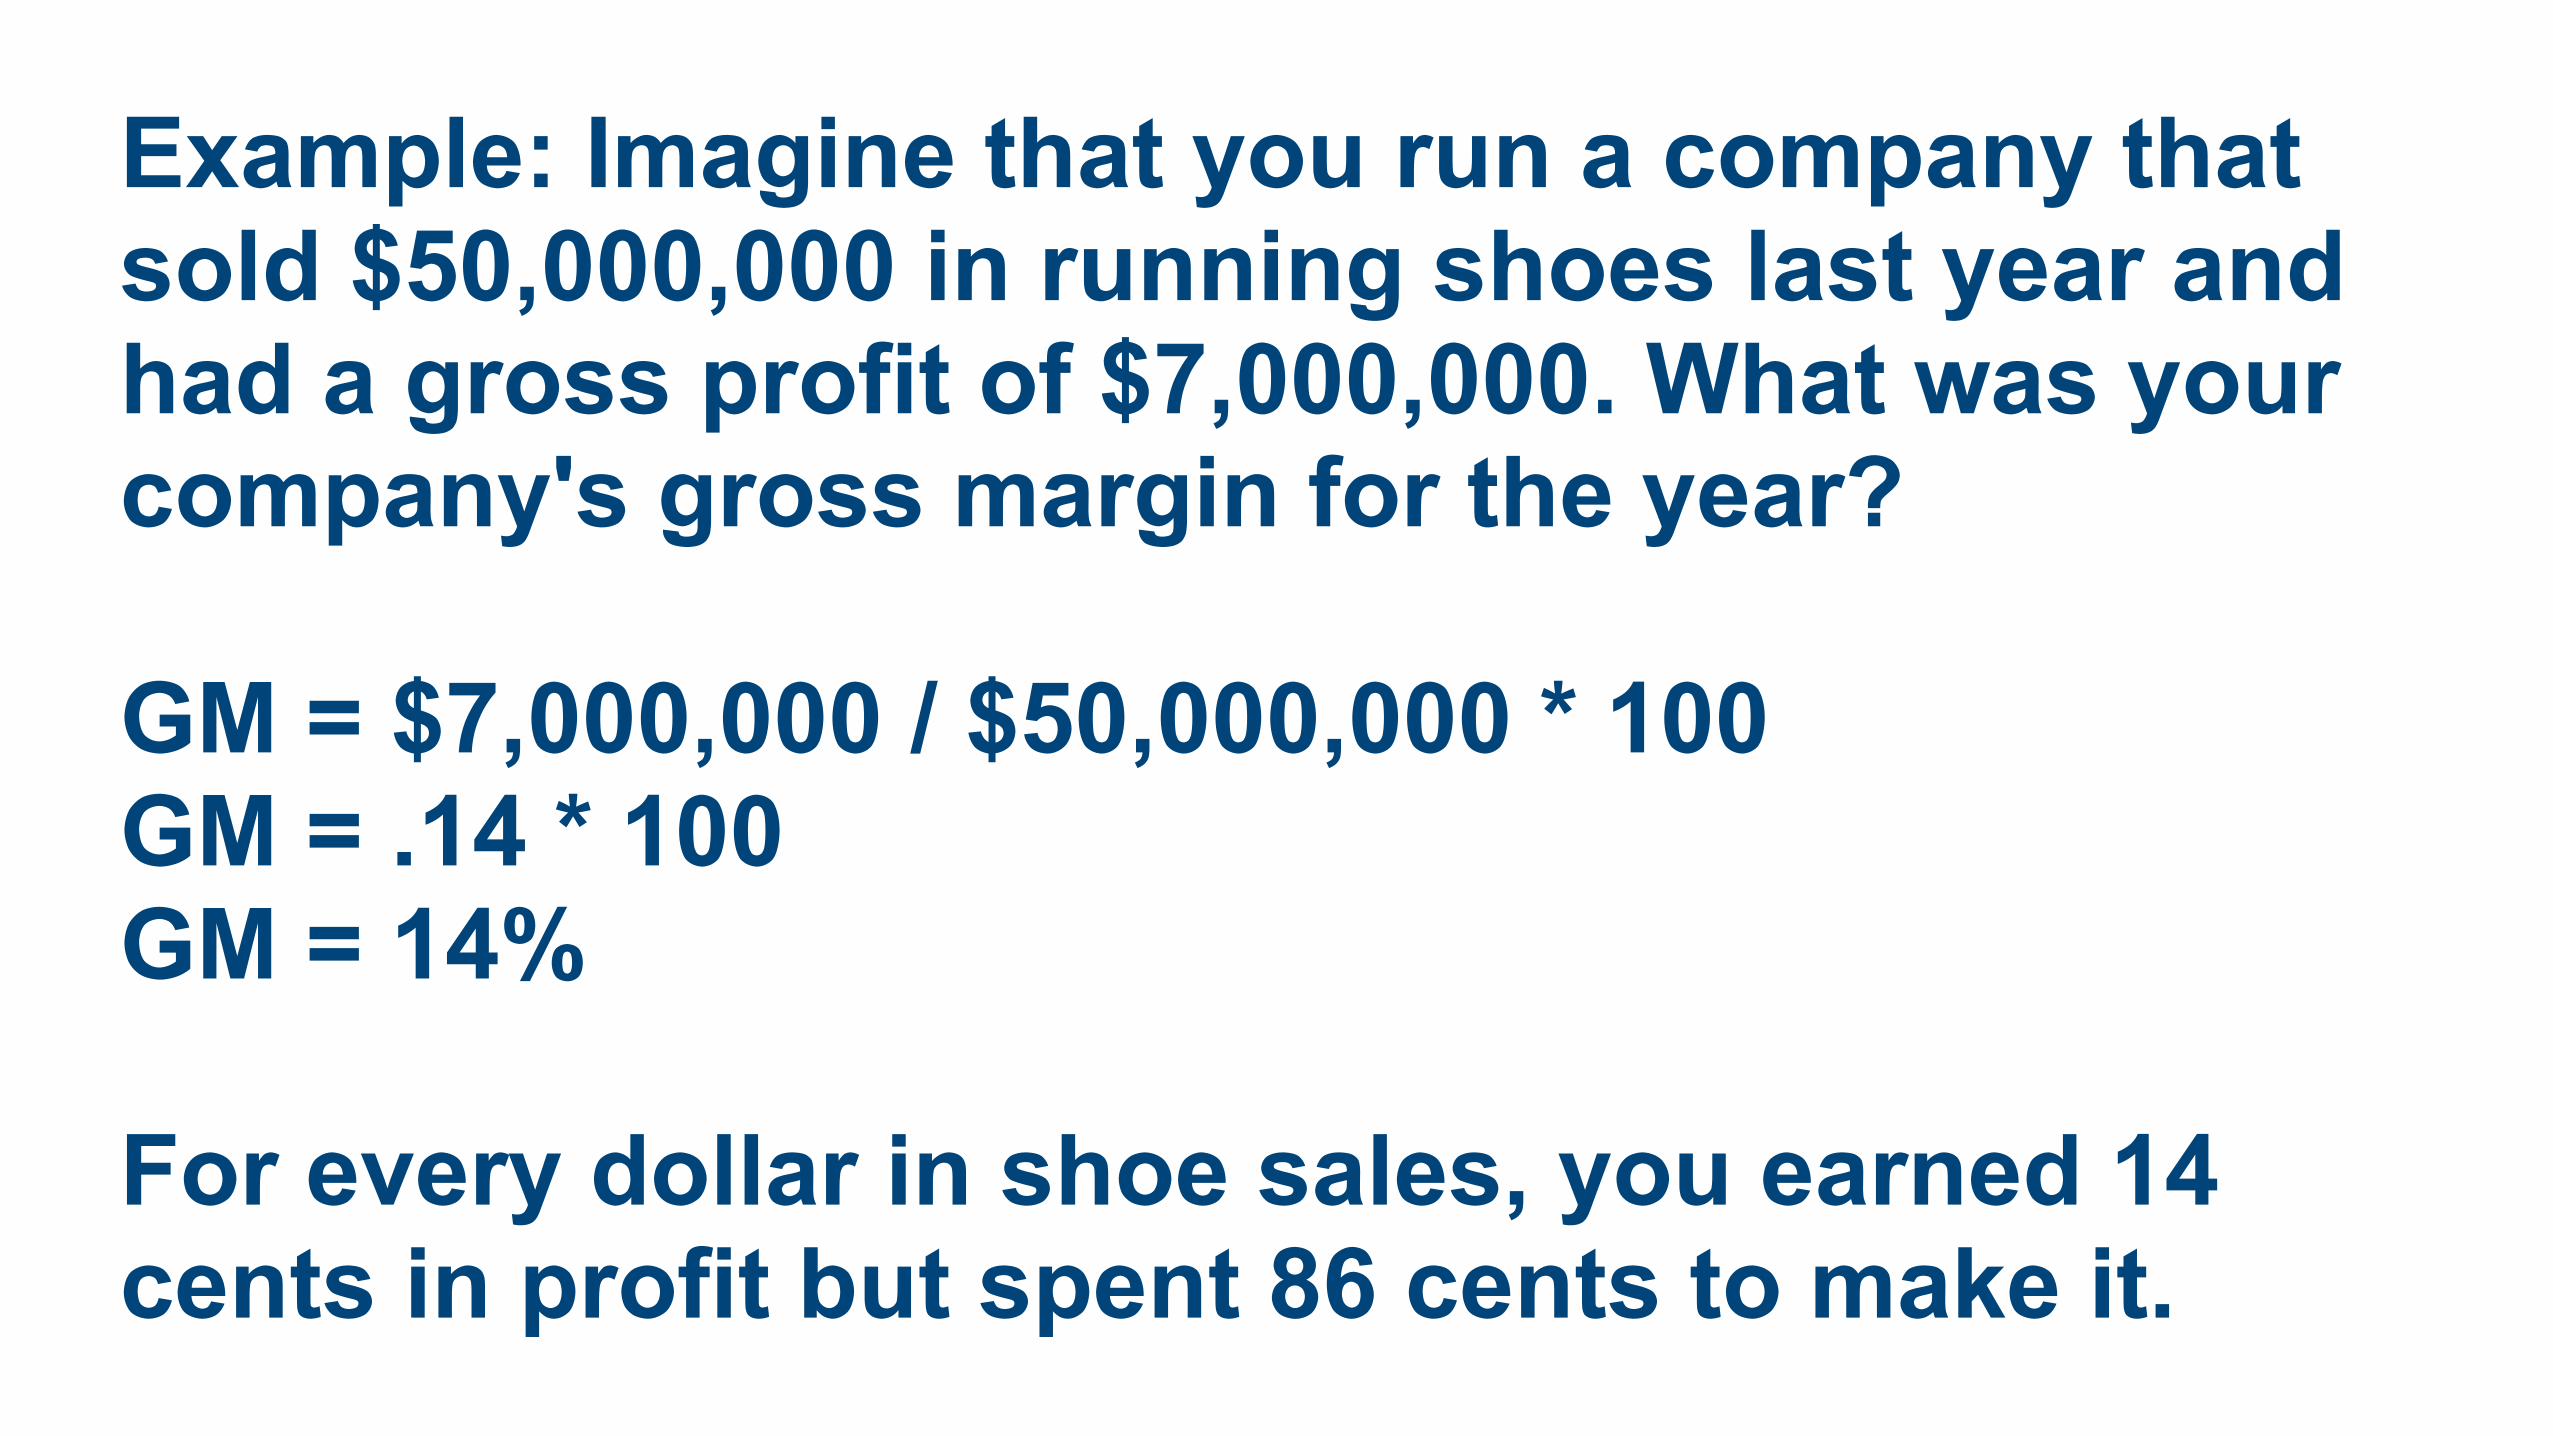
Example: Imagine that you run a company that sold $50,000,000 in running shoes last year and had a gross profit of $7,000,000. What was your company's gross margin for the year?
GM = $7,000,000 / $50,000,000 * 100 GM = .14 * 100 GM = 14%
For every dollar in shoe sales, you earned 14 cents in profit but spent 86 cents to make it.