Embed Size (px)
Citation preview

Waterbury-Oxford Airport FAR Part 150 Noise Study
FINAL Page 2-1
2.0 BASELINE NOISE ANALYSIS Chapter Organization The initial planning for the Waterbury-Oxford Airport (OXC) Federal Aviation Regulations (FAR) Part 150 Noise Study began in 2004. At that time, 2003 was the most recent full-year of recorded airport activity. The information presented in this chapter, including the noise analysis and contours, is based on Recorded 2003 and Forecast 2008 activity at OXC. Prior to the release of the Draft Report (May 2008), the Federal Aviation Administration (FAA) requested updated noise analysis and contours for the most recent full-year of activity (2007) and a forecast five-year period (2012). Chapter 5 presents the noise contour updates for Recorded 2007 and Forecast 2012 activity at OXC. The updates in Chapter 5 were undertaken to satisfy the FAA’s time-period policy for submission of a Noise Study. Baseline Noise Analysis – Recorded 2003 & Forecast 2008 Activity The FAR Part 150 process must include a thorough examination of the existing aircraft noise generated by an airport. As such, existing or “baseline” aircraft noise levels were generated for OXC. The baseline noise levels presented in this chapter were developed for year 2003 and 2008 expected aircraft activity levels. This chapter also provides background information regarding noise characteristics and measurement. As described above, Chapter 5 presents the noise contour updates for recorded 2007 and forecast 2012 activity at OXC. Note that the “baseline” noise levels were generated using existing airport flight procedures, and do not consider any potential abatement procedures or other mitigation measures. As such, the baseline noise levels presented in this chapter will be used in subsequent analysis to assess future land use compatibility and identify the need for mitigation in residential areas and other noise-sensitive locations. This chapter includes the following components:
• Measurement of Aircraft Noise • Existing Conditions • Future Conditions • Baseline Noise Summary
Waterbury-Oxford Airport FAR Part 150 Noise Study
FINAL Page 2-2
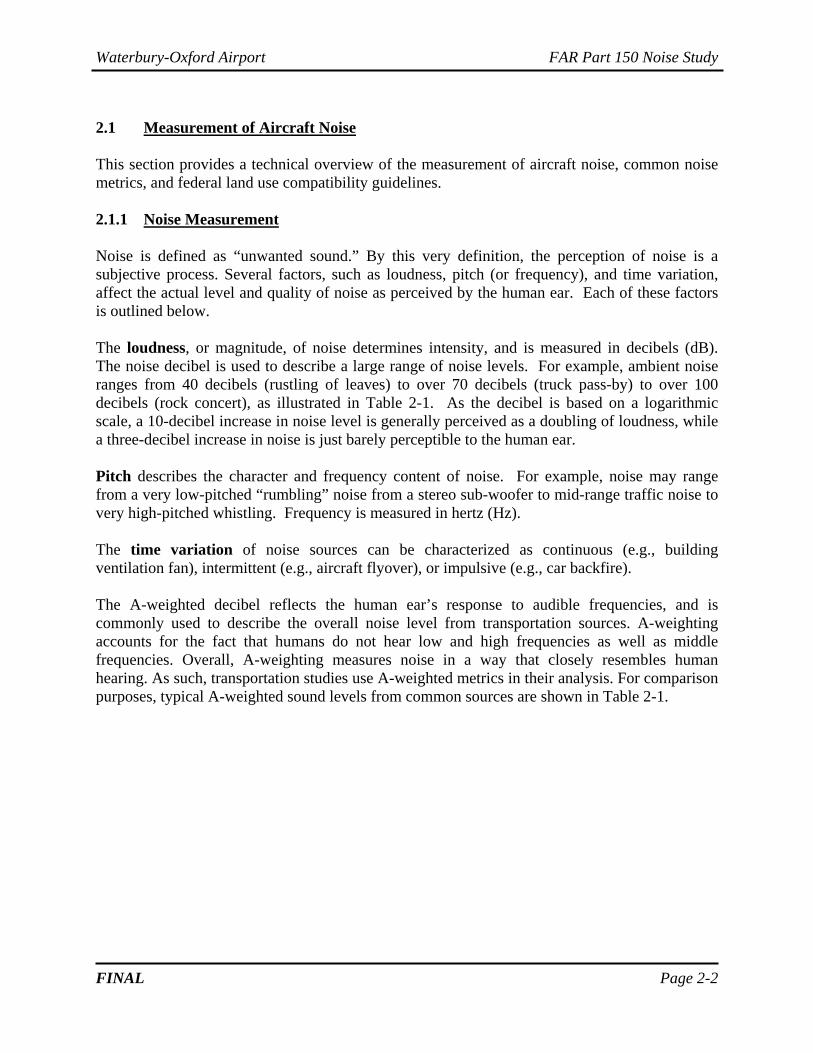
2.1 Measurement of Aircraft Noise This section provides a technical overview of the measurement of aircraft noise, common noise metrics, and federal land use compatibility guidelines. 2.1.1 Noise Measurement Noise is defined as “unwanted sound.” By this very definition, the perception of noise is a subjective process. Several factors, such as loudness, pitch (or frequency), and time variation, affect the actual level and quality of noise as perceived by the human ear. Each of these factors is outlined below.
The loudness, or magnitude, of noise determines intensity, and is measured in decibels (dB). The noise decibel is used to describe a large range of noise levels. For example, ambient noise ranges from 40 decibels (rustling of leaves) to over 70 decibels (truck pass-by) to over 100 decibels (rock concert), as illustrated in Table 2-1. As the decibel is based on a logarithmic scale, a 10-decibel increase in noise level is generally perceived as a doubling of loudness, while a three-decibel increase in noise is just barely perceptible to the human ear. Pitch describes the character and frequency content of noise. For example, noise may range from a very low-pitched “rumbling” noise from a stereo sub-woofer to mid-range traffic noise to very high-pitched whistling. Frequency is measured in hertz (Hz). The time variation of noise sources can be characterized as continuous (e.g., building ventilation fan), intermittent (e.g., aircraft flyover), or impulsive (e.g., car backfire).
The A-weighted decibel reflects the human ear’s response to audible frequencies, and is commonly used to describe the overall noise level from transportation sources. A-weighting accounts for the fact that humans do not hear low and high frequencies as well as middle frequencies. Overall, A-weighting measures noise in a way that closely resembles human hearing. As such, transportation studies use A-weighted metrics in their analysis. For comparison purposes, typical A-weighted sound levels from common sources are shown in Table 2-1.

Waterbury-Oxford Airport FAR Part 150 Noise Study
FINAL Page 2-3
TABLE 2-1 – REPRESENTATIVE NOISE LEVELS Source Noise Level Noise Effect
Breathing 0-10 dB Threshold of Hearing Whispering at 5 ft. 20 dB Quiet office, library 40 dB
Refrigerator 50 dB Quiet, Rarely Distracting
Large office 50 dB Normal conversation 60 dB
Moderate Noise
Vacuum cleaner 70 dB Annoying Garbage disposal 80 dB
Power lawn mower 90 dB Very Annoying
Motorcycle 100 dB Snow blower 105 dB
Potential Hearing Damage
Ambulance siren 110 dB Concert 120 dB
Hearing Damage
Firecracker 150 dB Eardrum Rupture Several noise “metrics” are used to measure aircraft noise. Four commonly-used A-weighted noise metrics are described below.
• Maximum Sound Level (LAMAX): Maximum noise level that occurs during an individual noise event, such as an aircraft flyover. It is the peak instantaneous noise level heard during the event.
• Sound Exposure Level (SEL): Total sound energy of an individual noise event, incorporating intensity, frequency, and duration. Unlike LAMAX, this measure is normalized to a referenced duration of one second, allowing events of different durations to be compared.
• Equivalent Sound Level (Leq): Time-average of the total sound energy over a given period of time. Unlike LAMAX and SEL, Leq may account for multiple noise events.
The above three metrics each serve a different measurement purpose, as illustrated in the graphic below. LAMAX provides the maximum instantaneous or peak level of noise at any given moment. As such, LAMAX is most useful for describing noises that are very short in duration, such as a car backfire or gun shot. For single events that are longer in duration, such as an aircraft operation, the peak noise is better described using SEL. SEL describes the sound level experienced if all sound energy of an aircraft flyover occurred in just one second. Thus, SEL enables direct comparison of noise events that span different durations. As SEL accounts for noise duration, the SEL may result in a higher noise level than LAMAX.

Waterbury-Oxford Airport FAR Part 150 Noise Study
FINAL Page 2-4
In contrast, Leq provides an average measure of noise for a particular time frame (18 seconds in the example below). Therefore, Leq results in a lower noise level than LAMAX and SEL. As stated above, the Leq can be used to describe the average noise of multiple events over a given period of time (e.g., 1 hour, 24 hours, etc.).
The above metrics are useful in describing aircraft noise. However, the Day-Night Average Noise Level (DNL) metric (described below), which is a variation of Leq, is predominately used in airport noise studies.
• Day-Night Average Noise Level (DNL): Total accumulation of aircraft noise spread out uniformly throughout the day (i.e., over a 24-hour period). DNL is an annualized metric representing the noise of a typical day of the year. To compensate for the added annoyance created by nighttime aircraft activity, DNL adds a 10-decibel weighting (a “penalty”) to night operations (between 10:00 pm and 7:00 am). The weighting incorporated in the metric equates one operation at night to 10 daytime operations.
Unlike the other metrics discussed, the DNL is an annualized average metric of 24-hour daily noise. It includes the noise of each repeated aircraft event during the day, which is known to influence annoyance, as well as the times when no activity is occurring. A location that experiences a noise level of 65 DNL may experience several daily events of over 100 SEL, mixed with lower level aircraft noise events, and many periods without aircraft activity. DNL provides a single-measure that account for all of this activity. Federal regulations require the use of the DNL, rather than other noise metrics, to determine if aircraft noise impacts are “significant.” The FAA uses a DNL of 65 dB to determine if non-compatible activities exist in the vicinity of an airport. For noise sensitive areas currently located within the DNL 65 dB noise contour, the FAA defines the “threshold of significance” as a DNL 1.5 dB increase in noise.

Waterbury-Oxford Airport FAR Part 150 Noise Study
FINAL Page 2-5
2.1.2 Land Use Compatibility The FAA has adopted land use compatibility guidelines for preparing FAR Part 150 Noise Studies. These guidelines are presented in Table 2-2. As noted in the table, a DNL below 65 dB is considered to be compatible with all land uses. In comparison, noise levels between DNL 65 and 75 are considered incompatible with residential areas and schools, but compatible with other activities. Within the DNL 65 to 75 dB range, homes and schools could be insulated to achieve an outdoor to indoor Noise Level Reduction (NLR) of at least 25 dB. However, in areas with a DNL over 75, residential land use is considered incompatible and relocation would be recommended. DNL levels over 75 are also considered incompatible with hospitals, places of worship, and recreational activities. Table 2-2 contains supporting notes that fully describe the federal compatibility guidelines. Although a DNL below 65 is considered compatible with all land uses, this threshold does not imply public acceptance. The number of people who are annoyed by aircraft noise in a specific area varies. The level of annoyance depends on the time of day, the time of year, the activities of the people, the type and age of the dwellings occupied by those people, and in some cases, the actual visual sighting of aircraft. Some people are more perceptive and sensitive to sound. Thus, there is no “universally acceptable” minimum DNL. Furthermore, as DNL is an average noise level, it does not account for the peak noise level experienced at any giving location. A location within a DNL of 65 dB may have a peak noise level of LAMAX 90-100 dB during a flyover by the noisiest aircraft types, and 70-80 dB from common small aircraft. Noise complaints documented from area residents often reference the peak noise level and repeated episodes as the most annoying factor of airport noise. Peak noise levels are directly related to average noise levels. FAA requires the use of average noise levels in noise studies, as only average noise levels can be directly compared at all locations; peak noise is highly variable.

Waterbury-Oxford Airport FAR Part 150 Noise Study
FINAL Page 2-6
TABLE 2-2 – FAA LAND USE COMPATIBILITY WITH DNL GUIDELINES
DNL Levels (in dB) Land Use <65 65-70 70-75 75-80
RESIDENTIAL Residential, Other than Mobile Homes Y N1 N1 N Mobile Home Parks Y N N N Transient Lodgings Y N1 N1 N1 PUBLIC USE Schools Y N1 N1 N Hospitals, & Nursing Homes Y 25 30 N Churches, Auditoriums & Concert Halls Y 25 30 N Government Services Y Y 25 30 Transportation Y Y Y2 Y3 Parking Y Y Y2 Y3 COMMERCIAL USE Offices, Business & Professional Y Y 25 30 Wholesale & Retail-Building Materials, Hardware & Farm Equipment Y Y Y2 Y3
Retail Trade-General Y Y 25 30 Utilities Y Y Y2 Y3 Communication Y Y 25 30 MANUFACTURING & PRODUCTION Manufacturing-General Y Y Y2 Y3 Photographic & Optical Y Y 25 30 Agriculture (Except Livestock) & Forestry Y Y6 Y7 Y3 Livestock Farming & Breeding Y Y6 Y7 N Mining & Fishing, Resource Production & Extraction Y Y Y Y RECREATIONAL Outdoor Sports Arenas & Spectator Sports Y Y5 Y5 N Outdoor Music Shells, Amphitheaters Y N N N Nature Exhibits & Zoos Y Y N N Amusement Parks, Resorts & Camps Y Y Y N Golf Courses, Riding Stables & Water Recreation Y Y 25 30 KEY: Y (Yes): Land use and related structures compatible without restrictions. N (No): Land use and related structures are not compatible and should be prohibited. NLR: Noise Level Reduction (outdoor to indoor) to be achieved through incorporation of noise attenuation into the design and construction of the structure. 25, 30 or 35: Land use and related structures generally compatible; measures to achieve NLR of 25, 30 or 35 dB must be incorporated into design and construction of structure. NOTES: 1Where the community determines that residential uses must be allowed, measures to achieve outdoor to indoor Noise Level Reduction (NLR) of at least 25 dB and 30dB should be incorporated into building codes and be considered in individual approvals. Normal construction can be expected to provide and NLR of 20dB. Thus, the reduction requirements are often stated as 5, 10 or 15dB over standard construction and normally assume mechanical ventilation and closed windows year round. However, the use of NLR criteria will not eliminate outdoor noise problems. 2Measures to achieve NLR of 25 must be incorporated into the design and construction of portions of these buildings where the public is received; office areas, noise sensitive areas or where the normal noise level is low. 3Measures to achieve NLR of 30 must be incorporated into the design and construction of portions of these buildings where the public is received; office areas, noise sensitive areas or where the normal noise level is low. 5Land use compatible provided special sound reinforcement systems are installed. 6Residential buildings require NLR of 25. 7Residential buildings require NLR of 30. Sources: FAA, FAR Part 150
Waterbury-Oxford Airport FAR Part 150 Noise Study
FINAL Page 2-7
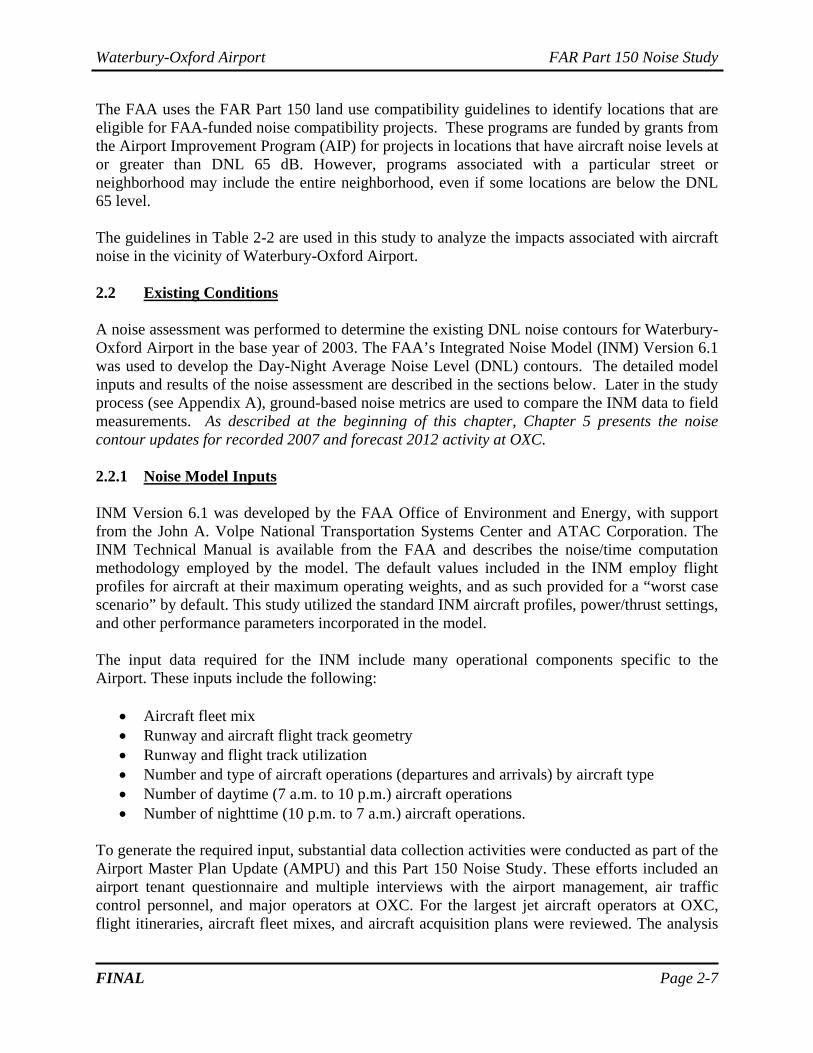
The FAA uses the FAR Part 150 land use compatibility guidelines to identify locations that are eligible for FAA-funded noise compatibility projects. These programs are funded by grants from the Airport Improvement Program (AIP) for projects in locations that have aircraft noise levels at or greater than DNL 65 dB. However, programs associated with a particular street or neighborhood may include the entire neighborhood, even if some locations are below the DNL 65 level. The guidelines in Table 2-2 are used in this study to analyze the impacts associated with aircraft noise in the vicinity of Waterbury-Oxford Airport. 2.2 Existing Conditions A noise assessment was performed to determine the existing DNL noise contours for Waterbury-Oxford Airport in the base year of 2003. The FAA’s Integrated Noise Model (INM) Version 6.1 was used to develop the Day-Night Average Noise Level (DNL) contours. The detailed model inputs and results of the noise assessment are described in the sections below. Later in the study process (see Appendix A), ground-based noise metrics are used to compare the INM data to field measurements. As described at the beginning of this chapter, Chapter 5 presents the noise contour updates for recorded 2007 and forecast 2012 activity at OXC. 2.2.1 Noise Model Inputs INM Version 6.1 was developed by the FAA Office of Environment and Energy, with support from the John A. Volpe National Transportation Systems Center and ATAC Corporation. The INM Technical Manual is available from the FAA and describes the noise/time computation methodology employed by the model. The default values included in the INM employ flight profiles for aircraft at their maximum operating weights, and as such provided for a “worst case scenario” by default. This study utilized the standard INM aircraft profiles, power/thrust settings, and other performance parameters incorporated in the model. The input data required for the INM include many operational components specific to the Airport. These inputs include the following:
• Aircraft fleet mix • Runway and aircraft flight track geometry • Runway and flight track utilization • Number and type of aircraft operations (departures and arrivals) by aircraft type • Number of daytime (7 a.m. to 10 p.m.) aircraft operations • Number of nighttime (10 p.m. to 7 a.m.) aircraft operations.
To generate the required input, substantial data collection activities were conducted as part of the Airport Master Plan Update (AMPU) and this Part 150 Noise Study. These efforts included an airport tenant questionnaire and multiple interviews with the airport management, air traffic control personnel, and major operators at OXC. For the largest jet aircraft operators at OXC, flight itineraries, aircraft fleet mixes, and aircraft acquisition plans were reviewed. The analysis

Waterbury-Oxford Airport FAR Part 150 Noise Study
FINAL Page 2-8
also included local wind data, FAA recorded flight plans, and tower counts of aircraft operations by type and time-of-day. The recent addition of the Air Traffic Control Tower (ATCT) at OXC and databases of FAA-recorded flight plans has provided more accurate operational information for OXC than available in past years. The results of the data collection activities are incorporated in the INM input data as summarized below. The aircraft fleet mix of operations at Waterbury-Oxford Airport consists of the following categories:
1) Single-engine piston general aviation aircraft 2) Multi-engine piston general aviation aircraft 3) Turboprop general aviation aircraft 4) Small, medium, and large Stage II and Stage III jet aircraft 5) Helicopters
The information provided below is based on 2003 OXC operational data. Slight operational changes are forecast for 2008. Single-engine piston general aviation aircraft accounted for nearly 75 percent of the total aircraft activity at OXC in 2003. Of these single-engine aircraft operations, 48 percent were considered regular operations (either one departure or one arrival) and 52 percent were touch & go operations. For INM modeling purposes, the Cessna 172 was selected to represent single-engine piston aircraft activity. Ten percent of the regular operations occur during the nighttime hours, while touch & go operations occurred during the daytime hours. The multi-engine piston aircraft operations accounted for 14 percent of overall aircraft activity – represented by the Baron 58B in INM. Similar to the single-engine aircraft, 10 percent of the multi-engine aircraft regular operations occurred during the nighttime hours. Two percent of this multi-engine aircraft activity was considered to be touch & go operations occurring during the daytime hours. Note that in general, only piston aircraft conduct touch & go operations at OXC. Turboprop aircraft operations constituted approximately five percent of the total aircraft operations. The Cessna Caravan 208, King Air 200, and Cessna Conquest were used in INM to model turboprop aircraft activity. Ten percent of the turboprop aircraft activity occurred during the nighttime hours. Overall, propeller aircraft (single- and multi-engine piston and turboprop aircraft) represented about 94 percent of the total aircraft activity at OXC. Helicopters represented less than one percent of the total operations. Jet aircraft activity accounted for approximately six percent of total operations. Nevertheless, jet aircraft are predominately responsible for the size and shape of the Airport’s noise footprint. As such, the jet aircraft input was further detailed as compared to propeller aircraft. Jet aircraft were separated into what is referred to as Stage II and Stage III jet aircraft. Stage II jets are older and noisier aircraft, and are no longer in production. Stage II jets were certified
See Sample Aircraft Photographs on
Figure 1-4

Waterbury-Oxford Airport FAR Part 150 Noise Study
FINAL Page 2-9
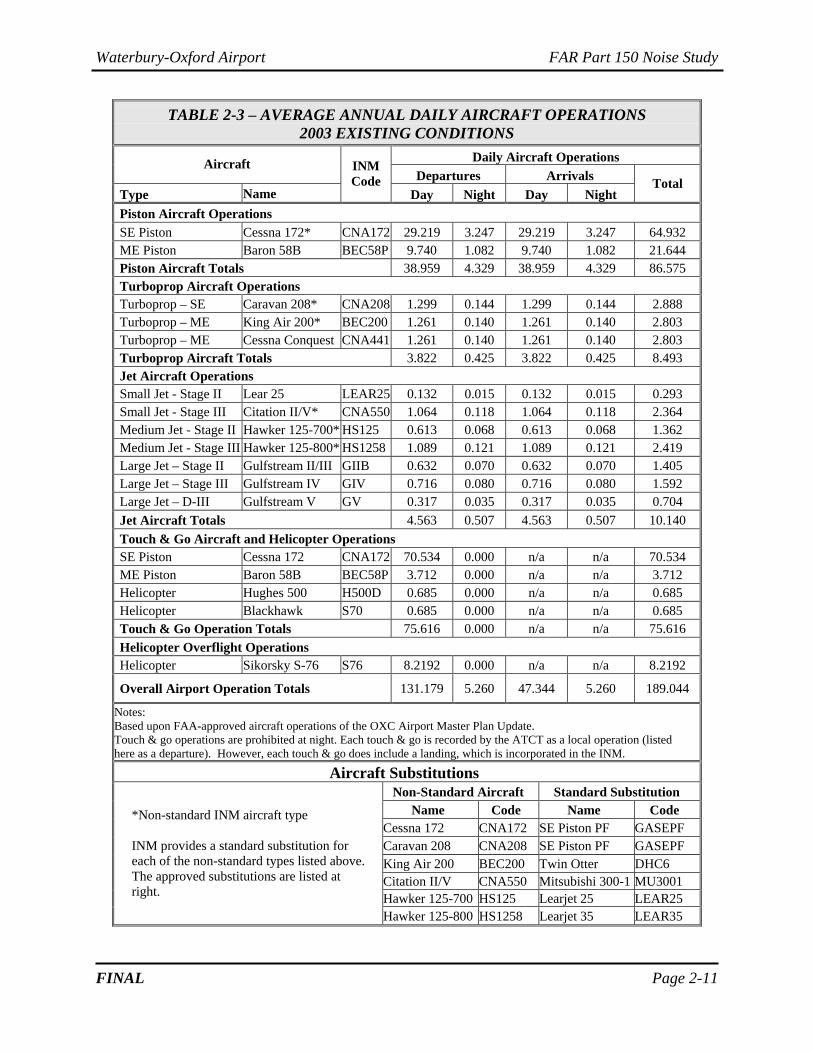
under Federal Aviation Regulations (FAR) 36 Section C36.5 (a) (2) of Appendix C. Stage II aircraft over 75,000 lbs. in commercial service are now prohibited from flight within the continental U.S. due to environmental noise concerns. However, this prohibition does not apply to Stage II aircraft weighing less than 75,000 lbs. In 2003, approximately 30% of the jet operations at OXC were conducted by Stage II jets. These operations consisted mostly of older Gulfstreams and Hawker aircraft, seven of which are based at OXC. Current production jets are all Stage III, and must comply with the more stringent noise levels prescribed in FAR 36 Section C36.5 (a) (3) of Appendix C. In 2003, 70% of the jet operations at OXC were conducted by quieter Stage III certified aircraft. This percentage is anticipated to increase in the future as the older Stage II jets are eventually retired from service. Jet aircraft were further segregated by their maximum takeoff weight. Jets using OXC range in weight from 10,400 pounds (e.g., Cessna Citation CJ1) to over 90,000 pounds (e.g., Gulfstream V). Jets were therefore divided into the following three general sizes by weight: small (under 25,000 lbs.); medium (25,000 to 60,000 lbs.); and large (over 60,000 lbs.). Six jet categories and seven different jet types were used in the INM to represent the jet aircraft operating at OXC. Small jet aircraft were modeled in INM using the Lear 25 Stage II aircraft and the Cessna Citation 550 Stage III aircraft. Medium jet activity was represented in INM by the Stage II Hawker 125-700 and the Stage III Hawker 125-800. For large jet operations, the Gulfstream II was modeled in INM to represent Stage II jet aircraft and the Gulfstream IV and V were used to represent Stage III jet aircraft. As with propeller aircraft, 10% of jet aircraft operations at the Airport occurred during the nighttime hours. The helicopter category was modeled in INM using three helicopters: the Hughes 500, the Sikorsky Blackhawk (military), and the Sikorsky S-76. The Hughes 500 and Sikorsky Blackhawk helicopters represent less than 1% of total airport operations. These helicopter operations were strictly modeled in INM as touch & go operations occurring during daytime hours only. An additional 3,000 annual helicopter operations were modeled as overflights using the Sikorsky S-76 helicopter during daytime hours. Table 2-3 summarizes the Airport’s average annual daily operations by aircraft type for the 2003 existing conditions. Also included in Table 2-3 is the aircraft identification code used for each aircraft type in the INM model. As shown, the Airport accommodated 189.04 average daily operations in 2003, which equals the 66,000 total annual takeoffs and landings, plus 3,000 overflights. Runway and flight track utilization are a major part of the INM modeling analysis. At OXC, aircraft operations were distributed between the two runway ends (Runway 18 and Runway 36). Runway 36 handles approximately 73% of the Airport’s aircraft operations, while Runway 18 accounts for the remaining 27%. The high percentage of activity on Runway 36 is due to the prevailing northerly/northwesterly winds, and the designation as the calm wind runway. Once aircraft operations were distributed by runway, designated aircraft flight tracks were determined. A flight track specifies the path along which aircraft travel during departure, arrival,

Waterbury-Oxford Airport FAR Part 150 Noise Study
FINAL Page 2-10
touch & go, or overflight operations at or near the Airport. The shape of the flight track depends on many factors, such as aircraft destination, aircraft size and type, and avoidance of noise-sensitive areas. Table 2-4 summarizes aircraft flight track utilization for piston, turboprop, and jet aircraft for each runway at OXC. Figure 2-1 illustrates flight tracks for aircraft departure procedures, while Figure 2-2 shows flight tracks for aircraft arrivals. Figure 2-3 illustrates the flight tracks that aircraft utilize for touch & go and overflight operations. The overflight track shown in Figure 2-3 is used by helicopters. For example, if a jet aircraft (i.e., Gulfstream IV) were to depart OXC and fly to Westchester County Airport, it would often takeoff on Runway 36 (to the north) and follow flight Track 36D4. This flight track includes a left turn after takeoff to a southerly heading, and air traffic control provided instructions after the aircraft leaves the vicinity. Note that Figure 2-1 has separate departure flight tracks for 2008, which are denoted with the letter “B” in the identification label (i.e. 36BD5). These modified tracks are necessary due to the runway extensions that were completed in 2004. The runway extensions slightly alter the initial departure point, and therefore the track as a whole. The runway extensions do not affect the arrival tracks as the extensions did not change the landing threshold locations.
Waterbury-Oxford Airport FAR Part 150 Noise Study
FINAL Page 2-11
TABLE 2-3 – AVERAGE ANNUAL DAILY AIRCRAFT OPERATIONS 2003 EXISTING CONDITIONS
Daily Aircraft Operations Aircraft Departures Arrivals
Type Name
INM Code
Day Night Day Night Total
Piston Aircraft Operations SE Piston Cessna 172* CNA172 29.219 3.247 29.219 3.247 64.932 ME Piston Baron 58B BEC58P 9.740 1.082 9.740 1.082 21.644 Piston Aircraft Totals 38.959 4.329 38.959 4.329 86.575 Turboprop Aircraft Operations Turboprop – SE Caravan 208* CNA208 1.299 0.144 1.299 0.144 2.888 Turboprop – ME King Air 200* BEC200 1.261 0.140 1.261 0.140 2.803 Turboprop – ME Cessna Conquest CNA441 1.261 0.140 1.261 0.140 2.803 Turboprop Aircraft Totals 3.822 0.425 3.822 0.425 8.493 Jet Aircraft Operations Small Jet - Stage II Lear 25 LEAR25 0.132 0.015 0.132 0.015 0.293 Small Jet - Stage III Citation II/V* CNA550 1.064 0.118 1.064 0.118 2.364 Medium Jet - Stage II Hawker 125-700* HS125 0.613 0.068 0.613 0.068 1.362 Medium Jet - Stage III Hawker 125-800* HS1258 1.089 0.121 1.089 0.121 2.419 Large Jet – Stage II Gulfstream II/III GIIB 0.632 0.070 0.632 0.070 1.405 Large Jet – Stage III Gulfstream IV GIV 0.716 0.080 0.716 0.080 1.592 Large Jet – D-III Gulfstream V GV 0.317 0.035 0.317 0.035 0.704 Jet Aircraft Totals 4.563 0.507 4.563 0.507 10.140 Touch & Go Aircraft and Helicopter Operations SE Piston Cessna 172 CNA172 70.534 0.000 n/a n/a 70.534 ME Piston Baron 58B BEC58P 3.712 0.000 n/a n/a 3.712 Helicopter Hughes 500 H500D 0.685 0.000 n/a n/a 0.685 Helicopter Blackhawk S70 0.685 0.000 n/a n/a 0.685 Touch & Go Operation Totals 75.616 0.000 n/a n/a 75.616 Helicopter Overflight Operations Helicopter Sikorsky S-76 S76 8.2192 0.000 n/a n/a 8.2192
Overall Airport Operation Totals 131.179 5.260 47.344 5.260 189.044
Notes: Based upon FAA-approved aircraft operations of the OXC Airport Master Plan Update. Touch & go operations are prohibited at night. Each touch & go is recorded by the ATCT as a local operation (listed here as a departure). However, each touch & go does include a landing, which is incorporated in the INM.
Aircraft Substitutions Non-Standard Aircraft Standard Substitution
Name Code Name Code Cessna 172 CNA172 SE Piston PF GASEPF Caravan 208 CNA208 SE Piston PF GASEPF King Air 200 BEC200 Twin Otter DHC6 Citation II/V CNA550 Mitsubishi 300-1 MU3001 Hawker 125-700 HS125 Learjet 25 LEAR25
*Non-standard INM aircraft type
INM provides a standard substitution for each of the non-standard types listed above. The approved substitutions are listed at right.
Hawker 125-800 HS1258 Learjet 35 LEAR35

Waterbury-Oxford Airport FAR Part 150 Noise Study
FINAL Page 2-12
TABLE 2-4 – AIRCRAFT FLIGHT TRACK UTILIZATION
Runway Procedure Flight Track Description Percent Use Track ID
Piston and Turboprop Aircraft Straight-In 60% 18A1 Left Downwind/Base Entry 10% 18A2 Runway 18 Approach Right Downwind/Base Entry 30% 18A3 Straight-Out 10% 18D1 Left Turn to Crosswind 40% 18D2 Runway 18 Departure Right Turn to Crosswind 50% 18D3 Straight-In 20% 36A1 Left Downwind/Base Entry 60% 36A2 Runway 36 Approach Right Downwind/Base Entry 20% 36A3 Straight-Out 10% 36D1 Left Turn to Crosswind 50% 36D2 Runway 36 Departure Right Turn to Crosswind 40% 36D3
Runway 18 Touch & Go Closed Left Traffic 100% 18T1
Runway 36 Touch & Go Closed Left Traffic 100% 36T1
Jet Aircraft Straight-In 40% 18A1 Left Downwind/Base Entry 20% 18A4 Runway 18 Approach Right Downwind/Base Entry 40% 18A5
Runway 18 Departure Straight-Out 100% 18D1
Straight-In 40% 36A1 Left Downwind/Base Entry 40% 36A4 Runway 36 Approach Right Downwind/Base Entry 20% 36A5 Straight-Out 2% 36D1
Runway 36 Departure Left Turn to Crosswind 98% 36D4,
36D5 Notes: Only the Gulfstream II Stage II aircraft uses flight track 36D5 as it requires a longer climb-out time before making the left turn; all other jet aircraft utilize 36D4 for left turn to crosswind departures. The Hughes 500 and Sikorsky Blackhawk helicopters utilize the touch & go flight tracks listed in this table. Due to the recent runway extension (2004), the future departure tracks are listed as “BD”, as shown in Figure 2-1.

Waterbury-Oxford Airport FAR Part 150 Noise Study
FINAL Page 2-13
Figure 2-1 – Existing & Future Aircraft Departure Flight Tracks at OXC

Waterbury-Oxford Airport FAR Part 150 Noise Study
FINAL Page 2-14
Figure 2-2 – Aircraft Arrival Flight Tracks at OXC

Waterbury-Oxford Airport FAR Part 150 Noise Study
FINAL Page 2-15
Figure 2-3 – Aircraft Touch & Go and Overflight Flight Tracks at OXC

Waterbury-Oxford Airport FAR Part 150 Noise Study
FINAL Page 2-16
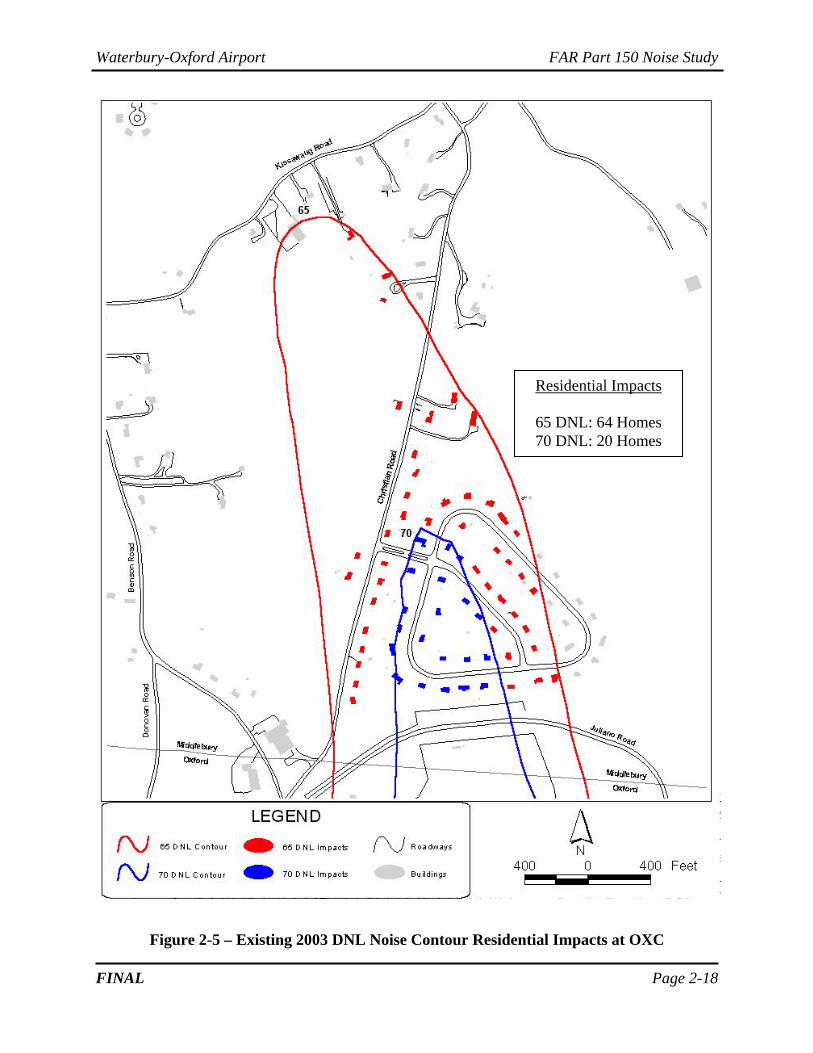
2.2.2 Noise Analysis Results DNL noise contours were generated for the 2003 existing conditions using the aircraft data shown in Tables 2-3 and 2-4 and the flight tracks shown on Figures 2-1 through 2-3. The 60, 65 and 70 DNL noise contours are shown in Figure 2-4. The 60 DNL contour is shown for informational purposes only, as all land uses are considered compatible with a DNL of less than 65 dB. The DNL 75 contour is contained entirely on airport property. Due to aircraft departure activity from Runway 36, the 65 and 70 DNL noise contours extend to the north of the Airport encompassing the Triangle Boulevard residential area (see Figure 2-5). The 65 and 70 DNL noise contours do not extend into residential areas to the south due to less departure activity on Runway 18 and lack of homes in the immediate vicinity. A determination of overall noise exposure is made by overlaying the DNL noise contours onto a land use map, as provided later in Section 2.4. Briefly, 2003 noise exposure includes 64 single-family residential homes located within the 65 DNL noise contour as shown on Figure 2-5. Note that 20 of the 64 homes within the 65 DNL contour are also within the 70 DNL noise contour.

Waterbury-Oxford Airport FAR Part 150 Noise Study
FINAL Page 2-17
Figure 2-4 – DNL Noise Contours for the 2003 Existing Conditions at OXC
Waterbury-Oxford Airport FAR Part 150 Noise Study
FINAL Page 2-18
Figure 2-5 – Existing 2003 DNL Noise Contour Residential Impacts at OXC
Residential Impacts
65 DNL: 64 Homes 70 DNL: 20 Homes

Waterbury-Oxford Airport FAR Part 150 Noise Study
FINAL Page 2-19
2.3 Future Conditions A noise assessment was also conducted to generate future-baseline DNL noise contours at OXC. This assessment was performed to determine potential changes in airport noise due to increased aircraft operations, projected changes in aircraft fleet mix (such as the reduction in Stage II jet aircraft), and the extensions of Runway 18-36 completed in 2004. However, this baseline analysis does not change the current flight procedures. The results of the noise assessment for the 2008 future conditions are described below. As described at the beginning of this chapter, Chapter 5 presents the noise contour updates for recorded 2007 and forecast 2012 activity at OXC. 2.3.1 Noise Model Inputs Table 2-5 summarizes the Airport’s annual average daily operations by aircraft type for the 2008 future conditions. Also included in Table 2-5 is the aircraft identification code used for each aircraft type in the INM model. Overall, it is anticipated that 2008 future condition aircraft operations will increase by approximately 10% over the 2003 existing conditions (based on the forecasts of the Airport Master Plan Update). As shown, OXC is anticipated to accommodate 207.4 average daily operations, equaling the 72,700 total annual takeoffs and landings, plus 3,000 overflights. Single-engine and multi-engine piston aircraft operations will increase by 5% and 6%, respectively, while turboprop operations will increase by about 16%. For jet aircraft, airport tenants and operators were surveyed and interviewed to estimate the changing aircraft fleet mix, with emphasis on the future use of noisier Stage II jets. Based upon national trends and the interviews, use of both small and large Stage II jets is expected to at OXC by 2008, but activity of medium Stage II jets (e.g., Hawker 125-700) is expected to increase slightly. All sizes of Stage III jets are expected to show strong activity growth at OXC by 2008. Specifically, the jet aircraft forecasts for 2008 included the following assumptions:
• Small Stage II jet operations are expected to decrease by 35%, while small Stage III jet operations are projected to increase by 94%.
• Medium Stage II jet operations are expected to increase by 18%, while medium Stage III jet operations are expected to increase by more than 111%.
• Large Stage II jet operations are expected to decrease by 36%, while large Stage III jet operations are projected to increase by 161%.
Runway and flight track utilization were assumed to be the same for both the 2003 existing conditions and the 2008 future conditions. Also, airport flight procedures, such as the percentage of daytime and nighttime aircraft operations, were are also assumed to remain the same in 2008. However, as discussed previously the extensions of Runway 18-36 create a slight shift in the departure flight tracks, which enable aircraft to conduct more of their initial climb-out over airport property. As a result, aircraft will be slightly higher when departing, and will make the left or right turn to crosswind maneuver sooner than aircraft departures in the 2003 runway configuration.

Waterbury-Oxford Airport FAR Part 150 Noise Study
FINAL Page 2-20
Figure 2-1 shows the future 2008 departure flight tracks, which are denoted with the letter “B” in the flight track identification label (i.e., 36BD5). Arrival and touch & go flight tracks remain the same in 2008.
TABLE 2-5 – AVERAGE ANNUAL DAILY AIRCRAFT OPERATIONS 2008 FUTURE CONDITIONS
Aircraft Daily Aircraft Operations Departures Arrivals Type Name
INM Code
Day Night Day Night Total
Piston Aircraft Operations SE Piston Cessna 172* CNA172 30.976 3.442 30.976 3.442 68.836 ME Piston Baron 58B BEC58P 10.325 1.147 10.325 1.147 22.945 Piston Aircraft Totals 41.301 4.589 41.301 4.589 91.781 Turboprop Aircraft Operations Turboprop – SE Caravan 208* CNA208 1.509 0.168 1.509 0.168 3.353 Turboprop – ME King Air 200* BEC200 1.465 0.163 1.465 0.163 3.255 Turboprop – ME Cessna Conquest CNA441 1.465 0.163 1.465 0.163 3.255 Turboprop Aircraft Totals 4.438 0.493 4.438 0.493 9.863 Jet Aircraft Operations Small Jet - Stage II Lear 25 LEAR25 0.086 0.010 0.086 0.010 0.192 Small Jet - Stage III Citation II/V* CNA550 2.059 0.229 2.059 0.229 4.575 Medium Jet - Stage II Hawker 125-700* HS125 0.725 0.081 0.725 0.081 1.611 Medium Jet - Stage III Hawker 125-800* HS1258 2.296 0.255 2.296 0.255 5.101 Large Jet - Stage II Gulfstream II/III GIIB 0.402 0.045 0.402 0.045 0.893 Large Jet - Stage III Gulfstream IV GIV 1.764 0.196 1.764 0.196 3.921 Large Jet - D-III Gulfstream V GV 0.928 0.103 0.928 0.103 2.063 Jet Aircraft Totals 8.260 0.918 8.260 0.918 18.356 Touch & Go Aircraft and Helicopter Operations SE Piston Cessna 172 CNA172 73.918 0.000 n/a n/a 73.918 ME Piston Baron 58B BEC58P 3.890 0.000 n/a n/a 3.890 Helicopter Hughes 500 H500D 0.685 0.000 n/a n/a 0.685 Helicopter Blackhawk S70 0.685 0.000 n/a n/a 0.685 Touch & Go Operation Totals 79.178 0.000 n/a n/a 79.178 Helicopter Overflight Operations Helicopter Sikorsky S-76 S76 8.2192 0.000 n/a n/a 8.2192
Overall Airport Operation Totals 141.397 6.000 54.000 6.000 207.397 Notes: Based upon FAA-approved aircraft operations of the OXC Airport Master Plan Update. Touch & Go operations occur predominantly during the day, each operation includes a takeoff & landing. * Non-standard INM aircraft type. The standard INM Substitutions are listed in Table 2-3
Waterbury-Oxford Airport FAR Part 150 Noise Study
FINAL Page 2-21
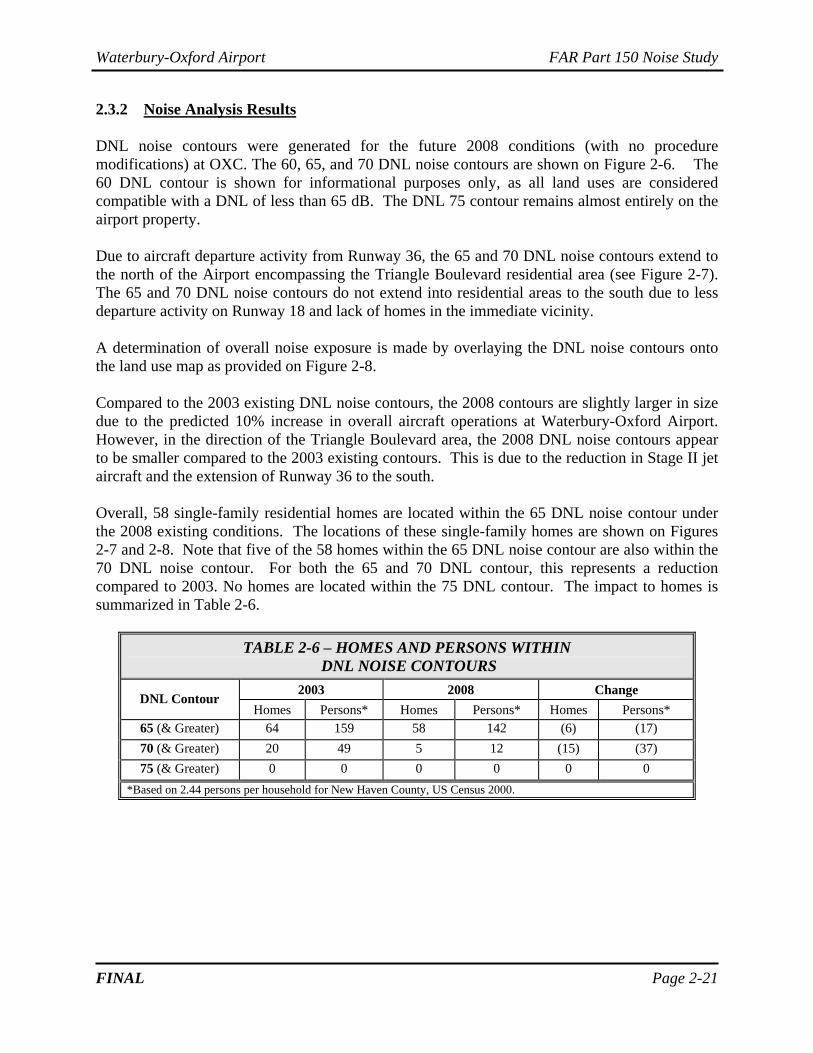
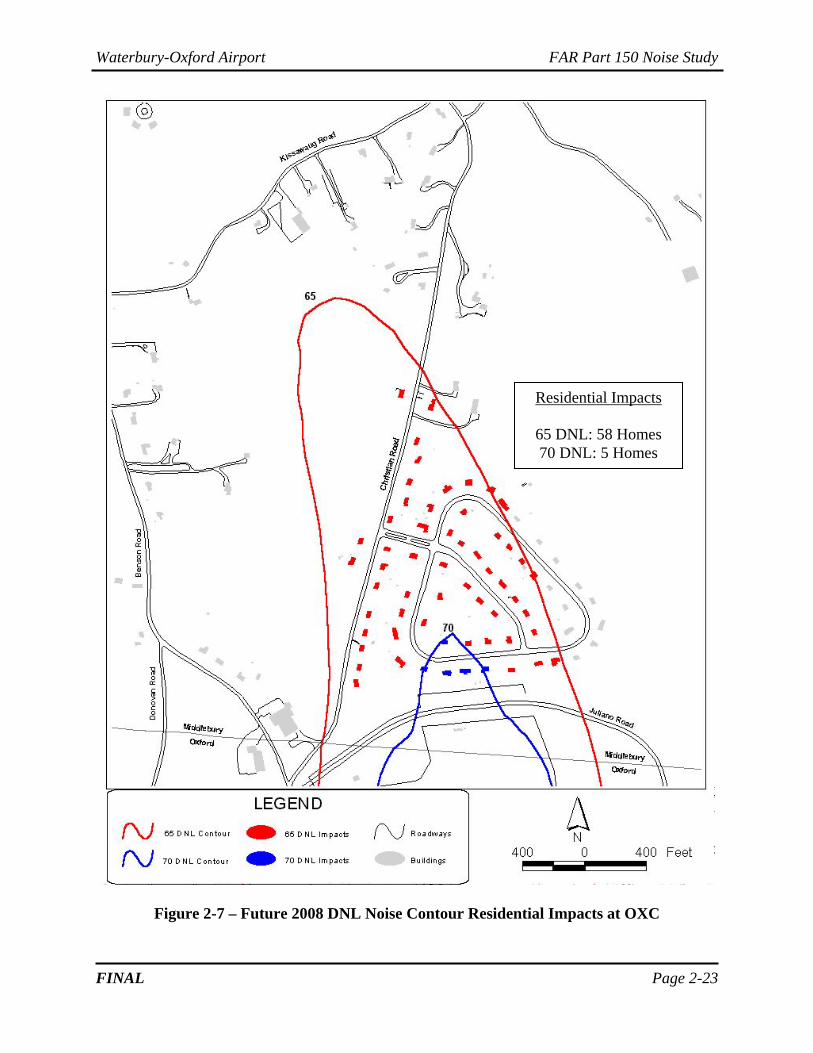
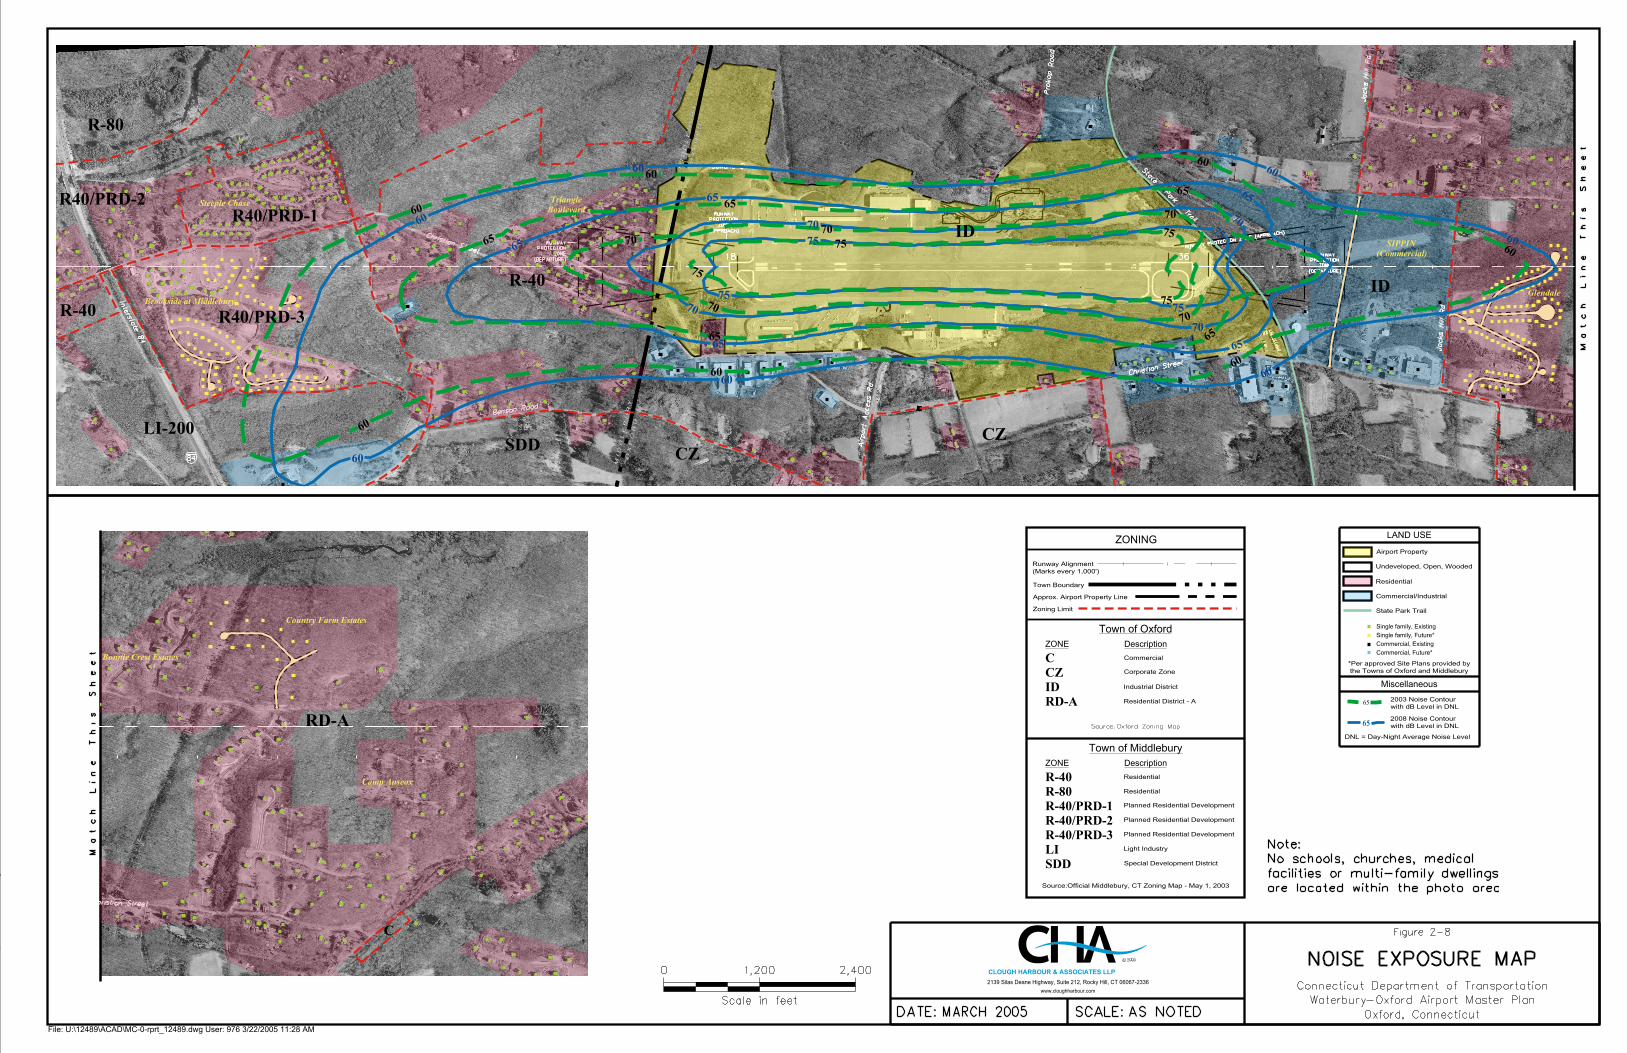
2.3.2 Noise Analysis Results DNL noise contours were generated for the future 2008 conditions (with no procedure modifications) at OXC. The 60, 65, and 70 DNL noise contours are shown on Figure 2-6. The 60 DNL contour is shown for informational purposes only, as all land uses are considered compatible with a DNL of less than 65 dB. The DNL 75 contour remains almost entirely on the airport property. Due to aircraft departure activity from Runway 36, the 65 and 70 DNL noise contours extend to the north of the Airport encompassing the Triangle Boulevard residential area (see Figure 2-7). The 65 and 70 DNL noise contours do not extend into residential areas to the south due to less departure activity on Runway 18 and lack of homes in the immediate vicinity. A determination of overall noise exposure is made by overlaying the DNL noise contours onto the land use map as provided on Figure 2-8. Compared to the 2003 existing DNL noise contours, the 2008 contours are slightly larger in size due to the predicted 10% increase in overall aircraft operations at Waterbury-Oxford Airport. However, in the direction of the Triangle Boulevard area, the 2008 DNL noise contours appear to be smaller compared to the 2003 existing contours. This is due to the reduction in Stage II jet aircraft and the extension of Runway 36 to the south. Overall, 58 single-family residential homes are located within the 65 DNL noise contour under the 2008 existing conditions. The locations of these single-family homes are shown on Figures 2-7 and 2-8. Note that five of the 58 homes within the 65 DNL noise contour are also within the 70 DNL noise contour. For both the 65 and 70 DNL contour, this represents a reduction compared to 2003. No homes are located within the 75 DNL contour. The impact to homes is summarized in Table 2-6.
TABLE 2-6 – HOMES AND PERSONS WITHIN DNL NOISE CONTOURS
2003 2008 Change DNL Contour
Homes Persons* Homes Persons* Homes Persons* 65 (& Greater) 64 159 58 142 (6) (17) 70 (& Greater) 20 49 5 12 (15) (37) 75 (& Greater) 0 0 0 0 0 0
*Based on 2.44 persons per household for New Haven County, US Census 2000.

Waterbury-Oxford Airport FAR Part 150 Noise Study
FINAL Page 2-22
Figure 2-6 – DNL Noise Contours for the 2008 Future Conditions at OXC
Waterbury-Oxford Airport FAR Part 150 Noise Study
FINAL Page 2-23
Figure 2-7 – Future 2008 DNL Noise Contour Residential Impacts at OXC
Residential Impacts
65 DNL: 58 Homes 70 DNL: 5 Homes
65
Residential District - A
Industrial District
Commercial
Corporate Zone
Zoning Limit
Source:Official Middlebury, CT Zoning Map - May 1, 2003
Residential
Residential
Planned Residential Development
Planned Residential Development
Planned Residential Development
Light Industry
Special Development District
Approx. Airport Property Line
Town Boundary
Runway Alignment(Marks every 1,000')
Description
Town of Middlebury
Town of OxfordDescription
ZONING
ZONE
ZONE
Commercial/Industrial
Residential
Undeveloped, Open, Wooded
Airport Property
DNL = Day-Night Average Noise Level
2003 Noise Contourwith dB Level in DNL
2008 Noise Contourwith dB Level in DNL
Commercial, Future*Commercial, ExistingSingle family, Future*Single family, Existing
*Per approved Site Plans provided bythe Towns of Oxford and Middlebury
State Park Trail
Miscellaneous
LAND USE
RD-A
R-40/PRD-2
LISDD
R-40/PRD-3
R-40R-80R-40/PRD-1
IDCZC
65
65
60
65
70
75
65
7570
60
6065
60
75
65
70
60
60
7570
65
60 O X
F O
R D
M I D
D L
E B
U R
Y
O X
F O
R D
M I D
D L
E B
U R
Y
O X
F O
R D
M I D
D L
E B
U R
Y
O X
F O
R D
M I D
D L
E B
U R
Y
SIPPIN(Commercial)
TriangleBoulevard
Steeple Chase
Brookside at Middlebury
Bonnie Crest Estates
Country Farm Estates
Glendale
Camp Anseox
R-80
R40/PRD-1R40/PRD-2
R-40 R40/PRD-3
LI-200
R-40
SDD CZCZ
ID
ID
RD-A
C
60
6570
75
75
70
65
60
60757065
60
75
65
70
60
60
70
65
60
60
65
70
75
65
7570
60
6065
60
75
65
70
60
60
7570
65
60
CLOUGH HARBOUR & ASSOCIATES LLP
File: U:\12489\ACAD\MC-0-rprt_12489.dwg User: 976 3/22/2005 11:28 AM
www.cloughharbour.com
2139 Silas Deane Highway, Suite 212, Rocky Hill, CT 06067-2336
Waterbury-Oxford Airport FAR Part 150 Noise Study
FINAL Page 2-25
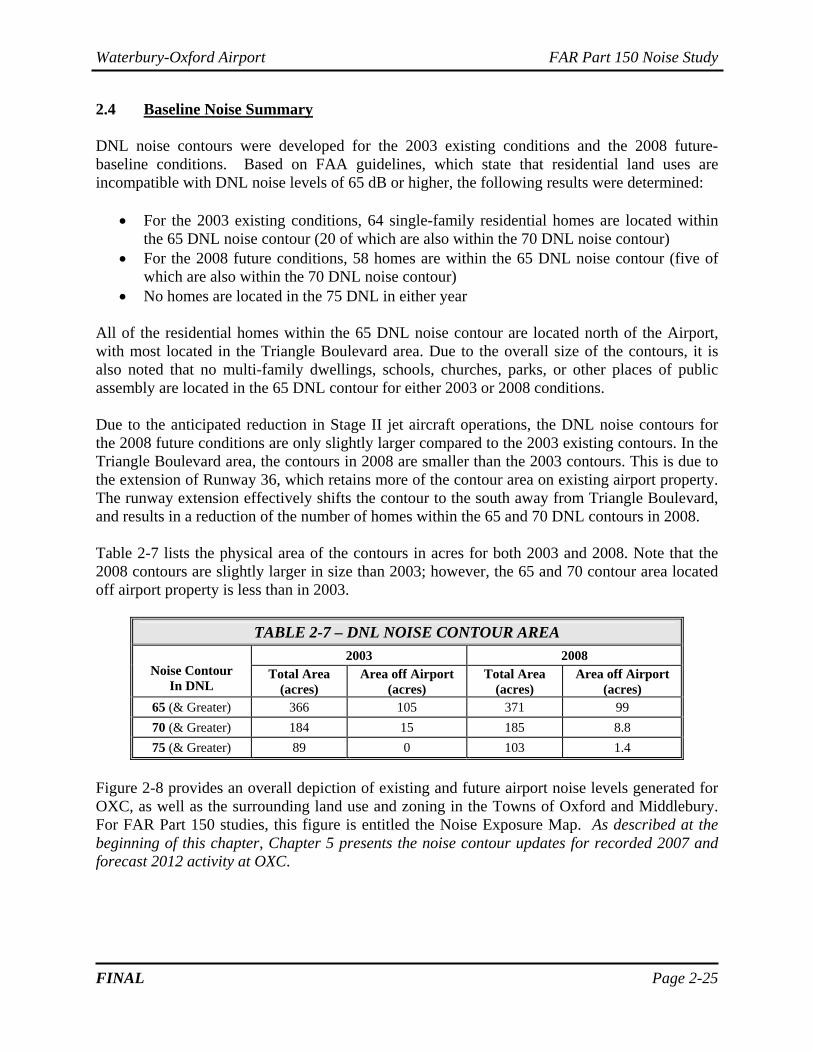
2.4 Baseline Noise Summary DNL noise contours were developed for the 2003 existing conditions and the 2008 future-baseline conditions. Based on FAA guidelines, which state that residential land uses are incompatible with DNL noise levels of 65 dB or higher, the following results were determined:
• For the 2003 existing conditions, 64 single-family residential homes are located within the 65 DNL noise contour (20 of which are also within the 70 DNL noise contour)
• For the 2008 future conditions, 58 homes are within the 65 DNL noise contour (five of which are also within the 70 DNL noise contour)
• No homes are located in the 75 DNL in either year All of the residential homes within the 65 DNL noise contour are located north of the Airport, with most located in the Triangle Boulevard area. Due to the overall size of the contours, it is also noted that no multi-family dwellings, schools, churches, parks, or other places of public assembly are located in the 65 DNL contour for either 2003 or 2008 conditions. Due to the anticipated reduction in Stage II jet aircraft operations, the DNL noise contours for the 2008 future conditions are only slightly larger compared to the 2003 existing contours. In the Triangle Boulevard area, the contours in 2008 are smaller than the 2003 contours. This is due to the extension of Runway 36, which retains more of the contour area on existing airport property. The runway extension effectively shifts the contour to the south away from Triangle Boulevard, and results in a reduction of the number of homes within the 65 and 70 DNL contours in 2008. Table 2-7 lists the physical area of the contours in acres for both 2003 and 2008. Note that the 2008 contours are slightly larger in size than 2003; however, the 65 and 70 contour area located off airport property is less than in 2003.
TABLE 2-7 – DNL NOISE CONTOUR AREA 2003 2008
Noise Contour In DNL
Total Area (acres)
Area off Airport (acres)
Total Area (acres)
Area off Airport (acres)
65 (& Greater) 366 105 371 99 70 (& Greater) 184 15 185 8.8 75 (& Greater) 89 0 103 1.4
Figure 2-8 provides an overall depiction of existing and future airport noise levels generated for OXC, as well as the surrounding land use and zoning in the Towns of Oxford and Middlebury. For FAR Part 150 studies, this figure is entitled the Noise Exposure Map. As described at the beginning of this chapter, Chapter 5 presents the noise contour updates for recorded 2007 and forecast 2012 activity at OXC.