Embed Size (px)
Citation preview

2020 CORPORATE
RESPONSIBILITY REPORT

// 2020 CSR1 // Diamondback Energy
TABLE OF CONTENTS
2 About Diamondback Energy
3 Diamondback at a Glance in 2019 4 2019 Financial and Operating Performance Highlights 5 Letter from the CEO 7 Environmental Responsibility17 Managing and Reducing Risks19 Governance and Business Ethics22 Our People26 Communities29 Moving Forward30 Appendix: Targets and Key Performance Indicators
This is the third annual corporate responsibility report for Diamondback Energy (“the “Company” or Diamondback”). Except where otherwise noted, this report includes data through December 31, 2019 and includes operations at our public midstream subsidiary, Rattler Midstream LP (“Rattler”), but does not include operations at our public mineral and royalty subsidiary, Viper Energy Partners LP (“Viper”), as Viper does not have physical oil and gas operations.
We developed the contents of this report through research, peer benchmarking and conversations with stakeholders. The report is also informed by standards of the Sustainability Accounting Standards Board (SASB), Global Reporting Initiative (GRI), and International Petroleum Industry Environmental Conservation Association (IPIECA) standards.
We are pleased to share this document as a summation of our corporate responsibility efforts in 2019 and our objectives moving forward.
ABOUT THIS REPORT

// 2020 CSR2 // Diamondback Energy
Diamondback AcreageDelaware BasinCentral Basin Platform Midland Basin
Headquartered in Midland, Texas, Diamondback is an independent oil and natural gas company. We began oper-ations in December 2007 with the acquisition of 4,174 net acres in the Permian Basin of West Texas. The Company incorporated in December 2011 and completed an initial public offering in October 2012. In nearly eight years as a public company, Diamondback has grown its acreage position to more than 382,000 net acres in the Permian Basin.
As of December 31, 2019, Diamondback had 712 full-time employees. We also hire independent contractors and consultants to assist with various business functions. Our common stock is listed on the Nasdaq Global Select Market under the symbol FANG.
Diamondback focuses on the acquisition, development, exploration and exploitation of unconventional onshore oil and natural gas reserves. Since our formation, we have focused these efforts solely within the Permian Basin.
Our strategic approach allows us to:
» Enhance returns through our low-cost development strat-egy of resource conversion, capital allocation and ongoing improvements in operational and cost efficiencies
» Focus on increasing hydrocarbon recoveries and maximiz-ing returns through horizontal drilling and development
» Adopt technologies and best practices that minimize the environmental impact of our operations and increase the safety of our employees and independent contractors
» Increase production and reserves by efficiently developing our oil-rich resource base and maximizing its value and resource potential
» Pursue acquisitions using our proven ability to evaluate resource potential and identify those that best meet our strategic and financial targets
» Maintain financial flexibility with low leverage
ABOUT DIAMONDBACKENERGY
Diamondback Permian Basin Acreage
// 2020 CSR3 // Diamondback Energy
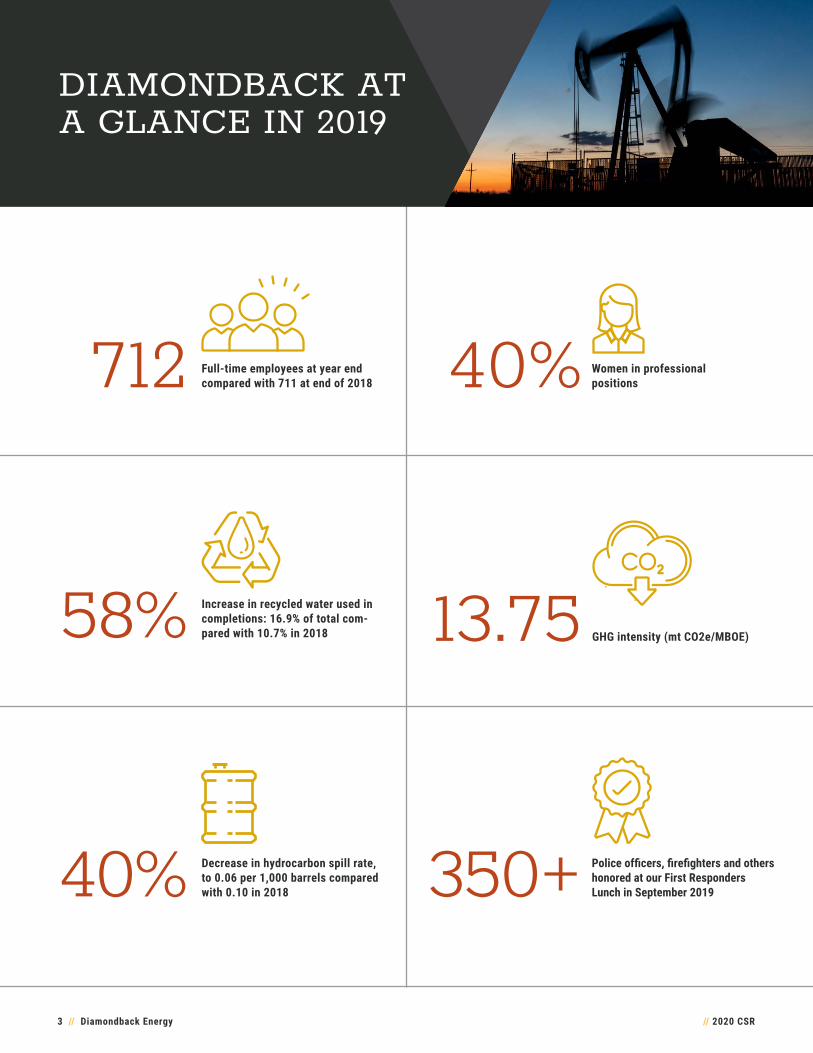
712 40%Full-time employees at year end compared with 711 at end of 2018
Women in professional positions
40% 350+Decrease in hydrocarbon spill rate, to 0.06 per 1,000 barrels compared with 0.10 in 2018
Police officers, firefighters and others honored at our First Responders Lunch in September 2019
58% 13.75Increase in recycled water used in completions: 16.9% of total com-pared with 10.7% in 2018 GHG intensity (mt CO2e/MBOE)
DIAMONDBACK AT A GLANCE IN 2019

// 2020 CSR4 // Diamondback Energy
Total Proved Reserves(BBOE)
Total Revenue (In billions)
0
200000
400000
600000
800000
1000000
1,200,000
0
0.4
0.2
0.6
0.8
1.0
1.2
’16 ’17 ’18 ’19
0
1
2
3
4
0
1.0
2.0
3.0
$4.0
’17 ’18 ’19’16
Total Average Production (BOE/d in Thousands)
Total Revenues (In Millions)
0
200000
400000
600000
800000
1000000
1,200,000
0
0.4
0.2
0.6
0.8
1.0
1.2
’16 ’17 ’18 ’19
0
1
2
3
4
0
1.0
2.0
3.0
$4.0
’17 ’18 ’19’16
Total Average Production (BOE/d in Thousands)
Total Revenues (In Millions)
2019 FINANCIAL AND OPERATING PERFORMANCE HIGHLIGHTS
Diamondback ended 2019 with estimated proved oil and natural gas reserves of 1,127.6 MMBOE, including 88.9 MMBOE attributable to Diamondback’s publicly traded mineral subsidiary Viper (NASDAQ:VNOM). We produced an average of nearly 283 MBOE/d in 2019, a 27% increase from 222 MBOE/d in 20181. Our 2019 production comprised approximately 66% oil, 18% natural gas liquids and 16% natural gas.
Diamondback achieved realized cash margins per BOE of 77% in 2019, extending our track record of cost leadership. We generated a full-year return on average capital employed of 7.6%, which we believe serves as a proxy for corporate returns and demonstrates how effectively we deploy capital.
We continued returning capital to stockholders in 2019 by increasing our annual cash dividend by 50% to $0.75 per share, up from $0.50 per share in 2018. Additionally, beginning with the fourth quarter of 2019, we doubled our annual cash dividend to $1.50 per share.
More details on our 2019 financial and operating performance can be found in our Form 10-K.
1Production figures include Viper

// 2020 CSR5 // Diamondback Energy
LETTER FROM THE CEO
Travis D. SticeCEO and Director
Welcome to Diamondback’s third annual corporate responsibility report. I am pleased to share the strides we have made in 2019 to operate sustainably, uphold the highest ethical standards, foster employees’ well-being and make a positive difference in the commu-nities in which we operate.
Our corporate responsibility efforts over the past year helped position Diamondback to begin 2020 on exception-ally strong footing. Despite the drastic economic setbacks that the oil and gas industry, and most other businesses globally, have weathered so far in 2020, Diamondback’s core principles remain strong.
We are committed to developing our natural resources in the Permian Basin safely and with acute consideration of Diamondback’s role in both our local and the global environment. Diamondback’s ability to create a positive impact starts with providing affordable energy for house-holds, businesses, transportation networks and other essential components of the U.S. and global economies. Our success opens greater opportunities for us to invest in programs and projects that create significant economic, social and educational benefits.
Our roots in the communities of West Texas run deep. We operate exclusively in the Permian Basin, one of the oldest and most economically productive oil basins in the world. Living and working in this region makes us all the more invested in its future.
As one of the fastest-growing and most efficient opera-tors in the Permian Basin, we strive to meet progressively higher expectations for environmental sustainability,
on-the-job safety, transparent governance and diversity and inclusion in our company. We also reach out to our stockholders, employees and community partners for their input on where Diamondback has the greatest opportuni-ties to help build a brighter future.
Our corporate responsibility initiatives in 2019 centered on a dozen key areas where we are able to have a material impact, or that directly impact our business: risk manage-ment, energy intensity, global climate change, emissions, waste and spills, water use, business ethics, compliance, diversity and inclusion, health and safety, training and edu-cation, and community engagement. We also established a new Safety, Sustainability and Corporate Responsibility Committee within our Board of Directors to further sharpen our company-wide focus on these priorities.
The process of assessing and reporting on Diamondback’s progress gives us clearer insights on where and how we can improve. In turn, we use those insights to set more ambitious corporate responsibility performance targets. We have set a goal to be best-in-class in our industry with regard to our performance and associated disclosure around all environmental, social and governance topics.

// 2020 CSR6 // Diamondback Energy
Here are a few examples of our 2019 corporate responsibility accomplishments that illustrate how all of us at Diamondback are focused on driving positive change:
We have always recognized that a fundamental commit-ment to corporate responsibility makes every aspect of our business stronger. The economic and social upheaval experienced thus far in 2020, from a global coronavirus pandemic to widespread protests over social and racial injustice, has heightened the need for us to support local families, nonprofit organizations and our employees, which we have done and will continue to do.
Diamondback’s five core values of leadership, integrity, excellence, people and teamwork are key to our recent accomplishments and continue to guide our work going forward. Our outlook remains bright, and we are eager to
tackle whatever new opportunities come our way. I want to close by thanking our 700-plus employees and hun-dreds of independent contractors for their invaluable role in Diamondback’s continued success.
Sincerely,
Travis D. Stice CEO and Director
ENVIRONMENTWe invested more than $3 million to improve our water recycling infra-structure and reduce the amount of freshwater required in our produc-tion operations. As a result, our use of recycled water for completions increased from 10.7% in 2018 to 16.9% in 2019 while completing 80% more wells year over year.
GOVERNANCEOur Board of Directors added five specific envi-ronmental and safety metrics into the criteria for determining annual compensation incentives, a move that further under-scores how vital this work is to Diamondback. We also increased the diver-sity of our board with the addition of two members this year.
SAFETYWe grew our Health, Safety and Environmental (HSE) organization by adding a full-time, field-dedicated coordi-nator to monitor specific facilities and help pre-vent potential issues. Already, HSE inspections of Diamondback pipeline operations have enabled us to proactively repair a number of pinhole leaks before they could grow and cause larger spills.
COMMUNITYIn our first full year as a mem-ber of the Permian Strategic Partnership along with 19 other energy companies, we helped fund a range of initia-tives geared toward improving education, housing, healthcare, roads and workforce develop-ment in communities across West Texas and southeastern New Mexico. We also launched a new program to match our employees’ charitable contri-butions to organizations that serve our local communities.
// 2020 CSR7 // Diamondback Energy
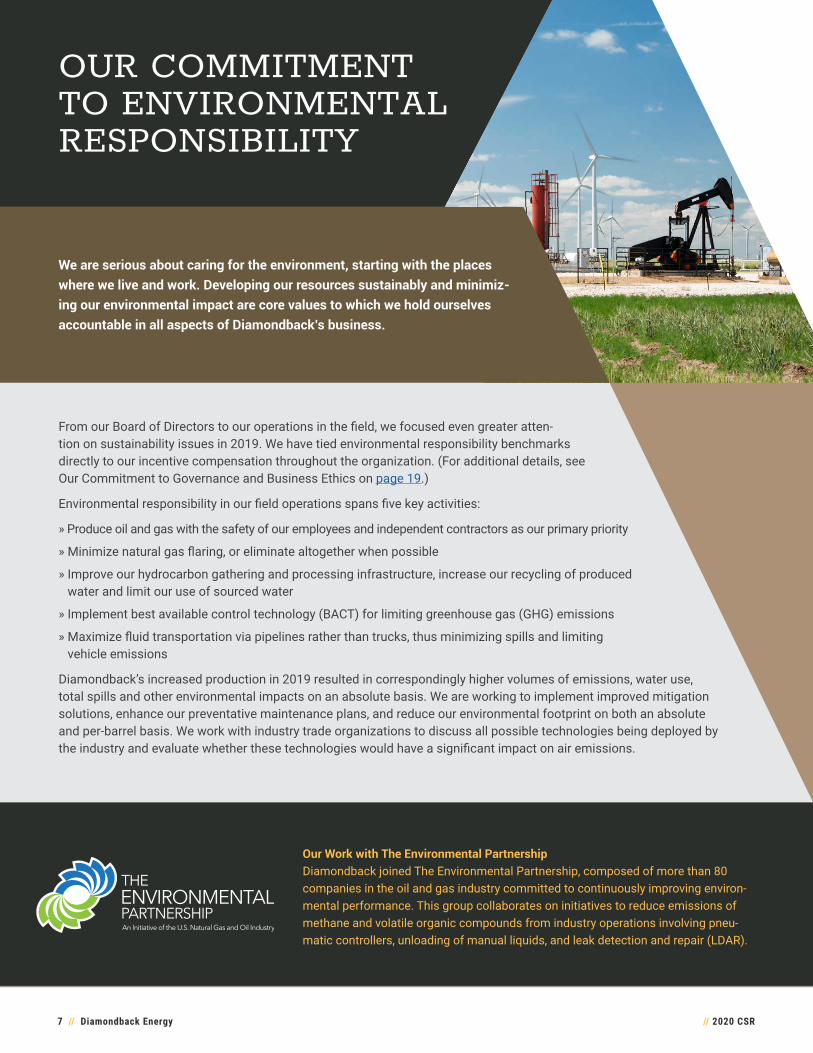
We are serious about caring for the environment, starting with the places where we live and work. Developing our resources sustainably and minimiz-ing our environmental impact are core values to which we hold ourselves accountable in all aspects of Diamondback’s business.
From our Board of Directors to our operations in the field, we focused even greater atten-tion on sustainability issues in 2019. We have tied environmental responsibility benchmarks directly to our incentive compensation throughout the organization. (For additional details, see Our Commitment to Governance and Business Ethics on page 19.)
Environmental responsibility in our field operations spans five key activities:
» Produce oil and gas with the safety of our employees and independent contractors as our primary priority
» Minimize natural gas flaring, or eliminate altogether when possible
» Improve our hydrocarbon gathering and processing infrastructure, increase our recycling of produced water and limit our use of sourced water
» Implement best available control technology (BACT) for limiting greenhouse gas (GHG) emissions
» Maximize fluid transportation via pipelines rather than trucks, thus minimizing spills and limiting vehicle emissions
Diamondback’s increased production in 2019 resulted in correspondingly higher volumes of emissions, water use, total spills and other environmental impacts on an absolute basis. We are working to implement improved mitigation solutions, enhance our preventative maintenance plans, and reduce our environmental footprint on both an absolute and per-barrel basis. We work with industry trade organizations to discuss all possible technologies being deployed by the industry and evaluate whether these technologies would have a significant impact on air emissions.
OUR COMMITMENT TO ENVIRONMENTAL RESPONSIBILITY
Our Work with The Environmental PartnershipDiamondback joined The Environmental Partnership, composed of more than 80 companies in the oil and gas industry committed to continuously improving environ-mental performance. This group collaborates on initiatives to reduce emissions of methane and volatile organic compounds from industry operations involving pneu-matic controllers, unloading of manual liquids, and leak detection and repair (LDAR).

// 2020 CSR8 // Diamondback Energy
ENERGY, GREENHOUSE GASES AND EMISSIONS
Consistent with our overall approach to environmental responsibility, Diamondback strives to limit and capture emissions by implementing BACT on all new facilities and wells and retrofitting our older facilities. BACT projects include fitting our tanks with vapor recovery towers and compressors that can capture up to 99.9% of possible emissions.
We maintain an LDAR program that uses optical gas imaging cameras and other technologies to monitor and measure the emissions from our facilities. As part of our self-auditing procedures, we act promptly to correct any identified flaws and leaks.
We are also expanding the use of electric and dual-fuel pressure-pumping crews and drilling rigs. Approximately 50% of our drilling rigs in the Delaware Basin ran partly or fully on electricity in 2019, and we expect this percentage to grow across our asset base in 2020 and beyond.
Our 2019 activities to reduce emissions also included:
» Replacing gas-driven pneumatic control systems with a compressed air system on facility upgrades or new builds
» Installing low- or no-bleed pneumatic level controllers at facilities where compressed air systems are not feasible
» Installing one horizontal heater instead of three vertical heaters on each newly built tank battery
» Continuing to install combustion equipment at each site to ensure the highest efficiency burn rate of non-captured gas
» Engineering and designing equipment to reduce the amount of gas in our oil and water tanks
» Using renewable energy in the form of solar powered pumps for chemical delivery, automated valves (where appropriate) and lighting
More detail and methodologies for the data and calcula-tions presented in this section can be found in the Appendix starting on page 30.
GHG Intensity(mt CO2e/MBOE)
Methane Intensityf
0
5
10
15
0
5
10
15
0
2016 2017 2018
0.10
0.20
0.30
0.40
0.0000
0.0001
0.0002
0.0003
0.0004
GHG Intensity (mt c02e/boe)
CH4 Intensity (mtCH4/Mboe produced)
’16 ’17 ’18 ’19
0.30
0.35
0.40
0.30
0.35
0.40%
’18 ’19
Methane Intensity
13.75GHG emissions intensity level (mt CO2e/MBOE) in 2019, surpassing our short-term target of 14.001
12019 emissions data is pending EPA review and third-party verification.
// 2020 CSR9 // Diamondback Energy
FLARED GAS
Our highest environmental priority is to eliminate the flaring of natural gas at all locations. Much of Diamondback’s flaring in 2019 stemmed from the activities of third-party gatherers and processors whose existing contracts with us did not pro-vide enough incentive to process our gas when commodity prices fell. We addressed the issue in 2019 by restructuring those contracts to pay gatherers and processors a fixed fee rather than a percentage of net proceeds. This effectively shifts all of the commodity price risk to Diamondback and reduces flaring as the gatherers and processors are simply paid for their service rather than the price of the commodity. This is one of the ways we have economically incentivized our midstream partners to reduce flaring across our acre-age position, even though the decision might reduce our cash flow.
We also continue to adopt improved technologies and onsite practices that move us closer to our ultimate goal: capture 100% of emissions coming off tanks and drastically reduce combustion and flared gas released into the atmo-sphere. To accomplish this, every facility built since 2014 has featured vapor recovery towers and vapor recovery units. These systems have reduced flared gas by 30% on an absolute basis and contributed to a comparable decrease per unit of overall production.
Other actions in 2019 included building a new compressed natural gas plant in one of our Southern Delaware Basin fields where takeaway capacity is limited due to the absence of pipeline infrastructure. The compressed natural gas plant will allow us to reduce flaring by several million standard cubic feet (scf) per day in that field until it reaches full-field development with permanent takeaway infrastruc-ture in place.
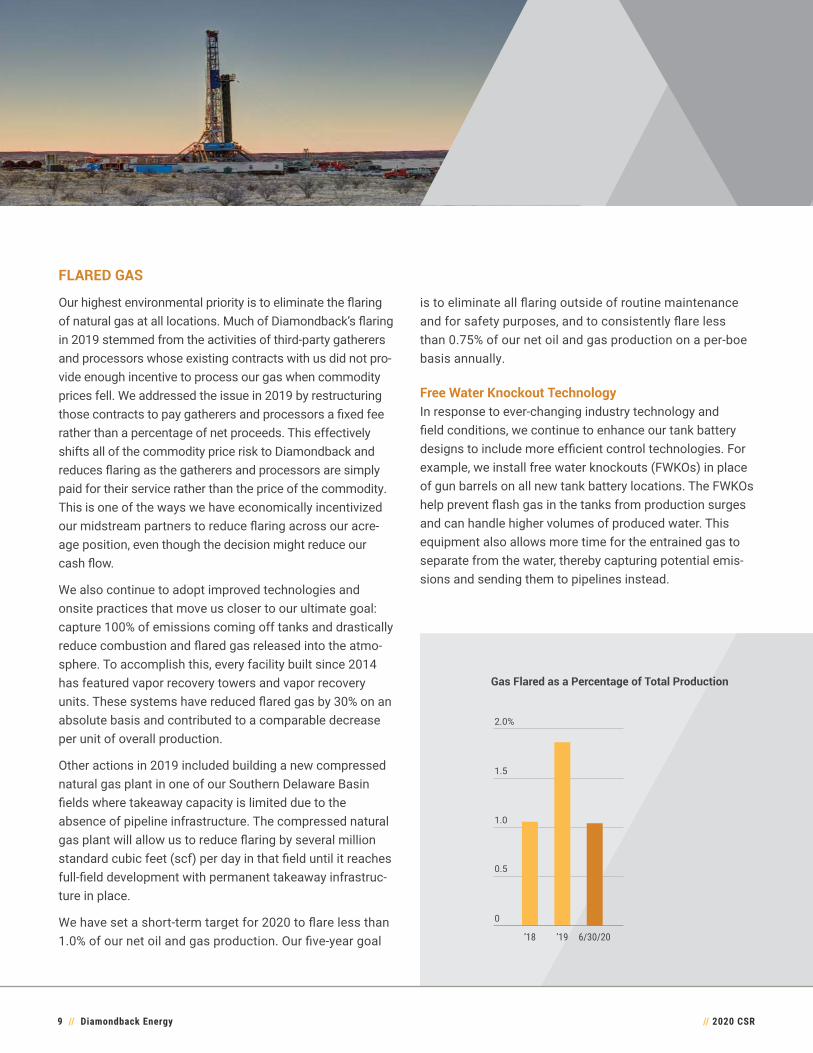
We have set a short-term target for 2020 to flare less than 1.0% of our net oil and gas production. Our five-year goal
is to eliminate all flaring outside of routine maintenance and for safety purposes, and to consistently flare less than 0.75% of our net oil and gas production on a per-boe basis annually.
Free Water Knockout TechnologyIn response to ever-changing industry technology and field conditions, we continue to enhance our tank battery designs to include more efficient control technologies. For example, we install free water knockouts (FWKOs) in place of gun barrels on all new tank battery locations. The FWKOs help prevent flash gas in the tanks from production surges and can handle higher volumes of produced water. This equipment also allows more time for the entrained gas to separate from the water, thereby capturing potential emis-sions and sending them to pipelines instead.
0.0
0.5
1.0
1.5
2.0
0
’18 ’19 6/30/20
0.5
1.0
1.5
2.0%
Gas Flares as % of Total Production Gas Flared as a Percentage of Total Production

// 2020 CSR10 // Diamondback Energy
0
3
6
9
12
15
18
0
6
3
’17
9
12
15
18%
’18 ’19
0.0
0.5
1.0
1.5
2.0
2.5
0
0.5
’17 ’18
1.0
1.5
2.0
2.5
’19
Percentage of Recycled Produced Water
Water Intensity
0
3
6
9
12
15
18
0
6
3
’17
9
12
15
18%
’18 ’19
0.0
0.5
1.0
1.5
2.0
2.5
0
0.5
’17 ’18
1.0
1.5
2.0
2.5
’19
Percentage of Recycled Produced Water
Water Intensity Freshwater Intensity Produced After BOE(BBL of freshwater used in completions/BOE)
WATER USAGE
Diamondback strives to use water responsibly and to mini-mize the Company’s draw on local water resources. We use a blend of recycled produced water, brackish water and freshwater for our completion operations across the basin, with an increased focus on both produced and brackish water as the primary options for water use.
Over the course of 2019, we invested more than $3 million to expand and improve our water recycling infrastructure. As a result, our use of recycled water for completions increased to 16.9% of total water used in completions in 2019, compared with 10.7% in 2018 and less than 1% in 2017. In addition, we spent approximately $60 million in 2019 on produced water gathering and disposal infrastruc-ture, much of which aids the process of water recycling.
In 2019, we undertook a study to classify fresh and brackish (non-potable) water use throughout our operating areas. We employed a third-party lab to test water quality parameters in order to classify the amounts of groundwater used. This test-ing established total dissolved solids (TDS) as the key deter-mining factor between fresh and brackish water, wherein freshwater contained less than 2,000 parts per million (ppm) of TDS. We sampled approximately 100 water supply wells and then correlated the water-quality data to water purchased from each source in 2019. When adding in the produced water used during operations, we determined that our drilling and completions operations consumed 49% brackish water, 35% freshwater and 16% produced water during 2019. With increasing midstream infrastructure to measure the salinity of every water source in our fields, we can more effectively maximize recycled and brackish water use.
Modifying our completion design has also helped us maxi-mize productivity while minimizing freshwater use. In 2019, we decreased our freshwater intensity rate to 0.56 BBL/BOE compared with 1.62 in 2018, with the majority of that decrease occurring in the Delaware Basin. Wells in the Delaware Basin have a higher water-to-oil ratio than in the Midland Basin, which allows Diamondback to utilize a higher percentage of recycled produced water in the Delaware Basin. Our five-year goal is to source 40% of the water that we use for completion operations from recycled sources in the Delaware Basin and 20% from recycled sources in the Midland Basin, with a company-wide goal of 25% recycled water use. Our minimum target for 2020 is to use at least 10% recycled water company-wide.
Diamondback uses the World Resources Institute’s Aqueduct Water Risk Atlas to categorize scarce water zones in our operating area. This tool helps guide us to make environmentally responsible decisions for future water needs. We recognize that our operations are primarily located in a water scarce region. As such, Diamondback’s overall goal is to minimize freshwater use and maximize recycled produced water and brackish water for our opera-tions in all areas. For more details on Diamondback’s water-management program and processes, please refer to our 2020 CDP Water Security response.
Percentage of Recycled Produced Water Used in Completion Operations(BBL)

// 2020 CSR11 // Diamondback Energy
SPILLS AND SPILL MANAGEMENT
Our goal is to eliminate all spills of crude oil and produced water. We follow a disciplined process of prevention, con-tainment and management. We work to mitigate spills through a three-step process:
1. Engineering process designs and reviews in which BACT is included
2. Construction packages and pre-startup safety reviews
3. Safe work practices within the operational teams
In addition, our operations team also reviews every site and process to ensure full alignment of these work practices.
Our hydrocarbon spill rate per 1,000 barrels decreased from 0.10 in 2018 to 0.06 in 2019. However, our rate of produced water spills per 1,000 barrels rose from 0.26 to 0.29 year over year, due in large part to our increased handling of recycled water. We continue to focus on eliminating spills across our organization, particularly during water recycling operations. We require our water transfer services contrac-tors to conduct routine visual inspections on lines that provide water to our completion operations.
Diamondback creates and maintains Spill Prevention Control and Countermeasure (SPCC) plans in accordance with federal regulations for our production facilities that have the potential to impact waters of the United States.
We also rolled out a more effective incident reporting sys-tem in 2019 that enables our employees and independent contractors to communicate more effectively for faster spill response and remediation.
In addition, Diamondback recently formed an internal Spill Reduction Task Force—consisting of cross-company, multi-functional team members—to understand the sources and causes of spills, perform root-cause analyses, and imple-ment design and operational changes to mitigate and elimi-nate similar issues in the future. This team is expected to allocate at least 5% of each employee’s monthly time to spill mitigation. We have also undertaken a company-wide review of our supervisory control and data acquisition (SCADA) and
0.00
0.05
0.10
0.15
0.20
0.25
0
Diamondback PBPA Average
’17 ’18 ’19
AXPC Average
0.05
0.10
0.15
0.20
0.25
Total Fluid Spill Rate per 1,000 BBL Produced Fluids vs. Industry Average
0.00
0.05
0.10
0.15
0.20
0.25
0.30
Diamondback Energy Spill Rate (2018)
0
0.15
0.10
0.05
0.20
0.25
0.30
0.00
0.05
0.10
0.15
0.20
0.25
0.30
Total Volume of Spills and Total Volume Recovered (BBLs in thousandst)
0
0.20
0.15
0.10
0.05
0.25
0.30
Hydrocarbon and Non-Hydrocarbon Spill Rates(per 1MBBL)
Non-Hydrocarbon
Hydrocarbon
<0.01%Our target spill rate (representing gross barrels of oil produced) in 2020.
// 2020 CSR12 // Diamondback Energy
automation systems to further reduce the number and impact of spills and provide better remote operational support.
Further, Diamondback continues to utilize impervious barriers on all tank batteries constructed and placed into operations. While this barrier will not prevent primary containment failure, it will prevent a spill from reaching and penetrating the sur-face. This barrier allows for 100% recovery of all liquid within the concerned area. A third party provides aerial surveillance twice a week to monitor potential spills or releases across all of our assets. This service has the potential to catch releases and allow us to mitigate additional impacts.
Spill Prevention TechnologiesWe install high-liquid-level alarms on all storage tanks as well as high-level “well-kill” systems. The high-level alarm allows operations personnel to respond to upset situations at each facility prior to a loss of containment or loss of pro-duction. The high-level well kill is an additional safeguard that sends a signal to each well associated with that battery and shuts the well in to prevent a spill. Through automation at Diamondback facilities, lease operations personnel can view tank levels and production data through their phones and computers. Additionally, Diamondback is in the initial stages of using SCADA to predict product inflows and alert personnel of impending issues with tank levels.
Pipeline integrity measuresWe have installed multiple pressure-control valves that send alarms and pump-kill signals in the event that pressure on a pipeline exceeds our internal design standards. In addition to the process control valves, we have placed multiple safety
systems within our pipeline assets to detect a potential loss of containment and close valves to prevent additional spilled volumes. While these valves will not prevent a spill, they immediately stop the flow.
SCADADiamondback is also undergoing a company-wide initiative to evaluate all current SCADA systems and surveillance pack-ages to ensure appropriate design and implementation. Deficiencies will be brought up to Diamondback’s standards. We are also writing SCADA and automation standards for all construction projects moving forward, incorporating both our findings and emerging technologies.
MonitoringWe engage overnight operators to monitor our assets with high levels of activities. These operators are fully trained and qualified to operate all of our upstream assets and serve as our primary stopgap for preventing spills during nighttime operations.
// 2020 CSR13 // Diamondback Energy
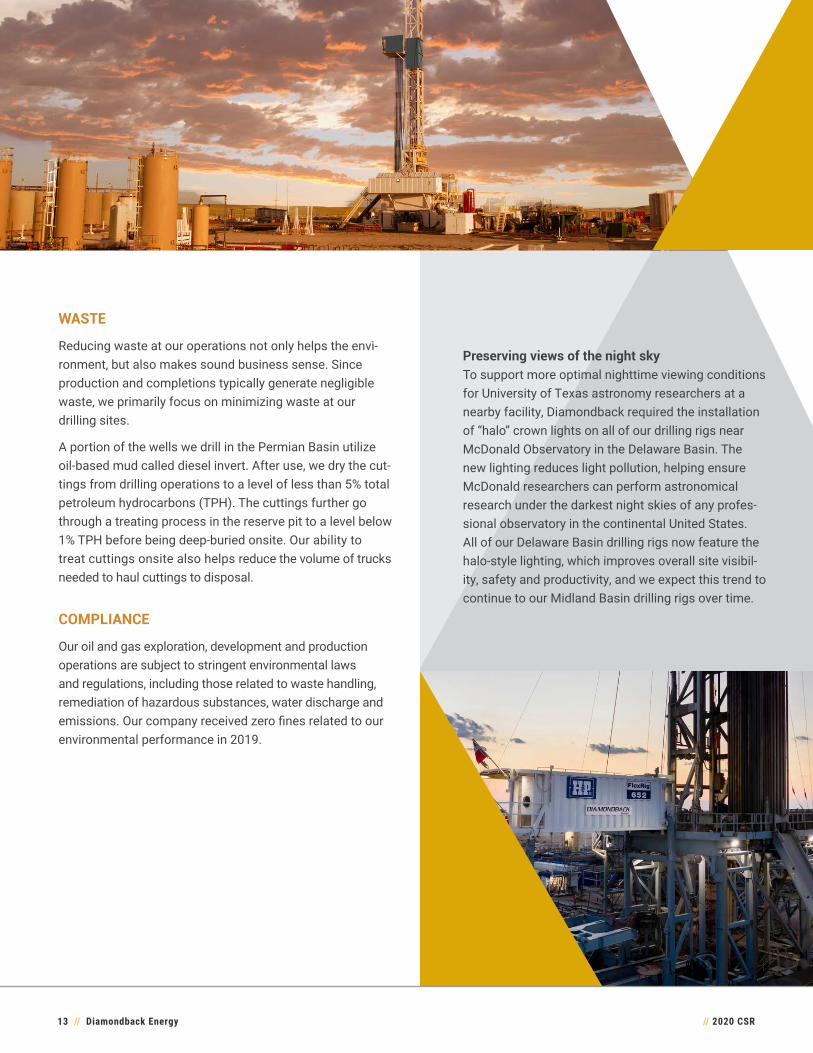
WASTE
Reducing waste at our operations not only helps the envi-ronment, but also makes sound business sense. Since production and completions typically generate negligible waste, we primarily focus on minimizing waste at our drilling sites.
A portion of the wells we drill in the Permian Basin utilize oil-based mud called diesel invert. After use, we dry the cut-tings from drilling operations to a level of less than 5% total petroleum hydrocarbons (TPH). The cuttings further go through a treating process in the reserve pit to a level below 1% TPH before being deep-buried onsite. Our ability to treat cuttings onsite also helps reduce the volume of trucks needed to haul cuttings to disposal.
COMPLIANCE
Our oil and gas exploration, development and production operations are subject to stringent environmental laws and regulations, including those related to waste handling, remediation of hazardous substances, water discharge and emissions. Our company received zero fines related to our environmental performance in 2019.
Preserving views of the night skyTo support more optimal nighttime viewing conditions for University of Texas astronomy researchers at a nearby facility, Diamondback required the installation of “halo” crown lights on all of our drilling rigs near McDonald Observatory in the Delaware Basin. The new lighting reduces light pollution, helping ensure McDonald researchers can perform astronomical research under the darkest night skies of any profes-sional observatory in the continental United States. All of our Delaware Basin drilling rigs now feature the halo-style lighting, which improves overall site visibil-ity, safety and productivity, and we expect this trend to continue to our Midland Basin drilling rigs over time.
// 2020 CSR14 // Diamondback Energy
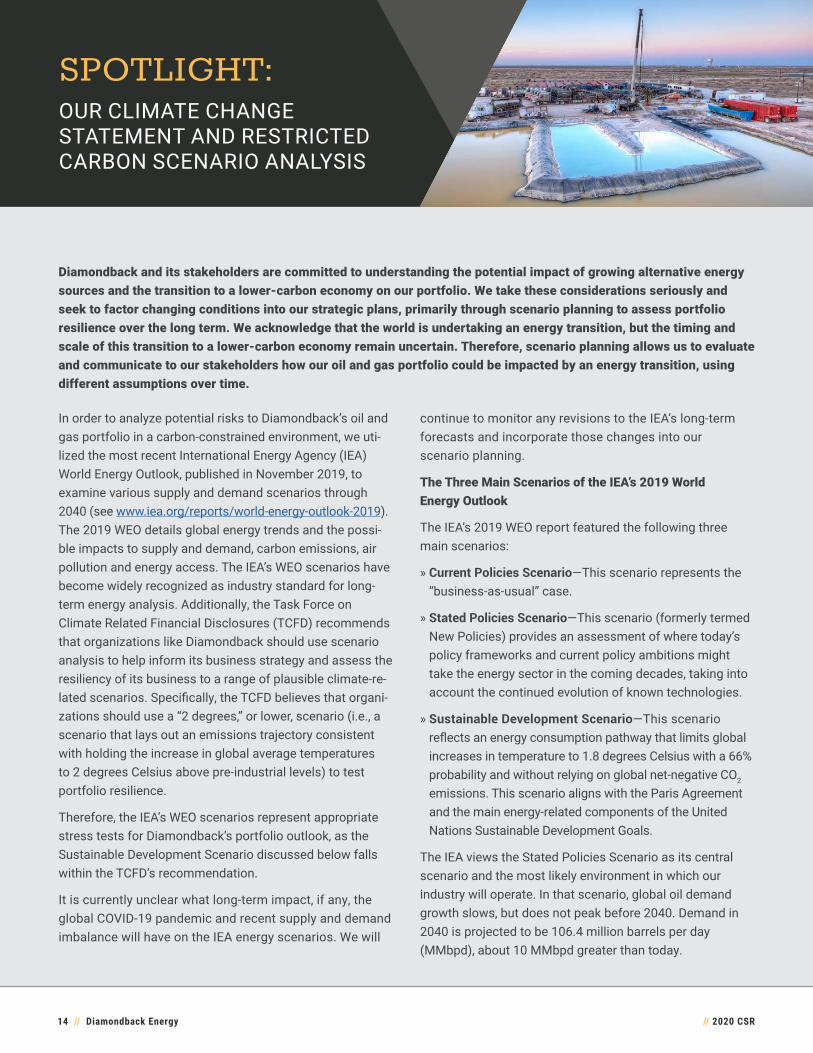
SPOTLIGHT:
Diamondback and its stakeholders are committed to understanding the potential impact of growing alternative energy sources and the transition to a lower-carbon economy on our portfolio. We take these considerations seriously and seek to factor changing conditions into our strategic plans, primarily through scenario planning to assess portfolio resilience over the long term. We acknowledge that the world is undertaking an energy transition, but the timing and scale of this transition to a lower-carbon economy remain uncertain. Therefore, scenario planning allows us to evaluate and communicate to our stakeholders how our oil and gas portfolio could be impacted by an energy transition, using different assumptions over time.
In order to analyze potential risks to Diamondback’s oil and gas portfolio in a carbon-constrained environment, we uti-lized the most recent International Energy Agency (IEA) World Energy Outlook, published in November 2019, to examine various supply and demand scenarios through 2040 (see www.iea.org/reports/world-energy-outlook-2019). The 2019 WEO details global energy trends and the possi-ble impacts to supply and demand, carbon emissions, air pollution and energy access. The IEA’s WEO scenarios have become widely recognized as industry standard for long-term energy analysis. Additionally, the Task Force on Climate Related Financial Disclosures (TCFD) recommends that organizations like Diamondback should use scenario analysis to help inform its business strategy and assess the resiliency of its business to a range of plausible climate-re-lated scenarios. Specifically, the TCFD believes that organi-zations should use a “2 degrees,” or lower, scenario (i.e., a scenario that lays out an emissions trajectory consistent with holding the increase in global average temperatures to 2 degrees Celsius above pre-industrial levels) to test portfolio resilience.
Therefore, the IEA’s WEO scenarios represent appropriate stress tests for Diamondback’s portfolio outlook, as the Sustainable Development Scenario discussed below falls within the TCFD’s recommendation.
It is currently unclear what long-term impact, if any, the global COVID-19 pandemic and recent supply and demand imbalance will have on the IEA energy scenarios. We will
continue to monitor any revisions to the IEA’s long-term forecasts and incorporate those changes into our scenario planning.
The Three Main Scenarios of the IEA’s 2019 World Energy Outlook
The IEA’s 2019 WEO report featured the following three main scenarios:
» Current Policies Scenario—This scenario represents the “business-as-usual” case.
» Stated Policies Scenario—This scenario (formerly termed New Policies) provides an assessment of where today’s policy frameworks and current policy ambitions might take the energy sector in the coming decades, taking into account the continued evolution of known technologies.
» Sustainable Development Scenario—This scenario reflects an energy consumption pathway that limits global increases in temperature to 1.8 degrees Celsius with a 66% probability and without relying on global net-negative CO2 emissions. This scenario aligns with the Paris Agreement and the main energy-related components of the United Nations Sustainable Development Goals.
The IEA views the Stated Policies Scenario as its central scenario and the most likely environment in which our industry will operate. In that scenario, global oil demand growth slows, but does not peak before 2040. Demand in 2040 is projected to be 106.4 million barrels per day (MMbpd), about 10 MMbpd greater than today.
OUR CLIMATE CHANGE STATEMENT AND RESTRICTED CARBON SCENARIO ANALYSIS
// 2020 CSR15 // Diamondback Energy
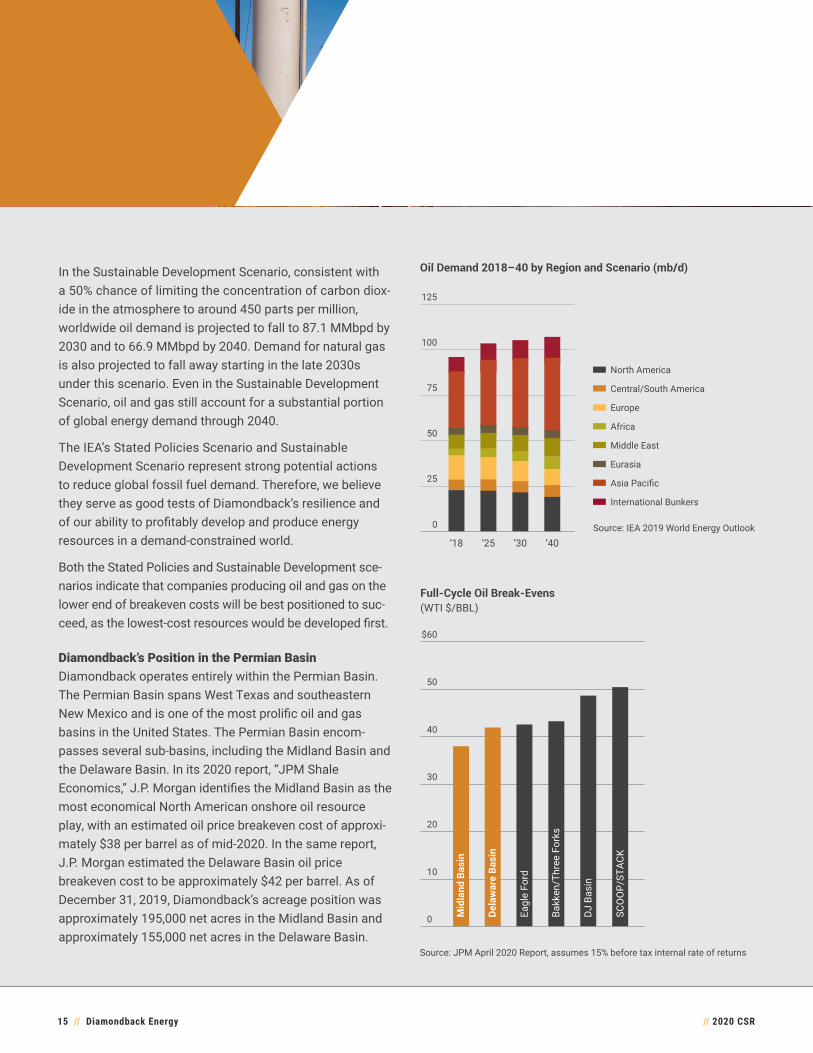
In the Sustainable Development Scenario, consistent with a 50% chance of limiting the concentration of carbon diox-ide in the atmosphere to around 450 parts per million, worldwide oil demand is projected to fall to 87.1 MMbpd by 2030 and to 66.9 MMbpd by 2040. Demand for natural gas is also projected to fall away starting in the late 2030s under this scenario. Even in the Sustainable Development Scenario, oil and gas still account for a substantial portion of global energy demand through 2040.
The IEA’s Stated Policies Scenario and Sustainable Development Scenario represent strong potential actions to reduce global fossil fuel demand. Therefore, we believe they serve as good tests of Diamondback’s resilience and of our ability to profitably develop and produce energy resources in a demand-constrained world.
Both the Stated Policies and Sustainable Development sce-narios indicate that companies producing oil and gas on the lower end of breakeven costs will be best positioned to suc-ceed, as the lowest-cost resources would be developed first.
Diamondback’s Position in the Permian BasinDiamondback operates entirely within the Permian Basin. The Permian Basin spans West Texas and southeastern New Mexico and is one of the most prolific oil and gas basins in the United States. The Permian Basin encom-passes several sub-basins, including the Midland Basin and the Delaware Basin. In its 2020 report, “JPM Shale Economics,” J.P. Morgan identifies the Midland Basin as the most economical North American onshore oil resource play, with an estimated oil price breakeven cost of approxi-mately $38 per barrel as of mid-2020. In the same report, J.P. Morgan estimated the Delaware Basin oil price breakeven cost to be approximately $42 per barrel. As of December 31, 2019, Diamondback’s acreage position was approximately 195,000 net acres in the Midland Basin and approximately 155,000 net acres in the Delaware Basin.
10
30
20
40
50
$60
00
10
20
30
40
50
60
SCOOP/STACKDJ BasinBakken/Three ForksDelawareEagle FordMidland
Mid
land
Bas
in
Dela
war
e Ba
sin
Eagl
e Fo
rd
Bakk
en/T
hree
For
ks
DJ B
asin
SCO
OP/
STAC
K
Full-Cycle Oil Break-Evens(WTI $/BBL)
Source: JPM April 2020 Report, assumes 15% before tax internal rate of returns
0
50
25
75
100
125
’40’30’25’18 0
0.15
0.10
0.05
0.20
0.25
0.30
North America
Middle East
Eurasia
Asia Pacific
International Bunkers
Africa
Central/South America
Europe
Oil Demand 2018–40 by Region and Scenario (mb/d)
Source: IEA 2019 World Energy Outlook
// 2020 CSR16 // Diamondback Energy
0
15
30
45
DVNOVVCXOMROCLRWPXMGYPDCEXECEOGPXDPEFANG
Company 13
Company 12
Company 11
Company 10
Company 9
Company 8
Diamondback
Company 6
Company 7
Company 5
Company 4
Company 3
Company 2
0
15
30
$45
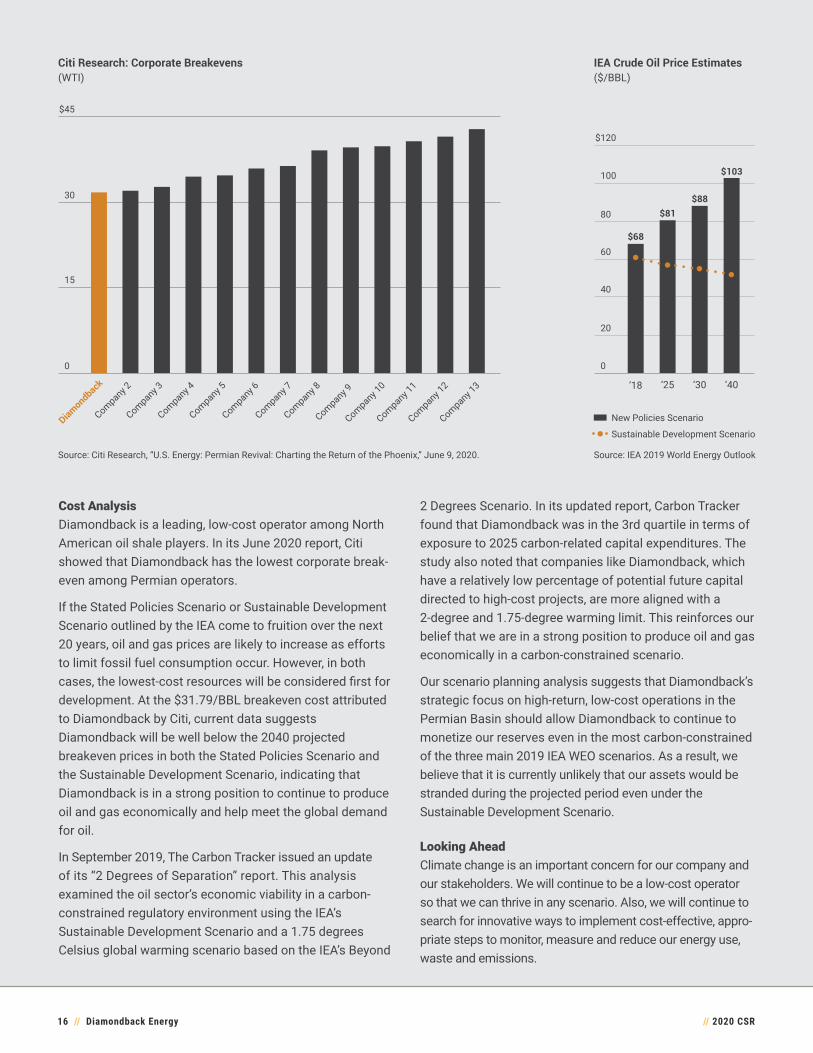
Citi Research: Corporate Breakevens (WTI)
Source: Citi Research, “U.S. Energy: Permian Revival: Charting the Return of the Phoenix,” June 9, 2020.
Cost AnalysisDiamondback is a leading, low-cost operator among North American oil shale players. In its June 2020 report, Citi showed that Diamondback has the lowest corporate break-even among Permian operators.
If the Stated Policies Scenario or Sustainable Development Scenario outlined by the IEA come to fruition over the next 20 years, oil and gas prices are likely to increase as efforts to limit fossil fuel consumption occur. However, in both cases, the lowest-cost resources will be considered first for development. At the $31.79/BBL breakeven cost attributed to Diamondback by Citi, current data suggests Diamondback will be well below the 2040 projected breakeven prices in both the Stated Policies Scenario and the Sustainable Development Scenario, indicating that Diamondback is in a strong position to continue to produce oil and gas economically and help meet the global demand for oil.
In September 2019, The Carbon Tracker issued an update of its “2 Degrees of Separation” report. This analysis examined the oil sector’s economic viability in a carbon- constrained regulatory environment using the IEA’s Sustainable Development Scenario and a 1.75 degrees Celsius global warming scenario based on the IEA’s Beyond
2 Degrees Scenario. In its updated report, Carbon Tracker found that Diamondback was in the 3rd quartile in terms of exposure to 2025 carbon-related capital expenditures. The study also noted that companies like Diamondback, which have a relatively low percentage of potential future capital directed to high-cost projects, are more aligned with a 2-degree and 1.75-degree warming limit. This reinforces our belief that we are in a strong position to produce oil and gas economically in a carbon-constrained scenario.
Our scenario planning analysis suggests that Diamondback’s strategic focus on high-return, low-cost operations in the Permian Basin should allow Diamondback to continue to monetize our reserves even in the most carbon-constrained of the three main 2019 IEA WEO scenarios. As a result, we believe that it is currently unlikely that our assets would be stranded during the projected period even under the Sustainable Development Scenario.
Looking AheadClimate change is an important concern for our company and our stakeholders. We will continue to be a low-cost operator so that we can thrive in any scenario. Also, we will continue to search for innovative ways to implement cost-effective, appro-priate steps to monitor, measure and reduce our energy use, waste and emissions.
IEA Crude Oil Price Estimates($/BBL)
0
40
20
60
80
100
$120
0
20
40
60
80
100
120
2040203020252017 ’40
$103
$81
$68
’30’25’18
$88
Source: IEA 2019 World Energy Outlook
New Policies Scenario
Sustainable Development Scenario

// 2020 CSR17 // Diamondback Energy
We systematically identify, assess and resolve a broad spectrum of current and potential risks that might compromise our ability to operate safely and responsibly.
OUR COMMITMENT TO MANAGING AND REDUCING RISKS
Diamondback’s senior leaders also monitor emerging trends and shifting conditions in the energy industry, ranging from new regulatory requirements to the impacts of global climate change, so that we are prepared to respond effectively.

// 2020 CSR18 // Diamondback Energy
MAINTAINING SECURE FACILITIES AND OPERATIONS
We are vigilant about safeguarding our people and property. Our security experts deploy and regularly update technolo-gies designed to thwart security threats. As a result, Diamondback facilities experienced no major security inci-dents in 2019.
Our protective actions last year included expanding our full-time HSE team responsible for monitoring specific facilities and addressing potential issues. For example, our augmented inspections of Diamondback and Rattler’s pipeline operations have enabled us to detect and repair pinhole leaks before they could grow and cause larger spills. We also instituted around-the-clock gate security at our largest operations in the Delaware and Midland basins to limit access to authorized employees and independent contractors only.
GUARDING AGAINST CYBERATTACKS AND BREACHES
We continually evolve and harden our information technol-ogy (IT) security systems to repel threats and minimize damage from any breaches that might occur. Our IT person-nel and end users receive regular training in cybersecurity best practices.
PREPARING FOR EMERGENCIES
Natural disasters, accidental spills and human-instigated threats are among the potential hazards that we encounter as an outgrowth of our work. We regularly develop and review our emergency response plans to cover likely scenarios.
Each of our corporate and field-office facilities has its own written plan that includes information on how to safely evacuate the building. We train teams of employees at each location to assist their co-workers in the event of a fire, bomb threat or other crisis. We also conduct annual full-scale drills to maximize emergency preparedness.
In early March 2020, shortly after the World Health Organization declared COVID-19 a pandemic, Diamondback enacted an emergency response plan that included immedi-ately transitioning all office employees to working from home indefinitely. We took this action to protect all employ-ees and independent contractors from the potential spread of the virus. Our IT systems transitioned seamlessly through this process. We did not experience any service interruptions and have maintained our field operations with-out any issues related to the pandemic. As of the filing of this report, we have yet to return to 100% office occupancy; however, we continue to maintain our best-in-class operations.
MINIMIZING RISKS TO LOCAL COMMUNITIES
Most of Diamondback’s operations are in unpopulated areas. In situations where our work poses a potential risk, we assign personnel to communicate with residents and moni-tor our daily operations to prevent or minimize any potential adverse impacts. This includes providing information to help the public avoid potentially hazardous conditions or activities near our pipelines, well sites and other operations. If any of our operations are near a populated area, we add extra secu-rity and protection around that facility.
We also have installed automated monitoring equipment at all production facilities to help safeguard people and the environment.

// 2020 CSR19 // Diamondback Energy
OUR COMMITMENT TO GOVERNANCE & BUSINESS ETHICS
We operate with integrity and transparency while striving to govern our business with the highest ethical standards.

// 2020 CSR20 // Diamondback Energy
OVERALL GOVERNANCE
Diamondback’s approach to corporate governance seeks to promote communication, transparency and accountability so that risks can be evaluated and accounted for in developing the Company’s long-term business strategy.
The highest level of oversight at the Company rests with the Board of Directors, who are elected annually by the Company’s stockholders. In recommending candidates for election to the board, the Nominating and Corporate Governance Committee of the Board evaluates, among other things the Committee may deem relevant, a candidate’s character, judgment, skill set, experience, independence and other time commitments.
The Nominating and Corporate Governance Committee is committed to continuous improvement and employs a rig-orous process to ensure that the composition of the board is diverse, balanced and aligned with the evolving needs of the Company.
In April 2020, we expanded our Board from six members to eight, reflecting Diamondback’s rapid growth as well as our increased focus on ESG objectives. We also continue to expand the ethnic and gender diversity of our Board, adding three diverse members since 2018. Seven of our eight direc-tors are independent under the NASDAQ listing standards and the rules of the Securities and Exchange Commission. The average age of our Board members is 60.5, and the aver-age tenure of the Company’s directors is 5.3 years.
Our newest Board members are:
» Stephanie Mains, who brings more than 30 years of expe-rience spanning the aviation, energy and transportation industries
» Vincent Brooks, a career U.S. Army officer who retired from active duty in 2019 as a four-star general after 42 years of service
Diamondback’s Board currently has four Committees, each of which is comprised entirely of independent directors. All of our Committee charters and certain key governance poli-cies are made available on Diamondback’s website.
Diamondback’s Audit Committee monitors and oversees the Company’s accounting, auditing and financial report-ing processes generally and monitors internal control risk and legal and regulatory compliance risk matters. The Company’s Compensation Committee oversees and administers our executive compensation policies, plans and practices and evaluates their impact on risk and risk management. The Nominating and Corporate Governance Committee assists the Board in developing criteria for, identifying and evaluating individuals qualified to serve as a member of the Board. Finally, Diamondback’s Safety, Sustainability and Corporate Responsibility Committee reviews and oversees management’s monitoring of, and adherence to, the Company’s approach to corporate respon-sibility, including its strategy, policies and practices regard-ing ESG matters.
The Chairman and CEO positions at Diamondback are held by separate individuals, with the Chairman serving as an Independent Director.
CODE OF CONDUCT
Our Corporate Compliance and Code of Business Ethics Handbook (Code) forms the foundation of our compliance program and our company-wide commitment to operating with integrity. It lays out clear standards on a variety of mat-ters, including conflicts of interest, confidentiality, vendor relationships, related party transactions and compliance with various laws, including those relating to corruption, bribery, money laundering, antitrust and insider trading. Diamondback’s Code is reviewed regularly and revised as needed to address matters applicable to the Company’s business. In addition to the Code, the Company maintains specific supplemental policies that address individual issues that may not be relevant to the entire Company, such as the supplemental trading policy for officers, directors and other designated individuals.
We review and monitor all conflict-of-interest disclosures made by employees in accordance with the provisions of the Code. Additionally, all officers and directors annually
38%Ethnic and gender diversity within our eight-member Board, including two female directors
“ Diamondback is committed to being best in class both in terms of disclosure, but more importantly, performance when it comes to sustainable development of our natural resources.”
—Steve West, Chairman of the Board
// 2020 CSR21 // Diamondback Energy
complete comprehensive D&O questionnaires that address various conflicts of interest and related party matters.
All Diamondback employees annually certify as to their receipt of, and agreement to comply with, the Code. Diamondback also endeavors to provide training on various topics set forth in the Code and other policies, including con-flicts of interest, workplace harassment and insider trading.
The Code provides that employees are responsible for reporting known or suspected conduct that may be illegal, unethical or otherwise violative of the provisions of the Code. We maintain a 24-hour, toll-free compliance hot-line that is managed by a third party and allows people to anonymously report such conduct. Diamondback maintains strict policies that prohibit retaliation against an employee for reporting in good faith any known or suspected misconduct.
CORPORATE RESPONSIBILITY OVERSIGHT
Our 15-member executive team includes members who are diverse in gender, race, functional experience, and education. This team oversees all corporate responsibility strategies and activities at Diamondback. To help inform Board decisions, we engage Diamondback’s largest stockholders at least annually for their insights and suggestions regarding our corporate gov-ernance standards, compensation and sustainability efforts. Last year, we reached investors representing more than 62% of our outstanding shares through these efforts.
Sharpening our ESG focusDiamondback’s long-range business success relies on developing our oil and gas resources sustainably and creat-ing a positive impact in the communities where we operate. In 2019, we tied these and other ESG priorities more directly into our governance standards and how we evaluate perfor-mance company-wide.
A new Safety, Sustainability and Corporate Responsibility Committee of our Board now supports Diamondback management in setting ESG strategy, including the estab-lishment of short-term and multi-year goals accompanied by specific performance targets. Chaired by Melanie Trent, the four-member committee also serves as a bridge between the Board and Company stockholders on ESG matters.
In addition, the Board last year added five ESG metrics to Diamondback’s annual short-term incentive (STI) compen-sation scorecard. Under the expanded set of metrics, 15% of the STI award to senior executives, managers and other
eligible employees is determined by whether the Company achieves its goals for:
» Reducing natural gas flaring: Less than 1.0% of net pro-duction flared (net BOEs of flared production divided by net BOEs produced)
» Lowering greenhouse gas emission intensity: Less than 14.00 (thousands of tons of CO2e emitted divided by MBOE produced)
» Minimizing oil spills: Less than 0.01% of gross barrels of oil produced (reportable gross oil barrels spilled divided by total gross oil barrels produced)
» Increasing recycled water use in completion operations: More than 10% of water used for completion operations sourced from recycled water
» Maximizing the safety of our employees through a total recordable incident rate target: at or below 0.5 recordable incidents per 200,000 personnel hours recorded
BUSINESS ETHICS
Our compliance program comprises standards of conduct and internal controls reasonably capable of detecting and reducing the likelihood of criminal and other improper con-duct, including these six principal components:
» Organizational leadership» Standards and procedures» Efforts to exclude bad actors from positions of authority» Training and education» Monitoring, auditing and evaluation of program effectiveness» Appropriate disciplinary and remedial actions
COMPLIANCE
The Board of Directors exercises overall compliance program oversight, while the Chief Financial Officer and General Counsel assume day-to-day responsibility. The CEO’s role is to foster a culture of transparency, integrity and compliance with all applicable laws.
LOBBYING AND TRADE ASSOCIATION ACTIVITIES
Our Government Affairs group works closely with various organizations representing the oil and gas industry in Texas and Washington, D.C. to help shape regulatory and pub-lic policy decisions that affect Diamondback operations. Diamondback’s involvement in cross-industry associations and working groups also creates valuable opportunities to share best practices and hone our overall ESG strategy.

// 2020 CSR22 // Diamondback Energy
The culture we have developed is grounded upon the solid foundation of our core values—leadership, integrity, excellence, people and teamwork—that are adhered to throughout the organization. We work tirelessly to minimize the risk of workplace incidents and prepare ahead for emergencies as an indelible element of our corporate responsibility.
OUR COMMITMENT TO OUR PEOPLE
TOTAL EMPLOYEES (at year-end)
2016: 1452017: 252 2018: 7112019: 712
In setting this high bar for all of our employees in terms of how they operate and interact, both within the office and out in the field, our employees are challenged each day with identifying new ways to foster a better future for themselves and the organization. We deeply value the perspec-tives and experiences from our diverse team and are proud that as our headcount has scaled up with the business in recent years, so too has our inclusion of additional team members from a range of ethnic, cultural, and ideological backgrounds.

// 2020 CSR23 // Diamondback Energy
DIVERSITY AND INCLUSION
We continue to cultivate an inclusive and respectful work environment that encourages our employees to achieve their full potential.
Building upon the nearly five-fold growth in Diamondback’s employee base since 2016, we actively seek to attract and retain an increasingly diverse workforce. Nearly a third of our employees are women and 25% are ethnic minorities.
At the end of 2019, women held 19% of all management posi-tions and 40% of all professional positions at Diamondback, compared with 28% and 42%, respectively, in 2018. Our pro-portion of ethnically diverse managers increased from 14% in 2018 to 20% in 2019, and 14% of our professional-level positions were held by minorities.
Equal employment opportunity is a core tenet within our People Policies Handbook. Employment decisions are based on merit, qualifications, competencies and con-tributions. Employees can raise questions or concerns about any type of discrimination in our workplace, without fear of reprisal, to the Human Resources department or through our toll-free Compliance Hotline.
HUMAN RIGHTS POLICY
Diamondback is committed to conducting its business in a manner that respects and promotes the fundamental rights and dignity of all people, in compliance with all applicable legal requirements. Our Human Rights Policy is posted on our website.
PROFESSIONAL DEVELOPMENT
Professional development includes exposure to new knowl-edge that our employees can apply to their on-the-job activ-ities. We support employees in pursuing opportunities to expand their professional skills through internal and external opportunities.
Course offerings in 2019 included insight into how person-ality traits and communication styles influence people’s leadership approach. We also provided a range of training
opportunities aligned with specific roles and responsibilities throughout Diamondback’s operations. Examples include:
» Live2Lead – Leadership Training » Performance Management Training » Interviewer Training » Microsoft Excel Training
Percentage of Female Employees
0
200
400
600
800
0
200
2016 2017 2018
400
600
800
0
30
25
20
15
10
5
35%
0
5
10
15
20
25
30
35
Total Employees
Percentage of Female Employees
’16 ’17 ’18 ’19
0
5
10
15
20
25
Percentage of Minority Employees
0
20
15
10
5
25%
’16 ’17 ’18 ’19
Management
Total
Percentage of Minority Employees
0
200
400
600
800
0
200
2016 2017 2018
400
600
800
0
30
25
20
15
10
5
35%
0
5
10
15
20
25
30
35
Total Employees
Percentage of Female Employees
’16 ’17 ’18 ’19
0
5
10
15
20
25
Percentage of Minority Employees
0
20
15
10
5
25%
’16 ’17 ’18 ’19
Management
Total

// 2020 CSR24 // Diamondback Energy
HEALTH AND SAFETY
Protecting employees, the public and the environment is a top priority in our operations and in the way we manage Diamondback’s assets. We strive to comply with all applica-ble HSE standards, laws and regulations.
We use robust tracking methods and work closely with regulatory organizations to prevent incidents. Our health and safety program delivers employee training and new-hire orientation on a variety of topics, including the importance of proper incident reporting. It also ensures that employees have all necessary equipment to operate safely.
Identifying Potential HazardsDiamondback employees and independent contractors are often in the best position to identify areas where we need to improve safety. Field personnel can easily report incidents, near misses and potential issues using our dynamic hazard identification system. Also, all employees and independent contractors have the authority to stop work if they deem it appropriate.
Using a mobile app on their smartphone, tablet or laptop, employees upload a summary and photos of the potential hazardous situation for timely follow-up by a Diamondback supervisor.
Through a unified orientation initiative called Basin United, we and other oil-and-gas operators have committed to reduce injuries and fatalities in our industry. We are aligning our employees and independent contractors around the International Association of Oil & Gas Producers (IOGP) Life Saving Rules, safety culture improvements, safety leadership actions and human performance principles.
We also involve employees from all operational levels on our Safety Committee, which provides:
» Suggested improvements to the overall safety program» Recommended preventative measures based on review-
ing vehicle and personnel incidents» Safety and environmental audits at operational locations» Audit and oversight of the Diamondback Hazard
Communication Program, in accordance with OSHA regulations
Workplace incidentsDiamondback has a record of zero employee work-related fatalities from 2016–2019. Our employee and independent contractor (“combined workforce”) OSHA recordable cases, comprising work-related injuries and illnesses that require
medical treatment beyond first aid, totaled 36 in 2019 compared with 43 in 2018. Our employee total recordable incident rate (TRIR) and lost-time incident rate (LTIR) both decreased in 2019. Our independent contractor TRIR and LTIR rose slightly, due in part to a year-over-year decrease in personnel hours worked. We have set a short-term target of maintaining an employee TRIR of 0.5 or less.
0.00
0.05
0.10
0.15
0.20
0.0
0.2
0.4
0.6
0.8
0
0.2
’18 ’19
0.4
0.8
0.6
0
’18 ’19
0.15
0.10
0.05
0.20
Total Recordable Incident Rate
Lost Time Incident Rate
Vehicle Incident Rate
0.0
0.5
1.0
1.5
2.0
0
’18 ’19
1.5
1.0
0.5
2.0
Lost Time Incident Rate— Combined Workforce(per 200k hours)
Source: AXPC EHS Benchmarking Survey (Onshore)
Diamondback
Industry Average
Total Recordable Incident Rate— Combined Workforce(per 200k hours)
0.00
0.05
0.10
0.15
0.20
0.0
0.2
0.4
0.6
0.8
0
0.2
’18 ’19
0.4
0.8
0.6
0
’18 ’19
0.15
0.10
0.05
0.20
Total Recordable Incident Rate
Lost Time Incident Rate
Vehicle Incident Rate
0.0
0.5
1.0
1.5
2.0
0
’18 ’19
1.5
1.0
0.5
2.0
Source: AXPC EHS Benchmarking Survey (Onshore)
Diamondback
Industry Average
// 2020 CSR25 // Diamondback Energy
VEHICLE SAFETY
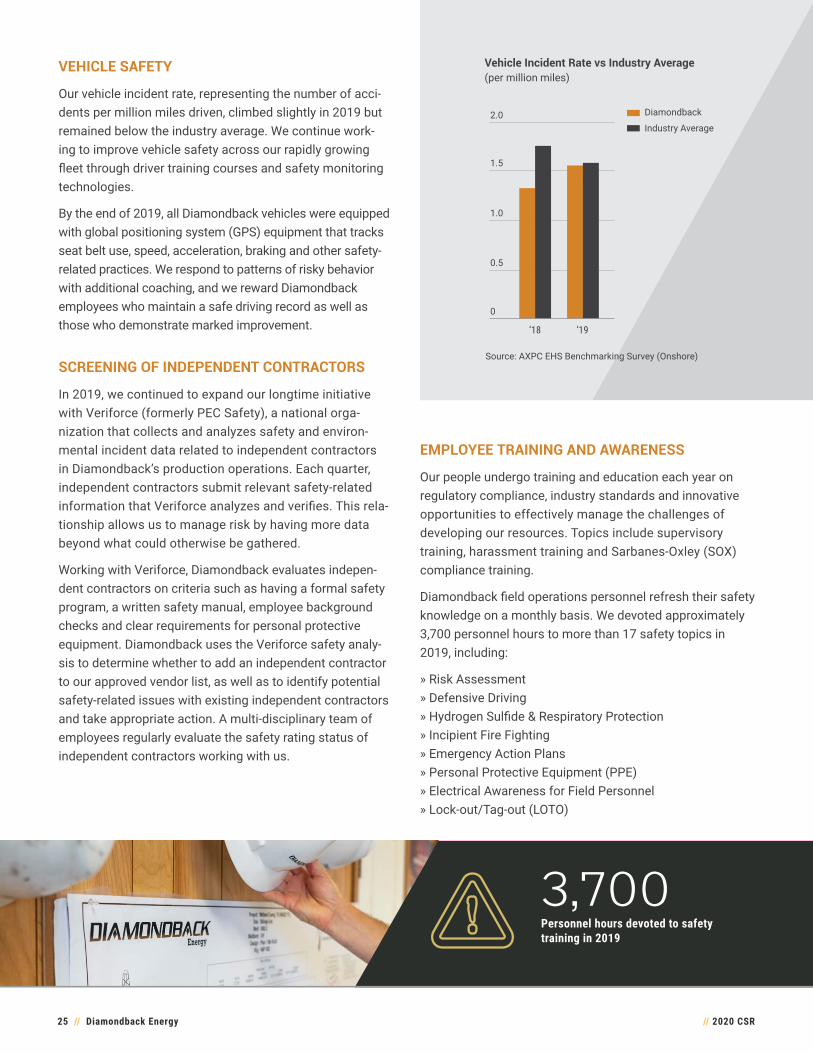
Our vehicle incident rate, representing the number of acci-dents per million miles driven, climbed slightly in 2019 but remained below the industry average. We continue work-ing to improve vehicle safety across our rapidly growing fleet through driver training courses and safety monitoring technologies.
By the end of 2019, all Diamondback vehicles were equipped with global positioning system (GPS) equipment that tracks seat belt use, speed, acceleration, braking and other safety- related practices. We respond to patterns of risky behavior with additional coaching, and we reward Diamondback employees who maintain a safe driving record as well as those who demonstrate marked improvement.
SCREENING OF INDEPENDENT CONTRACTORS
In 2019, we continued to expand our longtime initiative with Veriforce (formerly PEC Safety), a national orga-nization that collects and analyzes safety and environ-mental incident data related to independent contractors in Diamondback’s production operations. Each quarter, independent contractors submit relevant safety-related information that Veriforce analyzes and verifies. This rela-tionship allows us to manage risk by having more data beyond what could otherwise be gathered.
Working with Veriforce, Diamondback evaluates indepen-dent contractors on criteria such as having a formal safety program, a written safety manual, employee background checks and clear requirements for personal protective equipment. Diamondback uses the Veriforce safety analy-sis to determine whether to add an independent contractor to our approved vendor list, as well as to identify potential safety-related issues with existing independent contractors and take appropriate action. A multi-disciplinary team of employees regularly evaluate the safety rating status of independent contractors working with us.
EMPLOYEE TRAINING AND AWARENESS
Our people undergo training and education each year on regulatory compliance, industry standards and innovative opportunities to effectively manage the challenges of developing our resources. Topics include supervisory training, harassment training and Sarbanes-Oxley (SOX) compliance training.
Diamondback field operations personnel refresh their safety knowledge on a monthly basis. We devoted approximately 3,700 personnel hours to more than 17 safety topics in 2019, including:
» Risk Assessment» Defensive Driving» Hydrogen Sulfide & Respiratory Protection» Incipient Fire Fighting » Emergency Action Plans» Personal Protective Equipment (PPE) » Electrical Awareness for Field Personnel» Lock-out/Tag-out (LOTO)
Vehicle Incident Rate vs Industry Average(per million miles)
0.00
0.05
0.10
0.15
0.20
0.0
0.2
0.4
0.6
0.8
0
0.2
’18 ’19
0.4
0.8
0.6
0
’18 ’19
0.15
0.10
0.05
0.20
Total Recordable Incident Rate
Lost Time Incident Rate
Vehicle Incident Rate
0.0
0.5
1.0
1.5
2.0
0
’18 ’19
1.5
1.0
0.5
2.0
Source: AXPC EHS Benchmarking Survey (Onshore)
Diamondback
Industry Average
3,700Personnel hours devoted to safety training in 2019
// 2020 CSR26 // Diamondback Energy
Diamondback and our employees value the deep connections we share with our neighbors across the Permian Basin. We support an array of activities and organizations that enhance the quality of life in nearby communities as well as in the broader world.
OUR COMMITMENT TO COMMUNITIES
Our company’s philanthropic approach focuses on advancing education, supporting organizations that serve the needs of underprivileged children and helping those who are most disadvantaged. We also join with our employees in supporting other causes and strongly encourage all team members to volunteer in their communities. In 2019, we launched our Volunteer Time Off policy, which allows Diamondback employees to donate a portion of their time to charitable organizations of their choice. Our goals for 2020 include making volunteerism a more integral part of our company culture.
// 2020 CSR27 // Diamondback Energy
AMPLIFYING OUR TEAM MEMBERS’ CHARITABLE IMPACT
In the fall of 2019, Diamondback began matching the financial contributions from our employees to registered nonprofit organizations. When employees donate to a Permian Basin community-based charity, we double the amount of our corporate match. As of May 2020, the Company had distributed nearly $50,000 in matching funds to 28 organizations ranging from local food banks and community centers to the American Red Cross and American Cancer Society.
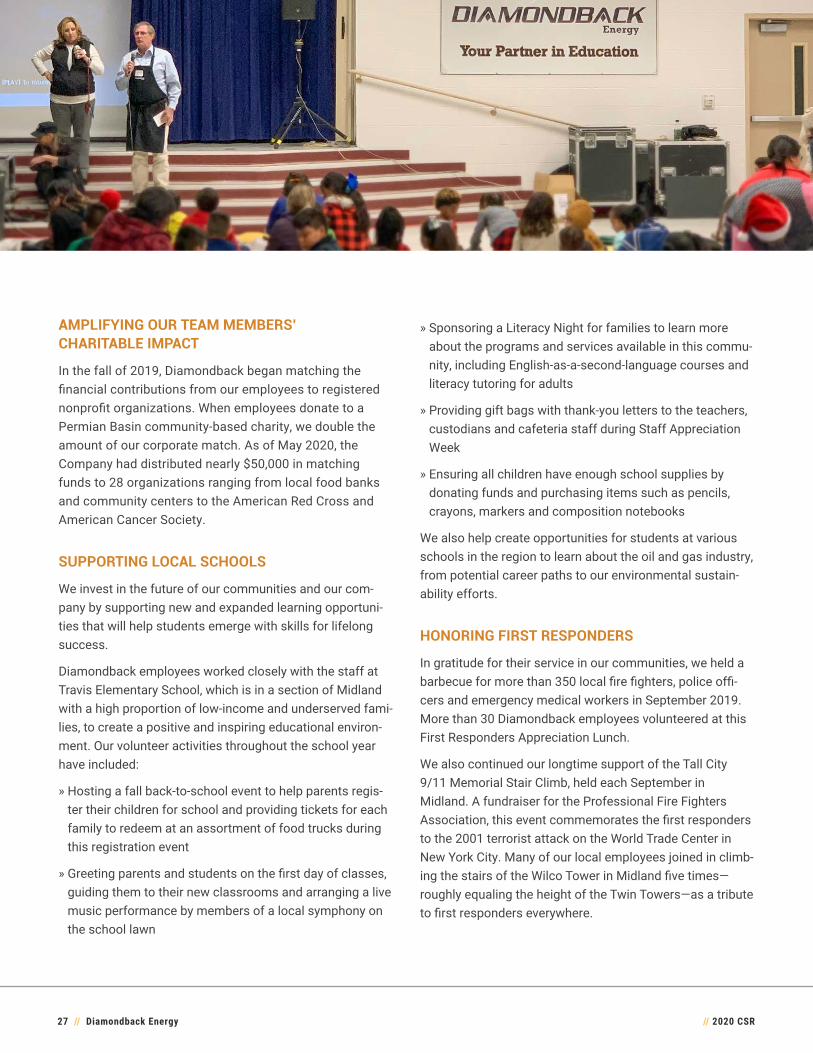
SUPPORTING LOCAL SCHOOLS
We invest in the future of our communities and our com-pany by supporting new and expanded learning opportuni-ties that will help students emerge with skills for lifelong success.
Diamondback employees worked closely with the staff at Travis Elementary School, which is in a section of Midland with a high proportion of low-income and underserved fami-lies, to create a positive and inspiring educational environ-ment. Our volunteer activities throughout the school year have included:
» Hosting a fall back-to-school event to help parents regis-ter their children for school and providing tickets for each family to redeem at an assortment of food trucks during this registration event
» Greeting parents and students on the first day of classes, guiding them to their new classrooms and arranging a live music performance by members of a local symphony on the school lawn
» Sponsoring a Literacy Night for families to learn more about the programs and services available in this commu-nity, including English-as-a-second-language courses and literacy tutoring for adults
» Providing gift bags with thank-you letters to the teachers, custodians and cafeteria staff during Staff Appreciation Week
» Ensuring all children have enough school supplies by donating funds and purchasing items such as pencils, crayons, markers and composition notebooks
We also help create opportunities for students at various schools in the region to learn about the oil and gas industry, from potential career paths to our environmental sustain-ability efforts.
HONORING FIRST RESPONDERS
In gratitude for their service in our communities, we held a barbecue for more than 350 local fire fighters, police offi-cers and emergency medical workers in September 2019. More than 30 Diamondback employees volunteered at this First Responders Appreciation Lunch.
We also continued our longtime support of the Tall City 9/11 Memorial Stair Climb, held each September in Midland. A fundraiser for the Professional Fire Fighters Association, this event commemorates the first responders to the 2001 terrorist attack on the World Trade Center in New York City. Many of our local employees joined in climb-ing the stairs of the Wilco Tower in Midland five times—roughly equaling the height of the Twin Towers—as a tribute to first responders everywhere.
// 2020 CSR28 // Diamondback Energy
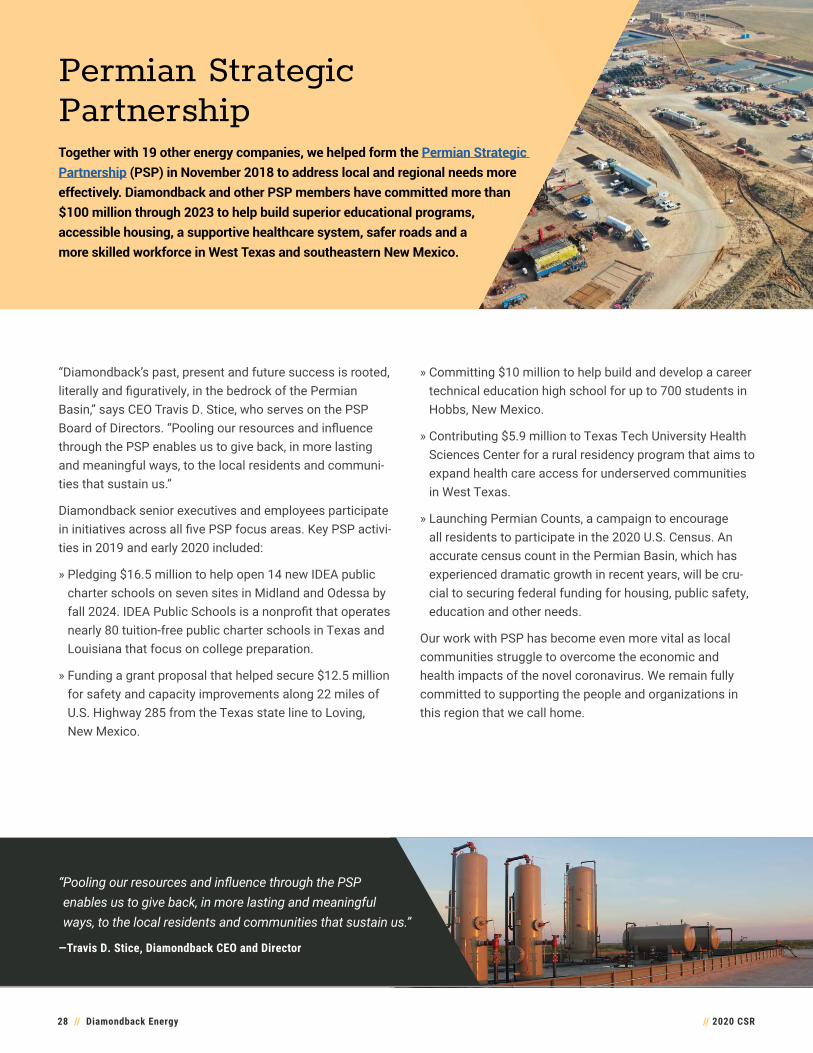
Permian Strategic PartnershipTogether with 19 other energy companies, we helped form the Permian Strategic Partnership (PSP) in November 2018 to address local and regional needs more effectively. Diamondback and other PSP members have committed more than $100 million through 2023 to help build superior educational programs, accessible housing, a supportive healthcare system, safer roads and a more skilled workforce in West Texas and southeastern New Mexico.
“Diamondback’s past, present and future success is rooted, literally and figuratively, in the bedrock of the Permian Basin,” says CEO Travis D. Stice, who serves on the PSP Board of Directors. “Pooling our resources and influence through the PSP enables us to give back, in more lasting and meaningful ways, to the local residents and communi-ties that sustain us.”
Diamondback senior executives and employees participate in initiatives across all five PSP focus areas. Key PSP activi-ties in 2019 and early 2020 included:
» Pledging $16.5 million to help open 14 new IDEA public charter schools on seven sites in Midland and Odessa by fall 2024. IDEA Public Schools is a nonprofit that operates nearly 80 tuition-free public charter schools in Texas and Louisiana that focus on college preparation.
» Funding a grant proposal that helped secure $12.5 million for safety and capacity improvements along 22 miles of U.S. Highway 285 from the Texas state line to Loving, New Mexico.
» Committing $10 million to help build and develop a career technical education high school for up to 700 students in Hobbs, New Mexico.
» Contributing $5.9 million to Texas Tech University Health Sciences Center for a rural residency program that aims to expand health care access for underserved communities in West Texas.
» Launching Permian Counts, a campaign to encourage all residents to participate in the 2020 U.S. Census. An accurate census count in the Permian Basin, which has experienced dramatic growth in recent years, will be cru-cial to securing federal funding for housing, public safety, education and other needs.
Our work with PSP has become even more vital as local communities struggle to overcome the economic and health impacts of the novel coronavirus. We remain fully committed to supporting the people and organizations in this region that we call home.
“�Pooling�our�resources�and�influence�through�the�PSP� enables us to give back, in more lasting and meaningful ways, to the local residents and communities that sustain us.”
—Travis D. Stice, Diamondback CEO and Director

// 2020 CSR29 // Diamondback Energy
We are proud of the Company’s accomplishments in 2019, and we intend to carry that momentum forward by redoubling our commitment to corporate re-sponsibility throughout Diamondback’s business and our interactions with local communities. Our employees are leading the way through their resolve to live our core values of leadership, integrity, excellence, people and teamwork.
MOVING FORWARD
In the years ahead, we will continue to benchmark our operations against industry peers and strive for continuous improvement. As we enhance our corporate responsibility efforts and increase stockholder value, we look forward to providing periodic updates in future reports that detail both our challenges and successes.
// 2020 CSR30 // Diamondback Energy
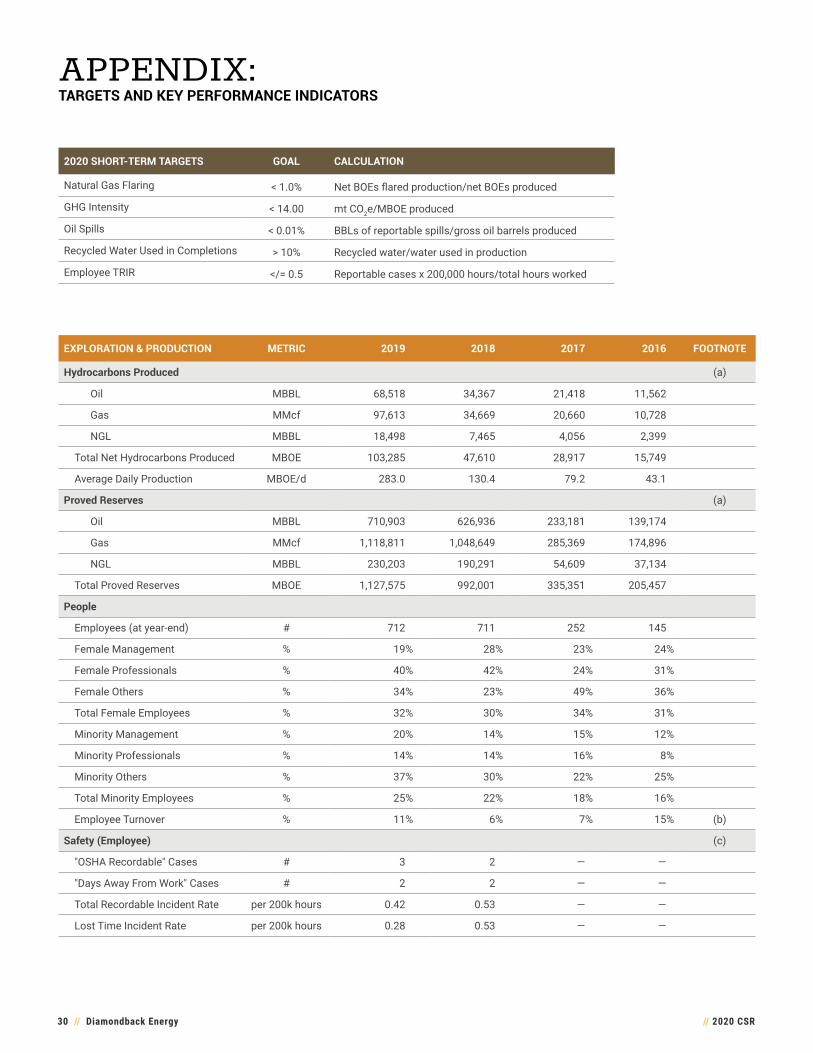
APPENDIX:TARGETS AND KEY PERFORMANCE INDICATORS
EXPLORATION & PRODUCTION METRIC 2019 2018 2017 2016 FOOTNOTE
Hydrocarbons Produced (a)
Oil MBBL 68,518 34,367 21,418 11,562
Gas MMcf 97,613 34,669 20,660 10,728
NGL MBBL 18,498 7,465 4,056 2,399
Total Net Hydrocarbons Produced MBOE 103,285 47,610 28,917 15,749
Average Daily Production MBOE/d 283.0 130.4 79.2 43.1
Proved Reserves (a)
Oil MBBL 710,903 626,936 233,181 139,174
Gas MMcf 1,118,811 1,048,649 285,369 174,896
NGL MBBL 230,203 190,291 54,609 37,134
Total Proved Reserves MBOE 1,127,575 992,001 335,351 205,457
People
Employees (at year-end) # 712 711 252 145
Female Management % 19% 28% 23% 24%
Female Professionals % 40% 42% 24% 31%
Female Others % 34% 23% 49% 36%
Total Female Employees % 32% 30% 34% 31%
Minority Management % 20% 14% 15% 12%
Minority Professionals % 14% 14% 16% 8%
Minority Others % 37% 30% 22% 25%
Total Minority Employees % 25% 22% 18% 16%
Employee Turnover % 11% 6% 7% 15% (b)
Safety (Employee) (c)
"OSHA Recordable" Cases # 3 2 — —
"Days Away From Work" Cases # 2 2 — —
Total Recordable Incident Rate per 200k hours 0.42 0.53 — —
Lost Time Incident Rate per 200k hours 0.28 0.53 — —
2020 SHORT-TERM TARGETS GOAL CALCULATION
Natural Gas Flaring < 1.0% Net BOEs flared production/net BOEs produced
GHG Intensity < 14.00 mt CO2e/MBOE produced
Oil Spills < 0.01% BBLs of reportable spills/gross oil barrels produced
Recycled Water Used in Completions > 10% Recycled water/water used in production
Employee TRIR </= 0.5 Reportable cases x 200,000 hours/total hours worked

// 2020 CSR31 // Diamondback Energy
EXPLORATION & PRODUCTION METRIC 2019 2018 2017 2016 FOOTNOTE
Safety (Independent Contractor) (c)
"OSHA Recordable" Cases # 33 41 20 6
"Days Away From Work" Cases # 16 18 10 —
Total Recordable Incident Rate per 200k hours 0.36 0.35 0.25 0.09
Lost Time Incident Rate per 200k hours 0.18 0.15 0.13 —
Safety (Combined Workforce) (c)
"OSHA Recordable" Cases # 36 43 20 6
"Days Away From Work" Cases # 18 20 10 —
Total Recordable Incident Rate per 200k hours 0.37 0.35 0.25 0.09
Lost Time Incident Rate per 200k hours 0.18 0.16 0.12 —
Vehicle Safety (c)
Preventable Vehicle Incidents # 15 6 1 2
Vehicle Incident Rate per million miles 1.56 1.33 0.34 0.90
Emissions (d)
Gross Volume of Flared Hydrocarbons MSCF 11,571,079 3,026,846 780,630 416,983
Gross Gas Flared as a % of Net BOE Production % 1.87% 1.06% 0.45% 0.44%
Gross Gas Flared as a % of Gross BOE Production % 1.57% 0.90% unavailable unavailable
Gross Gas Flared as a % of Gross Gas Production % 5.57 % 4.18 % unavailable unavailable
Flaring Intensity MSCF/MBOE 112.03 63.58 27.00 26.48
CO2 Emissions mt CO2 1,240,522 309,812 299,758 27,093 (c)
CH4 Emissions mt CH4 7,145 8,108 4,598 5,890 (e)
CH4 Intensity % 0.25% 0.37% unavailable unavailable (e)(f)
N2O Emissions mt N2O 2.60 2.01 2 .10 0.25 (c)
Total GHG Emissions mt CO2e 1,419,920 538,750 415,336 174,413 (c)
GHG Intensity mt CO2e/MBOE 13.75 12.16 14.36 11.07 (c)
VOC Emissions mt VOC 8,551 3,788 3,157 8,147 (c)
Spills (c)
Hydrocarbon Spills >1BBL # 342 288 211 unavailable
Non-Hydrocarbon Spills >1BBL # 490 319 229 unavailable
Hydrocarbon Volumes BBL 4,659 4,098 4,013 2,021
Produced Water Volumes BBL 92,544 27,441 14,843 4,544
Combined Volumes BBL 97,203 31,539 18,856 6,565
Hydrocarbon Spills Recovered % 68% unavailable unavailable unavailable
Produced Water Spills Recovered % 51% unavailable unavailable unavailable
Total Spills Recovered % 52% 81% 90% unavailable
Total Produced Fluid Spill per 1,000 BBL Produced Fluids BBL/MBBL 0.24 0.22 0.22 0.17 (g)
Total Produced Hydrocarbon Spill Rate per 1,000 BBL Produced BBL/MBBL 0.06 0.10 0.15 0.14 (g)
Total Produced Non-Hydrocarbon Spill Rate per 1,000 BBL Produced BBL/MBBL 0.29 0.26 0.26 0.19 (g)

// 2020 CSR32 // Diamondback Energy
EXPLORATION & PRODUCTION METRIC 2019 2018 2017 2016 FOOTNOTE
Other Environmental
Environmental Fines and Penalties $ 0 0 0 0
Water
Total Water Used in Production MBBL 165,551 92,540 59,526 unavailable
Brackish Water Used in Production MBBL 79,817 5,675 unavailable unavailable
Recycled Water Used in Production MBBL 27,936 9,911 435 unavailable
Freshwater Used in Production MBBL 57,798 76,954 59,091 unavailable
Recycled vs Used % 16.9% 10.7% 0.7% unavailable
Total Water Intensity MBBL/MBOE 1.60 1.94 2.06 unavailable
Freshwater Intensity MBBL/MBOE 0.56 1.62 2.04 unavailable
Governance (h)
Independent Board Members % 88% 71% 80% 80%
Women Board Members % 25% 14% 0% 0%
Minority Board Members % 13% 0% 0% 0%
All 2018 figures in the report reflect Diamondback data plus data attributable to Energen Corporation (“Energen”) for December 2018 subsequent to its acquisition by Diamondback, unless otherwise noted.(a) These figures represent Diamondback plus Viper.(b) Employee turnover does not include data and changes due to acquisition and divestiture activities related to Energen or Ajax Resources LLC.(c) 2018 figures represent Diamondback’s activity, excluding Energen. (d) 2019 emission data is pending EPA review and third party verification.(e) 2018 figures represent Diamondback and Energen combined activity.(f) Methane intensity % is calculated as (tonnes of methane emissions)/((total gas produced)*(average mole fraction of methane in produced gas)*(methane density
of .0192 kg/scf)*(1000 scf/mscf)*(1 tonne/1000 kg)). (g) This metric is calculated using gross hydrocarbon liquid production and gross water produced.(h) 2019 Board Member percentages are as of April 3, 2020.
FORWARD-LOOKING STATEMENTS AND OTHER DISCLAIMERSThis report contains forward-looking statements as defined by the Securities and Exchange Commission. All statements, other than historical facts, that address activities that Diamondback assumes, plans, expects, believes, intends or anticipates (and other similar expressions) will, should or may occur in the future are forward-looking statements. The forward-looking statements are based on management’s current beliefs, based on cur-rently available information, as to the outcome and timing of future events, including the current industry and macroeconomic conditions, commod-ity pricing environment, production levels, any future regulatory actions affecting Diamondback, the impact and duration of the ongoing COVID-19 pandemic, acquisitions and sales of assets and drilling and capital expenditure plans. These forward-looking statements involve certain risks and uncertainties, many of which are beyond Diamondback’s control and could cause the actual results or developments to differ materially from those currently anticipated by the management of Diamondback. Information concerning these risks and other factors can be found in Diamondback’s filings with the Securities and Exchange Commission, including its reports on Forms 10-K, 10-Q and 8-K. Diamondback undertakes no obligation to update or revise any forward-looking statement as a result of new information, future events or otherwise.

Diamondback Energy, Inc.500 West Texas Ave., Suite 1200, Midland, TX 79701
www.diamondbackenergy.com