Embed Size (px)
Citation preview

49
2.0 Project Description As described in 1.0 Introduction Oresome Bauxite Pty Ltd (Oresome) is proposing to develop the Urquhart Bauxite Project (UBx) at a site approximately 5 km south of the township of Weipa on the west coast of Cape York Peninsula, Queensland.
Area A and Area B will be mined sequentially during the dry season (from April to November) over the life of the mine. Mining will commence at Area A which will be mined at a maximum rate of less than 1.5 Mt of bauxite per year for a 4 year mine life period. The inferred resource available in Area A is approximately 7 Mt of bauxite, restricting the resource both in terms of production rate and physical availability. Mining of Area B will follow completion at Area A and is expected to have a smaller volume of resource and approximate 4 year mine life (Figure 7). Physical constraints on production will ensure that maximum production rates are not exceeded. Due to the quality of the resource being largely Direct Shipping Bauxite (DSB), no beneficiation onsite is required, apart from minor screening to separate debris. Mined bauxite will be hauled approximately 16 km by truck from the Project site, across a transport ML (MLA100131) over a section of ML7024, to a stockpile location within the GCR HPBP on ML20611.
Oresome identified a number of activities and operational efficiencies to minimise potential impacts to environmental values, including the following:
• Use of traditional shallow pit, panel bauxite mining methods, with truck and shovel or scraper operations within defined mining Areas A and B
• Mining operation limited to the dry season, with progressive rehabilitation occurring as part of the annual shut-down program and prior to the commencement of the wet season
• Sediment and erosion control measures appropriate to stabilise mined areas prior to the site being shut-down before the wet season
• Clean water drainage diverted away from mining areas. Mine-affected water will be captured and contained within the mine workings and managed for reuse during the dry season operation
• Shallow mine pit will not interact with deeper confined groundwater reserves during dry season operations as unconfined, surface aquifers are dry
• Retaining an unmined portion of the site of approximately 585 ha • A buffer of at least 50 m will be established from the edge of mining areas towards the western
coast to avoid impacts to coastal wetland, vine thicket, mangrove and permanent freshwater wetlands
• Storage and export from the HPBP will be according to the conditions of approval for the HPBP and will not require amendment to accommodate bauxite from the UBx Project, apart from an extension to the duration of the barging activity beyond 2020
• Power will be supplied from a combination of diesel-fueled generators and renewable energy (solar panels). A self-bunded diesel re-fueling facility for plant and equipment will be located at HPBP, avoiding the need for any re-fueling at the Project site
• Water will be required for potable supplies and dust suppression • Staff will access site daily by small boat from Weipa. All plant and equipment will be brought in
via the road network from Weipa as and when required. Major transportable plant will be stored at the HPBP site
• Mining activities will occur seven days a week, with one 12 hour shift per day. Oresome will however reserve the right to undertake a double-shift in order to meet productivity needs

50
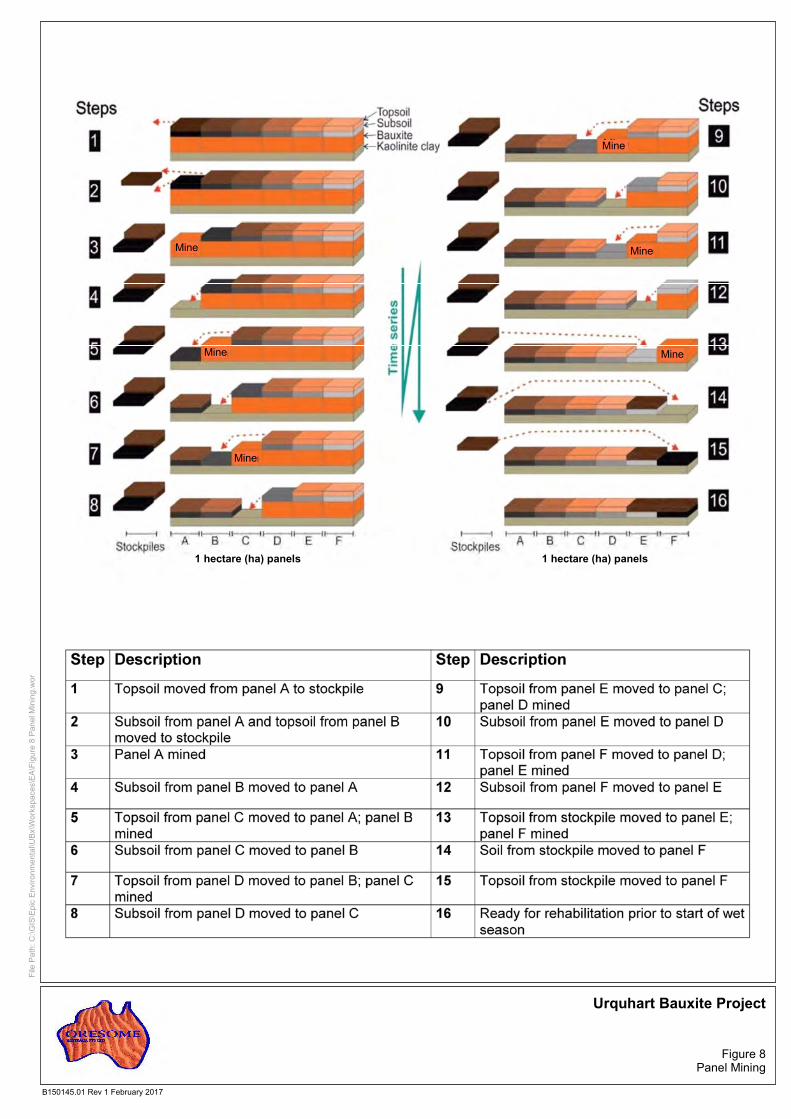
The panel mining activity has been designed to minimise movement and handling of topsoil and subsoil (overburden) while maximising the efficiency of the whole of life mining process by directly placing overburden and topsoil. Dry tailings from screening waste will be placed back into the mine pit to allow progressive rehabilitation. The aim of the mining process is to ensure that rehabilitation closely follows the progression of the open mining pit, with only 2 ha actively disturbed by mining (excluding rehabilitation activities) during a given mining season.
The implementation of the panel mining methodology is depicted in Figure 8.
Details regarding the Project disturbance footprint and infrastructure coordinates have been provided in Table 6.
Table 6 Project Disturbance and Infrastructure Locations
Aspect Area Longitude Latitude MLA 1,359 ha 141.838357
141.804067 141.803254 141.793719 141.478700 141.778330 141.785060 141.796451 141.809365 141.809037 141.816803 141.825549
-12.688725 -12.749443 -12.771575 -12.791317 -12.788118 -12.778641 -12.762704 -12.743885 -12.722504 -12.716032 -12.701247 -12.689099
Mining Area A 227 ha 141.832975 141.823046 141.820440 141.817586 141.814274 141.812790 141.813882 141.818649 141.820470 141.824868 141.827442
-12.697606 -12.714274 -12.718623 -12.723384 -12.724790 -12.721540 -12.717196 -12.710309 -12.703794 -12.696546 -12.695092
Mining Area B 547 ha 141.797815 141.801687 141.800612 141.791234 141.781155 141.791186
-12.747375 -12.747364 -12.772929 -12.788412 -12.775936 -12.756128
Haul road (internal to MLA)
22 ha 141.784613 141.800843 141.801684 141.833765
-12.775262 -12.769025 -12.747339 -12.694507

51
Aspect Area Longitude Latitude Access road (external to MLA and separate to this EA)
26 ha 141.801684 141.854974 141.891851 141.891851
-12.747315 -12.747155 -12.730651 -12.694507
Workshop, office and port-a-loo
54.5 sqm (0.00545 ha) 141.815468 141.815540 141.815569 141.815495
-12.723802 -12.723830 -12.723762 -12.723733
Common UBx functional area (diesel storage, off-loading area and workshop)
4.2 ha 141.882602 141.883294 141.881357 141.881024
-12.735386 -12.737119 -12.737857 -12.735939

Mine
Mine
Urquhart Bauxite Project
Figure 8Panel Mining
B150145.01 Rev 1 February 2017
1 hectare (ha) panels 1 hectare (ha) panels
MineMine
Mine
Mine
Mine
File
Pa
th:
C:\
GIS
\Ep
ic E
nvi
ron
me
nta
l\UB
x\W
ork
spa
ces\
EA
\Fig
ure
8 P
an
el M
inin
g.w
or

54
The main stages of the mining activity are:
• Site establishment: Vegetation will be cleared, mulched and stockpiled. Larger trees with hollows will be felled and placed in the rehabilitation area to provide fauna habitat
• Early works and construction: A two-stage stripping process will be implemented. Topsoil will be stripped, followed by the subsoil, leaving exposed bauxite to be mined. The topsoil and subsoil will be placed into the previously mined panel, commencing the progressive rehabilitation process
• Operations: Exposed bauxite will be pushed up into windrows with a bulldozer • Operations: The majority of windrowed bauxite will be loaded into rear dump trucks or scrapers
and transported by access road to the product stockpile area where it will be exported. Minor screening may be required at the stockpile prior to export
• Decommissioning/Rehabilitation: The remaining mined areas will be rehabilitated with progress monitored according to the Rehabilitation Plan and program (Appendix A)
The key feature of the mining sequence is that all mining panels will commence rehabilitation activities prior to the shut-down of operations at the end of each dry season. With this progressive rehabilitation approach, it is expected that vegetation will begin the process of regeneration during the subsequent wet season.
2.1 Accessing the site
During construction and operation, movement of major plant to the UBx will be from the PDR via the Aurukun Road, and existing access tracks through private land and ML7024. Up to 25 operational and construction staff are expected to travel daily to site by boat. No onsite accommodation is required for the Project during its construction or operational phases.
2.2 Office
The office (with crib hut facilities) will be a converted transportable donga (or similar) that will provide an area for lunch, health and safety requirements and supporting a small office.
2.3 Telecommunications
All communications will be via mobile phone or two-way radio. A dedicated emergency satellite phone will be stored in the crib hut at all times.
2.4 Workshop
The onsite workshop will be a converted 20 foot shipping container (or similar) used for storing maintenance tools and equipment. Any minor servicing of plant and equipment will be performed at the HPBP site. Plant and equipment will be removed from site via the road network and serviced in Weipa for any major repairs.
Minor volumes of fuel, lubricants and grease required for servicing of plant and equipment may also be stored within the workshop. These will be stored in self-bunded cabinets in accordance with relevant standards. All waste from the workshop activities will be stored in a bunded area and removed from site by a licenced waste contractor.

55
2.5 Storage of Diesel Diesel will be located at a self-bunded facility (up to 30,000 L capacity) at a common use interface area at HPBP (Figure 5). Use of the facility at Hey Point will limit the potential risks associated with maintaining diesel storage on the UBx site. The onsite storage of diesel at HPBP will be in accordance with approvals held by GCR, including a safety management system which incorporates appropriate spill response procedures.
2.6 Plant and Equipment The UBx will require plant and equipment as identified in Table 7. The plant and equipment will generally be brought to the site via the road network. During the wet season, equipment will either be left onsite, or mobilised to adjacent projects whilst the site is shut down.
Table 7 Plant and Equipment
Machine Type Number
D9 Bulldozer Dozer 1
KTEC 1233 ADT Units with Bell 40 t articulated dump trucks Truck 5
992 CAT Wheel Loaders Dozer 2
130 t B-Double Units Truck 8
12 klt Semi Water Truck Truck 1
14M Grader Grader 1
2.7 Water Supply Potable water will be delivered to the site in 20 litre (L) water coolers.
Up to 5,000 L of water is required per day for use by the water truck for the purposes of dust suppression. This will potentially be sourced from the existing groundwater bore at the HPBP. Opportunities to source water from alternative water sources will be subject to ongoing investigation.
2.8 Sewage A portable toilet will be located at the site. All wastes will be taken off-site for disposal by a licenced contractor.
2.9 Detailed Mine Plan The mining and overburden operations have been based on a block formation process with the areas to be approximately 150 x 150 m, these block sizes allow for a full production run over the 10 day cycle across the planned years of operation.
It is proposed to utilise a D9 bulldozer to clear and grub the areas which will then allow the overburden removal units to strategically keep in advance of the ore mining operations.
The initial topsoil removal will be stockpiled to be later placed back in the block to finalise rehabilitation works prior to shut down. All topsoil removed after the initial block will be immediately placed in

56
previously filled blocks to retain soil biological conditions and maximise seed bank potential. When the overburden is removed, it will be then placed in the previously mined areas for a continued rehabilitation plan to take place to maximise operations. Any base material required for formation of access roads can be placed with the overburden removal units to allow continuous operations.
2.9.1 Clearing Operations It is proposed to utilise a mine specified D9 bulldozer with a tree rake blade to clear existing trees and grass material to allow topsoil and overburden removal to begin. These operations will take place throughout the operation and immediately after wet season periods to allow for maximum clearing efficiency.
The trees and vegetation will be stockpiled to the side of the operations to allow for free flowing operations of the overburden removal and mining operations.
Oresome have allowed for all trees that have been stockpiled to be used by the Traditional Landowners with any left-over vegetation being spread over the immediate area with the D9 if required.
2.9.2 Overburden Removal / Rehabilitation Operations Oresome propose to utilise a dual bowl KTEC train towed by a 40 tonne articulated dump truck unit to remove all overburden material. These units will be fully mine specified. Oresome will adopt a block progression mining plan to allow the 5 units from each mine area to strategically remove the topsoil and overburden and unload back into previously mined out ore areas. This process will ensure that the mine will have continuous rehabilitation works underway while in operation.
Three of the five units will be fully equipped and automated with SITECH Trimble GPS systems that will have the surveyed mine plan uploaded, allowing for accurate removal of overburden to ensure maximum ore bodies are intact for loadout to the barge stockpile facility. These units will also allow for maximum grade control when rehabilitation is being completed, negating the need for final dozer works usually associated with such operations. Each unit will also have on-board weighing systems to accurately record the amount of overburden removed.
Five units in total when operations are at peak will be required to keep in front of the ore mining operations and due to the versatility of the units, can be operated during the wet season if required. This would only be the case if wet season conditions occur earlier than predicted and mine shut down procedures are required to be implemented.
2.9.3 Ore Mining Operations
Water control throughout the mine will be controlled by only having minimal operational ore blocks exposed due to the progressive rehabilitation. To control onsite water associated with the ore extraction, a sump will be developed in the open ore blocks to allow extraction of water for dust suppression across both the mine and the access road. As the ore blocks are closed in with rehab operations, the sump will be filled and another sump will be opened. This will progress throughout the life of the mine. The sumps will be located in the lowest regions of the ore body so as to maximize water collection. Importantly, sump location will overlay the kaolinite aquitard and will not interfere with the integrity of the thick clay layer.
Two mine specified 992 sized wheel loaders will be operated to mine the ore material once the overburden has

57
been removed. As with the KTEC units, the 992 wheel loaders will operate along a block progression to allow for maximum utilisation of all units operating. Each unit will also be fitted with Loadrite weigh scales to ensure accurate tracking of loaded ore material.
Both 992 units will have the SITECH Trimble GPS systems fitted and have the surveyed mine plan uploaded. This will allow for accurate and efficient removal of the ore material before any contamination of iron stone is struck. By having the GPS systems fitted, the loaders are able to operate within a 50 mm tolerance from the surveyed mine floor plan.
Along with the 992 loaders, 8 x 130 tonne B-Double units will haul the loaded ore material to the barge stockpile area located at Hey Point (refer to Figure 5).
Each prime mover will be fitted with standard safety equipment including ROPS/FOPS, fire extinguishers, battery isolations, e-stops, VHF radios, GPS management systems to track all operations, outward facing camera, fatigue monitoring cameras and tyre pressure monitoring system.
Each trailer has integrated safety features such as door sensors to ensure units do not tip prematurely, door open indicators, phasing hydraulic cylinders for tipping to prevent torsional twist, LED lighting and load restraints guards. Each trailer will also be lined with stainless steel to ensure that minimal hang up of material occurs and tyre pressure systems are fitted to each tyre on the trailers feeding back to the prime mover monitoring system.
2.10 Proposed Conditions: General A subset of the model mining conditions (specified by DEHP guidelines) is relevant to the UBx. The UBx has adopted all conditions listed in Schedule A of the Model Mining Conditions, except for those that refer to areas ‘marked C on the map’ (clause A3 and part of clause A2). The small scale of the mining area, combined with detailed ecological assessments undertaken to date, negate the requirement for an area C as described in the model conditions.
Schedule A – General
A1 This environmental authority authorises environmental harm referred to in the conditions. Where there is no condition or this environmental authority is silent on a matter, the lack of a condition or silence does not authorise environmental harm.
A2 In carrying out the mining activity authorised by this environmental authority, disturbance of land:
a) May occur in the areas marked ‘A’ b) Must not occur in the areas marked ‘B’
A4 The holder of this environmental authority must:
a) Install all measures, plant and equipment necessary to ensure compliance with the conditions of this environmental authority
b) Maintain such measures, plant and equipment in a proper and efficient condition c) Operate such measures, plant and equipment in a proper and efficient manner d) Ensure all instruments and devices used for the measurement or monitoring of any

58
parameter under any condition of this environmental authority are properly calibrated Monitoring
A5 Except where specified otherwise in another condition of this environmental authority, all monitoring records or reports required by this environmental authority must be kept for a period of not less than five years.
Financial assurance
A6 The activity must not be carried out until the environmental authority holder has given financial assurance to the administering authority as security for compliance with this environmental authority and any costs or expenses, or likely costs or expenses, mentioned in section 298 of the Act.
A7 The amount of financial assurance must be reviewed by the holder of this environmental authority when a plan of operations is amended or replaced or the authority is amended.
Risk management
A8 The holder of this environmental authority must develop and implement a risk management system for mining activities which mirrors the content requirement of the Standard for Risk Management (ISO31000:2009), or the latest edition of an Australian standard for risk management, to the extent relevant to environmental management, within 3 months from date of issue.
Notification of emergencies, incidents and exceptions
A9 The holder of this environmental authority must notify the administering authority by written notification within 24 hours, after becoming aware of any emergency or incident which results in the release of contaminants not in accordance, or reasonably expected to be not in accordance with, the conditions of this environmental authority.
A10 Within 10 business days following the initial notification of an emergency or incident, or receipt of monitoring results, whichever is the latter, further written advice must be provided to the administering authority, including the following:
a) Results and interpretation of any samples taken and analysed b) Outcomes of actions taken at the time to prevent or minimise unlawful environmental harm c) Proposed actions to prevent a recurrence of the emergency or incident.
Complaints
A11 The holder of this environmental authority must record all environmental complaints received about the mining activities including:
a) Name, address and contact number for of the complainant b) Time and date of complaint c) Reasons for the complaint d) Investigations undertaken e) Conclusions formed f) Actions taken to resolve the complaint

59
g) Any abatement measures implemented h) Person responsible for resolving the complaint
A12 The holder of this environmental authority must, when requested by the administering authority, undertake relevant specified monitoring within a reasonable timeframe nominated or agreed to by the administering authority to investigate any complaint of environmental harm. The results of the investigation (including an analysis and interpretation of the monitoring results) and abatement measures, where implemented, must be provided to the administering authority within 10 business days of completion of the investigation, or no later than 10 business days after the end of the timeframe nominated by the administering authority to undertake the investigation.
Third-party reporting
A13 The holder of this environmental authority must:
a) Within one year of the commencement of this environmental authority, obtain from an appropriately qualified person a report on compliance with the conditions of this environmental authority
b) Obtain further such reports at regular intervals, not exceeding three-yearly intervals, from the completion of the report referred to above
c) Provide each report to the administering authority within 90 days of its completion.
A14 Where a condition of this environmental authority requires compliance with a standard, policy or guideline published externally to this environmental authority and the standard is amended or changed subsequent to the issue of this environmental authority, the holder of this environmental authority must:
a) Comply with the amended or changed standard, policy or guideline within two years of the amendment or change being made, unless a different period is specified in the amended standard or relevant legislation, or where the amendment or change relates specifically to regulated structures referred to in the condition, the time specified in that condition
b) Until compliance with the amended or changed standard, policy or guidelines is achieved, continue to remain in compliance with the corresponding provision that was current immediately prior to the relevant amendment or change.

60
3.0 Legislation and Approvals This section clearly identifies the key legislation applicable to the Project. The legislation helps form an understanding of the Project’s legal obligations and identifies any environmental approvals that may be required in addition to the site specific application.
Legislation has been presented with respect to Commonwealth, State and local jurisdictions. Each piece of legislation is briefly summarised, followed by its applicability to the Project. The approvals sought by the site specific application are listed in Table 8.
Table 8 Approvals summary for the Site Specific Application
Legislation Approval Applicable to the Site Specific Application (Y/N)
Commonwealth
Environment Protection and Biodiversity Conservation Act 1999
A referral was made to the Commonwealth
Commonwealth determination was for a ‘controlled action’ with the assessment method as Preliminary Documentation (PD). A verification survey was completed in July 2016
No
Native Title Act 1993 Not applicable No
State
Environmental Protection Act 1994
Resource Environmentally Relevant Activity for which an Environmental Authority is required
• ERA 11: mining bauxite Ancillary activities approved under this Environmental Authority include:
• ERA 16 2(b) Extracting, other than by dredging more than 100,000 but not more than 1,000,000 t/yr
• ERA 16 3(b) Screening rock or other material >100,000 – 1 million t/yr
Yes
Aboriginal Cultural Heritage Act 2003
Oresome has undertaken a comprehensive process of engaging with relevant stakeholders. A list of the relevant stakeholder groups is provided in 1.0 Introduction
No
Mineral Resource Act 1989 Mining Leases for the mine are required (through DNRM)
No

61
Legislation Approval Applicable to the Site Specific Application (Y/N)
Nature Conservation Act 1992 and Nature Conservation Regulations 1996
Seasonal ecological surveys were conducted in April (wet season) and November (dry season) 2015. The surveys did not identify any flora or fauna that required additional permits to the environmental authority. A separate verification survey was completed in July 2016
No
Regional Planning Interest Act 2014
The location of the Project is not subject to areas protected under the RPI Act
No
Sustainable Planning Act 2009
Not applicable No
Vegetation Management Act 1999
Not applicable No
Water Act 2000 There are no waterways within the disturbance footprint
No
3.1 Commonwealth Legislation 3.1.1 Environment Protection and Biodiversity Conservation Act 1999 The Environment Protection and Biodiversity Conservation Act 1999 (EPBC Act) is the key piece of Commonwealth legislation governing environmental protection in Australia. Administered by the Commonwealth Government Department of the Environment and Energy (DEE), the EPBC Act defines and protects nine matters considered to be of National Environmental Significance (MNES) including:
• World heritage properties
• National heritage places
• Wetlands of international importance (listed under the Ramsar Convention)
• Listed threatened species and ecological communities
• Migratory species protected under international agreements
• Commonwealth marine areas
• The Great Barrier Reef Marine Park
• Nuclear actions (including uranium mines)
• A water resource in relation to coal seam gas development and large coal mining development
Under Part 3 of the EPBC Act, a person must not undertake an action (e.g. a project, a development, an undertaking, an activity or a series of activities, or an alteration of any of these things) that will have, or is likely to have, a significant impact on a protected matter, without approval from the Minister for the DEE (the Minister).

62
Relevance to the Project
The Project has been referred to the DEE, with a recommendation that the Project be deemed not to be a ‘controlled action’. On 17 June 2016 the published determination was received from the DEE that the UBx Project was a ‘controlled action’ and the assessment method was Preliminary Documentation.
Permits / Approvals
This determination for a ‘controlled action’ was made on the basis that there was a degree of uncertainty surrounding the breeding habitat for Palm Cockatoo and potential presence of the Bare-rumped Sheathtail Bat at the Project. In response, Oresome completed additional validation ecological surveys in July and December 2016 and used the results to develop relevant management plans to satisfy this requirement.
Based on the validation ecological survey and subsequent reporting, Bare-rumped Sheathtail Bat was not recorded at the site and has been determined as unlikely to occur. Furthermore, no breeding habitat for Palm Cockatoo was present though there is a potential for future use of the site.
3.1.2 Native Title Act 1993 The objectives of the Native Title Act 1993 (NT Act) include providing for the recognition and protection of native title. The NT Act also provides a mechanism for ensuring that future acts such as the grant of mining leases, or the rights to construct and operate under such authorities, are undertaken in accordance with procedural rights given to relevant native title parties.
Relevance to the Project
The UBx footprint is within the Wik and Wik Way People Native Title Determination No.2 according to the National Native Title Register. Oresome are progressing a right to negotiate process.
Permits / Approvals
Not applicable.
3.2 State Legislation 3.2.1 Aboriginal Cultural Heritage Act 2003 The Aboriginal Cultural Heritage Act 2003 (ACH Act) binds all persons to provide recognition, protection and conservation of Aboriginal cultural heritage. The Cultural Heritage Duty of Care (section 23 of the ACH Act) states that:
‘a person who carries out an activity must take all reasonable and practical measures to ensure the activity does not harm Aboriginal cultural heritage’.
The duty of care can be demonstrated through a number of processes.
Relevance to the Project
Oresome are working together with Traditional Owners through comprehensive stakeholder engagement and will seek employees from within the local Indigenous population if suitable candidates are available.

63
Permits / Approvals
No permits or approvals required.
3.2.2 Environmental Protection Act 1994 The objective of the Environmental Protection Act 1994 (EP Act) is to protect Queensland's environment and to promote ecologically sustainable development. The EP Act defines a General Environmental Duty under which all persons in Queensland have a responsibility to not carry out an activity that causes or is likely to cause environmental harm, and to take all reasonable and practicable measures to prevent or minimise the harm.
The EP Act also regulates ERAs. ERAs are activities that require an EA prior to activities commencing. Resource activities (mining) are defined under the EP Act as a resource ERA for which an EA is required.
Relevance to the Project
The proponent will have an obligation to comply with the environmental duty of care. Further to this, mining activities are defined as a Resource Environmentally Relevant Activity for which an EA is required.
Mining of bauxite is a resource ERA for which an EA is required. Ancillary approvals include bulk material handling and extractive and screening activities.
Permits / Approvals
• ERA 11 Mining Bauxite (resourced ERA)
Ancillary activities include:
• Extractive and screening activities o ERA 16 2(b) Extracting, other than by dredging more than 100,000 but not more than
1,000,000 t/a o ERA 16 3(b) Screening rock or other material >100,000 – 1 Mtpa
3.2.3 Mineral Resources Act 1989 The Minerals Resources Act 1989 (MR Act) facilitates granting, conditioning and management of mining leases and other tenement types. The principal objectives of the MR Act are to:
• Encourage and facilitate prospecting and exploring for and mining of minerals; • Enhance knowledge of the mineral resources of the State of Queensland; • Minimise land use conflict with respect to prospecting, exploring and mining; • Provide an administrative framework to expedite and regulate prospecting and exploring for
and mining of minerals; and • Encourage responsible land care management in prospecting, exploring and mining.
Relevance to the Project
Under the MR Act a mining lease is required prior to carrying out mining activities. The Project is in the process of seeking a ML for the mining activity and has applied for a transportation ML under s316 of the MR Act.
64
Permits / Approvals
Mining Lease (this is to be acquired through DNRM and is not relevant to this application process).
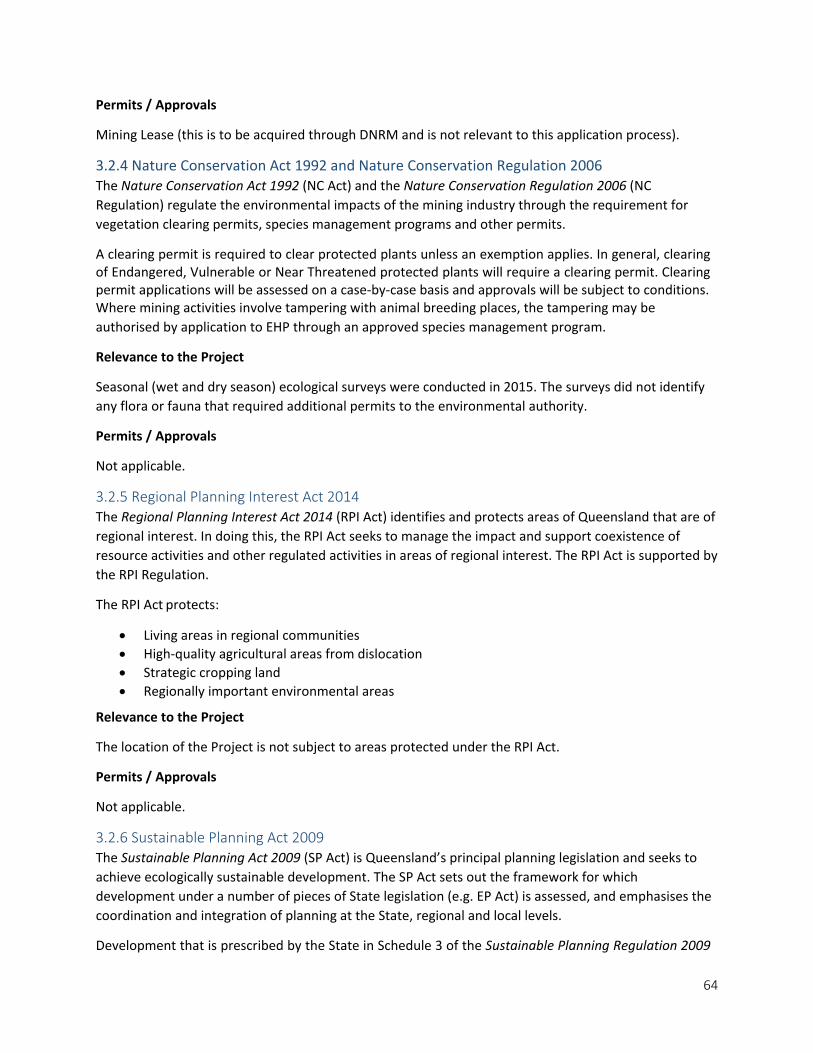
3.2.4 Nature Conservation Act 1992 and Nature Conservation Regulation 2006 The Nature Conservation Act 1992 (NC Act) and the Nature Conservation Regulation 2006 (NC Regulation) regulate the environmental impacts of the mining industry through the requirement for vegetation clearing permits, species management programs and other permits.
A clearing permit is required to clear protected plants unless an exemption applies. In general, clearing of Endangered, Vulnerable or Near Threatened protected plants will require a clearing permit. Clearing permit applications will be assessed on a case-by-case basis and approvals will be subject to conditions. Where mining activities involve tampering with animal breeding places, the tampering may be authorised by application to EHP through an approved species management program.
Relevance to the Project
Seasonal (wet and dry season) ecological surveys were conducted in 2015. The surveys did not identify any flora or fauna that required additional permits to the environmental authority.
Permits / Approvals
Not applicable.
3.2.5 Regional Planning Interest Act 2014 The Regional Planning Interest Act 2014 (RPI Act) identifies and protects areas of Queensland that are of regional interest. In doing this, the RPI Act seeks to manage the impact and support coexistence of resource activities and other regulated activities in areas of regional interest. The RPI Act is supported by the RPI Regulation.
The RPI Act protects:
• Living areas in regional communities • High-quality agricultural areas from dislocation • Strategic cropping land • Regionally important environmental areas
Relevance to the Project
The location of the Project is not subject to areas protected under the RPI Act.
Permits / Approvals
Not applicable.
3.2.6 Sustainable Planning Act 2009 The Sustainable Planning Act 2009 (SP Act) is Queensland’s principal planning legislation and seeks to achieve ecologically sustainable development. The SP Act sets out the framework for which development under a number of pieces of State legislation (e.g. EP Act) is assessed, and emphasises the coordination and integration of planning at the State, regional and local levels.
Development that is prescribed by the State in Schedule 3 of the Sustainable Planning Regulation 2009

65
(SP Regulation) or by local government through their planning scheme as assessable development requires development approval under the SP Act. Development approval applications are processed under the Integrated Development Assessment System (IDAS), by the relevant Assessment Manager and Referral Agencies identified in the SP Regulation.
The SP Act also requires development applications to be supported by the consent of the landowner for certain developments and/or evidence of Resource Entitlement where the works involve a State resource.
Relevance to the Project
Activities on a mining lease are exempt from the SP Act. All activities relevant to this application are within the boundaries of the mining lease.
Permits / Approvals
Not applicable.
3.2.7 Vegetation Management Act 1999 The Vegetation Management Act 1999 (VM Act) regulates the clearing of remnant vegetation in Queensland.
Relevance to the Project
The VM Act does not apply on mining leases; however, the assessment of the application of the EA for the mining lease will assess the vegetation clearing activities required as part of mining activities at the site.
Permits / Approvals
Not applicable.
3.2.8 Water Act 2000 The Water Act 2000 (Water Act) is the governing piece of legislation which controls the way in which water is allocated and managed in Queensland. The Water Act regulates the interaction with both surface and ground water.
The Water Act also regulates work that involves the removal of vegetation, excavating or placing fill in a watercourse, lake or spring, and the taking of quarry material (including stone, gravel, sand, rock, clay, earth and soil) from a watercourse unless it is removed from the watercourse or lake as waste material.
Relevance to the Project
There are no waterways within the disturbance footprint.
Permits / Approvals
Not applicable.
66
4.0 Climate 4.1 Average Conditions The Project area experiences an equatorial climate, according to the Köeppen classification system (Australian Bureau of Meteorology (BoM) 2016). This includes two distinctive seasons: a summer wet (December to March) and a winter dry (April to November) season.
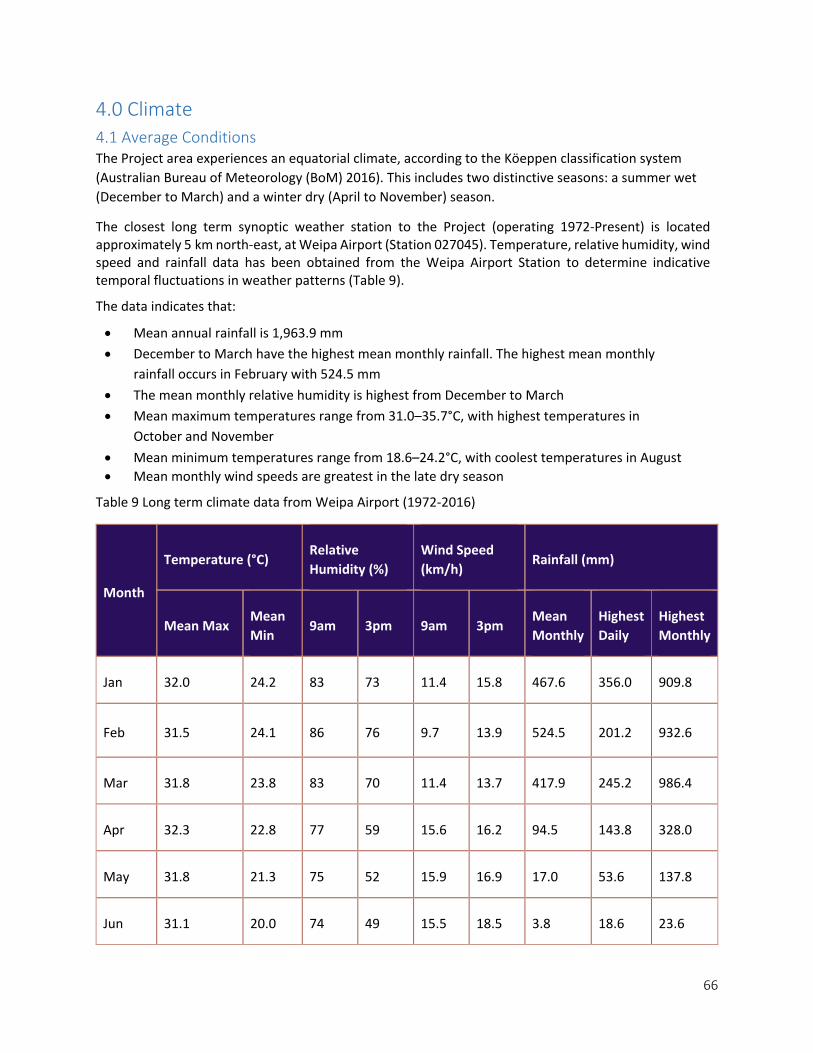
The closest long term synoptic weather station to the Project (operating 1972-Present) is located approximately 5 km north-east, at Weipa Airport (Station 027045). Temperature, relative humidity, wind speed and rainfall data has been obtained from the Weipa Airport Station to determine indicative temporal fluctuations in weather patterns (Table 9).
The data indicates that:
• Mean annual rainfall is 1,963.9 mm • December to March have the highest mean monthly rainfall. The highest mean monthly
rainfall occurs in February with 524.5 mm • The mean monthly relative humidity is highest from December to March • Mean maximum temperatures range from 31.0–35.7°C, with highest temperatures in
October and November • Mean minimum temperatures range from 18.6–24.2°C, with coolest temperatures in August • Mean monthly wind speeds are greatest in the late dry season
Table 9 Long term climate data from Weipa Airport (1972-2016)
Month
Temperature (°C) Relative Humidity (%)
Wind Speed (km/h)
Rainfall (mm)
Mean Max Mean Min
9am 3pm 9am 3pm Mean Monthly
Highest Daily
Highest Monthly
Jan 32.0 24.2 83 73 11.4 15.8 467.6 356.0 909.8
Feb 31.5 24.1 86 76 9.7 13.9 524.5 201.2 932.6
Mar 31.8 23.8 83 70 11.4 13.7 417.9 245.2 986.4
Apr 32.3 22.8 77 59 15.6 16.2 94.5 143.8 328.0
May 31.8 21.3 75 52 15.9 16.9 17.0 53.6 137.8
Jun 31.1 20.0 74 49 15.5 18.5 3.8 18.6 23.6
67
Month
Temperature (°C) Relative Humidity (%)
Wind Speed (km/h)
Rainfall (mm)
Mean Max Mean Min
9am 3pm 9am 3pm Mean Monthly
Highest Daily
Highest Monthly
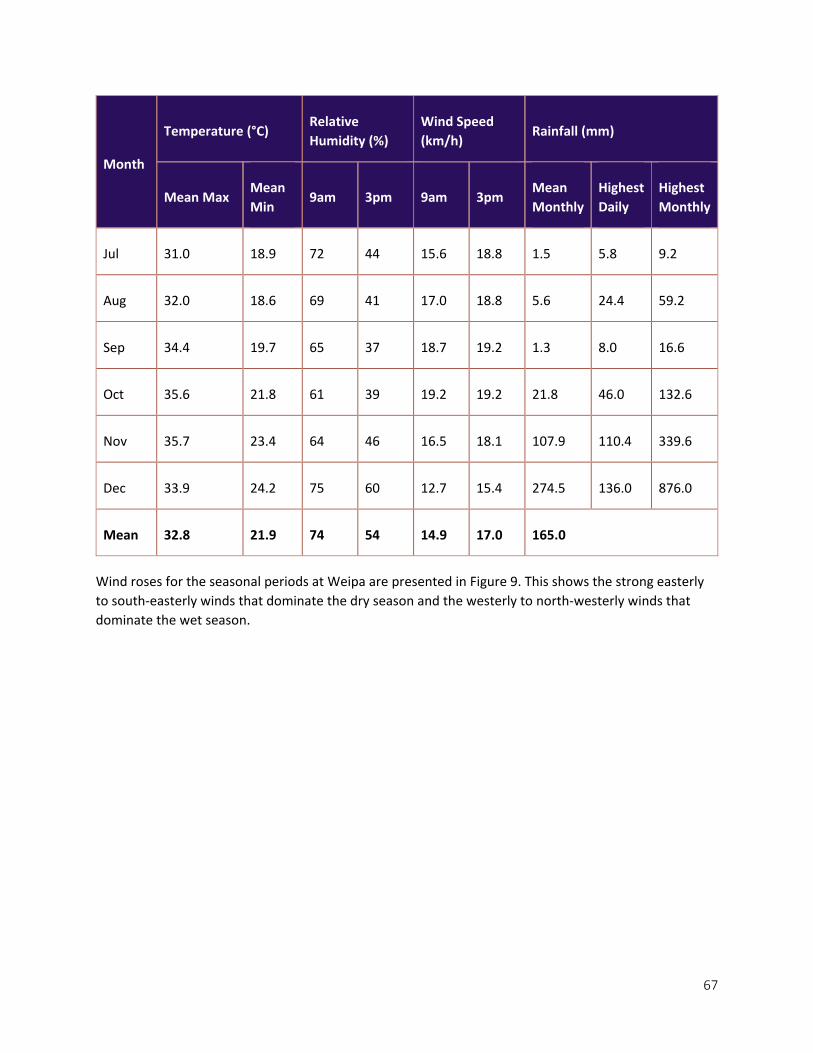
Jul 31.0 18.9 72 44 15.6 18.8 1.5 5.8 9.2
Aug 32.0 18.6 69 41 17.0 18.8 5.6 24.4 59.2
Sep 34.4 19.7 65 37 18.7 19.2 1.3 8.0 16.6
Oct 35.6 21.8 61 39 19.2 19.2 21.8 46.0 132.6
Nov 35.7 23.4 64 46 16.5 18.1 107.9 110.4 339.6
Dec 33.9 24.2 75 60 12.7 15.4 274.5 136.0 876.0
Mean 32.8 21.9 74 54 14.9 17.0 165.0
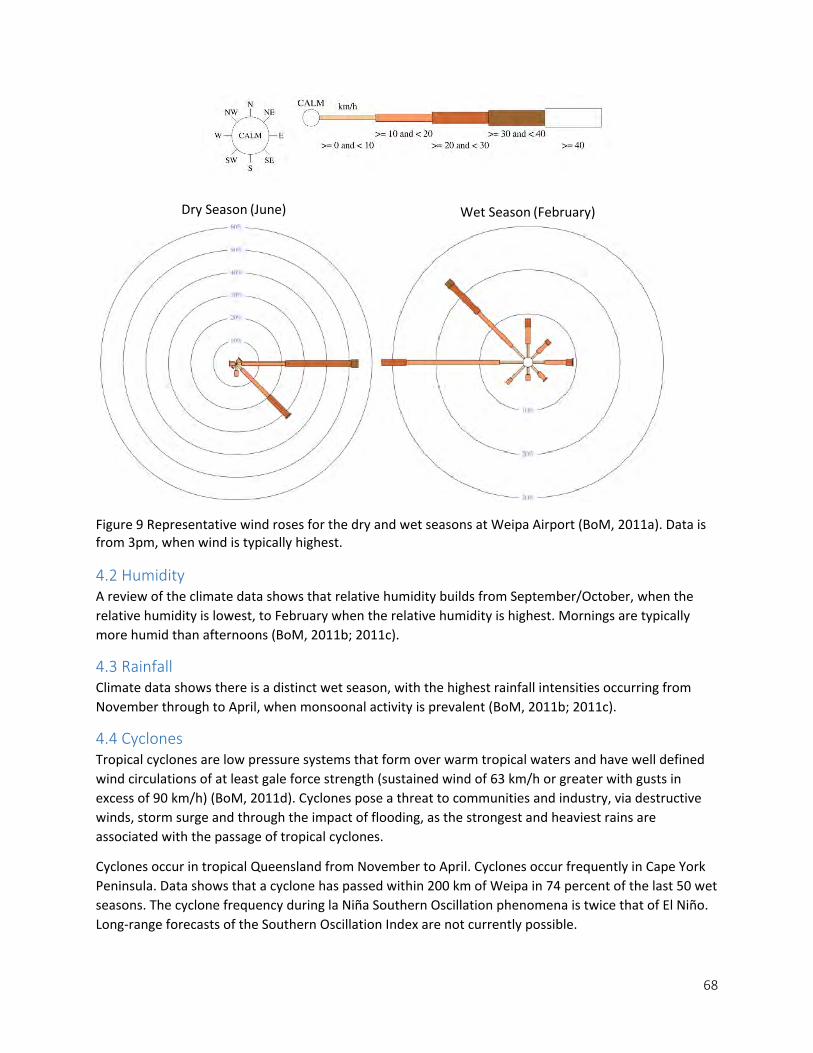
Wind roses for the seasonal periods at Weipa are presented in Figure 9. This shows the strong easterly to south-easterly winds that dominate the dry season and the westerly to north-westerly winds that dominate the wet season.
68
Figure 9 Representative wind roses for the dry and wet seasons at Weipa Airport (BoM, 2011a). Data is from 3pm, when wind is typically highest.
4.2 Humidity A review of the climate data shows that relative humidity builds from September/October, when the relative humidity is lowest, to February when the relative humidity is highest. Mornings are typically more humid than afternoons (BoM, 2011b; 2011c).
4.3 Rainfall Climate data shows there is a distinct wet season, with the highest rainfall intensities occurring from November through to April, when monsoonal activity is prevalent (BoM, 2011b; 2011c).
4.4 Cyclones Tropical cyclones are low pressure systems that form over warm tropical waters and have well defined wind circulations of at least gale force strength (sustained wind of 63 km/h or greater with gusts in excess of 90 km/h) (BoM, 2011d). Cyclones pose a threat to communities and industry, via destructive winds, storm surge and through the impact of flooding, as the strongest and heaviest rains are associated with the passage of tropical cyclones.
Cyclones occur in tropical Queensland from November to April. Cyclones occur frequently in Cape York Peninsula. Data shows that a cyclone has passed within 200 km of Weipa in 74 percent of the last 50 wet seasons. The cyclone frequency during la Niña Southern Oscillation phenomena is twice that of El Niño. Long-range forecasts of the Southern Oscillation Index are not currently possible.
Dry Season (June) Wet Season (February)

69
5.0 Preliminary Environmental Risk Assessment A requirement of the site specific application is to describe risks and assess the likely magnitude of impacts on the environmental values. This has been achieved through a preliminary risk assessment based on principles of AS/NZS ISO 31000:2009 Risk Management Principles and Guidelines.
The preliminary risk assessment evaluated the environmental risks associated with activities proposed to be undertaken at the UBx site. The assessment considered the small scale of the mining operation and the nature of mining method (shallow bauxite panel mining with progressive rehabilitation). Further, all infrastructure is designed to be mobile, which largely negates the requirement for construction risks (pre-mining) because plant could be quickly moved from site.
This section also forms the underlying framework for the Environmental Values, Potential Impacts and Management Practices section of the document. This section is based on a risk approach, with management measures and strategies designed to reduce risk to an appropriate level.
Due to the small scale of the Project, its associated activities (e.g. no refining processes) and its remote location, risks were generally determined to be low.
5.1 Methodology A desktop assessment of risks was undertaken, including the identification of activities with the potential to impact on the environment and a quantitative assessment of the scale and magnitude of risks associated with those activities. The risks were assessed in two stages:
• Risks assessed without control measures
• Risks assessed after control measures are implemented (residual risk)
A risk matrix was used to consider the likelihood (Table 10) and consequence (Table 11) of impacts.
‘Likelihood’ is defined as the chance that something might happen.
‘Consequence’ is defined as the outcome of an event which may have the potential to change the existing environmental values.
For each hazard, a likelihood and consequence score is generated, which combine to determine the category of risk (high, medium or low) (Table 12 and Table 13). The residual risk score should be as low as reasonably practicable.
Table 10 Categories of Likelihood
5 Almost Certain May occur several times per year or is expected to occur
4 Likely May occur about once per year or more likely to occur than not occur
3 Possible Could occur more than once during a lifetime or more likely to occur as not to occur
2 Unlikely Could occur about once during a lifetime or more likely not to occur than to occur

70
1 Rare Unlikely to occur during a lifetime or very unlikely to occur
Table 11 Categories of Consequence
5 Catastrophic Permanent environmental damage: remediation will take more than 5 years to remediate or remediation costs exceed $500,000
4 Major Long term environmental impact. Remediation between 1-5 years or costs between $50,000 and $500,000
3 Moderate Medium-term environmental damage. Remediation will be between 2 months and 1 year or cost between $10,000 and $50,000
2 Minor
Short-term environmental impact. Remediation will take less than 2 months or cost less between $5,000 and $10,000
No lasting environmental damage
1 Negligible No environmental impact. Remediation costs less than $5,000
Requires minor or no remediation
Table 12 Likelihood and Consequence Matrix
Consequence
1 2 3 4 5
Li
kelih
ood
5
4
3
2
1
71
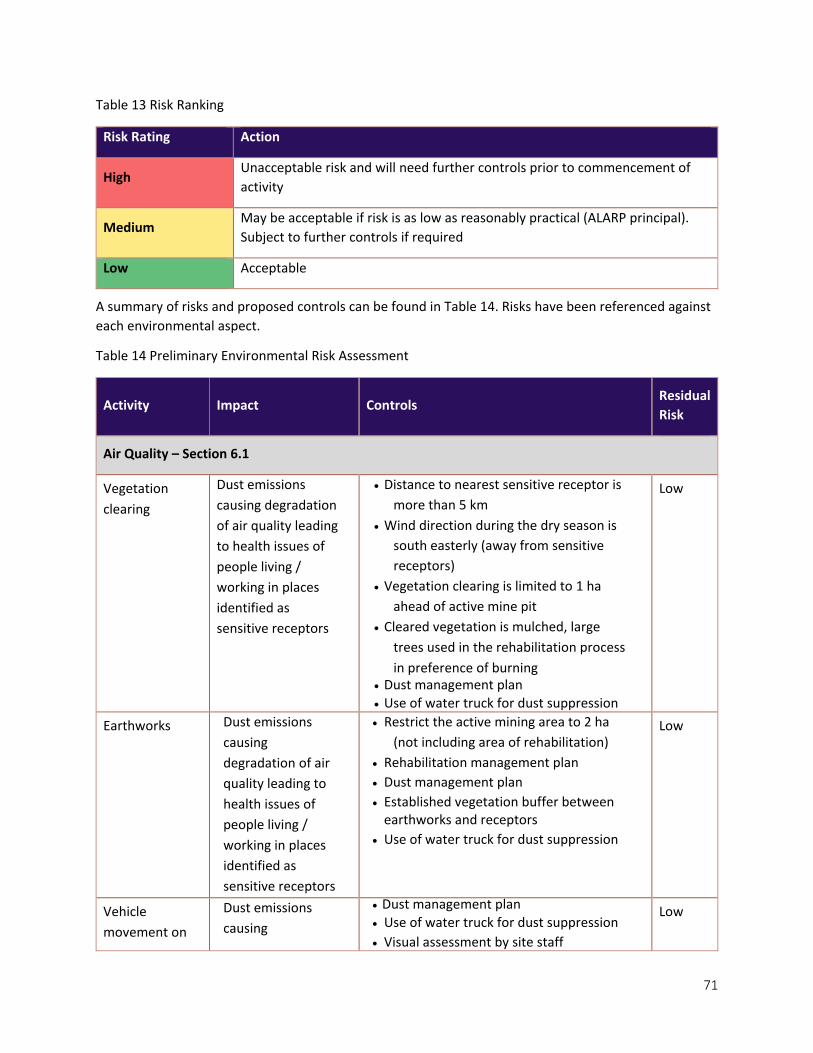
Table 13 Risk Ranking
Risk Rating Action
High Unacceptable risk and will need further controls prior to commencement of activity
Medium May be acceptable if risk is as low as reasonably practical (ALARP principal). Subject to further controls if required
Low Acceptable
A summary of risks and proposed controls can be found in Table 14. Risks have been referenced against each environmental aspect.
Table 14 Preliminary Environmental Risk Assessment
Activity Impact Controls Residual Risk
Air Quality – Section 6.1
Vegetation clearing
Dust emissions causing degradation of air quality leading to health issues of people living / working in places identified as sensitive receptors
• Distance to nearest sensitive receptor is more than 5 km
• Wind direction during the dry season is south easterly (away from sensitive receptors)
• Vegetation clearing is limited to 1 ha ahead of active mine pit
• Cleared vegetation is mulched, large trees used in the rehabilitation process in preference of burning
• Dust management plan • Use of water truck for dust suppression
Low
Earthworks Dust emissions causing degradation of air quality leading to health issues of people living / working in places identified as sensitive receptors
• Restrict the active mining area to 2 ha (not including area of rehabilitation)
• Rehabilitation management plan • Dust management plan • Established vegetation buffer between
earthworks and receptors • Use of water truck for dust suppression
Low
Vehicle movement on
Dust emissions causing
• Dust management plan • Use of water truck for dust suppression • Visual assessment by site staff
Low
72
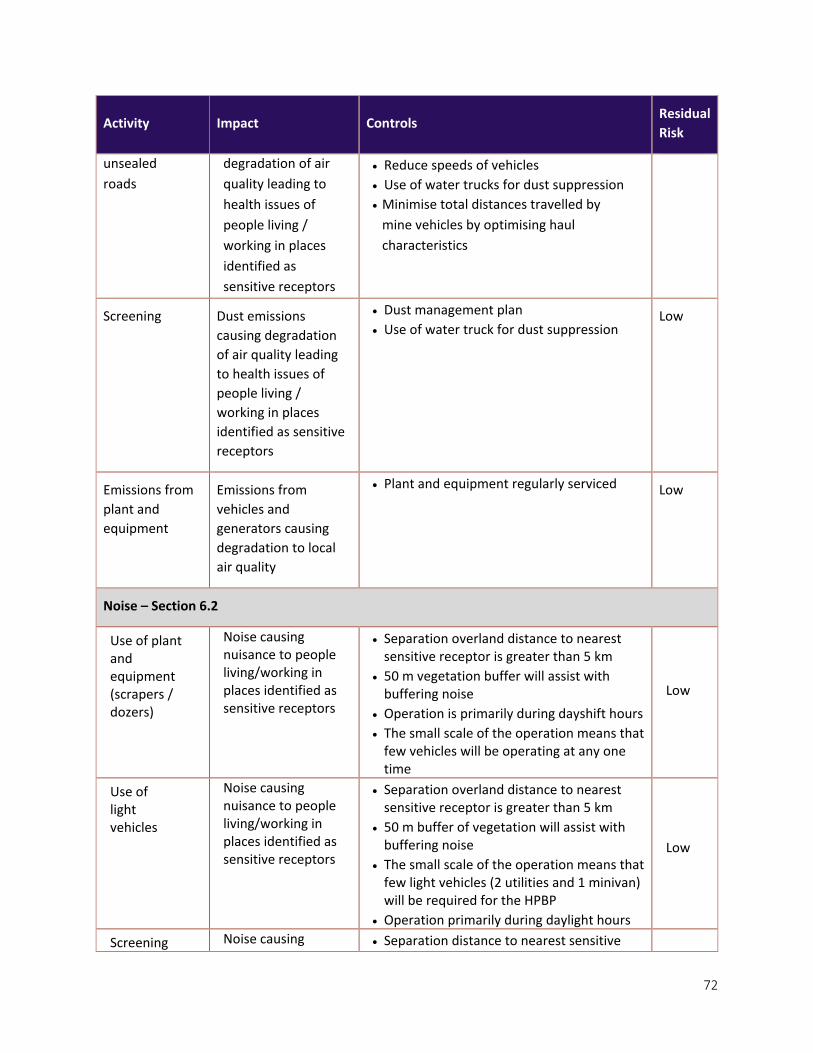
Activity Impact Controls Residual Risk
unsealed roads
degradation of air quality leading to health issues of people living / working in places identified as sensitive receptors
• Reduce speeds of vehicles • Use of water trucks for dust suppression • Minimise total distances travelled by
mine vehicles by optimising haul characteristics
Screening Dust emissions causing degradation of air quality leading to health issues of people living / working in places identified as sensitive receptors
• Dust management plan • Use of water truck for dust suppression
Low
Emissions from plant and equipment
Emissions from vehicles and generators causing degradation to local air quality
• Plant and equipment regularly serviced Low
Noise – Section 6.2
Use of plant and equipment (scrapers / dozers)
Noise causing nuisance to people living/working in places identified as sensitive receptors
• Separation overland distance to nearest sensitive receptor is greater than 5 km
• 50 m vegetation buffer will assist with buffering noise
• Operation is primarily during dayshift hours • The small scale of the operation means that
few vehicles will be operating at any one time
Low
Use of light vehicles
Noise causing nuisance to people living/working in places identified as sensitive receptors
• Separation overland distance to nearest sensitive receptor is greater than 5 km
• 50 m buffer of vegetation will assist with buffering noise
• The small scale of the operation means that few light vehicles (2 utilities and 1 minivan) will be required for the HPBP
• Operation primarily during daylight hours
Low
Screening Noise causing • Separation distance to nearest sensitive

73
Activity Impact Controls Residual Risk
nuisance to people living/working in places identified as sensitive receptors
receptor is greater than 5 km • 50 m buffer of vegetation • Only during operating during day shift
hours • Screening will likely not be undertaken for
the majority of ore extracted, due to the concentration of bauxite already present
Low
Groundwater – Section 6.3
Extraction of bauxite
Interaction with perched aquifers causing degradation of groundwater quality in localised mining area
• Shallow pit bauxite mining (<5.5 m) • Mining will only be undertaken within
the dry season • Ephemeral wetlands will recharge
during next wet season • Water management plan • Groundwater infiltration into active
mining area will be stored and utilised for dust suppression
Low
Contamination of groundwater via mine affected water infiltration
• No acid mine drainage • No processes that will produce
contaminated tailings • No local diesel storage • Soil and subsoil is benign
Low
Interaction with deeper confined aquifer impacts adjacent wetlands and surface water quality
• Maximum mining depth will not intersect deeper aquifer
• No direct or indirect impact on surface water quality or permanent wetland features
Low
Surface Water – Section 6.4
Vegetation clearing
Disturbance of natural surface water flow paths
• No clearing of defined watercourse riparian vegetation
• Erosion and sediment control plan • Water management plan
Low
Earthworks Degradation of wetlands and through escape of sediment laden water from disturbed areas
• Rehabilitation of mined panels will occur throughout the dry season
• Erosion and sediment control plan • Dry season operation • No direct or indirect impacts to permanent
wetlands
Low

74
Activity Impact Controls Residual Risk
Waste – Section 6.5
Mining equipment maintenance
Spill of hydrocarbons causing localised land contamination
• Waste management plan • Regulated wastes will be collected and
managed using colour coded receptacles which are labelled
• Suitably licenced waste contractor to collect waste
• Flammable and combustible liquids will be stored at HPBP in accordance with AS:1940
• No bulk fuel storage on the site
Low
Sewage Escape of sewage leading to localised land contamination
• Waste management plan • Suitably licenced waste contractor to
collect waste • Low volumes of sewage • Use of portable toilets to contain waste
Low
Crib room wastes (food scraps, plastics, glass etc.)
Escape of waste causing degradation to surrounding environment
• Waste management plan • Use of suitable waste receptacles • Suitably licenced waste contractor to
collect waste
Low
Cultural Heritage – Section 6.7
Clearing and Mining (Indigenous)
Damage of indigenous cultural heritage
• Cultural heritage management agreement Low
Social – Section 6.8
Mining activities (general)
Contribution to general impacts of bauxite mining in the Weipa region affecting health and wellbeing of local residents
• Employ and source equipment for the Project locally where possible and feasible
• Stakeholder management plan • Complaints management process
Low
Nature Conservation – Section 6.9
Clearing vegetation
Eucalyptus tetrodonta woodland will be cleared over eight
• Rehabilitation plan • Plan of operations • Flora and fauna management plans
Medium
75
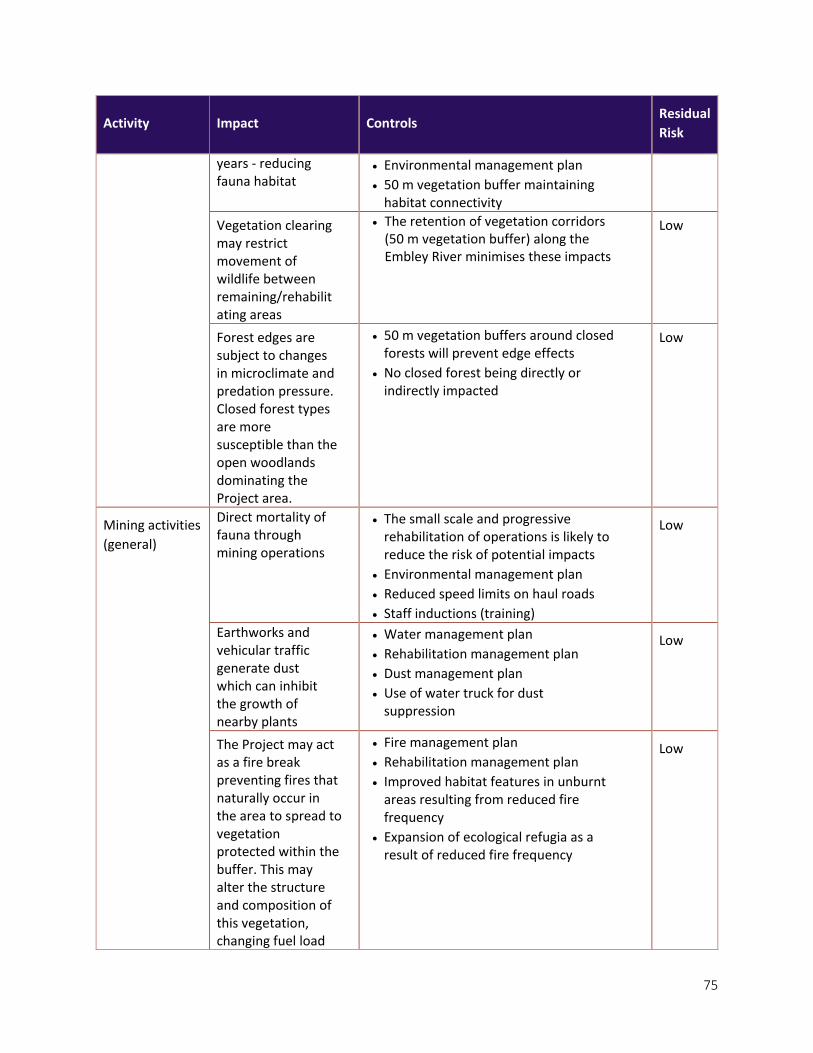
Activity Impact Controls Residual Risk
years - reducing fauna habitat
• Environmental management plan • 50 m vegetation buffer maintaining
habitat connectivity Vegetation clearing may restrict movement of wildlife between remaining/rehabilitating areas
• The retention of vegetation corridors (50 m vegetation buffer) along the Embley River minimises these impacts
Low
Forest edges are subject to changes in microclimate and predation pressure. Closed forest types are more susceptible than the open woodlands dominating the Project area.
• 50 m vegetation buffers around closed forests will prevent edge effects
• No closed forest being directly or indirectly impacted
Low
Mining activities (general)
Direct mortality of fauna through mining operations
• The small scale and progressive rehabilitation of operations is likely to reduce the risk of potential impacts
• Environmental management plan • Reduced speed limits on haul roads • Staff inductions (training)
Low
Earthworks and vehicular traffic generate dust which can inhibit the growth of nearby plants
• Water management plan • Rehabilitation management plan • Dust management plan • Use of water truck for dust
suppression
Low
The Project may act as a fire break preventing fires that naturally occur in the area to spread to vegetation protected within the buffer. This may alter the structure and composition of this vegetation, changing fuel load
• Fire management plan • Rehabilitation management plan • Improved habitat features in unburnt
areas resulting from reduced fire frequency
• Expansion of ecological refugia as a result of reduced fire frequency
Low

76
Activity Impact Controls Residual Risk
and thereby the potential for fires in the future The only elevations in noise level will be through the operation of machinery (e.g., diggers and loaders)
• Vehicles will be operated to manufacturer’s specifications and serviced regularly
• Mining methodology does not require explosives
Low
Inappropriate disposal and storage of putrescible waste may attract feral predators such as cats, dingo’s or pigs. Native species that feed or breed on the ground are most susceptible to these pest animals.
• Waste management plan • Appropriate waste receptacles at site • Waste collected by suitably licenced
contractor
Low
Land clearance and vehicular traffic have the potential to introduce and spread weeds
• Weed management plan (including vehicle wash down procedures)
Low
Human activities can disturb the regular behaviour of wildlife beyond the effects of noise and light. Timid species avoid foraging and breeding in areas with high human activity
• Buffers around sensitive habitats will minimise these risks
Low
Cumulative impacts
Contribution of environmental degradation in the region through increased footprint of land disturbance from bauxite mining
• The Weipa region already contains large areas under bauxite mining and rehabilitation
• The newly approved Amrun Project will result in the loss of substantial areas of habitat to the west and south of the area, over longer periods of
Low

77
Activity Impact Controls Residual Risk
time than the 8 year mine life of the Project
• All designated buffers and wildlife corridors proposed for the Project will connect with corridors to be conserved as part of the Amrun Project
• The Project is a small project in comparison to neighbouring approved mines

78
6.0 Environmental Values, Potential Impacts, Management Practices This section of the report provides a description of the environmental values that have the potential to be impacted upon by the Project. An environmental risk assessment provides the magnitude of the potential impacts of the activities being undertaken at the Project on the environmental values. Each section is concluded with management strategies to reduce the risk and demonstrate how the Project will manage its environmental impacts.
6.1 Air Quality The UBx will be a small bauxite mining operation located in a remote area that is mostly undeveloped. As shown in Figure 4, the Project is bounded to the south by a large bauxite mining operation with significantly larger environmental risks. Additionally, other existing mining related projects exist to the east (Hey Point Bauxite) and to the north west (Urquhart Point Mineral Sands). With respect to air quality, the following activities currently contribute to particulate emissions in the vicinity of the Project:
• Smoke from annual bushfires and controlled burns • Port of Weipa (stockpiling and loading product bauxite into bulk vessels for export markets) • Dust emissions from motor vehicles using unsealed roads
There is no directly relevant air monitoring data available to provide an indication of existing mining projects on air quality. Air quality monitoring is completed by the Queensland Department of Science, Information Technology and Innovation for a range of locations, however the nearest monitoring station is in Townsville.
The EIS prepared in 2011 for Amrun reviews historic project specific air quality monitoring data completed in the Weipa area. The data relates primarily to particulates, given this is the primary air quality parameter of concern for mineral extraction related activities. On the basis of the data reported in the Amrun EIS, the following typical background concentrations are considered reasonable for the general community in and around the existing mine projects:
• PM2.5 – 7 µg/m3 24 hour average • PM10 – 22 µg/m3 24 hour average • Total Suspended Particulate (TSP) – 23 µg/m3 annual average • Deposited Dust – 50 mg/m2/day (monthly average)
The operation of the Amrun project is likely to increase localised dust loadings, however for the receptors of interest to the UBx Project, these typical background concentrations are likely to be reasonable.
6.1.1 Potential Impacts on Environmental Values Potentially sensitive receptors have been identified in the surroundings of the Project as follows (Figure 10):
• Nanum • Napranum • Hey Point • Weipa • Amrun Construction Camp • Sudley Homestead

79
Hey Point is the focus of mineral processing and shipping activities, hence can be considered as both an existing source of emissions and a potential receptor.
For the purposes of determining separation distances from the proposed UBx Project, three points have been identified around the perimeter of the mine. The minimum separation distances are considered in the context of the potential for noise propagation from the proposed activities, and the potential for dust impacts to arise.
The proposed mine site is located on low lying land at a height of 1 – 5 m above sea level. The entire peninsula is relatively flat, rising to just over 10 m to the east, and to 30 m at the southern end of the peninsula. Given the relative lack of terrain features, air emissions from the UBx are not likely to benefit from significant attenuation by off-site topographic features. However, the feature formed by the mine pit walls may provide some benefit in terms of emissions attenuation.
Air quality may be impacted on a local scale by the Project, primarily through the generation of dust associated with earthworks and traffic. No odour-developing or ozone-depleting products will be used at the Project; therefore, odours and ozone depletion are not considered relevant to this assessment.
The prevailing winds during the dry season are beneficial for the Project, as the nearest potentially sensitive receptors are located to the north and south of the UBx Project. In particular, the townships of Weipa, Nanum and Napranum are located to the north, and the prevailing winds will disperse emissions from the operations to the west and north-west for the vast majority of time. On this basis, the potential for particulate emissions from the operations to affect the key receptor groupings is very limited.

80
6.1.1.1 Activities at the Project
In relation to air quality, the primary risk of impacts relates to relates to particulate emissions from plant and vehicle operations on open surfaces, and from movement and processing of overburden, top soil and the mined ore as follows:
• Clearing activities
• Earthworks
• Topsoil / subsoil stripping
• Movement of topsoil and subsoil
• Stockpile stacking and unloading
• Extraction and movement of bauxite
• Traffic on unsealed roads
• Grading of access roads
• Movement of light vehicles, haul trucks and other machinery
• Mobile screening of material
• Loading of materials onto trucks
• Wind erosion
Whilst gaseous emissions will be associated with fuel combustion, given the significant separation distance to the nearest receptors (> 5 km) and the scale of the operation, the impacts of gaseous emissions will be negligible.
6.1.1.2 Greenhouse Gases
Greenhouse gases will also be generated by activities at the Project including:
• Burning of fuel in heavy and light vehicles • Burning of fuel for electricity production via portable generators • Land clearing
6.1.2 Air Quality Objectives
6.1.2.1 Queensland The Queensland Environmental Protection (Air) Policy 2008 (EPP (Air)) specifies air quality criteria for pollutant compounds relevant to the Project. Table 15 summarises the criteria for the relevant compounds.
Table 15 Air Quality Criteria
Compound Air Quality Goal (µg/m3) Averaging Period
Carbon Monoxide 11,000 8 hours
Nitrogen Dioxide 250 1 hour

81
Compound Air Quality Goal (µg/m3) Averaging Period
62 Annual
PM10 50 24 hour
PM2.5 25 24 hour
PM2.5 8 Annual
The EPP Air does not provide criteria for deposited dust, however historically a 120 mg/m2/day goal has been referred to in environmental licenses. The model mining conditions nominate this deposition rate as an appropriate threshold for particulate emissions from mining activities.
6.1.2.2 Commonwealth Ambient Goals The NEPM ambient air quality goals are presented in Table 16. These goals are broadly consistent with the recommendations of the QLD DEHP, are presented in Table 15, with the exception of particulates. A recent update to the NEPM confirmed standards for PM2.5 based on the previous advisory reporting standards. In addition, the variation to the NEPM introduced an annual standard of 25 µg/m3 for PM10.
Table 16 NEPM Ambient Air Quality - Standards and Goals
Pollutant Averaging Period Maximum Concentration
Goal within 10 years – Maximum Allowable Exceedances
Carbon Monoxide (CO) 8 hours 9.0 ppm 1 day each year
Nitrogen Dioxide (NO2) 1 hour
1 year
0.12 ppm / 12 pphm
0.03 ppm / 3 pphm
1 day each year
None
Particulates as PM10 1 day
1 year
50 µg/m3
25 µg/m3
None
None
Particulates as PM2.5 1 day
1 year
25 µg/m3
8 µg/m3
None
None

82
6.1.3 Air Quality Review
6.1.3.1 Particulate Emission Sources Based on the currently available mining plans, there is potential for particulate emissions to arise as a result of the following:
• Two hectares actively worked mine area at any one time • Haul route emissions – vehicle related, and open surface area • Ore extraction, stockpiling, removal and transport – 1 million t p/a • Overburden / topsoil removal and stockpiling – 2 million t p/a • Ore processing onsite – screening of 10 percent of extracted material – 100,000 t p/a
The mining operations are proposed to occur during the dry season typically from April to November for 12 hours a day.
6.1.3.2 Emissions Estimates To provide an indication of the significance of the project in terms of dust emissions, emissions estimates have been completed based on the techniques presented in the National Pollutant Inventory for Mining1. For the purposes of the emissions estimation, the normal mining operational scenario has been considered as the emissions from this activity will be more significant than the construction phase and the initial site establishment stage. The resultant annual emissions for each activity are presented in Table 17. For the purposes of the emissions calculations, the following assumptions have been adopted:
• Default silt content and moisture contents from NPI manual • Average wind speeds for Weipa for wind erosion related sources • Silt content of 10 percent (relatively high) • Moisture content of 2 percent (relatively low) • No emissions controls
Table 17 Particulate Emissions Estimates (tonnes per annum)
Source Quantity TSP PM10 PM2.5
Active Open Mining Area – Wind Erosion
2 Hectares at any one time 7 4 1
Unsurfaced Access Road – Wind Erosion
16 km x 25 m wide road 140 70 14
Haul Vehicles on Access Road
Haul of 1 million tonnes of ore 271 80 8
Ore and overburden / topsoil extraction and
Dozer (1), Grader (1) and Scraper (2) operating continuously, 12 hours a day April to November
58 14 4
1 National Pollutant Inventory Emission Estimation Technique Manual for Mining, Version 3.1, January 2012.

83
Source Quantity TSP PM10 PM2.5
stockpiling, access road maintenance
Materials transfers 1 million t p/a ore to windrow
2 million t p/a soil / overburden to stockpile
1 million t p/a load ore to trucks
100,000 t p/a load ore to screening
100,000 t p/a load screened ore to truck
2 million t p/a replace soil / overburden during rehabilitation
372 186 37
Screening of Ore 100,000 t p/a 60 45 9
Stockpiles 1 Hectare at any one time 4 2 0.5
Total (t p/a) 912 401 73.5
To provide an indication of the scale of the estimated Project emissions, Table 18 presents data from a similar emission inventory completed for the Amrun project (2011 EIS).
Table 18 Amrun Project - Estimated Particulate Emissions (t p/a)
Source TSP PM10 PM2.5
Dust from Access Roads 9,385 1,925 231
Dust from Mining Areas (development, mining operation and rehabilitation)
3,249 993 119
Dust from beneficiation plant, conveyors, stockpiles, tailings, storage and shiploaders
3,363 1,153 185
Annual Total (tonnes) 15,997 4,071 535
As would be expected given the significantly different size of the UBx and the Amrun project, the estimate particulate emissions from the UBx Project are estimated to be significantly lower. For TSP and PM10 overall annual emissions are expected to be a factor of 10 lower, and for PM2.5 seven times lower than the projected emissions for Amrun.

84
Given the separation distance of the nearest potentially sensitive receptors (> 5 km), the scale of operations, the estimated emissions, prevailing wind directions and the potential benefit of vegetated buffers, it is considered unlikely that air quality impacts in excess of the State and Commonwealth air quality goals will arise as a result of the Project. However, given the location of significant existing particulate emitting projects in the region, it is considered appropriate to adopt best practice air quality management measures to reduce dust emissions where practicable.
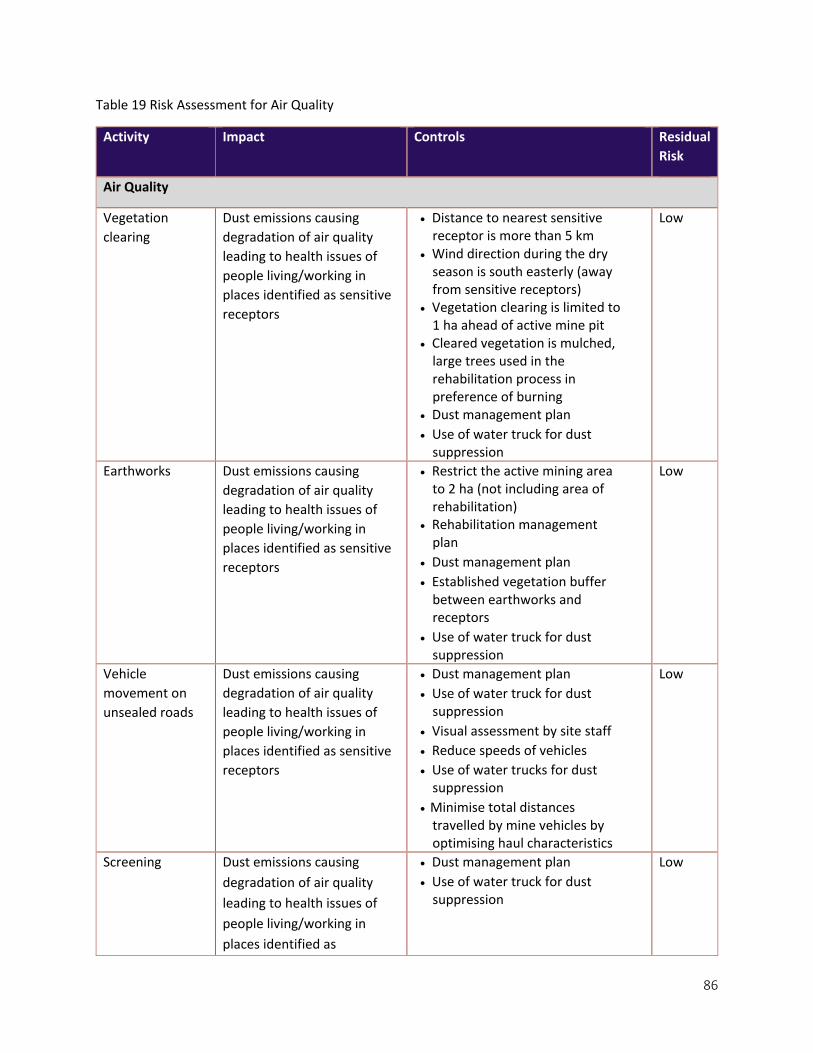
6.1.4 Risk Description A risk assessment for air quality is summarised in Table 19. As shown in the risk assessment, all perceived risks have a residual risk of ‘low’. The magnitude of the potential air quality impacts on environmental values at the Project will be reduced further by confining operations to the dry season, disturbing less than two hectares of land at any time (excluding land being rehabilitated) and having a short mine life. Management practices implemented at the Project will further reduce dust and greenhouse gas emissions.

86
Table 19 Risk Assessment for Air Quality
Activity Impact Controls Residual Risk
Air Quality
Vegetation clearing
Dust emissions causing degradation of air quality leading to health issues of people living/working in places identified as sensitive receptors
• Distance to nearest sensitive receptor is more than 5 km
• Wind direction during the dry season is south easterly (away from sensitive receptors)
• Vegetation clearing is limited to 1 ha ahead of active mine pit
• Cleared vegetation is mulched, large trees used in the rehabilitation process in preference of burning
• Dust management plan • Use of water truck for dust
suppression
Low
Earthworks Dust emissions causing degradation of air quality leading to health issues of people living/working in places identified as sensitive receptors
• Restrict the active mining area to 2 ha (not including area of rehabilitation)
• Rehabilitation management plan
• Dust management plan • Established vegetation buffer
between earthworks and receptors
• Use of water truck for dust suppression
Low
Vehicle movement on unsealed roads
Dust emissions causing degradation of air quality leading to health issues of people living/working in places identified as sensitive receptors
• Dust management plan • Use of water truck for dust
suppression • Visual assessment by site staff • Reduce speeds of vehicles • Use of water trucks for dust
suppression • Minimise total distances
travelled by mine vehicles by optimising haul characteristics
Low
Screening Dust emissions causing degradation of air quality leading to health issues of people living/working in places identified as
• Dust management plan • Use of water truck for dust
suppression
Low

87
Activity Impact Controls Residual Risk
Air Quality
sensitive receptors Emissions from plant and equipment
Emissions from vehicles and generators causing degradation to local air quality
• Plant and equipment regularly serviced
Low
6.1.5 Management Practices 6.1.5.1 Dust Management
The following mitigation measures will be implemented to manage dust at the Project site:
• Restrict mining disturbance to what is necessary for the operation (disturbing less than 2 ha of land at any time)
• Avoid re-handling of soil by direct placing onto rehabilitation areas
• Water exposed surfaces (access roads) during operations
• Limit light vehicles to a 40 km/h speed limit on unsealed roads
• Progressively rehabilitate mined areas
• Limit burning of cleared vegetation
• Investigate any dust complaints promptly and take appropriate actions to reduce dust nuisance
• Maintain a register of dust complaints
• Covering loads of haul trucks when leaving the site
• Properly maintain all equipment operated by diesel engines to minimise gaseous and particulate exhaust emissions
• Shut down equipment when not required (to avoid diesel emissions during idling)
In addition, it is noted that the significant areas of vegetation that are to be maintained in the surroundings of the UBx Project area will provide some benefit in terms of dust management. Dense vegetation acts as a wind break, and can also provide a small reduction in dust concentrations by scavenging of impinged dust particles from a dust laden air stream.
6.1.5.2 Greenhouse Gas Management
The following mitigation measures will be implemented to manage GHG at the Project:
• Minimising clearing
• Progressive rehabilitation of mined areas
• Optimise haul distances and thus energy use by strategic mine planning
• Consideration of fuel efficiencies of equipment to be used at the Project during the procurement

88
process
• Limit the use of lighting by operating primarily during daylight hours
• Maintain equipment onsite to maximise fuel efficiency
• Use appropriately sized equipment
• Maximising the use of renewable energy sources where possible
• Identify potential energy efficiency opportunities on a regular and ongoing basis
6.1.6 Commitments: Air Quality
Oresome will commit to the following in relation to air quality:
• Ensure all reasonable avoidance and mitigation measures are employed • Handling of any valid complaints received in relation to air quality • Records to be maintained (BoM rainfall data and weather station data) • Weekly environmental checklist to be undertaken to ensure compliance with the Environmental
Management Plan • Technical guidelines as identified by DEHP will be adhered to in the development of all
documentation, specifically: o Application requirements for activities with impacts to air (ESR/2015/1840, version 3.01)
6.1.7 Proposed Conditions: Air Quality Air quality management is included in the Model Mining Conditions (specified by EHP guidelines). The conditions that pertain to air quality management are enclosed within Schedule B of the Mining Model Conditions (see inset below). Of the model mining conditions, B1 (discharge of contaminants other than dust), B2 (stationary source emissions) and B3 (point source and fugitive emissions) are not relevant to the Project. Most model mining conditions pertaining to B4 (dust and particulate matter) are relevant to the Project, and are contained within the inset below. The only exception relates to PM2.5, which arises primarily from combustion sources, and is thus not likely to be significantly elevated by the Project. Air quality monitoring will be conducted only in response to a legitimate complaint received by Oresome in accordance with conditions A11 and A12 (General Conditions).
Schedule B – Air
Point source releases to air
B4 The proponent shall ensure that all reasonable and feasible avoidance and mitigation measures are employed so that the dust and particulate matter emissions generated by the mining activities do not cause exceedances of the following levels when measured at any sensitive or commercial place:
1. Dust deposition of 120 milligrams per square metre per day, averaged over one month, when monitored in accordance with the most recent version of Australian Standard AS3580.10.1 Methods for sampling and analysis of ambient air-Determination of particulate matter-Deposited matter – Gravimetric method
2. A concentration of particulate matter with an aerodynamic diameter of less than 10 micrometres (PM10) suspended in the atmosphere of 50 micrograms per cubic metre over a 24-hour averaging time, for no more than five exceedances recorded

89
each year, when monitored in accordance with the most recent version of either: d) Australian Standard AS3580.9.6 Methods for sampling and analysis of ambient air –
Determination of suspended particulate matter – PM10 high volume sampler with size selective inlet – Gravimetric method, or
e) Australian Standard AS3580.9.9 Methods for sampling and analysis of ambient air – Determination of suspended particulate matter – PM10 low volume sampler – Gravimetric method.
1. A concentration of particulate matter suspended in the atmosphere of 90 micrograms per cubic metre over a 1 year averaging time, when monitored in accordance with the most recent version of AS/NZS3580.9.3:2003 Methods for sampling and analysis of ambient air – Determination of suspended particulate matter – Total suspended particulate matter (TSP) – High volume sampler gravimetric method.

90
6.2 Noise and Vibration The Project lies a considerable distance from the nearest sensitive receptors of Napranum (7 km north-east), Nanum (9 km north), Weipa (5 km north), Aurukun (75 km south-west) and Sudley Homestead (50 km east). Sensitive receptors which have been deemed relevant to the Project for noise have been displayed in Figure 10.
There will be no significant vibration sources associated with the Project. Blasting is not required as part of the Project and therefore vibration issues will not be addressed further.
6.2.1 Environmental Values The Environmental Protection (Noise) Policy 2008 (EPP (Noise)) defines the following environmental values to be enhanced or protected:
• The qualities of the acoustic environment that are conducive to protecting the health and biodiversity of ecosystems;
• The qualities of the acoustic environment that are conducive to human health and wellbeing, including by ensuring a suitable environment for individuals to do any of the following:
o sleep o study or learn o be involved in recreation, including relaxation and conversation, and
• The qualities of the acoustic environment that are conducive to protecting the amenity of the community, including its social and economic amenity.
6.2.2 Acoustic Goals and Criteria 6.2.2.1 Operational Noise The DEHP have released model conditions for a range of industries and activities in Queensland. These provide guidance as to the appropriate project specific criteria to adopt for the management of noise from specific industries including mining. Table D1 in section 6.2.5 clearly sets out the model mining noise conditions for sensitive receptors.
Based on the model mining conditions, adopting 30 dB(A) as the minimum background level for deriving noise criteria, the noise criteria in Table 20 are applicable to the UBx Project.
Table 20 Model Mining Conditions Derived Noise Criteria
Noise Level dB(A) measured as:
Monday to Saturday Sundays and Public Holidays 7am to 6pm
6pm to 10pm
10pm to 7am
9am to 6pm
6pm to 10pm
10pm to 9am
LAeq,adj,15mins 35 35 30 35 35 30 LA1,adj,15mins 40 40 35 40 40 35
91
6.2.2.1 Construction Noise The EP Act provides the following legislation in relation to construction works:
‘440R Building Work
(1) A person must not carry out building work in a way that makes an audible noise – a. On a business day or Saturday, before 6.30 am or after 6.30 pm; or b. On any other day, at any time.’
The Section 440R requirements are reflective of the fact that managing exposure times is the most appropriate solution for management of short-term construction noise. If construction works are required outside the above defined period, it is generally necessary to lodge an application with the relevant regulatory authority.
6.2.3 Source Noise Levels Source noise levels for the various items of plant and equipment expected to be used for each of the mine phases was assessed. Based on the sound power level data, the following maximum activity noise levels were determined:
• Initial site preparation: 121.7 dB(A) Lw • Normal mining activities: 122.7 dB(A) Lw • Haul route construction: 118.2 dB(A) Lw
Haul route usage during the operational period will involve fewer mobile plant except when maintenance occurs. During maintenance periods, types and numbers of plant and equipment will be similar to those used during construction. On this basis, the construction noise levels for the haul route are expected to represent a worst case, and noise levels during normal operations and maintenance are expected to be lower.
Those activity noise levels assume that all plant items, including multiples of the same item, operate continuously and simultaneously with the exception that three of the six B-double haul trucks are assumed to operate onsite, with three hauling off-site.
6.2.4 Estimated Receptor Noise Levels In order to calculate the maximum expected receptor noise levels for the different phases of the mine, acoustic calculations have been completed that take into account standard distance separation calculations and air absorption. The results of the calculations are presented in Table 21. For the purposes of these worst case calculations, the following assumptions have been adopted:
• All plant operate simultaneously and continuously for 12 hours a day, including three of the six B-doubles
• All plant items are located at the site boundary closest to the receptor of interest • No topographic shielding occurs
As the mine sections demonstrate, for most of the surrounding receptors shielding from the mine walls is likely to reduce noise propagation from the Project site. This, in combination with the westerly and north-westerly prevailing winds, will further reduce the predicted noise levels.

92
Table 21 Maximum Worst Case Predicted Receptor Noise Levels
Receptor Identifier Maximum Worst Case Sound Pressure Level – dB(A) Access Road Construction
Initial Site Preparation Normal Operations
Nanum 17.5 24.5 33.5 Napranum 19.9 24.5 33.5 Hey Point N/A 23.2 32.2 Weipa 17.2 21.7 30.8 Amrun Construction Camp
7.1 14.4 23.5
Sudley Homestead <5 5.3 14.3 Aurukun <5 4.6 13.7 Model mining conditions noise criteria:
Daytime: 35 dB(A) LAeq, 40 dB(A) LA1 Evening: 35 dBA(A) LAeq, 40 dB(A) LA1
Based on comparison with the noise criteria derived from the model mining conditions, the predicted noise levels associated with the UBx Project are expected to be well within the appropriate acoustic goals.
The magnitude of noise on environmental values at the Project will be further reduced by limiting bauxite extraction to only 12 hours per day during daylight hours and operating only during the dry season. Management practices implemented at the Project will further act to reduce noise.
The review of potential acoustic impacts has concluded that worst case noise emissions from the Project are expected to remain well within the appropriate acoustic goals at the nearest sensitive receptors.
6.2.5 Noise Management Practices The following best practice measures are proposed to be implemented at the site to assist in managing noise emissions:
• Optimise mine layout to shield noise generation • Strategically plan the haul locations to limit total haulage required • Avoid double-handling of soil by directly placing stripped soil onto rehabilitation sites • Regularly service and maintain mining equipment exhaust systems • Limit speeds of mining equipment • Consider noise abatement fittings on mine vehicles prior to procurement • Investigate any noise complaints promptly and take appropriate actions to reduce noise
nuisance • Maintain a register of noise complaints • Ensure that all construction activity is limited to hours designated by the EP Act (6.30 am to 6.30
pm Monday to Saturday, excluding public holidays) • Equipment selection and maintenance:
o Use broadband reversing alarm systems (“quacker” alarms) o Select lower noise equipment and machinery o All noise generating equipment and machinery operated onsite must be properly
maintained. Specifically, noise reduction equipment such as mufflers must be routinely

93
checked to ensure it is fitted and functional. Where noise reduction equipment is not operating correctly, the machine must not be used until the defect is rectified
• Construction equipment siting and operation: o Locate any continuous stationary machinery such as generators furthest from sensitive
receptors o Use existing structures and barriers to shield receptors from noisy activity or machinery o Shut down equipment which are not required to be operated (instead of unnecessary
idling for extended periods) • Where complaints are received, these should be properly documented. Measures for reducing
noise levels should be identified as part of the complaint response process
6.2.2.1 Risk Description
A risk assessment for noise is summarised in Table 22. Management measures to avoid and mitigate potential impacts from noise are also considered.
This risk assessment identifies all activities as having a low residual risk. Noise at the Project is expected to be minimal due to the small scale of operations and the remote location of the Project in relation to sensitive receptors. The magnitude of noise on environmental values at the Project will be reduced by limiting bauxite extraction activities to only 12 hours per day during daylight hours and operating only during the dry season. Management practices implemented at the Project will further reduce noise.
Table 22 Noise Risk Assessment
Activity Impact Controls Residual Risk
Noise
Use of plant and equipment (scrapers / dozers)
Noise causing nuisance to people living/working in places identified as sensitive receivers
• Separation overland distance to nearest sensitive receptor is greater than 5 km
• 50 m vegetation buffer will assist with buffering noise
• Operation is primarily during dayshift hours
• The small scale of the operation means that few vehicles will be operating at any one time
Low
Use of light vehicles
Noise causing nuisance to people living/working in places identified as sensitive receivers
• Separation overland distance to nearest sensitive receptor is greater than 5 km
• 50 m buffer of vegetation will assist with buffering noise
• The small scale of the operation means that few light vehicles (2 utilities and 1 minivan) will be required for the HPBP
• Operation primarily during
Low
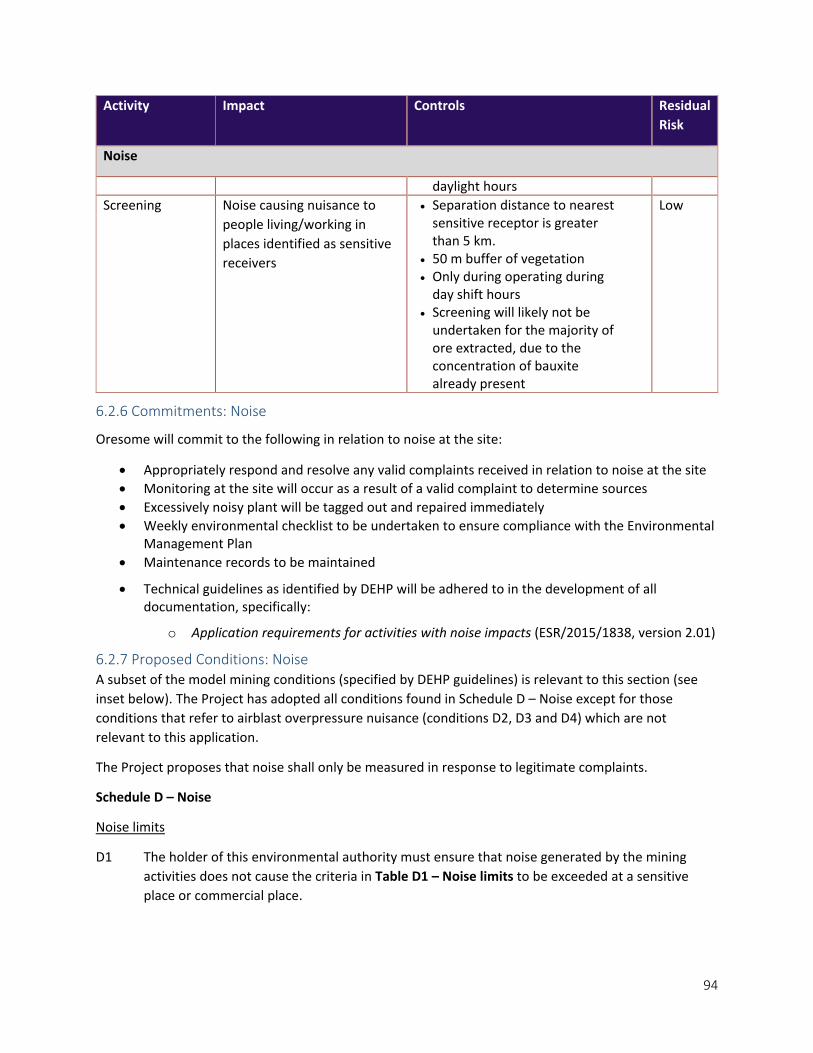
94
Activity Impact Controls Residual Risk
Noise
daylight hours Screening Noise causing nuisance to
people living/working in places identified as sensitive receivers
• Separation distance to nearest sensitive receptor is greater than 5 km.
• 50 m buffer of vegetation • Only during operating during
day shift hours • Screening will likely not be
undertaken for the majority of ore extracted, due to the concentration of bauxite already present
Low
6.2.6 Commitments: Noise
Oresome will commit to the following in relation to noise at the site:
• Appropriately respond and resolve any valid complaints received in relation to noise at the site • Monitoring at the site will occur as a result of a valid complaint to determine sources • Excessively noisy plant will be tagged out and repaired immediately • Weekly environmental checklist to be undertaken to ensure compliance with the Environmental
Management Plan • Maintenance records to be maintained
• Technical guidelines as identified by DEHP will be adhered to in the development of all documentation, specifically:
o Application requirements for activities with noise impacts (ESR/2015/1838, version 2.01)
6.2.7 Proposed Conditions: Noise A subset of the model mining conditions (specified by DEHP guidelines) is relevant to this section (see inset below). The Project has adopted all conditions found in Schedule D – Noise except for those conditions that refer to airblast overpressure nuisance (conditions D2, D3 and D4) which are not relevant to this application.
The Project proposes that noise shall only be measured in response to legitimate complaints.
Schedule D – Noise
Noise limits
D1 The holder of this environmental authority must ensure that noise generated by the mining activities does not cause the criteria in Table D1 – Noise limits to be exceeded at a sensitive place or commercial place.
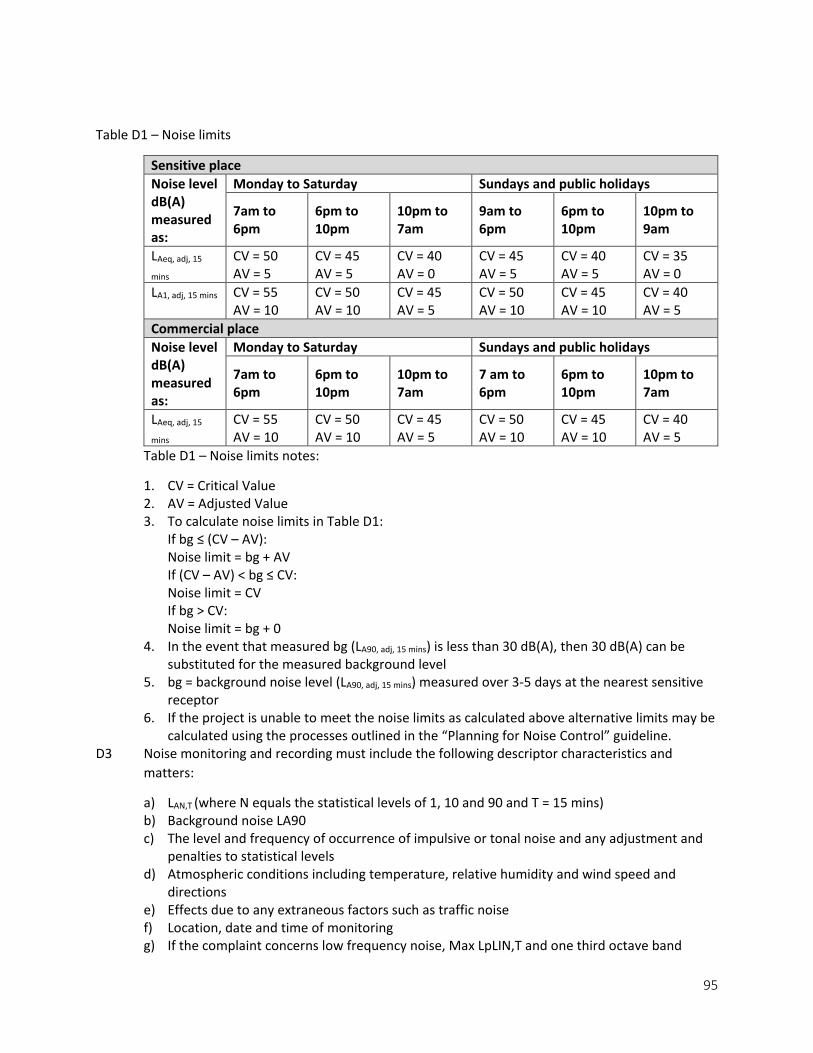
95
Table D1 – Noise limits
Sensitive place Noise level dB(A) measured as:
Monday to Saturday Sundays and public holidays
7am to 6pm
6pm to 10pm
10pm to 7am
9am to 6pm
6pm to 10pm
10pm to 9am
LAeq, adj, 15
mins CV = 50 AV = 5
CV = 45 AV = 5
CV = 40 AV = 0
CV = 45 AV = 5
CV = 40 AV = 5
CV = 35 AV = 0
LA1, adj, 15 mins CV = 55 AV = 10
CV = 50 AV = 10
CV = 45 AV = 5
CV = 50 AV = 10
CV = 45 AV = 10
CV = 40 AV = 5
Commercial place Noise level dB(A) measured as:
Monday to Saturday Sundays and public holidays
7am to 6pm
6pm to 10pm
10pm to 7am
7 am to 6pm
6pm to 10pm
10pm to 7am
LAeq, adj, 15
mins CV = 55 AV = 10
CV = 50 AV = 10
CV = 45 AV = 5
CV = 50 AV = 10
CV = 45 AV = 10
CV = 40 AV = 5
Table D1 – Noise limits notes:
1. CV = Critical Value 2. AV = Adjusted Value 3. To calculate noise limits in Table D1:
If bg ≤ (CV – AV): Noise limit = bg + AV If (CV – AV) < bg ≤ CV: Noise limit = CV If bg > CV: Noise limit = bg + 0
4. In the event that measured bg (LA90, adj, 15 mins) is less than 30 dB(A), then 30 dB(A) can be substituted for the measured background level
5. bg = background noise level (LA90, adj, 15 mins) measured over 3-5 days at the nearest sensitive receptor
6. If the project is unable to meet the noise limits as calculated above alternative limits may be calculated using the processes outlined in the “Planning for Noise Control” guideline.
D3 Noise monitoring and recording must include the following descriptor characteristics and matters:
a) LAN,T (where N equals the statistical levels of 1, 10 and 90 and T = 15 mins) b) Background noise LA90 c) The level and frequency of occurrence of impulsive or tonal noise and any adjustment and
penalties to statistical levels d) Atmospheric conditions including temperature, relative humidity and wind speed and
directions e) Effects due to any extraneous factors such as traffic noise f) Location, date and time of monitoring g) If the complaint concerns low frequency noise, Max LpLIN,T and one third octave band

96
measurements in dB(LIN) for centre frequencies in the 10 – 200 Hz range.
97
6.3 Groundwater
This section identifies the environmental values of groundwater that require protection during activities associated with the UBx Project. It also provides appropriate management strategies and mitigation measures to ensure that the risks of potential impacts to the groundwater environmental values are minimised.
A Hydrogeological Assessment of potential groundwater impacts associated with the UBx is provided in Appendix B and has been used to inform this section of the report. A Conceptual Hydrogeological Model (CHM) has been prepared for the Project (Drawing 21 – Appendix B). The CHM outlines a simplified representation of the actual system through a descriptive and graphical presentation of the groundwater system of the UBx area. The CHM shows both the shallow aquifer (regional water table) and potential perched aquifers in relation to the mining area. The CHM shows the relationship between the confined regional water table, unconfined perched aquifers and the proposed mining areas (bauxite). A cross-section of the CHM shows the anticipated fluctuation of the regional water table during wet and dry seasons (Drawings 9 and 10 – Appendix B). It is not anticipated that the UBx will interact with the regional water table. Additional works in November and December 2016 have been undertaken in relation to groundwater assessment and numerical modelling, specifically:
• Revision of the observed groundwater hydrographs • Completion of a Chloride Mass Balance, an estimation of groundwater recharge rates at the
Project site • Provision of a site water balance based on the current Conceptual Hydrogeological Model.
The water balance includes the main flow components of the groundwater system and accounts for the variations between wet season and dry seasons
• The development of a numerical model that has been used to assess the potential impact on groundwater due to mining
In March 2017, an updated Groundwater Impact Report was completed. The Groundwater Impact Report includes the components listed above, together with the following:
• An assessment of the adequacy of the current groundwater monitoring program • Recommendations with respect to the groundwater monitoring network, and its ability to
meet its competing objectives • A graphic representation of the Conceptual Hydrogeological Model, which combines the key
learnings from the hydrogeological assessment, subsequent numerical modelling, and modelled impacts in response to mining
Results of this assessment are similar to the findings of the hydrogeological assessment for the nearby Hey Point Bauxite Project (RPS Water, 2014). The same stratigraphic sequence is recognised in RPS Water (2014), and as a result both areas have a similar Conceptual Hydrogeological Model. The Hey Point Bauxite Project is similar in nature to the proposed UBx Project in regard to hydrogeological setting, mining operations and rehabilitation. RPS Water (2014) finds that there will be no impact on groundwater resources and ephemeral wetlands by the Hey Point Bauxite Project, an outcome similar to this groundwater assessment for the UBx Project.
98
6.3.1 Description of Groundwater
Existing studies have differentiated the groundwater bodies in the region into three groundwater systems:
• Shallow aquifer – within the Bulimba Formation (Fm.)
• Artesian aquifer – within the Gilbert River Fm. and the Garraway Beds
• Perched aquifers – discrete aquifers that may occur locally above the shallow aquifer units
The shallow aquifer resources are hosted within the Bulimba Fm. which overlies the confining shales and siltstones of the Rolling Downs Group. The artesian resources are hosted within the underlying Gilbert River Fm. and Garraway Beds. In relation to water resources management, the Gilbert River Formation and Garraway Beds are considered equivalents and are managed as one unit.
A third groundwater system, perched aquifers, can be defined in the upper horizons of the Bulimba Fm. within the Kaolinite and possibly within the bauxite.
6.3.1.1 Groundwater Levels Groundwater levels have been manually recorded in monitoring bores when constructed in December 2015, and in February, March, April, May and June of 2016. In addition, continuously recorded groundwater level data was obtained for three bores since mid-December 2015 using Solinst dataloggers. The results of the continuous recording of groundwater levels are illustrated as hydrographs in Drawing 17 – Appendix B. Additional data loggers were also installed in another three bores in April 2016. Refer Figure 11 for groundwater monitoring locations.
At times, groundwater monitoring bores have been observed to be dry. This may not be an indication that the aquifer has completely dried out, but an indication that the groundwater level has fallen below the base of the monitoring bore screen. For monitoring bores which do not screen the base of the upper aquifer, this simply means that the groundwater level has fallen below the base of the well. In mine area B, where the Bauxitic Gravels are shallower, and the upper aquifer monitoring bores fully screen the base of the aquifer, a dry reading could be interpreted as the aquifer being unsaturated (i.e. still contain moisture, but not to saturation point).
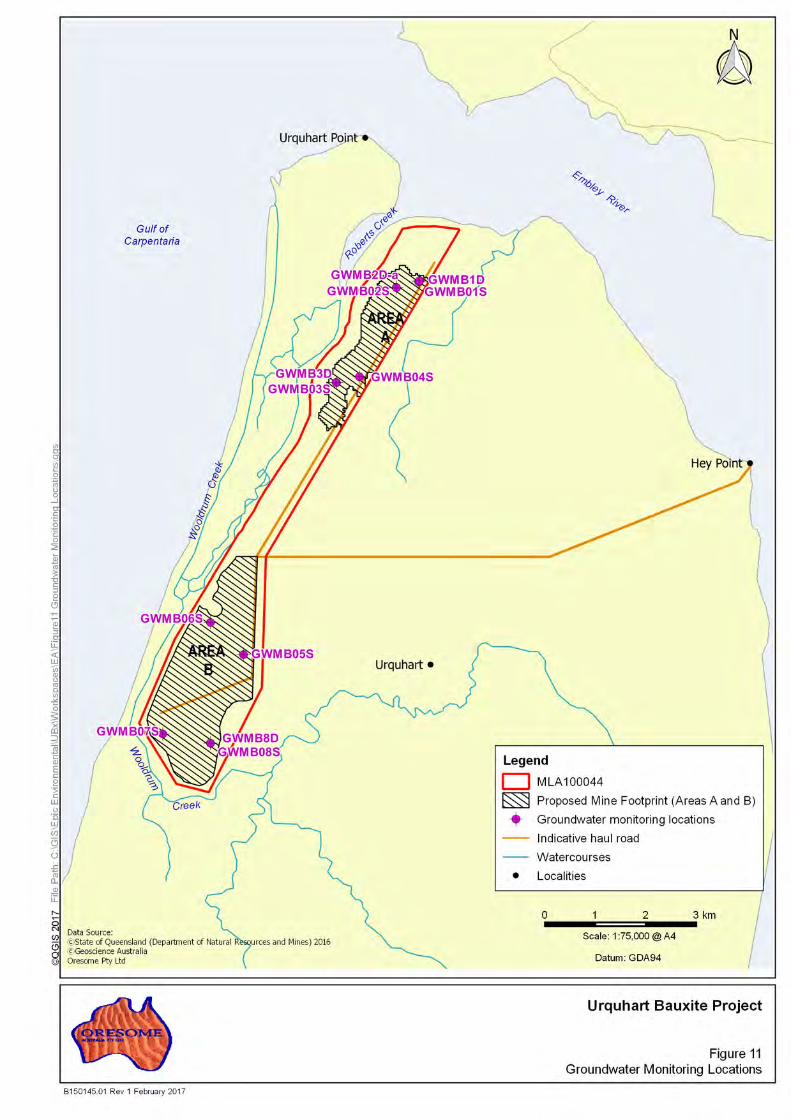
100
6.3.1.2 Recharge Estimation
Recharge to the groundwater system is rapid for the upper unconfined aquifer following significant rainfall events that occur mainly during the wet season. Recharge appears to be very rapid after incident rainfall, particularly for rainfall events in excess of 50 mm/day. Based on recorded groundwater levels in December 2015 and February 2016, it would appear that groundwater levels in the upper aquifer (dune sand, sand and bauxite) subsequently decline towards the end of the dry season, with some areas (particularly in mine area B where the base of the aquifer is relatively high) becoming unsaturated.
The water-table fluctuation (WTF) method provides an estimate of groundwater recharge by analysis of water-level fluctuations in observation wells. The method has been used by hydrogeologists for many years and is based on the assumption that a rise in water-table elevation measured in shallow wells is caused by the addition of recharge across the water table.
Recharge in mm/day and as a percentage of rainfall for the three significant groundwater level rises (Drawing 17 – Appendix B) were calculated as follows:
• 23/12/15 - 31/1/15, GWMB1S, Recharge = 4 mm/day = 2 % of rainfall for the period • 31/1/16 - 3/2/16, GWMB1S, Recharge = 13 mm/day = 18 % of rainfall for the period • 15/3/16 - 17/3/16, GWMB1S, Recharge = 33 mm/day = 18 % of rainfall for the period
Based on this analysis and with comparison with Drawing 17, it can be inferred that the groundwater system receives the bulk of its recharge, during the high intensity rainfall events during the wet season. All calculations were based on an assumed aquifer specific yield of 10 %.
To provide a cross check against the WTF estimate, a chloride mass balance recharge estimate for Urquhart Point has been completed. The Chloride Mass Balance method is documented by Wood and Sanford (1999). The equation for the Chloride Mass Balance takes the form:
R = P X Cleff / ClGW
Where:
R = Recharge (mm/yr); P = Mean annual precipitation in mm (mm); Cleff = Effective chloride concentration of infiltration water (mg/L); and ClGW = Chloride concentration of groundwater (mg/L).
If it is assumed that the effective chloride concentration is that of the chloride concentration of rainfall, and that the chloride concentration of rainfall is relatively unchanged since the time that recharge occurred, then the above method may be used for the estimation of recharge. Table 23 presents a statistical summary of the shallow groundwater bores at Urquhart Point.

101
Table 23 Chloride in Groundwater
Site Average Chloride from Recorded Samples (mg/L)
GWMB1s 44.8
GWMB2d 5.8
GWMB3s 4.4
GWMB4s 19.2
Average 18.5
Geometric Mean 10.1
Crosbie et al. (2012) presents results for the chloride concentration in rainfall at 21 sites across Australia. The assessment used the Crosbie et al. (2012) results from both the weighted averages reported, and the average of all raw results for various stations, to complete the chloride mass balance for Urquhart Point.
Based on the findings of the chloride mass balance analysis, it is considered that rate of recharge is likely to be between 20 to 30% of rainfall. This aligns reasonably well, with the WTF recharge estimate (of approximately 20% of rainfall), however is considered to be the more accurate of the two methods, as chloride is a conservative ion, and the method does not rely on estimates of hydraulic parameters such as specific yield (as opposed to the WTF method), which tend to have a reasonable impact on the calculated recharge.
6.3.1.3 Groundwater Discharge It can be observed that the groundwater system discharges to the coast and adjacent low lying topography when groundwater levels are predominantly higher than mean sea level (0 m AHD). The Mean Sea level line has been included to Drawing 17, which shows that groundwater discharge to surface waters and low lying topographic features will generally occur between the months of February to June (inclusive). Outside of this period, the main mechanisms for groundwater discharge will be evapotranspiration from vegetation, and minor evaporation from shallow groundwater in the low lying areas.
Model predictions indicate that reduced low salinity groundwater fluxes to adjacent surface water features are not significantly reduced, as by the end of the dry season, the natural hydraulic gradient fully reverses. This is due largely to the nature of the vegetation at the site, which has the ability to lower the groundwater levels well beneath the mean sea level during extended dry periods. If this were not the case, groundwater levels would only fall as low as mean sea level during these periods (considering the considerable network of surface water features in the area that maintain a head near or slightly above mean sea level).
Groundwater modelling results show that bauxite mining will have very limited impact on groundwater resources, as mining will only occur during the dry season, at which time a large proportion of the unconfined aquifer will be unsaturated. Mining operations will not intersect the deeper confined aquifer.
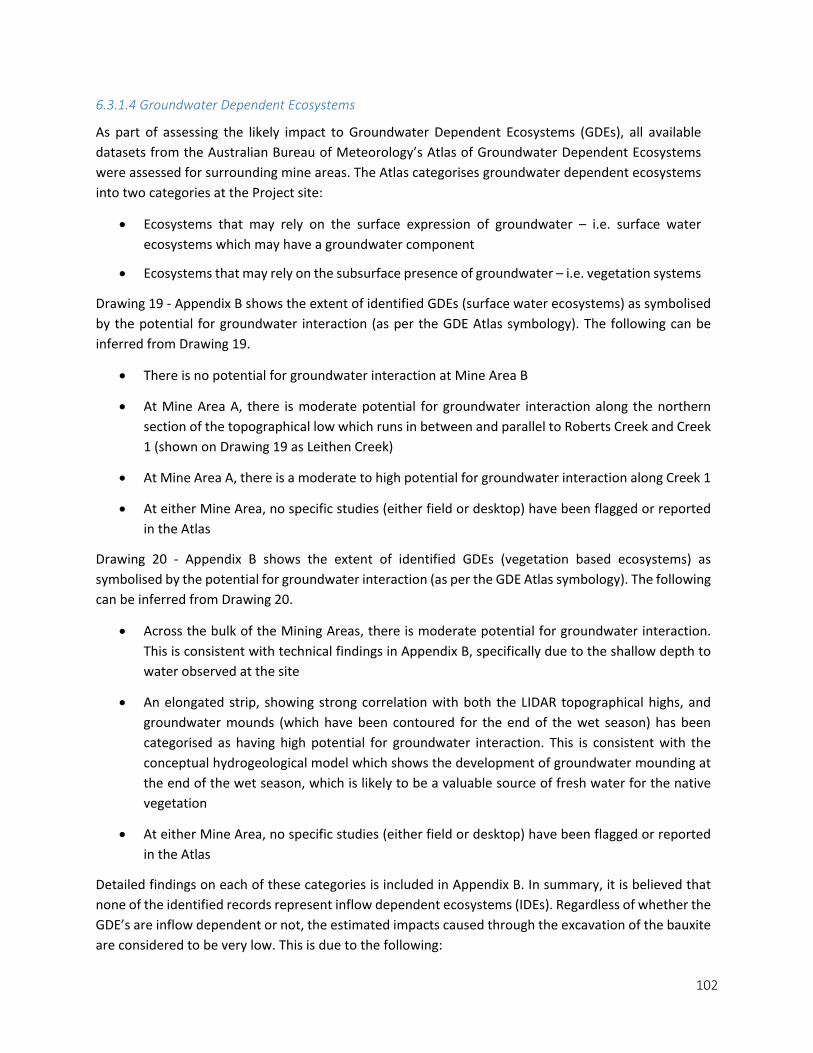
102
6.3.1.4 Groundwater Dependent Ecosystems
As part of assessing the likely impact to Groundwater Dependent Ecosystems (GDEs), all available datasets from the Australian Bureau of Meteorology’s Atlas of Groundwater Dependent Ecosystems were assessed for surrounding mine areas. The Atlas categorises groundwater dependent ecosystems into two categories at the Project site:
• Ecosystems that may rely on the surface expression of groundwater – i.e. surface water ecosystems which may have a groundwater component
• Ecosystems that may rely on the subsurface presence of groundwater – i.e. vegetation systems
Drawing 19 - Appendix B shows the extent of identified GDEs (surface water ecosystems) as symbolised by the potential for groundwater interaction (as per the GDE Atlas symbology). The following can be inferred from Drawing 19.
• There is no potential for groundwater interaction at Mine Area B
• At Mine Area A, there is moderate potential for groundwater interaction along the northern section of the topographical low which runs in between and parallel to Roberts Creek and Creek 1 (shown on Drawing 19 as Leithen Creek)
• At Mine Area A, there is a moderate to high potential for groundwater interaction along Creek 1
• At either Mine Area, no specific studies (either field or desktop) have been flagged or reported in the Atlas
Drawing 20 - Appendix B shows the extent of identified GDEs (vegetation based ecosystems) as symbolised by the potential for groundwater interaction (as per the GDE Atlas symbology). The following can be inferred from Drawing 20.
• Across the bulk of the Mining Areas, there is moderate potential for groundwater interaction. This is consistent with technical findings in Appendix B, specifically due to the shallow depth to water observed at the site
• An elongated strip, showing strong correlation with both the LIDAR topographical highs, and groundwater mounds (which have been contoured for the end of the wet season) has been categorised as having high potential for groundwater interaction. This is consistent with the conceptual hydrogeological model which shows the development of groundwater mounding at the end of the wet season, which is likely to be a valuable source of fresh water for the native vegetation
• At either Mine Area, no specific studies (either field or desktop) have been flagged or reported in the Atlas
Detailed findings on each of these categories is included in Appendix B. In summary, it is believed that none of the identified records represent inflow dependent ecosystems (IDEs). Regardless of whether the GDE’s are inflow dependent or not, the estimated impacts caused through the excavation of the bauxite are considered to be very low. This is due to the following:

103
• The groundwater system at the site follows an annual cycle of groundwater mounding and depletion. On an annual basis by the end of the dry season, groundwater levels have lowered to near the base of the bauxite, and in some areas, the bauxite becomes unsaturated. The following wet season recharges the aquifer to previous levels. Any mining at the site will be conducted during the dry season (due to logistical constraints) when groundwater levels naturally decline to their lowest levels. Spoil from the mine will be stockpiled, and replaced after the bauxite has been mined. Replaced spoil material will not be contaminated, and once replaced will have an aquifer specific yield equal to or greater than before previously mined
• Once mined, the unconfined aquifer will continue to function naturally. That is, there is no continued “sink” or “drain” which continuously acts to lower groundwater levels
• After mining, both mine areas A and B will fully recover, and groundwater mounding will continue to occur during the wet season. Modelling results suggest that within the first year after mine rehabilitation, simulated groundwater levels have recovered to within 1 metre of where they would have been expected, should mining not have occurred at all
• The quality of recharge water is expected to be unaffected by mining
• Temporal wetting and ‘drying’ of the aquifer system has not been shown to have an appreciable impact on the GDEs at the site. Aerial imagery shows that the region is well populated with native vegetation, which thrives on the excessive wet season rains
• As per CDM Smith (2016), ecosystems associated with variable and perennial inundation, aquatic and terrestrial ecology values are likely to be tolerant of significant changes in abiotic condition and habitat availability and species colonising these areas can generally tolerate a range of conditions
6.3.2 Groundwater Assessment and Numerical Modelling 6.3.2.1 Site Water Balance The objective of completing the site water balance was to gain a better understanding of the volumes and rates of groundwater movement in the groundwater system, and to better constrain the subsequent numerical groundwater model, by means of model calibration.
The Water Balance is based on the concept of Conservation of Mass (per unit time). That is:
• Inflow (I) – Outflow (O) = Change in Storage (ΔS)
The surface area used for the calculation of fluxes was defined to be similar to that, which would subsequently become the active area of the numerical flow model. Due to the dynamic nature of the hydrogeological regime at the Project, it was decided to split the site water balance temporally into two water balances, one estimate for the wet season and one estimate for the subsequent dry season. Refer Table 24 for the wet season water balance and Table 25 for the dry season water balance.

104
Table 24 Wet Season Water Balance
Wet Season (November to March Inclusive)
Component Inflows (L/s) over Study Area
Outflows (L/s) over Study Area
Δ Storage (L/s)
Recharge 363.1
Upward Vertical Leakage from Lower Aquifer (subcomponent)
0.3
Evapotranspiration 194.8
Discharge to Surface Water(s) from Upper Aquifer
23.6
Discharge to Surface Water(s) from Lower Aquifer
2
Groundwater Mounding 147
Sub Total 363.4 220.4 147
Inflow Minus Outflow 143
Percentage Error Calculated (Sum of Flows) 0.69 %
Table 25 Dry Season Water Balance
Dry Season (April to October Inclusive)
Component Inflows (L/s) over Study Area
Outflows (L/s) over Study Area
Δ Storage (L/s)
Recharge 35.5
Upward Vertical Leakage from Lower Aquifer (subcomponent)
0.2
Evapotranspiration 155
Recharge from Surface Water(s) to Upper Aquifer
15.7
Recharge from Surface Water(s) to Lower Aquifer
1.3
Groundwater Mound Depletion (Negative)
-104.2
Sub Total 52.7 155 -104.2
Inflow Minus Outflow -102.3
Percentage Error Calculated (Sum of Flows) 0.91 %

105
The following can be inferred from Table 24 and Table 25:
• Recharge from incident rainfall is the dominant inflow process during the wet season, while in the dry season, inflows are proportionate between recharge to groundwater from adjacent surface water features and that occurring from incident rainfall
• Regardless of season, outflows are dominated by the effect of Evapotranspiration, owing to the relatively thick stands of forestation at the Project site
• The rates of groundwater leakage through the kaolinitic clays are very small in comparison with the other identified groundwater fluxes
• The error term suggests that the calculated fluxes are reasonable
6.3.2.2 Numerical Model It was agreed during the meeting on 1 December 2016 with DEHP (Cairns) that:
• The primary objective of the Impact Assessment Model should be to quantify the extent of dewatering caused by bauxite mining of the upper aquifer at Urquhart Point, and identify any potential areas of concern due to the lateral propagation of drawdown beyond the mining operations
• A second but equally important outcome was to quantify the likely change in groundwater discharge to surface water features due to induced groundwater drawdown
• According to the Australian Groundwater Modelling Guidelines, the Target Confidence Level Classification should be Class 1 to Class 2
The Impact Assessment Model has been developed using the USGS modelling package MODFLOW (McDonald and Harbaugh 1988). MODFLOW is a modular three-dimensional finite difference groundwater model for the description and behaviour of groundwater systems. A finite difference approach allows partial differential equations for groundwater flow to be solved iteratively through a matrix equation, which solves for head and flow simultaneously. MODLFOW is accepted as the industry standard and is legally defensible. The model was based on the CHM as described in the August 2016 Groundwater Assessment Report and as illustrated conceptually in Drawing 21.
Development of a groundwater flow model generally requires a reasonable approximation of the aquifer geometry, its hydraulic parameters, and the stresses (such as recharge) acting upon it. Once the geometry of the aquifer is defined and location of various existing and future stress points are determined, the aquifer is discretised into cells or elements and hydraulic properties are assigned to each cell. Prior to any predictive simulations, the model predictions are usually required to be confirmed as reasonable, by calibrating the model to observed groundwater levels and flow patterns. This calibration usually requires a number of model runs during which modifications are made of the unknown or uncertain aquifer parameters until a reasonable match between observed and simulated groundwater levels is achieved.
Given the dynamic nature of the groundwater system at Urquhart Point (i.e. big wet season followed by a long dry season with associated cyclic groundwater fluctuations), a steady state calibration to average groundwater levels is not applicable. Under these conditions, a transient calibration is required, where by modifications are made of the aquifer parameters (including aquifer storage) until a reasonable match between temporal groundwater levels and simulated groundwater levels is achieved.
106
The model was developed using a combination of tools including ArcGIS, Modflow pre-processor graphical interface programs and in-house software.
Key features relating to the numerical model structure:
• The model consists of a north south (not rotated) model domain, spanning 5 km in an east west direction, and 5.5 km in a north south direction
• Minimum Easting is 587100 (GDA94, Z54) • Minimum Northing is 8592000 (GDA94, Z54). The southern extent of the model domain was
selected based on an analytical estimate of the likely radius of influence of the mine, considering broad aquifer parameters, and mining duration
• The model consists of 10 m x 10 m cells across the Mining Area (and well beyond), which coarsen outwards to the extents of the model mesh (which have 100 m x 100 m cells)
• The model consists of three layers, representing the upper aquifer, the aquitard and the lower confined aquifer, as identified in the CHM
• The surface elevation of the top of layer 1 was derived from a combination of LIDAR data, and SRTM data (freely available online)
• The base of the upper aquifer was derived from a geological block model • The base of the aquitard was inferred, based on the lithological data obtained from drill hole logs • The base of the lower aquifer was uniformly set, based on regional geological information relating
to the thickness of this unit. Nominally this has been set at -60 mAHD
Key features relating to the numerical model properties and boundary conditions:
• Aquifer and aquitard properties were varied during model calibration, in line with published estimates relating to the various lithologies, and information learned from other regional studies
• The coast and significant surface water features were modelled as general head boundaries, which include a model conductance term. This allows these features to form a part of the model calibration process, as well as allowing for the impact of these features to be reduced if required
• Some inactive zones were implemented, specifically on the opposite side of significant surface water features which form a constant head of water (i.e. west of Roberts and Triluck Creek)
• Recharge was implemented through the historic calibration period with daily rainfall data, and with monthly climate average data through the predictive period (factored by likely recharge estimates)
• Evapotranspiration was implemented based on Bureau of Meteorology monthly areal actual evapotranspiration data, with an extinction depth varying between 5 to 8 metres below land surface
6.3.2.3 Numerical Model Calibration A transient model calibration was performed with the observation data sourced from the Project through the period December 2015 to July 2016. A total of 663 head observations were imported into the groundwater model for calibration purposes.

107
The calibration was performed manually, and a model journal of the calibration was kept, in line with recommendations made in the Murray Darling Basin Groundwater Modelling Guidelines (MDBC, 2001). The MDBC modelling guidelines preceded the Australian Groundwater Guidelines (Barnett et al., 2012)
At the end of model simulations, groundwater fluxes were exported for comparison against the site water balance, and transient hydrographs were plotted for comparison of modelled verses observed heads. The principal of parsimony was adopted, in that parameter zonation was kept as simple as possible (the opposite of highly parameterised and automatically calibrated models which tend to focus on an objective function) while trying to achieve a model calibration.
Due to the thin nature of the upper aquifer, and more specifically, the thin saturated thickness at the end of the dry season, some issues were encountered early in the calibration through model convergence. These were rectified by using the MODFLOW 2000 rewetting package.
Oresome considers that the model is fit for the purpose of making model predictions, based on the following:
• The modelled hydrographs generally match the observed hydrographs reasonably well for both trend and absolute levels
• The groundwater fluxes reported from the model are commensurate with the site water balance • Parts of the upper aquifer dry out through the long dry season, as has been observed at the site
(for example Bore 2S)
The statistical summary completed based on the model calibration supports the above observations, namely:
• The model has a Scaled Root Mean Square (SRMS) error of less than 9 % (less than 10 % is generally considered acceptable). The SRMS estimate has been based on weightings for all data of the value 1. If logger data which accounts for the bulk of the calibration dataset was given a lower weighting (due to accuracy), the SRMS would decrease to less than 5%
• The model has a Root Mean Square (RMS) error of 0.2 m (i.e. generally how close the modelled levels are to observed levels)
• The model has a Correlation Coefficient of 0.9 (perfect calibrations tend to 1)
Drawing 25 presents a detailed statistical summary of the transient model calibration. Drawing 26 shows the modelled groundwater levels for Groundwater Monitoring Bore 1S, compared with the observed monitoring levels for this bore (known as a calibration hydrograph or history match). The modelled groundwater response matches the observation data for this bore very well through the bulk of the monitoring period. There is a small deficit in the late time trend for this bore, but interestingly, the modelled response seems to match the manual groundwater dip data better in the late time, than the corresponding logger data response (which is adjusted to suit the early time data). The simulated response shows that the model is behaving as expected, and replicates the observation data sufficiently.
Drawing 27 shows the calibration hydrographs for all other remaining groundwater bores at site. It is apparent from this drawing that not all bores have transducer logger data available, and where absent, the manual dips have been used for calibrating groundwater levels. As per the detailed statistical analysis (Drawing 25), it can be inferred from this Drawing, that the modelled response generally

108
matches the groundwater observations to less than 0.5 metre, and on average to around 0.2 metres. The trends of the simulated responses are generally acceptable, with early time increases in groundwater level in response to the wetter months between December and April, followed by a slow recession as excess groundwater is lost through evapotranspiration, and the system tends towards a new dynamic equilibrium with the surrounding surface water features (creeks).
In addition to the comparison with modelled groundwater levels, the MODFLOW Zone Budget package was used to compare calculated groundwater flow rates (flux) with the analytical site water balance.
If it is understood that the water balance flow rates are best used as a guide, and not an absolute target to try and achieve a match with, then it is easily observed that the numerical model is behaving according to the current conceptualisation. There will always be differences between a manually predicted water balance (which is based on a variety of analytical calculations and assumes variable like constant hydraulic gradient or some fixed hydraulic conductivity term) and the outputs from a numerical model. After all, the numerical model is a lot more complex. For example, the rate at which evapotranspiration discharges from the groundwater system, is dependent upon the depth to groundwater level at any given time.
The modelled flow rates calculated for the dry season have been based over a portion of the dry season, during the history match (calibration) period. Another variable to consider is the spatial area to which these rates have been calculated. While Oresome has done its best to ensure consistency in surface area for this comparison, there will be some minor difference due to the implementation of active area in the model domain, and that adopted for use in the analytical estimate.
The comparison of fluxes therefore, while not meaningless, tells us that the model is behaving as expected generally, and the flow rates are commensurate with our current understanding and conceptualisation.
6.3.2.4 Numerical Model Predictions The 4 year mine plan was mapped to the model cells, through the use of the MODFLOW drain package. The drain package is commonly used for modelling open cut mines, voids, or other trenches in which groundwater reports (flows towards). Drain cells remained active in the respective mine stages through the mine period, while in the rehabilitation period, the drain cells were inactivated (groundwater is allowed to recover).
In reality, the spoil used for backfilling the mine workings will likely have at least the same specific yield and permeability (or higher) than when it was in situ. During the early stages of rehabilitation when vegetation is not fully established, the evapotranspiration rate from the mined areas is also likely to be much less than when it was mined. Therefore, post mining, groundwater levels are likely to recover quicker in the mined areas, than in areas at proximity to the mine. This makes the assessment conservative, in that the impacts predicted should tend towards a worse case.
6.3.2.5 Numerical Model Results Due to the nature of the thinly saturated aquifer (specifically near the end of the dry season), some difficulties were experienced with model convergence through the predictive simulations. These were overcome by modification of the MODFLOW Rewetting Package, which allows dry cells to become wet again, should the prevailing, and neighbouring conditions necessitate it. It is noted that while these

109
difficulties were able to be overcome in Mine Area A, it is considered that any subsequent impact assessment conducted for future mining in Mine Area B, be assessed with an analytical approach (using the key learnings and outcomes from Mine Area A as a basis). Groundwater observations in Mine Area B suggest a much larger proportion of the upper aquifer in Mine Area B is dry, specifically through the dry season when mining would be practical.
Due to the highly seasonal climate at Urquhart Point, and associated cyclic groundwater hydrograph, it is not applicable to calculate groundwater drawdown due to mining, by assessing the change between the start of each mining season, and the end of each mining season. This is because, through the dry period, groundwater hydrographs are receding at a significant rate. If drawdown were calculated across this period without the mining induced stress, the result would be a reasonable drawdown across the entire site, which is highly influenced by the prior season’s groundwater mound. For a more accurate reflection of the mining induced drawdown, calculated drawdown has been undertaken from the modelled head without mining (assuming the same future climate scenario) and subtracting the groundwater head distribution at the same period (with active mining) for the end of each mining period. Drawdown has been calculated at the end of November, hence represents the worst-case scenario, prior to any recovery during rehabilitation operations.
A description of the model results is provided below:
Stage 1 – November 2017
• Modelled drawdown greater than 1 metre is likely to extend to approximately 280 metres (but generally be contained to 150 metres) from the Stage 1 operations which are completed by November 2017
• Maximum drawdown within the Stage 1 footprint is likely to be of the order of 3.5 metres, compared to non-mining groundwater levels at the same time
• Groundwater drawdown in excess of seasonal fluctuation is expected at Bore 2S and 2Da, but is likely to be less than 1 metre in magnitude
• Groundwater drawdown in excess of seasonal fluctuation is expected at Bore 2S and 2Da, but is likely to be less than 0.5 metre in magnitude
• Groundwater drawdown in excess of seasonal fluctuation is not expected at Bores 3S, 3D, or 4S • Groundwater drawdown (in excess of the seasonal fluctuation) of generally less than 2.5 metres
may occur within the BOM (2015) identified GDE’s footprint which has been indicated as ‘Moderate Potential’ for groundwater interaction. This is not considered to be significant impact given the existing observed seasonal fluctuation, and groundwater recovery rate (discussed below in more detail)
• The rate of groundwater interception through Stage 1 will likely reduce over time, to the order of 8 L/s prior to rehabilitation occurring
• The reduction in groundwater flow towards adjacent surface water features during the Stage 1 operation is likely to be negligible
110
Stage 2 – November 2018
• Modelled drawdown greater than 1 metre is likely to extend to approximately 220 metres (but generally be contained to 130 metres) from the Stage 2 operations which are completed by November 2018
• Maximum drawdown within the Stage 2 footprint is likely to be of the order of 3.5 metres, compared to non-mining groundwater levels at the same time
• Groundwater monitoring bore 4S will be destroyed during Stage 2. The response to mining is clearly visible on Drawing 43 which shows groundwater levels reduced to the base of the upper aquifer in this location
• Groundwater drawdown in excess of seasonal fluctuation is expected at Bore 3S and 3D, with the groundwater level at Bore 3S falling to the base of the aquifer in response to mining
• Bore 3D indicates that the confined aquifer remains confined (groundwater levels are above the top of the aquifer), hence groundwater availability to vegetation is not expected to be effected
• Groundwater drawdown in excess of seasonal fluctuation is not expected at Bores 1S, 1D, 2S or 2Da
• Groundwater drawdown (in excess of the seasonal fluctuation) of generally less than 1.5 metres may occur within the BOM (2015) identified GDE’s footprint which has been indicated as ‘Moderate Potential’ for groundwater interaction. This is not considered to be significant impact given the existing observed seasonal fluctuation
• The rate of groundwater interception through Stage 2 will likely reduce over time, to the order of 5 L/s prior to rehabilitation occurring
• The reduction in groundwater flow towards adjacent surface water features during the Stage 2 operation is likely to be negligible
Stage 3 – November 2019
• Modelled drawdown greater than 1 metre is likely to extend to approximately 400 metres (but generally be contained to 250 metres) from the Stage 3 operations which are completed by November 2019
• Maximum drawdown within the Stage 3 footprint is likely to be of the order of 4 metres, compared to non-mining groundwater levels at the same time
• Groundwater monitoring bores 2S, 2Da, 3S, and 3D, will be destroyed during Stage 3. The response to mining is clearly visible on Drawings 39 to 42, which shows groundwater levels reduced to the base of the upper aquifer (for shallow bores), and reductions in groundwater levels for the associated deeper bores
• Bores 2Da and 3D indicate that the confined aquifer remains confined (groundwater levels are above the top of the aquifer), hence groundwater availability to vegetation is not expected to be effected
• Groundwater monitoring bore 4S (if this bore was maintained through operations) would exhibit a significant response from the adjacent operation, with groundwater levels reduced to the base of the upper aquifer in this location
111
• Groundwater drawdown in excess of seasonal fluctuation is expected at Bore 1S and 1D, but is likely to be less than 1 metre in magnitude
• Groundwater drawdown (in excess of the seasonal fluctuation) of generally less than 1 metre may occur within the BOM (2015) identified GDE’s footprint which has been indicated as ‘Moderate Potential’ for groundwater interaction. This is not considered to be significant impact given the existing observed seasonal fluctuation
• The rate of groundwater interception through Stage 3 will likely reduce over time to the order of 7 L/s prior to rehabilitation occurring
• The reduction in groundwater flow towards adjacent surface water features during the Stage 3 operation is likely to be negligible
In addition to the complete array of modelled hydrographs and simulated groundwater drawdown plots, a three-dimensional scale representation of the mining scenario, for the Stage 3 Operations has been constructed.
Drawing 44 shows the location and extent of the model subset which has been ‘cookie cut’ through the existing numerical groundwater model. Drawings 45 and 46 show the model subset projected three dimensionally, with the mine plan and replaced spoil from previous mining stages shown on Drawing 46. Groundwater levels shown are the modelled groundwater levels for the end of November 2019, with and without mining stresses.
The following can be inferred from Drawings 45 and 46:
• The saturated thickness of the upper unconfined aquifer reaches a maximum near the centre of the subset, where topography is at its highest, and the distance from significant surface water features is at its greatest
• Towards the lower topography, where depth to water is shallow, the effects of evapotranspiration pull the groundwater level down to near the base of the aquifer
• Groundwater monitoring bore 2S is essentially ‘dry’ (or just about to go dry), as the groundwater level has fallen below the base of the monitoring bore screen. This is consistent with the measured groundwater levels
• During mining groundwater levels are reduced to the mine pit floor, but have recovered in rehabilitated mining areas; and
• The confined aquifer (accordingly) remains saturated throughout the mining process, which therefore does not represent any significant impact to the environment in terms of water availability
Stage 4 – November 2020 The following can be inferred from the model results:
• Modelled drawdown greater than 1 metre is likely to extend to approximately 400 metres (but generally be contained to 360 metres) from the Stage 4 operations which are completed by November 2020
• Maximum drawdown within the Stage 4 footprint is likely to be of the order of 3.5 metres, compared to non-mining groundwater levels at the same time
112
• Groundwater monitoring bore 1S will be destroyed during Stage 4. The response to mining is clearly visible on Drawing 43 which shows groundwater levels reduced to the base of the upper aquifer in this location
• Bore 1D indicates that the confined aquifer remains confined (groundwater levels are above the top of the aquifer), hence groundwater availability to vegetation is not expected to be effected
• Groundwater drawdown in excess of seasonal fluctuation is expected at Bores 2S and 2Da (if they were able to be maintained), but is likely to be less than 2.7 and 2.1 metres in magnitude respectively
• Groundwater drawdown (in excess of the seasonal fluctuation) of generally less than 1.5 metres may occur within the BOM (2015) identified GDE’s footprint which has been indicated as ‘Moderate Potential’ for groundwater interaction. This is not considered to be significant impact given the observed seasonal fluctuation
• The rate of groundwater interception through Stage 4 will likely reduce over time, to the order of 8 L/s prior to rehabilitation occurring
• The reduction in groundwater flow towards adjacent surface water features during the Stage 4 operation is likely to be negligible
Recovery from Mine Operations
Based on observations from the simulated hydrographs, it can be inferred that, by somewhere between 2023 and 2024, the groundwater system will have fully recovered to pre-mine groundwater oscillation levels. Generally, within the first year since mine rehabilitation, simulated groundwater levels have recovered to within 1 metre of the modelled pre-mining level, should mining not have occurred at all. Oresome notes that the model assumes average climate conditions, based on a long-term climate record. Deviations from average conditions will occur, which will likely effect groundwater levels to a degree commensurate with the simulated mine induced drawdown. A similar effect can be observed through the history match period December 2015 to July 2016. January 2016 to March 2016 received measured amounts of rainfall of 115, 264, and 377 mm respectively. Long term average conditions for those months are typically 482, 536, and 420 mm of rainfall. This effect can be observed in the seasonal fluctuation of all hydrographs, whereby the local maxima of hydrographs generally increase between 2016 and 2018.
6.3.3 Potential Impacts Mining operation will only be conducted during the months April to December, during the dry season. Surface materials above the pisolitic bauxite layer will be progressively stripped and stockpiled for replacement during post mining rehabilitation which will occur progressively during each mining season.
The bauxite layer will be mined by free digging and hauled and stockpiled for export.
The shallow aquifer recharges during the wet season when mining is impractical due to heavy rainfall. Seepage from the upper aquifer to isolated ephemeral wetlands towards the end of the wet season will also remain unaffected.
There are regional estuarine wetlands south of Area B (Triluck Creek and Winda Winda Creek) and west of Area A (Roberts Creek). Modelling has shown that mining will not impact on these creeks; therefore, mining would not affect the estuarine wetlands. Any short-term reduction to groundwater discharge is
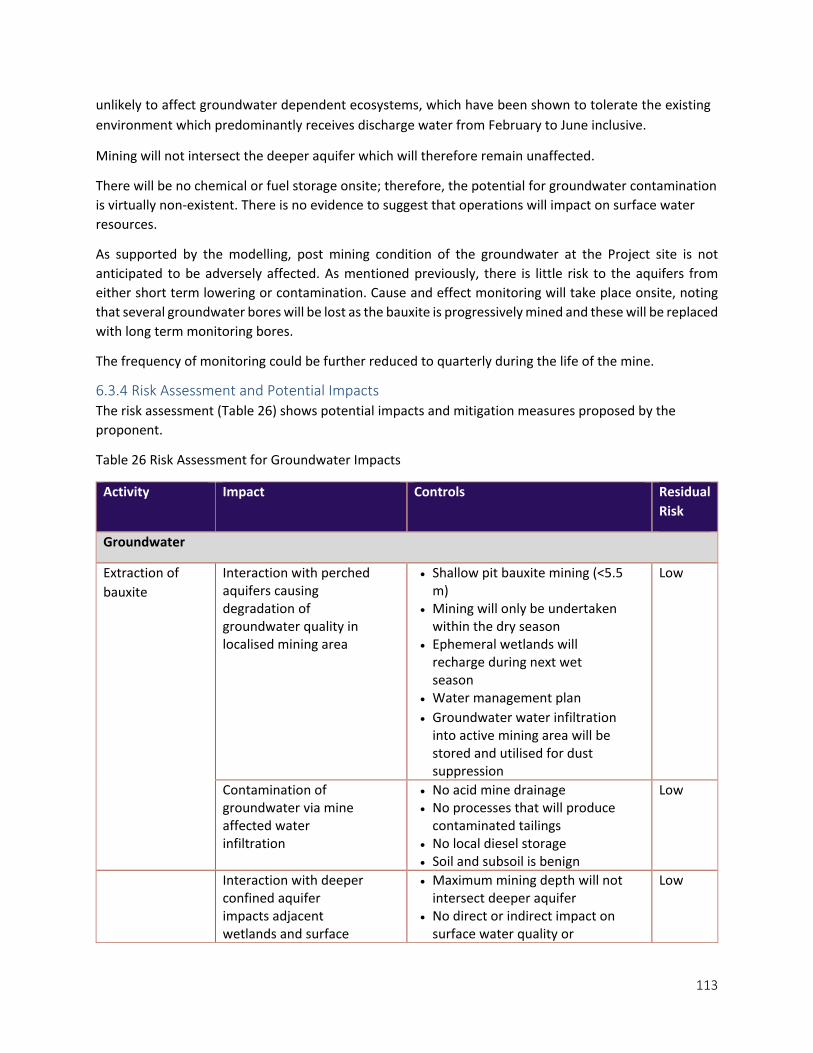
113
unlikely to affect groundwater dependent ecosystems, which have been shown to tolerate the existing environment which predominantly receives discharge water from February to June inclusive.
Mining will not intersect the deeper aquifer which will therefore remain unaffected.
There will be no chemical or fuel storage onsite; therefore, the potential for groundwater contamination is virtually non-existent. There is no evidence to suggest that operations will impact on surface water resources.
As supported by the modelling, post mining condition of the groundwater at the Project site is not anticipated to be adversely affected. As mentioned previously, there is little risk to the aquifers from either short term lowering or contamination. Cause and effect monitoring will take place onsite, noting that several groundwater bores will be lost as the bauxite is progressively mined and these will be replaced with long term monitoring bores.
The frequency of monitoring could be further reduced to quarterly during the life of the mine.
6.3.4 Risk Assessment and Potential Impacts The risk assessment (Table 26) shows potential impacts and mitigation measures proposed by the proponent.
Table 26 Risk Assessment for Groundwater Impacts
Activity Impact Controls Residual Risk
Groundwater
Extraction of bauxite
Interaction with perched aquifers causing degradation of groundwater quality in localised mining area
• Shallow pit bauxite mining (<5.5 m)
• Mining will only be undertaken within the dry season
• Ephemeral wetlands will recharge during next wet season
• Water management plan • Groundwater water infiltration
into active mining area will be stored and utilised for dust suppression
Low
Contamination of groundwater via mine affected water infiltration
• No acid mine drainage • No processes that will produce
contaminated tailings • No local diesel storage • Soil and subsoil is benign
Low
Interaction with deeper confined aquifer impacts adjacent wetlands and surface
• Maximum mining depth will not intersect deeper aquifer
• No direct or indirect impact on surface water quality or
Low
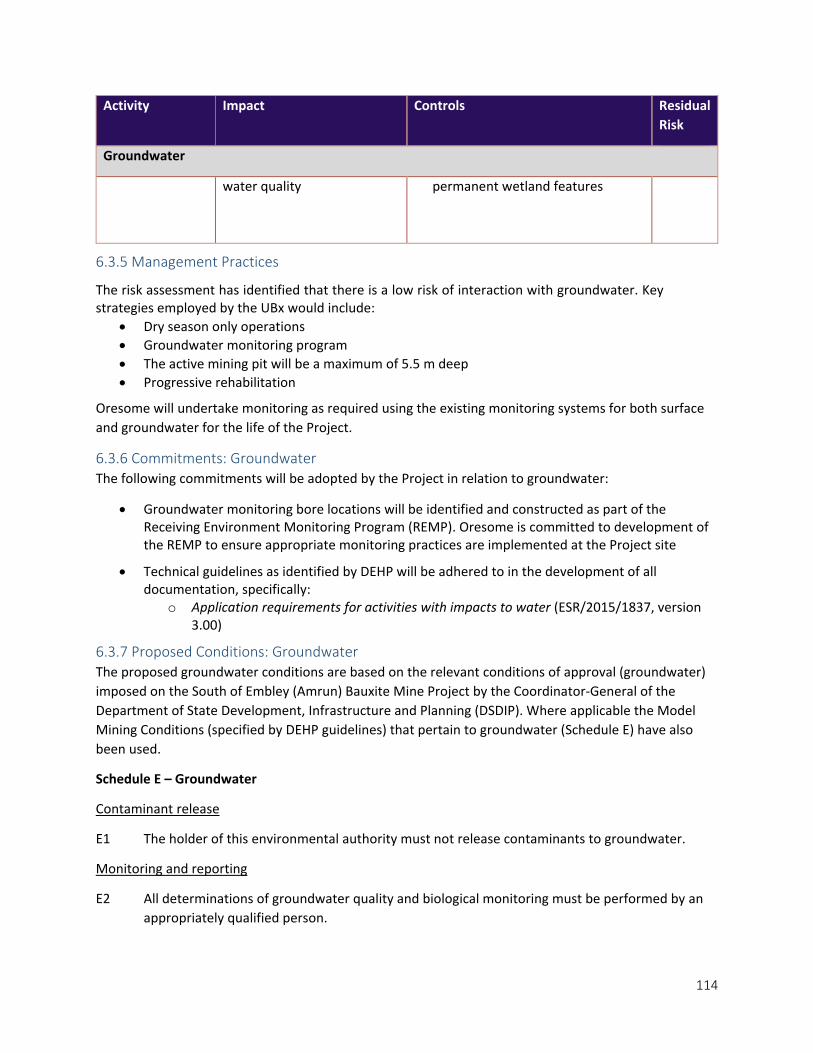
114
Activity Impact Controls Residual Risk
Groundwater
water quality permanent wetland features
6.3.5 Management Practices
The risk assessment has identified that there is a low risk of interaction with groundwater. Key strategies employed by the UBx would include:
• Dry season only operations • Groundwater monitoring program • The active mining pit will be a maximum of 5.5 m deep • Progressive rehabilitation
Oresome will undertake monitoring as required using the existing monitoring systems for both surface and groundwater for the life of the Project.
6.3.6 Commitments: Groundwater The following commitments will be adopted by the Project in relation to groundwater:
• Groundwater monitoring bore locations will be identified and constructed as part of the Receiving Environment Monitoring Program (REMP). Oresome is committed to development of the REMP to ensure appropriate monitoring practices are implemented at the Project site
• Technical guidelines as identified by DEHP will be adhered to in the development of all documentation, specifically:
o Application requirements for activities with impacts to water (ESR/2015/1837, version 3.00)
6.3.7 Proposed Conditions: Groundwater The proposed groundwater conditions are based on the relevant conditions of approval (groundwater) imposed on the South of Embley (Amrun) Bauxite Mine Project by the Coordinator-General of the Department of State Development, Infrastructure and Planning (DSDIP). Where applicable the Model Mining Conditions (specified by DEHP guidelines) that pertain to groundwater (Schedule E) have also been used.
Schedule E – Groundwater
Contaminant release
E1 The holder of this environmental authority must not release contaminants to groundwater.
Monitoring and reporting
E2 All determinations of groundwater quality and biological monitoring must be performed by an appropriately qualified person.

115
E3 Groundwater quality and levels must be monitored at the locations and frequencies defined in Table E3 – Groundwater monitoring locations and frequency (Groundwater Bore Monitoring Locations) for quality characteristics identified in Table E4 – Groundwater quality triggers and limits.
Table E3 – Groundwater monitoring locations and frequency
Monitoring point
Location Surface RL (m)1
m, AHD Monitoring frequency
Easting (GDA94-Zone 54) m, AMG
Easting (GDA94- Zone 54) m, AMG
GWMB1D 590,235 8,596,137 9.3 Monthly during the dry season prior to commencement of operations
GWMB01S 590,223 8,596,116 9.3 GWMB2D-a 589,780 8,595,997 9.0 GWMB02S 589,778 8,596,003 9.0 GWMB3D 588,584 8,594,119 11.0 GWMB03S 588,590 8,594,117 11.0 GWMB04S 589,047 8,594,232 12.1 GWMB05S 586,748 8,588,730 8.0 GWMB06S 586,094 8,589,366 10.4 GWMB07S 585,147 8,587,156 11.7 GWMN8D 586,095 8,586,973 11.1 GWMB08S 586,093 8,586,972 11.1
1. Monitoring is not required where a bore has been removed as a direct result of the mining activity
2. RL must be measured to the nearest 5 cm from the top of the bore casing
3. Reference sites must:
a. Have a similar flow regime
b. Be from the same bio-geographic and climatic region
c. Have similar geology, soil types and topography
d. Not be so close to the test sites that any disturbance at the test site also results in a change at the reference site
Bore construction and maintenance and decommissioning
E7 The construction, maintenance and management of groundwater bores (including groundwater monitoring bores) must be undertaken in a manner that prevents or minimises impacts to the environment and ensures the integrity of the bores to obtain accurate monitoring.

![SystemRDL 2.0 Register Description Language...SystemRDL 2.0 Register Description Language ... 2 [=]; [=]; ...File Size: 1MBPage Count: 146](https://img.pdfslide.net/doc/110x75/5ed2f8c9a9caa7002f55bc70/systemrdl-20-register-description-language-systemrdl-20-register-description.jpg)