Embed Size (px)
Citation preview
AN
NU
AL
R
EP
OR
T20 20

MACY’S, INC. IS ONE OF THE NATION’S PREMIER OMNI-CHANNEL RETAILERS.
Headquartered in New York City, the company comprises three retail brands: Macy’s, Bloomingdale’s and Bluemercury. With a robust e-commerce business, rich mobile experience and a national stores footprint, our customers can shop the way they live — anytime and through any channel. For more information, visit macysinc.com.

M A C Y ’ S , I N C . 2 0 2 0 A N N U A L R E P O R T
TO OUR SHAREHOLDERS
JEFF GENNETTECHAIRMAN & CHIEF EXECUTIVE OFFICER
Following an unprecedented year that delivered a series of challenges that once seemed unimaginable, Macy’s, Inc. today is well positioned to compete and grow as a digitally led omnichannel retailer. Last year as stores were shut down, we pivoted quickly, focusing on our digital properties to absorb the additional demand online and drive digital sales. When we reopened our stores, we capitalized on our digital momentum by quickly developing new fulfillment options, including curbside pickup, and expanding our merchandise offerings within many of our “pandemic” categories. We also tested new and innovative ways to serve our customers in the new normal. While we would never want to repeat this past year, we learned a lot about our strengths and identified new opportunities.
Our Polaris strategy that we introduced in February 2020 is designed to return our company to growth. By spring of last year, it was tested profoundly and proved durable. The acceleration of digital, coupled with structural changes guided by Polaris, enabled us to adapt and innovate with agility as consumer trends shifted quickly. The cost controls that we put in place were critical to successfully weathering the pandemic. And when we needed to make difficult choices about the priority of our investments, we leveraged Polaris to provide a roadmap. We accelerated our shift to digital shopping, strengthened the relationship between online and off-line with our omnichannel experience, expanded our assortment, improved our product mix and further employed data and analytics tools and processes to simplify our customer value equation.
The actions we took last year proved that our business is resilient and able to adapt to changing customer needs and new forces in the marketplace. We delivered positive adjusted EBITDA for the full year and generated consistent, sequential top line improvement from the lows of the first quarter. We also delivered positive free cash flow in 2020, and we expect to see this grow through the continued successful execution of our Polaris strategy. As a result, we ended the year with healthy liquidity, approximately $1.7 billion in cash and approximately $3 billion of untapped capacity in our revolving asset-based facility that we closed in June. We repaid approximately $530 million of debt in January 2021 at maturity.
We saw standout performance on both ends of the value spectrum – from off-price to luxury. During the fourth quarter, Backstage locations outperformed Macy’s stores by more than three times. We plan to open approximately 35 new Backstage stores within stores in 2021. Bloomingdale’s capitalized on the shift in consumer spending from experiences to luxury products, while Bluemercury benefited from the increase in demand for beauty and skincare. Both brands experienced a strong recovery in the fourth quarter of 2020 when compared to the first quarter.
M A C Y ’ S , I N C . 2 0 2 0 A N N U A L R E P O R T
TO OUR SHAREHOLDERS
REFINED POLARIS STRATEGY
Our experience in 2020 gives us increased confidence to take bolder actions as a digitally led omnichannel retailer. The refined Polaris strategy includes a deep understanding of the Macy’s, Inc. customer and how their shopping habits have evolved during the past year. There are six pillars that underpin the Polaris strategy:
W I N W I T H FA S H I O N A N D S T Y L E b y delivering products that meet core and new customer needs across all occasions and
transforming our assortment architecture, fashion curation, inventory productivity and vendor relationships. In 2020, we rapidly expanded our assortment, adding new categories and more than 1,000 brands to meet emerging demand. Looking ahead, we will continue to improve our assortment, especially for the under-40 customer, with the right mix of categories.
D E L I V E R C L E A R V A L U E T H R O U G H S I M P L E , E A S Y- T O - U N D E R S T A N D P R I C I N G A N D P R O M O T I O N S , deepening
core and new customer engagement through hyper-personalized loyalty ecosystem, communication and personalized experiences. We made significant strides in improving our customer value proposition in 2020 and saw both sequential and year-over-year improvement in regular price sell-through in the fourth quarter of 2020. We plan to continue to simplify promotions, optimize our markdowns and improve and localize our pricing to create better value clarity for our shoppers, all while improving merchandise margins. Additionally, we continue to build on our customer value ecosystem: loyalty, monetization and personalization, enabled by our Star Rewards loyalty program.
E X C E L I N D I G I TA L S H O P P I N G by providing a modern, frictionless digital shopping journey, supported by a seamless user interface,
immersive category-level experiences and a convenient delivery and returns experience that is fully connected to stores. We have already improved our customers’ digital journey, and we will continue to make fundamental investments while delivering new, immersive, content-driven experiences for customers. We anticipate these improvements will help us realize our goal of growing digital sales to $10 billion within the next three years.
REPOSIT ION OUR STORE FLEET AND E N H A N C E O M N I E X P E R I E N C E S to create a tech-enabled, connected omni-
ecosystem that supports a reimagined store experience through a streamlined stores portfolio and new off-mall formats. We are enhancing our omnichannel shopping experience by focusing on scaling store fulfillment, buy online pick-up in store, curbside pickup and same-day delivery services. To more closely connect online and offline and deliver a seamless customer experience, we will continue to invest in technology that enhances the way we engage our customers. The repositioning and resizing of our fleet through the monetization of our real estate assets will continue to play an important role in funding our growth initiatives.
M O D E R N I Z E O U R S U P P LY C H A I N I N F R A S T R U C T U R E by moving toward a faster and more efficient customer fulfillment
infrastructure while profitably improving convenience and the delivery experience. We are also better managing and placing our inventory to meet customer demand and to minimize markdowns. We expect these changes will deliver higher productivity in our customer fulfillment centers and stores, lower delivery expenses and improved customer service across our network.
And last, ENABLING TRANSFORMATION THROUGH DATA ANALYTICS, TECHNOLOGY AND A PERFORMANCE-DRIVEN OPERATING
MODEL, ensuring we have the right infrastructure and technology to execute and sustain our plans. This includes, first, a modernized technology platform to support a friction-free customer and colleague experience. Second, we are revamping our data and analytics foundation to drive growth and profitability through all our decisions. And third, the most critical to our success, a performance-driven operating model enabled by clear incentives for our colleagues.
1 4
5
6
2
3
M A C Y ’ S , I N C . 2 0 2 0 A N N U A L R E P O R T
TO OUR SHAREHOLDERS
CREATING A MORE SUSTAINABLE FUTUREAt Macy’s, Inc., we have a deep sense of stewardship for managing our resources and maximizing our positive social impact. We proactively engage on issues that span the breadth of our operations – this includes transparency, product responsibility and supply chain management, energy management, diversity and inclusion and building resilient communities. We believe operating by these principles will enable us to create value for our shareholders while addressing the shared needs of society. We believe that what we do, what we stand for, and how we get the work done are each equally important. Across the entire colleague lifecycle, we have a cohesive strategy that focuses on our culture and providing our people with the programs and support that matter the most to their professional growth and development. I am pleased to share our story with the recent publication of our Human Capital Report that highlights our culture and engagement, diversity and inclusion, future of work, healthy and safety, people analytics and total rewards.
LOOKING AHEAD FOR MACY’S, INC. We understand there is much work ahead to capitalize on the opportunities now available to Macy’s, Inc. We have the aspiration, the fortitude and the agility to successfully transform our business.
As we look towards a healthier economy in the coming months and years, I am optimistic about the way we are reimagining and repositioning our business in line with our Polaris strategy. Macy’s, Inc. has a clear path to sustainable growth, driven by the expansion of our digital channel and by the refocusing of our store fleet on better-quality malls and more convenient and productive off-mall formats that are closer to our customers. Our plan is underpinned by a capital allocation strategy that enhances our long-term financial stability and returns for our shareholders, our commitment to investing in growth initiatives that generate high returns and our goal of achieving a healthier capital structure and progressing towards investment-grade metrics.
I am also encouraged by the talent and focus of our teams across Macy’s, Inc. who persevered through 2020 and who are committed to our future growth. We have a diverse leadership team that includes a blend of new talent with outside perspectives along with our tenured and best developed leaders. I am confident that, together, we will succeed as we build toward a sustainable, profitable future.
Jeff Gennette Chairman & Chief Executive Officer
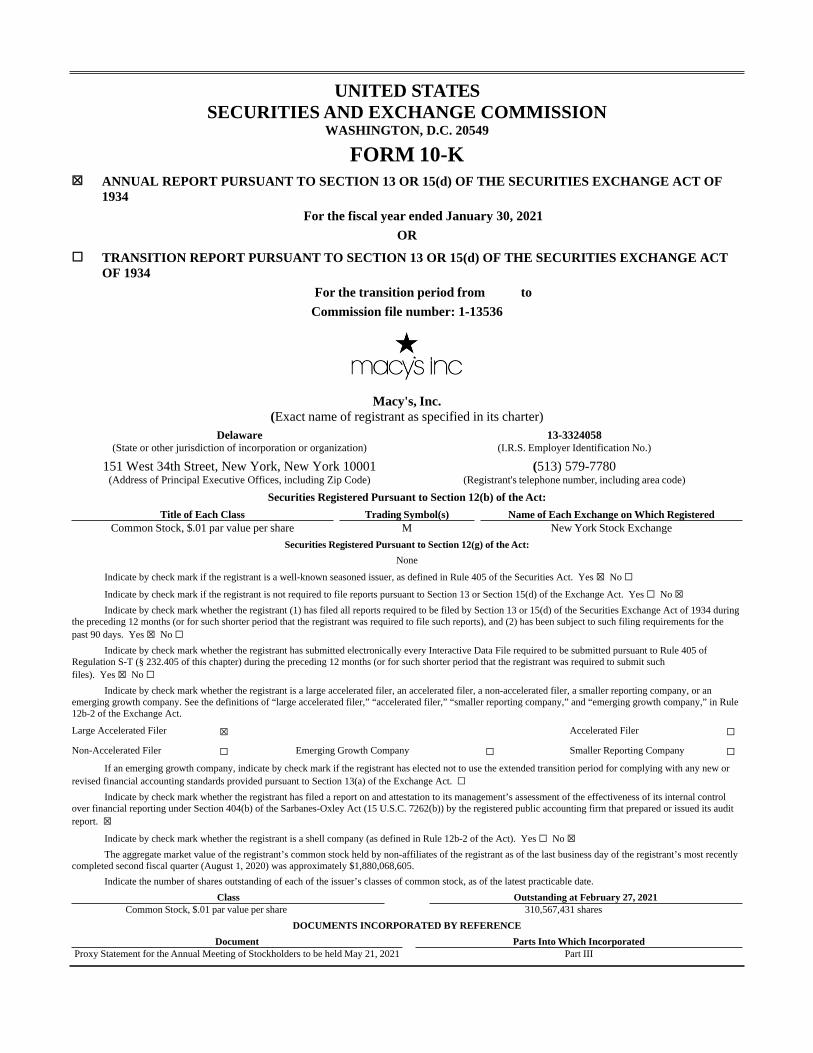
UNITED STATESSECURITIES AND EXCHANGE COMMISSION
WASHINGTON, D.C. 20549
FORM 10-K☒ ANNUAL REPORT PURSUANT TO SECTION 13 OR 15(d) OF THE SECURITIES EXCHANGE ACT OF
1934
For the fiscal year ended January 30, 2021
OR
☐ TRANSITION REPORT PURSUANT TO SECTION 13 OR 15(d) OF THE SECURITIES EXCHANGE ACT OF 1934
For the transition period from to
Commission file number: 1-13536
Macy's, Inc.(Exact name of registrant as specified in its charter)
Delaware 13-3324058(State or other jurisdiction of incorporation or organization) (I.R.S. Employer Identification No.)
151 West 34th Street, New York, New York 10001 (513) 579-7780(Address of Principal Executive Offices, including Zip Code) (Registrant's telephone number, including area code)
Securities Registered Pursuant to Section 12(b) of the Act:
Title of Each Class Trading Symbol(s) Name of Each Exchange on Which RegisteredCommon Stock, $.01 par value per share M New York Stock Exchange
Securities Registered Pursuant to Section 12(g) of the Act:
None
Indicate by check mark if the registrant is a well-known seasoned issuer, as defined in Rule 405 of the Securities Act. Yes ☒ No ☐Indicate by check mark if the registrant is not required to file reports pursuant to Section 13 or Section 15(d) of the Exchange Act. Yes ☐ No ☒Indicate by check mark whether the registrant (1) has filed all reports required to be filed by Section 13 or 15(d) of the Securities Exchange Act of 1934 during
the preceding 12 months (or for such shorter period that the registrant was required to file such reports), and (2) has been subject to such filing requirements for the past 90 days. Yes ☒ No ☐
Indicate by check mark whether the registrant has submitted electronically every Interactive Data File required to be submitted pursuant to Rule 405 of Regulation S-T (§ 232.405 of this chapter) during the preceding 12 months (or for such shorter period that the registrant was required to submit such files). Yes ☒ No ☐
Indicate by check mark whether the registrant is a large accelerated filer, an accelerated filer, a non-accelerated filer, a smaller reporting company, or an emerging growth company. See the definitions of “large accelerated filer,” “accelerated filer,” “smaller reporting company,” and “emerging growth company,” in Rule 12b-2 of the Exchange Act.
Large Accelerated Filer ☒ Accelerated Filer ☐
Non-Accelerated Filer ☐ Emerging Growth Company ☐ Smaller Reporting Company ☐If an emerging growth company, indicate by check mark if the registrant has elected not to use the extended transition period for complying with any new or
revised financial accounting standards provided pursuant to Section 13(a) of the Exchange Act. ☐Indicate by check mark whether the registrant has filed a report on and attestation to its management’s assessment of the effectiveness of its internal control
over financial reporting under Section 404(b) of the Sarbanes-Oxley Act (15 U.S.C. 7262(b)) by the registered public accounting firm that prepared or issued its audit report. ☒
Indicate by check mark whether the registrant is a shell company (as defined in Rule 12b-2 of the Act). Yes ☐ No ☒The aggregate market value of the registrant’s common stock held by non-affiliates of the registrant as of the last business day of the registrant’s most recently
completed second fiscal quarter (August 1, 2020) was approximately $1,880,068,605.
Indicate the number of shares outstanding of each of the issuer’s classes of common stock, as of the latest practicable date.
Class Outstanding at February 27, 2021Common Stock, $.01 par value per share 310,567,431 shares
DOCUMENTS INCORPORATED BY REFERENCE
Document Parts Into Which IncorporatedProxy Statement for the Annual Meeting of Stockholders to be held May 21, 2021 Part III
2
Unless the context requires otherwise, references to “Macy’s” or the “Company” are references to Macy’s and its subsidiaries and references to “2020,” “2019,” “2018,” “2017” and “2016” are references to the Company’s fiscal years ended January 30, 2021, February 1, 2020, February 2, 2019, February 3, 2018 and January 28, 2017, respectively. Fiscal year 2017 included 53 weeks; fiscal years 2020, 2019, 2018 and 2016 included 52 weeks.
Forward-Looking Statements
This report and other reports, statements and information previously or subsequently filed by the Company with the Securities and Exchange Commission (the “SEC”) contain or may contain forward-looking statements. Such statements are based upon the beliefs and assumptions of, and on information available to, the management of the Company at the time such statements are made. The following are or may constitute forward-looking statements within the meaning of the Private Securities Litigation Reform Act of 1995: (i) statements preceded by, followed by or that include the words “may,” “will,” “could,” “should,” “believe,” “expect,” “future,” “potential,” “anticipate,” “intend,” “plan,” “think,” “estimate” or “continue” or the negative or other variations thereof, and (ii) statements regarding matters that are not historical facts. Such forward-looking statements are subject to various risks and uncertainties, including risks and uncertainties relating to:
• the effects of the weather, natural disasters, and health pandemics, including the coronavirus (COVID-19) pandemic, on the Company’s business, including the ability to open stores, customer demand and its supply chain, as well as our consolidated results of operations, financial position and cash flows;
• the possible invalidity of the underlying beliefs and assumptions;
• the Company's ability to successfully execute against its Polaris strategy, including the ability to realize the anticipated benefits associated with the strategy;
• the success of the Company’s operational decisions, such as product sourcing, merchandise mix and pricing, and marketing and strategic initiatives, such as growing its digital channels, expanding off-mall and modernizing its technology and supply chain infrastructures;
• general consumer shopping behaviors and spending levels, including the shift of consumer spending to digital channels, the impact of changes in general economic conditions, consumer disposable income levels, consumer confidence levels, the availability, cost and level of consumer debt, and the costs of basic necessities and other goods;
• competitive pressures from department stores, specialty stores, general merchandise stores, manufacturers’ outlets, off-price and discount stores, and all other retail channels, including digitally-native retailers, social media and catalogs;
• the Company’s ability to remain competitive and relevant as consumers’ shopping behaviors continue to migrate to online and other shopping channels and to maintain its brand and reputation;
• possible systems failures and/or security breaches, including any security breach that results in the theft, transfer or unauthorized disclosure of customer, employee or company information, or the failure to comply with various laws applicable to the Company in the event of such a breach;
• the cost of employee benefits as well as attracting and retaining quality employees;
• transactions and strategy involving the Company's real estate portfolio;
• the seasonal nature of the Company’s business;
• conditions to, or changes in the timing of, proposed transactions, and changes in expected synergies, cost savings and non-recurring charges;
• the potential for the incurrence of charges in connection with the impairment of intangible assets, including goodwill;
• possible changes or developments in social, economic, business, industry, market, legal and regulatory circumstances and conditions;
• possible actions taken or omitted to be taken by third parties, including customers, suppliers, business partners, competitors and legislative, regulatory, judicial and other governmental authorities and officials;
• changes in relationships with vendors and other product and service providers;
3
• our substantial level of indebtedness;
• currency, interest and exchange rates and other capital market, economic and geo-political conditions;
• unstable political conditions, civil unrest, terrorist activities and armed conflicts;
• the possible inability of the Company’s manufacturers or transporters to deliver products in a timely manner or meet the Company’s quality standards;
• the Company’s reliance on foreign sources of production, including risks related to the disruption of imports by labor disputes, regional and global health pandemics, and regional political and economic conditions; and
• duties, taxes, other charges and quotas on imports.
In addition to any risks and uncertainties specifically identified in the text surrounding such forward-looking statements, the statements in the immediately preceding sentence and the statements under captions such as “Risk Factors” in reports, statements and information filed by the Company with the SEC from time to time constitute cautionary statements identifying important factors that could cause actual amounts, results, events and circumstances to differ materially from those expressed in or implied by such forward-looking statements.
4
Item 1. Business.
General
The Company is a corporation organized under the laws of the State of Delaware in 1985. The Company and its predecessors have been operating department stores since 1830. The Company operates 727 store locations in 43 states, the District of Columbia, Puerto Rico and Guam. As of January 30, 2021, the Company's operations were conducted through Macy's, Macy’s Backstage, Market by Macy’s, Bloomingdale's, Bloomingdale’s The Outlet, and bluemercury. In addition, Bloomingdale's in Dubai, United Arab Emirates, and Al Zahra, Kuwait are operated under license agreements with Al Tayer Insignia, a company of Al Tayer Group, LLC.
The Company sells a wide range of merchandise, including apparel and accessories (men’s, women’s and kids'), cosmetics, home furnishings and other consumer goods. The specific assortments vary by size of store, merchandising assortments and character of customers in the trade areas. Most stores are located at urban or suburban sites, principally in densely populated areas across the United States.
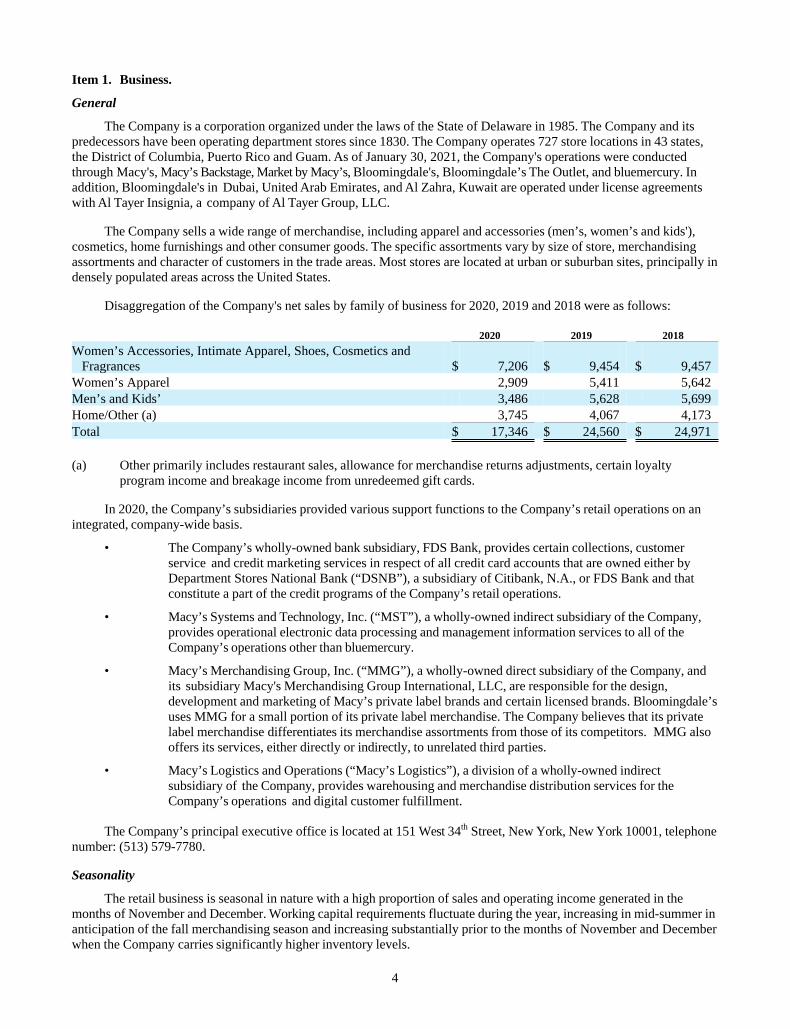
Disaggregation of the Company's net sales by family of business for 2020, 2019 and 2018 were as follows:
2020 2019 2018
Women’s Accessories, Intimate Apparel, Shoes, Cosmetics and Fragrances $ 7,206 $ 9,454 $ 9,457 Women’s Apparel 2,909 5,411 5,642 Men’s and Kids’ 3,486 5,628 5,699 Home/Other (a) 3,745 4,067 4,173 Total $ 17,346 $ 24,560 $ 24,971
(a) Other primarily includes restaurant sales, allowance for merchandise returns adjustments, certain loyalty program income and breakage income from unredeemed gift cards.
In 2020, the Company’s subsidiaries provided various support functions to the Company’s retail operations on an integrated, company-wide basis.
• The Company’s wholly-owned bank subsidiary, FDS Bank, provides certain collections, customer service and credit marketing services in respect of all credit card accounts that are owned either by Department Stores National Bank (“DSNB”), a subsidiary of Citibank, N.A., or FDS Bank and that constitute a part of the credit programs of the Company’s retail operations.
• Macy’s Systems and Technology, Inc. (“MST”), a wholly-owned indirect subsidiary of the Company, provides operational electronic data processing and management information services to all of the Company’s operations other than bluemercury.
• Macy’s Merchandising Group, Inc. (“MMG”), a wholly-owned direct subsidiary of the Company, and its subsidiary Macy's Merchandising Group International, LLC, are responsible for the design, development and marketing of Macy’s private label brands and certain licensed brands. Bloomingdale’s uses MMG for a small portion of its private label merchandise. The Company believes that its private label merchandise differentiates its merchandise assortments from those of its competitors. MMG also offers its services, either directly or indirectly, to unrelated third parties.
• Macy’s Logistics and Operations (“Macy’s Logistics”), a division of a wholly-owned indirect subsidiary of the Company, provides warehousing and merchandise distribution services for the Company’s operations and digital customer fulfillment.
The Company’s principal executive office is located at 151 West 34th Street, New York, New York 10001, telephone number: (513) 579-7780.
Seasonality
The retail business is seasonal in nature with a high proportion of sales and operating income generated in the months of November and December. Working capital requirements fluctuate during the year, increasing in mid-summer in anticipation of the fall merchandising season and increasing substantially prior to the months of November and December when the Company carries significantly higher inventory levels.
5
Purchasing
The Company purchases merchandise from many suppliers, none of which accounted for more than 5% of the Company’s purchases during 2020. The Company has no material long-term purchase commitments with any of its suppliers, and believes that it is not dependent on any one supplier. The Company considers its relations with its suppliers to be good.
Private Label Brands and Related Trademarks
The principal private label brands currently offered by the Company include Alfani, Aqua, Bar III, Belgique, Charter Club, Club Room, Epic Threads, first impressions, Giani Bernini, Holiday Lane, Home Design, Hotel Collection, Hudson Park, Ideology, I-N-C, jenni, JM Collection, Karen Scott, lune+aster, M-61, Maison Jules, Martha Stewart Collection, Oake, Sky, Style & Co., Sun + Stone, Sutton Studio, Tasso Elba, Thalia Sodi, The Cellar, Tools of the Trade and Wild Pair.
The trademarks associated with the Company's private label brands, other than Martha Stewart Collection and Thalia Sodi, are owned by the Company. The Martha Stewart Collection and Thalia Sodi brands are owned by third parties, which license the trademarks associated with the brands to Company pursuant to agreements. The agreement for Thalia Sodi expired in January 2021, but the Company has a 180-day sell-off period, while the Martha Stewart agreement extends through 2022.
Competition
The retail industry is highly competitive. The Company’s operations compete with many retail formats on the national and local level, including department stores, specialty stores, general merchandise stores, manufacturers' outlets, off-price and discount stores, online retailers and catalogs, among others. The Company seeks to attract customers by offering compelling, high-quality products, great prices and trusted service across all channels, including its digital platforms. The Company’s stores are located in premier locations and the Company provides a superior omnichannel product experience at a variety of price points. Other retailers may compete for customers on some or all of these bases, or on other bases, and may be perceived by some potential customers as being better aligned with their particular preferences.
Available Information
The Company makes its annual report on Form 10-K, quarterly reports on Form 10-Q, current reports on Form 8-K and amendments to those reports filed or furnished pursuant to Section 13(a) or 15(d) of the Securities Exchange Act of 1934 (the "Exchange Act") available free of charge through its internet website at https://www.macysinc.com as soon as reasonably practicable after it electronically files such material with, or furnishes it to, the SEC. The SEC also maintains an internet site that contains reports, proxy and information statements, and other information regarding issuers that file electronically with the SEC; the address of that site is https://www.sec.gov. In addition, the Company has made the following available free of charge through its website at https://www.macysinc.com:
• Charters of the Audit Committee, Compensation and Management Development Committee, Finance Committee, and Nominating and Corporate Governance Committee,
• Corporate Governance Principles,
• Lead Independent Director Policy,
• Non-Employee Director Code of Business Conduct and Ethics,
• Code of Conduct,
• Standards for Director Independence,
• Related Person Transactions Policy,
• Method to Facilitate Receipt, Retention and Treatment of Communications, and
• Proxy Access By-Laws.
Any of these items are also available in print to any shareholder who requests them. Requests should be sent to the Corporate Secretary of Macy’s, Inc. at 151 West 34th Street, New York, New York 10001.
6
Human Capital
Culture & Engagement
At Macy’s culture is about relationships—how the Company serves and supports its customers, communities and employees (called colleagues). The Company’s workplace is rooted in equity and guided by its values of acceptance, respect, integrity and giving back.
The Company gathers colleague feedback at key times throughout the colleague lifecycle from onboarding to offboarding, providing regular venues for colleagues to ask questions and share their opinions, such as Ask Me Anything sessions, town halls and employee resource groups. The Company formally solicits feedback from all colleagues twice a year through an enterprise-wide Culture Pulse Survey. The results are shared across the organization to provide visibility to both managers (called people leaders) and colleagues and help create an opportunity for open and constructive discussions among teams.
Diversity & Inclusion
Macy’s commitment to diversity and inclusion is guided by its values and starts from within by building a workforce that accurately represents the communities it serves at all levels and by cultivating a culture of belonging. The Company seeks to empower colleagues to harness and unleash the power of their individuality to help drive better business decisions for customers and shareholders.
The Company actively promotes an inclusive and welcoming environment for all customers and is focused on diversity and inclusion beyond the organization—working to support and develop diverse suppliers; investing in economic and workforce development; contributing to organizations fighting for social justice; and awarding scholarships to cultivate future leaders.
One of the Company’s measures to advance the diversity of its leadership at the senior director level and above is the MOSAIC program, a one-year professional development program launched in 2019 for its top talent at the manager and director levels who self-identify as ethnically diverse. From 2019 to 2020, approximately 61% of program participants were promoted or moved into a new role, with approximately 18% promoted to senior director level. The Company is currently at 24% ethnic diversity at the senior director level and above, with a goal to reach 25% in 2021 and 30% by 2025.
Macy’s believes people leaders play an important role in driving performance and an inclusive culture. In 2020, the Company incorporated People Leader Commitments (which were launched in 2019) and diversity and inclusion (D&I) into the performance review process. In 2021, the Company has included standardized D&I goals into annual reviews at the director level and above.
Company-sponsored, employee-led resource groups (ERGs) provide an opportunity for colleagues to experience connection, achieve belonging and build community. ERGs expanded from 51 to 94 chapters across Macy’s and Bloomingdale’s in 2020 and continue to be a resource for attracting and retaining talent.
Macy’s D&I focus areas extend beyond its colleagues and include community, customers, marketing and suppliers. For example:
• In 2020, the Company allocated $1 million to organizations promoting social justice, sourced new partners, and committed two colleagues to the work of CEO Action for Racial Equity Taskforce—the mission of the taskforce is to identify, develop and promote scalable and sustainable public policies and corporate engagement strategies that will address systemic racism, social justice and improve societal well-being.
• In 2019, the Company launched a Customer Bill of Rights across all Macy’s and Bloomingdale’s stores as a new standard of how the Company will treat everyone who engages with its brands.
• The Company is advancing representation in its advertising to reflect its customers by gender, gender identity, ethnicity, age, size and people with disabilities.
• In 2020, the Company increased brand assortment by adding 100 new, diverse-owned businesses online and in stores. Overall, minority and diverse suppliers (retail and non-retail) accounted for 3.5% of the Company’s total spend in 2020, with a goal to increase to 4% in 2021.
7
Future of Work
The workplace is evolving and so is Macy’s. The Company believes the future of work is about allowing colleagues to do their best work safely, flexibly and in an environment that inspires collaboration and connection and reflects their core values. Through investments in technology, new and updated policies and procedures, and listening to the needs of its colleagues, Macy’s is evolving with them. Because no matter where colleagues work, behind a desk or behind a screen, in stores or in distribution centers, the Company believes they are guided by their strong sense of culture and what it means to be part of the Macy’s family.
The Company has taken enhanced safety measures to help mitigate the spread of COVID-19 to colleagues and customers including requiring all customers to wear face masks in stores, enforcing social distancing guidelines, increasing safety equipment in stores, offering contactless shopping opportunities, providing company-supplied personal protection equipment and wellness checks for colleagues, and performing enhanced cleaning.
Learning & Development
Macy’s believes that learning goes hand in hand with career growth, personal satisfaction and outstanding results. The Company aspires to create a learning culture where colleagues actively learn, apply what they have learned to address business challenges and share their knowledge, including their mistakes, to help others grow. Learning is accessible through Ignite (powered by Degreed), the Company’s self-directed learning experience platform as well as through technology, social learning and meaningful experiences and exposures with colleagues.
The Company makes investments in its people leaders and future leaders. Macy’s and Bloomingdale’s Executive Development Programs offer immersive, hands-on learning experiences for recent college graduates from top universities across the U.S. to jump start a career in retail, with specialization in technology, digital, stores, merchandising, planning, human resources and credit and customer service. Macy’s and Bloomingdale’s offer internships for college students and Bloomindale’s offers an early immersion program focused on providing experiential learning and career exposure to those who identify with underrepresented groups. Bluemercury’s Shooting Stars is a six-month mentorship program that empowers mentees to own their journey by creating a development plan, becoming an inclusive leader and leveraging resources to support their career aspirations. In 2019, Macy’s partnered with Parsons School of Design to launch Macy’s Fashion Academy - a custom executive education program designed to offer best-in-class development across all disciplines of its merchant talent.
Approximately 81% of colleagues completed unconscious bias training in 2019 and approximately 96% of professional colleagues have utilized Ignite for personal and professional development. People leaders invest a minimum of 40 hours of leadership development each year. Professional colleagues participate in a 90-day onboarding experience with performance milestones, support resources and role-specific training.
Data Analytics
Macy’s is embedding data and analytics into its human capital management. Below are examples of how the Company leverages data-driven insights to support key business decisions.
• Career development: Allow colleagues to access their data and share their skills/career aspirations with the enterprise
• Culture: Consistently assess the health of its culture, its team’s performance and its talent pipelines
• Human resources: Standardized its employment and compensation practices across all business groups
• Leadership development: Leading technology solutions support people leaders with workforce management, including immediate access to performance, talent and compensation information for their total teams
• Talent recruitment and retention: Plan, recruit and retain talent, allowing it to co-locate teams critical to company growth and staff them with highly engaged top talent
• Workplace structure: Create multi-year strategies and prioritize workplace changes that align with customer and colleagues’ need
8
Talent
Macy’s employs approximately 90,000 full-time, part-time and seasonal colleagues nationwide across a variety of functions and roles. The Company is committed to having the best talent in retail – encouraging the continuous upskilling of its colleagues and empowering them to chart their own career paths, while staying focused on acquiring the best and brightest to inject fresh thinking.
Total Rewards
Macy’s offers comprehensive benefits and an awards strategy that recognizes performance and talent development. Eligible colleagues have varied medical plan options to meet individual needs. The Company’s commitment to colleagues’ well-being expanded during the pandemic in 2020, as it covered 100% of insurance premiums for colleagues while on furlough, including coverage for dependents. The Company provides paid time-off, parental leave and holiday pay as well as a company 401(k) plan and match, dependent care flexible spending account, colleague merchandise discount and tuition reimbursement for eligible colleagues.
The Company believes that pay equity is fundamental to its culture and D&I strategy. Compensation is based on job position, responsibilities, experience and performance with incentive opportunities that allow all colleagues to share in the Company’s success.
In 2021, the Company expects to achieve greater than 99% pay equity across gender and race. In terms of both base pay and total compensation, the Company expects to pay female colleagues at greater than 99% of what it pays male colleagues, and it expects that minorities will be paid at greater than 99% of what it pays non-minorities in the U.S.
The Company informs its compensation approach through market surveys and pay ranges to ensure pay is competitive and fair and has a robust process to assess internal pay levels for consistency and fairness. The Company’s incentive programs reward colleagues across all levels and functions for achievements in driving business results and upholding its shared culture and values, including annual cash incentives for corporate colleagues based on performance, Path to Growth quarterly incentive program for frontline colleagues, spot bonuses and commissions for store colleagues, and annual equity grants to eligible senior management.
Number of Employees
As of January 30, 2021, excluding seasonal employees, Macy’s had 75,711 full-time and part-time employees. Because of the seasonal nature of the retail business, the number of employees peaks in the holiday season. Approximately 7% of employees are represented by unions.
Macy’s, Inc.’s Human Capital Report was released in March 2021 and is available at https://macys.learn.taleo.net/files/upload/hcr/index_ORIG.html#/lessons/MQA5eF65af1i3n8XU_BME3xQTsmGcmHE. The contents of the Human Capital Report are not incorporated by reference into this Annual Report on Form 10-K.
Information about our Executive Officers
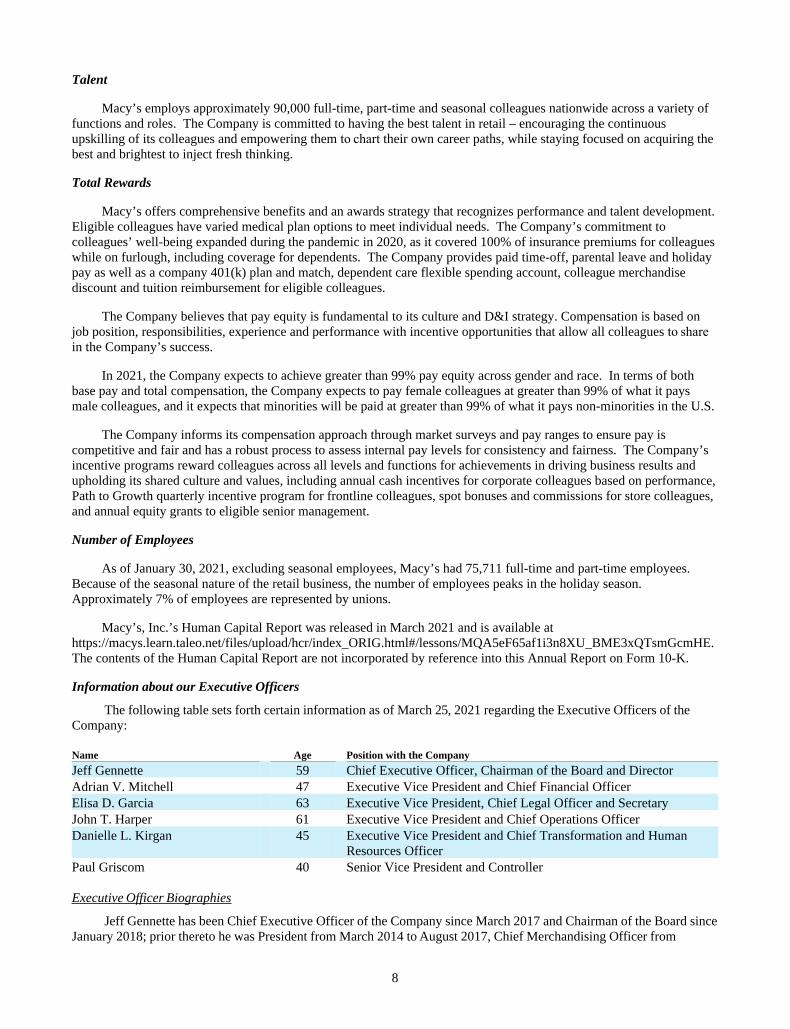
The following table sets forth certain information as of March 25, 2021 regarding the Executive Officers of the Company:
Name Age Position with the Company
Jeff Gennette 59 Chief Executive Officer, Chairman of the Board and DirectorAdrian V. Mitchell 47 Executive Vice President and Chief Financial OfficerElisa D. Garcia 63 Executive Vice President, Chief Legal Officer and SecretaryJohn T. Harper 61 Executive Vice President and Chief Operations OfficerDanielle L. Kirgan
45
Executive Vice President and Chief Transformation and Human Resources Officer
Paul Griscom 40 Senior Vice President and Controller
Executive Officer Biographies
Jeff Gennette has been Chief Executive Officer of the Company since March 2017 and Chairman of the Board since January 2018; prior thereto he was President from March 2014 to August 2017, Chief Merchandising Officer from
9
February 2009 to March 2014, Chairman and Chief Executive Officer of Macy’s West in San Francisco from February 2008 to February 2009 and Chairman and Chief Executive Officer of Seattle-based Macy’s Northwest from February 2006 through February 2008.
Adrian V. Mitchell has been Executive Vice President and Chief Financial Officer of the Company since November 2020; prior thereto he served as a Managing Director and Partner in the DigitalBCG and Consumer Practices of Boston Consulting Group from 2017 to 2020, Chief Executive Officer of Arhaus LLC from 2016 to 2017, executive positions at Crate and Barrel Holdings, Inc. from 2010 to 2015 including interim CEO, Chief Operating & Chief Financial Officer and Chief Financial Officer, and management positions at Target Corporation from 2007 to 2010 including Director of Strategy & Interactive Design for target.com and Director of Innovation & Productivity leading enterprise-wide projects for Target Corporation.
Elisa D. Garcia has been Executive Vice President, Chief Legal Officer and Secretary of the Company since September 2016; prior thereto she served as Chief Legal Officer of Office Depot, Inc. from December 2013 to September 2016, Executive Vice President and Secretary from July 2007 to September 2016 and General Counsel from July 2007 to December 2013.
John T. Harper has been Executive Vice President and Chief Operations Officer of the Company since January 2020; prior thereto he served as Chief Stores Officer from September 2017 to January 2020, President of Store Operations from May 2009 to September 2017, President of Macy’s Home Store from 2007 to 2009, Vice Chairman of Macy’s Midwest from 2006 to 2007 and Chairman of Hecht’s department stores from 2004 to 2006.
Danielle L. Kirgan has been Executive Vice President and Chief Transformation and Human Resources Officer of the Company since February 2020 and Chief Human Resources Officer since October 2017; prior thereto she served as Senior Vice President, People at American Airlines Group, Inc. from October 2016 to October 2017, Chief Human Resources Officer at Darden Restaurants, Inc. from January 2015 to October 2016 and Senior Vice President from May 2010, Vice President, Global Human Resources at ACI Worldwide, Inc. from January 2009 to December 2009, and Vice President, Human Resources at Conagra Foods, Inc. from 2004 to 2008.
Paul Griscom has been Senior Vice President and Controller of the Company since August 2020; prior thereto he served as Vice President and interim Principal Accounting Officer from June to August 2020, Vice President, Financial Reporting and Accounting Services from May 2019 to August 2020, Vice President, Financial Reporting from June 2017 to April 2019, Director of Financial Reporting from July 2016 to May 2017, Director, Training & Products, GAAP Dynamics from 2012 to 2016 and held various positions at KPMG LLP from 2000 to 2012.
Recent Developments
On March 1, 2021, the Company issued a press release announcing that John T. Harper will depart the Company effective August 1, 2021. Subsequently, the role of chief operations officer will be eliminated.
Item 1A. Risk Factors.
In evaluating the Company, the risks described below and the matters described in “Forward-Looking Statements” should be considered carefully. Such risks and matters are numerous and diverse, may be experienced continuously or intermittently, and may vary in intensity and effect. Although the risks are organized by heading, and each risk is described separately, many of the risks are interrelated. Any of such risks and matters, individually or in combination, could have a material adverse effect on our business, prospects, financial condition, results of operations and cash flows, as well as on the attractiveness and value of an investment in the Company’s securities.
10
The recent outbreak of COVID-19 has had and will continue to have a significant negative impact on the Company’s business and financial results.
In December 2019, there was an outbreak of COVID-19 in China that has since spread to the other regions of the world. The outbreak was subsequently labeled as a global pandemic by the World Health Organization in March 2020. As the pandemic continues to spread throughout the United States, businesses as well as federal, state and local governments have implemented significant actions to attempt to mitigate this public health crisis. Although the ultimate severity of the COVID-19 outbreak is uncertain at this time, the pandemic has had and will continue to have adverse impacts on the Company’s financial condition and results of operations, including, but not limited to:
• On March 18, 2020, the Company temporarily closed all of its stores and subsequently furloughed the majority of its workforce. As different states and localities began to ease the regulations imposed to slow the spread of COVID-19, the Company began to reopen its stores and by the end of the second quarter of 2020, substantially all of the Company’s stores had reopened. As a result of the COVID-19 pandemic, and particularly with the reopening of stores, the Company implemented safety measures and health and wellness precautions across its stores and facilities to mitigate risk to its customers and colleagues. These efforts to protect the health and well-being of customers and Company colleagues have resulted in, and will continue to result in, additional selling, general and administrative (“SG&A”) expenses. Recently, pockets of resurgence and variant strains of COVID-19 have emerged in parts of the world and the U.S., which may negatively impact store performance, as consumer shopping behaviors are impacted or government officials reinstate or prolong restrictions that may include occupancy limits, curfews and closures of non-essential businesses. Outbreaks and variant strains of the COVID-19 virus may continue to emerge or grow, which could require the Company to close its stores or further limit their operations. As a result, there can be no assurance as to whether stores can remain open or whether further store closures may be required.
• During the first and second quarters of 2020, the Company experienced significant reductions and volatility in demand for its retail products as customers were not able to purchase merchandise in stores due to quarantine or government or self-imposed restrictions placed on the Company’s stores’ operations. Despite continued store recovery in the third and fourth quarters of 2020, store sales declined significantly compared to the same periods last year. Additionally, social distancing measures or changes in consumer spending behaviors due to COVID-19 have impacted and may continue to impact traffic in stores and could result in a loss of sales and profit.
• COVID-19 has had a significant impact on the economic conditions in North America as well as a significant impact on discretionary consumer spending and consumer shopping behaviors. In response to the disruption caused by the COVID-19 pandemic, the Company reconfigured its cost base through colleague reductions and reduced discretionary spending and has made investments to adapt to the changes in consumer behavior. While it is premature to accurately predict the ultimate impact of these developments, the Company expects its results of operations will be adversely impacted in a significant manner and such impacts could continue for an undetermined amount of time.
• The Company has experienced and may continue to experience temporary or long-term disruptions in its supply chain, as the outbreak has resulted in travel disruptions and has impacted manufacturing and distribution throughout the world. The receipt of products or raw material sourced from impacted areas has been and may continue to be slowed or disrupted, which could impact the Company’s private brands or the fulfillment of merchandise orders from the Company’s brand partners. Furthermore, transportation delays and cost increases, more extensive travel restrictions, closures or disruptions of businesses and facilities and social, economic, political or labor instability in the affected areas have impacted and may continue to impact the Company, its suppliers’ operations and its customers.
• The Company has been and may continue to be required to change its plan for inventory receipts, which could place financial pressure on its brand partners. Such actions may negatively impact relationships with brand partners or adversely impact their financial performance and position. If this occurs, current brand partners’ ability to meet their obligations to the Company may be impacted or the Company may also be required to identify new brand partner relationships.
• The Company’s liquidity was negatively impacted by the store closures. While the Company has obtained additional financing, further actions may be required to improve the Company’s cash position, including but not limited to, monetizing Company assets, reinstituting colleague furloughs, and foregoing capital expenditures and other discretionary expenses. Failure to obtain any necessary additional financing or
11
enhance the Company’s liquidity could lead to default on its current financing arrangements and impact the Company’s ability to meet its obligations as they come due.
The Company cannot foresee whether the outbreak of COVID-19 will be effectively contained, nor can it predict the severity and duration of its impact, how variant strains of the COVID-19 virus will impact the pandemic, or the availability and distribution of effective medical treatments or vaccines. As such, the Company will continue to assess the highly uncertain financial impacts of COVID-19. The disruption to the global economy and to the Company’s business may lead to triggering events that may indicate that the carrying value of certain assets, including inventories, long-lived assets, intangibles, and goodwill, may not be recoverable.
The impact of COVID-19 may also exacerbate other risks included in in this section, any of which could be material. The situation is changing rapidly, and future impacts may materialize that are not yet known. Even if the COVID-19 pandemic subsides, the Company may continue to experience materially adverse impacts to the Company's business as a result of the virus' long-term economic impact, including adverse impacts on the business operations, liquidity and impacts of any recession that may occur in the future.
Strategic, Operational and Competitive Risks
Our strategic initiatives may not be successful, which could negatively affect our profitability and growth.
In February 2020, we announced the Polaris strategy, a multi-year plan designed to stabilize profitability and position the Company for sustainable, profitable growth. Over the course of the COVID-19 pandemic, we have refined the components of the Polaris strategy to focus where we believe we can drive competitive advantage and differentiation to first recover business and then drive growth, including a focus on winning with fashion and style, delivering clear value, excelling in digital shopping, enhancing store experience, modernizing supply chain and enabling transformation. Our ability to achieve sustainable, profitable growth is subject to the successful implementation of our strategic plans, including the Polaris strategy, and realization of anticipated benefits and savings. If these investments or initiatives do not perform as expected or create implementation or operational challenges, our profitability and growth could suffer.
Our sales and operating results depend on our ability to anticipate and respond to consumer preferences and manage our inventory and merchandise selection.
The fashion and retail industries are subject to sudden shifts in consumer trends and consumer spending. Our sales and operating results depend in part on our ability to predict or respond to changes in fashion trends and consumer preferences in a timely manner. We develop new retail concepts and continuously adjust our inventory position in certain major and private-label brands and product categories in an effort to attract and retain customers. Any sustained failure to anticipate, identify and respond to emerging trends in lifestyle and consumer preferences could negatively affect our business and results of operations.
Our profitability depends on our ability to manage inventory levels and merchandise selection. Overestimating customer demand for merchandise will likely result in the need to record inventory markdowns and sell excess inventory at clearance prices, which would negatively impact our gross margins and operating results. Underestimating customer demand for merchandise can lead to inventory shortages, missed sales opportunities and negative customer experiences.
The Company faces significant competition and challenges as consumers continue to migrate to online shopping and depends on its ability to differentiate itself in retail's ever-changing environment.
We conduct our retail merchandising business under highly competitive conditions. Although Macy's, Inc. is one of the nation’s largest retailers, we have numerous and varied competitors at the national and local levels, including department stores, specialty stores, general merchandise stores, manufacturers’ outlets, off-price and discount stores, online retailers and catalogs, among others. Competition is characterized by many factors, including assortment, advertising, price, quality, service, location, reputation and credit availability. Any failure by us to compete effectively could negatively affect our business and results of operations.
As consumers continue to migrate online, a trend that has accelerated with the COVID-19 pandemic, we face pressures to not only compete from a price perspective with our competitors, some of whom sell the same products, but also to differentiate Macy's, Inc. merchandise offerings, service and shopping experience to stay relevant in retail's ever-changing environment. We continue to significantly invest in our omnichannel capabilities to provide our customers with a seamless shopping experience between our store locations and our online and mobile environments and a favorable fashion experience. Insufficient, untimely or misguided investments in this area could significantly impact our profitability and growth and affect our ability to attract new customers, as well as maintain our existing ones.
12
In addition, a continued decline of customer store traffic and migration of sales from brick and mortar stores to digital platforms could lead to additional store closures, restructuring and other costs that could adversely impact our results of operations and cash flows.
Our ability to grow depends in part on our stores remaining relevant to customers.
We have invested in facilities and fixtures upgrades, merchandise assortment and customer service in selected stores to improve customer retention rates and overall customer satisfaction. While these investments are intended to improve the customer experience in our stores and drive traffic, realization of these benefits may not occur.
Because we rely on the ability of our physical retail locations to remain relevant to customers, providing desirable and sought-out shopping experiences is important to our financial success. Changes in consumer shopping habits, an over-malled/over-retailed environment, financial difficulties at other anchor tenants, significant mall vacancy issues, mall violence and new on- and off-mall developments could each adversely impact the traffic at current retail locations and lead to a decline in our financial condition or performance.
We may not be able to successfully execute our real estate strategy.
We continue to explore opportunities to monetize our real estate portfolio, including sales of stores as well as non-store real estate such as warehouses, outparcels and parking garages. We also continue to evaluate our real estate portfolio to identify opportunities where the redevelopment value of our real estate exceeds the value of non-strategic operating locations. This strategy is multi-pronged and may include transactions, strategic alliances or other arrangements with mall developers or other unrelated third-parties. Due to the cyclical nature of real estate markets, the performance of our real estate strategy is inherently volatile and could have a significant impact on our results of operations or financial condition.
Our revenues and cash requirements are affected by the seasonal nature of our business.
Our business is seasonal, with a high proportion of revenues and operating cash flows generated during the second half of the year, which includes the fall and the months of November and December. A disproportionate amount of our revenues is in the fourth quarter due to this seasonality. Should sales during this period fall below our expectations, a disproportionately negative impact on our annual results of operations could occur.
We incur significant additional expenses in the period leading up to the months of November and December in anticipation of higher sales volume in those periods, including costs for additional inventory, advertising and employees. If we are not successful in executing our sales strategy during this period, we may have to sell the inventory at significantly reduced prices or may not be able to sell the inventory at all, which could have a material adverse effect on our results of operations and cash flows.
We depend on our ability to attract, train, develop and retain quality employees.
Our business is dependent upon attracting, training, developing and retaining quality employees. Macy's, Inc. has a large number of employees, many of whom are in entry level or part-time positions with historically high rates of turnover. Our ability to meet labor needs while controlling costs associated with hiring and training new employees is subject to external factors such as unemployment levels, prevailing wage rates, minimum wage legislation and changing demographics. Low unemployment and a competitive wage environment have impacted our ability to attract and recruit talent, particularly for science, technology, engineering and math positions. The Company operates in a highly competitive and challenging business environment and is highly dependent upon management personnel to develop and effectively execute successful business strategies and tactics. Restructurings and organizational changes can have near-term impacts on knowledge transfer and result in the loss of key subject matter experts and leaders. Any circumstances that adversely impact our ability to attract, train, develop and retain quality employees could negatively affect our business and results of operations.
Increases in labor costs and the cost of employee benefits could impact our financial results and cash flow.
Minimum wage increases by states and wage and benefit increases to attract and retain workers in a tight labor market have increased labor costs in the retail sector. These increased costs pressure our margins and could have a negative impact on our financial results, particularly if future increases are instituted by state legislatures or the federal government.
13
Our expenses relating to employee health benefits are significant. Unfavorable changes in the cost of such benefits could negatively affect our financial results and cash flow. Healthcare costs have risen significantly in recent years, and recent legislative and private sector initiatives regarding healthcare reform have resulted and could continue to result in significant changes to the U.S. healthcare system. Due to uncertainty regarding legislative or regulatory changes, we are not able to fully determine the impact that future healthcare reform will have on our company-sponsored medical plans.
If cash flows from our private label credit card decrease, our financial and operational results may be negatively impacted.
We previously sold most of our credit accounts and related receivables to Citibank (in its role as the issuer of our credit card). Following the sale, we share in the economic performance of the credit card program with Citibank. Deterioration in economic or political conditions could adversely affect the volume of new credit accounts, the amount of credit card program balances and the ability of credit card holders to pay their balances. These conditions could result in the Company receiving lower payments under the credit card program.
Under the terms of the credit card program, Citibank has the right to terminate the agreement prior to the end of the current term if sales decrease by more than 34% over a twelve-month period as compared to the fiscal twelve-month period from July 2006 to June 2007 (the “Benchmark Year”). Based on the results of the Company’s February 2021 fiscal period, sales for the most recent twelve-month period then ended have decreased by more than 34% as compared to the Benchmark Year. We are in on-going discussions with Citibank concerning the credit card program. We cannot assure that Citibank will not terminate the credit card program or require more favorable terms to continue the credit card program. If Citibank does terminate the credit card program, any new credit card program may be on terms less favorable to us than the current credit card program.
Credit card operations are subject to many federal and state laws that may impose certain requirements and limitations on credit card providers. Citibank and our subsidiary bank, FDS Bank, may be required to comply with regulations that may negatively impact the operation of our private label credit card. This negative impact may affect our revenue streams derived from the sale of such credit card accounts and our financial results.
Our defined benefit plan funding requirements or plan settlement expense could impact our financial results and cash flow.
Significant changes in interest rates, decreases in the fair value of plan assets and timing and amount of benefit payments could affect the funded status of our plans and could increase future funding requirements of the plans. A significant increase in future funding requirements could have a negative impact on our cash flows, financial condition or results of operations.
These plans allow eligible retiring employees to receive lump sum distributions of benefits earned. Under applicable accounting rules, if annual lump sum distributions exceed an actuarially determined threshold of the total of the annual service and interest costs, we would be required to recognize in the current period of operations a settlement expense of a portion of the unrecognized actuarial loss and could have a negative impact on our results of operations.
If our company’s reputation and brand are not maintained at a high level, our operations and financial results may suffer.
We believe our reputation and brand are partially based on the perception that we act equitably and honestly in dealing with our customers, employees, business partners and shareholders. Our reputation and brand may be deteriorated by any incident that erodes the trust or confidence of our customers or the general public, particularly if the incident results in significant adverse publicity or governmental inquiry. Information about us, whether or not true, may be instantly and easily posted on social media platforms at any time and may be adverse to our reputation or brand. The harm could be immediate without affording us an opportunity for redress or correction. If our reputation or brand is damaged, our customers may refuse to continue shopping with us, potential employees may be unwilling to work for us, business partners may be discouraged from seeking future business dealings with us and, as a result, our operations and financial results may suffer.
If we are unable to protect our intellectual property, our brands and business could be damaged.
We believe that our copyrights, trademarks, trade dress, trade secrets and similar intellectual property are important assets and key elements of our strategy, including those related to our private brand merchandise. We rely on copyright and trademark law, trade secret protection and confidentiality agreements with our employees, consultants, vendors and others to protect our proprietary rights. If the steps we take to protect our proprietary rights are inadequate,
14
or if we are unable to protect or preserve the value of our copyrights, trademarks, trade secrets and other proprietary rights for any reason, our merchandise brands and business could be negatively affected.
Infrastructure Risks
Unforeseen disruptions in our distribution and fulfillment centers could have an adverse impact on our business and operations.
Our business depends on the orderly receipt and distribution of merchandise and effective management of our distribution and fulfillment centers. Unforeseen disruptions in operations due to fire, severe weather conditions, natural disasters, health pandemics or other catastrophic events, labor disagreements, or other shipping problems may result in the loss or unavailability of inventory and/or delays in the delivery of merchandise to our stores and customers.
A material disruption in our information technology systems could adversely affect our business or results of operations.
We rely extensively on our information technology systems to process transactions, summarize results and manage our business. Our information technology systems are subject to damage or interruption from power outages, computer and telecommunications failures, computer viruses, cyber-attack or other security breaches, catastrophic events such as fires, floods, earthquakes, tornadoes, hurricanes, acts of war or terrorism, and usage errors by our employees. If our information technology systems are damaged or cease to function properly, including a material disruption in our ability to authorize and process transactions at our stores or on our online systems, we may have to make a significant investment to fix or replace them, and we may suffer loss of critical data and interruptions or delays in our operations. Any material interruption in our information technology systems could negatively affect our business and results of operations.
In addition, COVID-19 may have an adverse impact on our information technology systems, including telecommuting issues associated with our employee population working remotely or an increase in online orders due to disruptions or closures of our retail store operations.
If our technology-based e-commerce systems do not function properly, our operating results could be negatively affected.
Customers are increasingly using computers, tablets and smart phones to shop online and to do price and comparison shopping. We strive to anticipate and meet our customers’ changing expectations and are focused on building a seamless shopping experience across our omnichannel business. Any failure to provide user-friendly, secure e-commerce platforms that offer merchandise and delivery options that resonate with customers’ could place us at a competitive disadvantage, result in the loss of online and other sales, harm our reputation with customers and have a material adverse impact on the growth of our business and our operating results.
Information Security, Cybersecurity, Privacy and Data Management Risks
A breach of information technology systems could adversely affect our reputation, business partner and customer relationships and operations, and result in high costs.
Through our sales, marketing activities, and use of third-party information, we collect and store certain non-public personal information that customers provide to purchase products or services, enroll in promotional programs, register on websites, or otherwise communicate to us. This may include phone numbers, driver license numbers, contact preferences, personal information stored on electronic devices, and payment information, including credit and debit card data. We gather and retain information about employees in the normal course of business. We may share information about such persons with vendors that assist with certain aspects of our business. In addition, our online operations depend upon the transmission of confidential information over the Internet, such as information permitting cashless payments.
We employ safeguards for the protection of this information and have made significant investments to secure access to our information technology network. For instance, we have implemented authentication protocols, installed firewalls and anti-virus/anti-malware software, conducted continuous risk assessments, and established data security breach preparedness and response plans. We also employ encryption and other methods to protect our data, promote security awareness with our associates and work with business partners in an effort to create secure and compliant systems.
15
However, these protections may be compromised as a result of third-party security breaches, burglaries, cyberattacks, errors by employees or employees of third-party vendors, or contractors, misappropriation of data by employees, vendors or unaffiliated third-parties, or other irregularities that may result in persons obtaining unauthorized access to company data.
Retail data frequently targeted by cybercriminals includes consumer credit card data, personally identifiable information, including social security numbers, and health care information. For retailers, point of sale and e-commerce websites are often attacked through compromised credentials, including those obtained through phishing, vishing and credential stuffing. Other methods of attack include advanced malware, the exploitation of software and operating vulnerabilities, and physical device tampering/skimming at card reader units. We believe these attack methods will continue to evolve.
Despite instituting controls for the protection of such information, no commercial or government entity can be entirely free of vulnerability to attack or compromise given that the techniques used to obtain unauthorized access, disable or degrade service change frequently. During the normal course of business, we have experienced and expect to continue to experience attempts to compromise our information systems. Unauthorized parties may attempt to gain access to our systems or facilities, or those of third parties with whom we do business, through fraud, trickery, or other forms of deception to employees, contractors, vendors and temporary staff. We may be unable to protect the integrity of our systems or company data. An alleged or actual unauthorized access or unauthorized disclosure of non-public personal information could:
• materially damage our reputation and brand, negatively affect customer satisfaction and loyalty, expose us to individual claims or consumer class actions, administrative, civil or criminal investigations or actions, and infringe on proprietary information; and
• cause us to incur substantial costs, including costs associated with remediation of information technology systems, customer protection costs and incentive payments for the maintenance of business relationships, litigation costs, lost revenues resulting from negative changes in consumer shopping patterns, unauthorized use of proprietary information or the failure to retain or attract customers following an attack. While we maintain insurance coverage that may, subject to policy terms and conditions, cover certain aspects of cyber risks, such insurance coverage may be unavailable or insufficient to cover all losses or all types of claims that may arise in the continually evolving area of cyber risk.
Supply Chain and Third-Party Risks
We depend on vendors and other sources of merchandise, goods and services outside the U.S. Our business could be affected by disruptions in, or other legal, regulatory, political, economic or public health issues associated with, our supply network.
We depend on vendors for timely and efficient access to products we sell. We source the majority of our merchandise from manufacturers located outside the U.S., primarily Asia. Current economic conditions may adversely impact our vendors and they may be unable to access financing or become insolvent and unable to supply us with products. Any major changes in tax policy, such as the disallowance of tax deductions for imported merchandise could have a material adverse effect on our business, results of operations and liquidity.
The procurement of all our goods and services is subject to the effects of price increases, which we may or may not be able to pass through to our customers. In addition, our procurement of goods and services from outside the U.S. is subject to risks associated with political or financial instability, trade restrictions, tariffs, currency exchange rates, transport capacity and costs, health pandemics and other factors relating to foreign trade. All of these factors may affect our ability to access suitable merchandise on acceptable terms, are beyond our control and could negatively affect our business, results of operations and liquidity.
The U.S. has been engaged in extended trade negotiations with China, which has resulted in the implementation of tariffs on a significant number of products manufactured in China and imported into the U.S. On May 10, 2019, the Trump Administration imposed a 25% tariff on approximately $200 billion worth of imports from China into the U.S. (the “Stage 3 Tariffs”), which imports include merchandise for both private-label and national brands sold in our stores. On August 1, 2019, the Trump Administration announced its intent to impose a 10% tariff on all remaining imports from China, valued at approximately $300 billion (the “Stage 4 Tariffs”), which imports also include merchandise sold in our stores. The proposed Stage 4 Tariffs were increased to 15% in August 2019 following retaliatory tariffs from China, and a portion of such 15% tariffs went into effect on September 1, 2019 (the “Stage 4A Tariffs”). Subsequently, in October
16
2019, the Trump Administration announced the suspension of the remaining new 15% tariffs (the “Stage 4B Tariffs”) following positive negotiations with China. On January 15, 2020, the U.S. and China signed an agreement known as the “Phase One” trade deal, pursuant to which, among other things, the Stage 3 Tariffs remained unchanged, the Stage 4A Tariffs were reduced from 15% to 7.5%, and the Stage 4B Tariffs were indefinitely suspended.
We continue to evaluate the impact of the effective tariffs, including potential future retaliatory tariffs, as well as other recent changes in foreign trade policy and the U.S. Administration on our supply chain, costs, sales and profitability, and are actively working through strategies to mitigate such impact, including reviewing sourcing options and working with our vendors and merchants. At this time, it is unknown how long U.S. tariffs on Chinese goods will remain in effect or whether additional tariffs will be imposed. Depending upon their duration and implementation, as well as our ability to mitigate their impact, these changes in foreign trade policy and any recently enacted, proposed and future tariffs on products imported by us from China could negatively impact our business, results of operations and liquidity if they seriously disrupt the movement of products through our supply chain or increase their cost. In addition, while we may be able to shift our sourcing options, executing such a shift would be time consuming and would be difficult or impracticable for many products and may result in an increase in our manufacturing costs. The adoption and expansion of trade restrictions, retaliatory tariffs, or other governmental action related to tariffs or international trade agreements or policies has the potential to adversely impact demand for our products, our costs, our customers, our suppliers, and/or the U.S. economy, which in turn could adversely impact our results of operations and business.
If our vendors, or any raw material vendors on which our vendors or our private label business relies, suffer prolonged manufacturing or transportation disruptions due to public health conditions or other unforeseen events, such as the COVID-19 pandemic, our ability to source product could be adversely impacted which would adversely affect our results of operations.
Disruption of global sourcing activities and quality and other concerns over our own brands could negatively impact brand reputation and earnings.
Economic and civil unrest in areas of the world where we source products, as well as shipping and dockage issues, could adversely impact the availability or cost of our products, or both. Most of the Company’s goods imported to the U.S. arrive from Asia through ports located on the U.S. west coast and are subject to potential disruption due to labor unrest, security issues or natural disasters affecting any or all of these ports. In addition, in recent years, we have substantially increased the number and types of merchandise that are sold under the Company’s proprietary brands. While we have focused on the quality of our proprietary branded products, we rely on third-parties to manufacture these products. Such third-party manufacturers may prove to be unreliable, the quality of our globally sourced products may vary from expectations and standards, the products may not meet applicable regulatory requirements which may require us to recall these products, or the products may infringe upon the intellectual property rights of third-parties. We face challenges in seeking indemnities from manufacturers of these products, including the uncertainty of recovering on such indemnity and the lack of understanding by manufacturers of U.S. product liability laws in certain foreign jurisdictions.
We also face concerns relating to human rights, working conditions and other labor rights and conditions and environmental impact in factories or countries where merchandise that we sell is produced and concerns about transparent sourcing and supply chains. We require all vendors for both private and national brands to comply with our vendor and supplier code of conduct, which outlines minimum standards to help ensure our merchandise is produced in workplaces free of abusive, exploitative or unsafe working conditions, and to comply with applicable laws and regulations of the United States and the country of manufacture or exportation. Although we have implemented policies and procedures designed to facilitate compliance with laws and regulations relating to production of merchandise, doing business in foreign countries and importing merchandise, and to screen, train and monitor our private label vendors to ensure safe and ethical treatment of workers in our supply chain, there can be no assurance that our vendors and other third parties with whom we do business will not violate such laws and regulations or our policies, which could subject us to liability and could adversely impact our reputation, results of operations and business.
Material disruptions in relationships with third-parties with whom the Company does business could adversely affect its operations.
The Company is a party to contracts, transactions and business relationships with various third parties, including suppliers, service providers, lenders and participants in joint ventures, strategic alliances and other commercial relationships. In some cases, we depend upon such third parties to provide products, services, advertising, technology infrastructure, development and support, data analytics, logistics, other goods and services to operate our business in the ordinary course, extensions of credit, credit card accounts and related receivables, and other matters. Furthermore, third-
17
party vendors may sell products directly to consumers in addition to, or in some cases in lieu of, traditional wholesale channels. As our business model depends on offering quality and relevant merchandise brands from third-party vendors in addition to our own private label products, any material disruption in our relationship with such vendors, or material disruption in the products or services provided by other third parties, could adversely affect our revenues, expense structure, earnings and operations.
Economic, Global, Legal and External Risks
The Company’s business is subject to discretionary consumer spending, unfavorable economic and political conditions, extreme violence and other related risks.
Our sales are significantly affected by discretionary spending by consumers. Consumer spending may be affected by many factors outside of our control, including general economic conditions, consumer disposable income levels, consumer confidence levels, the availability, cost and level of consumer debt, consumer behaviors towards incurring and paying debt, the cost of basic necessities and other goods, the strength of the U.S. Dollar relative to foreign currencies and the effects of the weather, natural disasters or health pandemics. These factors can have psychological or economic impacts on consumers that affect their discretionary spending habits. Any decline in discretionary spending by consumers could negatively affect our business and results of operations.
Unfavorable global, domestic or regional economic or political conditions and other developments and risks could negatively affect our business and results of operations. For example, unfavorable changes related to interest rates, rates of economic growth, fiscal and monetary policies of governments, inflation, deflation, tax rates and policy, unemployment trends, energy prices, and other matters that influence the availability and cost of merchandise, consumer confidence, spending and tourism could negatively affect our business and results of operations. Unstable political conditions, civil unrest, terrorist activities, armed conflicts or events of extreme violence may disrupt commerce and could negatively affect our business and results of operations.
Our business could be affected by extreme weather conditions, natural disasters or regional or global health pandemics.
Extreme weather conditions in the areas in which our stores are located could negatively affect our business and results of operations. For example, frequent or unusually heavy snowfall, ice storms, rainstorms or other extreme weather conditions over a prolonged period could make it difficult for our customers to travel to our stores and thereby reduce our sales and profitability. Our business is also susceptible to unseasonable weather conditions. For example, extended periods of unseasonably warm temperatures during the winter season or cool weather during the summer season could reduce demand for a portion of our inventory and thereby reduce our sales and profitability. In addition, extreme weather conditions could result in disruption or delay of production and delivery of materials and products in our supply chain and cause staffing shortages in our stores.
Natural disasters such as hurricanes, tornadoes and earthquakes, or a combination of these or other factors, could damage or destroy our facilities or make it difficult for customers to travel to our stores, thereby negatively affecting our business and results of operations.
Litigation, legislation, regulatory developments or non-compliance could adversely affect our business and results of operations.
We are subject to various federal, state and local laws, rules, regulations, inquiries and initiatives in connection with both our core business operations and our credit card and other ancillary operations (including the Credit Card Act of 2009 and the Dodd-Frank Wall Street Reform and Consumer Protection Act of 2010). Recent and future developments relating to such matters could increase our compliance costs and adversely affect the profitability of our credit card and other operations. Our effective tax rate is impacted by a number of factors, including changes in federal or state tax law, interpretation of existing laws and the ability to defend and support the tax positions taken on historical tax returns. Certain changes in any of these factors could materially impact the effective tax rate and net income.
We are also subject to anti-bribery, customs, child labor, truth-in-advertising and other laws, including consumer protection regulations and zoning and occupancy ordinances that regulate retailers generally and/or govern the importation, promotion and sale of merchandise and the operation of retail stores and warehouse facilities. Although we undertake to monitor changes in these laws, if these laws change without our knowledge, or are violated by importers, designers, manufacturers, distributors or agents, we could experience delays in shipments and receipt of goods or be subject to fines or other penalties under the controlling regulations, any of which could negatively affect our business
18
and results of operations. In addition, we are regularly involved in various litigation matters that arise in the ordinary course of our business. Adverse outcomes in current or future litigation could negatively affect our financial condition, results of operations and cash flows.
Changes in applicable environmental regulations, including increased or additional regulations to limit carbon emissions or other greenhouse gases may result in increased compliance costs, capital expenditures and other financial obligations which could affect our profitability.
In addition, our business is subject to complex and rapidly evolving laws addressing data privacy and data protection and companies are under increased regulatory scrutiny with respect to these matters. The Federal Trade Commission and many state attorneys general are interpreting federal and state consumer protection laws to impose standards for the online collection, use, dissemination and security of data. The interpretation and application of existing laws regarding data privacy and data protection are in flux and many states are considering new regulations in this area, The California Consumer Privacy Act (CCPA), California Privacy Rights Act (CPRA) and other applicable U.S. privacy laws or new state or federal laws may limit our ability to collect and use data, require us to modify our data processing practices or result in the possibility of fines, litigation or orders which may have an adverse effect on our business and results of operations. The burdens imposed by these and other laws and regulations that may be enacted, or new interpretations of existing laws and regulations, may also require us to incur substantial costs to reach compliance or change the manner in which we use data.
Our sales and operating results could be adversely affected by product safety concerns.
If the Company’s merchandise offerings do not meet applicable safety standards or consumers' expectations regarding safety, we could experience decreased sales, increased costs and/or be exposed to legal and reputational risk. Events that give rise to actual, potential or perceived product safety concerns could expose the Company to government enforcement action and/or private litigation. Reputational damage caused by real or perceived product safety concerns could negatively affect our business and results of operations.
Financial Risks
Inability to access capital markets could adversely affect our business or financial condition.
Changes in the credit and capital markets, including market disruptions, limited liquidity and interest rate fluctuations, may increase the cost of financing or restrict our access to this potential source of future liquidity. A downgrade in the ratings that rating agencies assign to the Company’s short- and long-term debt has and may continue to negatively impact our access to the debt capital markets and increase our cost of borrowing. In addition, our asset-based credit agreement requires us to maintain a specified fixed charge coverage ratio. Our ability to comply with the ratio may be affected by events beyond our control, including prevailing economic, financial and industry conditions. If our results of operations deteriorate to a point where we are not in compliance with our debt covenants, and we are unable to obtain a waiver, much of our debt would be in default and could become due and payable immediately. Our assets may not be sufficient to repay in full this indebtedness, resulting in a need for an alternate source of funding. We cannot make any assurances that we would be able to obtain such an alternate source of funding on satisfactory terms, if at all, and our inability to do so could cause the holders of our securities to experience a partial or total loss of their investments in the Company.
Our level of indebtedness may adversely affect our ability to operate our business, remain in compliance with debt covenants, react to changes in our business or the industry in which we operate, or prevent us from making payments on our indebtedness.
We have a significant amount of indebtedness. As of January 30, 2021, the aggregate principal amount of our total outstanding indebtedness was $4,906 million.
Our high level of indebtedness could have important consequences for the holders of our debt and equity securities. For example, it could:
• make it more difficult for us to satisfy our debt obligations;
• increase our vulnerability to general adverse economic and external conditions, including the COVID-19 pandemic;
• impair our ability to obtain additional debt or equity financing in the future for working capital, capital expenditures, acquisitions or general corporate or other purposes;
19
• require us to dedicate a material portion of our cash flows from operations to the payment of principal and interest on our indebtedness, thereby reducing the availability of our cash flows to fund working capital needs, capital expenditures, acquisitions and other general corporate purposes;
• expose us to the risk of increased interest rates to the extent we make borrowings under our asset-based credit agreement, which bear interest at a variable rate;
• limit our flexibility in planning for, or reacting to, changes in our business and the industry in which we operate;
• place us at a disadvantage compared to our competitors that have less indebtedness; and
• limit our ability to adjust to changing market conditions.
Any of these risks could materially impact our ability to fund our operations or limit our ability to expand our business, which could have a material adverse effect on our business, financial condition and results of operations.
Factors beyond our control could affect the Company’s stock price.
The Company’s stock price, like those of other retail companies, is subject to significant volatility because of many factors, including factors beyond our control. These factors may include:
• general economic, stock, credit and real estate market conditions;
• risks relating to the Company’s business and industry, including those discussed above;
• strategic actions by us or our competitors;
• adverse business announcements by our competitors;
• variations in our quarterly results of operations;
• future sales or purchases of the Company’s common stock; and
• investor perceptions of the investment opportunity associated with the Company’s common stock relative to other investment alternatives.
We may fail to meet the expectations of our stockholders or of analysts at some time in the future. If the analysts who regularly follow the Company’s stock lower their rating or lower their projections for future growth and financial performance, the Company’s stock price could decline. Also, sales of a substantial number of shares of the Company’s common stock in the public market or the appearance that these shares are available for sale could adversely affect the market price of the Company’s common stock.
Item 1B. Unresolved Staff Comments.
None.
Item 2. Properties.
The properties of the Company consist primarily of stores and related facilities, including a logistics network. The Company also owns or leases other properties, including corporate office space in New York and other facilities at which centralized operational support functions are conducted.
As of January 30, 2021, the operations of the Company included 727 store locations in 43 states, the District of Columbia, Puerto Rico and Guam, comprising a total of approximately 113 million square feet. At these locations, store boxes consisted of 328 owned boxes, 353 leased boxes, 105 boxes operated under arrangements where the Company owned the building and leased the land and three boxes of partly owned and partly leased buildings. All owned properties are held free and clear of mortgages. Certain properties secure the senior notes issued by the Company on June 8, 2020, as disclosed further in Item 7. Pursuant to various shopping center agreements, the Company is obligated to operate certain stores for periods of up to 15 years. Some of these agreements require that the stores be operated under a particular name. Most leases require the Company to pay real estate taxes, maintenance and other costs; some also require additional payments based on percentages of sales and some contain purchase options. Certain of the Company’s real estate leases have terms that extend for a significant number of years and provide for rental rates that increase or decrease over time.
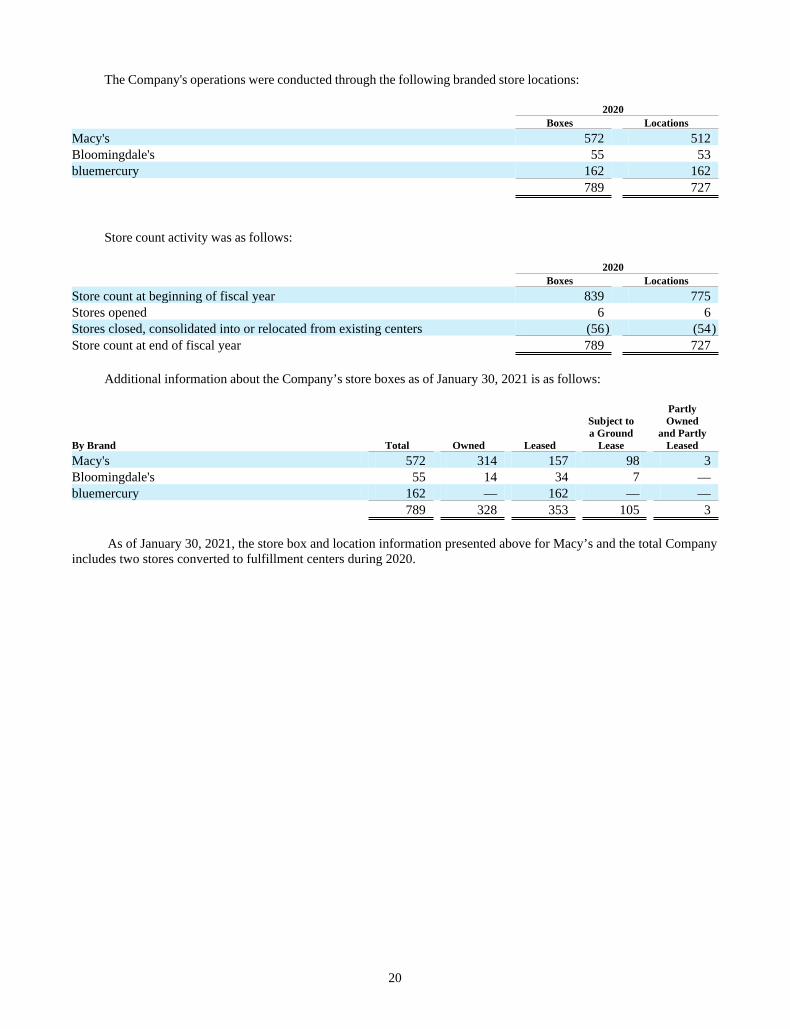
20
The Company's operations were conducted through the following branded store locations:
2020 Boxes Locations
Macy's 572 512 Bloomingdale's 55 53 bluemercury 162 162 789 727
Store count activity was as follows:
2020 Boxes Locations
Store count at beginning of fiscal year 839 775 Stores opened 6 6 Stores closed, consolidated into or relocated from existing centers (56) (54)Store count at end of fiscal year 789 727
Additional information about the Company’s store boxes as of January 30, 2021 is as follows:
By Brand Total Owned Leased
Subject toa Ground
Lease
PartlyOwned
and PartlyLeased
Macy's 572 314 157 98 3 Bloomingdale's 55 14 34 7 — bluemercury 162 — 162 — — 789 328 353 105 3
As of January 30, 2021, the store box and location information presented above for Macy’s and the total Company includes two stores converted to fulfillment centers during 2020.
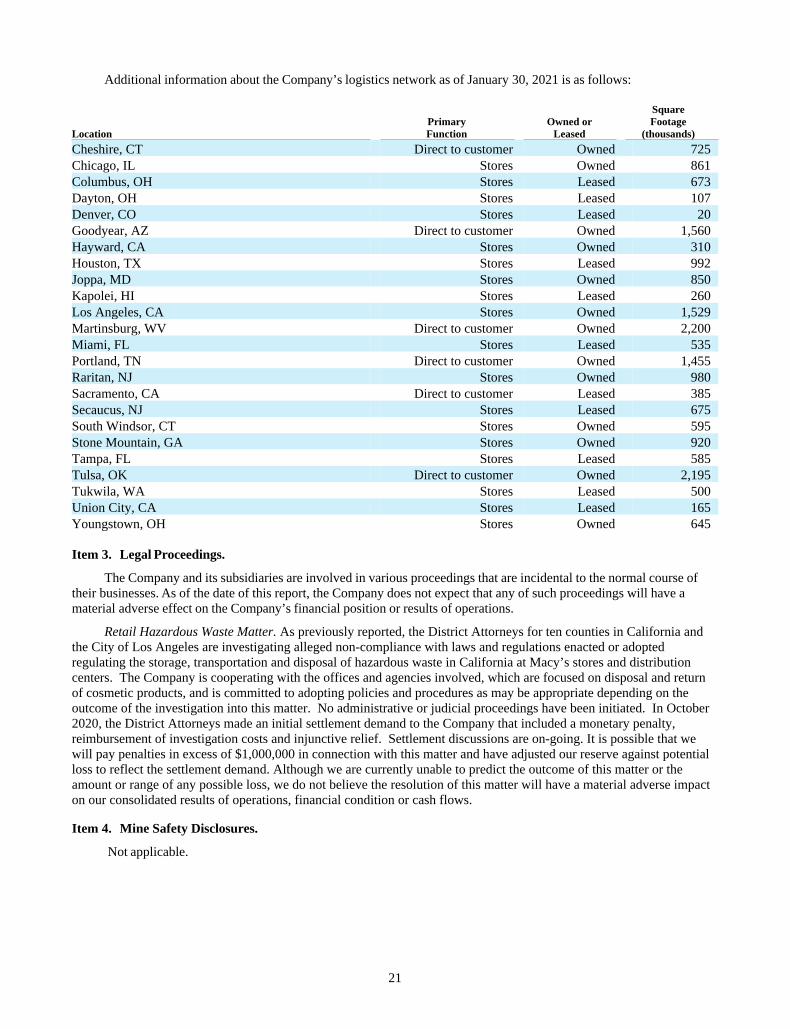
21
Additional information about the Company’s logistics network as of January 30, 2021 is as follows:
Location PrimaryFunction
Owned orLeased
SquareFootage
(thousands)
Cheshire, CT Direct to customer Owned 725 Chicago, IL Stores Owned 861 Columbus, OH Stores Leased 673 Dayton, OH Stores Leased 107 Denver, CO Stores Leased 20 Goodyear, AZ Direct to customer Owned 1,560 Hayward, CA Stores Owned 310 Houston, TX Stores Leased 992 Joppa, MD Stores Owned 850 Kapolei, HI Stores Leased 260 Los Angeles, CA Stores Owned 1,529 Martinsburg, WV Direct to customer Owned 2,200 Miami, FL Stores Leased 535 Portland, TN Direct to customer Owned 1,455 Raritan, NJ Stores Owned 980 Sacramento, CA Direct to customer Leased 385 Secaucus, NJ Stores Leased 675 South Windsor, CT Stores Owned 595 Stone Mountain, GA Stores Owned 920 Tampa, FL Stores Leased 585 Tulsa, OK Direct to customer Owned 2,195 Tukwila, WA Stores Leased 500 Union City, CA Stores Leased 165 Youngstown, OH Stores Owned 645
Item 3. Legal Proceedings.
The Company and its subsidiaries are involved in various proceedings that are incidental to the normal course of their businesses. As of the date of this report, the Company does not expect that any of such proceedings will have a material adverse effect on the Company’s financial position or results of operations.
Retail Hazardous Waste Matter. As previously reported, the District Attorneys for ten counties in California and the City of Los Angeles are investigating alleged non-compliance with laws and regulations enacted or adopted regulating the storage, transportation and disposal of hazardous waste in California at Macy’s stores and distribution centers. The Company is cooperating with the offices and agencies involved, which are focused on disposal and return of cosmetic products, and is committed to adopting policies and procedures as may be appropriate depending on the outcome of the investigation into this matter. No administrative or judicial proceedings have been initiated. In October 2020, the District Attorneys made an initial settlement demand to the Company that included a monetary penalty, reimbursement of investigation costs and injunctive relief. Settlement discussions are on-going. It is possible that we will pay penalties in excess of $1,000,000 in connection with this matter and have adjusted our reserve against potential loss to reflect the settlement demand. Although we are currently unable to predict the outcome of this matter or the amount or range of any possible loss, we do not believe the resolution of this matter will have a material adverse impact on our consolidated results of operations, financial condition or cash flows.
Item 4. Mine Safety Disclosures.
Not applicable.
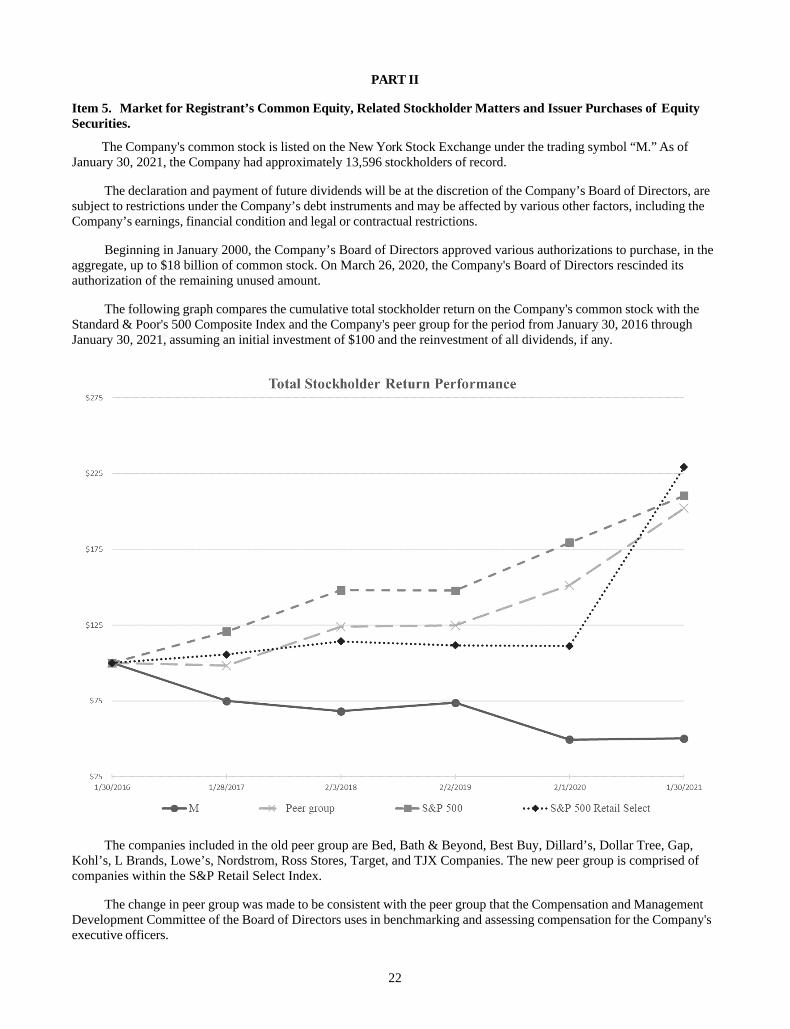
22
PART II
Item 5. Market for Registrant’s Common Equity, Related Stockholder Matters and Issuer Purchases of Equity Securities.
The Company's common stock is listed on the New York Stock Exchange under the trading symbol “M.” As of January 30, 2021, the Company had approximately 13,596 stockholders of record.
The declaration and payment of future dividends will be at the discretion of the Company’s Board of Directors, are subject to restrictions under the Company’s debt instruments and may be affected by various other factors, including the Company’s earnings, financial condition and legal or contractual restrictions.
Beginning in January 2000, the Company’s Board of Directors approved various authorizations to purchase, in the aggregate, up to $18 billion of common stock. On March 26, 2020, the Company's Board of Directors rescinded its authorization of the remaining unused amount.
The following graph compares the cumulative total stockholder return on the Company's common stock with the Standard & Poor's 500 Composite Index and the Company's peer group for the period from January 30, 2016 through January 30, 2021, assuming an initial investment of $100 and the reinvestment of all dividends, if any.
The companies included in the old peer group are Bed, Bath & Beyond, Best Buy, Dillard’s, Dollar Tree, Gap, Kohl’s, L Brands, Lowe’s, Nordstrom, Ross Stores, Target, and TJX Companies. The new peer group is comprised of companies within the S&P Retail Select Index.
The change in peer group was made to be consistent with the peer group that the Compensation and Management Development Committee of the Board of Directors uses in benchmarking and assessing compensation for the Company's executive officers.
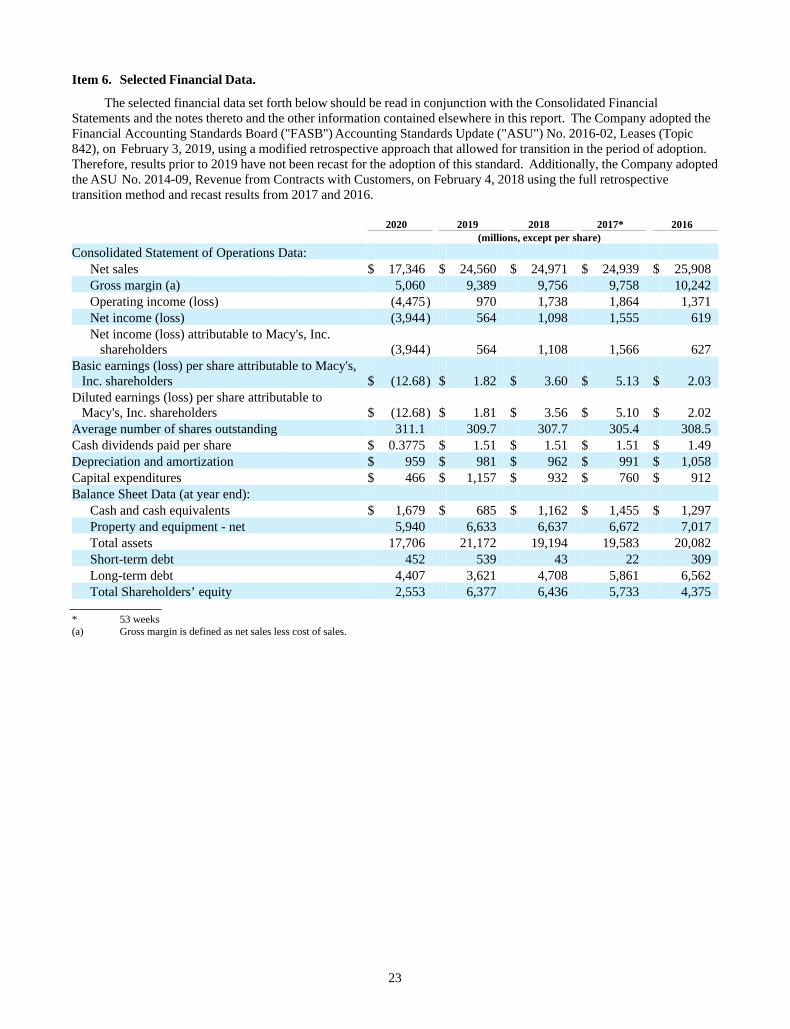
23
Item 6. Selected Financial Data.
The selected financial data set forth below should be read in conjunction with the Consolidated Financial Statements and the notes thereto and the other information contained elsewhere in this report. The Company adopted the Financial Accounting Standards Board ("FASB") Accounting Standards Update ("ASU") No. 2016-02, Leases (Topic 842), on February 3, 2019, using a modified retrospective approach that allowed for transition in the period of adoption. Therefore, results prior to 2019 have not been recast for the adoption of this standard. Additionally, the Company adopted the ASU No. 2014-09, Revenue from Contracts with Customers, on February 4, 2018 using the full retrospective transition method and recast results from 2017 and 2016.
2020 2019 2018 2017* 2016 (millions, except per share)
Consolidated Statement of Operations Data: Net sales $ 17,346 $ 24,560 $ 24,971 $ 24,939 $ 25,908 Gross margin (a) 5,060 9,389 9,756 9,758 10,242 Operating income (loss) (4,475) 970 1,738 1,864 1,371 Net income (loss) (3,944) 564 1,098 1,555 619 Net income (loss) attributable to Macy's, Inc. shareholders (3,944) 564 1,108 1,566 627
Basic earnings (loss) per share attributable to Macy's, Inc. shareholders $ (12.68) $ 1.82 $ 3.60 $ 5.13 $ 2.03 Diluted earnings (loss) per share attributable to Macy's, Inc. shareholders $ (12.68) $ 1.81 $ 3.56 $ 5.10 $ 2.02 Average number of shares outstanding 311.1 309.7 307.7 305.4 308.5 Cash dividends paid per share $ 0.3775 $ 1.51 $ 1.51 $ 1.51 $ 1.49 Depreciation and amortization $ 959 $ 981 $ 962 $ 991 $ 1,058 Capital expenditures $ 466 $ 1,157 $ 932 $ 760 $ 912 Balance Sheet Data (at year end):
Cash and cash equivalents $ 1,679 $ 685 $ 1,162 $ 1,455 $ 1,297 Property and equipment - net 5,940 6,633 6,637 6,672 7,017 Total assets 17,706 21,172 19,194 19,583 20,082 Short-term debt 452 539 43 22 309 Long-term debt 4,407 3,621 4,708 5,861 6,562 Total Shareholders’ equity 2,553 6,377 6,436 5,733 4,375
* 53 weeks(a) Gross margin is defined as net sales less cost of sales.
24
Item 7. Management’s Discussion and Analysis of Financial Condition and Results of Operations.
The discussion in this Item 7 should be read in conjunction with the Consolidated Financial Statements and the related notes included elsewhere in this report. The discussion in this Item 7 contains forward-looking statements that reflect the Company's plans, estimates and beliefs. The Company's actual results could materially differ from those discussed in these forward-looking statements. Factors that could cause or contribute to those differences include, but are not limited to, those discussed below and elsewhere in this report, particularly in “Risk Factors” and “Forward-Looking Statements.”
Company Overview
The Company is an omnichannel retail organization operating stores, websites and mobile applications under three brands (Macy's, Bloomingdale's and bluemercury) that sell a wide range of merchandise, including apparel and accessories (men's, women's and kids'), cosmetics, home furnishings and other consumer goods. As of January 30, 2021, the Company's operations were conducted through Macy's, Market by Macy’s, Macy’s Backstage, Bloomingdale’s, Bloomingdale’s The Outlet and bluemercury, which are aggregated into one reporting segment in accordance with the FASB Accounting Standards Codification (“ASC”) Topic 280, Segment Reporting.
Bloomingdale's in Dubai, United Arab Emirates and Al Zahra, Kuwait are operated under a license agreement with Al Tayer Insignia, a company of the Al Tayer Group, LLC.
COVID-19 Impact
In March 2020, the World Health Organization declared the outbreak of COVID-19 as a global pandemic, which continues to spread throughout the United States. The COVID-19 pandemic had a negative impact on the Company's 2020 operations and financial results, and the full financial impact of the pandemic cannot be reasonably estimated at this time due to uncertainty as to the severity and duration of the pandemic. The COVID-19 pandemic continues to cause significant disruption to organizations and communities across the globe. The Company is navigating through the pandemic with a focus on prudent cash management, strengthening liquidity and executing its strategic initiatives. In addition, as its stores began to reopen in the second quarter of 2020, the Company prioritized the implementation of significant health and safety measures to allow its customers and colleagues to feel safe in the Company's stores and facilities. In response to the operational and financial challenges caused by the COVID-19 pandemic, the specific steps taken by the Company to manage its business through this uncertain period, include, but are not limited to, the following.
• The Company temporarily closed all stores on March 18, 2020, which included all Macy’s, Bloomingdale’s, bluemercury, Macy’s Backstage, Bloomingdales the Outlet and Market by Macy’s stores. Stores began reopening on May 4, 2020 and substantially all of the Company's stores were open by the end of the second quarter of 2020.
• In an effort to increase liquidity, the Company fully drew on its $1,500 million credit facility, announced the suspension of quarterly cash dividends beginning in the second quarter of 2020 and took additional steps to reduce discretionary spending. The Company's Board of Directors also rescinded its authorization of any unused amounts under the Company's share repurchase program. In June 2020, the Company completed financing activities totaling nearly $4.5 billion and used a portion of the proceeds from these activities, as well as cash on hand, to repay its credit facility. To create greater flexibility for future liquidity needs, the Company executed an exchange offer and consent solicitation in July 2020 for $465 million of previously issued unsecured notes.
• To improve the Company's cash position and reduce its cash expenditures, the Company's Board of Directors and Chief Executive Officer did not receive compensation from April 1, 2020 through June 30, 2020. In addition, the Company deferred cash expenditures where possible and temporarily implemented a furlough for the majority of its colleague population which ended for most colleagues at the beginning of July 2020. Certain executives at the director level and above not impacted by the furlough took a temporary reduction of their pay through June 30, 2020.
• In June 2020, the Company announced a restructuring to align its cost base with anticipated near-term sales as the business recovers from the impact of the COVID-19 pandemic. The Company reduced corporate and management headcount by approximately 3,900. Additionally, the Company reduced staffing across its stores portfolio, supply chain and customer support network, which it expects to adjust as sales recover. During the second quarter of 2020, the Company recognized $154 million of expense for severance related to this reduction in force, of which substantially all has been paid as of January 30, 2021.
25
• During 2020, the Company deferred occupancy payments for a significant number of its stores. Such pandemic related deferrals were included in accounts payable and accrued liabilities and the Company continued to recognize expense during the deferral periods based on the contractual terms of the lease agreements. As of January 30, 2021, substantially all occupancy payment deferrals have been paid.
• During 2020, the Company incurred approximately $200 million of non-cash impairment charges primarily related to long-lived tangible and right of use assets to adjust the carrying value of certain store locations to their estimated fair value. The Company also incurred $3,080 million of non-cash impairment charges during 2020 on goodwill as a result of the sustained decline in the Company's market capitalization and decrease in projected cash flows primarily as a result of the COVID-19 pandemic.
• As a result of the COVID-19 pandemic, the Company implemented work-from-home policies for its colleagues except those involved in business critical activities and functions. Such policies are expected to remain in place for the duration of the pandemic. Post-pandemic, the Company may modify work environment policies which could impact the use of certain corporate assets. Such changes could lead to additional long-lived tangible and right of use corporate asset impairment.
• On March 27, 2020, the Coronavirus Aid, Relief, and Economic Security Act ("the CARES Act") was signed into law, which included payroll tax credits for employee retention, deferral of payroll taxes, and several income tax provisions, including modifications to the net interest deduction limitation, changes to certain property depreciation and carryback of certain operating losses.
The CARES Act impacted the Company's annual effective tax rate and the income tax benefit recognized during 2020. Specifically, the Company recognized an annual net operating loss that is available for carryback at a 35% federal income tax rate rather than the current 21% federal income tax rate. During 2020, the resultant benefit of this rate differential was offset by the impact of the non-tax deductible component of the goodwill impairment charge. The net impact of these items is the primary driver of the effective tax rate decrease when compared to 2019. As of January 30, 2021, the Company recognized a $520 million income tax receivable, which is included within Other Assets on the Consolidated Balance Sheets.
Under the terms of the Amended and Restated Credit Card Program Agreement (the “Program Agreement”) between the Company and Citibank, if sales decrease by more than 34% over a twelve-month period as compared to the Benchmark Year, defined as the twelve-month period from July 2006 to June 2007 in the Program Agreement, Citibank has the ability to provide written notice to terminate the agreement prior to the end of its current term. Based on the results for the Company’s February 2021 fiscal period, sales for the most recent twelve-month period ended February 27, 2021, have decreased by more than 34% as compared to the Benchmark Year. We are in on-going discussions with Citibank concerning the Program Agreement and as of the date of this filing, the Company has not received a notice to terminate the agreement. The Company is currently unable to estimate any impact this event might have on the Program Agreement or on the Company’s future financial results.
The COVID-19 pandemic has had and continues to have a material adverse impact on the Company's operational performance, financial results and cash flows, although the full impact will depend on future developments, including the continued spread and duration of the outbreak, variant strains of COVID-19, the availability and distribution of effective medical treatments or vaccines as well as any related federal, state or local governmental orders or restrictions, all of which are highly uncertain and cannot be predicted.
Management Overview
2020 was a year of unprecedented challenges and required the Company to adapt its business to address the disruption caused by the COVID-19 pandemic. Faced with the temporary closure of stores and changes in consumer shopping behaviors, the Company had to right-size its cost base and operating model, offer new fulfillment options to customers, focus on product categories with higher consumer demand, and accelerate its focus on digital shopping and underlying investments to support these trends. Financial results in the first and second quarter of 2020 were significantly impacted by the COVID-19 pandemic but the Company saw sequential improvement in its operating results during the third and fourth quarters of 2020. Although uncertainty surrounds the continued impact of the COVID-19 pandemic, the Company has positioned itself to focus on the recovery of its business in 2021 and execute on its corporate strategy for profitable growth in the future.
26
2020 Financial Highlights
Specific 2020 Macy's, Inc. financial performance included:
• Net sales were significantly impacted by the COVID-19 pandemic and were $17,346 million in 2020, as compared to $24,560 million in 2019, a decrease of 29.4%.
• Comparable sales on an owned basis and on an owned plus licensed basis decreased 27.9%.
• Driven by changes in consumer shopping behaviors due to the COVID-19 pandemic, digital sales increased to 44.3% of net sales, compared to 25.3% in 2019.
• The gross margin rate for 2020 was 29.2%, a decrease of 900 basis points compared to 2019.
• SG&A expenses decreased approximately 24.8% from 2019 and SG&A as a percent of sales was higher in 2020 by approximately 240 basis points, illustrating efficient expense management and improved colleague productivity in stores.
• Cash and non-cash restructuring, impairment, store closings and other costs were $3,579 million, driven by the recognition of non-cash impairment charges and implementation of restructuring activities to respond to the COVID-19 pandemic.
• Earnings before interest, taxes, depreciation and amortization excluding restructuring, impairment, store closings and other costs and settlement charges ("Adjusted EBITDA") was $117 million in 2020, as compared to $2,336 million in 2019.
• Diluted loss per share was $12.68 compared to diluted earnings per share of $1.81 in 2019. Excluding restructuring, impairment, store closings and other costs, settlement charges, financing costs and losses on early retirement of debt, adjusted diluted loss per share attributable to Macy's, Inc. shareholders was $2.21 compared to diluted earnings per share attributable to Macy’s, Inc. shareholders of $2.91 in 2019.
• The Company ended 2020 in a strong liquidity position with approximately $1.7 billion in cash and cash equivalents and approximately $3.0 billion of untapped capacity in the Company’s asset-based credit facility.
• Merchandise inventories were down 27.3% at the end of 2020 compared to the end of 2019. The Company exited 2020 in a clean inventory position.
See pages 36 to 39 for reconciliations of the non-GAAP financial measures presented above to the most comparable U.S. generally accepted accounting principles ("GAAP") financial measures and other important information.
Polaris Strategy
On February 4, 2020, Macy’s, Inc. announced its Polaris strategy, a multi-year plan designed to stabilize profitability and position the Company for sustainable, profitable growth. Over the course of the COVID-19 pandemic, the Company has refined the components of the Polaris strategy to focus where the Company can drive competitive advantage and differentiation to first recover the business and then drive both top- and bottom-line growth. The Polaris strategy was designed for flexibility and this was greatly tested in 2020. Although the Company’s operations were significantly impacted by the COVID-19 pandemic in 2020, the Polaris strategy proved durable and allowed for a number of accomplishments in 2020, notably:
• Increasing relevance by introducing new customers to the Macy’s brand. During 2020, Macy’s saw a 45% increase in active bronze memberships in its Star Rewards loyalty program. This increase partially offset the overall drop in active Star Rewards members, which was caused by declines in Macy’s upper loyalty program tiers. In addition, the Company launched Macy’s Media Network in 2020, a new fashion and beauty advertising platform providing a new income stream.
• In response to the pandemic and consumer behavior, the Company expanded merchandise assortments in categories such as home, outdoor furniture, loungewear and active. In addition, new categories were added to meet emerging demand, including baby gear and skin care devices, home fragrances, outdoor recreation and
27
gourmet food. In total, the Company added more than 1,000 new brands to meet the demands of customers in this ever-changing environment.
• Given the significant shift to digital shopping in 2020 that is expected to be permanent in nature, the Company accelerated its focus on and investments in digital shopping. During 2020, the Company quickly launched a curb-side pick-up fulfillment option and improved the integration of its digital and physical assets as well as the design of its digital platforms to improve customers’ shopping experiences. This focus on optimizing customers’ omnichannel experience will continue and the Company has and will continue to utilize its entire network of stores, distribution centers and vendor-direct programs to fill customer orders.
• Through the initial Polaris restructuring efforts in February 2020 and those executed in July 2020 in response to the COVID-19 pandemic, the Company exited 2020 with an annualized run-rate cost savings of approximately $900 million that is expected to be permanent in nature. Through focus on rigorous expense reduction, prudent cash management and execution of its 2020 financing activities, the Company ended 2020 with significant liquidity to help fund the recovery of its business and the necessary investments to execute on the Polaris strategy.
While the underlying components of the Polaris strategy are unchanged from those presented in February 2020, the components were refined during 2020 to align with customer demands in the COVID-19 pandemic environment as well as expected consumer behavior post-pandemic. The following are the key pillars of the Polaris strategy:
• Win With Fashion and Style: Delivering fashion and style that meets core and new customer needs for all occasions through existing and new retail platforms. The Company is focusing on the transformation of its assortment architecture, fashion curation, inventory productivity, and vendor relationships to support these changes.
• Deliver Clear Value: Build trust and deliver value to customers through simple, easy-to-understand pricing and promotions driven by advanced analytics. The Company intends to deepen core and new customer engagement through a personalized loyalty program as well as personalized communication and customer experiences across all touchpoints.
• Excel in Digital Shopping: Deliver profitable omnichannel growth by investing in a modern, frictionless digital shopping journey, supported by a seamless user experience, immersive category-level experiences and a convenient delivery and returns experience that is fully connected to stores. To support these efforts, the Company will focus on enhancements to product discovery, the checkout process and launch of new digital business models.
• Enhance Store Experience: Create a tech-enabled, connected omni-ecosystem that supports reimagined store experiences focused on discovery, convenience, service and engagement; delivered through a streamlined stores portfolio and new off-mall formats. The Company will enhance the connection between its store and digital channels by elevating customer experience standards across the organization, enhancing fulfillment options and providing convenience no matter where the customer shops.
• Modernize Supply Chain: The Company is moving towards a faster and more efficient customer fulfillment infrastructure by optimizing its network to profitably support the expected continued growth in digital and provide enhanced customer delivery options to create a convenient, fast and efficient customer experience for delivery and returns.
• Enable Transformation: Enabling and accelerating the Company’s core priorities through foundational improvements by modernizing technology platforms to support and enable growth, embedding data and analytics into every aspect of the Company’s business and defining and creating a performance-driven operation model that sets the tone, pace and expectations across the business to execute against the Polaris strategy.
Presentation of Information
The discussion that follows includes a comparison of our results of operations and liquidity and capital resources for the fiscal years ended January 30, 2021 and February 1, 2020. For a discussion of changes from the fiscal year ended February 1, 2020 to February 2, 2019, refer to Management's Discussion and Analysis of Financial Condition and Results
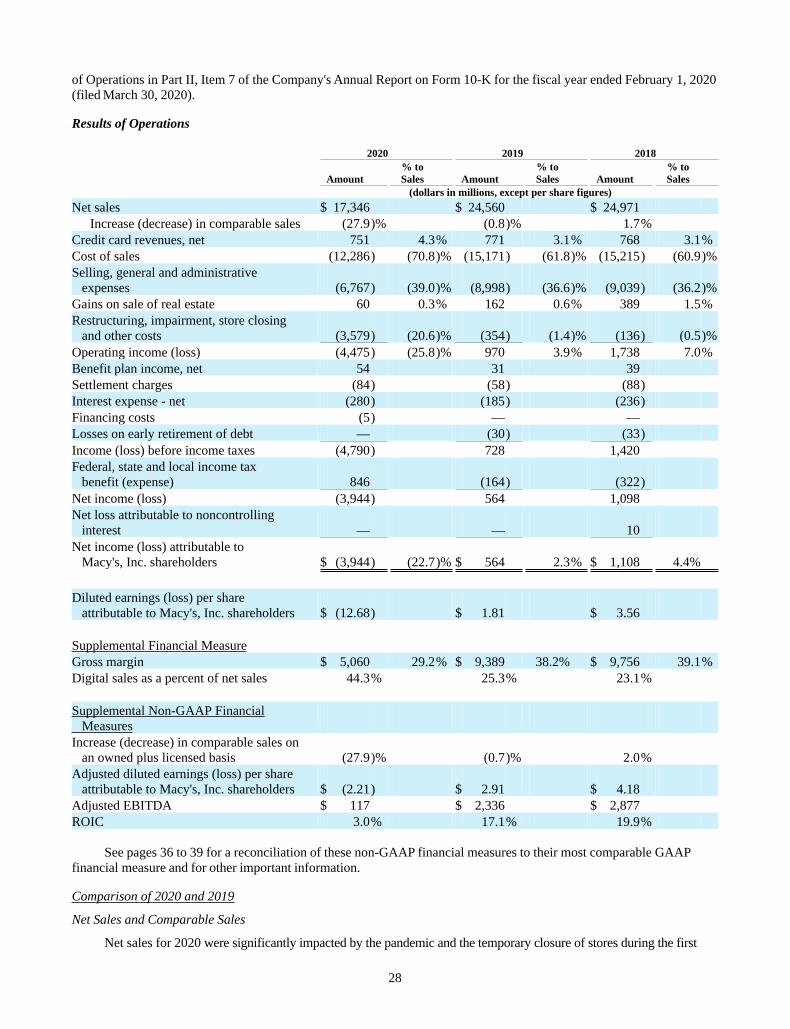
28
of Operations in Part II, Item 7 of the Company's Annual Report on Form 10-K for the fiscal year ended February 1, 2020 (filed March 30, 2020).
Results of Operations
2020 2019 2018
Amount % toSales Amount
% toSales Amount
% toSales
(dollars in millions, except per share figures)
Net sales $ 17,346 $ 24,560 $ 24,971 Increase (decrease) in comparable sales (27.9)% (0.8)% 1.7%
Credit card revenues, net 751 4.3% 771 3.1% 768 3.1%Cost of sales (12,286) (70.8)% (15,171) (61.8)% (15,215) (60.9)%Selling, general and administrative expenses (6,767) (39.0)% (8,998) (36.6)% (9,039) (36.2)%Gains on sale of real estate 60 0.3% 162 0.6% 389 1.5%Restructuring, impairment, store closing and other costs (3,579) (20.6)% (354) (1.4)% (136) (0.5)%Operating income (loss) (4,475) (25.8)% 970 3.9% 1,738 7.0%Benefit plan income, net 54 31 39 Settlement charges (84) (58) (88) Interest expense - net (280) (185) (236) Financing costs (5) — — Losses on early retirement of debt — (30) (33) Income (loss) before income taxes (4,790) 728 1,420 Federal, state and local income tax benefit (expense) 846 (164) (322) Net income (loss) (3,944) 564 1,098 Net loss attributable to noncontrolling interest — — 10 Net income (loss) attributable to Macy's, Inc. shareholders $ (3,944) (22.7)% $ 564 2.3% $ 1,108 4.4%
Diluted earnings (loss) per share attributable to Macy's, Inc. shareholders $ (12.68) $ 1.81 $ 3.56 Supplemental Financial Measure Gross margin $ 5,060 29.2% $ 9,389 38.2% $ 9,756 39.1%Digital sales as a percent of net sales 44.3% 25.3% 23.1% Supplemental Non-GAAP Financial Measures Increase (decrease) in comparable sales on an owned plus licensed basis (27.9)% (0.7)% 2.0% Adjusted diluted earnings (loss) per share attributable to Macy's, Inc. shareholders $ (2.21) $ 2.91 $ 4.18 Adjusted EBITDA $ 117 $ 2,336 $ 2,877 ROIC 3.0% 17.1% 19.9%
See pages 36 to 39 for a reconciliation of these non-GAAP financial measures to their most comparable GAAP financial measure and for other important information.
Comparison of 2020 and 2019
Net Sales and Comparable Sales
Net sales for 2020 were significantly impacted by the pandemic and the temporary closure of stores during the first
29
and second quarters. For 2020, net sales were $17,346 million, a decrease of $7,214 million, or 29.4%, from 2019. The decrease in comparable sales on an owned basis and on an owned plus licensed basis for 2020 was 27.9% compared to 2019. Driven by changes in consumer shopping behavior and the COVID-19 pandemic, digital sales grew significantly in 2020, with digital sales as a percent of net sales increasing to 44.3% from 25.3% in 2019. By family of business, home, fine jewelry and watches, fragrances, activewear and sleepwear performed well during 2020 as customers began to work, cook, dine and learn from home due to the pandemic. Driven by these changes to consumer behaviors, sales in 2020 were weaker in apparel categories such as dresses, women's and men’s sportswear and men’s tailored.
Credit Card Revenues, Net
Net credit card revenues were $751 million for 2020, a decrease of $20 million compared to $771 million recognized in 2019. Credit card penetration declined in 2020 to approximately 43% from approximately 47% in 2019. Combined with a decline in new accounts driven by temporary store closures, this decrease in credit sales drove the decrease in net credit card revenues. This was offset by an increase in profit share revenues associated with the underlying credit card portfolio performance, which was driven by improved bad debt activity and delinquencies.
Cost of Sales and Gross Margin
Cost of sales for 2020 decreased $2,885 million from 2019. The cost of sales rate as a percent to net sales of 70.8% in 2020 increased 900 basis points compared to 2019. The gross margin rate in 2020 was 29.2% compared to 38.2% in 2019. The increase in the cost of sales rate as a percent to net sales and the decrease in the gross margin rate were primarily due to increased markdowns in the first and second quarters of 2020. Higher delivery expenses associated with the increase in digital sales as well as carrier surcharges that the Company incurred in the fourth quarter of 2020 also contributed to these results.
SG&A Expenses
SG&A expenses for 2020 decreased $2,231 million and the SG&A rate as a percent to net sales increased 240 basis points, to 39.0%, from to 2019. The decrease in SG&A expenses is a reflection of lower sales as well as the implementation of various expense management strategies undertaken in response to the COVID-19 pandemic. These strategies include the July 2020 restructuring, a significant reduction in discretionary spending and the colleague furlough implemented in 2020.
Gains on Sale of Real Estate
The Company recognized gains of $60 million in 2020 associated with real estate sales, as compared to $162 million in 2019. 2019 included a gain of $52 million associated with the sale of the Macy's Downtown Seattle location.
Restructuring, Impairment, Store Closing and Other Costs
Restructuring, impairment, store closing and other costs for 2020 of $3,579 million included goodwill and asset impairment charges, severance and other human resource-related costs, and other costs associated with organizational changes and store closings, driven by the impacts of the COVID-19 pandemic. 2019 costs of $354 million included costs primarily associated with the Polaris strategy, including $161 million of non-cash impairment charges associated with store closures and campus consolidations and $157 million related to severance and other human resource-related costs.
Benefit Plan Income, Net
2020 and 2019 included $54 million and $31 million, respectively, of non-cash net benefit plan income relating to the Company's defined benefit plans. This income includes the net of: interest cost, expected return on plan assets and amortization of prior service costs or credits and actuarial gains and losses.
Settlement Charges
$84 million and $58 million of non-cash settlement charges were recognized in 2020 and 2019, respectively. These charges relate to the pro-rata recognition of net actuarial losses associated with the Company’s defined benefit retirement plans and are the result of lump sum distributions associated with retiree distribution elections and restructuring activity.
30
Net Interest Expense
Net interest expense, excluding financing costs and losses on early retirement of debt, for 2020 increased $95 million from 2019 to $280 million. This increase was primarily driven by the financing activities executed by the Company in June 2020 in response to the COVID-19 pandemic.
Losses on Early Retirement of Debt
In 2019, the Company completed a tender offer debt repurchase of $525 million of senior notes and debentures. As a result of these transactions, the Company recognized $30 million in expenses and fees.
Effective Tax Rate
The Company's effective tax rate was 17.7% for 2020 and 22.5% for 2019 compared to the federal income tax statutory rate of 21%. The effective tax rate in 2020 was impacted by the non-tax deductible component of the Company’s goodwill impairment charge, which was largely offset by the benefit associated with the carryback of net operating losses permitted under the CARES Act . The effective tax rate in 2019 was impacted by the settlement of certain state and local tax matters.
Net Income (Loss) Attributable to Macy's, Inc. Shareholders
Net loss attributable to Macy's, Inc. shareholders for 2020 decreased $4,508 million to $3,944 million, compared to 2019, driven by lower operating results resulting from the impact of the COVID-19 pandemic and goodwill impairment charges.
Guidance
The Company expects the COVID-19 pandemic to have a material impact on its financial condition, results of operations and cash flows from operations in future periods. The extent of the impact of the COVID-19 pandemic on the Company's operational and financial performance depends on future developments outside of the Company's control, including the duration and spread of the pandemic and related actions taken by federal, state and local government officials, and international governments to prevent disease spread. On February 23, 2021, the Company disclosed in its release of preliminary earnings its performance expectations for 2021, while acknowledging the significant uncertainty surrounding consumer behavior and economic conditions in the current environment. The Company’s annual guidance contemplates continued pandemic-related challenges in the spring season with momentum building in the back half of 2021.For a more complete discussion of the COVID-19 pandemic related risks facing the Company's business, refer to Item 1A, “Risk Factors.”
• Net sales between $19.75 billion to $20.75 billion, an increase between approximately 14% and 20% compared to 2020. Digital sales are expected to approximate 35% of net sales.
• Credit card revenues, net, approximately 3% of net sales
• Gross margin rate to increase by high-single digit percentage points, up to 37%
• SG&A expenses as a percentage of net sales to increase approximately 75 to 100 basis points compared to 2019 levels
• Gains on sale of real estate between $60 million and $90 million
• Benefit plan income of approximately $60 million
• Depreciation and amortization expense of approximately $900 million
• Adjusted EBITDA between 7% and 7.5% of net sales
• Net interest expense of approximately $325 million
• An adjusted tax rate of approximately 23.25%
• Diluted shares outstanding of approximately 318 million
• Adjusted diluted earnings per share between $0.40 and $0.90
• Capital expenditures of approximately $650 million
31
Cash Flow, Liquidity and Capital Resources
The Company's principal sources of liquidity are cash from operations, cash on hand and the asset based credit facility described below.
Because of the COVID-19 outbreak, there is significant uncertainty surrounding the potential impact on the Company's results of operations and cash flows. The Company’s liquidity was negatively impacted by store closures. The Company proactively took steps to increase available cash on hand including, but not limited to, targeted reductions in discretionary operating expenses and capital expenditures, suspension of the Company's quarterly dividend and executing additional financing transactions during the second quarter of 2020 as discussed in more detail below. While the Company has obtained additional financing, due the uncertainty of the COVID-19 pandemic, further actions may be required to improve the Company’s cash position, including but not limited to, monetizing Company assets, reinstituting colleague furloughs, and foregoing capital expenditures and other discretionary expenses.
Operating Activities
Net cash provided by operating activities was $649 million in 2020 compared to $1,608 million in 2019. The decline was driven by lower EBITDA, which was partially offset by lower tax payments and a net improvement in merchandise inventory and payables.
Investing Activities
Net cash used by investing activities for 2020 was $325 million, compared to $1,002 million for 2019. Investing activities for 2020 included purchases of property and equipment totaling $338 million and capitalized software of $128 million, compared to purchases of property and equipment totaling $902 million and capitalized software of $255 million for 2019. In addition, property and equipment sales, primarily related to real estate, generated cash proceeds of $113 million in 2020 compared to $185 million in 2019.
Financing Activities
Net cash provided by the Company for financing activities was $699 million for 2020, including debt issued of $2,780 million related to a $1,500 million draw on its revolving credit agreement and issuance of $1,300 million 8.375% senior secured notes, partially offset by repayment of the $1,500 million revolving credit facility draw and the approximate $530 million repayment of debt at maturity. 2020 also included $117 million of cash dividends paid.
Net cash used by the Company for financing activities was $1,123 million for 2019, including the repayment of $597 million of debt and the payment of $466 million of cash dividends. 2019 debt repayments included the repayment at maturity of $36 million of 8.5% senior debentures.
Secured Debt Issuance
On June 8, 2020, the Company issued $1,300 million aggregate principal amount of 8.375% senior secured notes due 2025 (the "Notes"). The Notes bear interest at a rate of 8.375% per annum, which accrues from June 8, 2020 and is payable in arrears on June 15 and December 15 of each year. The Notes mature on June 15, 2025, unless earlier redeemed or repurchased, and are subject to the terms and conditions set forth in the related indenture. The Notes were issued by Macy’s, Inc. and are secured on a first-priority basis by (i) a first mortgage/deed of trust in certain real property of subsidiaries of Macy’s, Inc. that was transferred to subsidiaries of Macy’s Propco Holdings, LLC, a newly created direct, wholly owned subsidiary of Macy’s, Inc. (“Propco”), and (ii) a pledge by Propco of the equity interests in its subsidiaries that own such transferred real property. The Notes are, jointly and severally, unconditionally guaranteed on a secured basis by Propco and its subsidiaries and unconditionally guaranteed on an unsecured basis by Macy’s Retail Holdings, LLC (f/k/a Macy’s Retail Holdings, Inc.) (“MRH”), a direct, wholly owned subsidiary of Macy’s, Inc. The Company used the proceeds of the Notes offering, along with cash on hand, to repay the outstanding borrowings under the existing $1,500 million unsecured credit agreement.
Entry into Asset-Based Credit Facility
On June 8, 2020, Macy’s Inventory Funding LLC (the “ABL Borrower”), an indirect wholly owned subsidiary of the Company, and its parent, Macy’s Inventory Holdings LLC (the “ABL Parent”), entered into an asset-based credit agreement (“the ABL Credit Facility”) with Bank of America, N.A., as administrative agent and collateral agent, and the lenders party thereto. As of January 30, 2021, the ABL Credit Facility provides the ABL Borrower with a $2,941 million revolving credit facility (the “Revolving ABL Facility”), including a swingline sub-facility and a letter of credit sub-
32
facility. The ABL Borrower may request increases in the size of the Revolving ABL Facility up to an additional aggregate principal amount of $750 million. As of January 30, 2021, the Company had $142 million of standby letters of credit outstanding under the ABL Credit Facility, which reduces the available borrowing capacity. The Company had no borrowings outstanding under the ABL Credit Facility as of January 30, 2021.
Additionally on June 8, 2020 and concurrently with closing the ABL Credit Facility, the ABL Borrower purchased all presently existing inventory, and assumed the liabilities in respect of all presently existing and outstanding trade payables owed to vendors in respect of such inventory, from MRH and certain wholly owned subsidiaries of MRH. The ABL Credit Facility is secured on a first priority basis (subject to customary exceptions) by (i) all assets of the ABL Borrower including all such inventory and the proceeds thereof and (ii) the equity of the ABL Borrower. The ABL Parent guaranteed the ABL Borrower’s obligations under the ABL Credit Facility. The Revolving ABL Facility matures on May 9, 2024.
The ABL Credit Facility contains customary borrowing conditions including a borrowing base equal to the sum of (a) 80% (which shall automatically increase to 90% upon the satisfaction of certain conditions, including the delivery of an initial appraisal of the inventory) of the net orderly liquidation percentage of eligible inventory, minus (b) customary reserves. Amounts borrowed under the ABL Credit Facility are subject to interest at a rate per annum equal to (i) prior to the Step Down Date (as defined in the ABL Credit Facility), at the ABL Borrower’s option, either (a) adjusted LIBOR plus a margin of 2.75% to 3.00% or (b) a base rate plus a margin of 1.75% to 2.00%, in each case depending on revolving line utilization and (ii) after the Step Down Date, at the ABL Borrower’s option, either (a) adjusted LIBOR plus a margin of 2.25% to 2.50% or (b) a base rate plus a margin of 1.25% to 1.50%, in each case depending on revolving line utilization. The ABL Credit Facility also contains customary covenants that provide for, among other things, limitations on indebtedness, liens, fundamental changes, restricted payments, cash hoarding, and prepayment of certain indebtedness as well as customary representations and warranties and events of default typical for credit facilities of this type.
The ABL Credit Facility also requires (1) the Company and its restricted subsidiaries to maintain a fixed charge coverage ratio of at least 1.00 to 1.00 as of the end of any fiscal quarter on or after April 30, 2021 if (a) certain events of default have occurred and are continuing or (b) Availability plus Suppressed Availability (each as defined in the ABL Credit Facility) is less than the greater of (x) 10% of the Loan Cap (as defined in the ABL Credit Facility) and (y) $250 million, in each case, as of the end of such fiscal quarter and (2) prior to April 30, 2021, that the ABL Borrower not permit Availability plus Suppressed Availability to be lower than the greater of (x) 10% of the Loan Cap and (y) $250 million.
Amendment to Existing Credit Agreement
On June 8, 2020, the Company substantially reduced the credit commitments of its existing $1,500 million unsecured credit agreement, which as of January 30, 2021, provides the Company with unsecured revolving credit of up to $1 million. The unsecured revolving credit facility contains covenants that provide for, among other things, limitations on fundamental changes, use of proceeds, and maintenance of property, as well as customary representations and warranties and events of default. In conjunction with this amendment, the interest coverage ratio and leverage ratio were eliminated as covenant requirements. As of January 30, 2021, the Company had no borrowings outstanding under the credit agreement.
Exchange Offers and Consent Solicitations for Certain Outstanding Debt Securities of MRH
During the second quarter of 2020, MRH completed exchange offers (each, an “Exchange Offer” and, collectively, the “Exchange Offers”) with eligible holders and received related consents in consent solicitations for each series of notes as follows:
(i) $81 million aggregate principal amount of 6.65% Senior Secured Debentures due 2024 (“New 2024 Notes”) issued by MRH for validly tendered (and not validly withdrawn) outstanding 6.65% Senior Debentures due 2024 issued by MRH (“Old 2024 Notes”);(ii) $74 million aggregate principal amount of 6.7% Senior Secured Debentures due 2028 (“New 2028 Notes”) issued by MRH for validly tendered (and not validly withdrawn) outstanding 6.7% Senior Debentures due 2028 issued by MRH (“Old 2028 Notes”);(iii) $13 million aggregate principal amount of 8.75% Senior Secured Debentures due 2029 (“New 2029 Notes”) issued by MRH for validly tendered (and not validly withdrawn) outstanding 8.75% Senior Debentures due 2029 issued by MRH (“Old 2029 Notes”);
33
(iv) $5 million aggregate principal amount of 7.875% Senior Secured Debentures due 2030 (“New 2030 Notes”) issued by MRH for validly tendered (and not validly withdrawn) outstanding 7.875% Senior Debentures due 2030 issued by MRH (“Old 2030 Notes”); (v) $5 million aggregate principal amount of 6.9% Senior Secured Debentures due 2032 (“New 2032 Notes”) issued by MRH for validly tendered (and not validly withdrawn) outstanding 6.9% Senior Debentures due 2032 issued by MRH (“Old 2032 Notes”); and (vi) $183 million aggregate principal amount of 6.7% Senior Secured Debentures due 2034 (“New 2034 Notes” and, together with the New 2024 Notes, New 2028 Notes, New 2029 Notes, New 2030 Notes and New 2032 Notes, the “New Notes” and each series, a “series of New Notes”) issued by MRH for validly tendered (and not validly withdrawn) outstanding 6.7% Senior Debentures due 2034 issued by MRH (“Old 2034 Notes” and, together with the Old 2024 Notes, Old 2028 Notes, Old 2029 Notes, Old 2030 Notes and Old 2032 Notes, the “Old Notes” and each series, a “series of Old Notes”).
Each New Note issued in the Exchange Offers for a validly tendered Old Note has an interest rate and maturity date that is identical to the interest rate and maturity date of the tendered Old Note, as well as identical interest payment dates and optional redemption prices. The New Notes are MRH’s and Macy’s general, senior obligations and are secured by a second-priority lien on the same collateral securing the Notes. Following the settlement, the aggregate principal amounts of each series of Old Notes outstanding are: (i) $41 million Old 2024 Notes, (ii) $29 million Old 2028 Notes, (iii) $5 million Old 2030 Notes, (iv) $12 million Old 2032 Notes and (v) $18 million Old 2034 Notes.
In addition, MRH solicited and received consents from holders of each series of Old Notes (each, a “Consent Solicitation” and, collectively, the “Consent Solicitations”) pursuant to a separate Consent Solicitation Statement to adopt certain proposed amendments to the indenture governing the Old Notes (the “Existing Indenture”) to conform certain provisions in the negative pledge covenant in the Existing Indenture to the provisions of the negative pledge covenant in MRH’s most recent indenture (the “Proposed Amendments”). MRH received consents from holders of (i) $85 million aggregate principal amount of outstanding Old 2024 Notes, (ii) $77 million aggregate principal amount of outstanding Old 2028 Notes, (iii) $13 million aggregate principal amount of outstanding Old 2029 Notes, (iv) $5 million aggregate principal amount of outstanding Old 2030 Notes, (v) $6 million aggregate principal amount of outstanding Old 2032 Notes and (vi) $185 million aggregate principal amount of outstanding Old 2034 Notes.
At January 30, 2021, no notes or debentures contained provisions requiring acceleration of payment upon a debt rating downgrade. However, the terms of approximately $4,159 million in aggregate principal amount of the Company's senior notes outstanding at that date require the Company to offer to purchase such notes at a price equal to 101% of their principal amount plus accrued and unpaid interest if there is both a change of control (as defined in the applicable indenture) of the Company and the notes are rated by specified rating agencies at a level below investment grade.
As of January 30, 2021, the Company's credit rating and outlook were as described in the table below.
Standard & Moody's Poor's Fitch
Long-term debt Ba3 B+ BBOutlook Negative Negative Negative
March 2021 Financing Activities
On March 17, 2021, MRH completed an offering of $500 million in aggregate principal amount of 5.875% senior notes due 2029 (the “2029 Notes”) in a private offering (the “Notes Offering”). The 2029 Notes mature on April 1, 2029. The 2029 Notes are senior unsecured obligations of MRH and are unconditionally guaranteed on a senior unsecured basis by Macy’s, Inc. MRH used the net proceeds from the Notes Offering, together with cash on hand, to fund a separately announced tender offer in which $500 million of senior notes and debentures were tendered for early settlement and purchased by MRH on March 17, 2021.
Dividends
On February 28, 2020, the Company's board of directors declared a quarterly dividend of 37.75 cents per share on its common stock, payable April 1, 2020, to shareholders of record at the close of business on March 13, 2020. The Company announced the suspension of quarterly cash dividends beginning in the second quarter of 2020.
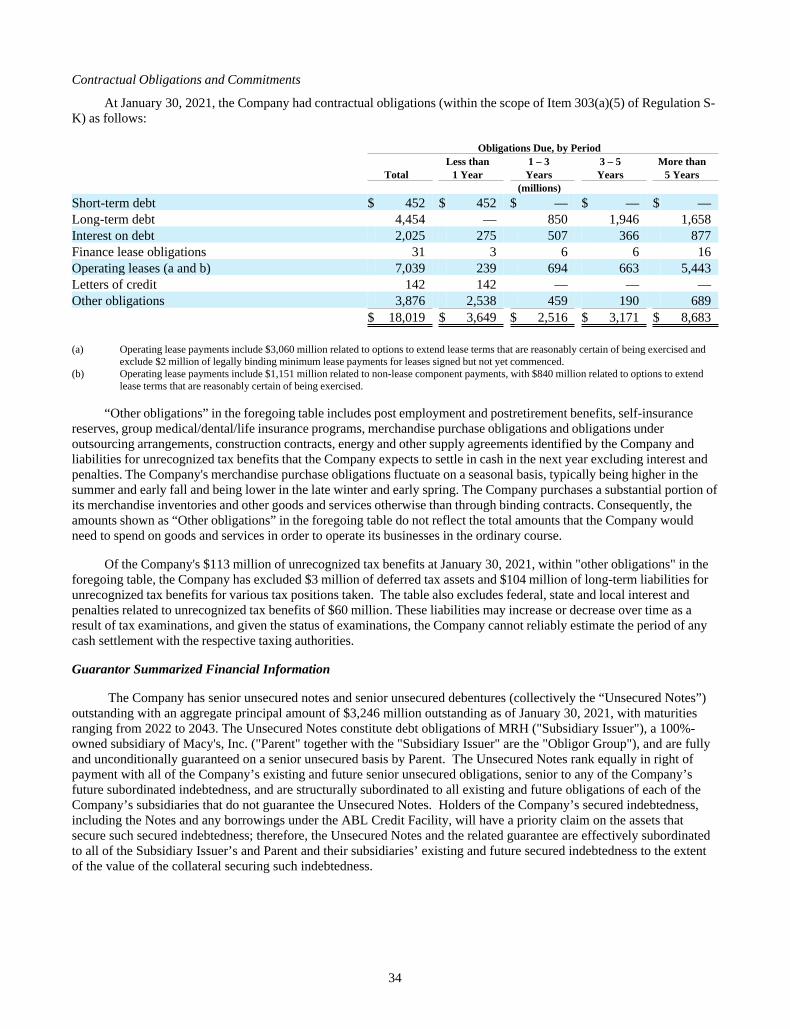
34
Contractual Obligations and Commitments
At January 30, 2021, the Company had contractual obligations (within the scope of Item 303(a)(5) of Regulation S-K) as follows:
Obligations Due, by Period Less than 1 – 3 3 – 5 More than
Total 1 Year Years Years 5 Years (millions)
Short-term debt $ 452 $ 452 $ — $ — $ — Long-term debt 4,454 — 850 1,946 1,658 Interest on debt 2,025 275 507 366 877 Finance lease obligations 31 3 6 6 16 Operating leases (a and b) 7,039 239 694 663 5,443 Letters of credit 142 142 — — — Other obligations 3,876 2,538 459 190 689 $ 18,019 $ 3,649 $ 2,516 $ 3,171 $ 8,683
(a) Operating lease payments include $3,060 million related to options to extend lease terms that are reasonably certain of being exercised and exclude $2 million of legally binding minimum lease payments for leases signed but not yet commenced.
(b) Operating lease payments include $1,151 million related to non-lease component payments, with $840 million related to options to extend lease terms that are reasonably certain of being exercised.
“Other obligations” in the foregoing table includes post employment and postretirement benefits, self-insurance reserves, group medical/dental/life insurance programs, merchandise purchase obligations and obligations under outsourcing arrangements, construction contracts, energy and other supply agreements identified by the Company and liabilities for unrecognized tax benefits that the Company expects to settle in cash in the next year excluding interest and penalties. The Company's merchandise purchase obligations fluctuate on a seasonal basis, typically being higher in the summer and early fall and being lower in the late winter and early spring. The Company purchases a substantial portion of its merchandise inventories and other goods and services otherwise than through binding contracts. Consequently, the amounts shown as “Other obligations” in the foregoing table do not reflect the total amounts that the Company would need to spend on goods and services in order to operate its businesses in the ordinary course.
Of the Company's $113 million of unrecognized tax benefits at January 30, 2021, within "other obligations" in the foregoing table, the Company has excluded $3 million of deferred tax assets and $104 million of long-term liabilities for unrecognized tax benefits for various tax positions taken. The table also excludes federal, state and local interest and penalties related to unrecognized tax benefits of $60 million. These liabilities may increase or decrease over time as a result of tax examinations, and given the status of examinations, the Company cannot reliably estimate the period of any cash settlement with the respective taxing authorities.
Guarantor Summarized Financial Information
The Company has senior unsecured notes and senior unsecured debentures (collectively the “Unsecured Notes”) outstanding with an aggregate principal amount of $3,246 million outstanding as of January 30, 2021, with maturities ranging from 2022 to 2043. The Unsecured Notes constitute debt obligations of MRH ("Subsidiary Issuer"), a 100%-owned subsidiary of Macy's, Inc. ("Parent" together with the "Subsidiary Issuer" are the "Obligor Group"), and are fully and unconditionally guaranteed on a senior unsecured basis by Parent. The Unsecured Notes rank equally in right of payment with all of the Company’s existing and future senior unsecured obligations, senior to any of the Company’s future subordinated indebtedness, and are structurally subordinated to all existing and future obligations of each of the Company’s subsidiaries that do not guarantee the Unsecured Notes. Holders of the Company’s secured indebtedness, including the Notes and any borrowings under the ABL Credit Facility, will have a priority claim on the assets that secure such secured indebtedness; therefore, the Unsecured Notes and the related guarantee are effectively subordinated to all of the Subsidiary Issuer’s and Parent and their subsidiaries’ existing and future secured indebtedness to the extent of the value of the collateral securing such indebtedness.
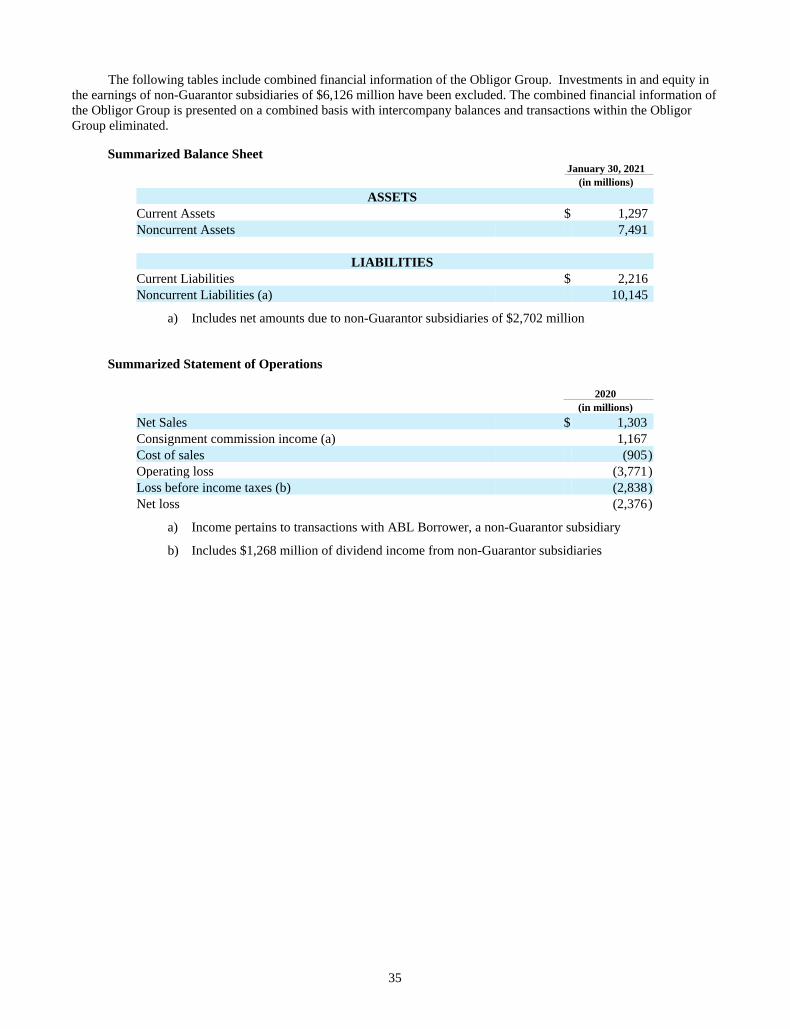
35
The following tables include combined financial information of the Obligor Group. Investments in and equity in the earnings of non-Guarantor subsidiaries of $6,126 million have been excluded. The combined financial information of the Obligor Group is presented on a combined basis with intercompany balances and transactions within the Obligor Group eliminated.
Summarized Balance Sheet January 30, 2021 (in millions)
ASSETS Current Assets $ 1,297 Noncurrent Assets 7,491
LIABILITIES Current Liabilities $ 2,216 Noncurrent Liabilities (a) 10,145
a) Includes net amounts due to non-Guarantor subsidiaries of $2,702 million
Summarized Statement of Operations
2020 (in millions)
Net Sales $ 1,303 Consignment commission income (a) 1,167 Cost of sales (905)Operating loss (3,771)Loss before income taxes (b) (2,838)Net loss (2,376)
a) Income pertains to transactions with ABL Borrower, a non-Guarantor subsidiary
b) Includes $1,268 million of dividend income from non-Guarantor subsidiaries
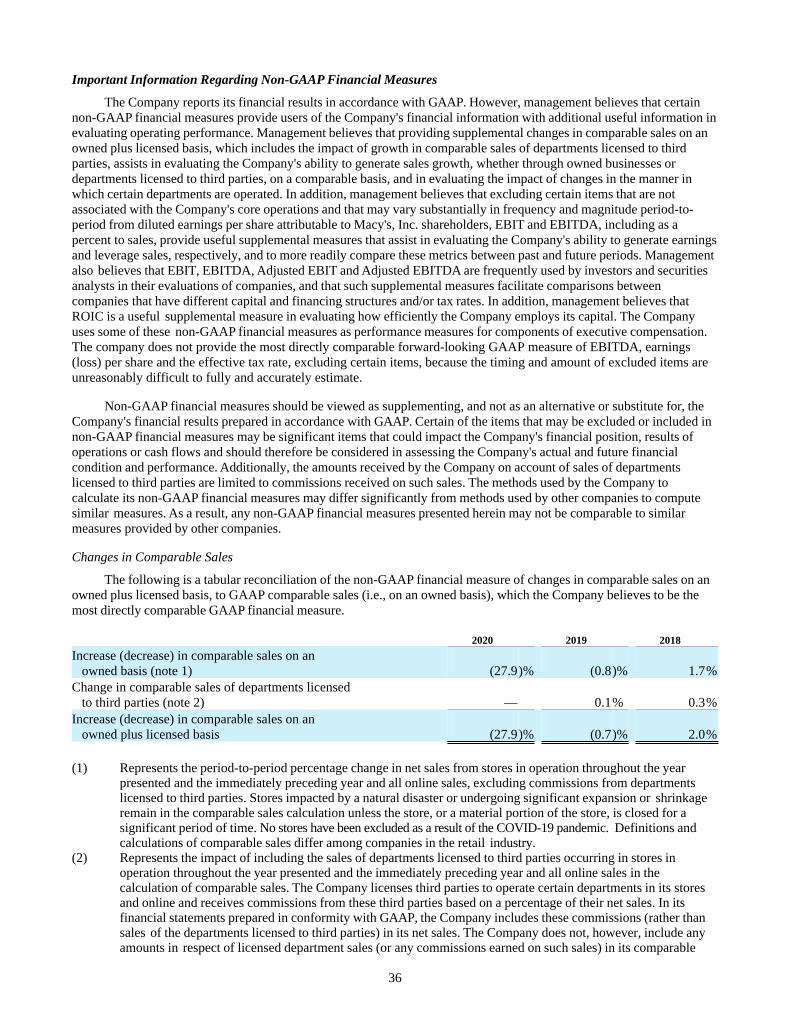
36
Important Information Regarding Non-GAAP Financial Measures
The Company reports its financial results in accordance with GAAP. However, management believes that certain non-GAAP financial measures provide users of the Company's financial information with additional useful information in evaluating operating performance. Management believes that providing supplemental changes in comparable sales on an owned plus licensed basis, which includes the impact of growth in comparable sales of departments licensed to third parties, assists in evaluating the Company's ability to generate sales growth, whether through owned businesses or departments licensed to third parties, on a comparable basis, and in evaluating the impact of changes in the manner in which certain departments are operated. In addition, management believes that excluding certain items that are not associated with the Company's core operations and that may vary substantially in frequency and magnitude period-to- period from diluted earnings per share attributable to Macy's, Inc. shareholders, EBIT and EBITDA, including as a percent to sales, provide useful supplemental measures that assist in evaluating the Company's ability to generate earnings and leverage sales, respectively, and to more readily compare these metrics between past and future periods. Management also believes that EBIT, EBITDA, Adjusted EBIT and Adjusted EBITDA are frequently used by investors and securities analysts in their evaluations of companies, and that such supplemental measures facilitate comparisons between companies that have different capital and financing structures and/or tax rates. In addition, management believes that ROIC is a useful supplemental measure in evaluating how efficiently the Company employs its capital. The Company uses some of these non-GAAP financial measures as performance measures for components of executive compensation. The company does not provide the most directly comparable forward-looking GAAP measure of EBITDA, earnings (loss) per share and the effective tax rate, excluding certain items, because the timing and amount of excluded items are unreasonably difficult to fully and accurately estimate.
Non-GAAP financial measures should be viewed as supplementing, and not as an alternative or substitute for, the Company's financial results prepared in accordance with GAAP. Certain of the items that may be excluded or included in non-GAAP financial measures may be significant items that could impact the Company's financial position, results of operations or cash flows and should therefore be considered in assessing the Company's actual and future financial condition and performance. Additionally, the amounts received by the Company on account of sales of departments licensed to third parties are limited to commissions received on such sales. The methods used by the Company to calculate its non-GAAP financial measures may differ significantly from methods used by other companies to compute similar measures. As a result, any non-GAAP financial measures presented herein may not be comparable to similar measures provided by other companies.
Changes in Comparable Sales
The following is a tabular reconciliation of the non-GAAP financial measure of changes in comparable sales on an owned plus licensed basis, to GAAP comparable sales (i.e., on an owned basis), which the Company believes to be the most directly comparable GAAP financial measure.
2020 2019 2018
Increase (decrease) in comparable sales on an owned basis (note 1) (27.9)% (0.8)% 1.7%Change in comparable sales of departments licensed to third parties (note 2) — 0.1% 0.3%Increase (decrease) in comparable sales on an owned plus licensed basis (27.9)% (0.7)% 2.0%
(1) Represents the period-to-period percentage change in net sales from stores in operation throughout the year presented and the immediately preceding year and all online sales, excluding commissions from departments licensed to third parties. Stores impacted by a natural disaster or undergoing significant expansion or shrinkage remain in the comparable sales calculation unless the store, or a material portion of the store, is closed for a significant period of time. No stores have been excluded as a result of the COVID-19 pandemic. Definitions and calculations of comparable sales differ among companies in the retail industry.
(2) Represents the impact of including the sales of departments licensed to third parties occurring in stores in operation throughout the year presented and the immediately preceding year and all online sales in the calculation of comparable sales. The Company licenses third parties to operate certain departments in its stores and online and receives commissions from these third parties based on a percentage of their net sales. In its financial statements prepared in conformity with GAAP, the Company includes these commissions (rather than sales of the departments licensed to third parties) in its net sales. The Company does not, however, include any amounts in respect of licensed department sales (or any commissions earned on such sales) in its comparable
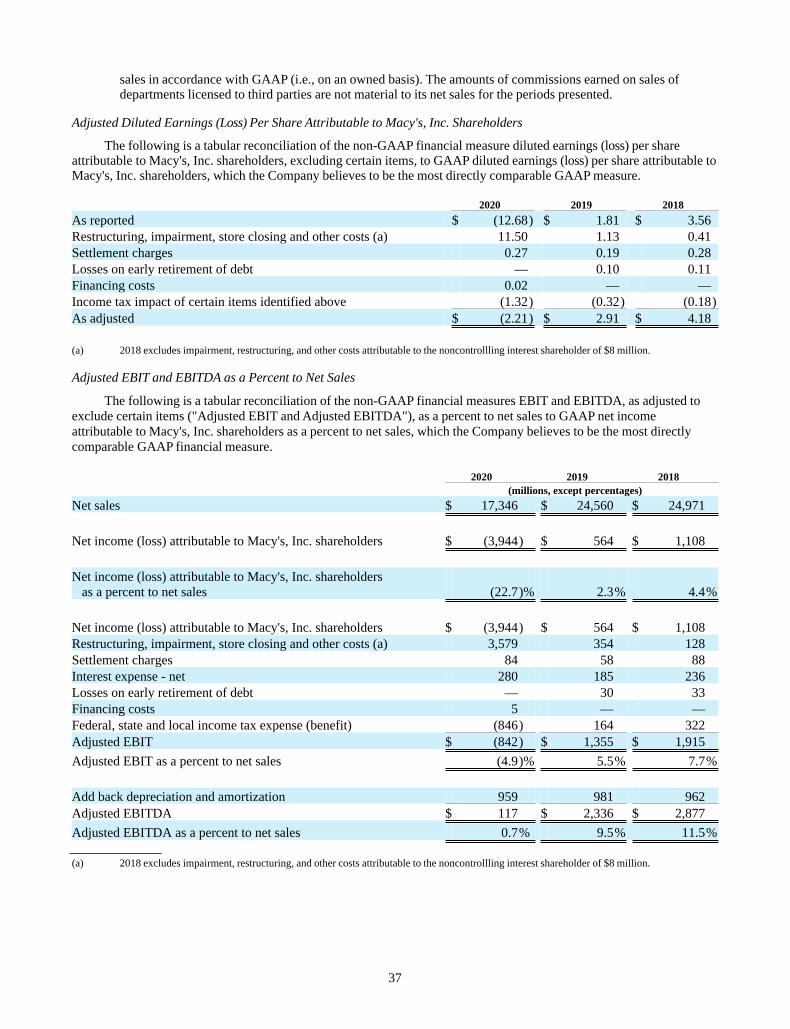
37
sales in accordance with GAAP (i.e., on an owned basis). The amounts of commissions earned on sales of departments licensed to third parties are not material to its net sales for the periods presented.
Adjusted Diluted Earnings (Loss) Per Share Attributable to Macy's, Inc. Shareholders
The following is a tabular reconciliation of the non-GAAP financial measure diluted earnings (loss) per share attributable to Macy's, Inc. shareholders, excluding certain items, to GAAP diluted earnings (loss) per share attributable to Macy's, Inc. shareholders, which the Company believes to be the most directly comparable GAAP measure.
2020 2019 2018
As reported $ (12.68) $ 1.81 $ 3.56 Restructuring, impairment, store closing and other costs (a) 11.50 1.13 0.41 Settlement charges 0.27 0.19 0.28 Losses on early retirement of debt — 0.10 0.11 Financing costs 0.02 — — Income tax impact of certain items identified above (1.32) (0.32) (0.18)As adjusted $ (2.21) $ 2.91 $ 4.18
(a) 2018 excludes impairment, restructuring, and other costs attributable to the noncontrollling interest shareholder of $8 million.
Adjusted EBIT and EBITDA as a Percent to Net Sales
The following is a tabular reconciliation of the non-GAAP financial measures EBIT and EBITDA, as adjusted to exclude certain items ("Adjusted EBIT and Adjusted EBITDA"), as a percent to net sales to GAAP net income attributable to Macy's, Inc. shareholders as a percent to net sales, which the Company believes to be the most directly comparable GAAP financial measure.
2020 2019 2018 (millions, except percentages)
Net sales $ 17,346 $ 24,560 $ 24,971
Net income (loss) attributable to Macy's, Inc. shareholders $ (3,944) $ 564 $ 1,108
Net income (loss) attributable to Macy's, Inc. shareholders as a percent to net sales (22.7)% 2.3% 4.4%
Net income (loss) attributable to Macy's, Inc. shareholders $ (3,944) $ 564 $ 1,108 Restructuring, impairment, store closing and other costs (a) 3,579 354 128 Settlement charges 84 58 88 Interest expense - net 280 185 236 Losses on early retirement of debt — 30 33 Financing costs 5 — — Federal, state and local income tax expense (benefit) (846) 164 322 Adjusted EBIT $ (842) $ 1,355 $ 1,915
Adjusted EBIT as a percent to net sales (4.9)% 5.5% 7.7%
Add back depreciation and amortization 959 981 962 Adjusted EBITDA $ 117 $ 2,336 $ 2,877
Adjusted EBITDA as a percent to net sales 0.7% 9.5% 11.5%
(a) 2018 excludes impairment, restructuring, and other costs attributable to the noncontrollling interest shareholder of $8 million.
38
ROIC
Historically, the Company defined ROIC as adjusted EBITDA, excluding net lease expense, as a percent to average invested capital. Average invested capital is comprised of an annual two-point (i.e., end of the year presented and the immediately preceding year) average of gross property and equipment, a capitalized value of non-capitalized leases equal to periodic annual reported net rent expense multiplied by a factor of eight and a four-point (i.e., end of each quarter within the period presented) average of other selected assets and liabilities. The calculation of the capitalized value of non-capitalized leases is consistent with industry and credit rating agency practice and the specified assets are subject to a four-point average to compensate for seasonal fluctuations.
In conjunction with the Company's adoption of ASU No. 2016-02 on February 3, 2019, the Company recognized lease liabilities and related right of use ("ROU") assets on the balance sheet for its operating leases. In the calculation of the Company's ROIC as of January 30, 2021 and February 1, 2020, the Company utilized the total lease ROU assets in lieu of the capitalized value of non-capitalized leases, excluding variable rent which is still multiplied by a factor of eight, as a result of the adoption of ASU 2016-02. In the Company's ROIC calculation as of February 2, 2019, a capitalized value of non-capitalized leases equal to periodic annual reported net rent expense multiplied by a factor of eight was utilized. Rent expense in 2020 and 2019 reflects lease expense related to the Company's operating leases in accordance with ASU 2016-02 and excludes non-lease component expenses. See Note 5, Properties and Leases, to the Consolidated Financial Statements for information on leases, including non-lease components.
In 2020 and 2019, the calculation of ROIC reflected certain refinements to better reflect the company's adjusted EBITDA, excluding lease expense, and invested capital which are summarized below (4-point average of balance, as applicable):
• Exclude non-lease components of $87 million and $83 million for 2020 and 2019, respectively, from lease expense.
• Exclude benefit plan income, net of $54 million and $31 million for 2020 and 2019, respectively, from Adjusted EBITDA, excluding lease expense.
• Exclude rabbi trust investments related to company's deferred compensation plan from prepaid expenses and other current assets ($32 million for both 2020 and 2019).
• Exclude deferred financing costs ($38 million for 2020 and $4 million for 2019) and net pension asset ($168 million for 2020 and $46 million for 2019) from other assets.
• Exclude dividend payable ($29 million for 2019), current liabilities for other postretirement health care and life insurance benefits and the supplementary retirement plan ($64 million for 2020 and $76 million for 2019), and the current lease liability ($287 million for 2020 and $306 million for 2019) from accounts payable and accrued liabilities.
• Include long-term workers' compensation and general liability ($348 million for 2020 and $371 million for 2019).
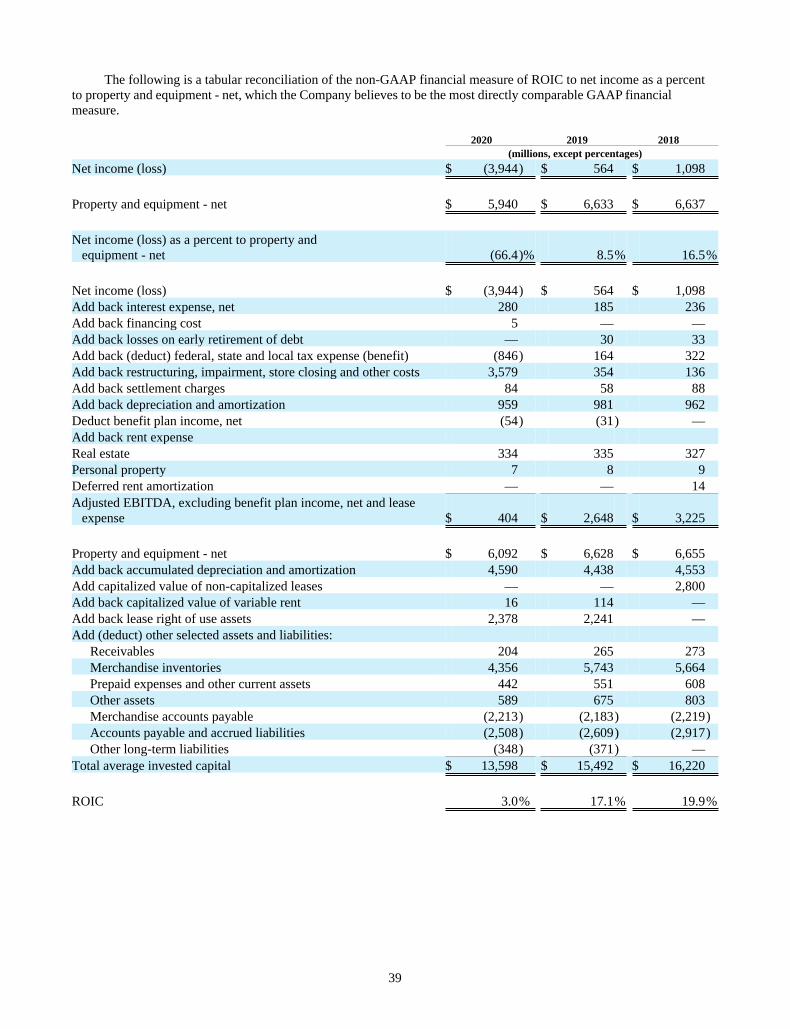
39
The following is a tabular reconciliation of the non-GAAP financial measure of ROIC to net income as a percent to property and equipment - net, which the Company believes to be the most directly comparable GAAP financial measure.
2020 2019 2018 (millions, except percentages)
Net income (loss) $ (3,944) $ 564 $ 1,098
Property and equipment - net $ 5,940 $ 6,633 $ 6,637
Net income (loss) as a percent to property and equipment - net (66.4)% 8.5% 16.5%
Net income (loss) $ (3,944) $ 564 $ 1,098 Add back interest expense, net 280 185 236 Add back financing cost 5 — — Add back losses on early retirement of debt — 30 33 Add back (deduct) federal, state and local tax expense (benefit) (846) 164 322 Add back restructuring, impairment, store closing and other costs 3,579 354 136 Add back settlement charges 84 58 88 Add back depreciation and amortization 959 981 962 Deduct benefit plan income, net (54) (31) — Add back rent expense Real estate 334 335 327 Personal property 7 8 9 Deferred rent amortization — — 14 Adjusted EBITDA, excluding benefit plan income, net and lease expense $ 404 $ 2,648 $ 3,225
Property and equipment - net $ 6,092 $ 6,628 $ 6,655 Add back accumulated depreciation and amortization 4,590 4,438 4,553 Add capitalized value of non-capitalized leases — — 2,800 Add back capitalized value of variable rent 16 114 — Add back lease right of use assets 2,378 2,241 — Add (deduct) other selected assets and liabilities:
Receivables 204 265 273 Merchandise inventories 4,356 5,743 5,664 Prepaid expenses and other current assets 442 551 608 Other assets 589 675 803 Merchandise accounts payable (2,213) (2,183) (2,219)Accounts payable and accrued liabilities (2,508) (2,609) (2,917)Other long-term liabilities (348) (371) —
Total average invested capital $ 13,598 $ 15,492 $ 16,220
ROIC 3.0% 17.1% 19.9%
40
Critical Accounting Policies
Merchandise Inventories
Merchandise inventories are valued at the lower of cost or market using the last-in, first-out ("LIFO") retail inventory method. Under the retail inventory method, inventory is segregated into departments of merchandise having similar characteristics and is stated at its current retail selling value. The retail inventory method inherently requires management judgments and estimates, such as the amount and timing of permanent markdowns to clear unproductive or slow-moving inventory, which may impact the ending inventory valuation as well as gross margins.
Permanent markdowns designated for clearance activity are recorded when the utility of the inventory has diminished. Factors considered in the determination of permanent markdowns include current and anticipated demand, customer preferences, age of the merchandise and fashion trends. When a decision is made to permanently mark down merchandise, the resulting gross margin reduction is recognized in the period the markdown is recorded.
Long-Lived Asset Impairment and Restructuring Charges
The carrying values of long-lived assets, inclusive of ROU assets, are periodically reviewed by the Company whenever events or changes in circumstances indicate that the carrying value may not be recoverable, such as historical operating losses or plans to close stores before the end of their previously estimated useful lives. Additionally, on an annual basis, the recoverability of the carrying values of individual stores is evaluated. A potential impairment has occurred if projected future undiscounted cash flows are less than the carrying value of the assets. The estimate of cash flows includes management's assumptions of cash inflows and outflows directly resulting from the use of those assets in operations. When a potential impairment has occurred, an impairment write-down is recorded if the carrying value of the long-lived asset exceeds its fair value. The Company believes its estimated cash flows are sufficient to support the carrying value of its long-lived assets. If estimated cash flows significantly differ in the future, the Company may be required to record asset impairment write-downs.
If the Company commits to a plan to dispose of a long-lived asset before the end of its previously estimated useful life or changes its use of corporate assets, estimated cash flows are revised accordingly, and the Company may be required to record an asset impairment charge. Additionally, related liabilities arise such as severance, contractual obligations and other accruals associated with store closings from decisions to dispose of assets. The Company estimates these liabilities based on the facts and circumstances in existence for each restructuring decision. The amounts the Company will ultimately realize or disburse could differ from the amounts assumed in arriving at the asset impairment and restructuring charge recorded.
Goodwill and Intangible Assets
The Company reviews the carrying value of its goodwill and other intangible assets with indefinite lives at least annually, as of the end of fiscal May, or more frequently if an event occurs or circumstances change, for possible impairment in accordance with ASC Topic 350, Intangibles - Goodwill and Other. For impairment testing, goodwill has been assigned to reporting units which consist of the Company's retail operating divisions. Macy's and bluemercury are the only reporting units with goodwill as of January 30, 2021, and 98% of the Company's goodwill is allocated to the Macy's reporting unit.
The Company may elect to evaluate qualitative factors to determine if it is more likely than not that the fair value of a reporting unit or fair value of indefinite lived intangible assets is less than its carrying value. If the qualitative evaluation indicates that it is more likely than not that the fair value of a reporting unit or indefinite lived intangible asset is less than its carrying amount, a quantitative impairment test is required. Alternatively, the Company may bypass the qualitative assessment for a reporting unit or indefinite lived intangible asset and directly perform the quantitative assessment. This determination can be made on an individual reporting unit or asset basis, and performance of the qualitative assessment may resume in a subsequent period.
The quantitative impairment test involves estimating the fair value of each reporting unit and indefinite lived intangible asset and comparing these estimated fair values with the respective reporting unit or indefinite lived intangible asset carrying value. If the carrying value of a reporting unit exceeds its fair value, an impairment loss will be recognized in an amount equal to such excess, limited to the total amount of goodwill allocated to the reporting unit. If the carrying value of an individual indefinite lived intangible asset exceeds its fair value, such individual indefinite lived intangible asset is written down by an amount equal to such excess.
41
Estimating the fair values of reporting units and indefinite lived intangible assets involves the use of significant assumptions, estimates and judgments with respect to a variety of factors, including sales, gross margin and SG&A expense rates, capital expenditures, cash flows and the selection and use of an appropriate discount rate and market values and multiples of earnings and revenues of similar public companies. Projected sales, gross margin and SG&A expense rate assumptions and capital expenditures are based on the Company's annual business plan or other forecasted results. Discount rates reflect market-based estimates of the risks associated with the projected cash flows of the reporting unit or indefinite lived intangible asset.
The use of different assumptions, estimates or judgments in the goodwill impairment testing process, including with respect to the estimated future cash flows of the Company's reporting units, the discount rate used to discount such estimated cash flows to their net present value, and the reasonableness of the resultant implied control premium relative to the Company's market capitalization, could materially increase or decrease the fair value of the reporting unit and/or its net assets and, accordingly, could materially increase or decrease any related impairment charge.
During the first quarter of 2020, as a result of the sustained decline in the Company's market capitalization and changes in the Company's long-term projections driven largely by the impacts of the COVID-19 pandemic, the Company determined a triggering event had occurred that required an interim impairment assessment for all of its reporting units and indefinite lived intangible assets. The Company determined the fair value of each of its reporting units using a market approach or a combination of a market approach and income approach, as appropriate. Relative to the prior assessment, as part of this interim 2020 assessment, it was determined that an increase in the discount rate applied in the valuation was required to align with market-based assumptions and company-specific risk. The revised long-term projections, in conjunction with this higher discount rate, resulted in lower fair values of the reporting units. As a result, the Company recognized $2,982 million and $98 million of goodwill impairment for the Macy's and bluemercury reporting units, respectively, during 2020, the majority of which was recognized during the first quarter of 2020.
As of May 2, 2020, the Company elected to perform a qualitative impairment test on its intangible assets with indefinite lives and concluded that it is more likely than not that the fair values exceeded the carrying values and the intangible assets with indefinite lives were not impaired.
For the Company's annual impairment assessment as of the end of fiscal May, the Company elected to perform a qualitative impairment test on its goodwill and intangible assets with indefinite lives and concluded that it is more likely than not that the fair values exceeded the carrying values and goodwill and intangible assets with indefinite lives were not impaired.
The Company continues to monitor the key inputs to the fair values of its reporting units. A decline in market capitalization or future declines in macroeconomic factors or business conditions may result in additional impairment charges in future periods.
Income Taxes
Income taxes are estimated based on the tax statutes, regulations and case law of the various jurisdictions in which the Company operates. Deferred income tax assets and liabilities are recognized for the future tax consequences attributable to differences between the financial statement carrying amounts of existing assets and liabilities and their respective tax bases, and net operating loss and tax credit carryforwards. Deferred income tax assets and liabilities are measured using enacted tax rates expected to apply to taxable income in the years in which those temporary differences are expected to be recovered or settled. Deferred income tax assets are evaluated for recoverability based on all available evidence, including past operating results, estimates of future taxable income, and the feasibility of tax planning strategies. Deferred income tax assets are reduced by a valuation allowance when it is more likely than not that some portion of the deferred income tax assets will not be realized.
Uncertain tax positions are recognized if the weight of available evidence indicates that it is more likely than not that the tax position will be sustained on examination, including resolution of any related appeals or litigation processes, based on the technical merits of the position. Uncertain tax positions meeting the more-likely-than-not recognition threshold are then measured to determine the amount of benefit eligible for recognition in the financial statements. Each uncertain tax position is measured at the largest amount of benefit that is more likely than not to be realized upon ultimate settlement.
42
Uncertain tax positions are evaluated and adjusted as appropriate, while taking into account the progress of audits of various taxing jurisdictions. Resolution of these matters could have a material impact on the Company's consolidated financial position, results of operations or cash flows.
Significant judgment is required in evaluating the Company's uncertain tax positions, provision for income taxes, and any valuation allowance recorded against deferred tax assets. Although the Company believes that its judgments are reasonable, no assurance can be given that the final tax outcome of these matters will not be different from that which is reflected in the Company's historical income provisions and accruals.
Pension and Supplementary Retirement Plans
The Company has a funded defined benefit pension plan (the “Pension Plan”) and an unfunded defined benefit supplementary retirement plan (the “SERP”). The Company accounts for these plans in accordance with ASC Topic 715, Compensation - Retirement Benefits. Under ASC Topic 715, an employer recognizes the funded status of a defined benefit postretirement plan as an asset or liability on the balance sheet and recognizes changes in that funded status in the year in which the changes occur through comprehensive income (loss). Additionally, pension expense is generally recognized on an accrual basis over the average remaining lifetime of participants. The pension expense calculation is generally independent of funding decisions or requirements.
The Pension Protection Act of 2006 provides the funding requirements for the Pension Plan which are different from the employer's accounting for the plan as outlined in ASC Topic 715. No funding contributions were required, and the Company made no funding contributions to the Pension Plan in 2020 and 2019. As of the date of this report, the Company does not anticipate making funding contributions to the Pension Plan in 2021.
The calculation of pension expense and pension liabilities requires the use of a number of assumptions. Changes in these assumptions can result in different expense and liability amounts, and future actual experience may differ significantly from current expectations. The Company believes that the most critical assumptions relate to the long-term rate of return on plan assets (in the case of the Pension Plan) and the discount rate used to determine the present value of projected benefit obligations.
The Company's assumed annual long-term rate of return for the Pension Plan's assets was 6.25% for 2020, 6.50% for 2019 and 6.75% for 2018 based on expected future returns on the portfolio of assets. As of January 30, 2021, the Company lowered the assumed annual long-term rate of return for the Pension Plan's assets from 6.25% to 5.75% based on expected future returns on the portfolio of assets. The Company develops its expected long-term rate of return assumption by evaluating input from several professional advisors taking into account the asset allocation of the portfolio and long-term asset class return expectations, as well as long-term inflation assumptions. Pension expense increases or decreases as the expected rate of return on the assets of the Pension Plan decreases or increases, respectively. Lowering or raising the expected long-term rate of return assumption on the Pension Plan's assets by 0.25% would increase or decrease the estimated 2021 pension expense by approximately $7 million.
The Company discounted its future pension obligations using a weighted-average rate of 2.43% at January 30, 2021 and 2.83% at February 1, 2020, for the Pension Plan and 2.51% at January 30, 2021 and 2.89% at February 1, 2020 for the SERP. The discount rate used to determine the present value of the Company's Pension Plan and SERP obligations is based on a yield curve constructed from a portfolio of high quality corporate debt securities with various maturities. Each year's expected future benefit payments are discounted to their present value at the appropriate yield curve rate, thereby generating the overall discount rate for Pension Plan and SERP obligations. As the discount rate is reduced or increased, the pension liability would increase or decrease, respectively, and future pension expense would decrease or increase, respectively. Lowering the discount rates by 0.25% would increase the projected benefit obligations at January 30, 2021 by approximately $86 million and would decrease estimated 2021 pension expense by approximately $4 million. Increasing the discount rates by 0.25% would decrease the projected benefit obligations at January 30, 2021 by approximately $82 million and would increase estimated 2021 pension expense by approximately $3 million.
The Company estimates the service and interest cost components of net periodic benefit costs for the Pension Plan and SERP. This method uses a full yield curve approach in the estimation of these components of net periodic benefit costs. Under this approach, the Company applies discounting using individual spot rates from the yield curve composed of the rates of return from a portfolio of high quality corporate debt securities available at the measurement date. These spot rates align to each of the projected benefit obligation and service cost cash flows.

43
New Pronouncements
See Note 1, Organization and Summary of Significant Accounting Policies, to the Consolidated Financial Statements for discussion on new accounting pronouncements.
44
Item 7A. Quantitative and Qualitative Disclosures About Market Risk.
The Company is exposed to market risk from changes in interest rates that may adversely affect its financial position, results of operations and cash flows. In seeking to minimize the risks from interest rate fluctuations, the Company manages exposures through its regular operating and financing activities and, when deemed appropriate, through the use of derivative financial instruments. The Company does not use financial instruments for trading or other speculative purposes and is not a party to any leveraged financial instruments.
The Company is exposed to interest rate risk through its borrowing activities, which are described in Note 7, Financing, to the Consolidated Financial Statements. All of the Company’s borrowings are under fixed rate instruments. However, the Company, from time to time, may use interest rate swap and interest rate cap agreements to help manage its exposure to interest rate movements and reduce borrowing costs. At January 30, 2021, the Company was not a party to any material derivative financial instruments and based on the Company’s lack of market risk sensitive instruments outstanding at January 30, 2021, the Company has determined that there was no material market risk exposure to the Company’s consolidated financial position, results of operations or cash flows as of such date.
45
Item 8. Financial Statements and Supplementary Data.
Information called for by this item is set forth in the Company’s Consolidated Financial Statements and supplementary data contained in this report and is incorporated herein by this reference. Specific financial statements and supplementary data can be found at the pages listed in the following index:
INDEX
PageReport of Management F-2
Report of Independent Registered Public Accounting Firm F-3
Consolidated Statements of Operations for the fiscal years ended January 30, 2021, February 1, 2020 and February 2, 2019
F-6
Consolidated Statements of Comprehensive Income (Loss) for the fiscal years ended January 30, 2021, February 1, 2020 and February 2, 2019
F-7
Consolidated Balance Sheets as of January 30, 2021 and February 1, 2020 F-8
Consolidated Statements of Changes in Shareholders’ Equity for the fiscal years ended January 30, 2021, February 1, 2020 and February 2, 2019
F-9
Consolidated Statements of Cash Flows for the fiscal years ended January 30, 2021, February 1, 2020 and February 2, 2019
F-10
Notes to Consolidated Financial Statements F-11
46
Item 9. Changes in and Disagreements with Accountants on Accounting and Financial Disclosure.
None.
Item 9A. Controls and Procedures.
a. Disclosure Controls and Procedures
The Company’s Chief Executive Officer and Chief Financial Officer have carried out, as of January 30, 2021, with the participation of the Company’s management, an evaluation of the effectiveness of the Company’s disclosure controls and procedures, as defined in Rule 13a-15(e) under the Exchange Act. Based upon this evaluation, the Chief Executive Officer and Chief Financial Officer have concluded that as of January 30, 2021, the Company’s disclosure controls and procedures were effective to provide reasonable assurance that information required to be disclosed by the Company in reports the Company files under the Exchange Act is recorded, processed, summarized and reported, within the time periods specified in the SEC rules and forms, and that information required to be disclosed by the Company in the reports the Company files or submits under the Exchange Act is accumulated and communicated to the Company’s management, including its Chief Executive Officer and Chief Financial Officer, as appropriate to allow timely decisions regarding required disclosure.
b. Management’s Annual Report on Internal Control over Financial Reporting
The Company’s management is responsible for establishing and maintaining adequate internal control over financial reporting, as defined in Exchange Act Rule 13a-15(f). The Company’s management conducted an assessment of the Company’s internal control over financial reporting based on the framework established by the Committee of Sponsoring Organizations of the Treadway Commission in Internal Control – Integrated Framework (2013). Based on this assessment, the Company’s management has concluded that, as of January 30, 2021, the Company’s internal control over financial reporting was effective.
The Company’s independent registered public accounting firm, KPMG LLP, has audited the Company’s Consolidated Financial Statements included in this Annual Report on Form 10-K and the effectiveness of the Company’s internal control over financial reporting as of January 30, 2021, and has issued an attestation report expressing an unqualified opinion on the effectiveness of the Company’s internal control over financial reporting, as stated in their report located on page F-3.
c. Changes in Internal Control over Financial Reporting
From time to time adoption of new accounting pronouncements, major organizational restructuring and realignment occurs for which the Company reviews its internal control over financial reporting. As a result of this review, there were no changes in the Company’s internal control over financial reporting that occurred during the Company’s most recently completed quarter that materially affected, or are reasonably likely to materially affect, the Company’s internal control over financial reporting.
Item 9B. Other Information.
None.
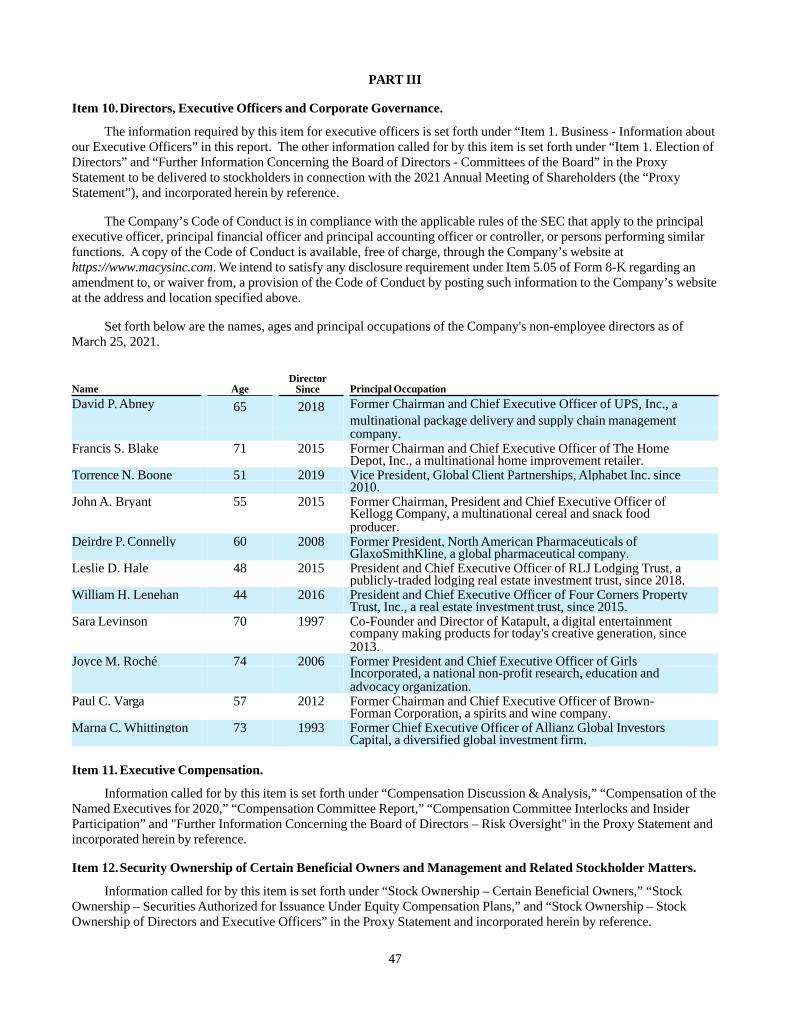
47
PART III
Item 10.Directors, Executive Officers and Corporate Governance.
The information required by this item for executive officers is set forth under “Item 1. Business - Information about our Executive Officers” in this report. The other information called for by this item is set forth under “Item 1. Election of Directors” and “Further Information Concerning the Board of Directors - Committees of the Board” in the Proxy Statement to be delivered to stockholders in connection with the 2021 Annual Meeting of Shareholders (the “Proxy Statement”), and incorporated herein by reference.
The Company’s Code of Conduct is in compliance with the applicable rules of the SEC that apply to the principal executive officer, principal financial officer and principal accounting officer or controller, or persons performing similar functions. A copy of the Code of Conduct is available, free of charge, through the Company’s website at https://www.macysinc.com. We intend to satisfy any disclosure requirement under Item 5.05 of Form 8-K regarding an amendment to, or waiver from, a provision of the Code of Conduct by posting such information to the Company’s website at the address and location specified above.
Set forth below are the names, ages and principal occupations of the Company's non-employee directors as of March 25, 2021.
Name AgeDirector
Since Principal Occupation
David P. Abney 65 2018 Former Chairman and Chief Executive Officer of UPS, Inc., amultinational package delivery and supply chain managementcompany.
Francis S. Blake 71 2015 Former Chairman and Chief Executive Officer of The HomeDepot, Inc., a multinational home improvement retailer.
Torrence N. Boone 51 2019 Vice President, Global Client Partnerships, Alphabet Inc. since2010.
John A. Bryant 55 2015 Former Chairman, President and Chief Executive Officer ofKellogg Company, a multinational cereal and snack foodproducer.
Deirdre P. Connelly 60 2008 Former President, North American Pharmaceuticals ofGlaxoSmithKline, a global pharmaceutical company.
Leslie D. Hale 48 2015 President and Chief Executive Officer of RLJ Lodging Trust, apublicly-traded lodging real estate investment trust, since 2018.
William H. Lenehan 44 2016 President and Chief Executive Officer of Four Corners PropertyTrust, Inc., a real estate investment trust, since 2015.
Sara Levinson 70 1997 Co-Founder and Director of Katapult, a digital entertainmentcompany making products for today's creative generation, since2013.
Joyce M. Roché 74 2006 Former President and Chief Executive Officer of GirlsIncorporated, a national non-profit research, education andadvocacy organization.
Paul C. Varga 57 2012 Former Chairman and Chief Executive Officer of Brown-Forman Corporation, a spirits and wine company.
Marna C. Whittington 73 1993 Former Chief Executive Officer of Allianz Global InvestorsCapital, a diversified global investment firm.
Item 11. Executive Compensation.
Information called for by this item is set forth under “Compensation Discussion & Analysis,” “Compensation of the Named Executives for 2020,” “Compensation Committee Report,” “Compensation Committee Interlocks and Insider Participation” and "Further Information Concerning the Board of Directors – Risk Oversight" in the Proxy Statement and incorporated herein by reference.
Item 12.Security Ownership of Certain Beneficial Owners and Management and Related Stockholder Matters.
Information called for by this item is set forth under “Stock Ownership – Certain Beneficial Owners,” “Stock Ownership – Securities Authorized for Issuance Under Equity Compensation Plans,” and “Stock Ownership – Stock Ownership of Directors and Executive Officers” in the Proxy Statement and incorporated herein by reference.

48
Item 13.Certain Relationships and Related Transactions, and Director Independence.
Information called for by this item is set forth under “Further Information Concerning the Board of Directors – Director Independence” and “Policy on Related Person Transactions” in the Proxy Statement and incorporated herein by reference.
Item 14.Principal Accountant Fees and Services.
Information called for by this item is set forth under “Item 2. Ratification of the Appointment of Independent Registered Public Accounting Firm” in the Proxy Statement and incorporated herein by reference.
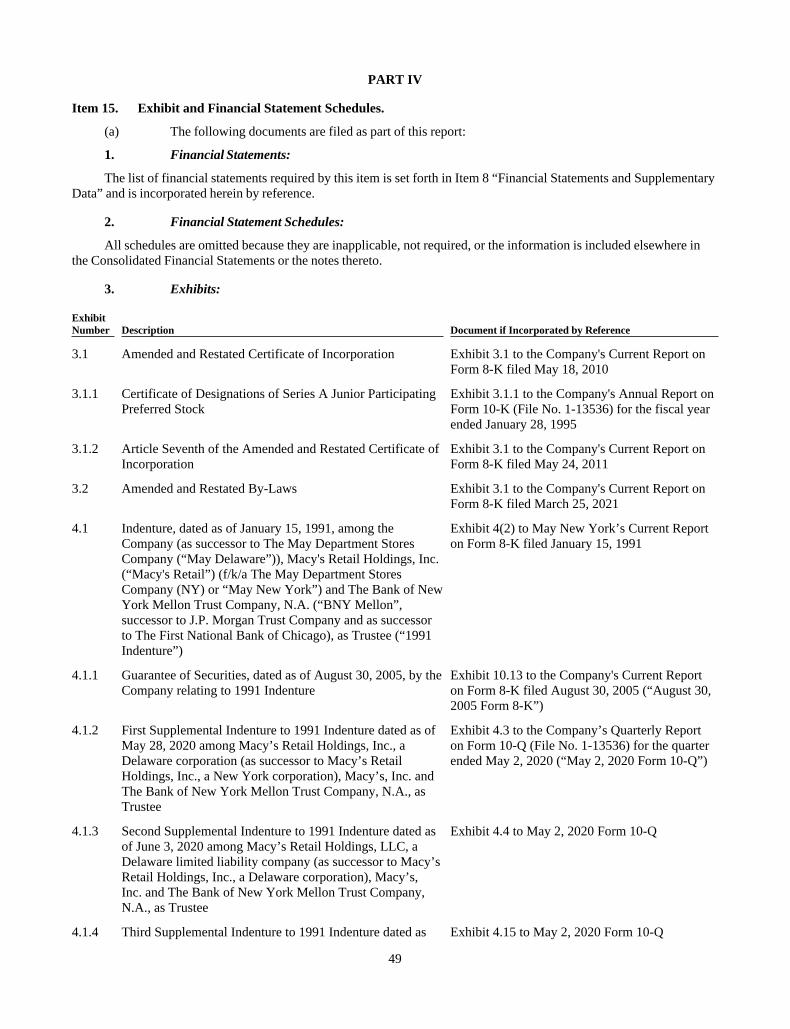
49
PART IV
Item 15. Exhibit and Financial Statement Schedules.
(a) The following documents are filed as part of this report:
1. Financial Statements:
The list of financial statements required by this item is set forth in Item 8 “Financial Statements and Supplementary Data” and is incorporated herein by reference.
2. Financial Statement Schedules:
All schedules are omitted because they are inapplicable, not required, or the information is included elsewhere in the Consolidated Financial Statements or the notes thereto.
3. Exhibits:
ExhibitNumber Description Document if Incorporated by Reference
3.1 Amended and Restated Certificate of Incorporation Exhibit 3.1 to the Company's Current Report on Form 8-K filed May 18, 2010
3.1.1 Certificate of Designations of Series A Junior Participating Preferred Stock
Exhibit 3.1.1 to the Company's Annual Report on Form 10-K (File No. 1-13536) for the fiscal year ended January 28, 1995
3.1.2 Article Seventh of the Amended and Restated Certificate of Incorporation
Exhibit 3.1 to the Company's Current Report on Form 8-K filed May 24, 2011
3.2 Amended and Restated By-Laws Exhibit 3.1 to the Company's Current Report on Form 8-K filed March 25, 2021
4.1 Indenture, dated as of January 15, 1991, among the Company (as successor to The May Department Stores Company (“May Delaware”)), Macy's Retail Holdings, Inc. (“Macy's Retail”) (f/k/a The May Department Stores Company (NY) or “May New York”) and The Bank of New York Mellon Trust Company, N.A. (“BNY Mellon”, successor to J.P. Morgan Trust Company and as successor to The First National Bank of Chicago), as Trustee (“1991 Indenture”)
Exhibit 4(2) to May New York’s Current Report on Form 8-K filed January 15, 1991
4.1.1 Guarantee of Securities, dated as of August 30, 2005, by the Company relating to 1991 Indenture
Exhibit 10.13 to the Company's Current Report on Form 8-K filed August 30, 2005 (“August 30, 2005 Form 8-K”)
4.1.2 First Supplemental Indenture to 1991 Indenture dated as of May 28, 2020 among Macy’s Retail Holdings, Inc., a Delaware corporation (as successor to Macy’s Retail Holdings, Inc., a New York corporation), Macy’s, Inc. and The Bank of New York Mellon Trust Company, N.A., as Trustee
Exhibit 4.3 to the Company’s Quarterly Report on Form 10-Q (File No. 1-13536) for the quarter ended May 2, 2020 (“May 2, 2020 Form 10-Q”)
4.1.3 Second Supplemental Indenture to 1991 Indenture dated as of June 3, 2020 among Macy’s Retail Holdings, LLC, a Delaware limited liability company (as successor to Macy’s Retail Holdings, Inc., a Delaware corporation), Macy’s, Inc. and The Bank of New York Mellon Trust Company, N.A., as Trustee
Exhibit 4.4 to May 2, 2020 Form 10-Q
4.1.4 Third Supplemental Indenture to 1991 Indenture dated as Exhibit 4.15 to May 2, 2020 Form 10-Q
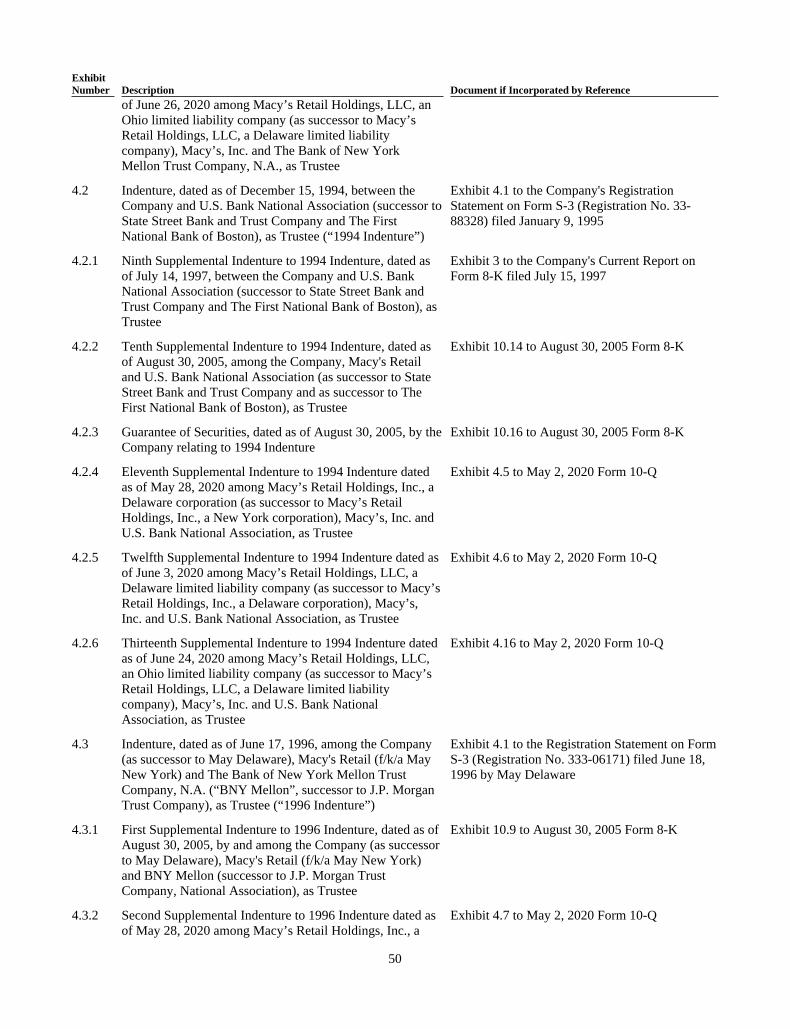
50
ExhibitNumber Description Document if Incorporated by Reference
of June 26, 2020 among Macy’s Retail Holdings, LLC, an Ohio limited liability company (as successor to Macy’s Retail Holdings, LLC, a Delaware limited liability company), Macy’s, Inc. and The Bank of New York Mellon Trust Company, N.A., as Trustee
4.2 Indenture, dated as of December 15, 1994, between the Company and U.S. Bank National Association (successor to State Street Bank and Trust Company and The First National Bank of Boston), as Trustee (“1994 Indenture”)
Exhibit 4.1 to the Company's Registration Statement on Form S-3 (Registration No. 33-88328) filed January 9, 1995
4.2.1 Ninth Supplemental Indenture to 1994 Indenture, dated as of July 14, 1997, between the Company and U.S. Bank National Association (successor to State Street Bank and Trust Company and The First National Bank of Boston), as Trustee
Exhibit 3 to the Company's Current Report on Form 8-K filed July 15, 1997
4.2.2 Tenth Supplemental Indenture to 1994 Indenture, dated as of August 30, 2005, among the Company, Macy's Retail and U.S. Bank National Association (as successor to State Street Bank and Trust Company and as successor to The First National Bank of Boston), as Trustee
Exhibit 10.14 to August 30, 2005 Form 8-K
4.2.3 Guarantee of Securities, dated as of August 30, 2005, by the Company relating to 1994 Indenture
Exhibit 10.16 to August 30, 2005 Form 8-K
4.2.4 Eleventh Supplemental Indenture to 1994 Indenture dated as of May 28, 2020 among Macy’s Retail Holdings, Inc., a Delaware corporation (as successor to Macy’s Retail Holdings, Inc., a New York corporation), Macy’s, Inc. and U.S. Bank National Association, as Trustee
Exhibit 4.5 to May 2, 2020 Form 10-Q
4.2.5 Twelfth Supplemental Indenture to 1994 Indenture dated as of June 3, 2020 among Macy’s Retail Holdings, LLC, a Delaware limited liability company (as successor to Macy’s Retail Holdings, Inc., a Delaware corporation), Macy’s, Inc. and U.S. Bank National Association, as Trustee
Exhibit 4.6 to May 2, 2020 Form 10-Q
4.2.6 Thirteenth Supplemental Indenture to 1994 Indenture dated as of June 24, 2020 among Macy’s Retail Holdings, LLC, an Ohio limited liability company (as successor to Macy’s Retail Holdings, LLC, a Delaware limited liability company), Macy’s, Inc. and U.S. Bank National Association, as Trustee
Exhibit 4.16 to May 2, 2020 Form 10-Q
4.3 Indenture, dated as of June 17, 1996, among the Company (as successor to May Delaware), Macy's Retail (f/k/a May New York) and The Bank of New York Mellon Trust Company, N.A. (“BNY Mellon”, successor to J.P. Morgan Trust Company), as Trustee (“1996 Indenture”)
Exhibit 4.1 to the Registration Statement on Form S-3 (Registration No. 333-06171) filed June 18, 1996 by May Delaware
4.3.1 First Supplemental Indenture to 1996 Indenture, dated as of August 30, 2005, by and among the Company (as successor to May Delaware), Macy's Retail (f/k/a May New York) and BNY Mellon (successor to J.P. Morgan Trust Company, National Association), as Trustee
Exhibit 10.9 to August 30, 2005 Form 8-K
4.3.2 Second Supplemental Indenture to 1996 Indenture dated as of May 28, 2020 among Macy’s Retail Holdings, Inc., a
Exhibit 4.7 to May 2, 2020 Form 10-Q
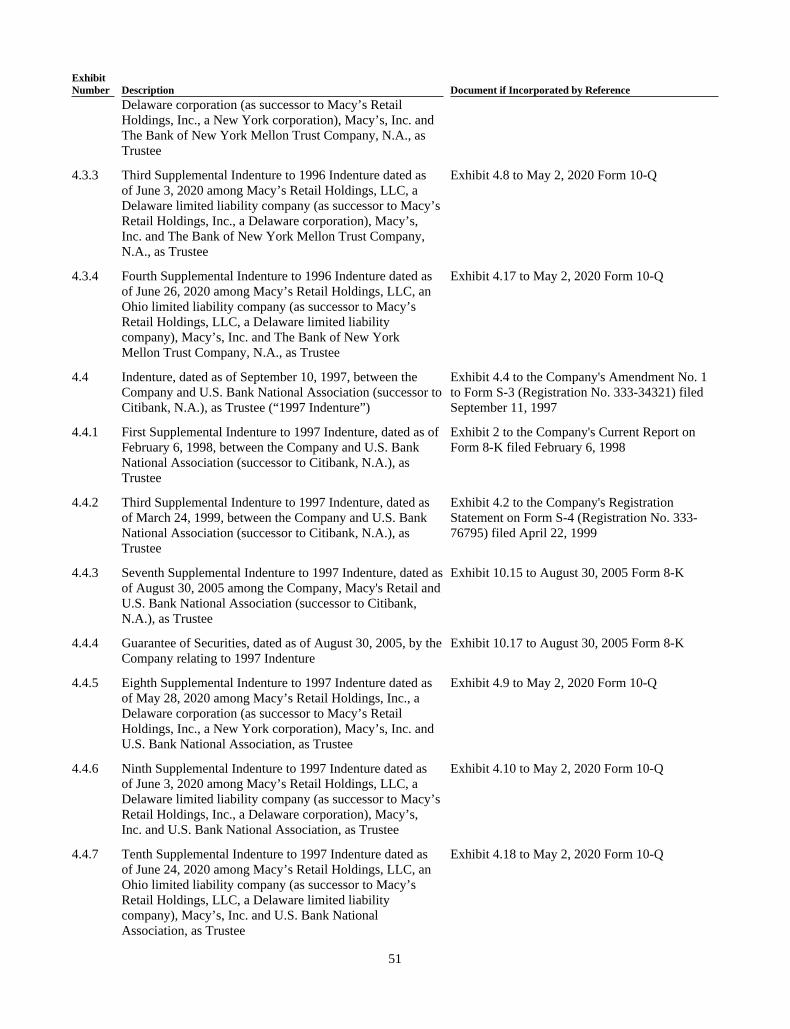
51
ExhibitNumber Description Document if Incorporated by Reference
Delaware corporation (as successor to Macy’s Retail Holdings, Inc., a New York corporation), Macy’s, Inc. and The Bank of New York Mellon Trust Company, N.A., as Trustee
4.3.3 Third Supplemental Indenture to 1996 Indenture dated as of June 3, 2020 among Macy’s Retail Holdings, LLC, a Delaware limited liability company (as successor to Macy’s Retail Holdings, Inc., a Delaware corporation), Macy’s, Inc. and The Bank of New York Mellon Trust Company, N.A., as Trustee
Exhibit 4.8 to May 2, 2020 Form 10-Q
4.3.4 Fourth Supplemental Indenture to 1996 Indenture dated as of June 26, 2020 among Macy’s Retail Holdings, LLC, an Ohio limited liability company (as successor to Macy’s Retail Holdings, LLC, a Delaware limited liability company), Macy’s, Inc. and The Bank of New York Mellon Trust Company, N.A., as Trustee
Exhibit 4.17 to May 2, 2020 Form 10-Q
4.4 Indenture, dated as of September 10, 1997, between the Company and U.S. Bank National Association (successor to Citibank, N.A.), as Trustee (“1997 Indenture”)
Exhibit 4.4 to the Company's Amendment No. 1 to Form S-3 (Registration No. 333-34321) filed September 11, 1997
4.4.1 First Supplemental Indenture to 1997 Indenture, dated as of February 6, 1998, between the Company and U.S. Bank National Association (successor to Citibank, N.A.), as Trustee
Exhibit 2 to the Company's Current Report on Form 8-K filed February 6, 1998
4.4.2 Third Supplemental Indenture to 1997 Indenture, dated as of March 24, 1999, between the Company and U.S. Bank National Association (successor to Citibank, N.A.), as Trustee
Exhibit 4.2 to the Company's Registration Statement on Form S-4 (Registration No. 333-76795) filed April 22, 1999
4.4.3 Seventh Supplemental Indenture to 1997 Indenture, dated as of August 30, 2005 among the Company, Macy's Retail and U.S. Bank National Association (successor to Citibank, N.A.), as Trustee
Exhibit 10.15 to August 30, 2005 Form 8-K
4.4.4 Guarantee of Securities, dated as of August 30, 2005, by the Company relating to 1997 Indenture
Exhibit 10.17 to August 30, 2005 Form 8-K
4.4.5 Eighth Supplemental Indenture to 1997 Indenture dated as of May 28, 2020 among Macy’s Retail Holdings, Inc., a Delaware corporation (as successor to Macy’s Retail Holdings, Inc., a New York corporation), Macy’s, Inc. and U.S. Bank National Association, as Trustee
Exhibit 4.9 to May 2, 2020 Form 10-Q
4.4.6 Ninth Supplemental Indenture to 1997 Indenture dated as of June 3, 2020 among Macy’s Retail Holdings, LLC, a Delaware limited liability company (as successor to Macy’s Retail Holdings, Inc., a Delaware corporation), Macy’s, Inc. and U.S. Bank National Association, as Trustee
Exhibit 4.10 to May 2, 2020 Form 10-Q
4.4.7 Tenth Supplemental Indenture to 1997 Indenture dated as of June 24, 2020 among Macy’s Retail Holdings, LLC, an Ohio limited liability company (as successor to Macy’s Retail Holdings, LLC, a Delaware limited liability company), Macy’s, Inc. and U.S. Bank National Association, as Trustee
Exhibit 4.18 to May 2, 2020 Form 10-Q
52
ExhibitNumber Description Document if Incorporated by Reference
4.5 Indenture, dated as of July 20, 2004, among the Company (as successor to May Delaware), Macy's Retail (f/k/a May New York) and BNY Mellon, as Trustee (“2004 Indenture”)
Exhibit 4.1 to Current Report on Form 8-K (File No. 001-00079) filed July 22, 2004 by May Delaware
4.5.1 First Supplemental Indenture to 2004 Indenture, dated as of August 30, 2005 among the Company (as successor to May Delaware), Macy's Retail and BNY Mellon (successor to J.P. Morgan Trust Company, National Association), as Trustee
Exhibit 10.10 to August 30, 2005 Form 8-K
4.6 Indenture, dated as of November 2, 2006, by and among Macy's Retail, the Company and U.S. Bank National Association, as Trustee (“2006 Indenture”)
Exhibit 4.6 to the Company's Registration Statement on Form S-3ASR (Registration No. 333-138376) filed November 2, 2006
4.6.1 Third Supplemental Indenture to 2006 Indenture, dated March 12, 2007, among Macy's Retail, the Company and U.S. Bank National Association, as Trustee
Exhibit 4.2 to the Company's Current Report on Form 8-K filed March 12, 2007
4.6.2 Sixth Supplemental Indenture to 2006 Indenture, dated December 10, 2015, among Macy's Retail, the Company and U.S. Bank National Association, as Trustee
Exhibit 4.2 to the Company's Current Report on Form 8-K filed December 10, 2015
4.6.3 Seventh Supplement Indenture to 2006 Indenture dated as of May 28, 2020 among Macy's Retail Holdings, Inc., a Delaware corporation (as successor to Macy's Retail Holdings, Inc., a New York corporation), Macy's, Inc. and U.S. Bank National Association, as Trustee
Exhibit 4.11 to May 2, 2020 Form 10-Q
4.6.4 Eighth Supplemental Indenture to 2006 Indenture dated as of June 3, 2020 among Macy’s Retail Holdings, LLC, a Delaware limited liability company (as successor to Macy’s Retail Holdings, Inc., a Delaware corporation), Macy’s, Inc. and U.S. Bank National Association, as Trustee
Exhibit 4.12 to May 2, 2020 Form 10-Q
4.6.5 Ninth Supplemental Indenture to 2006 Indenture dated as of June 24, 2020 among Macy’s Retail Holdings, LLC, an Ohio limited liability company (as successor to Macy’s Retail Holdings, LLC, a Delaware limited liability company), Macy’s, Inc. and U.S. Bank National Association, as Trustee
Exhibit 4.19 to May 2, 2020 Form 10-Q
4.7 Indenture, dated as of January 13, 2012, among Macy's Retail, the Company and BNY Mellon, as Trustee ("2012 Indenture")
Exhibit 4.1 to the Company's Current Report on Form 8-K filed January 13, 2012 (“January 13, 2012 Form 8-K”)
4.7.1 First Supplemental Trust Indenture to 2012 Indenture, dated as of January 13, 2012, among Macy's Retail, as issuer, the Company, as guarantor, and BNY Mellon, as trustee
Exhibit 4.2 to January 13, 2012 Form 8-K
4.7.2 Second Supplemental Trust Indenture to 2012 Indenture, dated as of January 13, 2012, among Macy's Retail, as issuer, the Company, as guarantor, and BNY Mellon, as trustee
Exhibit 4.3 to January 13, 2012 Form 8-K
4.7.3 Third Supplemental Trust Indenture, dated as of November 20, 2012, among Macy's Retail, as issuer, the Company, as guarantor, and BNY Mellon, as trustee
Exhibit 4.2 to the Company's Current Report on Form 8-K filed November 20, 2012 (“November 20, 2012 Form 8-K”)
4.7.4 Fourth Supplemental Trust Indenture, dated as of November Exhibit 4.3 to November 20, 2012 Form 8-K
53
ExhibitNumber Description Document if Incorporated by Reference
20, 2012, among Macy's Retail, as issuer, the Company, as guarantor, and BNY Mellon, as trustee
4.7.5 Fifth Supplemental Trust Indenture, dated as of September 6, 2013, among Macy's Retail, as issuer, the Company, as guarantor, and BNY Mellon, as trustee
Exhibit 4.2 to the Company's Current Report on Form 8-K filed September 6, 2013
4.7.6 Sixth Supplemental Trust Indenture, dated as of May 23, 2014, among Macy's Retail, as issuer, the Company, as guarantor, and BNY Mellon, as trustee
Exhibit 4.2 to the Company's Current Report on Form 8-K filed May 23, 2014
4.7.7 Seventh Supplemental Trust Indenture, dated as of November 18, 2014, among Macy's Retail, as issuer, the Company, as guarantor, and BNY Mellon, as trustee
Exhibit 4.2 to the Company's Current Report on Form 8-K filed November 18, 2014
4.7.8 Eighth Supplemental Indenture to 2012 Indenture dated as of May 28, 2020 among Macy’s Retail Holdings, Inc., a Delaware corporation (as successor to Macy’s Retail Holdings, Inc., a New York corporation), Macy’s, Inc. and The Bank of New York Mellon Trust Company, N.A., as Trustee
Exhibit 4.13 to May 2, 2020 Form 10-Q
4.7.9 Ninth Supplemental Indenture to 2012 Indenture dated as of June 3, 2020 among Macy’s Retail Holdings, LLC, a Delaware limited liability company (as successor to Macy’s Retail Holdings, Inc., a Delaware corporation), Macy’s, Inc. and The Bank of New York Mellon Trust Company, N.A., as Trustee
Exhibit 4.14 to May 2, 2020 Form 10-Q
4.7.10 Tenth Supplemental Indenture to 2012 Indenture dated as of June 26, 2020 among Macy’s Retail Holdings, LLC, an Ohio limited liability company (as successor to Macy’s Retail Holdings, LLC, a Delaware limited liability company), Macy’s, Inc. and The Bank of New York Mellon Trust Company, N.A., as Trustee
Exhibit 4.20 to May 2, 2020 Form 10-Q
4.8 Indenture dated as of June 8, 2020, among Macy's, Inc., as issuer, the guarantors party thereto and U.S. Bank National Association, as trustee and collateral trustee, relating to the Company's 8.375% Senior Secured Notes due 2025
Exhibit 4.1 to the Company's Current Report on Form 8-K filed June 9, 2020 (“June 9, 2020 Form 8-K”)
4.8.1 Form of 8.375% Senior Secured Note due 2025 Exhibit A to Exhibit 4.1 to June 9, 2020 Form 8-K
4.9 Indenture, dated as of July 28, 2020, among Macy’s Retail Holdings, LLC, as issuer, Macy’s, Inc., as guarantor, and U.S. Bank National Association, as trustee and collateral trustee, relating to Macy’s Retail Holdings, LLC’s 6.65% Senior Secured Debentures due 2024, 6.7% Senior Secured Debentures due 2028, 8.75% Senior Secured Debentures due 2029, 7.875% Senior Secured Debentures due 2030, 6.9% Senior Secured Debentures due 2032 and 6.7% Senior Secured Debentures due 2034
Exhibit 4.1 to the Company’s Current Report on Form 8-K filed July 28, 2020 (“July 28, 2020 Form 8-K”)
4.9.1 Form of 6.65% Senior Secured Debentures due 2024, 6.7% Senior Secured Debentures due 2028, 8.75% Senior Secured Debentures due 2029, 7.875% Senior Secured Debentures due 2030, 6.9% Senior Secured Debentures due 2032 and 6.7% Senior Secured Debentures due 2034
Exhibit A to Exhibit 4.1 to July 28, 2020 Form 8-K
54
ExhibitNumber Description Document if Incorporated by Reference
4.9.2 Fifth Supplemental Trust Indenture to 1996 Indenture, dated as of July 10, 2020, among Macy’s Retail Holdings, LLC, as issuer, Macy’s, Inc. as guarantor, and The Bank of New York Mellon Trust Company, N.A., as trustee, relating to Macy’s Retail Holdings, LLC’s 6.65% Senior Debentures due 2024, 6.7% Senior Debentures due 2028, 8.75% Senior Debentures due 2029, 7.875% Senior Debentures due 2030, 6.9% Senior Debentures due 2032 and 6.7% Senior Debentures due 2034
Exhibit 4.3 to July 28, 2020 Form 8-K
4.10 Description of the Company's Securities Registered under Section 12 of the Securities Exchange Act of 1934
Exhibit 4.8 to the Company’s Annual Report on Form 10-K (File No. 1-135360) for the fiscal year ended February 1, 2020 (“2019 Form 10-K”)
10.1 Credit Agreement, dated as of June 8, 2020, among Macy’s Inventory Funding LLC, as the Borrower, Macy’s Inventory Holdings LLC, as Parent, Bank of America, N.A., as Agent, L/C Issuer and Swing Line Lender, the other lenders party thereto, BofA Securities, Inc., Credit Suisse Loan Funding LLC, JPMorgan Chase Bank, N.A., Fifth Third Bank, National Association, MUFG Union Bank, N.A., PNC Capital Markets LLC and Wells Fargo Bank, National Association, as Joint Lead Arrangers and Joint Bookrunners, Credit Suisse Loan Funding LLC and JPMorgan Chase Bank, N.A., as Co-Syndication Agents and Fifth Third Bank, National Association, MUFG Union Bank, N.A., as Co-Syndication Agents and Fifth Third Bank, National Association, MUFG Union Bank, N.A., PNC Bank, National Association and Wells Fargo Bank, National Association, as Co-Documentation Agents
Exhibit 10.1 to June 9, 2020 Form 8-K
10.2 Credit Agreement, dated as of May 9, 2019, among the Company, Macy's Retail and Bank of America, N.A., as administrative agent
Exhibit 10.1 to the Company's Current Report on Form 8-K filed May 15, 2019 (“May 15, 2019 Form 8-K”)
10.3 Guarantee Agreement, dated as of May 9, 2019, among the Company, Macy's Retail and Bank of America, N.A., as administrative agent
Exhibit 10.2 to May 15, 2019 Form 8-K
10.4 Amendment No. 1 to Credit Agreement dated as of June 8, 2020 among Macy’s Retail Holdings, LLC, a Delaware limited liability company (f/k/a Macy’s Retail Holdings, Inc.), as Borrower, Macy’s, Inc., a Delaware corporation, as Parent, the Lenders party thereto, and Bank of America, N.A., as Administrative Agent
Exhibit 10.2 to June 9, 2020 Form 8-K
10.5 Tax Sharing Agreement, dated as of October 31, 2014, among Macy's, Inc. and members of the Affiliated Group
Exhibit 10.7 to the Company's Annual Report on Form 10-K (File No. 1-13536) for the fiscal year ended January 31, 2015 (“2014 Form 10-K”)
10.6+ Amended and Restated Credit Card Program Agreement, dated November 10, 2014, among the Company, FDS Bank, Macy's Credit and Customer Services, Inc. (“MCCS”), Macy's West Stores, Inc., Bloomingdales, Inc., Department Stores National Bank ("DSNB") and Citibank, N.A.
Exhibit 10.1 to the Company's Quarterly Report on Form 10-Q filed December 8, 2014
10.7 Senior Executive Incentive Compensation Plan, as amended March 26, 2020 *
Exhibit 10.3 to May 2, 2020 Form 10-Q
55
ExhibitNumber Description Document if Incorporated by Reference
10.8 Form of Indemnification Agreement * Exhibit 10.14 to the Registration Statement on Form 10 (File No. 1-10951), filed November 27, 1991
10.9 Executive Severance Plan, effective November 1, 2009, as revised and restated January 1, 2014 *
Exhibit 10.14 to the Company’s Annual Report on Form 10-K (File No. 1-13536) for the fiscal year ended February 1, 2014 (“2013 Form 10-K”)
10.9.1 Senior Executive Severance Plan effective as of April 1, 2018 *
Exhibit 10.9.1 to the Company's Annual Report on Form 10-K (File No. 1-13536) for the fiscal year ended February 3, 2018 ("2017 Form 10-K")
10.10 Form of Nonqualified Stock Option Agreement under the 2009 Omnibus Incentive Compensation Plan (for Executives and Key Employees) *
Exhibit 10.15.3 to the Company's Annual Report on Form 10-K (File No. 1-13536) for the fiscal year ended February 2, 2013 ("2012 Form 10-K")
10.10.1 Form of Nonqualified Stock Option Agreement under the Amended and Restated 2009 Omnibus Incentive Compensation Plan (for Executives and Key Employees) *
Exhibit 10.14.4 to 2014 Form 10-K
10.10.2 Form of Nonqualified Stock Option Agreement under the Amended and Restated 2009 Omnibus Incentive Compensation Plan (for Executives and Key Employees), as amended *
Exhibit 10.10.5 to 2017 Form 10-K
10.10.3 Form of Stock Option Terms and Conditions under the 2018 Equity and Incentive Compensation Plan *
Exhibit 10.1 to the Company's Quarterly Report on Form 10-Q (File No. 1-13536) for the quarter ended May 4, 2019
10.11 Form of Time-Based Restricted Stock Agreement under the 2009 Omnibus Incentive Compensation Plan *
Exhibit 10.3 to the Company's Current Report on Form 8-K filed March 25, 2010
10.12 2019-2021 Performance-Based Restricted Stock Unit Terms and Conditions under the 2018 Equity and Incentive Compensation Plan *
Exhibit 10.2 to the Company's Quarterly Report on Form 10-Q (File No. 1-13536) for the quarter ended May 4, 2019
10.12.1 2020-2022 Performance-Based Restricted Stock Unit Terms and Conditions under the 2018 Equity and Incentive Compensation Plan*
Exhibit 10.3 to the Company’s Quarterly Report on Form 10-Q (File No. 1-13536) for the quarter ended August 1, 2020
10.13 Form of Time-Based Restricted Stock Unit Agreement under the 2009 Omnibus Incentive Compensation Plan*
Exhibit 10.19 to 2012 Form 10-K
10.13.1 Form of Time-Based Restricted Stock Unit Agreement under the Amended and Restated 2009 Omnibus Incentive Compensation Plan *
Exhibit 10.18.1 to 2014 Form 10-K
10.13.2 Form of Time-Based Restricted Stock Unit Agreement under the Amended and Restated 2009 Omnibus Incentive Compensation Plan (with dividend equivalents) *
Exhibit 10.13.2 to 2017 Form 10-K
10.13.3 Form of Time-Based Restricted Stock Unit Agreement under the Amended and Restated 2009 Omnibus Incentive Compensation Plan, as amended *
Exhibit 10.13.3 to 2017 Form 10-K
10.13.4 Form of Time-Based Restricted Stock Unit Terms and Conditions under the 2018 Equity and Incentive Compensation Plan *
Exhibit 10.3 to the Company's Quarterly Report on Form 10-Q (File No. 1-13536) for the quarter ended May 4, 2019
10.14 Supplementary Executive Retirement Plan * Exhibit 10.29 to the Company’s Annual Report on Form 10-K (File No. 1-13536) for the fiscal
56
ExhibitNumber Description Document if Incorporated by Reference
year ended January 31, 2009 (“2008 Form 10-K”)
10.14.1 First Amendment to the Supplementary Executive Retirement Plan effective January 1, 2012 *
Exhibit 10.21.1 to the Company's Annual Report on Form 10-K (File No. 1-13536) for the fiscal year ended January 28, 2012
10.14.2 Second Amendment to Supplementary Executive Retirement Plan effective January 1, 2012 *
Exhibit 10.20.2 to 2012 Form 10-K
10.14.3 Third Amendment to Supplementary Executive Retirement Plan effective December 31, 2013 *
Exhibit 10.20.3 to 2013 Form 10-K
10.15 Executive Deferred Compensation Plan * Exhibit 10.30 to 2008 Form 10-K
10.15.1 First Amendment to Executive Deferred Compensation Plan effective December 31, 2013 *
Exhibit 10.21.1 to 2013 Form 10-K
10.16 Macy's, Inc. 401(k) Retirement Investment Plan (the "Plan") (amending and restating the Macy's, Inc. 401(k) Retirement Investment Plan) effective as of January 1, 2014 *
Exhibit 10.22 to 2013 Form 10-K
10.16.1 First Amendment to the Plan regarding matching contributions with respect to the Plan’s plan years beginning on and after January 1, 2014, effective January 1, 2014 *
Exhibit 10.21.1 to 2014 Form 10-K
10.16.2 Second Amendment to the Plan regarding marriage status, effective January 1, 2014 *
Exhibit 10.21.2 to 2014 Form 10-K
10.16.3 Third Amendment to the Plan regarding matching contributions with respect to the Plan’s plan years beginning on and after January 1, 2014 *
Exhibit 10.21.3 to 2014 Form 10-K
10.16.4 Fourth Amendment to the Plan regarding rules applicable to Puerto Rico participants effective January 1, 2011 (and for the Plan's plan years beginning on and after that date)*
Exhibit 10.17.4 to the Company's Annual Report on Form 10-K (File No. 1-13536) for the fiscal year ended January 30, 2016 ("2015 Form 10-K")
10.16.5 Fifth Amendment to the Plan regarding eligible associates to participate (pre-tax deferrals only, no match) immediately upon hire effective as of January 1, 2014*
Exhibit 10.17.5 to 2015 Form 10-K
10.17 Director Deferred Compensation Plan * Exhibit 10.33 to 2008 Form 10-K
10.18 Macy's, Inc. Amended and Restated 2009 Omnibus Incentive Compensation Plan *
Appendix B to the Company's Proxy Statement dated April 2, 2014
10.19 Macy's, Inc. 2018 Equity and Incentive Compensation Plan *
Appendix B to the Company's Proxy Statement dated April 4, 2018
10.20 Macy's, Inc. Deferred Compensation Plan (Amended and restated effective as of August 1, 2018) *
Exhibit 10.18 to 2019 Form 10-K
10.21 Change in Control Plan, effective November 1, 2009, as revised and restated effective April 1, 2018 *
Exhibit 10.20 to 2017 Form 10-K
10.22 Time Sharing Agreement between Macy's, Inc. and Jeff Gennette, dated June 14, 2017 *
Exhibit 10.21.1 to 2017 Form 10-K
10.23 Advisory Agreement dated as of April 6, 2020 by and between Macy’s, Inc. and Paula A. Price*
Exhibit 10.1 to the Company’s Current Report on Form 8-K filed April 7, 2020
21 Subsidiaries
57
ExhibitNumber Description Document if Incorporated by Reference
22 List of Subsidiary Guarantors
23 Consent of KPMG LLP
24 Powers of Attorney
31.1 Certification of Chief Executive Officer pursuant to Rule 13a-14(a)
31.2 Certification of Chief Financial Officer pursuant to Rule 13a-14(a)
32.1 Certification by Chief Executive Officer under Section 906 of the Sarbanes-Oxley Act
32.2 Certification by Chief Financial Officer under Section 906 of the Sarbanes-Oxley Act
101 The following financial statements from Macy's, Inc.’s Annual Report on Form 10-K for the year ended January 30, 2021, filed March 29, 2021, formatted in iXBRL (Inline eXtensible Business Reporting Language): (i) Consolidated Statements of Operations, (ii) Consolidated Statements of Comprehensive Income (Loss), (iii) Consolidated Balance Sheets, (iv) Consolidated Statements of Changes in Shareholders’ Equity, (v) Consolidated Statements of Cash Flows, and (vi) the Notes to Consolidated Financial Statements, tagged as block of text and in detail.
104 Cover Page Interactive Data File (formatted as iXBRL and contained in Exhibit 101)
+ Portions of the exhibit have been omitted pursuant to a request for confidential treatment. The confidential portions have been provided to the SEC.
* Constitutes a compensatory plan or arrangement.
58
SIGNATURES
Pursuant to the requirements of Section 13 or 15(d) of the Securities Exchange Act of 1934, the Registrant has duly caused this report to be signed on its behalf by the undersigned, thereunto duly authorized.
MACY’S, INC.
By: /s/ ELISA D. GARCIAElisa D. Garcia
Executive Vice President, Chief Legal Officer and Secretary
Date: March 29, 2021
Pursuant to the requirements of the Securities Exchange Act of 1934, this report has been signed below by the following persons on behalf of the Registrant and in the capacities indicated on March 29, 2021.
* * *Jeff Gennette Adrian V. Mitchell Paul Griscom
Chief Executive Officer (principal executive officer), Chairman of the Board and Director
Executive Vice President and Chief Financial Officer (principal financial officer)
Senior Vice President and Controller (principal accounting officer)
* * *David P. Abney Francis S. Blake Torrence N. Boone
Director Director Director
* * *John A. Bryant Deirdre P. Connelly Leslie D. Hale
Director Director Director
* * *William H. Lenehan Sara Levinson Joyce M. Roché
Director Director Director
* *Paul C. Varga Marna C. Whittington
Director Director
* The undersigned, by signing her name hereto, does sign and execute this Annual Report on Form 10-K pursuant to the Powers of Attorney executed by the above-named officers and directors and filed herewith.
By: /s/ ELISA D. GARCIAElisa D. GarciaAttorney-in-Fact
F-1
INDEX TO CONSOLIDATED FINANCIAL STATEMENTS
PageReport of Management F-2
Report of Independent Registered Public Accounting Firm F-3
Consolidated Statements of Operations for the fiscal years ended January 30, 2021, February 1, 2020 and February 2, 2019
F-6
Consolidated Statements of Comprehensive Income (Loss) for the fiscal years ended January 30, 2021, February 1, 2020 and February 2, 2019
F-7
Consolidated Balance Sheets as of January 30, 2021 and February 1, 2020 F-8
Consolidated Statements of Changes in Shareholders’ Equity for the fiscal years ended January 30, 2021, February 1, 2020 and February 2, 2019
F-9
Consolidated Statements of Cash Flows for the fiscal years ended January 30, 2021, February 1, 2020 and February 2, 2019
F-10
Notes to Consolidated Financial Statements F-11
F-2
REPORT OF MANAGEMENT
To the Shareholders of Macy’s, Inc.:
The integrity and consistency of the Consolidated Financial Statements of Macy’s, Inc. and subsidiaries, which were prepared in accordance with accounting principles generally accepted in the United States of America, are the responsibility of management and properly include some amounts that are based upon estimates and judgments.
The Company maintains a system of internal accounting controls, which is supported by a program of internal audits with appropriate management follow-up action, to provide reasonable assurance, at appropriate cost, that the Company’s assets are protected and transactions are properly recorded. Additionally, the integrity of the financial accounting system is based on careful selection and training of qualified personnel, organizational arrangements which provide for appropriate division of responsibilities and communication of established written policies and procedures.
The Company’s management is responsible for establishing and maintaining adequate internal control over financial reporting, as defined in Exchange Act Rule 13a-15(f) and has issued Management’s Report on Internal Control over Financial Reporting.
The Consolidated Financial Statements of the Company have been audited by KPMG LLP. Their report expresses their opinion as to the fair presentation, in all material respects, of the financial statements and is based upon their independent audits.
The Audit Committee, composed solely of outside directors, meets periodically with KPMG LLP, the internal auditors and representatives of management to discuss auditing and financial reporting matters. In addition, KPMG LLP and the Company’s internal auditors meet periodically with the Audit Committee without management representatives present and have free access to the Audit Committee at any time. The Audit Committee is responsible for recommending to the Board of Directors the engagement of the independent registered public accounting firm and the general oversight review of management’s discharge of its responsibilities with respect to the matters referred to above.
Jeff GennetteChief Executive Officer, Chairman of the Board and Director
Adrian V. MitchellExecutive Vice President and Chief Financial Officer
Paul GriscomSenior Vice President, Controller
F-3
Report of Independent Registered Public Accounting Firm
To the Shareholders and Board of Directors Macy’s, Inc.:
Opinions on the Consolidated Financial Statements and Internal Control Over Financial Reporting
We have audited the accompanying consolidated balance sheets of Macy’s, Inc. and subsidiaries (the Company) as of January 30, 2021 and February 1, 2020, the related consolidated statements of operations, comprehensive income (loss), changes in shareholders’ equity, and cash flows for each of the years in the three-year period ended January 30, 2021 and the related notes (collectively, the consolidated financial statements). We also have audited the Company’s internal control over financial reporting as of January 30, 2021, based on criteria established in Internal Control – Integrated Framework (2013) issued by the Committee of Sponsoring Organizations of the Treadway Commission.
In our opinion, the consolidated financial statements referred to above present fairly, in all material respects, the financial position of the Company as of January 30, 2021 and February 1, 2020, and the results of its operations and its cash flows for each of the years in the three-year period ended January 30, 2021, in conformity with U.S. generally accepted accounting principles. Also in our opinion, the Company maintained, in all material respects, effective internal control over financial reporting as of January 30, 2021 based on criteria established in Internal Control – Integrated Framework (2013) issued by the Committee of Sponsoring Organizations of the Treadway Commission.
Change in Accounting Principle
As discussed in Note 1 to the consolidated financial statements, the Company changed its method of accounting for leases as of February 3, 2019 due to the adoption of Accounting Standards Codification Topic 842, Leases.
Basis for Opinions
The Company’s management is responsible for these consolidated financial statements, for maintaining effective internal control over financial reporting, and for its assessment of the effectiveness of internal control over financial reporting, included in the accompanying 9A(b), “Management’s Annual Report on Internal Control over Financial Reporting.” Our responsibility is to express an opinion on the Company’s consolidated financial statements and an opinion on the Company’s internal control over financial reporting based on our audits. We are a public accounting firm registered with the Public Company Accounting Oversight Board (United States) (PCAOB) and are required to be independent with respect to the Company in accordance with the U.S. federal securities laws and the applicable rules and regulations of the Securities and Exchange Commission and the PCAOB.
We conducted our audits in accordance with the standards of the PCAOB. Those standards require that we plan and perform the audits to obtain reasonable assurance about whether the consolidated financial statements are free of material misstatement, whether due to error or fraud, and whether effective internal control over financial reporting was maintained in all material respects.
Our audits of the consolidated financial statements included performing procedures to assess the risks of material misstatement of the consolidated financial statements, whether due to error or fraud, and performing procedures that respond to those risks. Such procedures included examining, on a test basis, evidence regarding the amounts and disclosures in the consolidated financial statements. Our audits also included evaluating the accounting principles used and significant estimates made by management, as well as evaluating the overall presentation of the consolidated financial statements. Our audit of internal control over financial reporting included obtaining an understanding of internal control over financial reporting, assessing the risk that a material weakness exists, and testing and evaluating the design and operating effectiveness of internal control based on the assessed risk. Our audits also included performing such other procedures as we considered necessary in the circumstances. We believe that our audits provide a reasonable basis for our opinions.
Definition and Limitations of Internal Control Over Financial Reporting
A company’s internal control over financial reporting is a process designed to provide reasonable assurance regarding the reliability of financial reporting and the preparation of financial statements for external purposes in accordance with generally accepted accounting principles. A company’s internal control over financial reporting includes those policies and procedures that (1) pertain to the maintenance of records that, in reasonable detail, accurately and fairly reflect the transactions and dispositions of the assets of the company; (2) provide reasonable assurance that transactions are recorded as necessary to permit preparation of financial statements in accordance with generally accepted accounting principles, and that receipts and
F-4
expenditures of the company are being made only in accordance with authorizations of management and directors of the company; and (3) provide reasonable assurance regarding prevention or timely detection of unauthorized acquisition, use, or disposition of the company’s assets that could have a material effect on the financial statements.
Because of its inherent limitations, internal control over financial reporting may not prevent or detect misstatements. Also, projections of any evaluation of effectiveness to future periods are subject to the risk that controls may become inadequate because of changes in conditions, or that the degree of compliance with the policies or procedures may deteriorate.
Critical Audit Matters
The critical audit matters communicated below are matters arising from the current period audit of the consolidated financial statements that were communicated or required to be communicated to the audit committee and that: (1) relate to accounts or disclosures that are material to the consolidated financial statements and (2) involved our especially challenging, subjective, or complex judgments. The communication of critical audit matters does not alter in any way our opinion on the consolidated financial statements, taken as a whole, and we are not, by communicating the critical audit matters below, providing separate opinions on the critical audit matters or on the accounts or disclosures to which they relate.
Assessment of the liability for unrecognized tax benefits
As discussed in Note 9 to the consolidated financial statements, the Company has recorded gross unrecognized tax benefits, including interest and penalties, of $173 million as of January 30, 2021. The Company recognizes tax positions when it is more likely than not that the tax position will be sustained on examination based on the technical merits of the position. Uncertain tax positions meeting the recognition threshold are then measured at the largest amount of benefit that is more likely than not to be realized upon ultimate settlement.
We identified the assessment of the liability for unrecognized tax benefits as a critical audit matter. Complex auditor judgment was required in evaluating the Company’s interpretation of tax law and its estimate of the ultimate resolution of the tax positions.
The following are the primary procedures we performed to address this critical audit matter. We evaluated the design and tested the operating effectiveness of certain internal controls related to the Company’s unrecognized tax benefits process, including a control related to the interpretation of tax law and the estimate of the ultimate resolution of the tax positions. Since tax law is complex and often subject to interpretation, we involved tax professionals with specialized skills and knowledge. They assisted us in evaluating the estimate of the ultimate resolution of the tax positions taken by the Company and the impact on unrecognized tax benefits by assessing tax examination activity and evaluating the tax positions based on tax law, regulations, and other authoritative guidance with respect to statute expirations and reserve additions.
Assessment of the carrying value of certain property and equipment
As discussed in Note 1 to the consolidated financial statements, the Company evaluates the carrying value of property and equipment whenever events or changes in circumstances indicate that a potential impairment has occurred. As of January 30, 2021, net property and equipment was $5,940 million. When a potential impairment has occurred, an impairment write-down is recorded if the carrying value of the long-lived asset exceeds its fair value. As discussed in Note 4 to the consolidated financial statements, the Company recognized $200 million of impairments primarily related to long-lived tangible and right of use assets in the year ended January 30, 2021.
We identified the assessment of the carrying value of certain property and equipment as a critical audit matter. Subjective and challenging auditor judgment was required to assess the fair value estimates made related to certain properties, specifically identifying comparable sales transactions and market rent assumptions, as well as assessing adjustments to the comparable market data based on the specific characteristics of the property.
The following are the primary procedures we performed to address this critical audit matter. We evaluated the design and tested the operating effectiveness of certain internal controls related to the Company’s impairment assessment process for property and equipment, including controls related to fair value estimates made related to the underlying properties. We involved valuation professionals with specialized skills and knowledge who assisted in:
• Developing independent fair value estimates for certain properties by selecting comparable sales transactions and market rent assumptions based on publicly available market data for comparable assets, and making certain adjustments considering the location, quality of the property and real estate market conditions
• Comparing the independent fair value estimates for certain properties to the Company’s fair value estimates that were ultimately used to identify and record, if applicable, impairment.
F-5
Assessment of the carrying value of goodwill in the Macy’s reporting unit
As discussed in Notes 4 and 6 to the consolidated financial statements, during 2020 the Company recognized $2,982 million of goodwill impairment for the Macy’s reporting unit. The goodwill impairment resulted from a sustained decline in the Company's market capitalization and changes in the Company’s long-term projections driven largely by the impacts of the COVID-19 pandemic. The Company reviews goodwill for impairment annually and whenever events or changes in circumstances indicate that the carrying value of a reporting unit likely exceeds its fair value. This involves estimating the fair value of reporting units using a market approach or a combination of a market approach and income approach, as appropriate.
We identified the assessment of the carrying value of goodwill in the Macy’s reporting unit as a critical audit matter. Specialized skills and knowledge were required to evaluate the company-specific risk premium applied in discounting management’s financial projections. Subjective and challenging auditor judgment was required to evaluate comparable market-based information, including assessing the control premium implied by a comparison of management’s discounted financial projections to the Company’s market capitalization.
The following are the primary procedures we performed to address this critical audit matter. We evaluated the design and tested the operating effectiveness of certain internal controls related to the assessment of the carrying value of goodwill in the Macy’s reporting unit, including a control related to management's review of the company-specific risk premium. We involved valuation professionals with specialized skills and knowledge who assisted in evaluating the company-specific risk premium by:
• Considering how management’s financial projections compared to publicly-available forecasts of comparable companies
• Evaluating the implied control premium calculated as part of a market capitalization reconciliation relative to a range of control premiums on observed transactions in the industry.
/s/ KPMG LLP
We have served as the Company’s auditor since 1988.
Cincinnati, OhioMarch 29, 2021
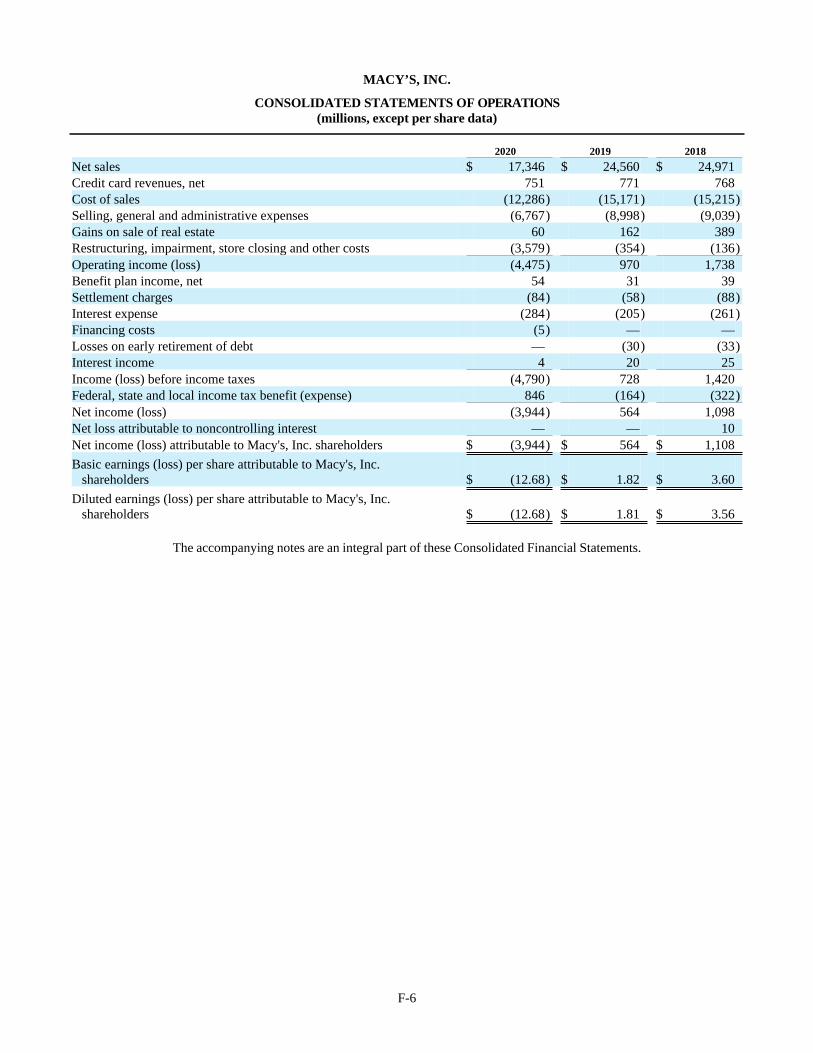
F-6
MACY’S, INC.
CONSOLIDATED STATEMENTS OF OPERATIONS(millions, except per share data)
2020 2019 2018
Net sales $ 17,346 $ 24,560 $ 24,971 Credit card revenues, net 751 771 768 Cost of sales (12,286) (15,171) (15,215)Selling, general and administrative expenses (6,767) (8,998) (9,039)Gains on sale of real estate 60 162 389 Restructuring, impairment, store closing and other costs (3,579) (354) (136)Operating income (loss) (4,475) 970 1,738 Benefit plan income, net 54 31 39 Settlement charges (84) (58) (88)Interest expense (284) (205) (261)Financing costs (5) — — Losses on early retirement of debt — (30) (33)Interest income 4 20 25 Income (loss) before income taxes (4,790) 728 1,420 Federal, state and local income tax benefit (expense) 846 (164) (322)Net income (loss) (3,944) 564 1,098 Net loss attributable to noncontrolling interest — — 10 Net income (loss) attributable to Macy's, Inc. shareholders $ (3,944) $ 564 $ 1,108
Basic earnings (loss) per share attributable to Macy's, Inc. shareholders $ (12.68) $ 1.82 $ 3.60
Diluted earnings (loss) per share attributable to Macy's, Inc. shareholders $ (12.68) $ 1.81 $ 3.56
The accompanying notes are an integral part of these Consolidated Financial Statements.
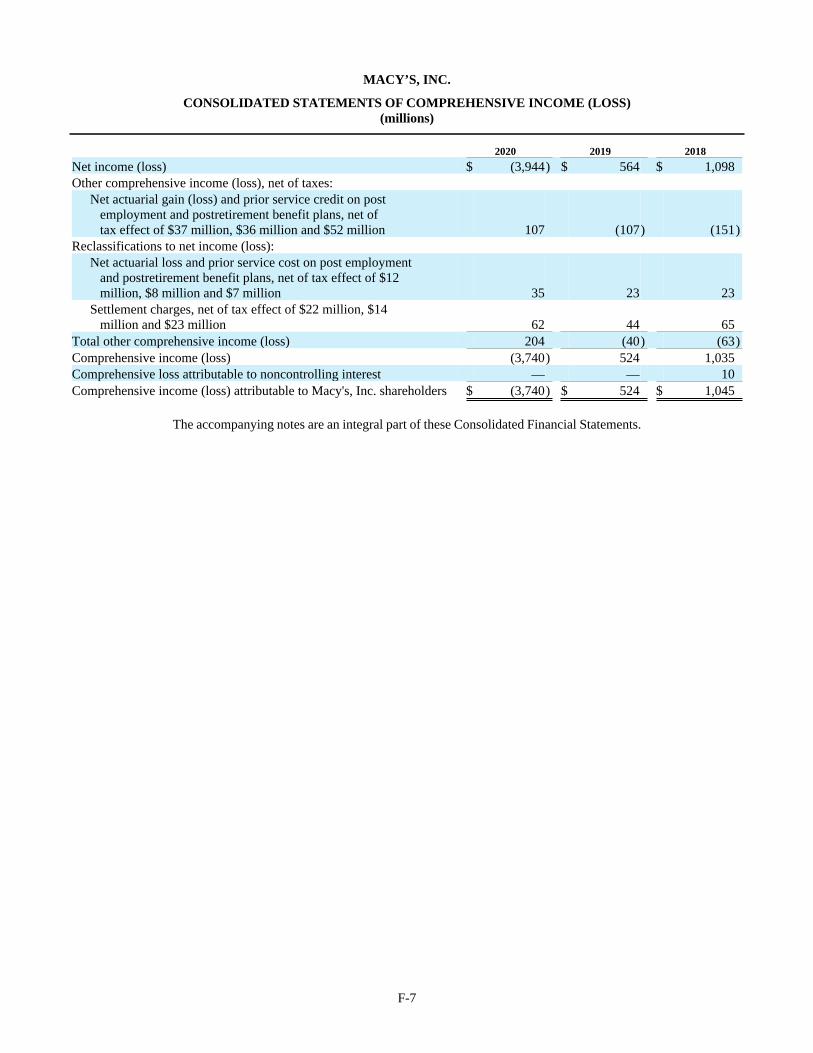
F-7
MACY’S, INC.
CONSOLIDATED STATEMENTS OF COMPREHENSIVE INCOME (LOSS)(millions)
2020 2019 2018
Net income (loss) $ (3,944) $ 564 $ 1,098 Other comprehensive income (loss), net of taxes:
Net actuarial gain (loss) and prior service credit on post employment and postretirement benefit plans, net of tax effect of $37 million, $36 million and $52 million 107 (107) (151)
Reclassifications to net income (loss): Net actuarial loss and prior service cost on post employment and postretirement benefit plans, net of tax effect of $12 million, $8 million and $7 million 35 23 23 Settlement charges, net of tax effect of $22 million, $14 million and $23 million 62 44 65
Total other comprehensive income (loss) 204 (40) (63)Comprehensive income (loss) (3,740) 524 1,035 Comprehensive loss attributable to noncontrolling interest — — 10 Comprehensive income (loss) attributable to Macy's, Inc. shareholders $ (3,740) $ 524 $ 1,045
The accompanying notes are an integral part of these Consolidated Financial Statements.
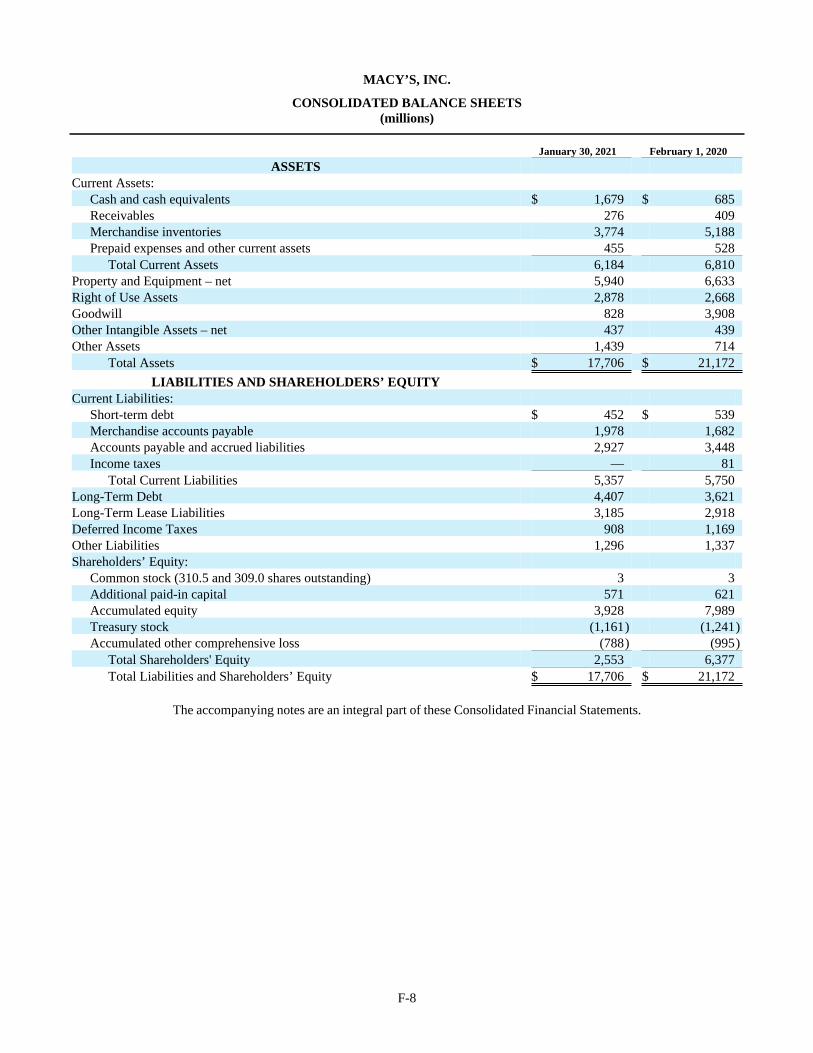
F-8
MACY’S, INC.
CONSOLIDATED BALANCE SHEETS(millions)
January 30, 2021 February 1, 2020
ASSETS Current Assets:
Cash and cash equivalents $ 1,679 $ 685 Receivables 276 409 Merchandise inventories 3,774 5,188 Prepaid expenses and other current assets 455 528
Total Current Assets 6,184 6,810 Property and Equipment – net 5,940 6,633 Right of Use Assets 2,878 2,668 Goodwill 828 3,908 Other Intangible Assets – net 437 439 Other Assets 1,439 714
Total Assets $ 17,706 $ 21,172
LIABILITIES AND SHAREHOLDERS’ EQUITY Current Liabilities:
Short-term debt $ 452 $ 539 Merchandise accounts payable 1,978 1,682 Accounts payable and accrued liabilities 2,927 3,448 Income taxes — 81
Total Current Liabilities 5,357 5,750 Long-Term Debt 4,407 3,621 Long-Term Lease Liabilities 3,185 2,918 Deferred Income Taxes 908 1,169 Other Liabilities 1,296 1,337 Shareholders’ Equity:
Common stock (310.5 and 309.0 shares outstanding) 3 3 Additional paid-in capital 571 621 Accumulated equity 3,928 7,989 Treasury stock (1,161) (1,241)Accumulated other comprehensive loss (788) (995)
Total Shareholders' Equity 2,553 6,377 Total Liabilities and Shareholders’ Equity $ 17,706 $ 21,172
The accompanying notes are an integral part of these Consolidated Financial Statements.
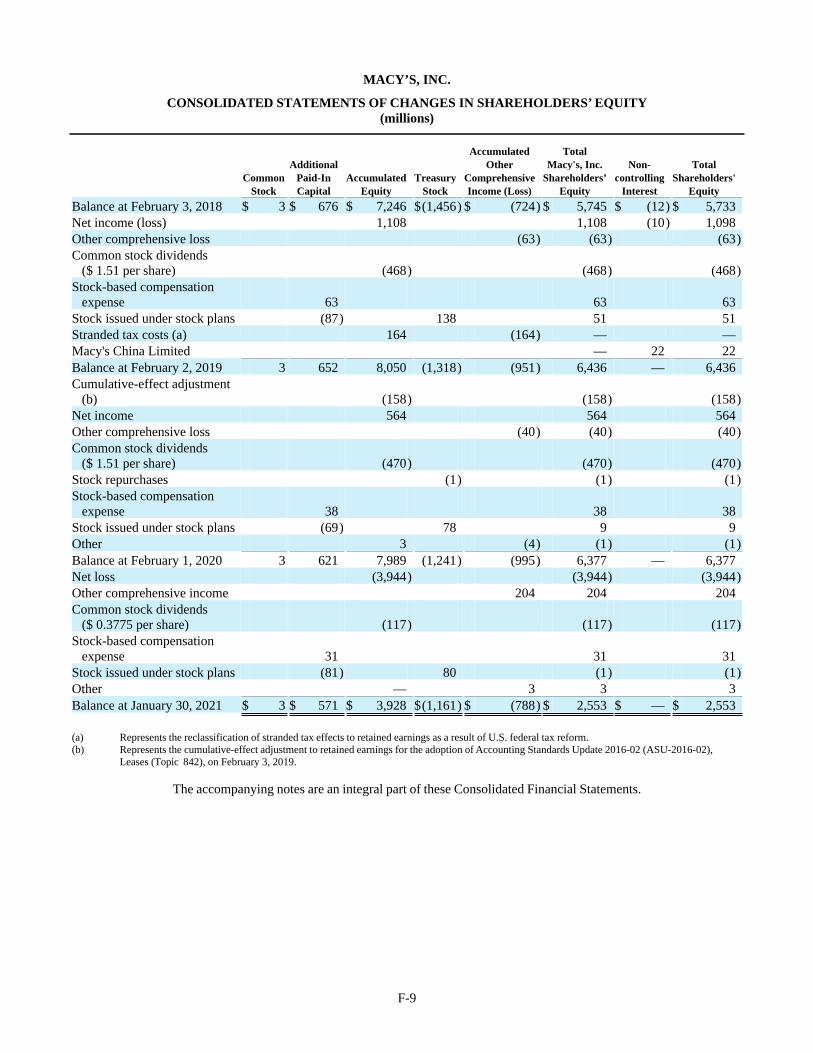
F-9
MACY’S, INC.
CONSOLIDATED STATEMENTS OF CHANGES IN SHAREHOLDERS’ EQUITY(millions)
Accumulated Total Additional Other Macy's, Inc. Non- Total Common Paid-In Accumulated Treasury Comprehensive Shareholders’ controlling Shareholders' Stock Capital Equity Stock Income (Loss) Equity Interest Equity
Balance at February 3, 2018 $ 3 $ 676 $ 7,246 $(1,456) $ (724) $ 5,745 $ (12) $ 5,733 Net income (loss) 1,108 1,108 (10) 1,098 Other comprehensive loss (63) (63) (63)Common stock dividends ($ 1.51 per share) (468) (468) (468)Stock-based compensation expense 63 63 63 Stock issued under stock plans (87) 138 51 51 Stranded tax costs (a) 164 (164) — — Macy's China Limited — 22 22 Balance at February 2, 2019 3 652 8,050 (1,318) (951) 6,436 — 6,436 Cumulative-effect adjustment (b) (158) (158) (158)Net income 564 564 564 Other comprehensive loss (40) (40) (40)Common stock dividends ($ 1.51 per share) (470) (470) (470)Stock repurchases (1) (1) (1)Stock-based compensation expense 38 38 38 Stock issued under stock plans (69) 78 9 9 Other 3 (4) (1) (1)Balance at February 1, 2020 3 621 7,989 (1,241) (995) 6,377 — 6,377 Net loss (3,944) (3,944) (3,944)Other comprehensive income 204 204 204 Common stock dividends ($ 0.3775 per share) (117) (117) (117)Stock-based compensation expense 31 31 31 Stock issued under stock plans (81) 80 (1) (1)Other — 3 3 3 Balance at January 30, 2021 $ 3 $ 571 $ 3,928 $(1,161) $ (788) $ 2,553 $ — $ 2,553
(a) Represents the reclassification of stranded tax effects to retained earnings as a result of U.S. federal tax reform.(b) Represents the cumulative-effect adjustment to retained earnings for the adoption of Accounting Standards Update 2016-02 (ASU-2016-02),
Leases (Topic 842), on February 3, 2019.
The accompanying notes are an integral part of these Consolidated Financial Statements.
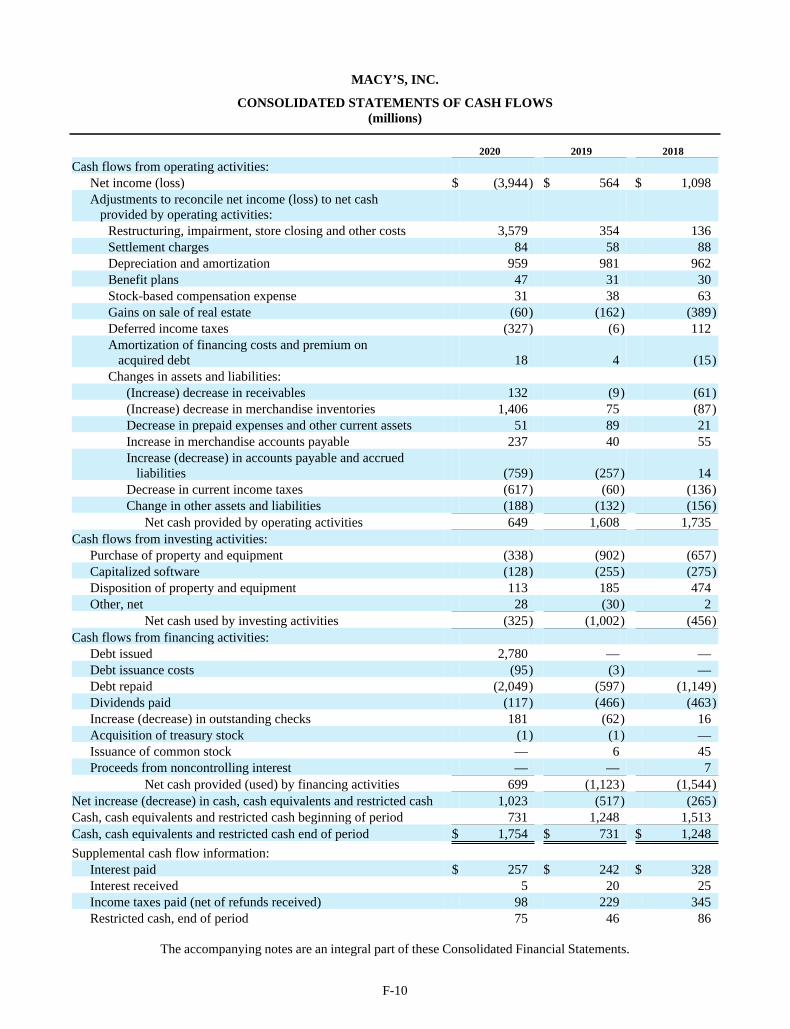
F-10
MACY’S, INC.
CONSOLIDATED STATEMENTS OF CASH FLOWS(millions)
2020 2019 2018
Cash flows from operating activities: Net income (loss) $ (3,944) $ 564 $ 1,098 Adjustments to reconcile net income (loss) to net cash provided by operating activities:
Restructuring, impairment, store closing and other costs 3,579 354 136 Settlement charges 84 58 88 Depreciation and amortization 959 981 962 Benefit plans 47 31 30 Stock-based compensation expense 31 38 63 Gains on sale of real estate (60) (162) (389)Deferred income taxes (327) (6) 112 Amortization of financing costs and premium on acquired debt 18 4 (15)Changes in assets and liabilities:
(Increase) decrease in receivables 132 (9) (61)(Increase) decrease in merchandise inventories 1,406 75 (87)Decrease in prepaid expenses and other current assets 51 89 21 Increase in merchandise accounts payable 237 40 55 Increase (decrease) in accounts payable and accrued liabilities (759) (257) 14 Decrease in current income taxes (617) (60) (136)Change in other assets and liabilities (188) (132) (156)
Net cash provided by operating activities 649 1,608 1,735 Cash flows from investing activities:
Purchase of property and equipment (338) (902) (657)Capitalized software (128) (255) (275)Disposition of property and equipment 113 185 474 Other, net 28 (30) 2
Net cash used by investing activities (325) (1,002) (456)Cash flows from financing activities:
Debt issued 2,780 — — Debt issuance costs (95) (3) — Debt repaid (2,049) (597) (1,149)Dividends paid (117) (466) (463)Increase (decrease) in outstanding checks 181 (62) 16 Acquisition of treasury stock (1) (1) — Issuance of common stock — 6 45 Proceeds from noncontrolling interest — — 7
Net cash provided (used) by financing activities 699 (1,123) (1,544)Net increase (decrease) in cash, cash equivalents and restricted cash 1,023 (517) (265)Cash, cash equivalents and restricted cash beginning of period 731 1,248 1,513 Cash, cash equivalents and restricted cash end of period $ 1,754 $ 731 $ 1,248
Supplemental cash flow information: Interest paid $ 257 $ 242 $ 328 Interest received 5 20 25 Income taxes paid (net of refunds received) 98 229 345 Restricted cash, end of period 75 46 86
The accompanying notes are an integral part of these Consolidated Financial Statements.
F-11
MACY’S, INC.
NOTES TO CONSOLIDATED FINANCIAL STATEMENTS
1. Organization and Summary of Significant Accounting Policies
Nature of Operations
Macy’s, Inc., together with its subsidiaries (the “Company”), is an omnichannel retail organization operating stores, websites and mobile applications under three brands (Macy’s, Bloomingdale’s and bluemercury) that sell a wide range of merchandise, including apparel and accessories (men's, women's and kids'), cosmetics, home furnishings and other consumer goods. The Company has stores in 43 states, the District of Columbia, Puerto Rico and Guam. As of January 30, 2021, the Company’s operations and operating segments were conducted through Macy’s, Market by Macy’s, Macy's Backstage, Bloomingdale’s, Bloomingdale’s The Outlet, and bluemercury, which are aggregated into one reporting segment in accordance with the Financial Accounting Standards Board (“FASB”) Accounting Standards Codification (“ASC”) Topic 280, Segment Reporting. The metrics used by management to assess the performance of the Company’s operating divisions include sales trends, gross margin rates, expense rates, and rates of earnings before interest and taxes (“EBIT”) and earnings before interest, taxes, depreciation and amortization (“EBITDA”). The Company’s operating divisions have historically had similar economic characteristics and are expected to have similar economic characteristics and long-term financial performance in future periods.
Fiscal Year
The Company’s fiscal year ends on the Saturday closest to January 31. Fiscal years 2020, 2019 and 2018 ended on January 30, 2021, February 1, 2020 and February 2, 2019, respectively, and included 52 weeks. References to years in the Consolidated Financial Statements relate to fiscal years rather than calendar years.
Basis of Presentation
In August 2015, the Company established a joint venture, Macy's China Limited, of which the Company held a sixty-five percent ownership interest and Hong Kong-based Fung Retailing Limited held the remaining thirty-five percent ownership interest. Macy's China Limited sold merchandise in China through an e-commerce presence on Alibaba Group's Tmall Global. In January 2019, the Company ended the joint venture with Fung Retailing Limited after winding down the operations of Macy's China Limited earlier in 2018. In conjunction with the termination of the joint venture, the Company acquired the noncontrolling interest in Macy's China Limited from Fung Retailing Limited, resulting in one hundred percent ownership. For the period of time prior to the acquisition of the noncontrolling interest, Fung Retailing Limited's thirty-five percent proportionate share of the results of Macy's China Limited was reported as noncontrolling interest in the Consolidated Financial Statements. All significant intercompany transactions were eliminated.
For 2020, 2019 and 2018, the Consolidated Financial Statements include the accounts of Macy's, Inc. and its 100%-owned subsidiaries and, for the applicable periods, the majority-owned subsidiary, Macy's China Limited.
Certain reclassifications were made to prior years' amounts to conform with the classifications of such amounts in the most recent years.
Use of Estimates
The preparation of financial statements in conformity with accounting principles generally accepted in the United States of America requires management to make estimates and assumptions that affect the reported amounts of assets and liabilities and disclosure of contingent assets and liabilities at the date of the financial statements and the reported amounts of revenues and expenses during the reporting period. Such estimates and assumptions are subject to inherent uncertainties, including the ultimate financial impact of the COVID-19 pandemic, which may result in actual amounts differing from reported amounts.
Net Sales
Revenue is recognized when customers obtain control of goods and services promised by the Company. The amount of revenue recognized is based on the amount that reflects the consideration that is expected to be received in exchange for those respective goods and services. See Note 3, Revenue, for further discussion of the Company's accounting policies for revenue from contracts with customers.
NOTES TO CONSOLIDATED FINANCIAL STATEMENTS — (Continued)
F-12
Cost of Sales
Cost of sales consists of the cost of merchandise, including inbound freight, shipping and handling costs, and depreciation. An estimated allowance for future sales returns is recorded and cost of sales is adjusted accordingly.
Cash and Cash Equivalents
Cash and cash equivalents include cash and liquid investments with original maturities of three months or less. Cash and cash equivalents includes amounts due in respect of credit card sales transactions that are settled early in the following period in the amount of $92 million at January 30, 2021, and $118 million at February 1, 2020.
Investments
The Company from time to time invests in debt and equity securities, including companies engaged in complementary businesses. All debt securities held by the Company are accounted for under ASC Topic 320, Investments – Debt Securities, while all marketable securities held by the Company are accounted for under ASC Topic 321, Investments – Equity Securities. Unrealized holding gains and losses on trading securities and equity securities with a readily determinable fair value are recognized in the Consolidated Statements of Operations. Equity securities without a readily determinable fair value are generally recorded at cost and subsequently adjusted, in net income, for observable price changes (i.e., prices in orderly transactions for the identical investment or similar investment of the same issuer).
Receivables
Receivables were $276 million at January 30, 2021, compared to $409 million at February 1, 2020.
The Company and Citibank, the owner of most of the Company's credit assets, are party to a long-term marketing and servicing alliance pursuant to the terms of the Program Agreement. Income earned under the Program Agreement is treated as credit card revenues, net on the Consolidated Statements of Operations. Under the Program Agreement, Citibank offers proprietary and non-proprietary credit cards to the Company’s customers.
Merchandise Inventories
Merchandise inventories are valued at lower of cost or market using the last-in, first-out ("LIFO") retail inventory method. Under the retail inventory method, inventory is segregated into departments of merchandise having similar characteristics, and is stated at its current retail selling value. Inventory retail values are converted to a cost basis by applying specific average cost factors for each merchandise department. Cost factors represent the average cost-to-retail ratio for each merchandise department based on beginning inventory and the annual purchase activity. At January 30, 2021, and February 1, 2020, merchandise inventories valued at LIFO, including adjustments as necessary to record inventory at the lower of cost or market, approximated the cost of such inventories using the first-in, first-out ("FIFO") retail inventory method. The application of the LIFO retail inventory method did not result in the recognition of any LIFO charges or credits affecting cost of sales for 2020, 2019 or 2018. The retail inventory method inherently requires management judgments and estimates, such as the amount and timing of permanent markdowns to clear unproductive or slow-moving inventory, which may impact the ending inventory valuation as well as gross margins.
Permanent markdowns designated for clearance activity are recorded when the utility of the inventory has diminished. Factors considered in the determination of permanent markdowns include current and anticipated demand, customer preferences, age of the merchandise and fashion trends. When a decision is made to permanently markdown merchandise, the resulting gross margin reduction is recognized in the period the markdown is recorded.
Physical inventories are generally taken within each merchandise department annually, and inventory records are adjusted accordingly, resulting in the recording of actual shrinkage. Physical inventories are taken at all store locations for substantially all merchandise categories approximately three weeks before the end of the year. Shrinkage is estimated as a percentage of sales at interim periods and for this approximate three-week period, based on historical shrinkage rates. While it is not possible to quantify the impact from each cause of shrinkage, the Company has loss prevention programs and policies that are intended to minimize shrinkage, including the use of radio frequency identification cycle counts and interim inventories to keep the Company's merchandise files accurate.
Vendor Allowances
The Company receives certain allowances as reimbursement for markdowns taken and/or to support the gross margins earned in connection with the sales of merchandise. These allowances are recognized when earned. The Company
NOTES TO CONSOLIDATED FINANCIAL STATEMENTS — (Continued)
F-13
also receives advertising allowances from approximately 460 of its merchandise vendors pursuant to cooperative advertising programs, with some vendors participating in multiple programs. These allowances represent reimbursements by vendors of costs incurred by the Company to promote the vendors’ merchandise and are netted against advertising and promotional costs when the related costs are incurred. Advertising allowances in excess of costs incurred are recorded as a reduction of merchandise costs and, ultimately, through cost of sales when the merchandise is sold.
The arrangements pursuant to which the Company’s vendors provide allowances, while binding, are generally informal in nature and one year or less in duration. The terms and conditions of these arrangements vary significantly from vendor to vendor and are influenced by, among other things, the type of merchandise to be supported.
Advertising
Advertising and promotional costs are generally expensed at first showing. Advertising and promotional costs and cooperative advertising allowances were as follows:
2020 2019 2018 (millions)
Gross advertising and promotional costs $ 907 $ 1,330 $ 1,358 Cooperative advertising allowances 89 188 196 Advertising and promotional costs, net of cooperative advertising allowances $ 818 $ 1,142 $ 1,162
Net sales $ 17,346 $ 24,560 $ 24,971
Advertising and promotional costs, net of cooperative advertising allowances, as a percent to net sales 4.7% 4.6% 4.7%
Property and Equipment
Depreciation of owned properties is provided primarily on a straight-line basis over the estimated asset lives, which range from fifteen to fifty years for buildings and building equipment and three to fifteen years for fixtures and equipment. Real estate taxes and interest on construction in progress and land under development are capitalized. Amounts capitalized are amortized over the estimated lives of the related depreciable assets. The Company receives contributions from developers and merchandise vendors to fund building improvement and the construction of vendor shops. Such contributions are generally netted against the capital expenditures.
Buildings on leased land and leasehold improvements are amortized over the shorter of their economic lives or the lease term, beginning on the date the asset is put into use.
The carrying value of long-lived assets, inclusive of ROU assets, is periodically reviewed by the Company whenever events or changes in circumstances indicate that a potential impairment has occurred. For long-lived assets held for use, a potential impairment has occurred if projected future undiscounted cash flows are less than the carrying value of the assets. The estimate of cash flows includes management’s assumptions of cash inflows and outflows directly resulting from the use of those assets in operations. When a potential impairment has occurred, an impairment write-down is recorded if the carrying value of the long-lived asset exceeds its fair value. The Company believes its estimated cash flows are sufficient to support the carrying value of its long-lived assets. If estimated cash flows significantly differ in the future, the Company may be required to record asset impairment write-downs.
If the Company commits to a plan to dispose of a long-lived asset before the end of its previously estimated useful life, estimated cash flows are revised accordingly, and the Company may be required to record an asset impairment write- down. Additionally, related liabilities arise such as severance, contractual obligations and other accruals associated with store closings from decisions to dispose of assets. The Company estimates these liabilities based on the facts and circumstances in existence for each restructuring decision. The amounts the Company will ultimately realize or disburse could differ from the amounts assumed in arriving at the asset impairment and restructuring charge recorded.
The Company classifies certain long-lived assets as held for disposal by sale and ceases depreciation when the particular criteria for such classification are met, including the probable sale within one year. For long-lived assets to be disposed of by sale, an impairment charge is recorded if the carrying amount of the asset exceeds its fair value less costs to sell. Such valuations include estimations of fair values and incremental direct costs to transact a sale.
NOTES TO CONSOLIDATED FINANCIAL STATEMENTS — (Continued)
F-14
Leases
Operating lease liabilities are recognized at the lease commencement date based on the present value of the fixed lease payments using the Company's incremental borrowing rates for its population of leases. Related operating ROU assets are recognized based on the initial present value of the fixed lease payments, reduced by contributions from landlords, plus any prepaid rent and direct costs from executing the leases. ROU assets are tested for impairment in the same manner as long-lived assets. Certain of the Company’s real estate leases have terms that extend for a significant number of years and provide for rental rates that increase or decrease over time. Lease terms include the noncancellable portion of the underlying leases along with any reasonably certain lease periods associated with available renewal periods, termination options and purchase options. Lease agreements with lease and non-lease components are combined as a single lease component for all classes of underlying assets.
Leases with an initial term of 12 months or less are not recorded on the balance sheet; the Company recognizes lease expense for these leases on a straight-line basis over the lease term. Variable lease payments are recognized as lease expense as they are incurred.
ASU 2016-02, Leases (Topic 842), as amended, was adopted by the Company on February 3, 2019, utilizing a modified retrospective approach that allowed for transition in the period of adoption. The Company adopted the package of practical expedients available at transition that retained the lease classification and initial direct costs for any leases that existed prior to adoption of the standard. Contracts entered into prior to adoption were not reassessed for leases or embedded leases. Upon adoption, the Company used hindsight in determining lease term and impairment. For lease and non-lease components, the Company has elected to account for both as a single lease component. Prior to February 3, 2019, leases were accounted for under ASC Subtopic 840, Leases.
Goodwill and Other Intangible Assets
The carrying value of goodwill and other intangible assets with indefinite lives are reviewed at least annually for possible impairment in accordance with ASC Subtopic 350-20, Goodwill. Goodwill and other intangible assets with indefinite lives have been assigned to reporting units for purposes of impairment testing. The reporting units are the Company’s retail operating divisions. Goodwill and other intangible assets with indefinite lives are tested for impairment annually at the end of the fiscal month of May.
The Company evaluates qualitative factors to determine if it is more likely than not that the fair value of a reporting unit or other intangible assets with indefinite lives is less than its carrying value and whether it is necessary to perform the quantitative impairment test. If required, the Company performs a quantitative impairment test which involves a comparison of each reporting unit's or other intangible assets with indefinite lives’ fair values to its carrying value. Estimating the fair values of the reporting units or other intangible assets with indefinite lives involves the use of significant assumptions, estimates and judgments with respect to a variety of factors, including sales, gross margin and SG&A expense rates, capital expenditures, cash flows and the selection and use of an appropriate discount rate and market values and multiples of earnings and revenues of similar public companies. The projected sales, gross margin and SG&A expense rate assumptions and capital expenditures are based on the Company’s annual business plan or other forecasted results. Discount rates reflect market-based estimates of the risks associated with the projected cash flows of the reporting unit or indefinite lived intangible asset.
The estimates of fair value of reporting units or other intangible assets with indefinite lives are based on the best information available as of the date of the assessment. If the carrying value of a reporting unit exceeds its fair value, an impairment loss will be recognized in an amount equal to such excess, limited to the total amount of goodwill allocated to the reporting unit. If the carrying value of an individual indefinite-lived intangible asset exceeds its fair value, such individual indefinite-lived intangible asset is written down by an amount equal to such excess.
Capitalized Software
The Company capitalizes purchased and internally developed software and amortizes such costs to expense on a straight-line basis generally over four to five years. Capitalized software is included in other assets on the Consolidated Balance Sheets.
Gift Cards
The Company only offers no-fee, non-expiring gift cards to its customers. At the time gift cards are sold or issued, no revenue is recognized; rather, the Company records an accrued liability to customers. The liability is relieved and
NOTES TO CONSOLIDATED FINANCIAL STATEMENTS — (Continued)
F-15
revenue is recognized equal to the amount redeemed for merchandise. The Company records revenue from unredeemed gift cards (breakage) in net sales on a pro-rata basis over the time period gift cards are actually redeemed. At least three years of historical data, updated annually, is used to determine actual redemption patterns. The Company records breakage income within net sales on the Consolidated Statements of Operations.
Loyalty Programs
The Company maintains customer loyalty programs in which customers earn points based on their purchases. Under the Macy’s Star Rewards loyalty program, points are earned based on customers’ spending on Macy’s private label and co-branded credit cards as well as non-proprietary cards. Under the Macy’s brand, the Company previously participated in a coalition program ("Plenti") whereby customers could earn points based on spending levels with bonus opportunities through various targeted offers and promotions at Macy's and other partners. The Company's participation in Plenti ended on May 3, 2018. The Company’s Bloomingdale’s Loyallist and bluemercury BlueRewards programs provide tender neutral points-based programs to their customers. The Company recognizes the estimated net amount of the rewards that will be earned and redeemed as a reduction to net sales at the time of the initial transaction and as tender when the points are subsequently redeemed by a customer.
Self-Insurance Reserves
The Company, through its insurance subsidiary, is self-insured for workers compensation and general liability claims up to certain maximum liability amounts. Although the amounts accrued are actuarially determined based on analysis of historical trends of losses, settlements, litigation costs and other factors, the amounts the Company will ultimately disburse could differ from such accrued amounts.
Post Employment and Postretirement Obligations
The Company, through its actuaries, utilizes assumptions when estimating the liabilities for pension and other employee benefit plans. These assumptions, where applicable, include the discount rates used to determine the actuarial present value of projected benefit obligations, the rate of increase in future compensation levels, mortality rates, the long- term rate of return on assets and the growth in health care costs. The Company measures post employment and postretirement assets and obligations using the month-end that is closest to the Company's fiscal year-end or an interim period quarter-end if a plan is determined to qualify for a remeasurement. The benefit expense is generally recognized in the Consolidated Financial Statements on an accrual basis over the average remaining lifetime of participants, and the accrued benefits are reported in other assets, accounts payable and accrued liabilities and other liabilities on the Consolidated Balance Sheets, as appropriate.
Income Taxes
Income taxes are accounted for under the asset and liability method. Deferred income tax assets and liabilities are recognized for the future tax consequences attributable to differences between the financial statement carrying amounts of existing assets and liabilities and their respective tax bases, and net operating loss and tax credit carryforwards. Deferred income tax assets and liabilities are measured using enacted tax rates expected to apply to taxable income in the years in which those temporary differences are expected to be recovered or settled. The effect on deferred income tax assets and liabilities of a change in tax rates is recognized in the Consolidated Statements of Operations in the period that includes the enactment date. Deferred income tax assets are reduced by a valuation allowance when it is more likely than not that some portion of the deferred income tax assets will not be realized.
Stock Based Compensation
The Company records stock-based compensation expense according to the provisions of ASC Topic 718, Compensation – Stock Compensation. ASC Topic 718 requires all share-based payments to employees, including grants of employee stock options, to be recognized in the financial statements based on their fair values. Under the provisions of ASC Topic 718, the Company determines the appropriate fair value model to be used for valuing share-based payments and the amortization method for compensation cost.
Comprehensive Income (Loss)
Total comprehensive income (loss) represents the change in equity during a period from sources other than transactions with shareholders and, as such, includes net income (loss). For the Company, the only other components of total comprehensive income (loss) for 2020, 2019 and 2018 relate to post employment and postretirement plan items. Settlement charges incurred are included as a separate component of income before income taxes in the Consolidated
NOTES TO CONSOLIDATED FINANCIAL STATEMENTS — (Continued)
F-16
Statements of Operations. Amortization reclassifications out of accumulated other comprehensive loss are included in the computation of net periodic benefit cost (income) and are included in benefit plan income, net on the Consolidated Statements of Operations.
Recent Accounting Pronouncements
In June 2016, the FASB issued ASU 2016-13, Financial Instruments - Credit Losses (Topic 326): Measurement of Credit Losses on Financial Instruments, which amends the financial instrument impairment model to utilize an expected loss methodology in place an incurred loss methodology. The new guidance applies to financial assets measured at an amortized cost basis, including receivables that result from revenue transactions and held-to-maturity debt securities. This guidance is effective for fiscal years, and interim periods within those fiscal years, beginning after December 15, 2019, and early adoption was permitted for fiscal years beginning after December 15, 2018. The Company adopted this guidance in the first quarter of fiscal 2020. The adoption of this guidance did not have a material impact on the Company’s consolidated financial statements and related disclosures.
In August 2018, the FASB issued ASU 2018-13, Fair Value Measurement (Topic 820): Disclosure Framework – Changes to the Disclosure Requirements for Fair Value Measurement, which amends the fair value disclosure requirements by removing, modifying and adding certain disclosures. This guidance is effective for fiscal years, and interim periods within those years, beginning after December 15, 2019, with early adoption permitted. The Company adopted this guidance in the first quarter of fiscal 2020. The adoption of this guidance did not have a material impact on the Company’s consolidated financial statements and related disclosures.
In August 2018, the FASB issued ASU 2018-15, Intangibles – Goodwill and Other – Internal-Use Software (Subtopic 350-40): Customer’s Accounting for Implementation Costs Incurred in a Cloud Computing Arrangement That Is a Service Contract. This ASU clarifies the accounting treatment for fees paid by a customer in a cloud computing arrangement (hosting arrangement) by providing guidance for determining when the arrangement includes a software license. This guidance is effective for public business entities for fiscal years, and interim periods within those years, beginning after December 15, 2019, with early adoption permitted. The amendments may be applied either retrospectively or prospectively to all implementation costs incurred after the date of adoption. The Company adopted this guidance on a prospective basis in the first quarter of fiscal 2020. The adoption of this guidance did not have a material impact on the Company’s consolidated financial statements and related disclosures.
In March 2020, the SEC issued a final rule, Financial Disclosures About Guarantors and Issuers of Guaranteed Securities and Affiliates Whose Securities Collateralize a Registrant’s Securities, that simplifies the disclosure requirements related to registered securities under Rule 3-10 of Regulation S-X. The rule replaces the requirement to provide condensed consolidating financial information with a requirement to present summarized financial information of the issuers and guarantors. It also requires qualitative disclosures with respect to information about guarantors, the terms and conditions of guarantees and the factors that may affect payment. These disclosures may be provided outside the footnotes to the Company’s consolidated financial statements. In applying this rule, the Company has elected to provide these disclosures in Item 7. Management’s Discussion & Analysis of Financial Conditions and Results of Operations.
2. Impact of COVID-19
In March 2020, the World Health Organization declared the outbreak of COVID-19 as a global pandemic, which continues to spread throughout the United States. The COVID-19 pandemic had a negative impact on the Company's 2020 operations and financial results, and the full financial impact of the pandemic cannot be reasonably estimated at this time due to uncertainty as to the severity and duration of the pandemic. The following summarizes the actions taken and impacts from the COVID-19 pandemic during 2020.
• The Company temporarily closed all stores on March 18, 2020, which included all Macy’s, Bloomingdale’s, bluemercury, Macy’s Backstage, Bloomingdales the Outlet and Market by Macy’s stores. Stores began reopening on May 4, 2020 and substantially all of the Company's stores were open by the end of the second quarter of 2020.
• In an effort to increase liquidity, the Company fully drew on its $1,500 million credit facility, announced the suspension of quarterly cash dividends beginning in the second quarter of 2020 and took additional steps to reduce discretionary spending. The Company's Board of Directors also rescinded its authorization of any
NOTES TO CONSOLIDATED FINANCIAL STATEMENTS — (Continued)
F-17
unused amounts under the Company's share repurchase program. In June 2020, the Company completed financing activities totaling nearly $4.5 billion and used a portion of the proceeds from these activities, as well as cash on hand, to repay its credit facility. To create greater flexibility for future liquidity needs, the Company executed an exchange offer and consent solicitation in July 2020 for $465 million of previously issued unsecured notes. See Note 7, "Financing," for further discussion on these activities.
• To improve the Company's cash position and reduce its cash expenditures, the Company's Board of Directors and Chief Executive Officer did not receive compensation from April 1, 2020 through June 30, 2020. In addition, the Company deferred cash expenditures where possible and temporarily implemented a furlough for the majority of its colleague population which ended for most colleagues at the beginning of July 2020. Certain executives not impacted by the furlough took a temporary reduction of their pay through June 30, 2020.
• In June 2020, the Company announced a restructuring to align its cost base with anticipated near-term sales as the business recovers from the impact of the COVID-19 pandemic. The Company reduced corporate and management headcount by approximately 3,900. Additionally, the Company reduced staffing across its stores portfolio, supply chain and customer support network, which it expects to adjust as sales recover. During the second quarter of 2020, the Company recognized $154 million of expense for severance related to this reduction in force, of which substantially all has been paid as of January 30, 2021.
• During 2020, the Company deferred occupancy payments for a significant number of its stores. Such pandemic related deferrals were included in accounts payable and accrued liabilities and the Company continued to recognize expense during the deferral periods based on the contractual terms of the lease agreements. As of January 30, 2021, substantially all occupancy payment deferrals have been paid.
• During 2020, the Company incurred non-cash impairment charges primarily related to long-lived tangible and right of use assets to adjust the carrying value of certain store locations to their estimated fair value. The Company also incurred non-cash impairment charges during 2020 on goodwill as a result of the sustained decline in the Company's market capitalization and decline in projected cash flows primarily as a result of the COVID-19 pandemic. See Note 4, "Restructuring, Impairment, Store Closings and Other Costs" and Note 6, "Goodwill and Other Intangible Assets," respectively, for further discussion of these charges.
• On March 27, 2020, the CARES Act was signed into law, which included payroll tax credits for employee retention, deferral of payroll taxes, and several income tax provisions, including modifications to the net interest deduction limitation, changes to certain property depreciation and carryback of certain operating losses.
The CARES Act impacted the Company's annual effective tax rate and the income tax benefit recognized during 2020. Specifically, the Company recognized an annual net operating loss that is available for carryback at a 35% federal income tax rate rather than the current 21% federal income tax rate. During 2020, the resultant benefit of this rate differential was offset by the impact of the non-tax deductible component of the goodwill impairment charge. The net impact of these items is the primary driver of the effective tax rate decrease when compared to 2019. As of January 30, 2021, the Company recognized a $520 million income tax receivable, which is included within Other Assets on the Consolidated Balance Sheets. See Note 9, "Taxes" for further discussion on and disclosure of 2020 income taxes.
During 2020, the Company recognized $60 million in employee retention payroll tax credits and elected to defer payment of approximately $134 million of the employer portion of social security taxes. The Company expects to pay the deferred payroll taxes in the third quarter of fiscal 2021.
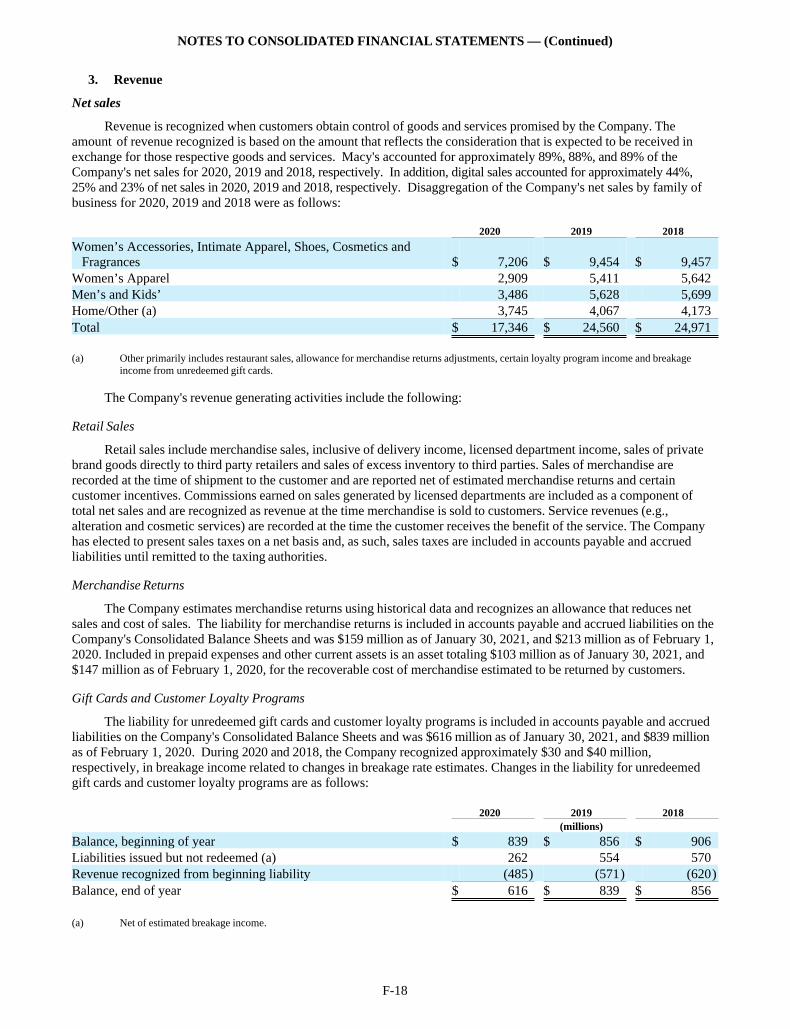
NOTES TO CONSOLIDATED FINANCIAL STATEMENTS — (Continued)
F-18
3. Revenue
Net sales
Revenue is recognized when customers obtain control of goods and services promised by the Company. The amount of revenue recognized is based on the amount that reflects the consideration that is expected to be received in exchange for those respective goods and services. Macy's accounted for approximately 89%, 88%, and 89% of the Company's net sales for 2020, 2019 and 2018, respectively. In addition, digital sales accounted for approximately 44%, 25% and 23% of net sales in 2020, 2019 and 2018, respectively. Disaggregation of the Company's net sales by family of business for 2020, 2019 and 2018 were as follows:
2020 2019 2018
Women’s Accessories, Intimate Apparel, Shoes, Cosmetics and Fragrances $ 7,206 $ 9,454 $ 9,457 Women’s Apparel 2,909 5,411 5,642 Men’s and Kids’ 3,486 5,628 5,699 Home/Other (a) 3,745 4,067 4,173 Total $ 17,346 $ 24,560 $ 24,971
(a) Other primarily includes restaurant sales, allowance for merchandise returns adjustments, certain loyalty program income and breakage income from unredeemed gift cards.
The Company's revenue generating activities include the following:
Retail Sales
Retail sales include merchandise sales, inclusive of delivery income, licensed department income, sales of private brand goods directly to third party retailers and sales of excess inventory to third parties. Sales of merchandise are recorded at the time of shipment to the customer and are reported net of estimated merchandise returns and certain customer incentives. Commissions earned on sales generated by licensed departments are included as a component of total net sales and are recognized as revenue at the time merchandise is sold to customers. Service revenues (e.g., alteration and cosmetic services) are recorded at the time the customer receives the benefit of the service. The Company has elected to present sales taxes on a net basis and, as such, sales taxes are included in accounts payable and accrued liabilities until remitted to the taxing authorities.
Merchandise Returns
The Company estimates merchandise returns using historical data and recognizes an allowance that reduces net sales and cost of sales. The liability for merchandise returns is included in accounts payable and accrued liabilities on the Company's Consolidated Balance Sheets and was $159 million as of January 30, 2021, and $213 million as of February 1, 2020. Included in prepaid expenses and other current assets is an asset totaling $103 million as of January 30, 2021, and $147 million as of February 1, 2020, for the recoverable cost of merchandise estimated to be returned by customers.
Gift Cards and Customer Loyalty Programs
The liability for unredeemed gift cards and customer loyalty programs is included in accounts payable and accrued liabilities on the Company's Consolidated Balance Sheets and was $616 million as of January 30, 2021, and $839 million as of February 1, 2020. During 2020 and 2018, the Company recognized approximately $30 and $40 million, respectively, in breakage income related to changes in breakage rate estimates. Changes in the liability for unredeemed gift cards and customer loyalty programs are as follows:
2020 2019 2018 (millions)
Balance, beginning of year $ 839 $ 856 $ 906 Liabilities issued but not redeemed (a) 262 554 570 Revenue recognized from beginning liability (485) (571) (620)Balance, end of year $ 616 $ 839 $ 856
(a) Net of estimated breakage income.
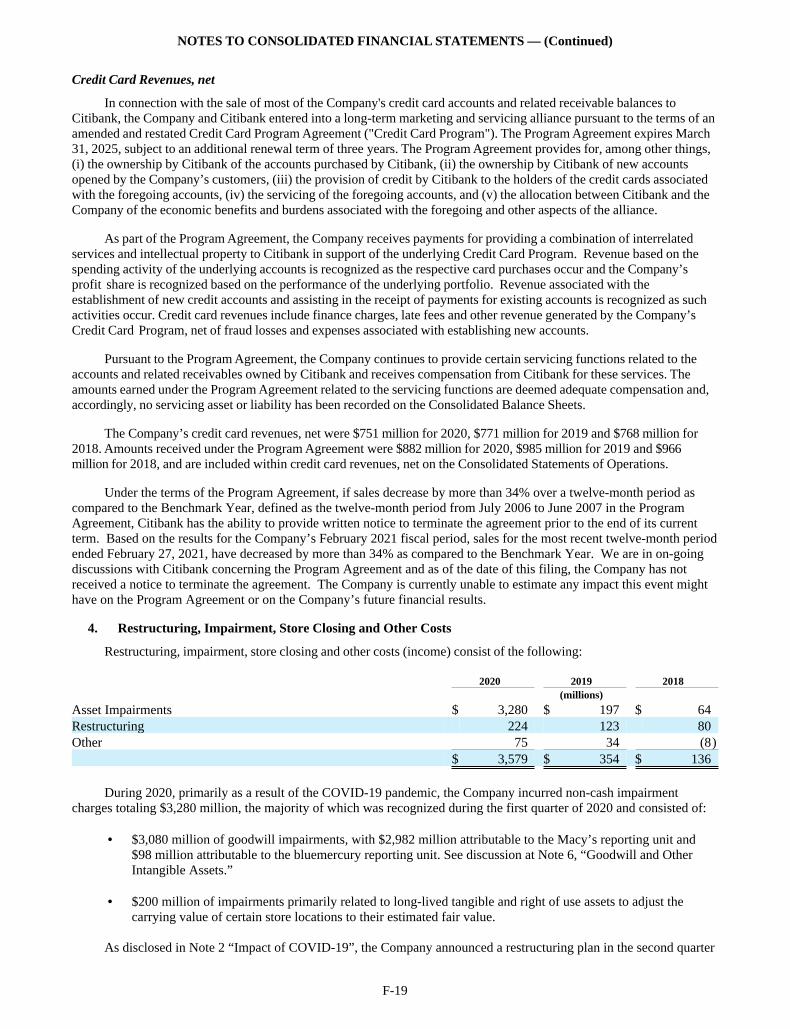
NOTES TO CONSOLIDATED FINANCIAL STATEMENTS — (Continued)
F-19
Credit Card Revenues, net
In connection with the sale of most of the Company's credit card accounts and related receivable balances to Citibank, the Company and Citibank entered into a long-term marketing and servicing alliance pursuant to the terms of an amended and restated Credit Card Program Agreement ("Credit Card Program"). The Program Agreement expires March 31, 2025, subject to an additional renewal term of three years. The Program Agreement provides for, among other things, (i) the ownership by Citibank of the accounts purchased by Citibank, (ii) the ownership by Citibank of new accounts opened by the Company’s customers, (iii) the provision of credit by Citibank to the holders of the credit cards associated with the foregoing accounts, (iv) the servicing of the foregoing accounts, and (v) the allocation between Citibank and the Company of the economic benefits and burdens associated with the foregoing and other aspects of the alliance.
As part of the Program Agreement, the Company receives payments for providing a combination of interrelated services and intellectual property to Citibank in support of the underlying Credit Card Program. Revenue based on the spending activity of the underlying accounts is recognized as the respective card purchases occur and the Company’s profit share is recognized based on the performance of the underlying portfolio. Revenue associated with the establishment of new credit accounts and assisting in the receipt of payments for existing accounts is recognized as such activities occur. Credit card revenues include finance charges, late fees and other revenue generated by the Company’s Credit Card Program, net of fraud losses and expenses associated with establishing new accounts.
Pursuant to the Program Agreement, the Company continues to provide certain servicing functions related to the accounts and related receivables owned by Citibank and receives compensation from Citibank for these services. The amounts earned under the Program Agreement related to the servicing functions are deemed adequate compensation and, accordingly, no servicing asset or liability has been recorded on the Consolidated Balance Sheets.
The Company’s credit card revenues, net were $751 million for 2020, $771 million for 2019 and $768 million for 2018. Amounts received under the Program Agreement were $882 million for 2020, $985 million for 2019 and $966 million for 2018, and are included within credit card revenues, net on the Consolidated Statements of Operations.
Under the terms of the Program Agreement, if sales decrease by more than 34% over a twelve-month period as compared to the Benchmark Year, defined as the twelve-month period from July 2006 to June 2007 in the Program Agreement, Citibank has the ability to provide written notice to terminate the agreement prior to the end of its current term. Based on the results for the Company’s February 2021 fiscal period, sales for the most recent twelve-month period ended February 27, 2021, have decreased by more than 34% as compared to the Benchmark Year. We are in on-going discussions with Citibank concerning the Program Agreement and as of the date of this filing, the Company has not received a notice to terminate the agreement. The Company is currently unable to estimate any impact this event might have on the Program Agreement or on the Company’s future financial results.
4. Restructuring, Impairment, Store Closing and Other Costs
Restructuring, impairment, store closing and other costs (income) consist of the following:
2020 2019 2018 (millions)
Asset Impairments $ 3,280 $ 197 $ 64 Restructuring 224 123 80 Other 75 34 (8) $ 3,579 $ 354 $ 136
During 2020, primarily as a result of the COVID-19 pandemic, the Company incurred non-cash impairment charges totaling $3,280 million, the majority of which was recognized during the first quarter of 2020 and consisted of:
• $3,080 million of goodwill impairments, with $2,982 million attributable to the Macy’s reporting unit and $98 million attributable to the bluemercury reporting unit. See discussion at Note 6, “Goodwill and Other Intangible Assets.”
• $200 million of impairments primarily related to long-lived tangible and right of use assets to adjust the carrying value of certain store locations to their estimated fair value.
As disclosed in Note 2 “Impact of COVID-19”, the Company announced a restructuring plan in the second quarter
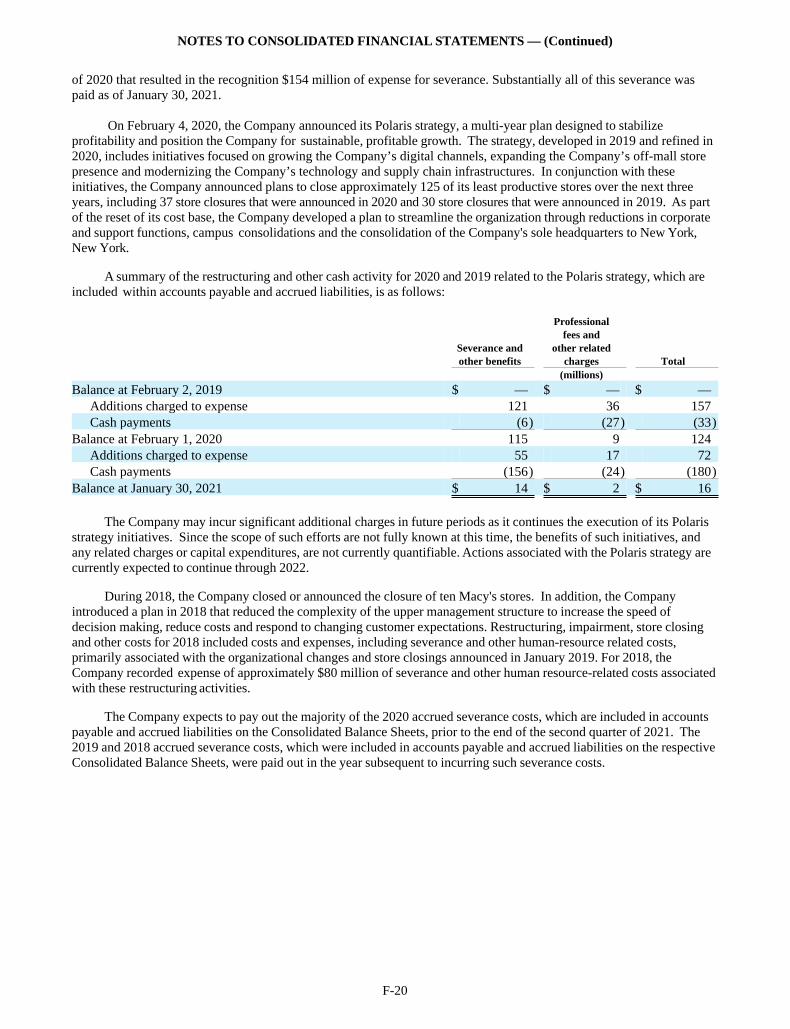
NOTES TO CONSOLIDATED FINANCIAL STATEMENTS — (Continued)
F-20
of 2020 that resulted in the recognition $154 million of expense for severance. Substantially all of this severance was paid as of January 30, 2021.
On February 4, 2020, the Company announced its Polaris strategy, a multi-year plan designed to stabilize profitability and position the Company for sustainable, profitable growth. The strategy, developed in 2019 and refined in 2020, includes initiatives focused on growing the Company’s digital channels, expanding the Company’s off-mall store presence and modernizing the Company’s technology and supply chain infrastructures. In conjunction with these initiatives, the Company announced plans to close approximately 125 of its least productive stores over the next three years, including 37 store closures that were announced in 2020 and 30 store closures that were announced in 2019. As part of the reset of its cost base, the Company developed a plan to streamline the organization through reductions in corporate and support functions, campus consolidations and the consolidation of the Company's sole headquarters to New York, New York.
A summary of the restructuring and other cash activity for 2020 and 2019 related to the Polaris strategy, which are included within accounts payable and accrued liabilities, is as follows:
Professional fees and Severance and other related other benefits charges Total (millions)
Balance at February 2, 2019 $ — $ — $ — Additions charged to expense 121 36 157 Cash payments (6) (27) (33)
Balance at February 1, 2020 115 9 124 Additions charged to expense 55 17 72 Cash payments (156) (24) (180)
Balance at January 30, 2021 $ 14 $ 2 $ 16
The Company may incur significant additional charges in future periods as it continues the execution of its Polaris strategy initiatives. Since the scope of such efforts are not fully known at this time, the benefits of such initiatives, and any related charges or capital expenditures, are not currently quantifiable. Actions associated with the Polaris strategy are currently expected to continue through 2022.
During 2018, the Company closed or announced the closure of ten Macy's stores. In addition, the Company introduced a plan in 2018 that reduced the complexity of the upper management structure to increase the speed of decision making, reduce costs and respond to changing customer expectations. Restructuring, impairment, store closing and other costs for 2018 included costs and expenses, including severance and other human-resource related costs, primarily associated with the organizational changes and store closings announced in January 2019. For 2018, the Company recorded expense of approximately $80 million of severance and other human resource-related costs associated with these restructuring activities.
The Company expects to pay out the majority of the 2020 accrued severance costs, which are included in accounts payable and accrued liabilities on the Consolidated Balance Sheets, prior to the end of the second quarter of 2021. The 2019 and 2018 accrued severance costs, which were included in accounts payable and accrued liabilities on the respective Consolidated Balance Sheets, were paid out in the year subsequent to incurring such severance costs.
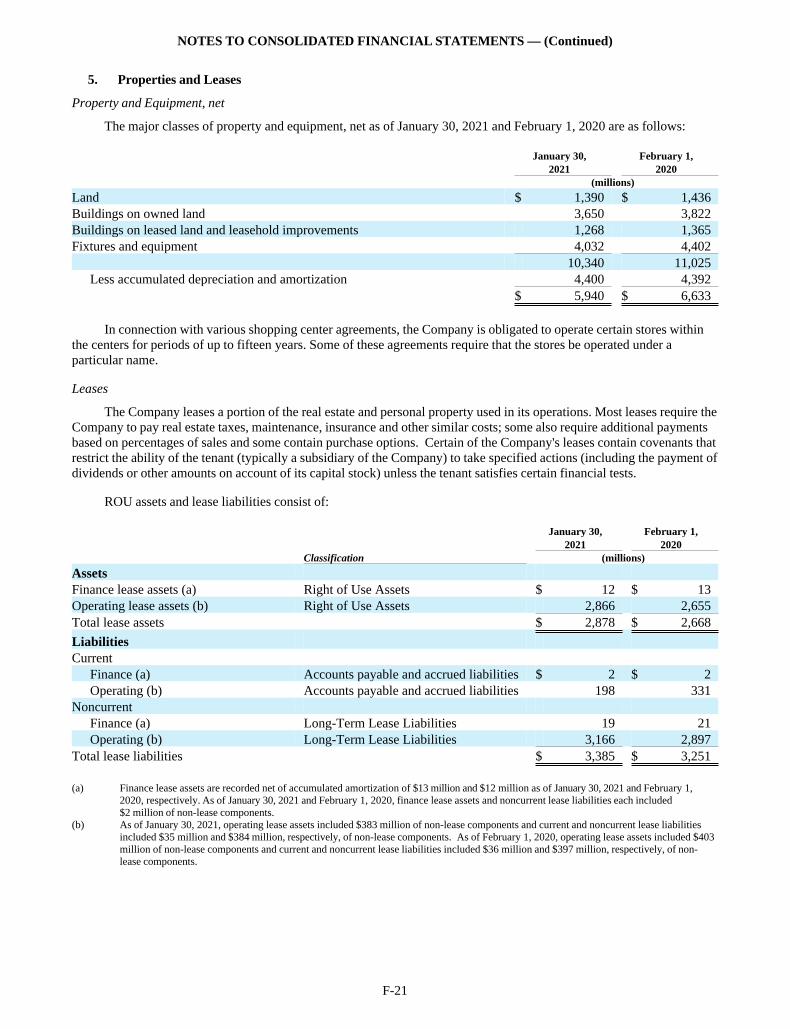
NOTES TO CONSOLIDATED FINANCIAL STATEMENTS — (Continued)
F-21
5. Properties and Leases
Property and Equipment, net
The major classes of property and equipment, net as of January 30, 2021 and February 1, 2020 are as follows:
January 30, February 1, 2021 2020 (millions)
Land $ 1,390 $ 1,436 Buildings on owned land 3,650 3,822 Buildings on leased land and leasehold improvements 1,268 1,365 Fixtures and equipment 4,032 4,402 10,340 11,025
Less accumulated depreciation and amortization 4,400 4,392 $ 5,940 $ 6,633
In connection with various shopping center agreements, the Company is obligated to operate certain stores within the centers for periods of up to fifteen years. Some of these agreements require that the stores be operated under a particular name.
Leases
The Company leases a portion of the real estate and personal property used in its operations. Most leases require the Company to pay real estate taxes, maintenance, insurance and other similar costs; some also require additional payments based on percentages of sales and some contain purchase options. Certain of the Company's leases contain covenants that restrict the ability of the tenant (typically a subsidiary of the Company) to take specified actions (including the payment of dividends or other amounts on account of its capital stock) unless the tenant satisfies certain financial tests.
ROU assets and lease liabilities consist of:
January 30, February 1, 2021 2020 Classification (millions)
Assets Finance lease assets (a) Right of Use Assets $ 12 $ 13 Operating lease assets (b) Right of Use Assets 2,866 2,655 Total lease assets $ 2,878 $ 2,668
Liabilities Current
Finance (a) Accounts payable and accrued liabilities $ 2 $ 2 Operating (b) Accounts payable and accrued liabilities 198 331
Noncurrent Finance (a) Long-Term Lease Liabilities 19 21 Operating (b) Long-Term Lease Liabilities 3,166 2,897
Total lease liabilities $ 3,385 $ 3,251
(a) Finance lease assets are recorded net of accumulated amortization of $13 million and $12 million as of January 30, 2021 and February 1, 2020, respectively. As of January 30, 2021 and February 1, 2020, finance lease assets and noncurrent lease liabilities each included $2 million of non-lease components.
(b) As of January 30, 2021, operating lease assets included $383 million of non-lease components and current and noncurrent lease liabilities included $35 million and $384 million, respectively, of non-lease components. As of February 1, 2020, operating lease assets included $403 million of non-lease components and current and noncurrent lease liabilities included $36 million and $397 million, respectively, of non-lease components.
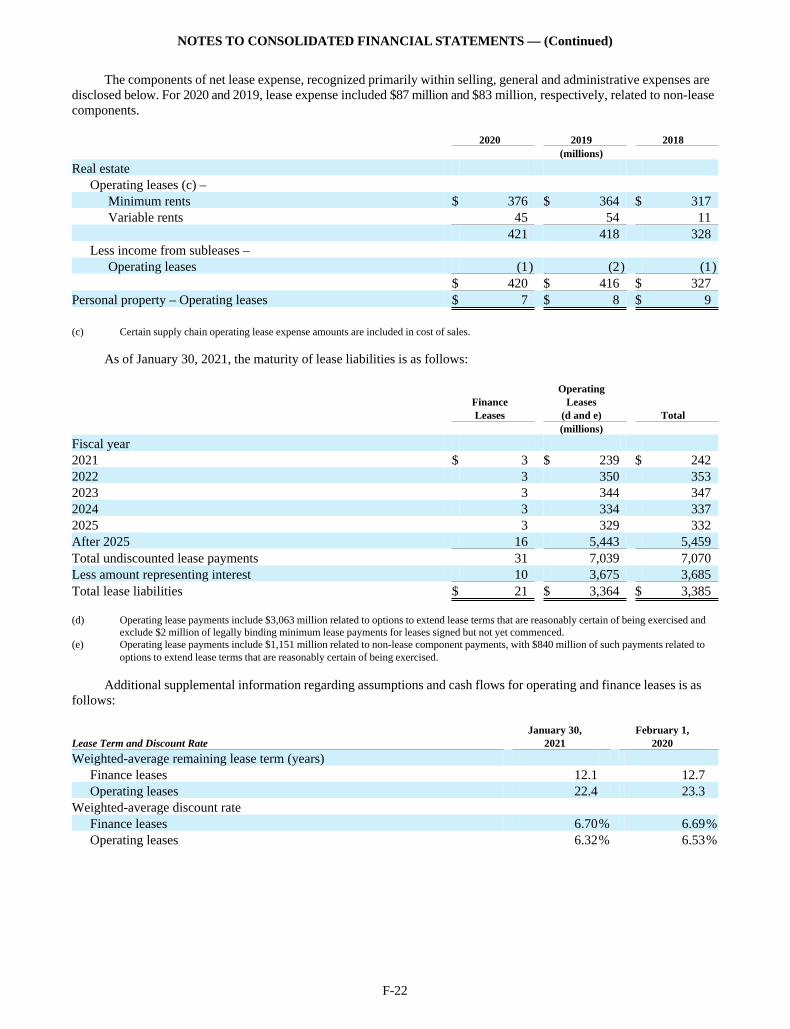
NOTES TO CONSOLIDATED FINANCIAL STATEMENTS — (Continued)
F-22
The components of net lease expense, recognized primarily within selling, general and administrative expenses are disclosed below. For 2020 and 2019, lease expense included $87 million and $83 million, respectively, related to non-lease components.
2020 2019 2018 (millions)
Real estate Operating leases (c) –
Minimum rents $ 376 $ 364 $ 317 Variable rents 45 54 11
421 418 328 Less income from subleases –
Operating leases (1) (2) (1) $ 420 $ 416 $ 327 Personal property – Operating leases $ 7 $ 8 $ 9
(c) Certain supply chain operating lease expense amounts are included in cost of sales.
As of January 30, 2021, the maturity of lease liabilities is as follows:
Operating Finance Leases Leases (d and e) Total (millions)
Fiscal year 2021 $ 3 $ 239 $ 242 2022 3 350 353 2023 3 344 347 2024 3 334 337 2025 3 329 332 After 2025 16 5,443 5,459 Total undiscounted lease payments 31 7,039 7,070 Less amount representing interest 10 3,675 3,685 Total lease liabilities $ 21 $ 3,364 $ 3,385
(d) Operating lease payments include $3,063 million related to options to extend lease terms that are reasonably certain of being exercised and exclude $2 million of legally binding minimum lease payments for leases signed but not yet commenced.
(e) Operating lease payments include $1,151 million related to non-lease component payments, with $840 million of such payments related to options to extend lease terms that are reasonably certain of being exercised.
Additional supplemental information regarding assumptions and cash flows for operating and finance leases is as follows:
January 30, February 1, Lease Term and Discount Rate 2021 2020
Weighted-average remaining lease term (years) Finance leases 12.1 12.7 Operating leases 22.4 23.3
Weighted-average discount rate Finance leases 6.70% 6.69%Operating leases 6.32% 6.53%
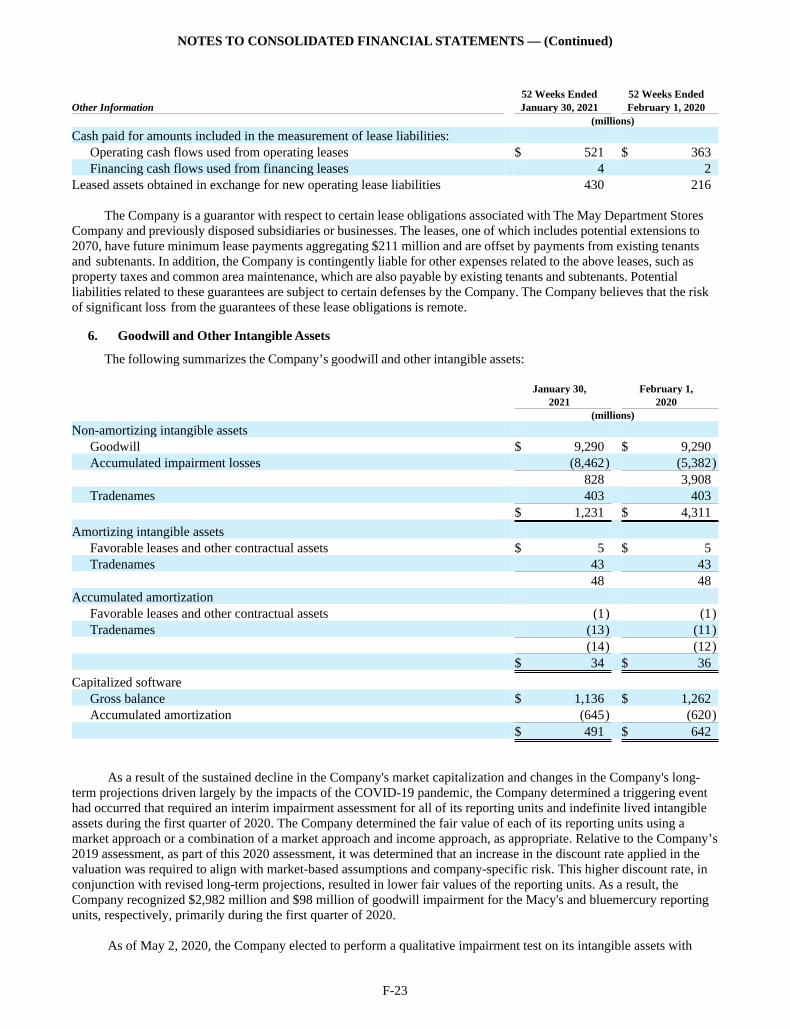
NOTES TO CONSOLIDATED FINANCIAL STATEMENTS — (Continued)
F-23
52 Weeks Ended 52 Weeks Ended Other Information January 30, 2021 February 1, 2020 (millions)
Cash paid for amounts included in the measurement of lease liabilities: Operating cash flows used from operating leases $ 521 $ 363 Financing cash flows used from financing leases 4 2
Leased assets obtained in exchange for new operating lease liabilities 430 216
The Company is a guarantor with respect to certain lease obligations associated with The May Department Stores Company and previously disposed subsidiaries or businesses. The leases, one of which includes potential extensions to 2070, have future minimum lease payments aggregating $211 million and are offset by payments from existing tenants and subtenants. In addition, the Company is contingently liable for other expenses related to the above leases, such as property taxes and common area maintenance, which are also payable by existing tenants and subtenants. Potential liabilities related to these guarantees are subject to certain defenses by the Company. The Company believes that the risk of significant loss from the guarantees of these lease obligations is remote.
6. Goodwill and Other Intangible Assets
The following summarizes the Company’s goodwill and other intangible assets:
January 30, February 1, 2021 2020 (millions)
Non-amortizing intangible assets Goodwill $ 9,290 $ 9,290 Accumulated impairment losses (8,462) (5,382) 828 3,908 Tradenames 403 403
$ 1,231 $ 4,311
Amortizing intangible assets Favorable leases and other contractual assets $ 5 $ 5 Tradenames 43 43
48 48 Accumulated amortization
Favorable leases and other contractual assets (1) (1)Tradenames (13) (11)
(14) (12) $ 34 $ 36
Capitalized software Gross balance $ 1,136 $ 1,262 Accumulated amortization (645) (620)
$ 491 $ 642
As a result of the sustained decline in the Company's market capitalization and changes in the Company's long-term projections driven largely by the impacts of the COVID-19 pandemic, the Company determined a triggering event had occurred that required an interim impairment assessment for all of its reporting units and indefinite lived intangible assets during the first quarter of 2020. The Company determined the fair value of each of its reporting units using a market approach or a combination of a market approach and income approach, as appropriate. Relative to the Company’s 2019 assessment, as part of this 2020 assessment, it was determined that an increase in the discount rate applied in the valuation was required to align with market-based assumptions and company-specific risk. This higher discount rate, in conjunction with revised long-term projections, resulted in lower fair values of the reporting units. As a result, the Company recognized $2,982 million and $98 million of goodwill impairment for the Macy's and bluemercury reporting units, respectively, primarily during the first quarter of 2020.
As of May 2, 2020, the Company elected to perform a qualitative impairment test on its intangible assets with
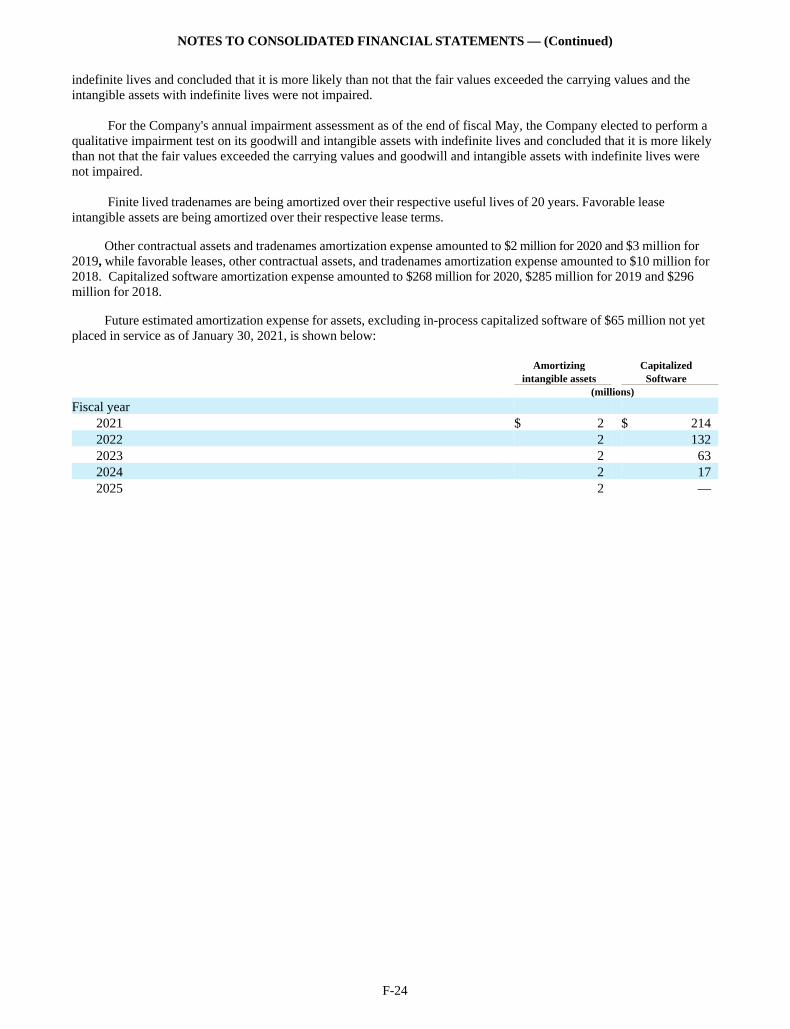
NOTES TO CONSOLIDATED FINANCIAL STATEMENTS — (Continued)
F-24
indefinite lives and concluded that it is more likely than not that the fair values exceeded the carrying values and the intangible assets with indefinite lives were not impaired.
For the Company's annual impairment assessment as of the end of fiscal May, the Company elected to perform a qualitative impairment test on its goodwill and intangible assets with indefinite lives and concluded that it is more likely than not that the fair values exceeded the carrying values and goodwill and intangible assets with indefinite lives were not impaired.
Finite lived tradenames are being amortized over their respective useful lives of 20 years. Favorable lease intangible assets are being amortized over their respective lease terms.
Other contractual assets and tradenames amortization expense amounted to $2 million for 2020 and $3 million for 2019, while favorable leases, other contractual assets, and tradenames amortization expense amounted to $10 million for 2018. Capitalized software amortization expense amounted to $268 million for 2020, $285 million for 2019 and $296 million for 2018.
Future estimated amortization expense for assets, excluding in-process capitalized software of $65 million not yet placed in service as of January 30, 2021, is shown below:
Amortizing Capitalized intangible assets Software (millions)
Fiscal year 2021 $ 2 $ 214 2022 2 132 2023 2 63 2024 2 17 2025 2 —
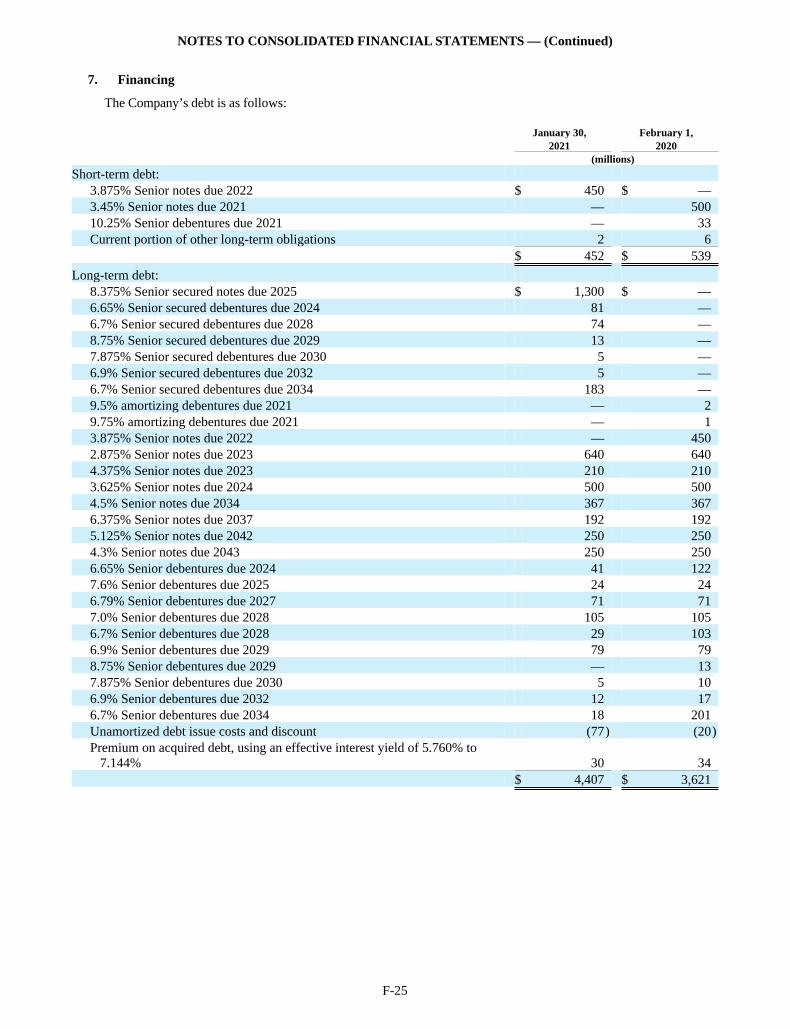
NOTES TO CONSOLIDATED FINANCIAL STATEMENTS — (Continued)
F-25
7. Financing
The Company’s debt is as follows:
January 30, February 1, 2021 2020 (millions)
Short-term debt: 3.875% Senior notes due 2022 $ 450 $ — 3.45% Senior notes due 2021 — 500 10.25% Senior debentures due 2021 — 33 Current portion of other long-term obligations 2 6
$ 452 $ 539
Long-term debt: 8.375% Senior secured notes due 2025 $ 1,300 $ — 6.65% Senior secured debentures due 2024 81 — 6.7% Senior secured debentures due 2028 74 — 8.75% Senior secured debentures due 2029 13 — 7.875% Senior secured debentures due 2030 5 — 6.9% Senior secured debentures due 2032 5 — 6.7% Senior secured debentures due 2034 183 — 9.5% amortizing debentures due 2021 — 2 9.75% amortizing debentures due 2021 — 1 3.875% Senior notes due 2022 — 450 2.875% Senior notes due 2023 640 640 4.375% Senior notes due 2023 210 210 3.625% Senior notes due 2024 500 500 4.5% Senior notes due 2034 367 367 6.375% Senior notes due 2037 192 192 5.125% Senior notes due 2042 250 250 4.3% Senior notes due 2043 250 250 6.65% Senior debentures due 2024 41 122 7.6% Senior debentures due 2025 24 24 6.79% Senior debentures due 2027 71 71 7.0% Senior debentures due 2028 105 105 6.7% Senior debentures due 2028 29 103 6.9% Senior debentures due 2029 79 79 8.75% Senior debentures due 2029 — 13 7.875% Senior debentures due 2030 5 10 6.9% Senior debentures due 2032 12 17 6.7% Senior debentures due 2034 18 201 Unamortized debt issue costs and discount (77) (20)Premium on acquired debt, using an effective interest yield of 5.760% to 7.144% 30 34
$ 4,407 $ 3,621
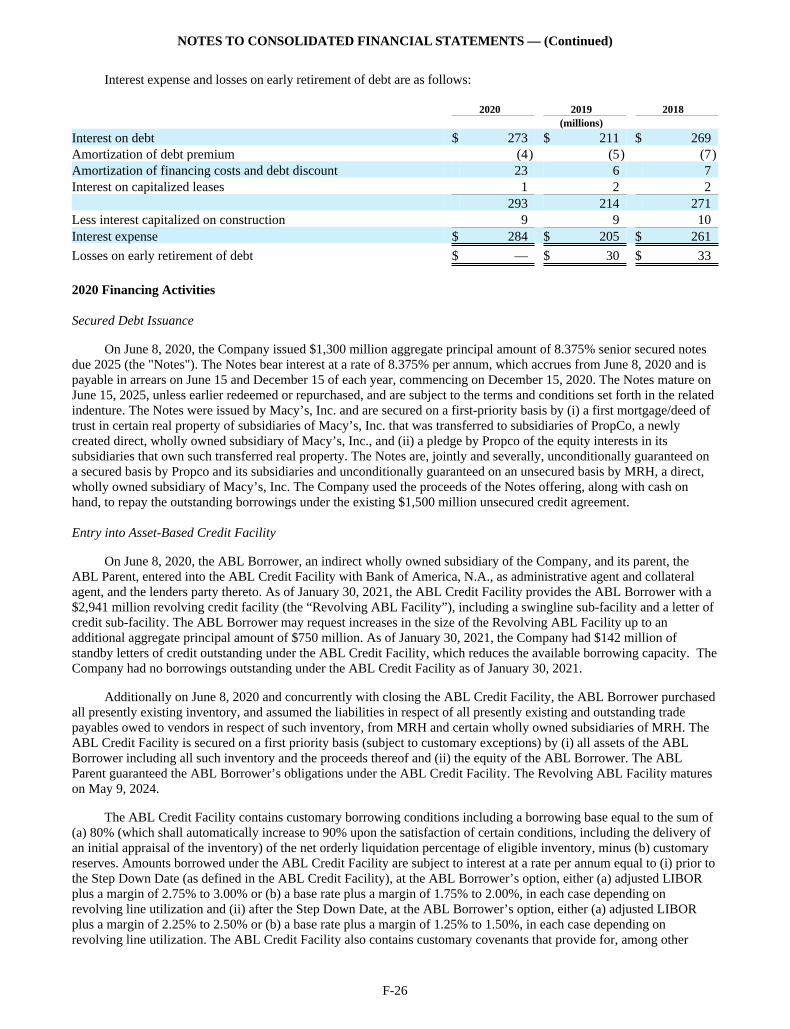
NOTES TO CONSOLIDATED FINANCIAL STATEMENTS — (Continued)
F-26
Interest expense and losses on early retirement of debt are as follows:
2020 2019 2018 (millions)
Interest on debt $ 273 $ 211 $ 269 Amortization of debt premium (4) (5) (7)Amortization of financing costs and debt discount 23 6 7 Interest on capitalized leases 1 2 2 293 214 271 Less interest capitalized on construction 9 9 10 Interest expense $ 284 $ 205 $ 261
Losses on early retirement of debt $ — $ 30 $ 33
2020 Financing Activities
Secured Debt Issuance
On June 8, 2020, the Company issued $1,300 million aggregate principal amount of 8.375% senior secured notes due 2025 (the "Notes"). The Notes bear interest at a rate of 8.375% per annum, which accrues from June 8, 2020 and is payable in arrears on June 15 and December 15 of each year, commencing on December 15, 2020. The Notes mature on June 15, 2025, unless earlier redeemed or repurchased, and are subject to the terms and conditions set forth in the related indenture. The Notes were issued by Macy’s, Inc. and are secured on a first-priority basis by (i) a first mortgage/deed of trust in certain real property of subsidiaries of Macy’s, Inc. that was transferred to subsidiaries of PropCo, a newly created direct, wholly owned subsidiary of Macy’s, Inc., and (ii) a pledge by Propco of the equity interests in its subsidiaries that own such transferred real property. The Notes are, jointly and severally, unconditionally guaranteed on a secured basis by Propco and its subsidiaries and unconditionally guaranteed on an unsecured basis by MRH, a direct, wholly owned subsidiary of Macy’s, Inc. The Company used the proceeds of the Notes offering, along with cash on hand, to repay the outstanding borrowings under the existing $1,500 million unsecured credit agreement.
Entry into Asset-Based Credit Facility
On June 8, 2020, the ABL Borrower, an indirect wholly owned subsidiary of the Company, and its parent, the ABL Parent, entered into the ABL Credit Facility with Bank of America, N.A., as administrative agent and collateral agent, and the lenders party thereto. As of January 30, 2021, the ABL Credit Facility provides the ABL Borrower with a $2,941 million revolving credit facility (the “Revolving ABL Facility”), including a swingline sub-facility and a letter of credit sub-facility. The ABL Borrower may request increases in the size of the Revolving ABL Facility up to an additional aggregate principal amount of $750 million. As of January 30, 2021, the Company had $142 million of standby letters of credit outstanding under the ABL Credit Facility, which reduces the available borrowing capacity. The Company had no borrowings outstanding under the ABL Credit Facility as of January 30, 2021.
Additionally on June 8, 2020 and concurrently with closing the ABL Credit Facility, the ABL Borrower purchased all presently existing inventory, and assumed the liabilities in respect of all presently existing and outstanding trade payables owed to vendors in respect of such inventory, from MRH and certain wholly owned subsidiaries of MRH. The ABL Credit Facility is secured on a first priority basis (subject to customary exceptions) by (i) all assets of the ABL Borrower including all such inventory and the proceeds thereof and (ii) the equity of the ABL Borrower. The ABL Parent guaranteed the ABL Borrower’s obligations under the ABL Credit Facility. The Revolving ABL Facility matures on May 9, 2024.
The ABL Credit Facility contains customary borrowing conditions including a borrowing base equal to the sum of (a) 80% (which shall automatically increase to 90% upon the satisfaction of certain conditions, including the delivery of an initial appraisal of the inventory) of the net orderly liquidation percentage of eligible inventory, minus (b) customary reserves. Amounts borrowed under the ABL Credit Facility are subject to interest at a rate per annum equal to (i) prior to the Step Down Date (as defined in the ABL Credit Facility), at the ABL Borrower’s option, either (a) adjusted LIBOR plus a margin of 2.75% to 3.00% or (b) a base rate plus a margin of 1.75% to 2.00%, in each case depending on revolving line utilization and (ii) after the Step Down Date, at the ABL Borrower’s option, either (a) adjusted LIBOR plus a margin of 2.25% to 2.50% or (b) a base rate plus a margin of 1.25% to 1.50%, in each case depending on revolving line utilization. The ABL Credit Facility also contains customary covenants that provide for, among other
NOTES TO CONSOLIDATED FINANCIAL STATEMENTS — (Continued)
F-27
things, limitations on indebtedness, liens, fundamental changes, restricted payments, cash hoarding, and prepayment of certain indebtedness as well as customary representations and warranties and events of default typical for credit facilities of this type.
The ABL Credit Facility also requires (1) the Company and its restricted subsidiaries to maintain a fixed charge coverage ratio of at least 1.00 to 1.00 as of the end of any fiscal quarter on or after April 30, 2021, if (a) certain events of default have occurred and are continuing or (b) Availability plus Suppressed Availability (each as defined in the ABL Credit Facility) is less than the greater of (x) 10% of the Loan Cap (as defined in the ABL Credit Facility) and (y) $250 million, in each case, as of the end of such fiscal quarter and (2) prior to April 30, 2021, that the ABL Borrower not permit Availability plus Suppressed Availability to be lower than the greater of (x) 10% of the Loan Cap and (y) $250 million.
Amendment to Existing Credit Agreement
On June 8, 2020, the Company substantially reduced the credit commitments of its existing $1,500 million unsecured credit agreement, which as of January 30, 2021 provided the Company with unsecured revolving credit of up to $1 million.
Exchange Offers and Consent Solicitations for Certain Outstanding Debt Securities of MRH
During the second quarter of 2020, MRH completed exchange offers (each, an “Exchange Offer” and, collectively, the “Exchange Offers”) with eligible holders and received related consents in consent solicitations for each series of notes as follows:
(i) $81 million aggregate principal amount of 6.65% Senior Secured Debentures due 2024 (“New 2024 Notes”) issued by MRH for validly tendered (and not validly withdrawn) outstanding 6.65% Senior Debentures due 2024 issued by MRH (“Old 2024 Notes”);(ii) $74 million aggregate principal amount of 6.7% Senior Secured Debentures due 2028 (“New 2028 Notes”) issued by MRH for validly tendered (and not validly withdrawn) outstanding 6.7% Senior Debentures due 2028 issued by MRH (“Old 2028 Notes”);(iii) $13 million aggregate principal amount of 8.75% Senior Secured Debentures due 2029 (“New 2029 Notes”) issued by MRH for validly tendered (and not validly withdrawn) outstanding 8.75% Senior Debentures due 2029 issued by MRH (“Old 2029 Notes”); (iv) $5 million aggregate principal amount of 7.875% Senior Secured Debentures due 2030 (“New 2030 Notes”) issued by MRH for validly tendered (and not validly withdrawn) outstanding 7.875% Senior Debentures due 2030 issued by MRH (“Old 2030 Notes”); (v) $5 million aggregate principal amount of 6.9% Senior Secured Debentures due 2032 (“New 2032 Notes”) issued by MRH for validly tendered (and not validly withdrawn) outstanding 6.9% Senior Debentures due 2032 issued by MRH (“Old 2032 Notes”); and (vi) $183 million aggregate principal amount of 6.7% Senior Secured Debentures due 2034 (“New 2034 Notes” and, together with the New 2024 Notes, New 2028 Notes, New 2029 Notes, New 2030 Notes and New 2032 Notes, the “New Notes” and each series, a “series of New Notes”) issued by MRH for validly tendered (and not validly withdrawn) outstanding 6.7% Senior Debentures due 2034 issued by MRH (“Old 2034 Notes” and, together with the Old 2024 Notes, Old 2028 Notes, Old 2029 Notes, Old 2030 Notes and Old 2032 Notes, the “Old Notes” and each series, a “series of Old Notes”).
Each New Note issued in the Exchange Offers for a validly tendered Old Note has an interest rate and maturity date that is identical to the interest rate and maturity date of the tendered Old Note, as well as identical interest payment dates and optional redemption prices. The New Notes are MRH’s and Macy’s general, senior obligations and are secured by a second-priority lien on the same collateral securing the Notes. Following the settlement, the aggregate principal amounts of each series of Old Notes outstanding are: (i) $41 million Old 2024 Notes, (ii) $29 million Old 2028 Notes, (iii) $5 million Old 2030 Notes, (iv) $12 million Old 2032 Notes and (v) $18 million Old 2034 Notes.
In addition, MRH solicited and received consents from holders of each series of Old Notes (each, a “Consent Solicitation” and, collectively, the “Consent Solicitations”) pursuant to a separate Consent Solicitation Statement to adopt certain proposed amendments to the indenture governing the Old Notes (the “Existing Indenture”) to conform certain provisions in the negative pledge covenant in the Existing Indenture to the provisions of the negative pledge covenant in MRH’s most recent indenture (the “Proposed Amendments”). MRH received consents from holders of (i)
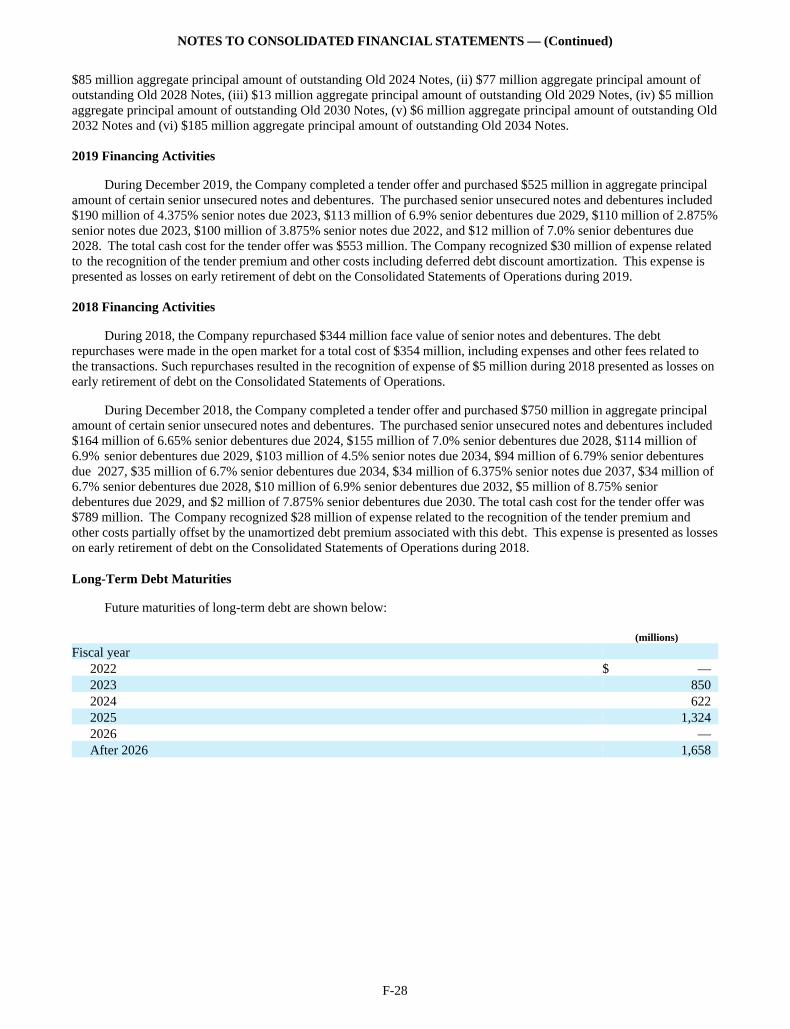
NOTES TO CONSOLIDATED FINANCIAL STATEMENTS — (Continued)
F-28
$85 million aggregate principal amount of outstanding Old 2024 Notes, (ii) $77 million aggregate principal amount of outstanding Old 2028 Notes, (iii) $13 million aggregate principal amount of outstanding Old 2029 Notes, (iv) $5 million aggregate principal amount of outstanding Old 2030 Notes, (v) $6 million aggregate principal amount of outstanding Old 2032 Notes and (vi) $185 million aggregate principal amount of outstanding Old 2034 Notes.
2019 Financing Activities
During December 2019, the Company completed a tender offer and purchased $525 million in aggregate principal amount of certain senior unsecured notes and debentures. The purchased senior unsecured notes and debentures included $190 million of 4.375% senior notes due 2023, $113 million of 6.9% senior debentures due 2029, $110 million of 2.875% senior notes due 2023, $100 million of 3.875% senior notes due 2022, and $12 million of 7.0% senior debentures due 2028. The total cash cost for the tender offer was $553 million. The Company recognized $30 million of expense related to the recognition of the tender premium and other costs including deferred debt discount amortization. This expense is presented as losses on early retirement of debt on the Consolidated Statements of Operations during 2019.
2018 Financing Activities
During 2018, the Company repurchased $344 million face value of senior notes and debentures. The debt repurchases were made in the open market for a total cost of $354 million, including expenses and other fees related to the transactions. Such repurchases resulted in the recognition of expense of $5 million during 2018 presented as losses on early retirement of debt on the Consolidated Statements of Operations.
During December 2018, the Company completed a tender offer and purchased $750 million in aggregate principal amount of certain senior unsecured notes and debentures. The purchased senior unsecured notes and debentures included $164 million of 6.65% senior debentures due 2024, $155 million of 7.0% senior debentures due 2028, $114 million of 6.9% senior debentures due 2029, $103 million of 4.5% senior notes due 2034, $94 million of 6.79% senior debentures due 2027, $35 million of 6.7% senior debentures due 2034, $34 million of 6.375% senior notes due 2037, $34 million of 6.7% senior debentures due 2028, $10 million of 6.9% senior debentures due 2032, $5 million of 8.75% senior debentures due 2029, and $2 million of 7.875% senior debentures due 2030. The total cash cost for the tender offer was $789 million. The Company recognized $28 million of expense related to the recognition of the tender premium and other costs partially offset by the unamortized debt premium associated with this debt. This expense is presented as losses on early retirement of debt on the Consolidated Statements of Operations during 2018.
Long-Term Debt Maturities
Future maturities of long-term debt are shown below:
(millions)
Fiscal year 2022 $ — 2023 850 2024 622 2025 1,324 2026 — After 2026 1,658
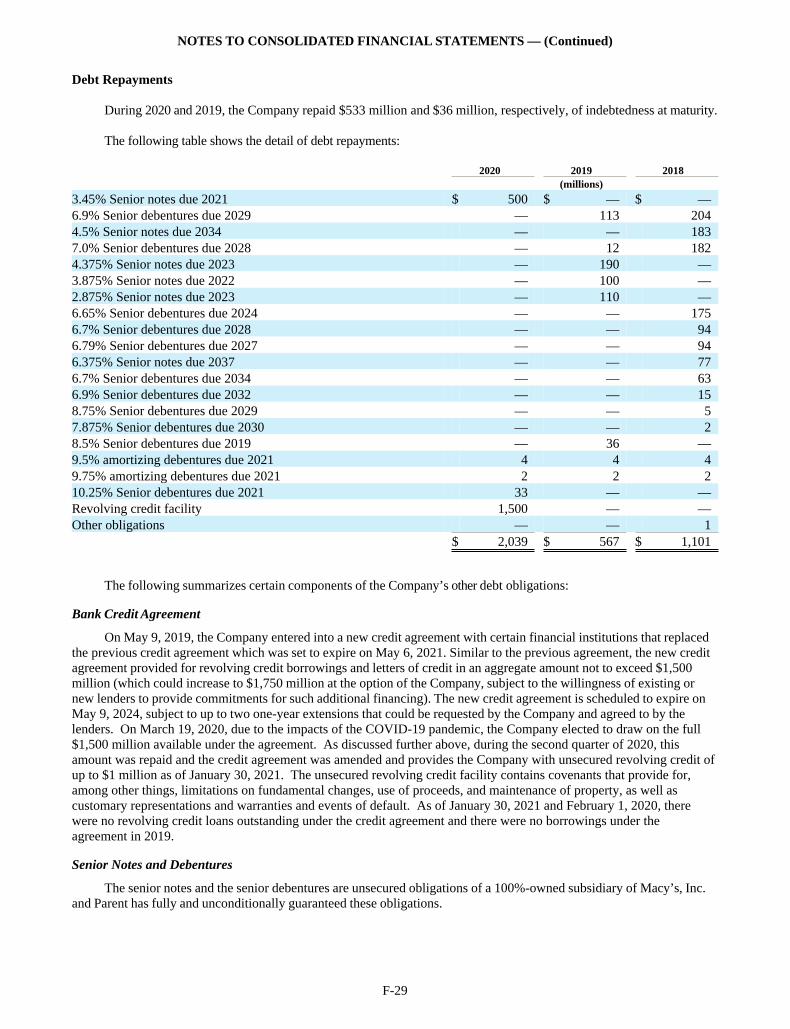
NOTES TO CONSOLIDATED FINANCIAL STATEMENTS — (Continued)
F-29
Debt Repayments
During 2020 and 2019, the Company repaid $533 million and $36 million, respectively, of indebtedness at maturity.
The following table shows the detail of debt repayments:
2020 2019 2018 (millions)
3.45% Senior notes due 2021 $ 500 $ — $ — 6.9% Senior debentures due 2029 — 113 204 4.5% Senior notes due 2034 — — 183 7.0% Senior debentures due 2028 — 12 182 4.375% Senior notes due 2023 — 190 — 3.875% Senior notes due 2022 — 100 — 2.875% Senior notes due 2023 — 110 — 6.65% Senior debentures due 2024 — — 175 6.7% Senior debentures due 2028 — — 94 6.79% Senior debentures due 2027 — — 94 6.375% Senior notes due 2037 — — 77 6.7% Senior debentures due 2034 — — 63 6.9% Senior debentures due 2032 — — 15 8.75% Senior debentures due 2029 — — 5 7.875% Senior debentures due 2030 — — 2 8.5% Senior debentures due 2019 — 36 — 9.5% amortizing debentures due 2021 4 4 4 9.75% amortizing debentures due 2021 2 2 2 10.25% Senior debentures due 2021 33 — — Revolving credit facility 1,500 — — Other obligations — — 1 $ 2,039 $ 567 $ 1,101
The following summarizes certain components of the Company’s other debt obligations:
Bank Credit Agreement
On May 9, 2019, the Company entered into a new credit agreement with certain financial institutions that replaced the previous credit agreement which was set to expire on May 6, 2021. Similar to the previous agreement, the new credit agreement provided for revolving credit borrowings and letters of credit in an aggregate amount not to exceed $1,500 million (which could increase to $1,750 million at the option of the Company, subject to the willingness of existing or new lenders to provide commitments for such additional financing). The new credit agreement is scheduled to expire on May 9, 2024, subject to up to two one-year extensions that could be requested by the Company and agreed to by the lenders. On March 19, 2020, due to the impacts of the COVID-19 pandemic, the Company elected to draw on the full $1,500 million available under the agreement. As discussed further above, during the second quarter of 2020, this amount was repaid and the credit agreement was amended and provides the Company with unsecured revolving credit of up to $1 million as of January 30, 2021. The unsecured revolving credit facility contains covenants that provide for, among other things, limitations on fundamental changes, use of proceeds, and maintenance of property, as well as customary representations and warranties and events of default. As of January 30, 2021 and February 1, 2020, there were no revolving credit loans outstanding under the credit agreement and there were no borrowings under the agreement in 2019.
Senior Notes and Debentures
The senior notes and the senior debentures are unsecured obligations of a 100%-owned subsidiary of Macy’s, Inc. and Parent has fully and unconditionally guaranteed these obligations.
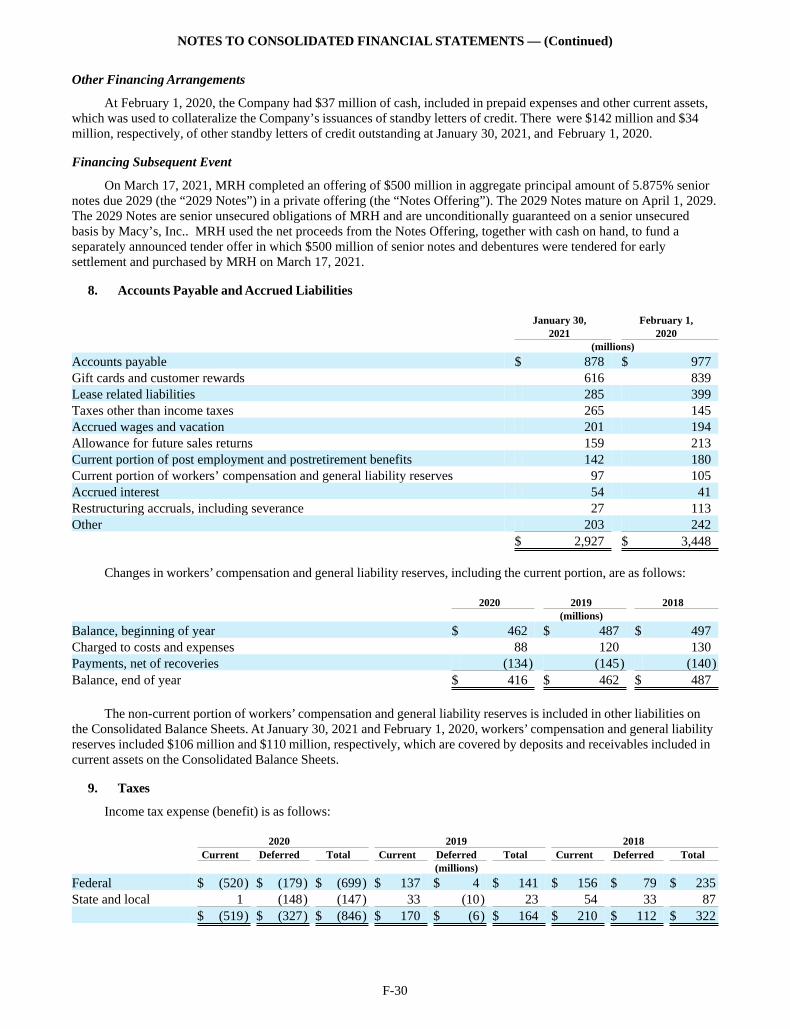
NOTES TO CONSOLIDATED FINANCIAL STATEMENTS — (Continued)
F-30
Other Financing Arrangements
At February 1, 2020, the Company had $37 million of cash, included in prepaid expenses and other current assets, which was used to collateralize the Company’s issuances of standby letters of credit. There were $142 million and $34 million, respectively, of other standby letters of credit outstanding at January 30, 2021, and February 1, 2020.
Financing Subsequent Event
On March 17, 2021, MRH completed an offering of $500 million in aggregate principal amount of 5.875% senior notes due 2029 (the “2029 Notes”) in a private offering (the “Notes Offering”). The 2029 Notes mature on April 1, 2029. The 2029 Notes are senior unsecured obligations of MRH and are unconditionally guaranteed on a senior unsecured basis by Macy’s, Inc.. MRH used the net proceeds from the Notes Offering, together with cash on hand, to fund a separately announced tender offer in which $500 million of senior notes and debentures were tendered for early settlement and purchased by MRH on March 17, 2021.
8. Accounts Payable and Accrued Liabilities
January 30, February 1, 2021 2020 (millions)
Accounts payable $ 878 $ 977 Gift cards and customer rewards 616 839 Lease related liabilities 285 399 Taxes other than income taxes 265 145 Accrued wages and vacation 201 194 Allowance for future sales returns 159 213 Current portion of post employment and postretirement benefits 142 180 Current portion of workers’ compensation and general liability reserves 97 105 Accrued interest 54 41 Restructuring accruals, including severance 27 113 Other 203 242 $ 2,927 $ 3,448
Changes in workers’ compensation and general liability reserves, including the current portion, are as follows:
2020 2019 2018 (millions)
Balance, beginning of year $ 462 $ 487 $ 497 Charged to costs and expenses 88 120 130 Payments, net of recoveries (134) (145) (140)Balance, end of year $ 416 $ 462 $ 487
The non-current portion of workers’ compensation and general liability reserves is included in other liabilities on the Consolidated Balance Sheets. At January 30, 2021 and February 1, 2020, workers’ compensation and general liability reserves included $106 million and $110 million, respectively, which are covered by deposits and receivables included in current assets on the Consolidated Balance Sheets.
9. Taxes
Income tax expense (benefit) is as follows:
2020 2019 2018 Current Deferred Total Current Deferred Total Current Deferred Total (millions)
Federal $ (520) $ (179) $ (699) $ 137 $ 4 $ 141 $ 156 $ 79 $ 235 State and local 1 (148) (147) 33 (10) 23 54 33 87 $ (519) $ (327) $ (846) $ 170 $ (6) $ 164 $ 210 $ 112 $ 322
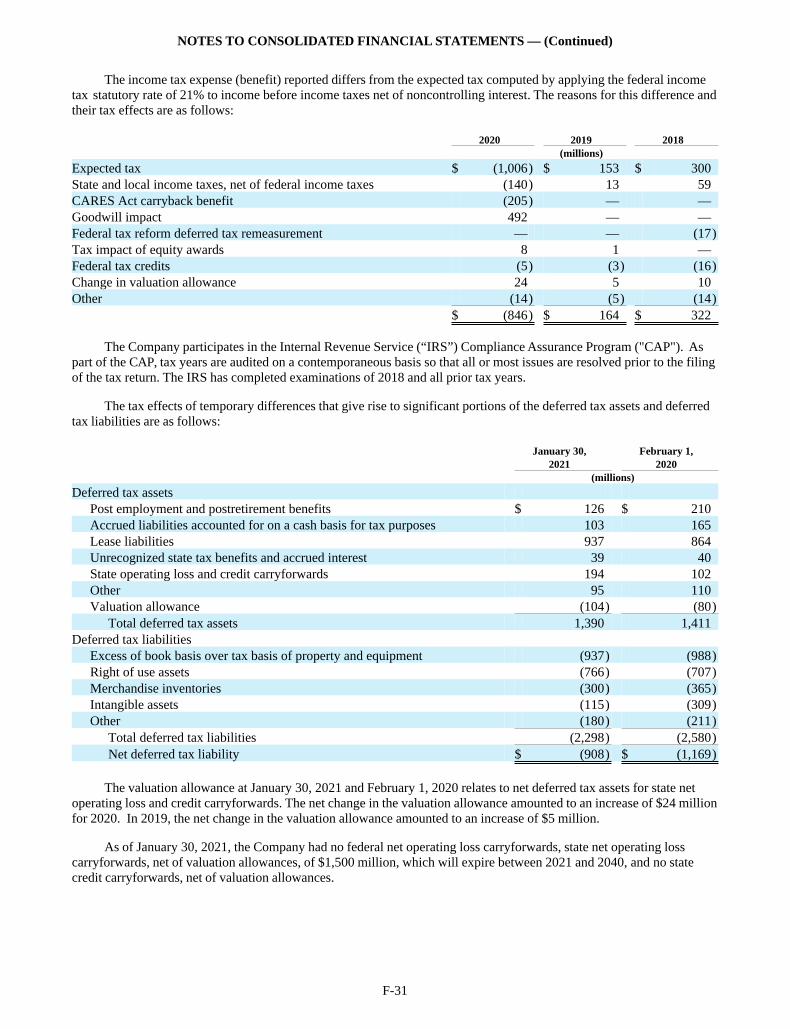
NOTES TO CONSOLIDATED FINANCIAL STATEMENTS — (Continued)
F-31
The income tax expense (benefit) reported differs from the expected tax computed by applying the federal income tax statutory rate of 21% to income before income taxes net of noncontrolling interest. The reasons for this difference and their tax effects are as follows:
2020 2019 2018 (millions)
Expected tax $ (1,006) $ 153 $ 300 State and local income taxes, net of federal income taxes (140) 13 59 CARES Act carryback benefit (205) — — Goodwill impact 492 — — Federal tax reform deferred tax remeasurement — — (17)Tax impact of equity awards 8 1 — Federal tax credits (5) (3) (16)Change in valuation allowance 24 5 10 Other (14) (5) (14) $ (846) $ 164 $ 322
The Company participates in the Internal Revenue Service (“IRS”) Compliance Assurance Program ("CAP"). As part of the CAP, tax years are audited on a contemporaneous basis so that all or most issues are resolved prior to the filing of the tax return. The IRS has completed examinations of 2018 and all prior tax years.
The tax effects of temporary differences that give rise to significant portions of the deferred tax assets and deferred tax liabilities are as follows:
January 30, February 1, 2021 2020 (millions)
Deferred tax assets Post employment and postretirement benefits $ 126 $ 210 Accrued liabilities accounted for on a cash basis for tax purposes 103 165 Lease liabilities 937 864 Unrecognized state tax benefits and accrued interest 39 40 State operating loss and credit carryforwards 194 102 Other 95 110 Valuation allowance (104) (80)
Total deferred tax assets 1,390 1,411 Deferred tax liabilities
Excess of book basis over tax basis of property and equipment (937) (988)Right of use assets (766) (707)Merchandise inventories (300) (365)Intangible assets (115) (309)Other (180) (211)
Total deferred tax liabilities (2,298) (2,580)Net deferred tax liability $ (908) $ (1,169)
The valuation allowance at January 30, 2021 and February 1, 2020 relates to net deferred tax assets for state net operating loss and credit carryforwards. The net change in the valuation allowance amounted to an increase of $24 million for 2020. In 2019, the net change in the valuation allowance amounted to an increase of $5 million.
As of January 30, 2021, the Company had no federal net operating loss carryforwards, state net operating loss carryforwards, net of valuation allowances, of $1,500 million, which will expire between 2021 and 2040, and no state credit carryforwards, net of valuation allowances.
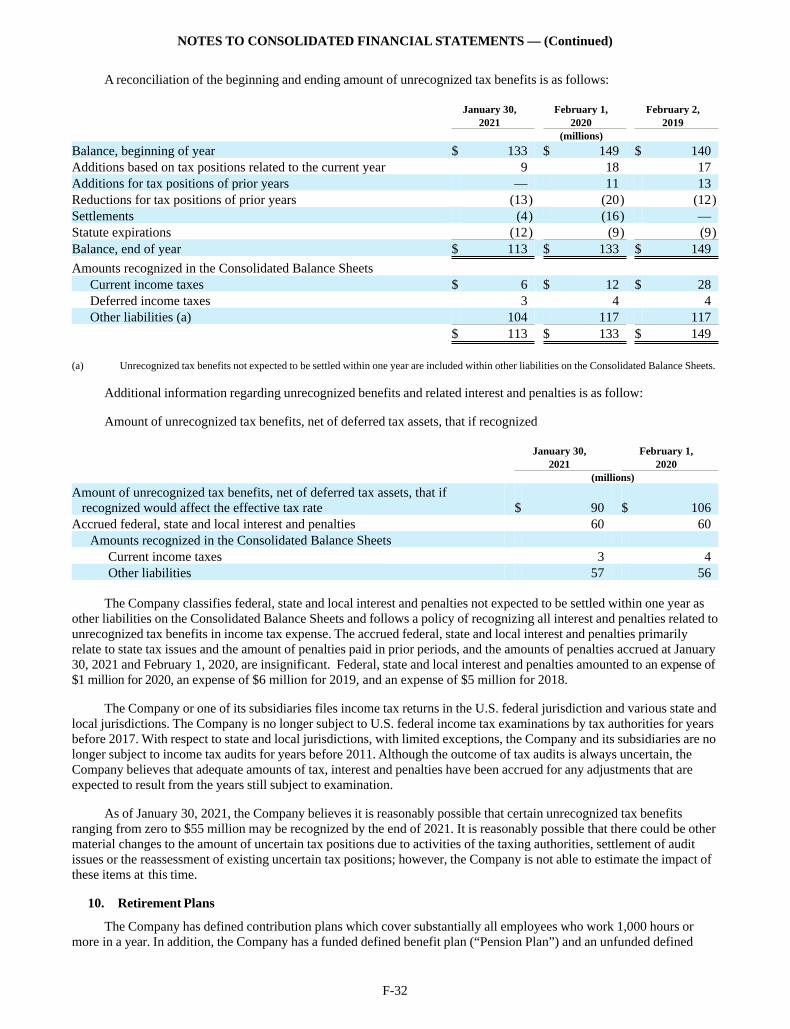
NOTES TO CONSOLIDATED FINANCIAL STATEMENTS — (Continued)
F-32
A reconciliation of the beginning and ending amount of unrecognized tax benefits is as follows:
January 30, February 1, February 2, 2021 2020 2019 (millions)
Balance, beginning of year $ 133 $ 149 $ 140 Additions based on tax positions related to the current year 9 18 17 Additions for tax positions of prior years — 11 13 Reductions for tax positions of prior years (13) (20) (12)Settlements (4) (16) — Statute expirations (12) (9) (9)Balance, end of year $ 113 $ 133 $ 149
Amounts recognized in the Consolidated Balance Sheets Current income taxes $ 6 $ 12 $ 28 Deferred income taxes 3 4 4 Other liabilities (a) 104 117 117
$ 113 $ 133 $ 149
(a) Unrecognized tax benefits not expected to be settled within one year are included within other liabilities on the Consolidated Balance Sheets.
Additional information regarding unrecognized benefits and related interest and penalties is as follow:
Amount of unrecognized tax benefits, net of deferred tax assets, that if recognized
January 30, February 1, 2021 2020 (millions)
Amount of unrecognized tax benefits, net of deferred tax assets, that if recognized would affect the effective tax rate $ 90 $ 106 Accrued federal, state and local interest and penalties 60 60
Amounts recognized in the Consolidated Balance Sheets Current income taxes 3 4 Other liabilities 57 56
The Company classifies federal, state and local interest and penalties not expected to be settled within one year as other liabilities on the Consolidated Balance Sheets and follows a policy of recognizing all interest and penalties related to unrecognized tax benefits in income tax expense. The accrued federal, state and local interest and penalties primarily relate to state tax issues and the amount of penalties paid in prior periods, and the amounts of penalties accrued at January 30, 2021 and February 1, 2020, are insignificant. Federal, state and local interest and penalties amounted to an expense of $1 million for 2020, an expense of $6 million for 2019, and an expense of $5 million for 2018.
The Company or one of its subsidiaries files income tax returns in the U.S. federal jurisdiction and various state and local jurisdictions. The Company is no longer subject to U.S. federal income tax examinations by tax authorities for years before 2017. With respect to state and local jurisdictions, with limited exceptions, the Company and its subsidiaries are no longer subject to income tax audits for years before 2011. Although the outcome of tax audits is always uncertain, the Company believes that adequate amounts of tax, interest and penalties have been accrued for any adjustments that are expected to result from the years still subject to examination.
As of January 30, 2021, the Company believes it is reasonably possible that certain unrecognized tax benefits ranging from zero to $55 million may be recognized by the end of 2021. It is reasonably possible that there could be other material changes to the amount of uncertain tax positions due to activities of the taxing authorities, settlement of audit issues or the reassessment of existing uncertain tax positions; however, the Company is not able to estimate the impact of these items at this time.
10. Retirement Plans
The Company has defined contribution plans which cover substantially all employees who work 1,000 hours or more in a year. In addition, the Company has a funded defined benefit plan (“Pension Plan”) and an unfunded defined
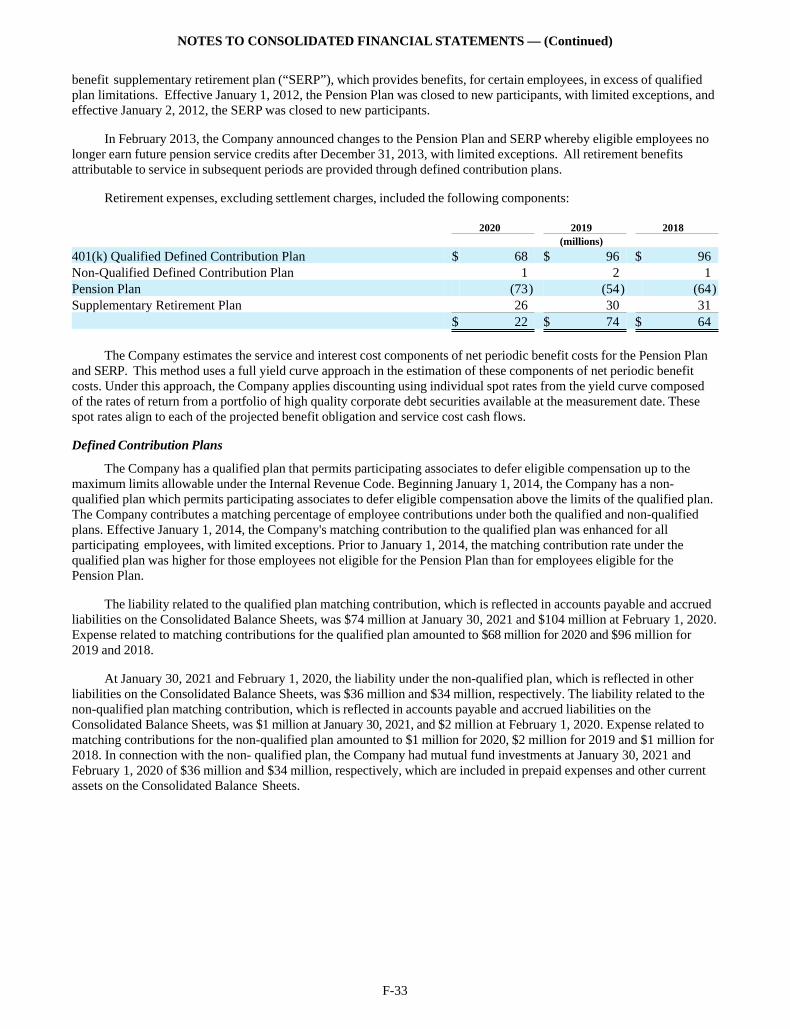
NOTES TO CONSOLIDATED FINANCIAL STATEMENTS — (Continued)
F-33
benefit supplementary retirement plan (“SERP”), which provides benefits, for certain employees, in excess of qualified plan limitations. Effective January 1, 2012, the Pension Plan was closed to new participants, with limited exceptions, and effective January 2, 2012, the SERP was closed to new participants.
In February 2013, the Company announced changes to the Pension Plan and SERP whereby eligible employees no longer earn future pension service credits after December 31, 2013, with limited exceptions. All retirement benefits attributable to service in subsequent periods are provided through defined contribution plans.
Retirement expenses, excluding settlement charges, included the following components:
2020 2019 2018 (millions)
401(k) Qualified Defined Contribution Plan $ 68 $ 96 $ 96 Non-Qualified Defined Contribution Plan 1 2 1 Pension Plan (73) (54) (64)Supplementary Retirement Plan 26 30 31 $ 22 $ 74 $ 64
The Company estimates the service and interest cost components of net periodic benefit costs for the Pension Plan and SERP. This method uses a full yield curve approach in the estimation of these components of net periodic benefit costs. Under this approach, the Company applies discounting using individual spot rates from the yield curve composed of the rates of return from a portfolio of high quality corporate debt securities available at the measurement date. These spot rates align to each of the projected benefit obligation and service cost cash flows.
Defined Contribution Plans
The Company has a qualified plan that permits participating associates to defer eligible compensation up to the maximum limits allowable under the Internal Revenue Code. Beginning January 1, 2014, the Company has a non-qualified plan which permits participating associates to defer eligible compensation above the limits of the qualified plan. The Company contributes a matching percentage of employee contributions under both the qualified and non-qualified plans. Effective January 1, 2014, the Company's matching contribution to the qualified plan was enhanced for all participating employees, with limited exceptions. Prior to January 1, 2014, the matching contribution rate under the qualified plan was higher for those employees not eligible for the Pension Plan than for employees eligible for the Pension Plan.
The liability related to the qualified plan matching contribution, which is reflected in accounts payable and accrued liabilities on the Consolidated Balance Sheets, was $74 million at January 30, 2021 and $104 million at February 1, 2020. Expense related to matching contributions for the qualified plan amounted to $68 million for 2020 and $96 million for 2019 and 2018.
At January 30, 2021 and February 1, 2020, the liability under the non-qualified plan, which is reflected in other liabilities on the Consolidated Balance Sheets, was $36 million and $34 million, respectively. The liability related to the non-qualified plan matching contribution, which is reflected in accounts payable and accrued liabilities on the Consolidated Balance Sheets, was $1 million at January 30, 2021, and $2 million at February 1, 2020. Expense related to matching contributions for the non-qualified plan amounted to $1 million for 2020, $2 million for 2019 and $1 million for 2018. In connection with the non- qualified plan, the Company had mutual fund investments at January 30, 2021 and February 1, 2020 of $36 million and $34 million, respectively, which are included in prepaid expenses and other current assets on the Consolidated Balance Sheets.
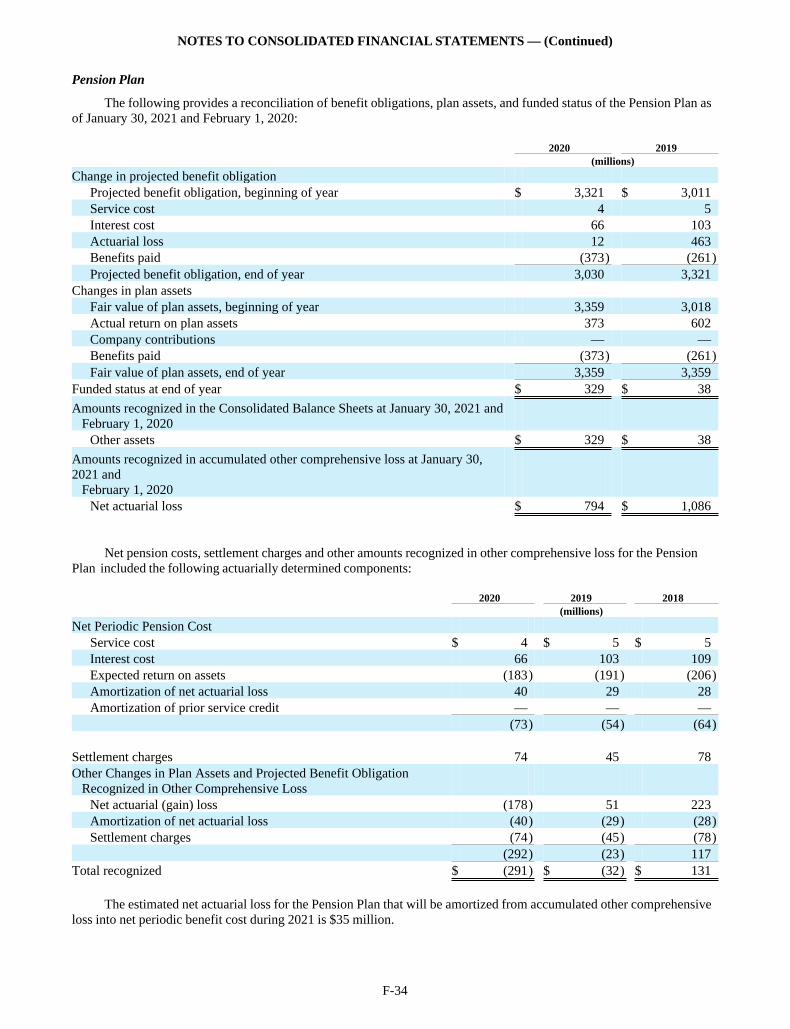
NOTES TO CONSOLIDATED FINANCIAL STATEMENTS — (Continued)
F-34
Pension Plan
The following provides a reconciliation of benefit obligations, plan assets, and funded status of the Pension Plan as of January 30, 2021 and February 1, 2020:
2020 2019 (millions)
Change in projected benefit obligation Projected benefit obligation, beginning of year $ 3,321 $ 3,011 Service cost 4 5 Interest cost 66 103 Actuarial loss 12 463 Benefits paid (373) (261)Projected benefit obligation, end of year 3,030 3,321
Changes in plan assets Fair value of plan assets, beginning of year 3,359 3,018 Actual return on plan assets 373 602 Company contributions — — Benefits paid (373) (261)Fair value of plan assets, end of year 3,359 3,359
Funded status at end of year $ 329 $ 38
Amounts recognized in the Consolidated Balance Sheets at January 30, 2021 and February 1, 2020
Other assets $ 329 $ 38
Amounts recognized in accumulated other comprehensive loss at January 30, 2021 and February 1, 2020
Net actuarial loss $ 794 $ 1,086
Net pension costs, settlement charges and other amounts recognized in other comprehensive loss for the Pension Plan included the following actuarially determined components:
2020 2019 2018 (millions)
Net Periodic Pension Cost Service cost $ 4 $ 5 $ 5 Interest cost 66 103 109 Expected return on assets (183) (191) (206)Amortization of net actuarial loss 40 29 28 Amortization of prior service credit — — —
(73) (54) (64) Settlement charges 74 45 78 Other Changes in Plan Assets and Projected Benefit Obligation Recognized in Other Comprehensive Loss
Net actuarial (gain) loss (178) 51 223 Amortization of net actuarial loss (40) (29) (28)Settlement charges (74) (45) (78)
(292) (23) 117 Total recognized $ (291) $ (32) $ 131
The estimated net actuarial loss for the Pension Plan that will be amortized from accumulated other comprehensive loss into net periodic benefit cost during 2021 is $35 million.
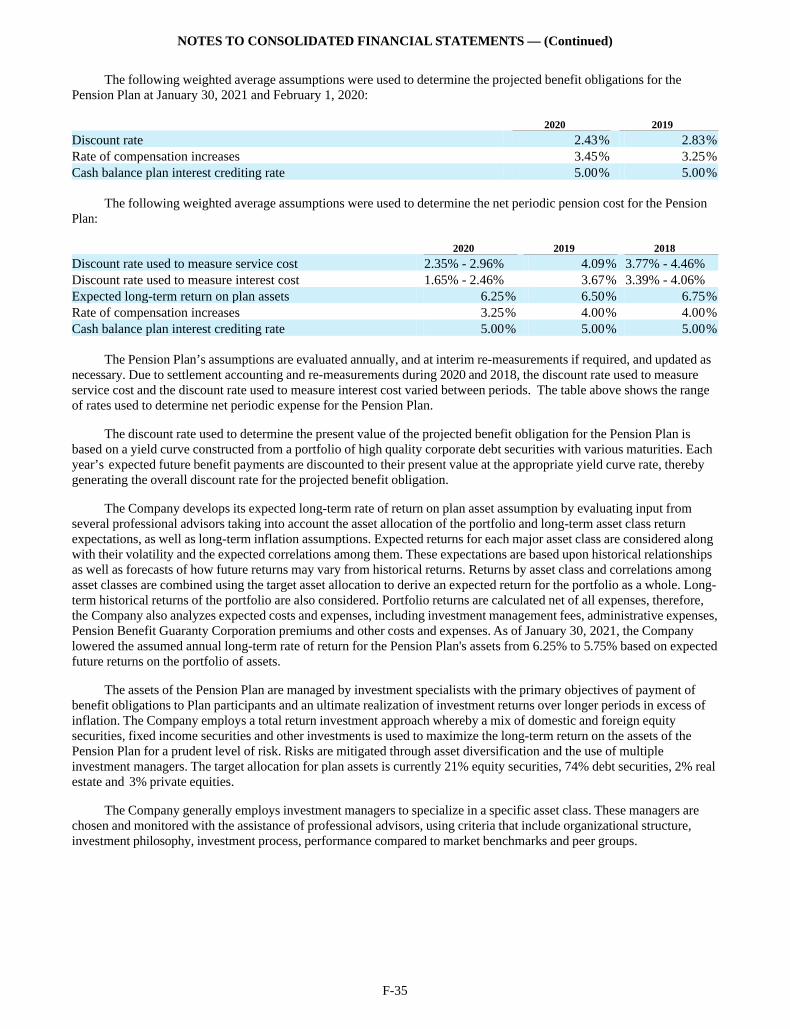
NOTES TO CONSOLIDATED FINANCIAL STATEMENTS — (Continued)
F-35
The following weighted average assumptions were used to determine the projected benefit obligations for the Pension Plan at January 30, 2021 and February 1, 2020:
2020 2019
Discount rate 2.43% 2.83%Rate of compensation increases 3.45% 3.25%Cash balance plan interest crediting rate 5.00% 5.00%
The following weighted average assumptions were used to determine the net periodic pension cost for the Pension Plan:
2020 2019 2018
Discount rate used to measure service cost 2.35% - 2.96% 4.09% 3.77% - 4.46% Discount rate used to measure interest cost 1.65% - 2.46% 3.67% 3.39% - 4.06% Expected long-term return on plan assets 6.25% 6.50% 6.75%Rate of compensation increases 3.25% 4.00% 4.00%Cash balance plan interest crediting rate 5.00% 5.00% 5.00%
The Pension Plan’s assumptions are evaluated annually, and at interim re-measurements if required, and updated as necessary. Due to settlement accounting and re-measurements during 2020 and 2018, the discount rate used to measure service cost and the discount rate used to measure interest cost varied between periods. The table above shows the range of rates used to determine net periodic expense for the Pension Plan.
The discount rate used to determine the present value of the projected benefit obligation for the Pension Plan is based on a yield curve constructed from a portfolio of high quality corporate debt securities with various maturities. Each year’s expected future benefit payments are discounted to their present value at the appropriate yield curve rate, thereby generating the overall discount rate for the projected benefit obligation.
The Company develops its expected long-term rate of return on plan asset assumption by evaluating input from several professional advisors taking into account the asset allocation of the portfolio and long-term asset class return expectations, as well as long-term inflation assumptions. Expected returns for each major asset class are considered along with their volatility and the expected correlations among them. These expectations are based upon historical relationships as well as forecasts of how future returns may vary from historical returns. Returns by asset class and correlations among asset classes are combined using the target asset allocation to derive an expected return for the portfolio as a whole. Long- term historical returns of the portfolio are also considered. Portfolio returns are calculated net of all expenses, therefore, the Company also analyzes expected costs and expenses, including investment management fees, administrative expenses, Pension Benefit Guaranty Corporation premiums and other costs and expenses. As of January 30, 2021, the Company lowered the assumed annual long-term rate of return for the Pension Plan's assets from 6.25% to 5.75% based on expected future returns on the portfolio of assets.
The assets of the Pension Plan are managed by investment specialists with the primary objectives of payment of benefit obligations to Plan participants and an ultimate realization of investment returns over longer periods in excess of inflation. The Company employs a total return investment approach whereby a mix of domestic and foreign equity securities, fixed income securities and other investments is used to maximize the long-term return on the assets of the Pension Plan for a prudent level of risk. Risks are mitigated through asset diversification and the use of multiple investment managers. The target allocation for plan assets is currently 21% equity securities, 74% debt securities, 2% real estate and 3% private equities.
The Company generally employs investment managers to specialize in a specific asset class. These managers are chosen and monitored with the assistance of professional advisors, using criteria that include organizational structure, investment philosophy, investment process, performance compared to market benchmarks and peer groups.
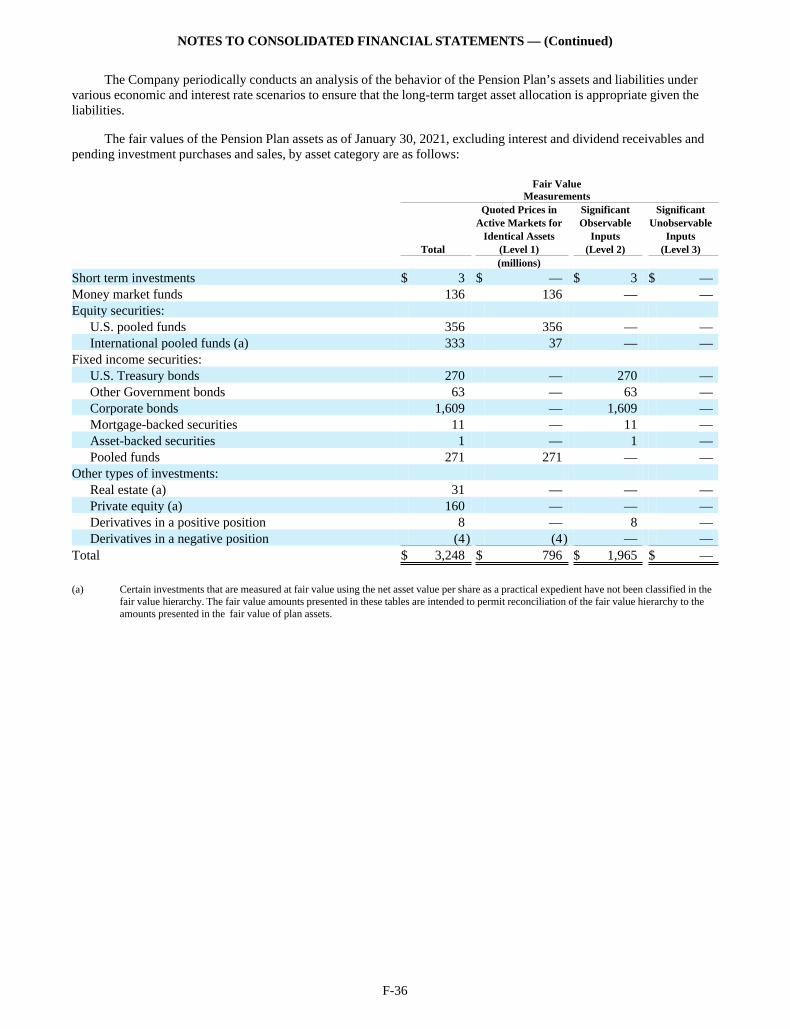
NOTES TO CONSOLIDATED FINANCIAL STATEMENTS — (Continued)
F-36
The Company periodically conducts an analysis of the behavior of the Pension Plan’s assets and liabilities under various economic and interest rate scenarios to ensure that the long-term target asset allocation is appropriate given the liabilities.
The fair values of the Pension Plan assets as of January 30, 2021, excluding interest and dividend receivables and pending investment purchases and sales, by asset category are as follows:
Fair Value
Measurements Quoted Prices in Significant Significant Active Markets for Observable Unobservable Identical Assets Inputs Inputs Total (Level 1) (Level 2) (Level 3) (millions)
Short term investments $ 3 $ — $ 3 $ — Money market funds 136 136 — — Equity securities:
U.S. pooled funds 356 356 — — International pooled funds (a) 333 37 — —
Fixed income securities: U.S. Treasury bonds 270 — 270 — Other Government bonds 63 — 63 — Corporate bonds 1,609 — 1,609 — Mortgage-backed securities 11 — 11 — Asset-backed securities 1 — 1 — Pooled funds 271 271 — —
Other types of investments: Real estate (a) 31 — — — Private equity (a) 160 — — — Derivatives in a positive position 8 — 8 — Derivatives in a negative position (4) (4) — —
Total $ 3,248 $ 796 $ 1,965 $ —
(a) Certain investments that are measured at fair value using the net asset value per share as a practical expedient have not been classified in the fair value hierarchy. The fair value amounts presented in these tables are intended to permit reconciliation of the fair value hierarchy to the amounts presented in the fair value of plan assets.
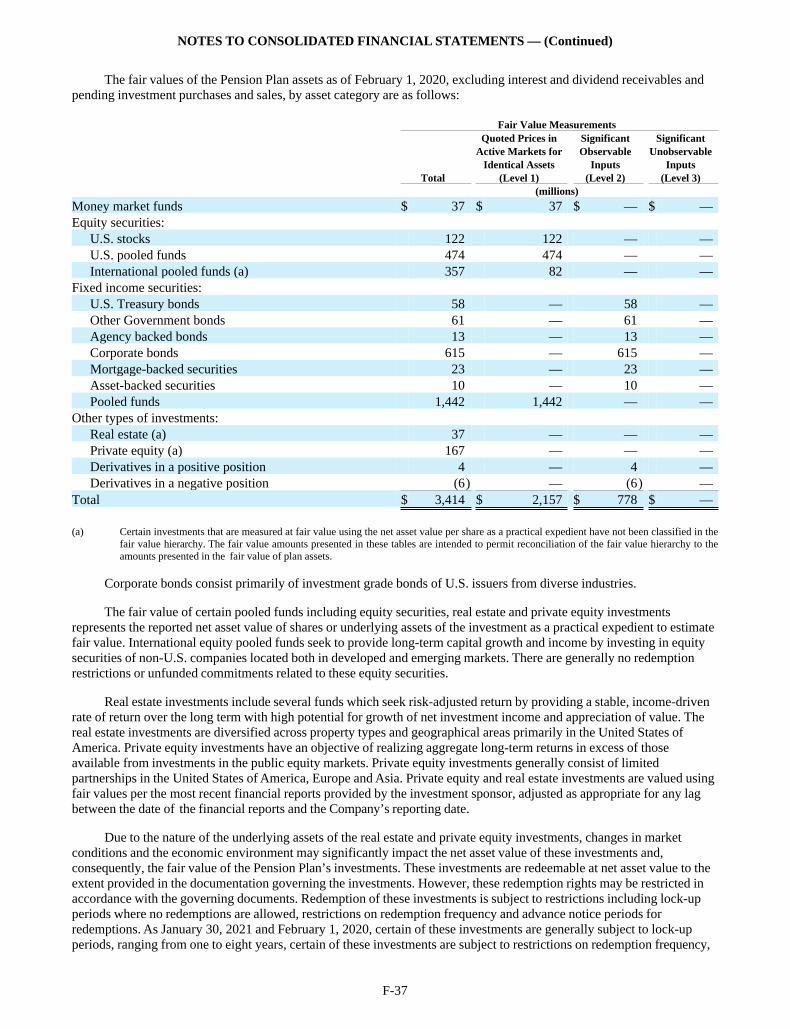
NOTES TO CONSOLIDATED FINANCIAL STATEMENTS — (Continued)
F-37
The fair values of the Pension Plan assets as of February 1, 2020, excluding interest and dividend receivables and pending investment purchases and sales, by asset category are as follows:
Fair Value Measurements Quoted Prices in Significant Significant Active Markets for Observable Unobservable Identical Assets Inputs Inputs Total (Level 1) (Level 2) (Level 3) (millions)
Money market funds $ 37 $ 37 $ — $ — Equity securities:
U.S. stocks 122 122 — — U.S. pooled funds 474 474 — — International pooled funds (a) 357 82 — —
Fixed income securities: U.S. Treasury bonds 58 — 58 — Other Government bonds 61 — 61 — Agency backed bonds 13 — 13 — Corporate bonds 615 — 615 — Mortgage-backed securities 23 — 23 — Asset-backed securities 10 — 10 — Pooled funds 1,442 1,442 — —
Other types of investments: Real estate (a) 37 — — — Private equity (a) 167 — — — Derivatives in a positive position 4 — 4 — Derivatives in a negative position (6) — (6) —
Total $ 3,414 $ 2,157 $ 778 $ —
(a) Certain investments that are measured at fair value using the net asset value per share as a practical expedient have not been classified in the fair value hierarchy. The fair value amounts presented in these tables are intended to permit reconciliation of the fair value hierarchy to the amounts presented in the fair value of plan assets.
Corporate bonds consist primarily of investment grade bonds of U.S. issuers from diverse industries.
The fair value of certain pooled funds including equity securities, real estate and private equity investments represents the reported net asset value of shares or underlying assets of the investment as a practical expedient to estimate fair value. International equity pooled funds seek to provide long-term capital growth and income by investing in equity securities of non-U.S. companies located both in developed and emerging markets. There are generally no redemption restrictions or unfunded commitments related to these equity securities.
Real estate investments include several funds which seek risk-adjusted return by providing a stable, income-driven rate of return over the long term with high potential for growth of net investment income and appreciation of value. The real estate investments are diversified across property types and geographical areas primarily in the United States of America. Private equity investments have an objective of realizing aggregate long-term returns in excess of those available from investments in the public equity markets. Private equity investments generally consist of limited partnerships in the United States of America, Europe and Asia. Private equity and real estate investments are valued using fair values per the most recent financial reports provided by the investment sponsor, adjusted as appropriate for any lag between the date of the financial reports and the Company’s reporting date.
Due to the nature of the underlying assets of the real estate and private equity investments, changes in market conditions and the economic environment may significantly impact the net asset value of these investments and, consequently, the fair value of the Pension Plan’s investments. These investments are redeemable at net asset value to the extent provided in the documentation governing the investments. However, these redemption rights may be restricted in accordance with the governing documents. Redemption of these investments is subject to restrictions including lock-up periods where no redemptions are allowed, restrictions on redemption frequency and advance notice periods for redemptions. As January 30, 2021 and February 1, 2020, certain of these investments are generally subject to lock-up periods, ranging from one to eight years, certain of these investments are subject to restrictions on redemption frequency,
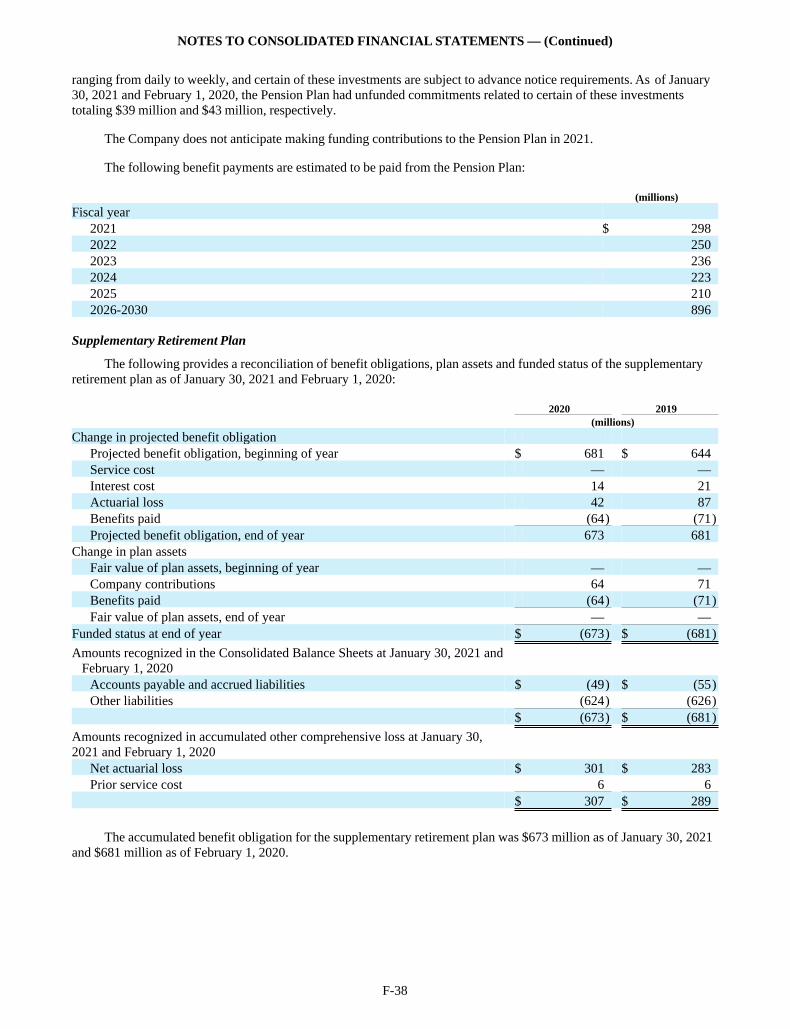
NOTES TO CONSOLIDATED FINANCIAL STATEMENTS — (Continued)
F-38
ranging from daily to weekly, and certain of these investments are subject to advance notice requirements. As of January 30, 2021 and February 1, 2020, the Pension Plan had unfunded commitments related to certain of these investments totaling $39 million and $43 million, respectively.
The Company does not anticipate making funding contributions to the Pension Plan in 2021.
The following benefit payments are estimated to be paid from the Pension Plan:
(millions)
Fiscal year 2021 $ 298 2022 250 2023 236 2024 223 2025 210 2026-2030 896
Supplementary Retirement Plan
The following provides a reconciliation of benefit obligations, plan assets and funded status of the supplementary retirement plan as of January 30, 2021 and February 1, 2020:
2020 2019 (millions)
Change in projected benefit obligation Projected benefit obligation, beginning of year $ 681 $ 644 Service cost — — Interest cost 14 21 Actuarial loss 42 87 Benefits paid (64) (71)Projected benefit obligation, end of year 673 681
Change in plan assets Fair value of plan assets, beginning of year — — Company contributions 64 71 Benefits paid (64) (71)Fair value of plan assets, end of year — —
Funded status at end of year $ (673) $ (681)
Amounts recognized in the Consolidated Balance Sheets at January 30, 2021 and February 1, 2020
Accounts payable and accrued liabilities $ (49) $ (55)Other liabilities (624) (626)
$ (673) $ (681)
Amounts recognized in accumulated other comprehensive loss at January 30, 2021 and February 1, 2020
Net actuarial loss $ 301 $ 283 Prior service cost 6 6
$ 307 $ 289
The accumulated benefit obligation for the supplementary retirement plan was $673 million as of January 30, 2021 and $681 million as of February 1, 2020.
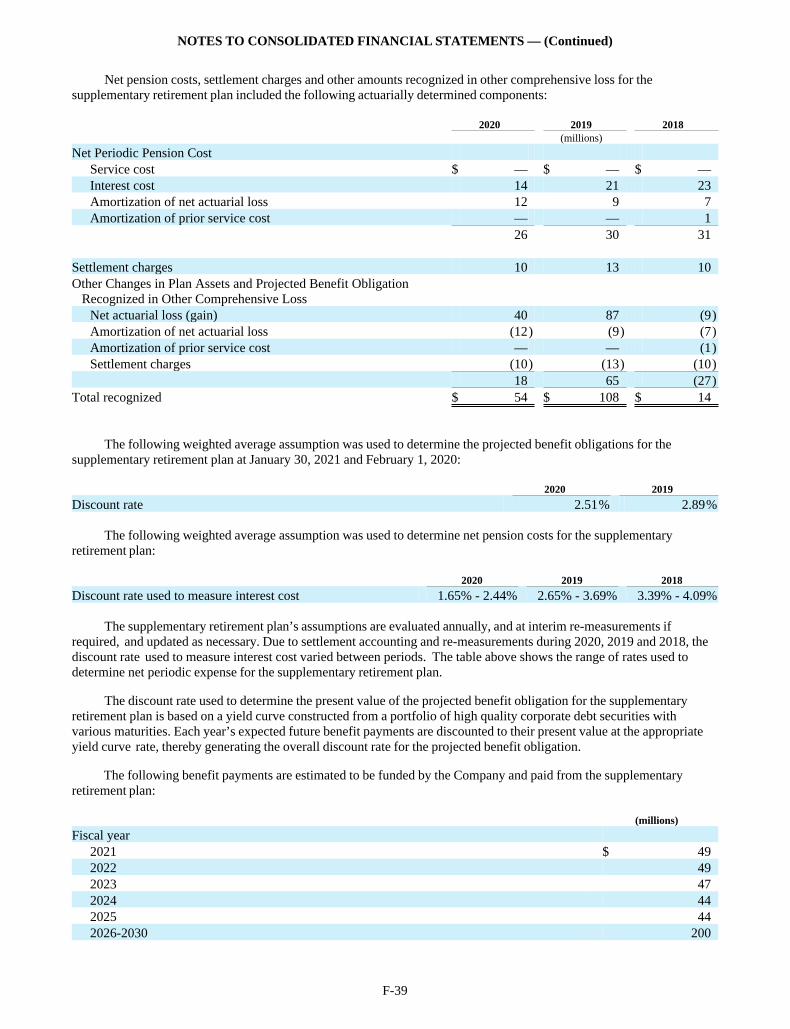
NOTES TO CONSOLIDATED FINANCIAL STATEMENTS — (Continued)
F-39
Net pension costs, settlement charges and other amounts recognized in other comprehensive loss for the supplementary retirement plan included the following actuarially determined components:
2020 2019 2018 (millions)
Net Periodic Pension Cost Service cost $ — $ — $ — Interest cost 14 21 23 Amortization of net actuarial loss 12 9 7 Amortization of prior service cost — — 1
26 30 31 Settlement charges 10 13 10 Other Changes in Plan Assets and Projected Benefit Obligation Recognized in Other Comprehensive Loss
Net actuarial loss (gain) 40 87 (9)Amortization of net actuarial loss (12) (9) (7)Amortization of prior service cost — — (1)Settlement charges (10) (13) (10)
18 65 (27)Total recognized $ 54 $ 108 $ 14
The following weighted average assumption was used to determine the projected benefit obligations for the supplementary retirement plan at January 30, 2021 and February 1, 2020:
2020 2019
Discount rate 2.51% 2.89%
The following weighted average assumption was used to determine net pension costs for the supplementary retirement plan:
2020 2019 2018
Discount rate used to measure interest cost 1.65% - 2.44% 2.65% - 3.69% 3.39% - 4.09%
The supplementary retirement plan’s assumptions are evaluated annually, and at interim re-measurements if required, and updated as necessary. Due to settlement accounting and re-measurements during 2020, 2019 and 2018, the discount rate used to measure interest cost varied between periods. The table above shows the range of rates used to determine net periodic expense for the supplementary retirement plan.
The discount rate used to determine the present value of the projected benefit obligation for the supplementary retirement plan is based on a yield curve constructed from a portfolio of high quality corporate debt securities with various maturities. Each year’s expected future benefit payments are discounted to their present value at the appropriate yield curve rate, thereby generating the overall discount rate for the projected benefit obligation.
The following benefit payments are estimated to be funded by the Company and paid from the supplementary retirement plan:
(millions)
Fiscal year 2021 $ 49 2022 49 2023 47 2024 44 2025 44 2026-2030 200
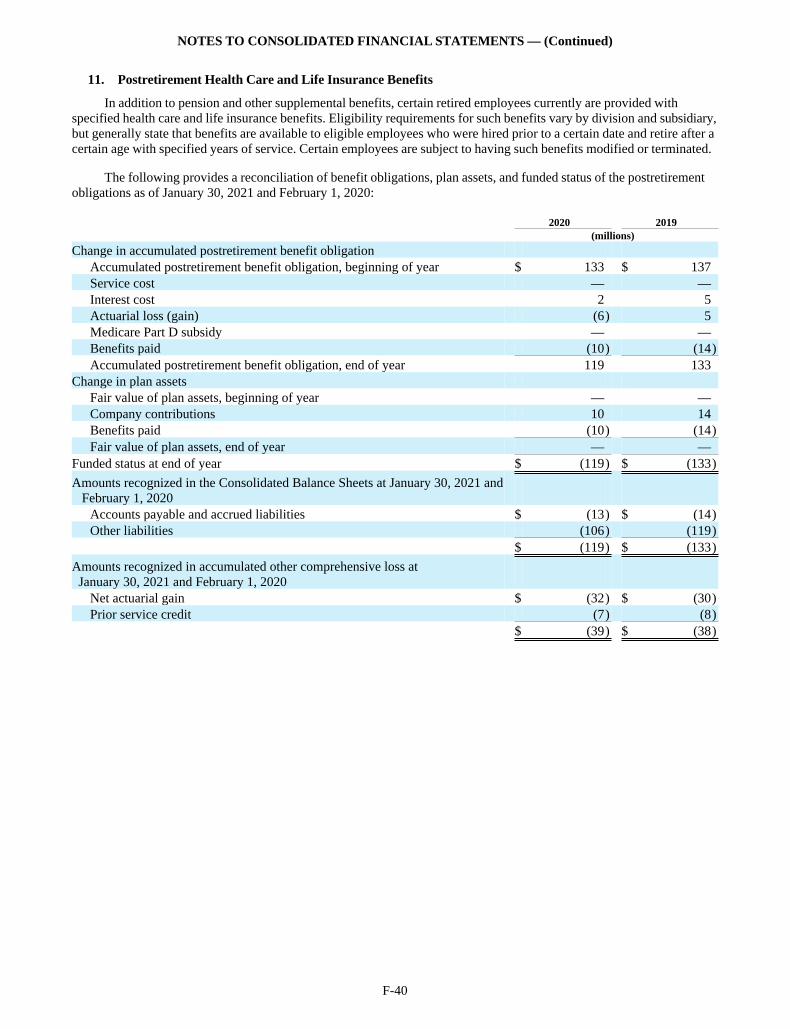
NOTES TO CONSOLIDATED FINANCIAL STATEMENTS — (Continued)
F-40
11. Postretirement Health Care and Life Insurance Benefits
In addition to pension and other supplemental benefits, certain retired employees currently are provided with specified health care and life insurance benefits. Eligibility requirements for such benefits vary by division and subsidiary, but generally state that benefits are available to eligible employees who were hired prior to a certain date and retire after a certain age with specified years of service. Certain employees are subject to having such benefits modified or terminated.
The following provides a reconciliation of benefit obligations, plan assets, and funded status of the postretirement obligations as of January 30, 2021 and February 1, 2020:
2020 2019 (millions)
Change in accumulated postretirement benefit obligation Accumulated postretirement benefit obligation, beginning of year $ 133 $ 137 Service cost — — Interest cost 2 5 Actuarial loss (gain) (6) 5 Medicare Part D subsidy — — Benefits paid (10) (14)Accumulated postretirement benefit obligation, end of year 119 133
Change in plan assets Fair value of plan assets, beginning of year — — Company contributions 10 14 Benefits paid (10) (14)Fair value of plan assets, end of year — —
Funded status at end of year $ (119) $ (133)
Amounts recognized in the Consolidated Balance Sheets at January 30, 2021 and February 1, 2020
Accounts payable and accrued liabilities $ (13) $ (14)Other liabilities (106) (119)
$ (119) $ (133)
Amounts recognized in accumulated other comprehensive loss at January 30, 2021 and February 1, 2020
Net actuarial gain $ (32) $ (30)Prior service credit (7) (8)
$ (39) $ (38)
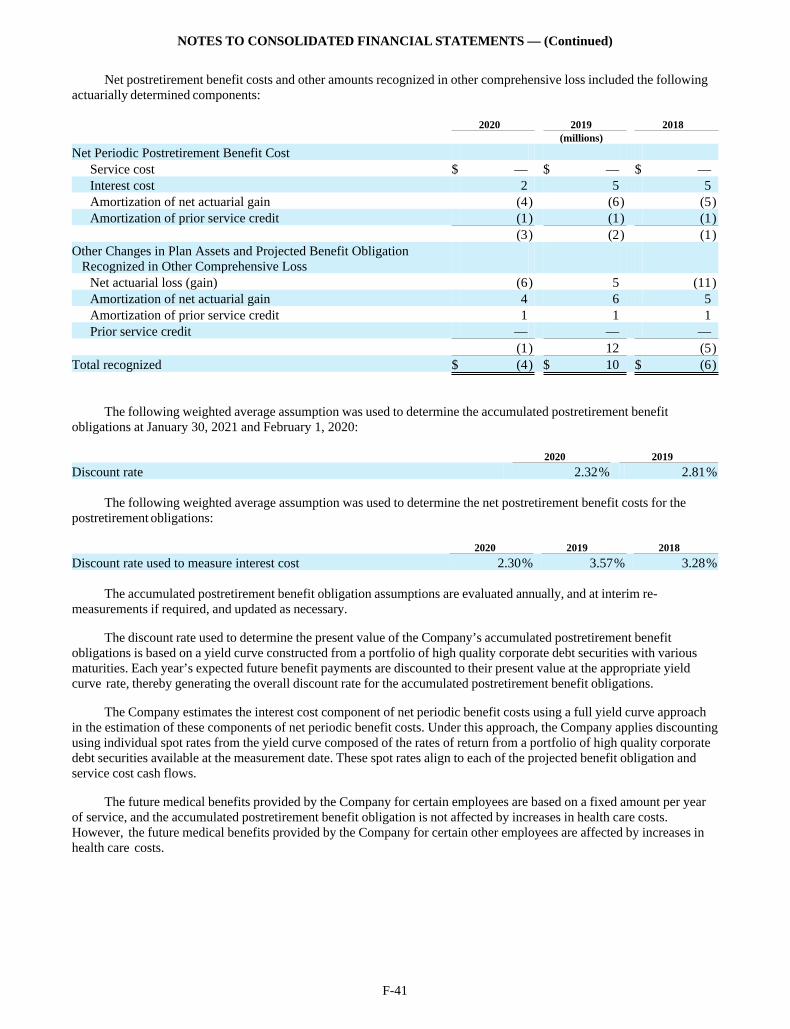
NOTES TO CONSOLIDATED FINANCIAL STATEMENTS — (Continued)
F-41
Net postretirement benefit costs and other amounts recognized in other comprehensive loss included the following actuarially determined components:
2020 2019 2018 (millions)
Net Periodic Postretirement Benefit Cost Service cost $ — $ — $ — Interest cost 2 5 5 Amortization of net actuarial gain (4) (6) (5)Amortization of prior service credit (1) (1) (1)
(3) (2) (1)Other Changes in Plan Assets and Projected Benefit Obligation Recognized in Other Comprehensive Loss
Net actuarial loss (gain) (6) 5 (11)Amortization of net actuarial gain 4 6 5 Amortization of prior service credit 1 1 1 Prior service credit — — —
(1) 12 (5)Total recognized $ (4) $ 10 $ (6)
The following weighted average assumption was used to determine the accumulated postretirement benefit obligations at January 30, 2021 and February 1, 2020:
2020 2019
Discount rate 2.32% 2.81%
The following weighted average assumption was used to determine the net postretirement benefit costs for the postretirement obligations:
2020 2019 2018
Discount rate used to measure interest cost 2.30% 3.57% 3.28%
The accumulated postretirement benefit obligation assumptions are evaluated annually, and at interim re- measurements if required, and updated as necessary.
The discount rate used to determine the present value of the Company’s accumulated postretirement benefit obligations is based on a yield curve constructed from a portfolio of high quality corporate debt securities with various maturities. Each year’s expected future benefit payments are discounted to their present value at the appropriate yield curve rate, thereby generating the overall discount rate for the accumulated postretirement benefit obligations.
The Company estimates the interest cost component of net periodic benefit costs using a full yield curve approach in the estimation of these components of net periodic benefit costs. Under this approach, the Company applies discounting using individual spot rates from the yield curve composed of the rates of return from a portfolio of high quality corporate debt securities available at the measurement date. These spot rates align to each of the projected benefit obligation and service cost cash flows.
The future medical benefits provided by the Company for certain employees are based on a fixed amount per year of service, and the accumulated postretirement benefit obligation is not affected by increases in health care costs. However, the future medical benefits provided by the Company for certain other employees are affected by increases in health care costs.
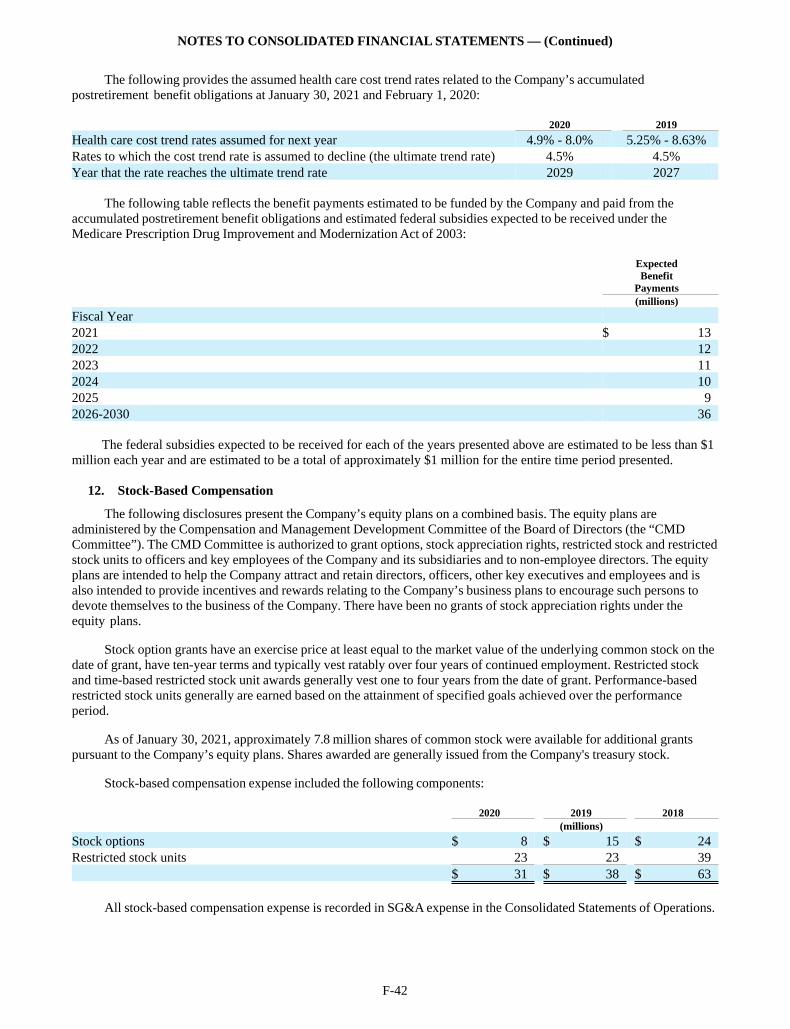
NOTES TO CONSOLIDATED FINANCIAL STATEMENTS — (Continued)
F-42
The following provides the assumed health care cost trend rates related to the Company’s accumulated postretirement benefit obligations at January 30, 2021 and February 1, 2020:
2020 2019
Health care cost trend rates assumed for next year 4.9% - 8.0% 5.25% - 8.63% Rates to which the cost trend rate is assumed to decline (the ultimate trend rate) 4.5% 4.5% Year that the rate reaches the ultimate trend rate 2029 2027
The following table reflects the benefit payments estimated to be funded by the Company and paid from the accumulated postretirement benefit obligations and estimated federal subsidies expected to be received under the Medicare Prescription Drug Improvement and Modernization Act of 2003:
ExpectedBenefit
Payments (millions)
Fiscal Year 2021 $ 13 2022 12 2023 11 2024 10 2025 9 2026-2030 36
The federal subsidies expected to be received for each of the years presented above are estimated to be less than $1 million each year and are estimated to be a total of approximately $1 million for the entire time period presented.
12. Stock-Based Compensation
The following disclosures present the Company’s equity plans on a combined basis. The equity plans are administered by the Compensation and Management Development Committee of the Board of Directors (the “CMD Committee”). The CMD Committee is authorized to grant options, stock appreciation rights, restricted stock and restricted stock units to officers and key employees of the Company and its subsidiaries and to non-employee directors. The equity plans are intended to help the Company attract and retain directors, officers, other key executives and employees and is also intended to provide incentives and rewards relating to the Company’s business plans to encourage such persons to devote themselves to the business of the Company. There have been no grants of stock appreciation rights under the equity plans.
Stock option grants have an exercise price at least equal to the market value of the underlying common stock on the date of grant, have ten-year terms and typically vest ratably over four years of continued employment. Restricted stock and time-based restricted stock unit awards generally vest one to four years from the date of grant. Performance-based restricted stock units generally are earned based on the attainment of specified goals achieved over the performance period.
As of January 30, 2021, approximately 7.8 million shares of common stock were available for additional grants pursuant to the Company’s equity plans. Shares awarded are generally issued from the Company's treasury stock.
Stock-based compensation expense included the following components:
2020 2019 2018 (millions)
Stock options $ 8 $ 15 $ 24 Restricted stock units 23 23 39 $ 31 $ 38 $ 63
All stock-based compensation expense is recorded in SG&A expense in the Consolidated Statements of Operations.
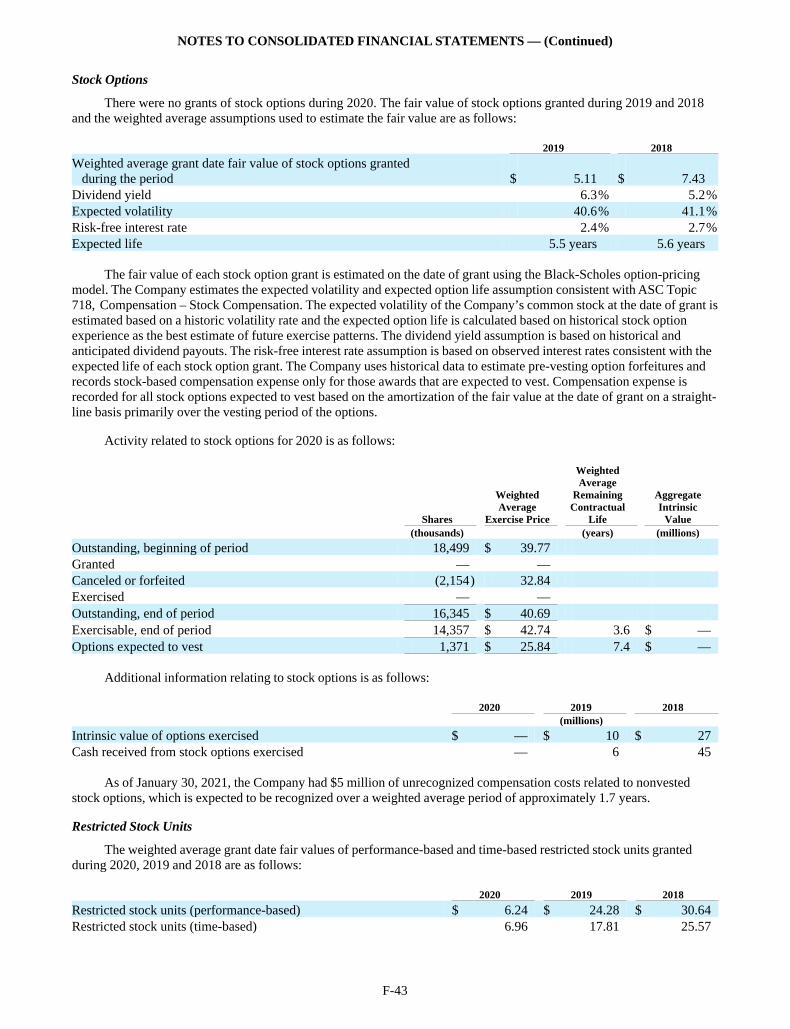
NOTES TO CONSOLIDATED FINANCIAL STATEMENTS — (Continued)
F-43
Stock Options
There were no grants of stock options during 2020. The fair value of stock options granted during 2019 and 2018 and the weighted average assumptions used to estimate the fair value are as follows:
2019 2018
Weighted average grant date fair value of stock options granted during the period $ 5.11 $ 7.43 Dividend yield 6.3% 5.2%Expected volatility 40.6% 41.1%Risk-free interest rate 2.4% 2.7%Expected life 5.5 years 5.6 years
The fair value of each stock option grant is estimated on the date of grant using the Black-Scholes option-pricing model. The Company estimates the expected volatility and expected option life assumption consistent with ASC Topic 718, Compensation – Stock Compensation. The expected volatility of the Company’s common stock at the date of grant is estimated based on a historic volatility rate and the expected option life is calculated based on historical stock option experience as the best estimate of future exercise patterns. The dividend yield assumption is based on historical and anticipated dividend payouts. The risk-free interest rate assumption is based on observed interest rates consistent with the expected life of each stock option grant. The Company uses historical data to estimate pre-vesting option forfeitures and records stock-based compensation expense only for those awards that are expected to vest. Compensation expense is recorded for all stock options expected to vest based on the amortization of the fair value at the date of grant on a straight- line basis primarily over the vesting period of the options.
Activity related to stock options for 2020 is as follows:
Shares
WeightedAverage
Exercise Price
WeightedAverage
RemainingContractual
Life
AggregateIntrinsic
Value (thousands) (years) (millions)
Outstanding, beginning of period 18,499 $ 39.77 Granted — — Canceled or forfeited (2,154) 32.84 Exercised — — Outstanding, end of period 16,345 $ 40.69 Exercisable, end of period 14,357 $ 42.74 3.6 $ — Options expected to vest 1,371 $ 25.84 7.4 $ —
Additional information relating to stock options is as follows:
2020 2019 2018 (millions)
Intrinsic value of options exercised $ — $ 10 $ 27 Cash received from stock options exercised — 6 45
As of January 30, 2021, the Company had $5 million of unrecognized compensation costs related to nonvested stock options, which is expected to be recognized over a weighted average period of approximately 1.7 years.
Restricted Stock Units
The weighted average grant date fair values of performance-based and time-based restricted stock units granted during 2020, 2019 and 2018 are as follows:
2020 2019 2018
Restricted stock units (performance-based) $ 6.24 $ 24.28 $ 30.64 Restricted stock units (time-based) 6.96 17.81 25.57
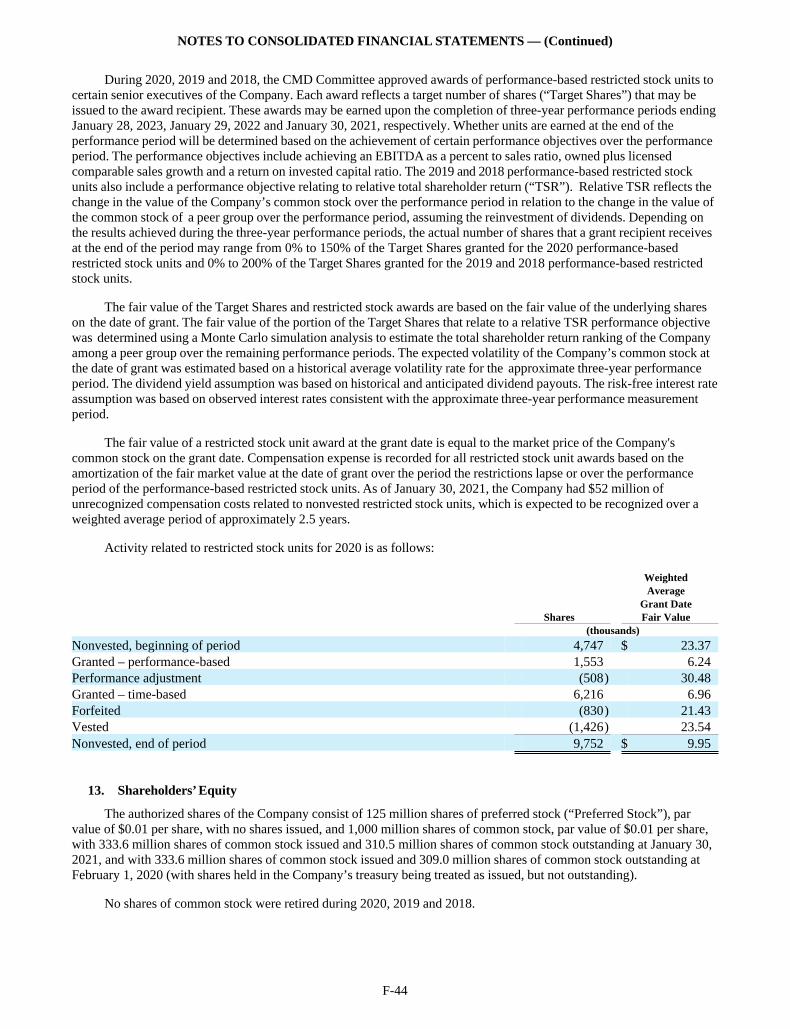
NOTES TO CONSOLIDATED FINANCIAL STATEMENTS — (Continued)
F-44
During 2020, 2019 and 2018, the CMD Committee approved awards of performance-based restricted stock units to certain senior executives of the Company. Each award reflects a target number of shares (“Target Shares”) that may be issued to the award recipient. These awards may be earned upon the completion of three-year performance periods ending January 28, 2023, January 29, 2022 and January 30, 2021, respectively. Whether units are earned at the end of the performance period will be determined based on the achievement of certain performance objectives over the performance period. The performance objectives include achieving an EBITDA as a percent to sales ratio, owned plus licensed comparable sales growth and a return on invested capital ratio. The 2019 and 2018 performance-based restricted stock units also include a performance objective relating to relative total shareholder return (“TSR”). Relative TSR reflects the change in the value of the Company’s common stock over the performance period in relation to the change in the value of the common stock of a peer group over the performance period, assuming the reinvestment of dividends. Depending on the results achieved during the three-year performance periods, the actual number of shares that a grant recipient receives at the end of the period may range from 0% to 150% of the Target Shares granted for the 2020 performance-based restricted stock units and 0% to 200% of the Target Shares granted for the 2019 and 2018 performance-based restricted stock units.
The fair value of the Target Shares and restricted stock awards are based on the fair value of the underlying shares on the date of grant. The fair value of the portion of the Target Shares that relate to a relative TSR performance objective was determined using a Monte Carlo simulation analysis to estimate the total shareholder return ranking of the Company among a peer group over the remaining performance periods. The expected volatility of the Company’s common stock at the date of grant was estimated based on a historical average volatility rate for the approximate three-year performance period. The dividend yield assumption was based on historical and anticipated dividend payouts. The risk-free interest rate assumption was based on observed interest rates consistent with the approximate three-year performance measurement period.
The fair value of a restricted stock unit award at the grant date is equal to the market price of the Company's common stock on the grant date. Compensation expense is recorded for all restricted stock unit awards based on the amortization of the fair market value at the date of grant over the period the restrictions lapse or over the performance period of the performance-based restricted stock units. As of January 30, 2021, the Company had $52 million of unrecognized compensation costs related to nonvested restricted stock units, which is expected to be recognized over a weighted average period of approximately 2.5 years.
Activity related to restricted stock units for 2020 is as follows:
Weighted Average Grant Date Shares Fair Value (thousands)
Nonvested, beginning of period 4,747 $ 23.37 Granted – performance-based 1,553 6.24 Performance adjustment (508) 30.48 Granted – time-based 6,216 6.96 Forfeited (830) 21.43 Vested (1,426) 23.54 Nonvested, end of period 9,752 $ 9.95
13. Shareholders’ Equity
The authorized shares of the Company consist of 125 million shares of preferred stock (“Preferred Stock”), par value of $0.01 per share, with no shares issued, and 1,000 million shares of common stock, par value of $0.01 per share, with 333.6 million shares of common stock issued and 310.5 million shares of common stock outstanding at January 30, 2021, and with 333.6 million shares of common stock issued and 309.0 million shares of common stock outstanding at February 1, 2020 (with shares held in the Company’s treasury being treated as issued, but not outstanding).
No shares of common stock were retired during 2020, 2019 and 2018.
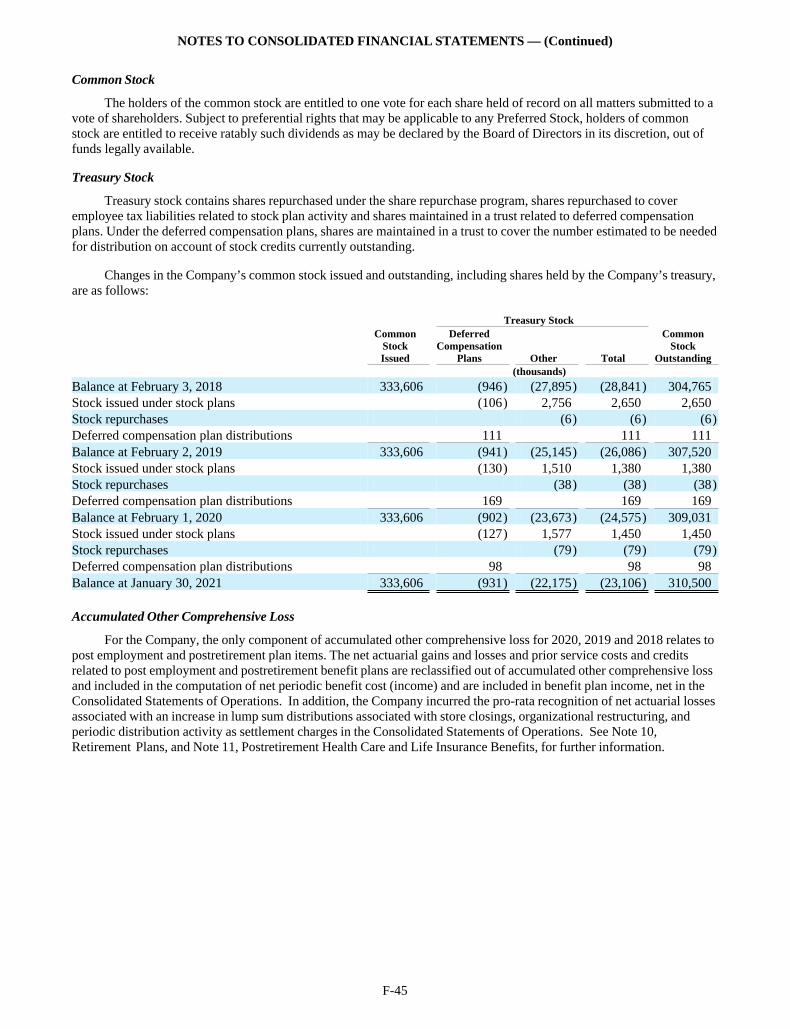
NOTES TO CONSOLIDATED FINANCIAL STATEMENTS — (Continued)
F-45
Common Stock
The holders of the common stock are entitled to one vote for each share held of record on all matters submitted to a vote of shareholders. Subject to preferential rights that may be applicable to any Preferred Stock, holders of common stock are entitled to receive ratably such dividends as may be declared by the Board of Directors in its discretion, out of funds legally available.
Treasury Stock
Treasury stock contains shares repurchased under the share repurchase program, shares repurchased to cover employee tax liabilities related to stock plan activity and shares maintained in a trust related to deferred compensation plans. Under the deferred compensation plans, shares are maintained in a trust to cover the number estimated to be needed for distribution on account of stock credits currently outstanding.
Changes in the Company’s common stock issued and outstanding, including shares held by the Company’s treasury, are as follows:
Treasury Stock
CommonStockIssued
DeferredCompensation
Plans Other Total
CommonStock
Outstanding (thousands)
Balance at February 3, 2018 333,606 (946) (27,895) (28,841) 304,765 Stock issued under stock plans (106) 2,756 2,650 2,650 Stock repurchases (6) (6) (6)Deferred compensation plan distributions 111 111 111 Balance at February 2, 2019 333,606 (941) (25,145) (26,086) 307,520 Stock issued under stock plans (130) 1,510 1,380 1,380 Stock repurchases (38) (38) (38)Deferred compensation plan distributions 169 169 169 Balance at February 1, 2020 333,606 (902) (23,673) (24,575) 309,031 Stock issued under stock plans (127) 1,577 1,450 1,450 Stock repurchases (79) (79) (79)Deferred compensation plan distributions 98 98 98 Balance at January 30, 2021 333,606 (931) (22,175) (23,106) 310,500
Accumulated Other Comprehensive Loss
For the Company, the only component of accumulated other comprehensive loss for 2020, 2019 and 2018 relates to post employment and postretirement plan items. The net actuarial gains and losses and prior service costs and credits related to post employment and postretirement benefit plans are reclassified out of accumulated other comprehensive loss and included in the computation of net periodic benefit cost (income) and are included in benefit plan income, net in the Consolidated Statements of Operations. In addition, the Company incurred the pro-rata recognition of net actuarial losses associated with an increase in lump sum distributions associated with store closings, organizational restructuring, and periodic distribution activity as settlement charges in the Consolidated Statements of Operations. See Note 10, Retirement Plans, and Note 11, Postretirement Health Care and Life Insurance Benefits, for further information.
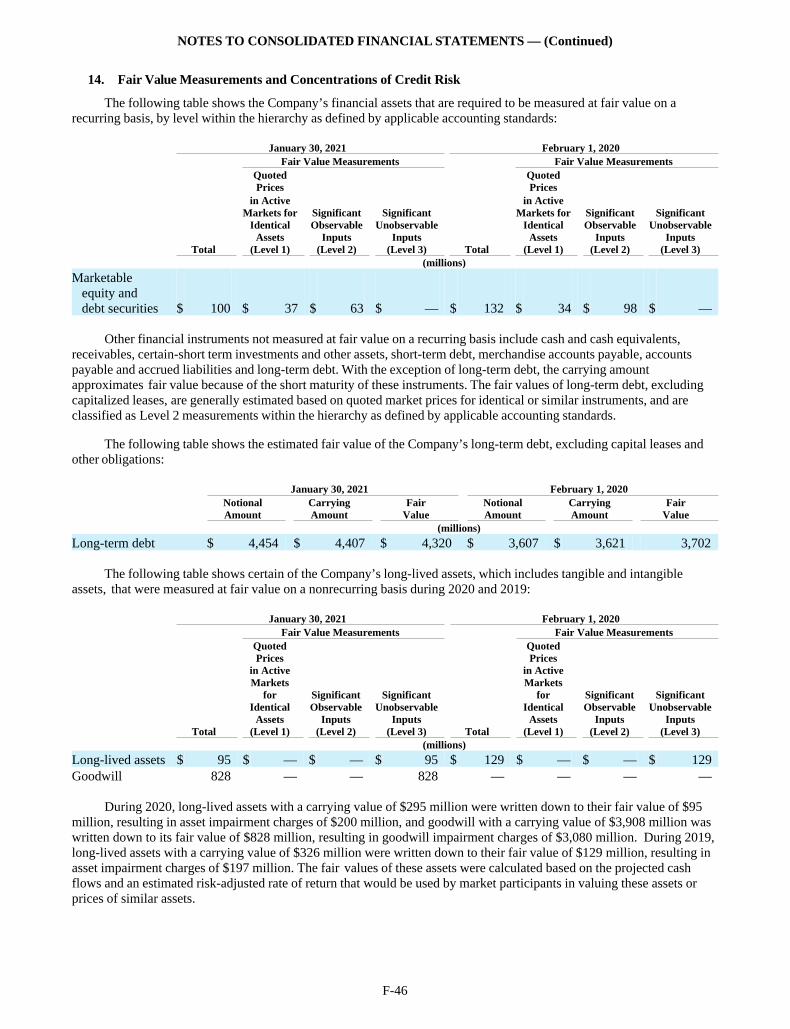
NOTES TO CONSOLIDATED FINANCIAL STATEMENTS — (Continued)
F-46
14. Fair Value Measurements and Concentrations of Credit Risk
The following table shows the Company’s financial assets that are required to be measured at fair value on a recurring basis, by level within the hierarchy as defined by applicable accounting standards:
January 30, 2021 February 1, 2020 Fair Value Measurements Fair Value Measurements
QuotedPrices
QuotedPrices
Total
in ActiveMarkets for
IdenticalAssets
(Level 1)
SignificantObservable
Inputs(Level 2)
SignificantUnobservable
Inputs(Level 3) Total
in ActiveMarkets for
IdenticalAssets
(Level 1)
SignificantObservable
Inputs(Level 2)
SignificantUnobservable
Inputs(Level 3)
(millions)
Marketable equity and debt securities $ 100 $ 37 $ 63 $ — $ 132 $ 34 $ 98 $ —
Other financial instruments not measured at fair value on a recurring basis include cash and cash equivalents, receivables, certain-short term investments and other assets, short-term debt, merchandise accounts payable, accounts payable and accrued liabilities and long-term debt. With the exception of long-term debt, the carrying amount approximates fair value because of the short maturity of these instruments. The fair values of long-term debt, excluding capitalized leases, are generally estimated based on quoted market prices for identical or similar instruments, and are classified as Level 2 measurements within the hierarchy as defined by applicable accounting standards.
The following table shows the estimated fair value of the Company’s long-term debt, excluding capital leases and other obligations:
January 30, 2021 February 1, 2020
NotionalAmount
CarryingAmount
FairValue
NotionalAmount
CarryingAmount
FairValue
(millions)
Long-term debt $ 4,454 $ 4,407 $ 4,320 $ 3,607 $ 3,621 3,702
The following table shows certain of the Company’s long-lived assets, which includes tangible and intangible assets, that were measured at fair value on a nonrecurring basis during 2020 and 2019:
January 30, 2021 February 1, 2020 Fair Value Measurements Fair Value Measurements
Total
QuotedPrices
in ActiveMarkets
forIdentical
Assets(Level 1)
SignificantObservable
Inputs(Level 2)
SignificantUnobservable
Inputs(Level 3) Total
QuotedPrices
in ActiveMarkets
forIdentical
Assets(Level 1)
SignificantObservable
Inputs(Level 2)
SignificantUnobservable
Inputs(Level 3)
(millions)
Long-lived assets $ 95 $ — $ — $ 95 $ 129 $ — $ — $ 129 Goodwill 828 — — 828 — — — —
During 2020, long-lived assets with a carrying value of $295 million were written down to their fair value of $95 million, resulting in asset impairment charges of $200 million, and goodwill with a carrying value of $3,908 million was written down to its fair value of $828 million, resulting in goodwill impairment charges of $3,080 million. During 2019, long-lived assets with a carrying value of $326 million were written down to their fair value of $129 million, resulting in asset impairment charges of $197 million. The fair values of these assets were calculated based on the projected cash flows and an estimated risk-adjusted rate of return that would be used by market participants in valuing these assets or prices of similar assets.
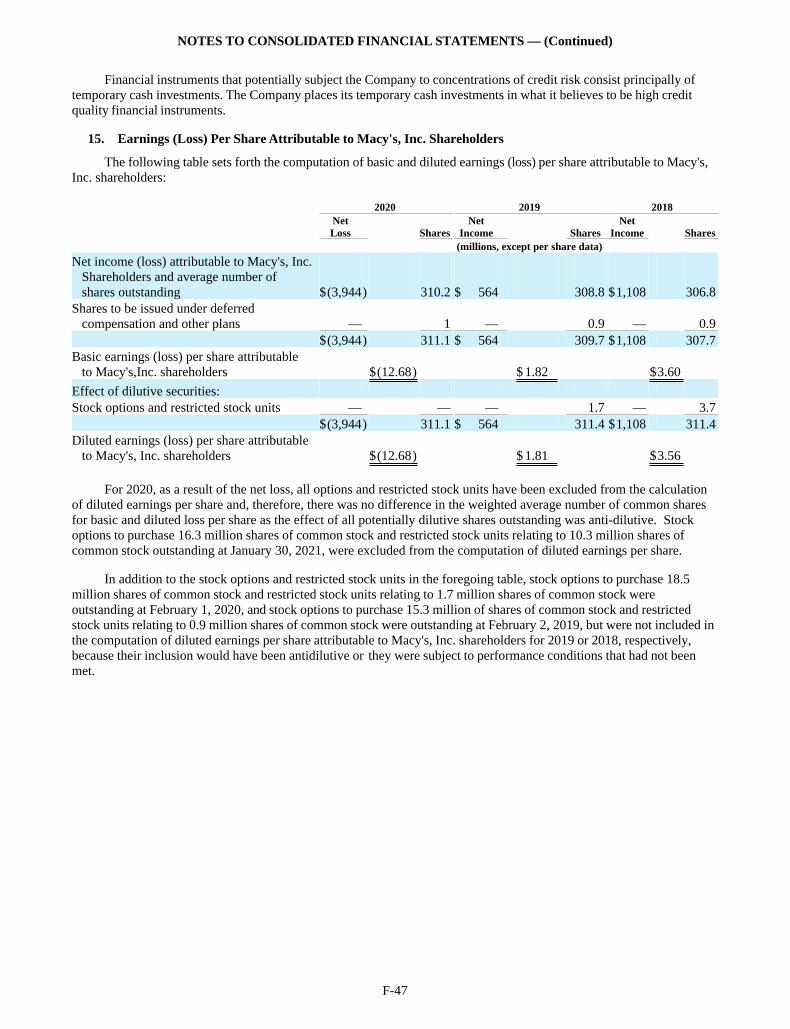
NOTES TO CONSOLIDATED FINANCIAL STATEMENTS — (Continued)
F-47
Financial instruments that potentially subject the Company to concentrations of credit risk consist principally of temporary cash investments. The Company places its temporary cash investments in what it believes to be high credit quality financial instruments.
15. Earnings (Loss) Per Share Attributable to Macy's, Inc. Shareholders
The following table sets forth the computation of basic and diluted earnings (loss) per share attributable to Macy's, Inc. shareholders:
2020 2019 2018
NetLoss Shares
NetIncome Shares
NetIncome Shares
(millions, except per share data)
Net income (loss) attributable to Macy's, Inc. Shareholders and average number of shares outstanding $(3,944) 310.2 $ 564 308.8 $1,108 306.8 Shares to be issued under deferred compensation and other plans — 1 — 0.9 — 0.9 $(3,944) 311.1 $ 564 309.7 $1,108 307.7 Basic earnings (loss) per share attributable to Macy's,Inc. shareholders $(12.68) $ 1.82 $3.60
Effect of dilutive securities: Stock options and restricted stock units — — — 1.7 — 3.7 $(3,944) 311.1 $ 564 311.4 $1,108 311.4 Diluted earnings (loss) per share attributable to Macy's, Inc. shareholders $(12.68) $ 1.81 $3.56
For 2020, as a result of the net loss, all options and restricted stock units have been excluded from the calculation of diluted earnings per share and, therefore, there was no difference in the weighted average number of common shares for basic and diluted loss per share as the effect of all potentially dilutive shares outstanding was anti-dilutive. Stock options to purchase 16.3 million shares of common stock and restricted stock units relating to 10.3 million shares of common stock outstanding at January 30, 2021, were excluded from the computation of diluted earnings per share.
In addition to the stock options and restricted stock units in the foregoing table, stock options to purchase 18.5 million shares of common stock and restricted stock units relating to 1.7 million shares of common stock were outstanding at February 1, 2020, and stock options to purchase 15.3 million of shares of common stock and restricted stock units relating to 0.9 million shares of common stock were outstanding at February 2, 2019, but were not included in the computation of diluted earnings per share attributable to Macy's, Inc. shareholders for 2019 or 2018, respectively, because their inclusion would have been antidilutive or they were subject to performance conditions that had not been met.
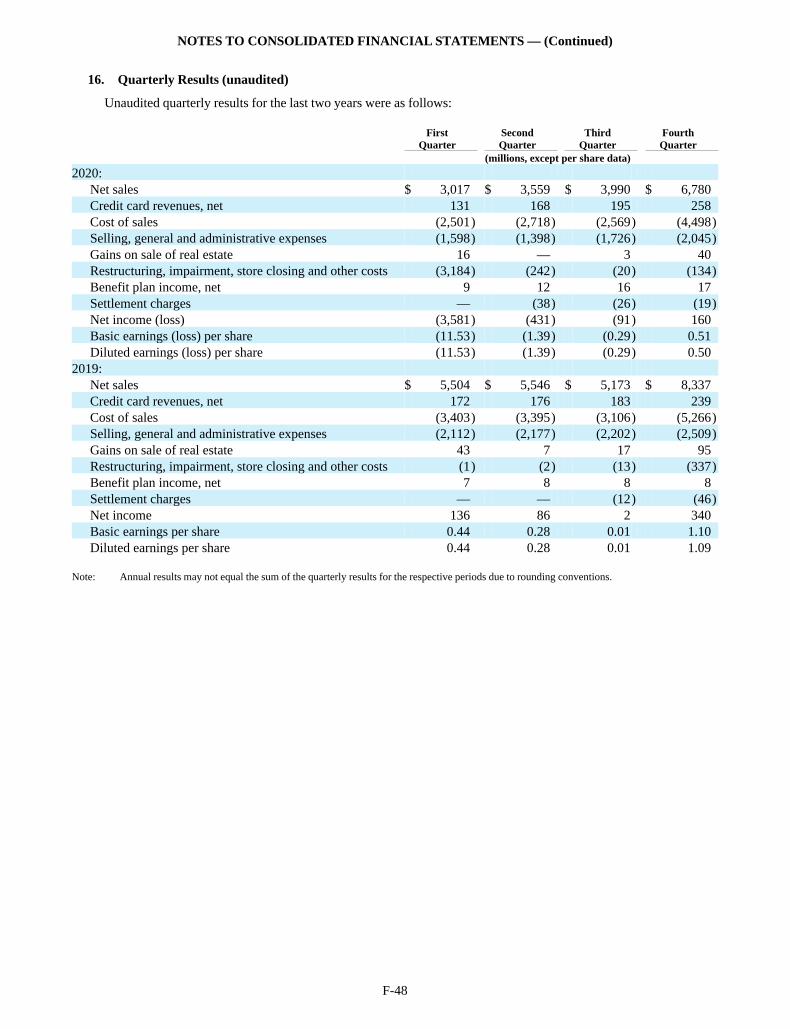
NOTES TO CONSOLIDATED FINANCIAL STATEMENTS — (Continued)
F-48
16. Quarterly Results (unaudited)
Unaudited quarterly results for the last two years were as follows:
FirstQuarter
SecondQuarter
ThirdQuarter
FourthQuarter
(millions, except per share data)
2020: Net sales $ 3,017 $ 3,559 $ 3,990 $ 6,780 Credit card revenues, net 131 168 195 258 Cost of sales (2,501) (2,718) (2,569) (4,498)Selling, general and administrative expenses (1,598) (1,398) (1,726) (2,045)Gains on sale of real estate 16 — 3 40 Restructuring, impairment, store closing and other costs (3,184) (242) (20) (134)Benefit plan income, net 9 12 16 17 Settlement charges — (38) (26) (19)Net income (loss) (3,581) (431) (91) 160 Basic earnings (loss) per share (11.53) (1.39) (0.29) 0.51 Diluted earnings (loss) per share (11.53) (1.39) (0.29) 0.50
2019: Net sales $ 5,504 $ 5,546 $ 5,173 $ 8,337 Credit card revenues, net 172 176 183 239 Cost of sales (3,403) (3,395) (3,106) (5,266)Selling, general and administrative expenses (2,112) (2,177) (2,202) (2,509)Gains on sale of real estate 43 7 17 95 Restructuring, impairment, store closing and other costs (1) (2) (13) (337)Benefit plan income, net 7 8 8 8 Settlement charges — — (12) (46)Net income 136 86 2 340 Basic earnings per share 0.44 0.28 0.01 1.10 Diluted earnings per share 0.44 0.28 0.01 1.09
Note: Annual results may not equal the sum of the quarterly results for the respective periods due to rounding conventions.
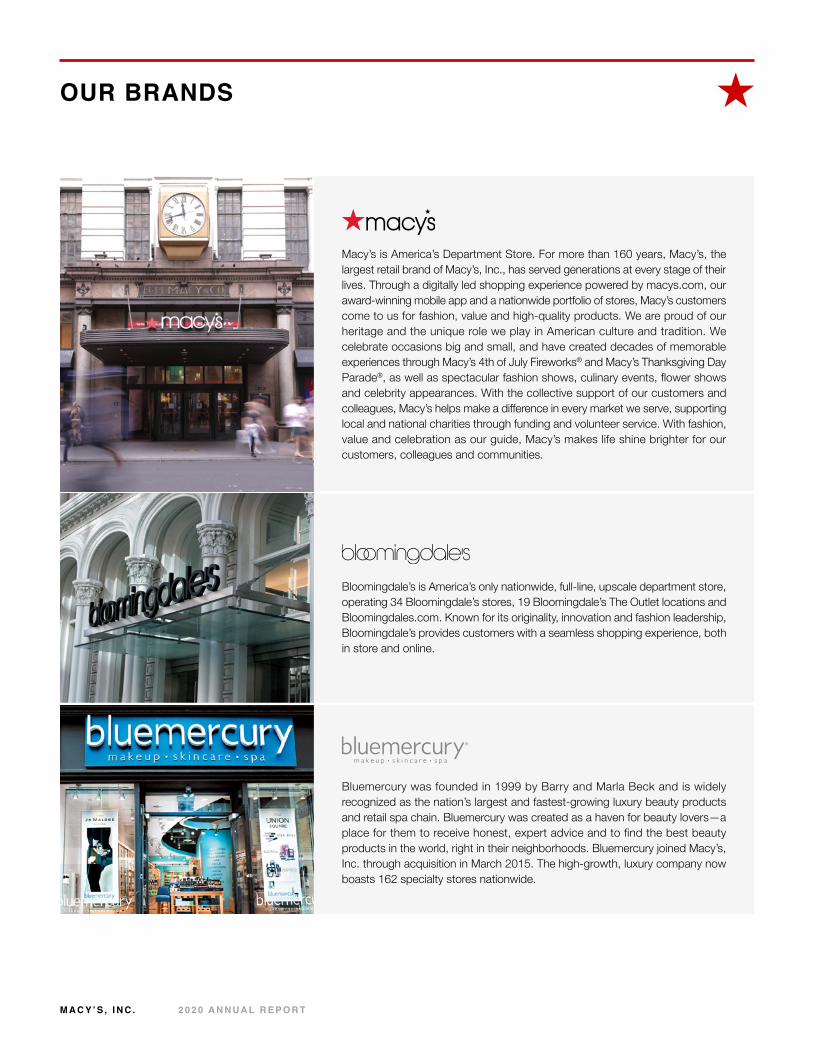
M A C Y ’ S , I N C . 2 0 2 0 A N N U A L R E P O R T
OUR BRANDS
Macy’s is America’s Department Store. For more than 160 years, Macy’s, the largest retail brand of Macy’s, Inc., has served generations at every stage of their lives. Through a digitally led shopping experience powered by macys.com, our award-winning mobile app and a nationwide portfolio of stores, Macy’s customers come to us for fashion, value and high-quality products. We are proud of our heritage and the unique role we play in American culture and tradition. We celebrate occasions big and small, and have created decades of memorable experiences through Macy’s 4th of July Fireworks® and Macy’s Thanksgiving Day Parade®, as well as spectacular fashion shows, culinary events, flower shows and celebrity appearances. With the collective support of our customers and colleagues, Macy’s helps make a difference in every market we serve, supporting local and national charities through funding and volunteer service. With fashion, value and celebration as our guide, Macy’s makes life shine brighter for our customers, colleagues and communities.
Bluemercury was founded in 1999 by Barry and Marla Beck and is widely recognized as the nation’s largest and fastest-growing luxury beauty products and retail spa chain. Bluemercury was created as a haven for beauty lovers—a place for them to receive honest, expert advice and to find the best beauty products in the world, right in their neighborhoods. Bluemercury joined Macy’s, Inc. through acquisition in March 2015. The high-growth, luxury company now boasts 162 specialty stores nationwide.
Bloomingdale’s is America’s only nationwide, full-line, upscale department store, operating 34 Bloomingdale’s stores, 19 Bloomingdale’s The Outlet locations and Bloomingdales.com. Known for its originality, innovation and fashion leadership, Bloomingdale’s provides customers with a seamless shopping experience, both in store and online.
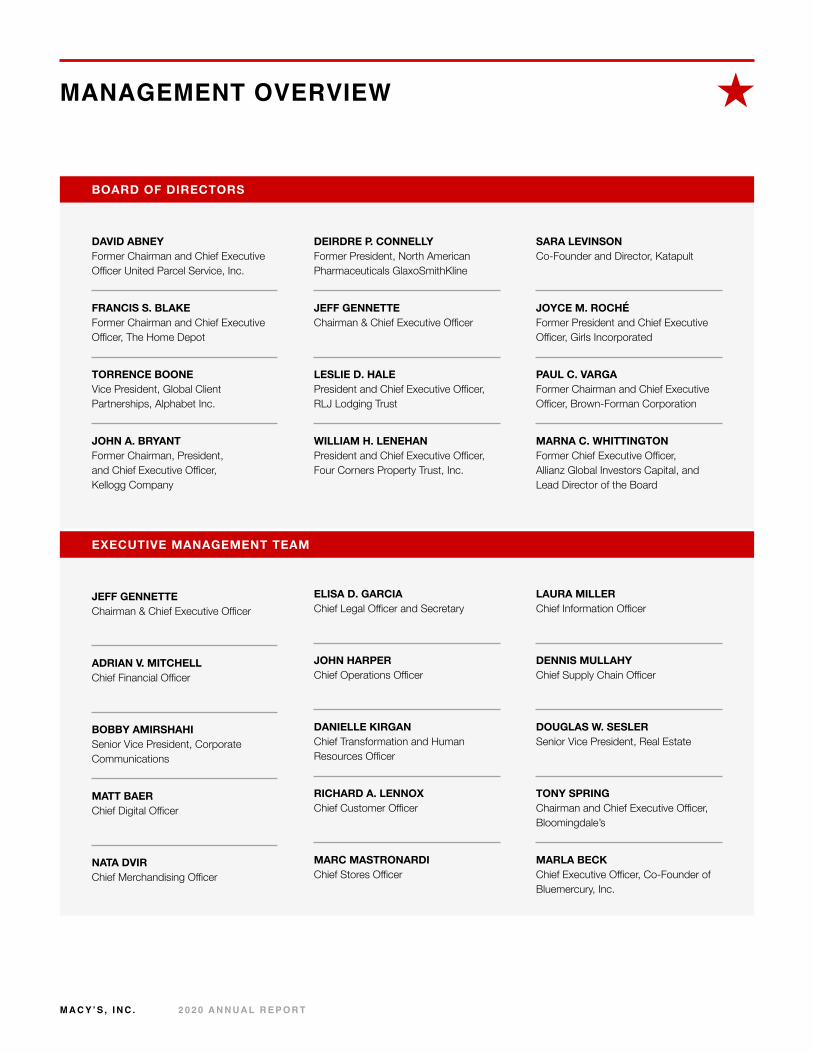
M A C Y ’ S , I N C . 2 0 2 0 A N N U A L R E P O R T
MANAGEMENT OVERVIEW
BOARD OF DIRECTORS
EXECUTIVE MANAGEMENT TEAM
DAVID ABNEYFormer Chairman and Chief Executive Officer United Parcel Service, Inc.
FRANCIS S. BLAKEFormer Chairman and Chief Executive Officer, The Home Depot
TORRENCE BOONEVice President, Global Client Partnerships, Alphabet Inc.
JOHN A. BRYANTFormer Chairman, President, and Chief Executive Officer, Kellogg Company
JEFF GENNETTEChairman & Chief Executive Officer
ADRIAN V. MITCHELLChief Financial Officer
BOBBY AMIRSHAHISenior Vice President, Corporate Communications
MATT BAERChief Digital Officer
NATA DVIRChief Merchandising Officer
DEIRDRE P. CONNELLYFormer President, North American Pharmaceuticals GlaxoSmithKline
JEFF GENNETTEChairman & Chief Executive Officer
LESLIE D. HALEPresident and Chief Executive Officer, RLJ Lodging Trust
WILLIAM H. LENEHANPresident and Chief Executive Officer, Four Corners Property Trust, Inc.
ELISA D. GARCIA Chief Legal Officer and Secretary
JOHN HARPERChief Operations Officer
DANIELLE KIRGAN Chief Transformation and Human Resources Officer
RICHARD A. LENNOXChief Customer Officer
MARC MASTRONARDIChief Stores Officer
SARA LEVINSONCo-Founder and Director, Katapult
JOYCE M. ROCHÉFormer President and Chief Executive Officer, Girls Incorporated
PAUL C. VARGAFormer Chairman and Chief Executive Officer, Brown-Forman Corporation
MARNA C. WHITTINGTONFormer Chief Executive Officer, Allianz Global Investors Capital, and Lead Director of the Board
LAURA MILLERChief Information Officer
DENNIS MULLAHYChief Supply Chain Officer
DOUGLAS W. SESLERSenior Vice President, Real Estate
TONY SPRINGChairman and Chief Executive Officer, Bloomingdale’s
MARLA BECKChief Executive Officer, Co-Founder of Bluemercury, Inc.
M A C Y ’ S , I N C . 2 0 2 0 A N N U A L R E P O R T
M A C Y S I N C . C O M | M A C Y S . C O M | B L O O M I N G D A L E S . C O M | B L U E M E R C U RY. C O M
SHAREHOLDER INFORMATION
CONTACT USMACYSINC.COM/INVESTORS
MACY’S INC. SHARESCOMPUTERSHARE.COM/INVESTOR
Macy’s, Inc. c/o Computershare Shareowner Services P.O. Box 505000 Louisville, KY 40233-5000
CALLMacy’s, Inc. Investor Relations Department 1-212-494-1621
WRITEMacy’s, Inc. Investor Relations Department 151 W. 34th Street, 13th Floor New York, NY 10001
EMAIL [email protected]
1-866-337-3311 (Inside the United States and Canada)
1-201-680-6578 (Outside the United States and Canada)
1-800-231-5469 (TDD) For the hearing impaired