Embed Size (px)
Citation preview

20th Annual Willis Construction Risk Management Conference
Plano, Texas
What’s Next for Surety? Adapting to changes in the Construction Economy…
C. Scott Hull, Head of SuretyWillis Global Surety
2
Today’s TopicsToday’s Topics
• Surety Market
• Underwriting Focus
• How Sureties View Financial Information
• Strategy – “Surety Game plan”
3
Surety Market OverviewSurety Market Overview
• Profitable trend continues for seventh consecutive year
•Top line revenue showing moderate growth
•U.S. industry direct loss ratio of only 16%
•Significant capacity available
4
Surety Market OverviewSurety Market Overview
• Extremely competitive market
• New players continue to enter product line
• 2014 forecast – moderate top line growth; potential for uptick in claim frequency as economy accelerates
• Forecasts predict the industry will remain stable
5
2013 Surety Industry Results2013 Surety Industry Results
2013 GWP Rank
2013 Market Share Entity Name
2013Y Direct
Premiums Written ($000)
YOY DWP Change
2013Y Direct
Premiums Earned ($000)
2013Y Direct
Losses Incurred ($000)
YOY Direct Losses Incurred Change
2013Y Direct
Incurred Loss
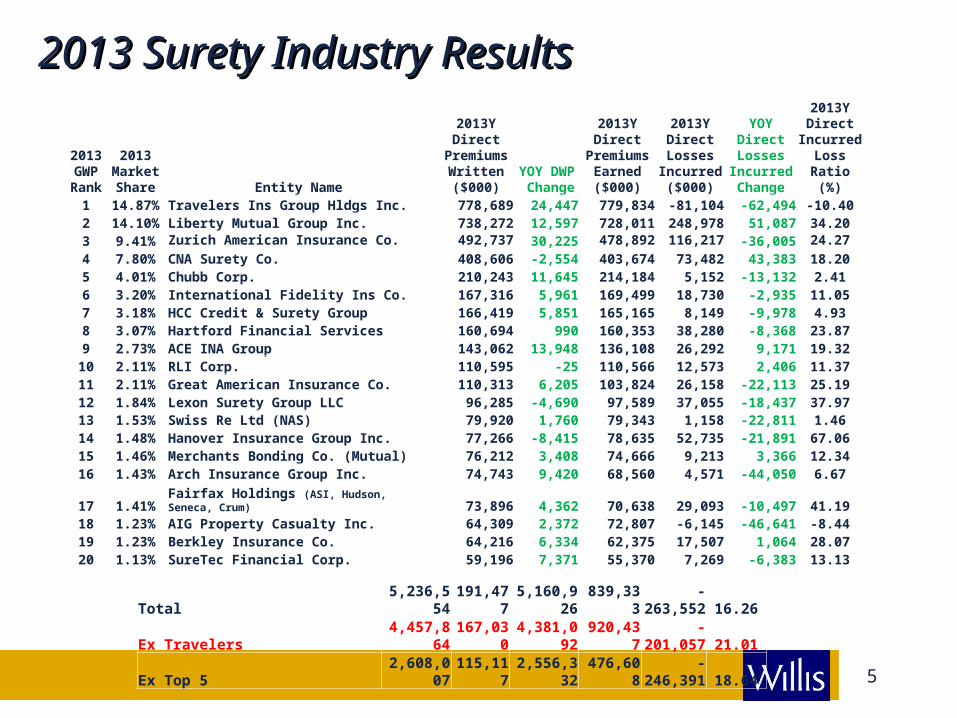
Ratio (%)1 14.87% Travelers Ins Group Hldgs Inc. 778,689 24,447 779,834 -81,104 -62,494 -10.402 14.10% Liberty Mutual Group Inc. 738,272 12,597 728,011 248,978 51,087 34.203 9.41% Zurich American Insurance Co. 492,737 30,225 478,892 116,217 -36,005 24.27
4 7.80% CNA Surety Co. 408,606 -2,554 403,674 73,482 43,383 18.205 4.01% Chubb Corp. 210,243 11,645 214,184 5,152 -13,132 2.416 3.20% International Fidelity Ins Co. 167,316 5,961 169,499 18,730 -2,935 11.057 3.18% HCC Credit & Surety Group 166,419 5,851 165,165 8,149 -9,978 4.938 3.07% Hartford Financial Services 160,694 990 160,353 38,280 -8,368 23.879 2.73% ACE INA Group 143,062 13,948 136,108 26,292 9,171 19.3210 2.11% RLI Corp. 110,595 -25 110,566 12,573 2,406 11.3711 2.11% Great American Insurance Co. 110,313 6,205 103,824 26,158 -22,113 25.1912 1.84% Lexon Surety Group LLC 96,285 -4,690 97,589 37,055 -18,437 37.9713 1.53% Swiss Re Ltd (NAS) 79,920 1,760 79,343 1,158 -22,811 1.4614 1.48% Hanover Insurance Group Inc. 77,266 -8,415 78,635 52,735 -21,891 67.0615 1.46% Merchants Bonding Co. (Mutual) 76,212 3,408 74,666 9,213 3,366 12.3416 1.43% Arch Insurance Group Inc. 74,743 9,420 68,560 4,571 -44,050 6.67
17 1.41% Fairfax Holdings (ASI, Hudson, Seneca, Crum) 73,896 4,362 70,638 29,093 -10,497 41.1918 1.23% AIG Property Casualty Inc. 64,309 2,372 72,807 -6,145 -46,641 -8.4419 1.23% Berkley Insurance Co. 64,216 6,334 62,375 17,507 1,064 28.0720 1.13% SureTec Financial Corp. 59,196 7,371 55,370 7,269 -6,383 13.13
Total 5,236,554 191,477 5,160,926 839,333 -263,552 16.26Ex Travelers 4,457,864 167,030 4,381,092 920,437 -201,057 21.01Ex Top 5 2,608,007 115,117 2,556,332 476,608 -246,391 18.64

6
Top 15 Writers of All U.S. SuretyTop 15 Writers of All U.S. SuretySurety & Fidelity Association of America
Top 15 Surety Writers1994 vs 2013
1994 2013
Surety
($millions)
Premium Surety
1 Reliance Travelers 147.1 1 TRAVELERS BOND 778.62 USF&G St. Paul Travelers 144.1 2 LIBERTY MUTUAL GRP 738.23 F&D Zurich 142.5 3 ZURICH INSURANCE GRP 492.74 St Paul Group Travelers 140.9 4 CNA INSURANCE GRP 408.65 AIG AIU Holdings Chartis 111.5 5 CHUBB & SON INC GRP 210.26 Aetna Travelers 106.6 6 INTERNATIONAL FIDELITY INS CO 167.37 Continental CNA 100.7 7 HCC CREDIT & SURETY GROUP 166.48 Fireman's Fund Out of surety 97.3 8 HARTFORD FINANCIAL SERVICES 160.79 CNA Insurance Companies 92.8 9 ACE LTD GROUP 143.1
10 Safeco Liberty Mutual 88.9 10 RLI INSURANCE GRP 110.611 Chubb 77.7 11 GREAT AMERICAN 110.312 Hartford 74.0 12 LEXON/BONDSAFEGUARD 96.313 Amwest Gone 70.2 13 NAS SURETY GRP 79.914 Capsure CNA 55.3 14 HANOVER INSURANCE GROUP 77.215 CIGNA Group ACE 49.7 15 MERCHANTS BONDING 76.2
($millions)
Premium
Companies that are gone in RED
Companies that merged or were sold are in BLUECompanies that merger or were sold a second time are in GREEN
Source: SFAA
7
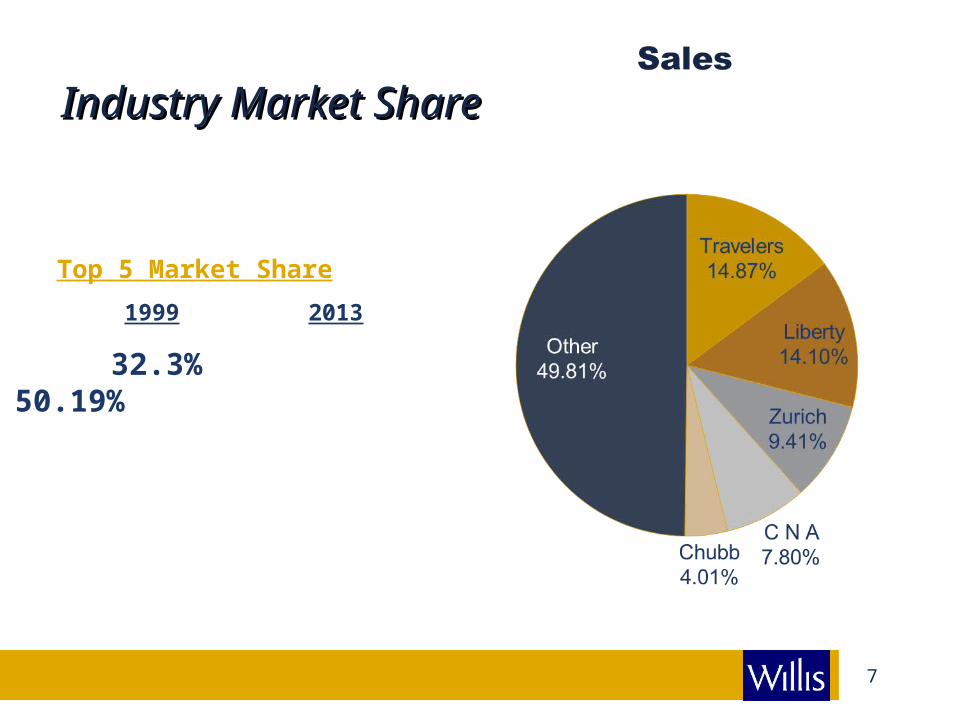
Top 5 Market Share
1999 2013
32.3% 50.19%
Industry Market ShareIndustry Market Share
8
Underwriting FocusUnderwriting Focus
• Underwriters are challenged with balancing increased risk environment with holding on to clients
• Contractor’s debt levels
• Increased interest in cash flow, profitability and overhead flexibility
• Vigilance on credit risks
• Verification and understanding of project funding – Financing terms
• Subcontractors – prequalification practices, payment controls, performance security closely inspected
• Increased interest in contractual terms, specifically, schedule, payment terms and damages clauses – Liquidated, consequential, etc.
• Bond Forms
• Warranties – type and duration
9
Rate Environment Rate Environment
• Rate levels continue to be stable – Pressure for rate reductions
• Pricing based on credit modeling• Driven by target return on capital rates
• Middle market contractors may enjoy lower rates than larger firms
• International pricing based on local country conditions – bank pricing, type of obligation and contract terms & conditions
10
Tomorrow…Tomorrow…
• Surety is still the most economical form of capital support for the construction industry.
• Surety losses, historically, are lagging indicator. While loss severity has not yet been a major factor, loss frequency is increasing.
• Ample surety capacity is available. For contractors with aggregate work programs of $500 million+, underwriting terms and pricing have been stable. Alternatives are growing.
• International surety is growing. Reverse-Flow business within the US expected to grow from acquisition activity and a trend to PPP opportunities.
• Leading US sureties now global, with significant premiums outside US, which will improve premium growth and profit picture.
• Growing use of surety in place of bank guarantees. Pay on demand facilities for international work (e.g. Australia, South Africa, Brazil, Peru, Columbia, Venezuela, etc.).
11
Tomorrow…Tomorrow…
• Contractors with work programs of $50 million to $500 million are more vulnerable to current pressures on margin. Sureties are cautious that loss activity will develop further in this sector.
• Increased interest in joint ventures by contractors seeking risk-sharing and access to capacity for larger work.
• Continued focus, by sureties, on subcontractor selection and risk management practices, contract terms & conditions, bond forms and credit risk management.
• Actions by rating agencies, the failure of sureties to meet internal capital return hurdles and the possibility of industry consolidation are among the uncertainties that might disrupt a contractor’s surety capacity with little or no warning.
12
How Sureties View Your Balance SheetHow Sureties View Your Balance Sheet
• Tangible Liquidity
o Casho Accounts Receivable
Retainage Related Parties
o Investmentso Cost in Excess of Billings – “Underbillings”o Prepaid Expenseso Cash Value of Life Insuranceo Future Cash
13
How Sureties View Your Balance SheetHow Sureties View Your Balance Sheet
• Tangible Equity
o Accounts Receivableo Profits / Completed vs. Uncompleted o Notes Receivable and Payableo Cost in Excess of Billings – “Underbillings”o Billings in Excess of Cost – “Overbillings”
Deferred Income vs. Job Borrowo Goodwill and Intangibles
14
Work-in-ProgressWork-in-ProgressA Surety’s FocusA Surety’s Focus
• Unbilled Backlog
• Cost in Excess of Billings – “Underbillings”
• Billings in Excess of Cost – “Overbillings”
• Net Cash Remaining
• Pure Job Borrow
• Gross Profit Margin Remaining
• Completed vs. Uncompleted Margin Trends
15
Work-in-ProgressWork-in-ProgressA Surety’s FocusA Surety’s FocusNet Cash Remaining
Measures future cash flow available from a contractor’s unbilled backlog, based on the currently estimated cost-to-complete of all projects.
Formula:
(Total Contract Value) – (Total Billed to Date) – (Total Est. Cost to Complete) = Net Cash Remaining
Pure Job Borrow Is the sum of all negative “Net Cash Remaining” balances that exist on
individual projects. Pure Job Borrow represents the amount of cash that must go back into a given project at or prior to completion – at the project’s currently estimated cost-to-complete.
16
Surety Game PlanSurety Game Plan• Business Plan:o Budgeto Revenue – Overhead – Profit – Overhead… OVERHEAD!o Continuityo Acquisitions territorial or niche expansiono Capital Expenditures (CapEx)o Future Expansion/Goals
• Surety Needs to Support Business Plan o Increased single or aggregate needo New territories, type of work, etc.
• Large Potential Projects• Safety Program• Job Watch List
17
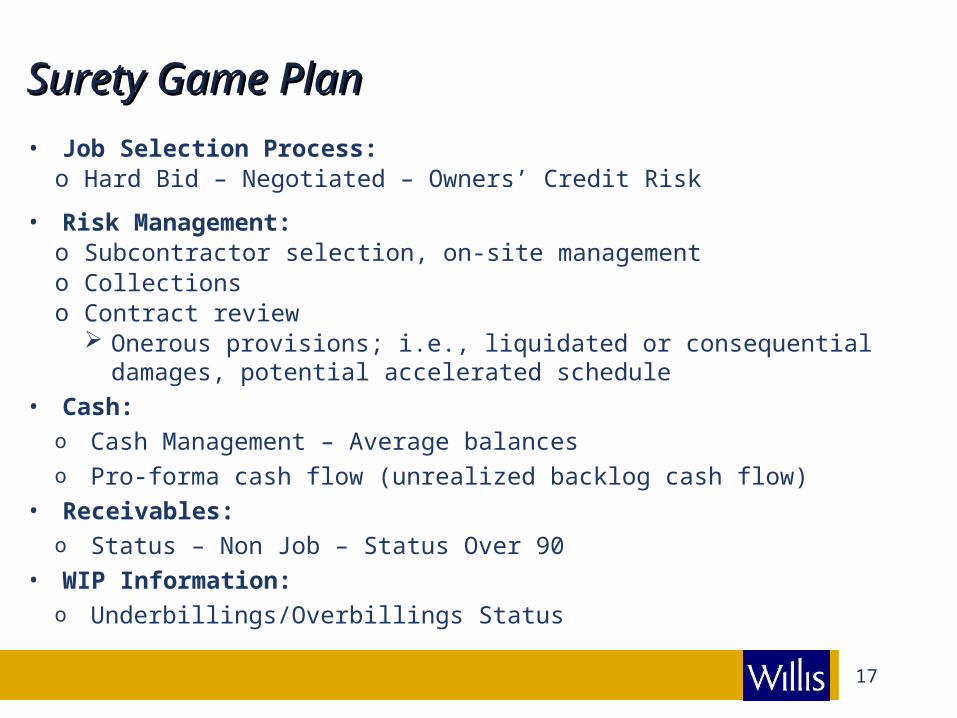
Surety Game PlanSurety Game Plan
• Job Selection Process:o Hard Bid – Negotiated – Owners’ Credit Risk
• Risk Management:o Subcontractor selection, on-site managemento Collectionso Contract review
Onerous provisions; i.e., liquidated or consequential damages, potential accelerated schedule
• Cash:o Cash Management – Average balanceso Pro-forma cash flow (unrealized backlog cash flow)
• Receivables:o Status – Non Job – Status Over 90
• WIP Information:o Underbillings/Overbillings Status
18
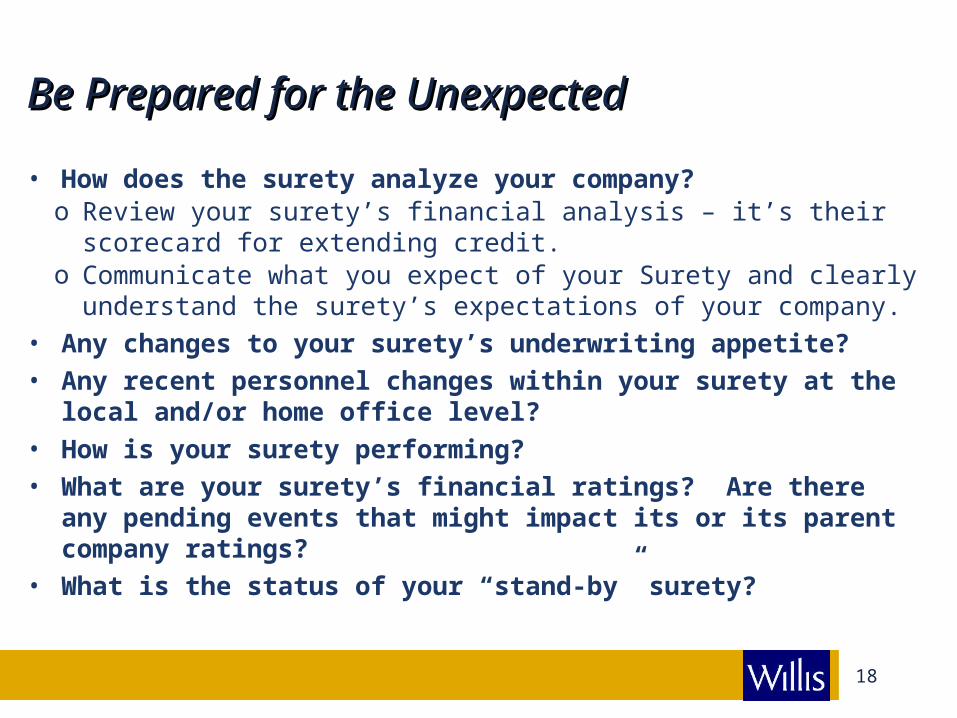
Be Prepared for the UnexpectedBe Prepared for the Unexpected
• How does the surety analyze your company?o Review your surety’s financial analysis – it’s their scorecard for
extending credit.o Communicate what you expect of your Surety and clearly understand
the surety’s expectations of your company. • Any changes to your surety’s underwriting appetite?• Any recent personnel changes within your surety at the local
and/or home office level?• How is your surety performing?• What are your surety’s financial ratings? Are there any pending
events that might impact its or its parent company ratings?• What is the status of your “stand-by” surety?
19
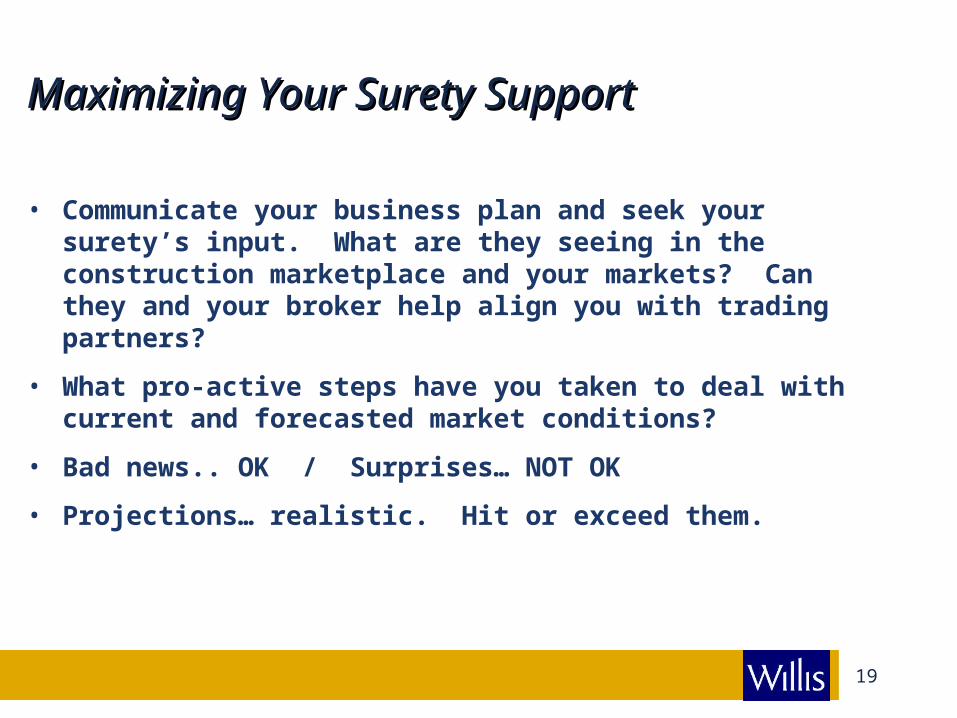
Maximizing Your Surety SupportMaximizing Your Surety Support
• Communicate your business plan and seek your surety’s input. What are they seeing in the construction marketplace and your markets? Can they and your broker help align you with trading partners?
• What pro-active steps have you taken to deal with current and forecasted market conditions?
• Bad news.. OK / Surprises… NOT OK
• Projections… realistic. Hit or exceed them.

20
Thank you…