Embed Size (px)
Citation preview

2001-11-19 IEEE C802.16.2a-01/13
0
Project IEEE 802.16 Broadband Wireless Access Working Group <http://ieee802.org/16>
Title Propagation in the frequency range 2-11 GHz
DateSubmitted
2001-11-15
Source(s) G. Jack GarrisonHarris Corporation#409-1230 Quayside Drive NewWestminsterB.C. Canada V3M 6H1
Voice: +1 604 524 6980Fax: +1 604 524 6980mailto:[email protected]
Re: Analysis of propagation and fading mechanisms in systems operating in the frequency range 2-11 GHz.
Abstract This paper provides an analysis of the important propagation and fading mechanisms forsystems operating in 2.5 GHz, 3.5 GHz and 10.5 GHz bands. It identifies the dominant fadingmechanism in each type of system and provides examples of link budget calculations.
Purpose To assist in the decision process for TG2 system parameters used in coexistence analysis and toprovide source material for TG3 system designeres.
NoticeThis document has been prepared to assist IEEE 802.16. It is offered as a basis for discussion and is not bindingon the contributing individual(s) or organization(s). The material in this document is subject to change in formand content after further study. The contributor(s) reserve(s) the right to add, amend or withdraw materialcontained herein.
ReleaseThe contributor grants a free, irrevocable license to the IEEE to incorporate material contained in thiscontribution, and any modifications thereof, in the creation of an IEEE Standards publication; to copyright in theIEEE’s name any IEEE Standards publication even though it may include portions of this contribution; and at theIEEE’s sole discretion to permit others to reproduce in whole or in part the resulting IEEE Standards publication.The contributor also acknowledges and accepts that this contribution may be made public by IEEE 802.16.
PatentPolicy andProcedures
The contributor is familiar with the IEEE 802.16 Patent Policy and Procedures (Version 1.0)<http://ieee802.org/16/ipr/patents/policy.html>, including the statement “IEEE standards may include the knownuse of patent(s), including patent applications, if there is technical justification in the opinion of the standards-developing committee and provided the IEEE receives assurance from the patent holder that it will licenseapplicants under reasonable terms and conditions for the purpose of implementing the standard.”
Early disclosure to the Working Group of patent information that might be relevant to the standard is essential toreduce the possibility for delays in the development process and increase the likelihood that the draft publicationwill be approved for publication. Please notify the Chair <mailto:[email protected] > as early as possible, inwritten or electronic form, of any patents (granted or under application) that may cover technology that is underconsideration by or has been approved by IEEE 802.16. The Chair will disclose this notification via the IEEE802.16 web site <http://ieee802.org/16/ipr/patents/notices>.

2001-11-19 IEEE C802.16.2a-01/13
1
Propagation in the frequency range 2-11 GHz.
Some Notes on Sub-11 GHzTransmission Link Considerations
Objectives
• Identify Constraints on Channel Models to Ensurethat TG3 Link Availability Objectives areAchieved (99.9/99.99 %)
• Establish Link Margin Limits so that CoexistenceC/I Objectives can be Defined
2001-11-19 IEEE C802.16.2a-01/13
2
Rician Fading(Tutorial Review)

2001-11-19 IEEE C802.16.2a-01/13
3
Example 1
Reflections from a Spherical Earth
• Analytical Method
• Geometry and Antenna Patterns
• Terrain Type and Reflection Coefficient
• Terrain Roughness to Compute Specular and Diffuse Reflections

2001-11-19 IEEE C802.16.2a-01/13
4

2001-11-19 IEEE C802.16.2a-01/13
5
Primary Signal P
Specular Reflection S
Glistening Surface Diffuse Reflections D
Rice (power ratio)KP S
D jj
j= +
=∑( )
( )max
2
1
2

2001-11-19 IEEE C802.16.2a-01/13
6

2001-11-19 IEEE C802.16.2a-01/13
7

2001-11-19 IEEE C802.16.2a-01/13
8

2001-11-19 IEEE C802.16.2a-01/13
9

2001-11-19 IEEE C802.16.2a-01/13
10

2001-11-19 IEEE C802.16.2a-01/13
11
Example 2
Shooting Through the Urban Canopy
• TG3 Method
• Measurement Data
• Empirical Equation
where
K F F F K d us h b= 0γ
F
F h h
F b b
d
K
u
s
h rx rx
b
=
=−
==
seasonal factor, 1 in summer and 2.5 in winter
= , receive antenna height factor, in meters
= , antenna beamwidth factor, in degrees
distance in km
=
dB, 1 km intercept
zero - mean lognormal variate, 8 dB standard deviation over the cell area
.46
-0.62
/
/
.
3
17
0 5
100
b gb g
γ

2001-11-19 IEEE C802.16.2a-01/13
12
Attenuated Primary Signal P'
Diffuse Reflections D
Rice (power ratio)KP S
D jj
j= +
=∑( )
( )
' '
max
2
1
2
Attenuated Specular Reflection S'

2001-11-19 IEEE C802.16.2a-01/13
13

2001-11-19 IEEE C802.16.2a-01/13
14

2001-11-19 IEEE C802.16.2a-01/13
15
2001-11-19 IEEE C802.16.2a-01/13
16
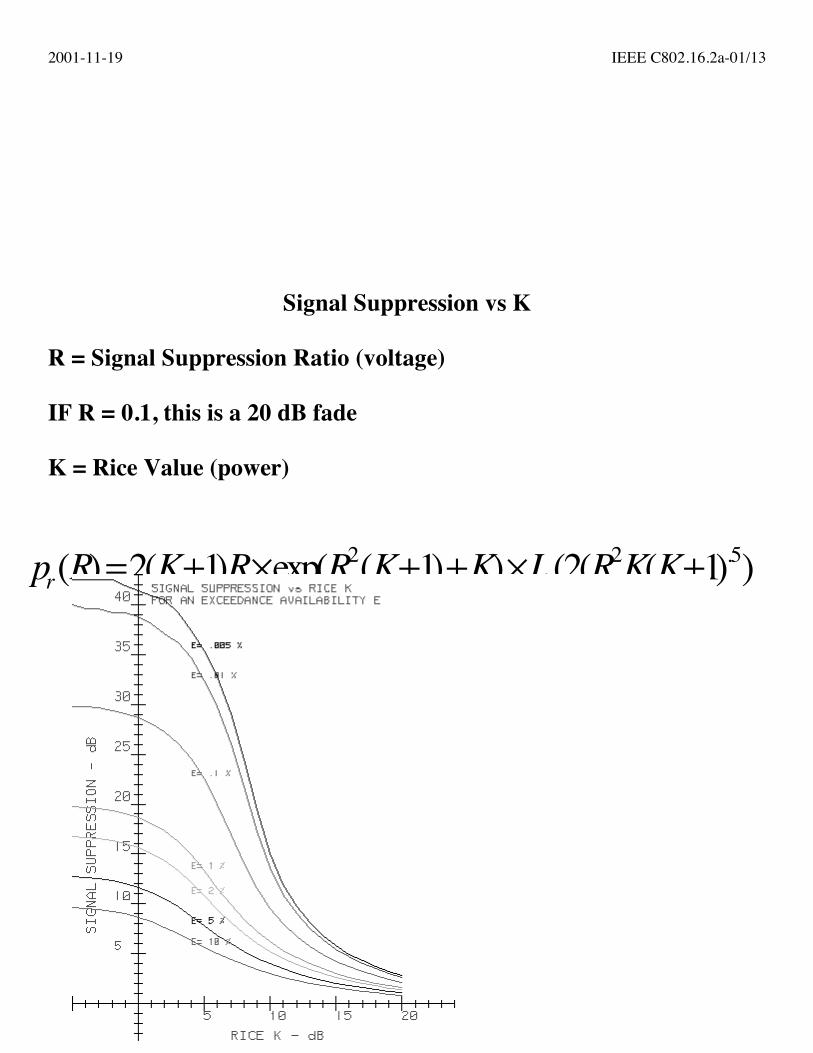
Signal Suppression vs K
R = Signal Suppression Ratio (voltage)
IF R = 0.1, this is a 20 dB fade
K = Rice Value (power)
p R K R R K K I R K Kr( ) ( ) exp( ( ) ) ( ( ( ) ).= + × + + × +2 1 1 2 120
2 5

2001-11-19 IEEE C802.16.2a-01/13
17
K (dB) 0 3 5 8 10 12 15 18 20 % Outage18 16.2 13.3 8.4 6.2 4.6 3 2 1.6 1
19.1 16.7 13.7 8.6 6.3 4.7 3.1 2.1 1.6 0.919.6 17.2 14.1 8.9 6.5 4.8 3.1 2.1 1.6 0.820.2 17.8 14.6 9.2 6.7 4.9 3.2 2.2 1.7 0.720.9 18.4 15.2 9.5 6.9 5.1 3.3 2.2 1.7 0.621.7 19.2 15.9 9.9 7.1 5.2 3.4 2.3 1.8 0.522.7 20.1 16.8 10.4 7.5 5.4 3.5 2.4 1.8 0.423.9 21.4 18 11.1 7.9 5.7 3.7 2.5 1.9 0.325.7 23.1 19.7 12.1 8.5 6.1 3.9 2.6 2 0.228.6 26.1 22.6 14 9.5 6.7 4.3 2.8 2.1 0.129.1 26.6 23 14.3 9.7 6.8 4.3 2.8 2.2 0.0929.6 27 23.5 14.6 9.9 7 4.4 2.9 2.2 0.0830.2 27.6 24.1 15 10.1 7.1 4.4 2.9 2.2 0.0730.9 28.3 24.7 15.5 10.3 7.2 4.5 3 2.3 0.0631.7 29.1 25.5 16.1 10.6 7.4 4.6 3 2.3 0.0532.6 30 26.5 16.8 11 7.6 4.7 3.1 2.4 0.04
34 31.4 27.7 17.7 11.5 7.9 4.9 3.2 2.4 0.0335.7 33.2 29.5 19.1 12.2 8.3 5.1 3.3 2.5 0.0238.8 36.2 32.9 21.7 13.6 9 5.4 3.5 2.6 0.0139.2 36.5 33 22.2 13.8 9.1 5.5 3.5 2.7 0.00939.6 37.1 33.4 22.6 14 9.2 5.5 3.6 2.7 0.008
40 37.7 34 23.1 14.3 9.4 5.6 3.6 2.7 0.00740.9 38.4 34.7 23.7 14.7 9.6 5.7 3.6 2.8 0.00641.4 39.2 35.4 24.4 15 9.7 5.8 3.7 2.8 0.00542.5 40 36.5 25.4 15.6 10 5.9 3.8 2.8 0.00443.7 41.4 37.7 26.6 16.2 10.3 6 3.8 2.9 0.00345.2 43.1 39.6 28.3 17.3 10.8 6.2 3.9 3 0.002
48 46 42.5 31.2 19.2 11.6 6.6 4.1 3.1 0.00152 49.1 45.2 34.2 21.4 12.5 7 4.3 3.3 0.0005
56.5 56.5 52 41.4 27.3 14.7 7.8 4.8 3.6 0.0001

2001-11-19 IEEE C802.16.2a-01/13
18
Conclusions
• TG3 systems cannot operate at a Rice K=0 dB and still achieveacceptable availability objectives.
• NLOS TG3 systems face a number of attenuation and fadingmechanisms that are interrelated and require careful examinationreferenced to desired availability objectives.
• To maintain Rice K at acceptable values, TG3 criteria for linkdistance, excess link loss, antenna beam width, minimum antennaelevation and urban canopy type needs to be reviewed.
• A Rice K=0 dB is not equivalent to Rayleigh.

2001-11-19 IEEE C802.16.2a-01/13
19
Atmospheric Multipath

2001-11-19 IEEE C802.16.2a-01/13
20
Consideration Rationale
• Not Currently Included in TG3 Channel Models
• Fade Unavailability Not Insignificant for Long Paths
• Needs to be Included in Link Budgets

2001-11-19 IEEE C802.16.2a-01/13
21
Fading Mechanism
• A Result of Multiple Refractive Paths in the Atmosphere
• Most Severe if the Atmosphere is not "Well Mixed" (Summer)
• Impacted by Terrain Type
• Excludes Ground Reflections
• Rayleigh Fade Distribution
• Empirical Outage Equations (decades of measurements)

2001-11-19 IEEE C802.16.2a-01/13
22
Fade Model
• Modified Two - Ray Model
• Two Components:
Flat Fade Component
Dispersive Frequency Selective Component
• Various Estimation Models
- KQ Factor
- KQ plus Terrain S
- ITU Rec. P-530
- Vigants Barnett

2001-11-19 IEEE C802.16.2a-01/13
23
Vigants Barnett Method
• Computes the Probability of a Rayleigh Fade pr(Ray)
• Outage = pr(Ray) times Rayleigh Fade Prob to Margin FM
• Includes Terrain Factor C where C equals:
C=0.25 - good propagation conditions (mountains/dry climates)
C=1 - average propagation conditions (avr. terrain/climate)
C=4 - difficult propagation conditions (over water/gulf coast)
• Alternative Definition for C:
C = Cf(S/15.2)-1.3
where
Cf = 0.25, 1, 4 and S = terrain roughness in m

2001-11-19 IEEE C802.16.2a-01/13
24
Unavailability Equation
• Valid for FM> 15 dB
The effective fade margin is composed of the flat fade margin and thedispersive fade margin.
• Flat fade margin = thermal plus interference.
P C f d
f GHz
d km
FM
FM= × × × × ×
==
=
− −6 0 10 107 3 10. /
w here
frequency in
path length in
effective fade m argin in dB

2001-11-19 IEEE C802.16.2a-01/13
25
• Dispersive fade margin = selective fade depth causing an outage.This is a measured equipment parameter for the average outagelevel of a selective frequency notch moved across the channelpassband.
Flat Fade Example

2001-11-19 IEEE C802.16.2a-01/13
26
Conclusions
• Atmospheric Multipath is not Negligible on Long Paths.

2001-11-19 IEEE C802.16.2a-01/13
27
• The impact on availability is directly related to the fade marginavailable to withstand a Rayleigh fade.
• Even for paths of 10 km or less, atmospheric multipath is finite andwill reduce the margin available for other excess loss, interferenceor fade mechanisms.

2001-11-19 IEEE C802.16.2a-01/13
28
TG3 Link Budget Examples(16-QAM)
PARAMETER NAME V-POL H-POL
UNITS
Location
New York
Frequency f0 3.5 GHzPath Length r0 7 km

2001-11-19 IEEE C802.16.2a-01/13
29
CCIR .01% Rain Rate rr01ccir 42 mm/hrRiceFactor
Kr 20 dB
TX Pwr/Cxr (clear sky) ptx 35.00 35.00 dBmPower Control pcr 0.00 0.00 dBTX Transmission Line Loss 0.00 0.00 dBTX Branching Network Loss -3.00 -3.00 dBTX Antenna Gain gbase 14.50 14.50 dBiEIRP (clear sky) 46.50 46.50 dBmEIRP(rain)
46.50 46.50 dbm
FSL to Distance R0 -120.18 -120.18 dBExcess Loss to edge of coverage Rmax 0.00 0.00 dBAtmospheric Absorption aabsorb -0.05 -0.05 dBFoliage Loss 0.00 0.00 dBStructure Loss 0.00 0.00 dBRx Antenna Gain gsub 18.00 18.00 dBiRX RF Losses -3.00 -3.00 dBRX Signal Level (clear sky) -58.73 -58.73 dBmRX Noise Level n0 -101.52 -101.52 dBmC/N (clear sky) cnrcsv/h 42.79 42.79 dB
Required C/(N+I) for BER=E-6 cnir_E6 18.00 18.00 dB
C/I ( HPA Intermod -clear sky) hpaim 100.00 100.00 dBC/I (adj-channel) ciadjcs 100.00 100.00 dBC/I (co-channel) cicocs 100.00 100.00 dBC/I Total citotalcsv/
h95.23 95.23 dB
C/(N+I) (clear sky) cnircsv/h 42.79 42.79 dB Allowed C/N at Threshold cnthreshv/h 18.00 18.00 dBFade Margin (clear sky) margincsv/h 24.79 24.79 dB
C/I ( HPA Intermod -rain) hpaim 100.00 100.00 dBC/I(adj-channel) plus Rain XPD ciadjr 100.00 100.00 dBC/I(co-channel plus Rain XPD) cicor 100.00 dBC/I Total citotalv/h 96.99 96.99 dBC/(N+I) (rain) cnirrv/h 42.79 42.79 dBAllowed C/N at Threshold cnthreshrv/h 18.00 18.00 dBFade Margin (rain) marginrainv/h 24.79 24.79 dB
Annual Availability (clear sky)-2 Way availcsv_a_ 99.99979 99.99979 %Annual Availability (rain) availrv/h_a 99.99999 99.99999 %Annual Availability (Rice)-2 Way avail_rice 100.00000 100.00000 %Total Annual Availability 99.99978 99.99978 %Outage 0.01893 0.01893 hrs
F1. 3.5 GHz link budget without impairments
2001-11-19 IEEE C802.16.2a-01/13
30
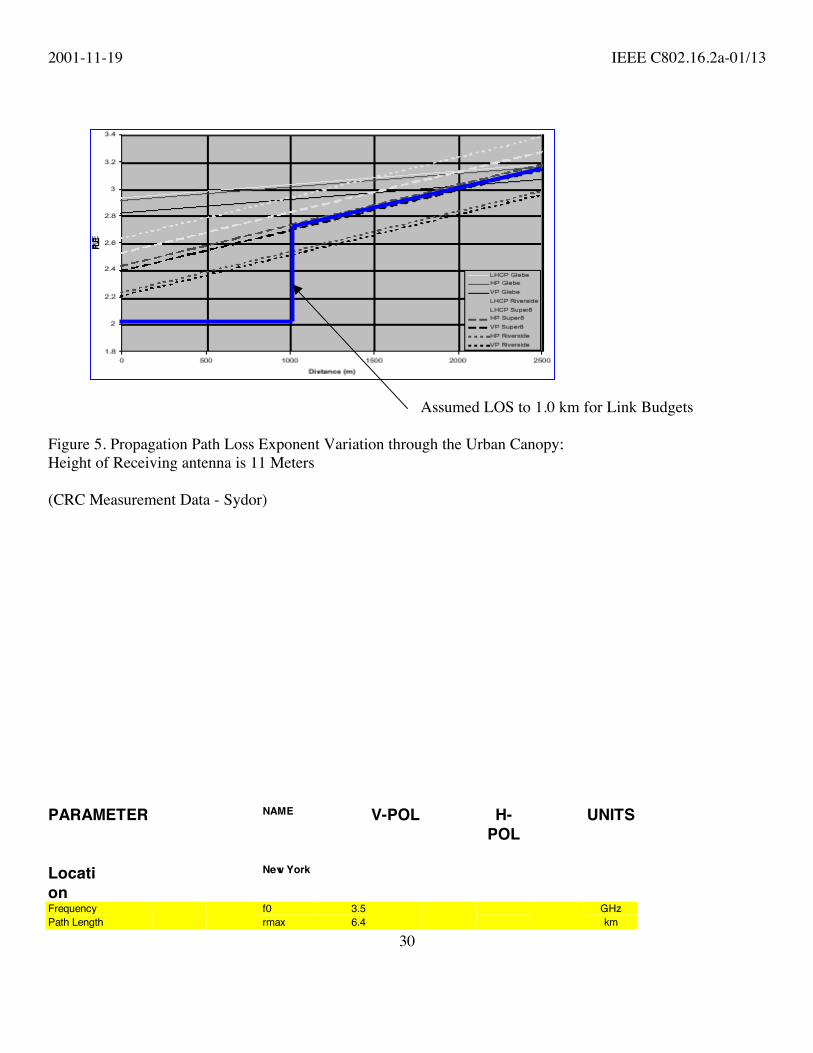
Assumed LOS to 1.0 km for Link Budgets
Figure 5. Propagation Path Loss Exponent Variation through the Urban Canopy;Height of Receiving antenna is 11 Meters
(CRC Measurement Data - Sydor)
PARAMETER NAME V-POL H-POL
UNITS
Location
New York
Frequency f0 3.5 GHzPath Length rmax 6.4 km
2001-11-19 IEEE C802.16.2a-01/13
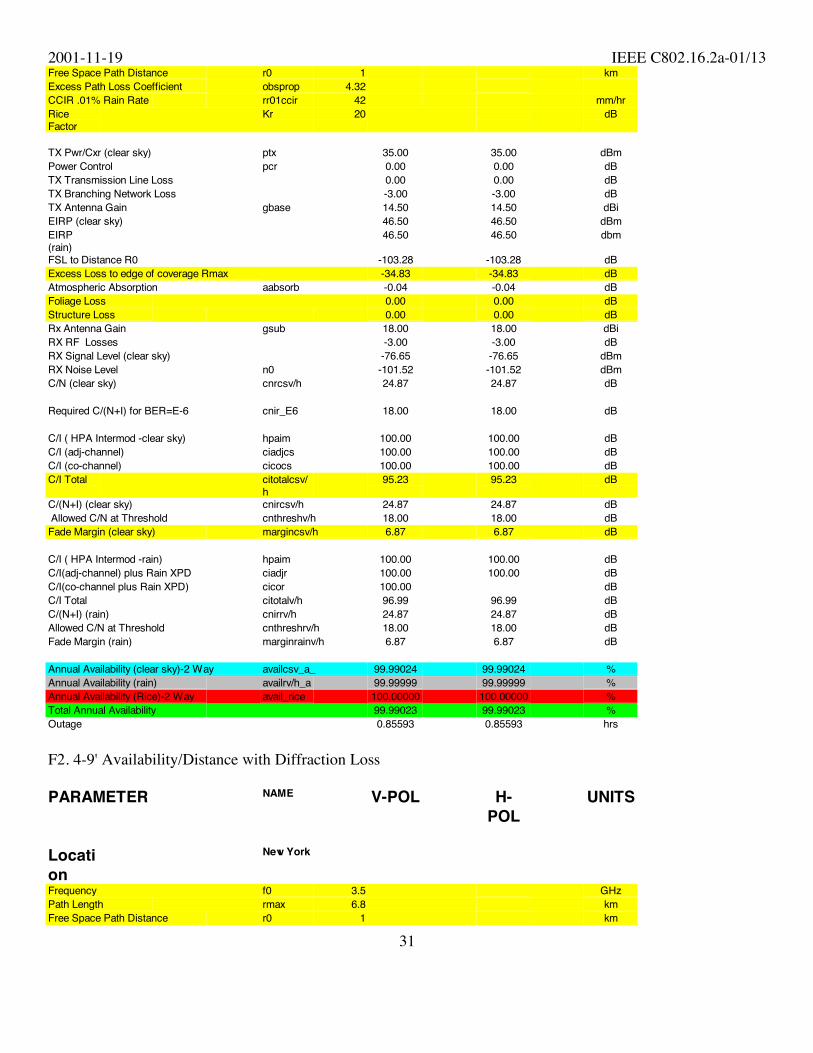
31
Free Space Path Distance r0 1 kmExcess Path Loss Coefficient obsprop 4.32CCIR .01% Rain Rate rr01ccir 42 mm/hrRiceFactor
Kr 20 dB
TX Pwr/Cxr (clear sky) ptx 35.00 35.00 dBmPower Control pcr 0.00 0.00 dBTX Transmission Line Loss 0.00 0.00 dBTX Branching Network Loss -3.00 -3.00 dBTX Antenna Gain gbase 14.50 14.50 dBiEIRP (clear sky) 46.50 46.50 dBmEIRP(rain)
46.50 46.50 dbm
FSL to Distance R0 -103.28 -103.28 dBExcess Loss to edge of coverage Rmax -34.83 -34.83 dBAtmospheric Absorption aabsorb -0.04 -0.04 dBFoliage Loss 0.00 0.00 dBStructure Loss 0.00 0.00 dBRx Antenna Gain gsub 18.00 18.00 dBiRX RF Losses -3.00 -3.00 dBRX Signal Level (clear sky) -76.65 -76.65 dBmRX Noise Level n0 -101.52 -101.52 dBmC/N (clear sky) cnrcsv/h 24.87 24.87 dB
Required C/(N+I) for BER=E-6 cnir_E6 18.00 18.00 dB
C/I ( HPA Intermod -clear sky) hpaim 100.00 100.00 dBC/I (adj-channel) ciadjcs 100.00 100.00 dBC/I (co-channel) cicocs 100.00 100.00 dBC/I Total citotalcsv/
h95.23 95.23 dB
C/(N+I) (clear sky) cnircsv/h 24.87 24.87 dB Allowed C/N at Threshold cnthreshv/h 18.00 18.00 dBFade Margin (clear sky) margincsv/h 6.87 6.87 dB
C/I ( HPA Intermod -rain) hpaim 100.00 100.00 dBC/I(adj-channel) plus Rain XPD ciadjr 100.00 100.00 dBC/I(co-channel plus Rain XPD) cicor 100.00 dBC/I Total citotalv/h 96.99 96.99 dBC/(N+I) (rain) cnirrv/h 24.87 24.87 dBAllowed C/N at Threshold cnthreshrv/h 18.00 18.00 dBFade Margin (rain) marginrainv/h 6.87 6.87 dB
Annual Availability (clear sky)-2 Way availcsv_a_ 99.99024 99.99024 %Annual Availability (rain) availrv/h_a 99.99999 99.99999 %Annual Availability (Rice)-2 Way avail_rice 100.00000 100.00000 %Total Annual Availability 99.99023 99.99023 %Outage 0.85593 0.85593 hrs
F2. 4-9' Availability/Distance with Diffraction Loss
PARAMETER NAME V-POL H-POL
UNITS
Location
New York
Frequency f0 3.5 GHzPath Length rmax 6.8 kmFree Space Path Distance r0 1 km

2001-11-19 IEEE C802.16.2a-01/13
32
Excess Path Loss Coefficient obsprop 4.44CCIR .01% Rain Rate rr01ccir 42 mm/hrRiceFactor
Kr 15 dB
TX Pwr/Cxr (clear sky) ptx 35.00 35.00 dBmPower Control pcr 0.00 0.00 dBTX Transmission Line Loss 0.00 0.00 dBTX Branching Network Loss -3.00 -3.00 dBTX Antenna Gain gbase 14.50 14.50 dBiEIRP (clear sky) 46.50 46.50 dBmEIRP(rain)
46.50 46.50 dbm
FSL to Distance R0 -103.28 -103.28 dBExcess Loss to edge of coverage Rmax -36.96 -36.96 dBAtmospheric Absorption aabsorb -0.05 -0.05 dBFoliage Loss 0.00 0.00 dBStructure Loss 0.00 0.00 dBRx Antenna Gain gsub 18.00 18.00 dBiRX RF Losses -3.00 -3.00 dBRX Signal Level (clear sky) -78.79 -78.79 dBmRX Noise Level n0 -101.52 -101.52 dBmC/N (clear sky) cnrcsv/h 22.73 22.73 dB
Required C/(N+I) for BER=E-6 cnir_E6 18.00 18.00 dB
C/I ( HPA Intermod -clear sky) hpaim 100.00 100.00 dBC/I (adj-channel) ciadjcs 100.00 100.00 dBC/I (co-channel) cicocs 100.00 100.00 dBC/I Total citotalcsv/
h95.23 95.23 dB
C/(N+I) (clear sky) cnircsv/h 22.73 22.73 dB Allowed C/N at Threshold cnthreshv/h 18.00 18.00 dBFade Margin (clear sky) margincsv/h 4.73 4.73 dB
C/I ( HPA Intermod -rain) hpaim 100.00 100.00 dBC/I(adj-channel) plus Rain XPD ciadjr 100.00 100.00 dBC/I(co-channel plus Rain XPD) cicor 100.00 dBC/I Total citotalv/h 96.99 96.99 dBC/(N+I) (rain) cnirrv/h 22.73 22.73 dBAllowed C/N at Threshold cnthreshrv/h 18.00 18.00 dBFade Margin (rain) marginrainv/h 4.73 4.73 dB
Annual Availability (clear sky)-2 Way availcsv_a_ 99.98084 99.98084 %Annual Availability (rain) availrv/h_a 99.99999 99.99999 %Annual Availability (Rice)-2 Way avail_rice 99.92000 99.92000 %Total Annual Availability 99.90083 99.90083 %Outage 8.68728 8.68728 hrs
F3. Example Link Budget for 3-9's Availability/Distance
PARAMETER NAME V-POL H-POL
UNITS
Location
New York
Frequency f0 3.5 GHzPath Length rmax 1 kmFree Space Path Distance r0 1 kmExcess Path Loss Coefficient obsprop 2.7

2001-11-19 IEEE C802.16.2a-01/13
33
CCIR .01% Rain Rate rr01ccir 42 mm/hrRiceFactor
Kr 0 dB
TX Pwr/Cxr (clear sky) ptx 35.00 35.00 dBmPower Control pcr 0.00 0.00 dBTX Transmission Line Loss 0.00 0.00 dBTX Branching Network Loss -3.00 -3.00 dBTX Antenna Gain gbase 14.50 14.50 dBiEIRP (clear sky) 46.50 46.50 dBmEIRP(rain)
46.50 46.50 dbm
FSL to Distance R0 -103.28 -103.28 dBExcess Loss to edge of coverage Rmax 0.00 0.00 dBAtmospheric Absorption aabsorb -0.01 -0.01 dBFoliage Loss 0.00 0.00 dBStructure Loss 0.00 0.00 dBRx Antenna Gain gsub 18.00 18.00 dBiRX RF Losses -3.00 -3.00 dBRX Signal Level (clear sky) -41.79 -41.79 dBmRX Noise Level n0 -101.52 -101.52 dBmC/N (clear sky) cnrcsv/h 59.73 59.73 dB
Required C/(N+I) for BER=E-6 cnir_E6 18.00 18.00 dB
C/I ( HPA Intermod -clear sky) hpaim 100.00 100.00 dBC/I (adj-channel) ciadjcs 100.00 100.00 dBC/I (co-channel) cicocs 100.00 100.00 dBC/I Total citotalcsv/
h95.23 95.23 dB
C/(N+I) (clear sky) cnircsv/h 59.73 59.73 dB Allowed C/N at Threshold cnthreshv/h 18.00 18.00 dBFade Margin (clear sky) margincsv/h 41.73 41.73 dB
C/I ( HPA Intermod -rain) hpaim 100.00 100.00 dBC/I(adj-channel) plus Rain XPD ciadjr 100.00 100.00 dBC/I(co-channel plus Rain XPD) cicor 100.00 dBC/I Total citotalv/h 96.99 96.99 dBC/(N+I) (rain) cnirrv/h 59.73 59.73 dBAllowed C/N at Threshold cnthreshrv/h 18.00 18.00 dBFade Margin (rain) marginrainv/h 41.73 41.73 dB
Annual Availability (clear sky)-2 Way availcsv_a_ 100.00000 100.00000 %Annual Availability (rain) availrv/h_a 99.99999 99.99999 %Annual Availability (Rice)-2 Way avail_rice 99.99000 99.99000 %Total Annual Availability 99.98999 99.98999 %Outage 0.87688 0.87688 hrs
F4. What can we do if K= 0 dB for 4-9's Availability. Try 0.1 km!
Availability Distance Rice K TX Pwr FadeMargin
ControllingImpairment
3-9's 7 km 6 dB +50 dBm(100 watts)
19 dB Rician Fading

2001-11-19 IEEE C802.16.2a-01/13
34
4-9's 7 km 9 dB +50 dBm(100 watts)
19 dB Rician Fading
4-9's 22 km 20 dB +44 dBm(25 watts)
24 dB AtmosphericMultipath
Conclusions
• Significant Constraints on the Values for Rice K
• Beating it to Death with Power is not a Valid Mitigation Technique
• Long Paths are Controlled by Atmospheric Multipath. DiffractionLoss and any Significant Rician Fading cannot be Tolerated
Cell Area Space/Time Availability
• TG3 Objectives: 90% of Cell Area to Exceed 99.9% Availability
F0 = 3.5 GHz

2001-11-19 IEEE C802.16.2a-01/13
35
Rmax = 7 km
Availability = 99.9 %
Rice K:
- Erceg Equation for log-normal distribution of K
- Mean = 0 dB
- Sigma = 8 dB
----------------------------------------
Simulation Methodology:
- Set up cell in 10 annular rings, each corresponding to 10% of area
- Compute allowed value of Ka vs distance r (link budget for 99.9%)
- Compute expected value of Ke at a random distance within eachannular ring (30,000 random deviates based on Erceg)
- Compare Ke with Ka and compute probability that 99.9% objectivewill not be met
2001-11-19 IEEE C802.16.2a-01/13
36
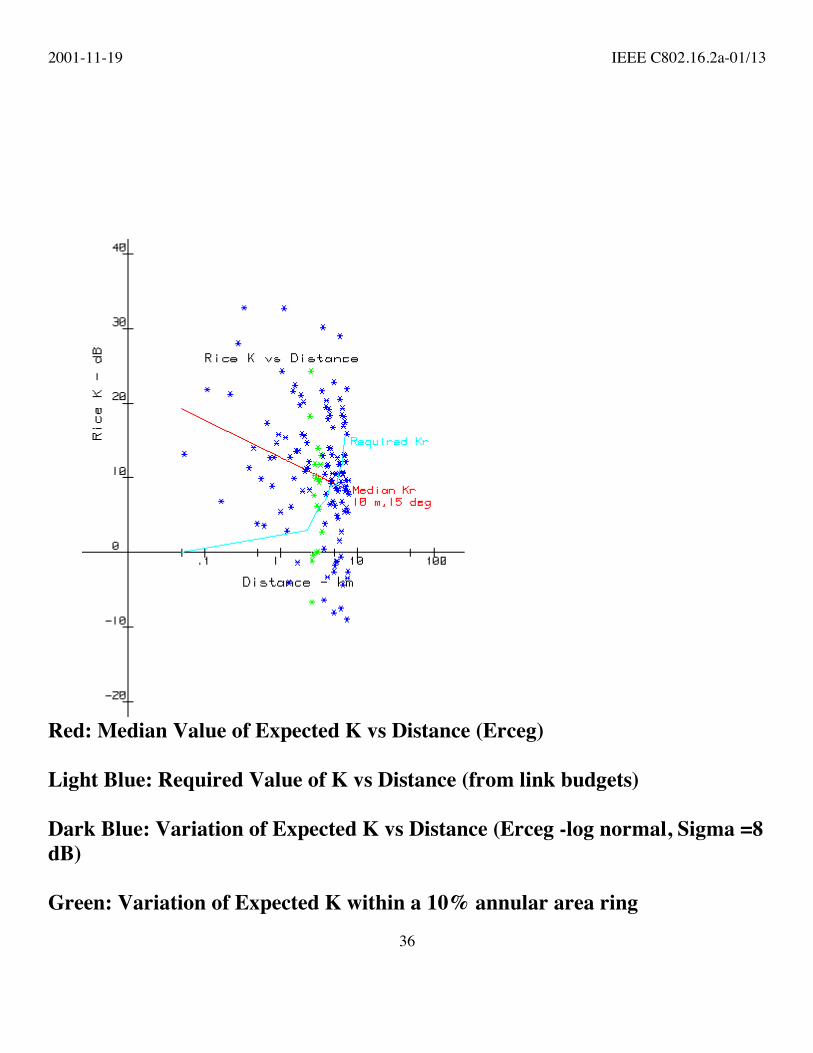
Red: Median Value of Expected K vs Distance (Erceg)
Light Blue: Required Value of K vs Distance (from link budgets)
Dark Blue: Variation of Expected K vs Distance (Erceg -log normal, Sigma =8dB)
Green: Variation of Expected K within a 10% annular area ring

2001-11-19 IEEE C802.16.2a-01/13
37
% Cell Area Distancer - km
Allowed Rice K-dB to
AvailabilityLimit
Median Rice Kto Distance r
Excess KRelative to
Median
Prob that K isLess than
Allowed WithinAnnular Ring
- %
.1 2.2 3 11 8 8-9
.2 3.1 6 10 4 14-15.5
.3 3.8 7 10 3 21-22.5
.4 4.4 9 10 1 27-28
.5 5 9 9 0 31-32.5
.6 5.5 9 9 0 31.5-32
.7 5.9 11 9 -2 35-37
.8 6.3 12 9 -3 43-46
.9 6.6 14 9 -5 50-521.0 7 16 8 -8 60-62

2001-11-19 IEEE C802.16.2a-01/13
38
Conclusions
• TG3 Space/Time Availability Objectives are not Achievable in thePresence of any Significant Rician Fading
• TG2a Systems Model Should Assume a Link Design that Allows forOnly Diffraction Loss and a Very Modest Amount of FoliagePenetration. This is the only Systems Model that will Allow forInter-System C/I

2001-11-19 IEEE C802.16.2a-01/13
39
Minimal Frequency Re-Use Plan
• Cannot Repeat Frequency Assignments Within aCell due to Limits of Antenna F/B Ratio (25 dB).This Would Not Support 64-QAM Transmission.
• Care Required in Assignment of Adjacent SectorAssignments due to XPD Reduction if ShootingThrough Trees
• Likely Require 4 Frequencies/2-Polarizations forFDD

2001-11-19 IEEE C802.16.2a-01/13
40
1 1
1
1
1
11
11
A DB C
A' D'B' C'
1
1
1 1
1
1
1
1
1 1 1
1
1
1
1
1
V-POL
H-POL

2001-11-19 IEEE C802.16.2a-01/13
41
Subscriber Path Length and VerticalElevation Angle Distributions

2001-11-19 IEEE C802.16.2a-01/13
42
• Randomly Uniform vs Distance
• Area Proportional
• Rayleigh Rooftops
• Compiled US Statistics (38 GHz)
-Major Impact on Coexistence Due to VerticalAntenna Pattern Discrimination - Need to Select aDistribution for Simulation Studies

2001-11-19 IEEE C802.16.2a-01/13
43

2001-11-19 IEEE C802.16.2a-01/13
44
Distribution of Elevation Anglesfor FS Subscribers in the 37.5-40 GHz Band
0
0.2
0.4
0.6
0.8
1
0 5 10 15 20 25 30 35 40 45 50 55 60
Elevation Angle (deg)
Prob
abili
ty D
ensi
ty

2001-11-19 IEEE C802.16.2a-01/13
45
0.0%
10.0%
20.0%
30.0%
40.0%
50.0%
60.0%
70.0%
< 0.05 < 0.1 < 0.25 < 0.5 < 0.75 < 1.0
Link Length (km)
Per
cent
age
of L
inks
FIGURE 5
38 GHz link length distribution statistics in the United Statesfor subscriber-based HDFS networks

2001-11-19 IEEE C802.16.2a-01/13
46
0
10
20
30
40
50
60
70
80
90
100
<10 10 - 25 25 - 45 >45
Elevation Angle (deg)
Per
cent
age
of L
inks
Cumulative distribution
Distribution of 38-GHzHDFS
FIGURE 6
38 GHz HDFS elevation angle distribution in the United States

2001-11-19 IEEE C802.16.2a-01/13
47
12TH
AV
E12
TH A
VE
12TH
AV
E12
TH A
VE
12TH
AV
E12
TH A
VE
12TH
AV
E12
TH A
VE
12TH
AV
E
Rose 9/1015-02
0 0.35
Miles
0.7
FIGURE 2 4
Deployment pattern in an urban area in the Unted States of America

2001-11-19 IEEE C802.16.2a-01/13
48
���������������������������
�����
� ��� �
�����
�
�� �
�
������
�����
�� �������
����
�� ����!"
$
���� $����
�(� )������ ����(� )������ ����(� )������ ����(� )������ ����(� )������ ����(� )������ ����(� )������ ����(� )������ ����(� )������ ���
*+ ��������*+ ��������*+ ��������*+ ��������*+ ��������*+ ��������*+ ��������*+ ��������*+ ��������
+, -������#��� -���� ��+, -������#��� -���� ��+, -������#��� -���� ��+, -������#��� -���� ��+, -������#��� -���� ��+, -������#��� -���� ��+, -������#��� -���� ��+, -������#��� -���� ��+, -������#��� -���� ��
�,�, ���������,�, ���������,�, ���������,�, ���������,�, ���������,�, ���������,�, ���������,�, ���������,�, ��������
��,, ����� �. ��� ����������,, ����� �. ��� ����������,, ����� �. ��� ����������,, ����� �. ��� ����������,, ����� �. ��� ����������,, ����� �. ��� ����������,, ����� �. ��� ����������,, ����� �. ��� ����������,, ����� �. ��� ��������
�// ��� ����// ��� ����// ��� ����// ��� ����// ��� ����// ��� ����// ��� ����// ��� ����// ��� ���
,, ����� ��,, ����� ��,, ����� ��,, ����� ��,, ����� ��,, ����� ��,, ����� ��,, ����� ��,, ����� ��
��� &�� ���01 ������ &�� ���01 ������ &�� ���01 ������ &�� ���01 ������ &�� ���01 ������ &�� ���01 ������ &�� ���01 ������ &�� ���01 ������ &�� ���01 ���
*� ����� �. ��� ��������*� ����� �. ��� ��������*� ����� �. ��� ��������*� ����� �. ��� ��������*� ����� �. ��� ��������*� ����� �. ��� ��������*� ����� �. ��� ��������*� ����� �. ��� ��������*� ����� �. ��� ��������
+�+ *�� ���+�+ *�� ���+�+ *�� ���+�+ *�� ���+�+ *�� ���+�+ *�� ���+�+ *�� ���+�+ *�� ���+�+ *�� ���
2*% )������ ���2*% )������ ���2*% )������ ���2*% )������ ���2*% )������ ���2*% )������ ���2*% )������ ���2*% )������ ���2*% )������ ���
�%, %�� ����%, %�� ����%, %�� ����%, %�� ����%, %�� ����%, %�� ����%, %�� ����%, %�� ����%, %�� ���
(&, *�� ���(&, *�� ���(&, *�� ���(&, *�� ���(&, *�� ���(&, *�� ���(&, *�� ���(&, *�� ���(&, *�� ���
**, ����� ��**, ����� ��**, ����� ��**, ����� ��**, ����� ��**, ����� ��**, ����� ��**, ����� ��**, ����� ��
2++ %�� ���2++ %�� ���2++ %�� ���2++ %�� ���2++ %�� ���2++ %�� ���2++ %�� ���2++ %�� ���2++ %�� ���
�,% ��� ��� ��,% ��� ��� ��,% ��� ��� ��,% ��� ��� ��,% ��� ��� ��,% ��� ��� ��,% ��� ��� ��,% ��� ��� ��,% ��� ��� �
*2, ������� ���*2, ������� ���*2, ������� ���*2, ������� ���*2, ������� ���*2, ������� ���*2, ������� ���*2, ������� ���*2, ������� ���
&,* ��������&,* ��������&,* ��������&,* ��������&,* ��������&,* ��������&,* ��������&,* ��������&,* ��������
&/ ���� ��&/ ���� ��&/ ���� ��&/ ���� ��&/ ���� ��&/ ���� ��&/ ���� ��&/ ���� ��&/ ���� ��
�**/ ����� �. ��� ���������**/ ����� �. ��� ���������**/ ����� �. ��� ���������**/ ����� �. ��� ���������**/ ����� �. ��� ���������**/ ����� �. ��� ���������**/ ����� �. ��� ���������**/ ����� �. ��� ���������**/ ����� �. ��� ��������
(/ 3���� ��(/ 3���� ��(/ 3���� ��(/ 3���� ��(/ 3���� ��(/ 3���� ��(/ 3���� ��(/ 3���� ��(/ 3���� ��
�/�� ��� ����/�� ��� ����/�� ��� ����/�� ��� ����/�� ��� ����/�� ��� ����/�� ��� ����/�� ��� ����/�� ��� ���
������ 3�
4�� 3�
-�������� 3�
������ ��������
-5 ��������
���#���� 6��
FIGURE 4
Hub deployment in urban area, United States

2001-11-19 IEEE C802.16.2a-01/13
49


![Point – to – point Radiocommunication · • Fade Margin = [Flat Receive Level] – ... (XPD) in multipath or precipitation conditions; • Signal distortion due to frequency](https://img.pdfslide.net/doc/110x75/5b827c4c7f8b9a7b6f8eafd0/point-to-point-radiocommunication-fade-margin-flat-receive-level.jpg)