Embed Size (px)
Citation preview
GR-NC-O3
UNIVERSITY OF CALIFORNIA COOPERATIVE EXTENSION
2003
SAMPLE COSTSTO ESTABLISH A VINEYARD AND PRODUCE
WINE GRAPESCabernet Sauvignon
NORTH COAST REGION NAPA COUNTY
Edward A. Weber UC Cooperative Extension Farm Advisor, Napa CountyKaren M. Klonsky UC Cooperative Extension Specialist, Department of Agricultural and Resource
Economics, UC DavisRichard L. De Moura Staff Research Associate, Department of Agricultural and Resource Economics,
UC Davis

2003 Winegrape Cost and Return Study North Coast/Napa County UC Cooperative Extension 2
SAMPLE COST TO ESTABLISH A VINEYARD AND PRODUCE WINE GRAPESCabernet Sauvignon
NORTH COAST REGION – Napa County
CONTENTS
INTRODUCTION................................................................................................................................................2ASSUMPTIONS...................................................................................................................................................3 Establishment Cultural Practices and Material Inputs.........................................................................................3 Production Cultural Practices and Material Inputs..............................................................................................6 Cash Overhead.....................................................................................................................................................9 Non-Cash Overhead...........................................................................................................................................10REFERENCES.....................................................................................................................................................12Table 1. SAMPLE COSTS PER ACRE TO ESTABLISH A VINEYARD.......................................................13Table 2. COSTS PER ACRE TO PRODUCE WINE GRAPES........................................................................15Table 3. COSTS AND RETURNS PER ACRE TO PRODUCE WINE GRAPES...........................................16Table 4. MONTHLY CASH COSTS – WINE GRAPES..................................................................................17Table 5. RANGING ANALYSIS – INCOME AND YIELD............................................................................18Table 6. WHOLE FARM EQUIPMENT, INVESTMENT, AND BUSINESS OVERHEAD COSTS............19Table 7. HOURLY EQUIPMENT COSTS........................................................................................................20Table 8. OPERATIONS WITH EQUIPMENT.................................................................................................21
Acknowledgment. Appreciation is expressed to the Napa Valley Grape Growers Association andNapa County Farm Bureau members who provided time and input for this study. Thank you to the staff at theNapa Valley Grape Growers Association, Sandy Elles and Jennifer Kopp, for coordinating the data collectionand providing facilities for the meetings.
INTRODUCTION
Sample costs to establish a vineyard and produce wine grapes under drip irrigation in the North CoastRegion, Napa County are presented in this study. This study is intended as a guide only, and can be used tomake production decisions, determine potential returns, prepare budgets and evaluate production loans.Practices described are based on production practices considered typical for the crop and area, but these samepractices will not apply to every situation. The sample costs for labor, materials, equipment and customservices are based on current figures. A blank column, “Your Costs”, in Tables 2 and 3 is provided for enteringyour farming costs.
The hypothetical farm operation, production practices, overhead, and calculations are described underthe assumptions. For additional information or an explanation of the calculations used in the study call theDepartment of Agricultural and Resource Economics, University of California, Davis, (530) 752-3589 or yourlocal UC Cooperative Extension office.
Sample Cost of Production Studies for many commodities are available and can be requested through theDepartment of Agricultural and Resource Economics, UC Davis. Current studies can be downloaded from thedepartment website at http://coststudies.ucdavis.edu or obtained from selected county UC CooperativeExtension offices.

2003 Winegrape Cost and Return Study North Coast/Napa County UC Cooperative Extension 3
.
ASSUMPTIONS
The assumptions refer to Tables 1 to 8 and pertain to sample costs to establish a vineyard and producewine grapes in the North Coast – Napa County or Napa Valley Appellation. Within the Napa ValleyAppellation are 13 subappellations. For district location and other related information see the websiteswww.napavintners.com and www.napagrowers.org. The cultural practices shown represent operations andmaterials considered typical in a well-managed vineyard in the region. The costs, materials, and practices shownin this study will not be applicable to all situations. Establishment and cultural practices vary by grower andthe differences can be significant. The trade names and cultural practices shown in this report do not constitutean endorsement or recommendation by the University of California nor is any criticism implied by omission ofsimilar products or practices.
Farm. The hypothetical farm, located on land with a 10% slope, is owned and operated by the grower.The 35 contiguous acre farm consists of 30 acres on which wine grapes are being replanted, and five acresoccupied by roads, irrigation systems, fencing, and farmstead. Management companies farm approximately40% of the farms in the area (NVGGA). In this study we incorporated information from both farmer andmanagement company operations to present a farm managed by the owner. Management companies will chargea fee for their services, but farms operated by management companies will not have an equipment inventory asshown in Table 6.
Establishment Operating CostsThe following practices refer to table 1.
Environmental Preparation. The Napa County Conservation, Development, and PlanningDepartment administers regulations for planting and replanting vineyard sites that have a 5% or greater slope.Environmental regulations and costs will differ depending upon whether the vineyard is on the valley floor or ona slope including the degree of slope. The 10% slope in this study is designated as Level II or Track II. Prior toany site development, a permit must be obtained which ranges from $800 to $1,000. An Erosion Control Plan isrequired and for this study is estimated to cost $7,500. No additional drainage is required for this site, but somesites may require subdrains with costs ranging from $5,000 to $10,000 per acre.
Vineyard Conversion and Site Preparation. The new vineyard is being planted on land that had anexisting vineyard. The old grapevines are removed, stacked and burned. Rock removal may be required on somenew plantings, but is not accounted for in this study. A company is hired to collect, crush and remove the oldsteel trellis components. A hand crew cleans and hauls miscellaneous debris left in the field using the grower’stractor and trailer. The field is ripped four to five feet deep in three passes - line of planting, crossways,diagonally. The field is again hand cleaned using the grower’s tractor and trailer to remove debris pulled up fromthe ripping. A custom operator then disks the land in two directions and landplanes the site. Landplaning isassumed to be necessary on the site. Soil amendments (lime or gypsum and compost) are applied. A commercialcompany is hired to layout the field, mark/stake vine sites and irrigation lines. In the row middles, a cover crop(Bell bean, oat, vetch mix) is planted. The trellis system endposts and stakes are installed. All operations thatprepare the vineyard for planting are done in the fall, beginning in the year prior to planting, but costs are shownin the first year.
2003 Winegrape Cost and Return Study North Coast/Napa County UC Cooperative Extension 4
Vines. Field-grown dormant benchgraft vines, Cabernet Sauvignon variety, are planted on a 7 X 4-footspacing at 1,555 vines per acre. Vines will be trained to a bilateral cordon and spur pruned. Cordons are thehorizontal branches, and spurs are the bearing units on the cordon. The grapevines are assumed to begin yieldingfruit in three years and to produce for an additional 22 years.
Planting. Planting in this study occurs in mid-April and is done by hand. Holes are dug and thedormant vines are planted to the appropriate depth. The hole is filled with soil, and the vine is covered with aprotective mound of soil. In June the plants are unmounded and an open topped carton is placed over the vine.In the following year an average of 2% or 13 vines per acre will be replanted.
Trellis System. The trellis is a vertical shoot positioning system (VSP). The system in this studyutilizes 3-inch X 8-foot notched steel line posts spaced 16-feet apart (every 4th vine), with three training stakes(1/4-inch round tensile rod X 4-feet) at the vine locations in between. End posts are 3-7/8 inch X 10-foot steeltube (well casing) with a spade. No additional anchors are required. Seven permanent wires are secured to theend posts – 14-gauge fruit wire and 14 gauge drip wire, 2 pairs of 13 gauge canopy wires and a single canopywire at the top. The system is considered as part of the vineyard since it will be removed when the vines areremoved. Therefore it is included in the establishment cost. The trellis system is installed during the first 2years as follows:
First Year. In the fall of the year prior to planting, end-posts and stakes are laid out by the grower andinstalled by a trellis company. The grower lays out the stakes and end-posts, using a tractor and trailer. Haulingthe posts takes 2 men and 1 tractor driver approximately 0.83 hours per acre but uses a total of 2.5 man-hoursper acre. The drip wire is installed after planting.
Second Year. Two pairs of canopy wires, a single canopy wire at the top and the fruit wire are installed
Drip System (Irrigation). Mainlines are laid out in the fall prior to trellis installation. After plantingthe drip line is attached to the drip wire on the trellis system and emitters are punched. Drip system labor isincluded in the total drip system costs. The system is considered part of the vineyard since it will be removedwhen the vines are removed; therefore it is included in the establishment costs.
Training/Pruning. Training and pruning establish the vine framework and these techniques will varywith variety and trellis system. In this study training includes pruning, tying, suckering, shoot positioning andthinning. The prunings are placed in between the vine rows and are chopped during the first discing.
First Year. The vines are allowed to grow freely the first year with no attempt at training. A good rootsystem should develop this year to support vine training in the second year.
Second Year. In February the vines are pruned back to two buds. In June, the vines are suckered toone shoot. Vines are trained by tying one shoot to the post to become the main trunk. Later in the season thisshoot is topped at or slightly below the cordon wire. Two lateral shoots are selected from the trunk as thebilateral cordons. Any remaining lower laterals are removed. In July and August, two passes are made to topthe vines, remove extra shoots (suckering) and tie the canes loosely on the wire.

2003 Winegrape Cost and Return Study North Coast/Napa County UC Cooperative Extension 5
Third Year. In February, cordons are pruned back to the appropriate length as determined by girth.These canes are then tied trimly to the fruiting wire. Training vines in the third year includes extending thecordons along the permanent cordon wire and selecting spur positions. Suckering is done in May; shootpositioning in June and July. Crop thinning is done in June to remove about 50% of the crop from theseyoung vines. Slower growing vines continue to be trained; however, year three is the last year that the vinesare trained in this study. After the vines are trained, canopy management begins and includes suckering trunksand cordons, shoot positioning, and thinning.
Irrigation. Water is from wells and does not have a cost. Pumping costs from grower input rangedfrom $30 to $50 per acre. An average of $40 per acre is used in this study. During the first and second year,irrigation is from late May to late September/early October, a total of 20 weeks, (2 irrigations per week at 2gallons per vine per irrigation). In this study 4.58 acre-inches are applied and water is calculated to cost $8.73per acre-inch. No assumption is made about effective rainfall. In the third year five gallons per week (5.73 acreinches) at one irrigation per week is applied over a 20-week period. Water cost based on a pumping cost of $40per acre equals $6.98 per acre-inch. Labor is calculated at .03 hours per acre per irrigation.
Frost Protection. A propane powered wind machine is installed in the summer of the second year forprotection of the lower ten acres. The machine begins operation in the third year. It is assumed that the windmachine will run 50 hours per season.
Pest Management. The pesticides and rates mentioned in this cost study as well as other materials arelisted in UC Integrated Pest Management Guidelines, Grapes, available at www.ipm.ucdavis.edu. Pesticidesmentioned in the study are commonly used, but are not recommendations.
Insects. Leafhoppers are the most common insect pest in the North Coast. In Napa County,populations are usually below treatment thresholds. In this study, we assume that no insecticides are needed.
Diseases. Many pathogens attack grapevines, but the major disease assumed in this study is powderymildew (Uncinula necator). Powdery mildew control begins in September of the second year with Flintfungicide applied by the grower. In the third year, wettable sulfur is applied in mid-April and mid-May, dustingsulfur once in May and twice in June, and Flint in July. All are applied by ground with the grower’s equipment.A fungicide application may be made to pruning wounds in February for control of Eutypa, but is not includedas a cost in this study.
Weeds. In late January/early February of the first year, prior to planting, Roundup is applied to the vinerow (24-inch band) with an ATV and sprayer. In March the middles are mowed and in early May disked. InJuly or August, hand hoeing is done around the vines. In the second year, Roundup is applied as a strip sprayin February prior to pruning: the middles (cover crop) are mowed in March, disked in May and October. In thethird year, Roundup is applied as a strip spray with the ATV and sprayer in February, and the middles aremowed in March and May.

2003 Winegrape Cost and Return Study North Coast/Napa County UC Cooperative Extension 6
Cover Crop. After land preparation in the fall of the year prior to planting, an annual cover crop isplanted in the vine middles, mowed in March of the following year, and then disked in May. In the fall of thefirst year, an annual cover crop (bell bean, oat, vetch) is planted and disked in May of the second year. InOctober of the second year a permanent cover crop is planted and allowed to reseed thereafter in the spring.
Fertilization. Beginning in the first year, an NPK fertilizer, 8-8-8, is applied in equal amounts throughthe drip line in June, July, and September. A total of five gallons or 51 pounds of material per acre is applied. In the third year, the fertilizer is applied in May and in September after harvest.
Erosion Control. Farms located on a slope must implement an erosion control plan. In this study thegrower uses silt fencing and straw around the field perimeter. The erosion control cost is a typical value overyears as suggested by participating growers. The cost includes the reusable silt fencing, additional straw ifnecessary and labor for winter maintenance and checking the system, especially during rainfall periods.
Harvesting. Harvesting starts in the third year. In this study the crop is hand harvested. Laborcontractors charge $250 per ton for young vineyards. See Harvest in production section for operationexplanations.
Yield. Average yields in the third year are assumed to be one ton per acre.
Production Cultural Practices and Material InputsRefers to tables 2 - 8
Pruning. Pruning is done during the winter months, February in this study. The prunings are placed inthe vine centers and chopped during the first mowing. Winter tying, where cordons are tied to the cordon wirewith twine at the trunk and at each end of the cordons is done in March. Pruning costs in this study are basedon an hourly rate, although much of the pruning in the region may be done by piecework.
Canopy Management. Canopy management begins with trunk and cordon suckering in April. Asecond suckering pass in May also includes shoot thinning and positioning. Passes in June and July are madefor leaf removal, lateral removal, and wire lifting. Crop thinning and vine/cane trimming are done in separatepasses in July. Shoot removal is the operation whereby weak shoots, which lack vigor and do not originate fromthe fruiting spur buds, are removed. In early June after fruit set, some basal leaves are removed in and aroundthe fruit zone to allow for exposure and better air movement. Positioning and thinning shoots allows vinesspace to develop good fruit clusters, and opens the canopy to allow greater air movement through the vines andaround the clusters. Canopy management varies among growers.
Irrigation. Water is from wells and does not have a cost. Pumping costs from grower input rangedfrom $30 to $50 per acre. In this study 5.73 acre-inches are applied and water is calculated to cost $6.98 peracre-inch based on the $40 grower average for pumping cost. Once per week over 20 weeks, water at fivegallons per vine is applied from late May to September/early October. Irrigation labor is calculated at 0.10hours per acre per irrigation. No assumption is made about effective rainfall.

2003 Winegrape Cost and Return Study North Coast/Napa County UC Cooperative Extension 7
Frost Protection. It is assumed in this study, that the wind machine will run 50 hours per season.The machine provides frost protection for the lower 10 acres.
Fertilization. An NPK fertilizer, 8-8-8, at 51 pounds per acre is applied through the irrigation systemequally in May and in September after harvest.
Pest Management. The pesticides and rates mentioned in this cost study are listed in UC IntegratedPest Management Guidelines, Grapes. Pesticides mentioned in the study are not recommendations, butthose commonly used in the region. For information on other pesticides available, pest identification,monitoring, and management visit the UC IPM website at www.ipm.ucdavis.edu. For additional informationand pesticide use permits, contact the local county Agricultural Commissioner's office.
Pest Control Adviser. Written recommendations are required for many pesticides commercially appliedand are made by licensed pest control advisors (PCA’s). In addition the PCA will monitor the field for pestsand nutrition. Growers may hire private PCA’s or receive the service as part of a service agreement with anagricultural chemical and fertilizer company. Management companies may have their own PCA.
Insects. Leafhoppers are the most common insect pest in the North Coast. In Napa County,populations are usually below treatment thresholds. In this study, we assume that no insecticides are needed.
Diseases. Powdery mildew treatments begin in mid-April with two wettable sulfur applications duringApril and one application in May. Sulfur dust is applied three times in May and three times in June. Anapplication of Flint is made in July. All applications are made with the grower’s equipment. Wettable sulfurand Flint are applied to every row and sulfur dust at full rate to alternate rows.
Weeds. In this vineyard, vine row weeds are controlled with Roundup applied as a strip spray (28.6%of the acreage) in February and again in July. A permanent cover crop is planted in the row middles and isdescribed under cover crop.
Cover Crop. In October of the second year a permanent cover crop is planted and allowed to reseed inthe spring. The crop is mowed once in March and again in May after seed formation. The cover crop is drieddown by late spring/early summer.
Erosion Control. Farms located on a slope must implement an erosion control plan. In this study thegrower uses silt fencing and straw around the field perimeter. The erosion control cost is a typical value overyears as suggested by participating growers. The cost includes the reusable silt fencing, additional straw ifnecessary and labor for winter maintenance and checking the system, especially during rainfall periods.
Harvest. The crop is hand picked by a labor contractor. In normal producing vineyards (4-5 tons),contractors may charge $120 to $150 per ton. Charges may be lower or higher due to yield, trellis system, andground terrain. To determine number of pickers for harvest, an industry assumption is one-ton per day perpicker, assuming an eight-hour day. Bin handling includes use of the grower owned tractor and three bin trailerswith one-half ton bins, two tractors rented and a forklift rented each for two-weeks. The grapes are handpicked

2003 Winegrape Cost and Return Study North Coast/Napa County UC Cooperative Extension 8
into the bins, loaded on the grower owned flatbed truck and delivered to the winery. The truck holds 16 binsand takes one hour per roundtrip delivery.
Yields. Yield maturity is reached in the fifth or sixth year. An assumed yield of 5 tons per acre is usedto calculate returns in the production years. Typical yield range for Cabernet Sauvignon in Napa County is 3.5to 6.5 tons per acre.
Returns. A price of a $3,638 per ton for Cabernet Sauvignon wine grapes is used in this study. Theprice is an average of the 1999 to 2002 weighted average grower returns as reported in Table 6 each year in theFinal Grape Crush Report. Net returns at different yields and prices are shown in Table 5.
Assessments. The Napa Grape Growers Association, a voluntary organization, charges membershipdues of $10 per net acre planted, bearing and non-bearing, with a minimum annual fee of $150 per member peryear and a maximum annual fee of $1,800. The organization’s purpose is to “uphold the reputation of thisvalley as one of the premium winegrape growing regions in the world.” The assessment is not included as a costin this study. Other assessments not included are for Pierce’s Diseases and glass-winged sharpshooter controlprograms in which growers are assessed $2 per $1,000 crop returns by the state, and approximately(assessment varies each year) $4 per acre by the county, and a Napa County farmworker housing assessment of$8 per acre.
Pickup/ATV. The grower uses the pickup for business and personal use. The assumed business use forthe pickup is 4,500 miles per year for the ranch. In addition to spot spraying for weed control, the All TerrainVehicle (ATV) is used on the ranch for checking the vineyard and irrigating.
Labor. Labor rates of $18.23 per hour for machine operators and $13.50 for general labor includespayroll overhead of 35%. The basic hourly wages are $13.50 for machine operators and $10.00 for general labor.The overhead includes the employers’ share of federal and California state payroll taxes, workers' compensationinsurance for vineyards (code 0040), and a percentage for other possible benefits. Workers’ compensationinsurance costs will vary among growers, but for this study the cost is based upon the average industry final rateas of January 1, 2003 (California Department of Insurance). Labor for operations involving machinery are 20%higher than the operation time given in Table 1 and 4 to account for the extra labor involved in equipment set up,moving, maintenance, work breaks, and field repair.
Equipment Operating Costs. Repair costs are based on purchase price, annual hours of use, totalhours of life, and repair coefficients formulated by American Society of Agricultural Engineers (ASAE). Fueland lubrication costs are also determined by ASAE equations based on maximum Power Take Off (PTO)horsepower, and fuel type. Prices for on-farm delivery of diesel and gasoline are $1.11 and $1.58 per gallon,respectively. The cost includes a 2.25% sales tax (effective September 2001) on diesel fuel and 7.25% sales taxon gasoline. Gasoline also includes federal and state excise tax, which can be refunded for on-farm use whenfiling your income tax. The fuel, lube, and repair cost per acre for each operation in Table 2 is determined bymultiplying the total hourly operating cost in Table 7 for each piece of equipment used for the selectedoperation by the hours per acre. Tractor time is 10% higher than implement time for a given operation toaccount for setup, travel and down time.
2003 Winegrape Cost and Return Study North Coast/Napa County UC Cooperative Extension 9
Interest On Operating Capital. Interest on operating capital is based on cash operating costs and iscalculated monthly until harvest at a nominal rate of 7.14% per year. A nominal interest rate is the typicalmarket cost of borrowed funds. The interest cost of post harvest operations is discounted back to the lastharvest month using a negative interest charge.
Risk. The risks associated with crop production should not be minimized. While this study makesevery effort to model a production system based on typical, real world practices, it cannot fully representfinancial, agronomic and market risks, which affect profitability and economic viability. Growers may purchaseFederal crop insurance to reduce the production risk associated with specific natural hazards. Insurance policiesvary and range from a basic catastrophic loss policy to one that insures losses for up to 75% of a crop.Insurance costs will depend on the type and level of coverage.
Cash Overhead
Cash overhead consists of various cash expenses paid out during the year that are assigned to the wholefarm and not to a particular operation. These costs include property taxes, interest on operating capital, officeexpense, liability and property insurance, sanitation services, equipment repairs, and management.
Property Taxes. Counties charge a base property tax rate of 1% on the assessed value of the property.In some counties special assessment districts exist and charge additional taxes on property including equipment,buildings, and improvements. For this study, county taxes are calculated as 1% of the average value of theproperty. Average value equals new cost plus salvage value divided by 2 on a per acre basis.
Insurance. Insurance for farm investments varies depending on the assets included and the amount ofcoverage. Property insurance provides coverage for property loss and is charged at 0.676% of the average valueof the assets over their useful life. Liability insurance covers accidents on the farm and costs $516 for the entirefarm.
Sanitation Services. Sanitation services provide portable toilets for the vineyard and cost the farm$1,090 annually. The cost includes one double toilet unit with washbasins, delivery and pickup, and fivemonths of weekly servicing. Costs also include soap or other suitable cleansing agent, and single use towels.Separate potable water and single-use drinking cups are also supplied. Contract labor providers may includethis service for their work force and therefore sanitation fees would not be a direct cost to the grower.
Management/Supervisor Wages. Salary is not included. Returns above costs are considered a returnto management
Office Expense. Office and business expenses are estimated at $300 per acre. These expenses includeoffice supplies, telephones, bookkeeping, accounting, legal fees, shop and office utilities, and miscellaneousadministrative charges.
Investment Repairs. Annual repairs on investments or capital recovery items that require maintenanceare calculated as 2% of the purchase price. Repairs are not calculated for land and establishment costs.

2003 Winegrape Cost and Return Study North Coast/Napa County UC Cooperative Extension 10
Non-Cash Overhead
Non-cash overhead is calculated as the capital recovery cost for equipment and other farm investments.
Capital Recovery Costs. Capital recovery cost is the annual depreciation and interest costs for acapital investment. It is the amount of money required each year to recover the difference between the purchaseprice and salvage value (unrecovered capital). It is equivalent to the annual payment on a loan for theinvestment with the down payment equal to the discounted salvage value. This is a more complex method ofcalculating ownership costs than straight-line depreciation and opportunity costs, but more accuratelyrepresents the annual costs of ownership because it takes the time value of money into account (Boehlje andEidman). The formula for the calculation of the annual capital recovery costs is ((Purchase Price – SalvageValue) x Capital Recovery Factor) + (Salvage Value x Interest Rate).
Salvage Value. Salvage value is an estimate of the remaining value of an investment at the end of itsuseful life. For farm machinery (tractors and implements) the remaining value is a percentage of the new cost ofthe investment (Boehlje and Eidman). The percent remaining value is calculated from equations developed bythe American Society of Agricultural Engineers (ASAE) based on equipment type and years of life. The life inyears is estimated by dividing the wear out life, as given by ASAE by the annual hours of use in this operation.For other investments including irrigation systems, buildings, and miscellaneous equipment, the value at the endof its useful life is zero. The salvage value for land is the purchase price because land does not depreciate. Thepurchase price and salvage value for equipment and investments are shown in Table 6.
Capital Recovery Factor. Capital recovery factor is the amortization factor or annual payment whosepresent value at compound interest is 1. The amortization factor is a table value that corresponds to the interestrate used and the life of the machine.
Interest Rate. The interest rate of 6.25% used to calculate capital recovery cost is the USDA-ERS’s ten-year average of California’s agricultural sector long-run rate of return to production assets from current income.It is used to reflect the long-term realized rate of return to these specialized resources that can only be usedeffectively in the agricultural sector. In other words, the next best alternative use for these resources is inanother agricultural enterprise.
Establishment Cost. Costs to establish the vineyard are used to determine capital recovery expenses,depreciation, and interest on investment for the production years. Establishment cost is the sum of the costs forland preparation, trellis system, drip system, planting, vines, cash overhead and production expenses forgrowing the vines through the first year that grapes are harvested minus any returns from production. The TotalAccumulated Net Cash Cost on Table 1, in the third year represents the establishment cost. For this study thecost is $26,579 per acre or $797,370 for the 30-acre vineyard. The establishment cost is spread over theremaining 22 years of the 25 years the vineyard is in production.
Irrigation System. The previous vineyard is assumed to have a well, pump, and filtration/injectorstation that are included in the land cost.

2003 Winegrape Cost and Return Study North Coast/Napa County UC Cooperative Extension 11
Land. Bare land available for vineyard establishment is valued at $120,000 per acre or $140,000 per netplantable (30) acre. Land planted with resistant rootstock vines is valued from $85,000 to $180,000.
Building. The building complex is 400 square foot metal building or buildings on a cement slab.
Tools . This includes shop tools, hand tools, and miscellaneous field tools such as pruning tools.
Equipment. Farm equipment is purchased new or used, but the study shows the current purchase pricefor new equipment. The new purchase price is adjusted to 60% to indicate a mix of new and used equipment.Annual ownership costs for equipment and other investments are in the Whole Farm Equipment, Investmentand Business Overhead Tables. Equipment costs are composed of three parts: non-cash overhead, cashoverhead, and operating costs. Both of the overhead factors have been discussed in previous sections. Theoperating costs consist of repairs, fuel, and lubrication and are discussed under operating costs.
Table Values. Due to rounding, the totals may be slightly different from the sum of the components.
The University of California does not discriminate in any of its policies, procedures or practices. The university is an affirmative action/equal opportunity employer.
University of California and the United States Department of Agriculture cooperating

2003 Winegrape Cost and Return Study North Coast/Napa County UC Cooperative Extension 12
REFERENCES
American Society of Farm Managers and Rural Appraisers. 2002. Trends in Agricultural Land & Lease Values.California Chapter of the American Society of Farm Managers and Rural Appraisers. Woodbridge, CA.
American Society of Agricultural Engineers. 1994. American Society of Agricultural Engineers StandardsYearbook. Russell H. Hahn and Evelyn E. Rosentreter (ed.) St. Joseph, MO. 41st edition.
Barker, Doug. April 22, 2003. California Workers’ Compensation Rating Data for Selected AgriculturalClassifications as of January 1, 2003. California Department of Insurance, Rate Regulation Branch.
Boehlje, Michael D., and Vernon R. Eidman. 1984. Farm Management. John Wiley and Sons. New York, NY.
California State Department of Food and Agriculture. 1998-2002. Final Grape Crush Report. CaliforniaDepartment of Food and Agriculture. Sacramento, CA. Internet accessed March 10, 2003http://www.nass.usda.gov/ca/bul/crush/
Smart, Richard and Mike Robinson. 1991. Sunlight into Wine. Winetitles. Adelaide, South Australia.
Statewide IPM Project. 2000. “UC Pest Management Guidelines, Grapes”. In M. L. Flint (ed.) UC IPM PestManagement Guidelines. Pub. 3339. IPM Education and Publication. University of California, Divisionof Agriculture and Natural Resources. Oakland, CA.
United States Department of Agriculture-Economic Reporting Service. Farm Financial Ratios IndicatingSolvency and Profitability 1960 – 02, California. 2002.www.ers.usda.gov/data/farmbalancesheet/fbsdmu.htm. Internet; accessed January 4, 2003.
Verdegaal, Paul S., Karen M. Klonsky. Richard L. De Moura, Sample Costs to Establish a Vineyard andProduce Wine Grapes. Lodi Appellation. 2001. University of California Cooperative Extension. Davis,CA.
Weaver, Robert J. 1976. Grape Growing. John Wiley and Sons. New York, NY.
-----------------------------------------------------------------
For information concerning the above or other University of California publications, contact UC DANR CommunicationsServices at 1-800-994-8849, online at www.ucop.edu, or your local county UC Cooperative Extension office.

2003 Winegrape Cost and Return Study North Coast/Napa County UC Cooperative Extension 13
UC COOPERATIVE EXTENSIONTable 1. SAMPLE COSTS PER ACRE TO ESTABLISH A VINEYARD
NORTH COAST – Napa County
Cost Per Acre*Year: 1st 2nd 3rd
Tons Per Acre: 1.0Regulatory Costs Land Use Permit 30 Erosion Control Plan 250TOTAL REGULATORY COSTS 280 Land Preparation: Vineyard Removal 400 Crush/Haul Steel 125 Clean Field by Hand 2X 623 Rip 3X 750 Disk 2X/Landplane 1X 400 Apply Soil Amendments (Gypsum or Lime and Compost) 473 Mark , Layout, Stake Vineyard 311 Install Trellis/Layout Posts 4,435 610 Plant Cover Crop 18TOTAL LAND PREPARATION COSTS (PRIOR YEAR COSTS) 7,535 610
Planting Costs: Spray Strip (Roundup) 26 Mow Middles 29 Vines: 1,555 Per Acre (2% Replant In 2nd Year) 5,054 88 Dig, Plant, Mound 1,866 7 Install Drip System 2,700 Unmound Vines/Place Carton around Vine 731TOTAL PLANTING COSTS 10,406 95 Cultural Costs: Prune 175 420 Sucker/Train/Wrap/Tie Vine 1,507 302 Shoot Positioning/Thin 101 Thin Crop 101 Irrigate 55 55 55 Fertilizer (8-8-8) 4 4 4 Frost Protection 31 Weed Control – Mow Middles 29 58 Weed Control – Disk Middles 21 41 Weed Control – Winter Strip Spray (Roundup) 26 51 Weed Control – Hand Weed 270 Disease Control – Mildew (Flint) (Wettable & Dusting Sulfur, Flint) 47 154 Plant Cover Crop 18 59 Erosion Control 200 200 200 Pickup Truck Use 80 80 80 ATV Use 23 23 23TOTAL CULTURAL COSTS 671 2,246 1,580Harvest Costs: Pick Fruit 250 Bin Handling 179 Haul To Crusher 3TOTAL HARVEST COSTS 432Interest On Operating Capital @ 7.14% 963 71 45TOTAL OPERATING COSTS/ACRE 19,855 3,022 2,057
2003 Winegrape Cost and Return Study North Coast/Napa County UC Cooperative Extension 14
UC COOPERATIVE EXTENSIONTable 1. continued
Cost Per Acre*
Year: 1st 2nd 3rdTons Per Acre: 1
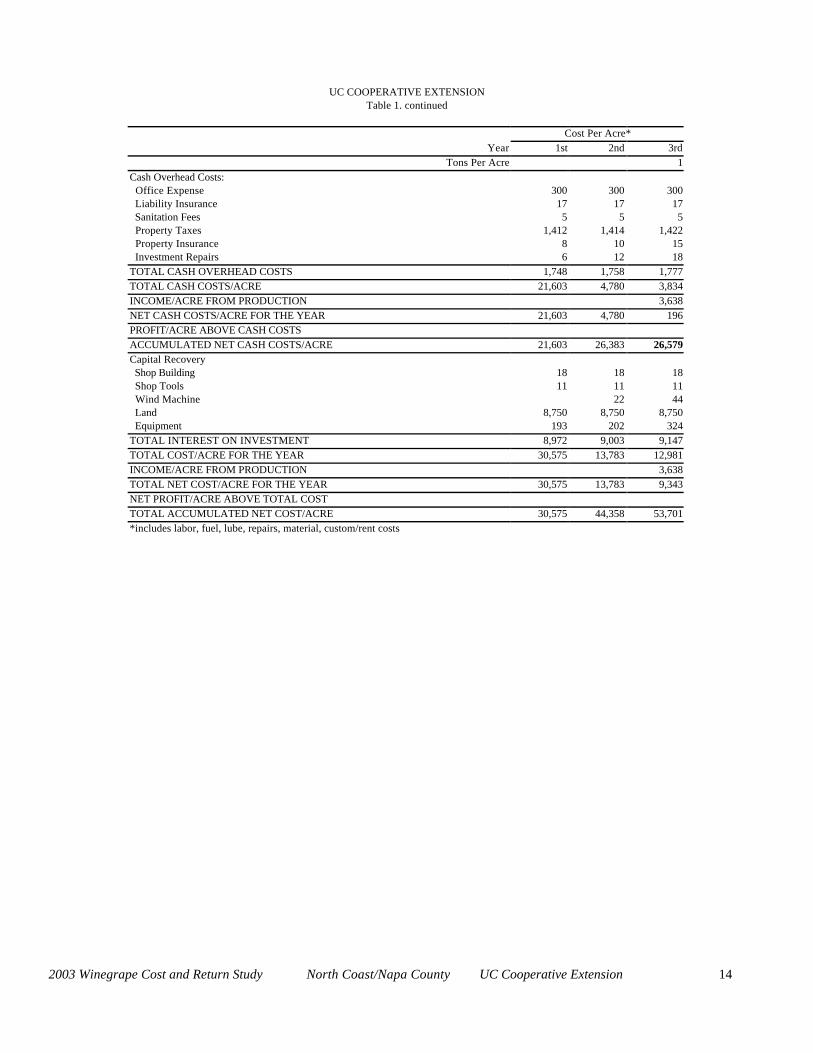
Cash Overhead Costs: Office Expense 300 300 300 Liability Insurance 17 17 17 Sanitation Fees 5 5 5 Property Taxes 1,412 1,414 1,422 Property Insurance 8 10 15 Investment Repairs 6 12 18TOTAL CASH OVERHEAD COSTS 1,748 1,758 1,777TOTAL CASH COSTS/ACRE 21,603 4,780 3,834INCOME/ACRE FROM PRODUCTION 3,638NET CASH COSTS/ACRE FOR THE YEAR 21,603 4,780 196PROFIT/ACRE ABOVE CASH COSTS ACCUMULATED NET CASH COSTS/ACRE 21,603 26,383 26,579
Capital Recovery Shop Building 18 18 18 Shop Tools 11 11 11 Wind Machine 22 44 Land 8,750 8,750 8,750 Equipment 193 202 324TOTAL INTEREST ON INVESTMENT 8,972 9,003 9,147TOTAL COST/ACRE FOR THE YEAR 30,575 13,783 12,981INCOME/ACRE FROM PRODUCTION 3,638TOTAL NET COST/ACRE FOR THE YEAR 30,575 13,783 9,343NET PROFIT/ACRE ABOVE TOTAL COST TOTAL ACCUMULATED NET COST/ACRE 30,575 44,358 53,701*includes labor, fuel, lube, repairs, material, custom/rent costs

2003 Winegrape Cost and Return Study North Coast/Napa County UC Cooperative Extension 15
UC COOPERATIVE EXTENSIONTable 2. COSTS PER ACRE to PRODUCE WINE GRAPES
NORTH COAST – Napa County 2003
Operation Cash and Labor Cost per acre Time Labor Fuel, Lube Material Custom/ Total Your
Operation (Hrs/A) Cost & Repairs Cost Rent Cost CostCultural:Spray Strip 2' (Roundup) 2.00 43 2 5 0 50Mow Middles 2.00 43 14 0 0 57Erosion Control-Materials/Labor 0.00 0 0 200 0 200Frost Protection 1.67 22 0 31 0 53Fertilizer through Drip 0.00 0 0 4 0 4Irrigation 2.00 27 0 40 0 67Disease - Mildew (Wettable Sulfur) 3.00 64 18 7 0 89Disease - Mildew (Sulfur Dust) 3.00 64 17 12 0 93Disease - Mildew (Flint) 1.00 21 6 19 0 47Prune 31.10 417 0 0 0 417Tying 5.00 67 0 0 0 67Trunk/Cordon Suckering 27.00 362 0 0 0 362Sucker/Shoot Thin/Shoot Position 27.00 362 0 0 0 362Leaf & Lateral Removal/WireLift 40.00 536 0 0 0 536Thin Crop 10.00 134 0 0 0 134Vine/Cane Trim 0.50 11 5 0 0 16Pickup Truck Use 2.50 53 26 0 0 79ATV 1.00 21 1 0 0 22TOTAL CULTURAL COSTS 158.77 2,246 91 318 0 2,655 Harvest:Harvest-Hand Labor 0.00 0 0 0 625 625Harvest-Bin Handling 4.00 77 5 0 110 193Haul 0.31 7 2 0 0 9TOTAL HARVEST COSTS 4.31 84 7 0 735 827 Interest on operating capital @ 7.14% 79TOTAL OPERATING COSTS/ACRE 2,330 98 318 735 3,561 CASH OVERHEAD:Office Expense 300Liability Insurance 17Sanitation Fees 5Property Taxes 1,557Property Insurance 106Investment Repairs 18TOTAL CASH OVERHEAD COSTS 2,003 TOTAL CASH COSTS/ACRE 5,563 NON-CASH OVERHEAD: Per producing Annual Cost
Acre Capital RecoveryLand 140,000 8,750 8,750Building 227 18 18Tools-Shop/Field/Fuel Tanks 83 11 11Wind Machine 565 44 44Vineyard Establishment 26,579 2,255 2,255Equipment 3,038 359 359TOTAL NON-CASH OVERHEAD COSTS 170,491 11,438 11,438 TOTAL COSTS/ACRE 17,002

2003 Winegrape Cost and Return Study North Coast/Napa County UC Cooperative Extension 16
UC COOPERATIVE EXTENSIONTable 3. COSTS AND RETURNS PER ACRE to PRODUCE WINE GRAPES
NORTH COAST – Napa County 2003
Quantity/ Price or Value or Your Acre Unit Cost/Unit Cost/Acre CostGROSS RETURNSCabernet Sauvignon Wine Grapes 5.00 ton 3,638.00 18,190 OPERATING COSTSHerbicide:
Roundup Ultra 0.86 pint 6.06 5Miscellaneous:
Erosion Control Management - Straw/Silt Fence/Labor 1.00 acre 200.00 200Wind Machine Operation – Frost Protection 50.00 hrac 0.62 31
Fertilizer:8-8-8 51.00 lb 0.08 4
Water:Water Pumped 5.73 acin 6.98 40
Fungicide:Wettable Sulfur 9.00 lb 0.75 7Sulfur Dust 72.00 lb 0.16 12Flint 1.50 oz 12.99 19
Contract:Harvest Hand 5.00 ton 125.00 625
Rent:Tractors (2) 4.00 acwk 21.33 85Forklift (1) 2.00 acwk 12.48 25
Labor (machine) 21.98 hrs 17.76 390Labor (non-machine) 144.77 hrs 13.40 1,940Fuel - Gas 12.46 gal 1.58 20Fuel - Diesel 34.34 gal 1.11 38Lube 9Machinery repair 32Interest on operating 79TOTAL OPERATING COSTS/ACRE 3,561 NET RETURNS ABOVE OPERATING COSTS 14,629 CASH OVERHEAD COSTS:Office Expense 300Liability Insurance 17Sanitation Fees 5Property Taxes 1,557Property Insurance 106Investment Repairs 18TOTAL CASH OVERHEAD COSTS/ACRE 2,003 TOTAL CASH COSTS/ACRE 5,563 NON-CASH OVERHEAD COSTS (Capital Recovery)Land 8,750Building 18Tools-Shop/Field/Fuel Tanks 11Wind Machine 44Vineyard Establishment 2,255Equipment 359TOTAL NON-CASH OVERHEAD COSTS/ACRE 11,438 TOTAL COSTS/ACRE 17,002NET RETURNS ABOVE TOTAL COSTS 1,188

2003 Winegrape Cost and Return Study North Coast/Napa County UC Cooperative Extension 17
UC COOPERATIVE EXTENSIONTable 4. MONTHLY CASH to PRODUCE WINE GRAPES
NORTH COAST – Napa County 2003 Beginning JAN 03 JAN FEB MAR APR MAY JUN JUL AUG SEP OCT NOV DEC TOTALEnding DEC 03 03 03 03 03 03 03 03 03 03 03 03 03 Cultural:Spray 2 ft. Strip (Roundup) 25 25 50Mow Middles 28 28 57Erosion Control-Materials/Labor 200 200Frost Protection 53 53Fertilizer through Drip 2 2 4Irrigation 7 13 13 17 13 3 67Disease - Mildew (Wettable Sulfur) 59 30 89Disease - Mildew (Sulfur Dust) 46 46 93Disease - Mildew (Flint) 47 47Prune 417 417Tying 67 67Trunk/Cordon Suckering 362 362Sucker/Shoot Thin/Shoot Position 362 362Leaf & Lateral Removal/Wire Lift 268 268 536Thin Crop 134 134Vine/Cane Trim 16 16Pickup Truck Use 7 7 7 7 7 7 7 7 7 7 7 7 79ATV 2 2 2 2 2 2 2 2 2 2 2 2 22TOTAL CULTURAL COSTS 34 425 104 483 484 336 512 25 24 212 8 8 2,655Harvest:Harvest-Hand Labor 625 625Harvest-Bin Handling 193 193Haul 9 9TOTAL HARVEST COSTS 827 827Interest on operating capital 0 3 3 6 9 11 14 14 19 -1 0 0 79TOTAL OPERATING COSTS/ACRE 34 428 107 489 493 347 526 39 870 210 8 8 3,561OVERHEAD:Office Expense 25 25 25 25 25 25 25 25 25 25 25 25 300Liability Insurance 17 17Sanitation 1 1 1 1 1 1 1 1 1 1 5Property Taxes 778 778 1,557Property Insurance 53 53 106Investment Repairs 1 1 1 1 1 1 1 1 1 1 1 1 18TOTAL CASH OVERHEAD COSTS 858 44 27 27 27 27 858 27 27 27 26 26 2,003TOTAL CASH COSTS/ACRE 892 472 134 516 520 374 1,384 66 897 237 35 35 5,563

2003 Winegrape Cost and Return Study North Coast/Napa County UC Cooperative Extension 18
UC COOPERATIVE EXTENSIONTable 5. RANGING ANALYSIS
NORTH COAST – Napa County 2003
COSTS PER ACRE TO PRODUCE GRAPES FOR WINE AT VARYING YIELDS
YIELD (ton/acre) 3.50 4.00 4.50 5.00 5.50 6.00 6.50OPERATING COSTS:Cultural Cost 2,655 2,655 2,655 2,655 2,655 2,655 2,655Harvest Cost 616 686 756 827 897 967 1,037Interest on operating capital 78 78 79 79 79 80 80TOTAL OPERATING COSTS/ACRE 3,349 3,419 3,490 3,561 3,631 3,702 3,772Total Operating Costs/ton 957 855 776 712 660 617 580CASH OVERHEAD COSTS/ACRE 2,003 2,003 2,003 2,003 2,003 2,003 2,003TOTAL CASH COSTS/ACRE 5,352 5,422 5,493 5,564 5,634 5,705 5,775Total Cash Costs/ton 1,529 1,356 1,221 1,113 1,024 951 888NON-CASH OVERHEAD COSTS/ACRE 11,438 11,438 11,438 11,438 11,438 11,438 11,438TOTAL COSTS/ACRE 16,790 16,860 16,931 17,002 17,072 17,143 17,213Total Costs/ton 4,797 4,215 3,762 3,400 3,104 2,857 2,648
NET RETURNS PER ACRE ABOVE OPERATING COSTS
PRICE YIELD (ton/acre)$/ton 3.50 4.00 4.50 5.00 5.50 6.00 6.50
2,547.00 5,566 6,769 7,972 9,174 10,378 11,580 12,7842,910.00 6,836 8,221 9,605 10,989 12,374 13,758 15,1433,274.00 8,110 9,677 11,243 12,809 14,376 15,942 17,5093,638.00 9,384 11,133 12,881 14,629 16,378 18,126 19,8754,002.00 10,658 12,589 14,519 16,449 18,380 20,310 22,2414,366.00 11,932 14,045 16,157 18,269 20,382 22,494 24,6074,729.00 13,203 15,497 17,791 20,084 22,379 24,672 26,967
NET RETURN PER ACRE ABOVE CASH COST
PRICE YIELD (ton/acre)$/ton 3.50 4.00 4.50 5.00 5.50 6.00 6.50
2,547.00 3,563 4,766 5,969 7,171 8,375 9,577 10,7812,910.00 4,833 6,218 7,602 8,986 10,371 11,755 13,1403,274.00 6,107 7,674 9,240 10,806 12,373 13,939 15,5063,638.00 7,381 9,130 10,878 12,626 14,375 16,123 17,8724,002.00 8,655 10,586 12,516 14,446 16,377 18,307 20,2384,366.00 9,929 12,042 14,154 16,266 18,379 20,491 22,6044,729.00 11,200 13,494 15,788 18,081 20,376 22,669 24,964
NET RETURNS PER ACRE ABOVE TOTAL COST
PRICE YIELD (ton/acre)$/ton 3.50 4.00 4.50 5.00 5.50 6.00 6.50
2,547.00 -7,876 -6,672 -5,470 -4,267 -3,064 -1,861 -6582,910.00 -6,605 -5,220 -3,836 -2,452 -1,067 317 1,7023,274.00 -5,331 -3,764 -2,198 -632 935 2,501 4,0683,638.00 -4,057 -2,308 -560 1,188 2,937 4,685 6,4344,002.00 -2,783 -852 1,078 3,008 4,939 6,869 8,8004,366.00 -1,509 604 2,716 4,828 6,941 9,053 11,1664,729.00 -239 2,056 4,350 6,643 8,938 11,231 13,526

2003 Winegrape Cost and Return Study North Coast/Napa County UC Cooperative Extension 19
UC COOPERATIVE EXTENSIONTable 6. WHOLE FARM ANNUAL EQUIPMENT, INVESTMENT, AND BUSINESS OVERHEAD COSTS
NORTH COAST – Napa County 2003
ANNUAL EQUIPMENT COSTS
Cash OverheadYrs Salvage Capital Insur-
Yr Description Price Life Value Recovery ance Taxes Total03 60HP 4WD Narrow Tractor 36,000 15 7,009 3,472 145 215 3,83203 Air Blast l3Pt Sprayer 200 gal 6,082 15 584 612 23 33 66803 ATV 4WD 6,700 5 3,003 1,071 33 49 1,15303 Bins 1/2 ton (2) 400 10 71 50 2 2 5403 Bins 1/2 ton (2) 400 10 71 50 2 2 5403 Bins 1/2 ton (2) 400 10 71 50 2 2 5403 Bin Trailer 2Bin #2 680 15 65 68 3 4 7503 Bin Trailer 2Bin #3 680 15 65 68 3 4 7503 Bin Trailer 2Bin #1 680 15 65 68 3 4 7503 Duster - 3 Pt 5,000 5 1,629 908 22 33 96303 Mower-Flail 5' 4,504 15 432 453 17 25 49503 Pickup Truck 1/2 Ton 26,000 7 9,863 3,533 121 179 3,83303 Sprayer ATV 20 gal 350 10 62 43 1 2 4703 Truck Flatbed 20' 2 Ton 49,803 10 14,711 5,744 218 323 6,28503 Vine Trimmer 2 - 1/2 row 14,200 10 2,511 1,764 56 84 1,904
TOTAL 151,879 40,212 17,954 649 960 19,564 60% of New Cost * 91,127 24,127 10,773 390 576 11,738*Used to reflect a mix or new and used equipment
ANNUAL INVESTMENT COSTS
Cash OverheadYrs Salvage Capital Insur-
Description Price Life Value Recovery ance Taxes Repairs TotalBuilding 400 sq ft 6,800 25 545 23 34 136 738Vineyard Establishment 797,370 22 67,664 2,695 3,987 0 74,346Land 35 Acres 4,200,000 25 4,200,000 262,500 0 42,000 0 304,500Tools-Shop/Field/Fuel Tanks 2,500 10 344 8 13 50 415Wind Machine 16,946 25 1,695 1,327 63 93 339 1,823TOTAL INVESTMENT 5,023,616 4,201,695 332,380 2,790 46,127 525 381,821
ANNUAL BUSINESS OVERHEAD COSTS
Units/ Price/ TotalDescription Farm Unit Unit CostLiability Insurance 30 acre 17 516Office Expense 30 acre 300 9,000Sanitation 30 acre 36 1,090

2003 Winegrape Cost and Return Study North Coast/Napa County UC Cooperative Extension 20
UC COOPERATIVE EXTENSIONTable 7. HOURLY EQUIPMENT COSTS
NORTH COAST – Napa County 2003
COSTS PER HOURActual Cash Overhead OperatingHours Capital Insur- Fuel & Total Total
Yr Description Used Recovery ance Taxes Repairs Lube Oper. Costs/Hr.03 60HP 4WD Narrow Tractor 346.50 6.01 0.25 0.37 0.88 3.76 4.64 11.2803 Air Blast 3Pt Sprayer 200 gal 120.00 3.06 0.11 0.17 0.99 0.00 0.99 4.3303 ATV 4WD 90.00 7.14 0.22 0.32 0.50 0.61 1.11 8.7903 Bins 1/2 ton (2) 30.00 0.99 0.03 0.05 0.00 0.00 0.00 1.0703 Bins 1/2 ton (2) 30.00 0.99 0.03 0.05 0.00 0.00 0.00 1.0703 Bins 1/2 ton (2) 30.00 0.99 0.03 0.05 0.00 0.00 0.00 1.0703 Bin Trailer 2Bin #2 30.00 1.37 0.05 0.07 0.10 0.00 0.10 1.6003 Bin Trailer 2Bin #3 30.00 1.37 0.05 0.07 0.10 0.00 0.10 1.6003 Bin Trailer 2Bin #1 30.00 1.37 0.05 0.07 0.10 0.00 0.10 1.6003 Duster - 3 Pt 90.00 6.05 0.15 0.22 0.73 0.00 0.73 7.1503 Mower-Flail 5' 60.00 4.53 0.17 0.25 2.02 0.00 2.02 6.9703 Pickup Truck 1/2 Ton 75.00 28.26 0.97 1.43 1.91 8.33 10.24 40.9103 Sprayer ATV 20 gal 60.00 0.43 0.01 0.02 0.10 0.00 0.10 0.5703 Truck Flatbed 20' 2 Ton 9.40 367.03 13.93 20.61 4.75 1.28 6.03 407.6003 Vine Trimmer, 2 - 1/2 row 15.00 70.56 2.26 3.34 5.87 0.00 5.87 82.03

2003 Winegrape Cost and Return Study North Coast/Napa County UC Cooperative Extension 21
UC COOPERATIVE EXTENSIONTable 8. OPERATIONS WITH EQUIPMENT
NORTH COAST - Napa County 2003
Operation EquipmentOperation Month Tractor Implement Material Rate/acre* UnitCultural:Spray Strip 2' (Roundup) January Sprayer ATV Roundup 0.43 pt
July Sprayer ATV Roundup 0.43 ptMow Middles March 60HP 4WD Mower Flail 5'
May 60HP 4WD Mower Flail 5'Erosion Control-Materials/Labor October Straw/SiltFrost Protection April Wind MachineFertilizer through Drip May 8-8-8 25.50 lb
September 8-8-8 25.50 lbIrrigation May Water 0.57 acin
June Water 1.15 acinJuly Water 1.15 acinAugust Water 1.43 acinSeptember Water 1.15 acinOctober Water 0.28 acin
Disease - Mildew (Wettable Sulfur) April 60HP 4WD Air Blast Sprayer Wettable Sulfur 3.00 lbApril 60HP 4WD Air Blast Sprayer Wettable Sulfur 3.00 lbMay 60HP 4WD Air Blast Sprayer Wettable Sulfur 3.00 lb
Disease - Mildew (Sulfur Dust) May 60HP 4WD Duster Sulfur Dust 12.00 lbMay 60HP 4WD Duster Sulfur Dust 12.00 lbMay 60HP 4WD Duster Sulfur Dust 12.00 lbJune 60HP 4WD Duster Sulfur Dust 12.00 lbJune 60HP 4WD Duster Sulfur Dust 12.00 lbJune 60HP 4WD Duster Sulfur Dust 12.00 lb
Disease - Mildew (Flint) July 60HP 4WD Air Blast Sprayer Flint 1.50 flozPrune FebruaryTying MarchTrunk/Cordon Suckering AprilSucker/Shoot Thin/Shoot Position MayLeaf & LateralRemoval/WireLift JuneThin Crop JuneVine/Cane Trim July 60HP 4WD Vine TrimmerPickup Truck Use Annual Pickup 1/2 tonATV Annual ATVHarvest:Harvest-Hand Labor SeptemberHarvest-Bin Handling September 60HP 4WD Bin Trailer/Bins
Bin Trailer/Bins Rented TractorBin Trailer/Bins Rented Tractor
Rented ForkliftHaul September Truck Flatbed *Rates are per broadcast acres (30)