Embed Size (px)
Citation preview
1996
University of California Cooperative Extension
Sample CostsTo Establish A Vineyard And Produce
Wine Grapes
Drip Irrigated Chardonnay Variety
Santa Maria ValleySanta Barbara County
ByEtaferahu Takele, Area Farm Advisor, Farm Management Economics, Southern Region
andMary Bianchi, Farm Advisor, Santa Barbara and San Luis Obispo Counties
1996 Santa Barbara County Chardonnay Vineyard Cost and Return Study(100 Acres) UC Cooperative Extension 2
U.C. Cooperative Extension
Costs For Establishing A Vineyard And Producing Wine GrapesDrip Irrigated Chardonnay Variety
Santa Barbara County - 1996
Detailed costs for vineyard establishment and wine grape production in the Santa Maria Valley of Santa BarbaraCounty for 1996 are presented in this study. The hypothetical vineyard used in this report consists of a total of 100acres, 95 of which are being either established or “redeveloped,” and the remaining five acres are in farmsteadbuildings, a reservoir and roads.
This study consists of General Assumptions we used for establishing and producing Chardonnay wine grapesalong with seven tables of cost analysis. The practices described in this cost study are considered typical forwine grape production in the Santa Maria Valley of Santa Barbara County. They do not reflect the exact valuesor practices of any grower or shipper, but rather an amalgamation of costs and practices in the region. Samplecosts given for labor, materials, equipment and contract services are based on 1996 prices. Some costs andpractices detailed in this study may not be applicable to your situation. The use of trade names in this reportdoes not constitute an endorsement or recommendation by the University of California nor is any criticismimplied by omission of other similar products. This study is only intended as a guide, it can be used in makingproduction decisions, determining potential returns, preparing budgets and evaluating production loans.
Costs are presented in seven tables.
Table 1. Costs Per Acre To Establish A Vineyard.Table 2. Costs Per Acre To Produce Wine GrapesTable 3. Costs And Returns Per Acre To Produce Wine GrapesTable 4. Monthly Cash Costs Per Acre To Produce Wine GrapesTable 5. Whole Farm Annual Equipment, Investment And Business Overhead CostsTable 6. Hourly Equipment CostsTable 7. Ranging AnalysisA blank Your Cost column is also provided to enter your actual costs on Tables 2 and 3, Costs Per Acre ToProduce Wine Grapes and Costs And Returns Per Acre To Produce Wine Grapes.
For an explanation of calculations used for the study refer to the attached General Assumptions, call EtaferahuTakele, the Area Farm Management Economics Advisor, University of California Cooperative Extension,Moreno Valley, California, (909) 683-6491 ext. 243 or call the Santa Barbara County Farm Advisor, MaryBianchi, (805) 781-5940.
The University of California, Cooperative Extension in compliance with Titles VI and VII of the Civil Rights Act of 1964, Title IXof the Education Amendments of 1972, Sections 503 and 504 of the Rehabilitation Act of 1973 does not discriminate on the basis ofrace, religion, color, national origins, sex, mental or physical handicaps or age in any of its programs or activities, or with respect toany of its employment policies, practices or procedures. Nor does the University of California does not discriminate on the basis ofancestry, sexual orientation, marital status, citizenship, medical condition (as defined in section 12926 of the California GovernmentCode) or because the individuals are disabled or Vietnam era veterans (as defined the Vietnam Era Veterans Readjustment Act of 1974and Section of the California Government Code). Inquiries regarding this policy may be directed to the Affirmative Action Director,University of California, Agriculture and Natural Resources, 300 Lakeside Drive, Oakland, California 94612-3560, (510) 987-0097.
University of California and the United States Department of Agriculture cooperating.
1996 Santa Barbara County Chardonnay Vineyard Cost and Return Study(100 Acres) UC Cooperative Extension 3
ASSUMPTIONS USED IN THIS STUDY
The following is a description of the assumptions used in this study to develop costs to establish a vineyardand produce Chardonnay wine grapes in the Santa Maria Valley of Santa Barbara County in 1996.
1. LANDThe vineyard is owned by an absentee landlord. Management and operation is performed by a localvineyard management company. The vineyard is located in the Santa Maria Valley of Santa BarbaraCounty and is situated at the eastern end of the valley. The vineyard is comprised of 100 acres, 95 ofwhich are planted to wine grapes. Land is valued at $10,000 per acre. Because only 95 of the 100 acresare planted to wine grapes, land is valued at $10,526 per plantable acre.
2. VINESDormant bench grafts, scions of certified Chardonnay on phylloxera resistant rootstocks, are planted ona 5'x8' spacing with 1,089 vines per acre during the spring following land preparation in the previousyear. In the first year following planting, grow tubes are placed around vines. In the second year 5% or54 vines per acre will be replanted. Vines are trained as unilateral cordonsspur pruned. The grapevinesare expected to begin yielding fruit in three years and then be productive for an additional 22 years.Costs of vines and tubes are $3.50 and $0.75 each, respectively.
3. IRRIGATION & FROST PROTECTION SYSTEMSIrrigation System: A new 10” well is drilled 300’ deep, followed by an installation of a new 50 hpsubmersible pump and motor, and filtration/injector station. The underground portion of the dripirrigation system is installed in the fall prior to planting. Just prior to planting, the above-ground portionof the drip system (polyethylene laterals and a single 1.0 gph emitters) is installed. However, on sandysoils, two 0.5 gph emitters may be installed to increase the root zone wetted area. The well, motor,pump, filtration station, fertilizer injector system, drip lines and the labor to install each of thesecomponents is included in the irrigation system cost. The irrigation system is considered animprovement to the property and has a 25 year life span. Therefore, it is not found in preplantoperations in Table 1, rather it is shown in the non-cash overhead sections as depreciation and intereston investment of various tables and the Investments portion of Table 5. However, since the irrigationsystem is purchased and installed during the first year, growers may prefer to consider this as a cash costand add about $3,400/acre to the first year establishment cost.
Pumped water plus labor is the irrigation cost. The cost is based on using the motor to pump 6 acre-inches from 200 feet deep and pressurized to 30 psi to supply one of five irrigated sets among the 100planted acres. Price per acre-foot of water will vary by grower in this region depending on quantitypumped, power cost, various well characteristics, and other irrigation factors. In this study, water iscalculated to cost $50 per acre-foot. No assumption is made about effective rainfall. Irrigations begin inApril and end in September during the first two years. By the third year additional water is appliedduring one postharvest irrigation in October.
1996 Santa Barbara County Chardonnay Vineyard Cost and Return Study(100 Acres) UC Cooperative Extension 4
Frost Protection System: The frost protection system consists of a 20 acre-foot reservoir, two dieselengine powered pumps, screen/strainer, specialty control valves and a permanent underground pipelinewith overhead sprinklers. The pumping capacity of the system is 5,000 gpm at approximately 175TDH. Water for frost protection is pumped from the well into the reservoir and stored until needed.Although the frost protection system is installed during the vineyard conversion and prior to planting inthe first year, it is not shown as a cash cost in vineyard establishment, but rather is considered as animprovement to the land. The cost for the frost protection system can be found in Table 5 under AnnualInvestment Costs. This system has an expected life of 25 years.
In this study, it is assumed that frost protection will be required for 6 hours per night for 8 nights peryear. Annual use of 6 acre inches of water per acre for frost protection is presumed to occur from thethird year of establishment throughout the life of the vineyard. In actual practice the amount of waterused to protect the vineyard from frost will vary from year to year. The water for frost protectionpurposes costs $87.48 per acre foot and reflects both the initial pumping from the well and theadditional pumping and pressurization of the sprinkler system.
Applied Irrigation WaterAcre Inches
Year April - May July - August September Total1 1 2 1 42 2 4 1 73 6* 8 4 18
*/ Frost Protection
4. TRELLIS SYSTEMThe trellis system is designed to support a cordon trained spur pruned vineyard. The trellis equipmentfor this vineyard include T-stakes, rebar support stakes, wooden endposts and foliage support wires.Seven foot metal stakes are put at every third vine. These stakes are notched to support the pairsmoveable foliage wires. The trunks of the two vines between these stakes are trained up rebar stakes.Pressure-treated Douglas Fir end posts and six inch augers at row ends anchor the wires. High tensile 13gauge wires are used for the trellis. The trellis wires are as follows: one wire at 18” to hold the driplateral, one permanent wire for tying canes, two pair of moveable foliage support wires and one stabilizerwire. Installation of the trellis system is performed as a custom operation and occurs in the fall andwinter prior to planting. It is considered part of the vineyard since it would be removed at the time ofvine removal and is shown in the vineyard establishment costs in Table 1.
The trellis system costs are broken down as follows: T-stakes at every third vine (363 stakes per acre)at $1.56 each; rebar support stakes at the remaining two-thirds of the vines (726 rebar support stakesper acre) at $1.30 each; two wooden endposts per row (14 endposts per acre) at $15.43 per endpost;and wires to support foliage at $70 per row. Labor to install T-stakes and rebar stakes is estimated attwo acres per hour. The total cost for the complete trellis system installation is $2,220 per acre or$2.04 per vine.
1996 Santa Barbara County Chardonnay Vineyard Cost and Return Study(100 Acres) UC Cooperative Extension 5
5. ESTABLISHMENT CULTURAL PRACTICESThis vineyard is established on ground that is currently planted to wine grapes, which are to be removed.The land is assumed to be on relatively flat alluvial soils that are adequately drained and moderatelyfertile. The practices described below represent only the hypothetical vineyard in this study. These aretypical practices for many vineyards in the Santa Maria Valley, but may not be appropriate to everysituation.
Vineyard Conversion And Site Preparation:The existing grapevines are removed in the fall. Infestation of the previous vines by phylloxera andnematodes is assumed to be significant. After the vines have been pushed out and burned, gypsum isapplied at a rate of four to five tons per acre. The site is then slip plowed twice to a depth of 5 to 6 feet.Slip plowing is effective at breaking up underlying soil layers, which aids root and water penetration, andalso pulls up roots from the previous vines which can harbor disease. After slip plowing, the ground isdisced twice to break up large clods and smooth the soil. The vineyard site is not fumigated. Vineyardremoval and slip plowing are performed by contract or custom operators. All operations that preparethe vineyard for planting are done in the year prior to planting, but costs are shown in the first year.Windbreaks are established by planting Casuarina cunninghamiana (River She Oak) during year one.
Planting: Planting the vineyard starts by laying out and marking vine sites in late fall following the lastdiscing, usually September or October. The initial survey operation is contracted to a professionalsurvey crew that lays out a 100’ by 100’ grid. The underground portion of the drip irrigation system(mains and risers) is installed before substantial rainfall. Individual vine sites are marked in the vineyardby a labor crew. A post-emergent herbicide “strip-spray” is applied on a four-foot band to the vinerows. This operation takes place in late January or early February.
In March or early April, following sufficient rainfall to soften the soil for digging, dormant bench graftsof Chardonnay headed back to two buds, are hand-planted by labor crews. At this time, a vine sleeve isalso installed around each vine to aid in growth. Just prior to planting, the above ground portion of theirrigation system (drip hose laterals and emitters) is installed.
In the second year, 5% of the vines or 54 vines per acre are lost and are replaced. This involves plantingnew dormant or green bench grafts.
Pruning and Training: Activities include pruning, training, tying, suckering vines, shoot positioningand thinning operations. Not all operations are practiced each year, nor are all the same practices used forother training methods or trellis systems.
In the first year, the vine trunk is established. The second year training completes cordon and begins todefine spur positions. Budbreak, typically occurring in mid-March, signals the onset of vine trainingwhich can run from May through August or even September, and can require six or more passes throughthe vineyard. Training of the vine includes suckering, tying, and establishing the trunk and spurs of thevine. Suckering is the removal of shoots from the rootstock and along the trunk that could compete withthe main trunk and head for water and nutrients. Vine trunks are established by tying one shoot up thestake. This operation takes place at two week intervals requiring several trips through the vineyard.Once this shoot has extended 18 inches above the cordon wire it is topped slightly below the wire, suchthat training of the head can begin. Two to four auxiliary shoots are selected for the spurs for thefollowing years. Any remaining lower shoots that were not removed during earlier suckering or training
1996 Santa Barbara County Chardonnay Vineyard Cost and Return Study(100 Acres) UC Cooperative Extension 6
operations would also be pruned off at this time. All prunings are left in between the vine rows to bechopped by the tractor and mower. Pruning costs increase from year two through year five and remainconstant there afterwards.
Training vines is assumed to be completed by the third year, but spur positions that were selected duringdormant pruning may be reassessed during the spring. Slower growing vines continue to be trained;however, year three is the last year that the vines are trained in this study. Suckering of the vines, whichbegins in year two increases in cost up to the fourth year and remains constant through the productionyears.
After vines are trained, canopy management activities such as shoot positioning, thinning, leaf removalstart in year four. The number of hours per acre needed for shoot positioning increases each year up toyear six and remains constant in the years thereafter. Mechanical hedging begins in year four. Itsprimary function is for disease management but it also facilitates harvesting and dormant pruning.
Insect, Mite and Disease Management: Few insects pests need management in the Santa MariaValley, although orange tortrix, leafhoppers, mites and mealybugs may be a problem.
There are many pathogens that attack grapevines, but the only major disease that is assumed to occur inthis study is powdery mildew (Uncinula necator). Powdery mildew control begins the second year withan application of wettable sulfur at 2 to 4 inches of shoot growth. Also six sulfur dustings are donebeginning in early May through mid-June. Sulfur dustings are applied at a rate of 10 pounds per acre toevery row on seven day intervals. From third year on, sterol inhibitor products are used. Equipment forspraying and dusting comprises a tractor, a pull type sprayer and a 3-point duster.
Vineyard Floor Management: Weeds present in the vine row the year the vines are planted arecontrolled with two hand hoeing passes and a post-emergent herbicide. The row centers between the vinerows are mowed three to five times. Discing is avoided to reduce erosion potential and provide habitatfor beneficial insects. Some vineyards are disced every other row, every other year. During vineyardestablishment, a non-native cover crop consisting of Zorro fescue and Blando brome is used for erosioncontrol as well. Summer weed control along the vine row begins in the second year with spot spraying,being sure to protect vine trunks with vine grow tubes.
Fertilization: Nitrogen fertilizer is applied in all years of vineyard establishment. A liquid formulationof nitrogen (17%) is used at a rate of 6.25 pounds of N per acre through the drip line in two splitapplications in May and October, totaling 12.5 pounds N for the season.
Vertebrate Pest Management: Few vertebrate pests require control in Santa Maria vineyards:principally rabbits, gophers and sometimes squirrels. Damage by rabbits is managed by vine grow tubesplaced around the young vines during the first year after the vines are planted and pruned to two buds.This prevents rabbits from feeding on those portions of the young vines within the sleeve. Gophercontrol is critical for many sites and often entails a combination of mechanical and hand baiting togetherwith trapping.
1996 Santa Barbara County Chardonnay Vineyard Cost and Return Study(100 Acres) UC Cooperative Extension 7
Establishment Cost: An establishment cost is the sum of the costs for land preparation, trellis system,planting, vines, cash overhead and production expenses for growing the vines from the first year tillgrapes are harvestedin this case, the third year. It is used to determine the non-cash overheadexpenses, depreciation and interest on investment, during the production years. The Total AccumulatedNet Cash Cost on Table 1, in the third year represents the establishment cost. For this study the cost is$11,985 per acre or $1,138,575 for the 95 acre vineyard. The establishment cost is spread over theremaining 22 years of the 25 years the vineyard is in production.
6. PRODUCTION CULTURAL PRACTICESPruning: Pruning is done during the winter months, November through February, and comprises theremoval of old fruit wood and selecting fruiting spurs for the coming season. The prunings are placed inthe row middles where they are chopped using the mower. Canopy management activities such as shootpositioning, thinning, and suckering trunks continue through all production years. Positioning andthinning of shoots and leaf removal opposite clusters allows vines adequate space to develop better fruitby opening the canopy to allow higher sunlight and greater air movement through the vines and aroundthe clusters. Consequently, growth of fruit fungal diseases is lessened.
Fertilization: Nitrogen is applied at a rate of 25 pounds of N per acre during the production years byinjecting liquid nitrogen through the drip irrigation system. Additionally, liquid potassium is applied intwo applications, 15 gallons per acre in June at about full bloom and 25 gallons per acre in October afterharvest. Fertility management is monitored by annual bloom-time leaf petiole sampling and tissueanalysis for content of major and minor nutrients, primarily N, P, K, and Zn.
Vineyard Floor Management: In this vineyard, row weeds are controlled with a mix of pre-emergentherbicides applied as a strip spray during November and spot sprays of Roundup. Cover crops in therow middles are maintained and managed with three mowings per season. The first pass of the seasonalso chops prunings. A spot herbicide spray of Roundup is used to treat 10% of the acreage, primarilyfor field bindweed or bermudagrass control.
Insect, Mite and Disease Management: Few insects pests need management in the Santa MariaValley, although orange tortrix, leafhoppers, mites and mealybugs may be a problem. Treatments occuron as needed basis.
Powdery mildew is the principle disease of the region and control is begun in April at 2 to 4” shootgrowth with an application of wettable sulfur. It is followed by two more applications of wettable sulfuron a 7 to 10 day cycle. Following bloom, dusting sulfur is applied on a 7 day cycle to every rowcontinuing through mid-June. Then sterol inhibitor sprays are begun at this time and continue throughJuly or until fruit attains about 14 to 15 Brix.
Control of botrytis bunch rot (Botrytis cinerea) is effected through the use of canopy managementpractices of shoot positioning and leaf removal. In some years, growers may be faced with environmentalconditions that could require chemical control practices.
Pesticides, rates, and cultural practices mentioned in this cost study are a few of those listed in the UCIPM Pest Management Guidelines, Grapes and Grape Pest Management. Written recommendations arerequired for many pesticides and are made by licensed pest control advisors (PCA). In this study nopesticides are used because there are no persistent pests. Pesticide application is on as needed basis.
1996 Santa Barbara County Chardonnay Vineyard Cost and Return Study(100 Acres) UC Cooperative Extension 8
For pesticide regulatory information and pesticide use permits, contact the local county AgriculturalCommissioner's office in Santa Barbara. For additional production information contact the Santa BarbaraCounty viticulture farm advisor.
7. HARVESTHarvesting starts in the third year. In this cost study the vineyard contracts to have the grape cropharvested by labor crews and is charged on a per ton basis. Hauling to a local winery is also contractedfor and paid by the grower. Hauling expenses can be significant for growers selling to wineries in theNorth Coast.
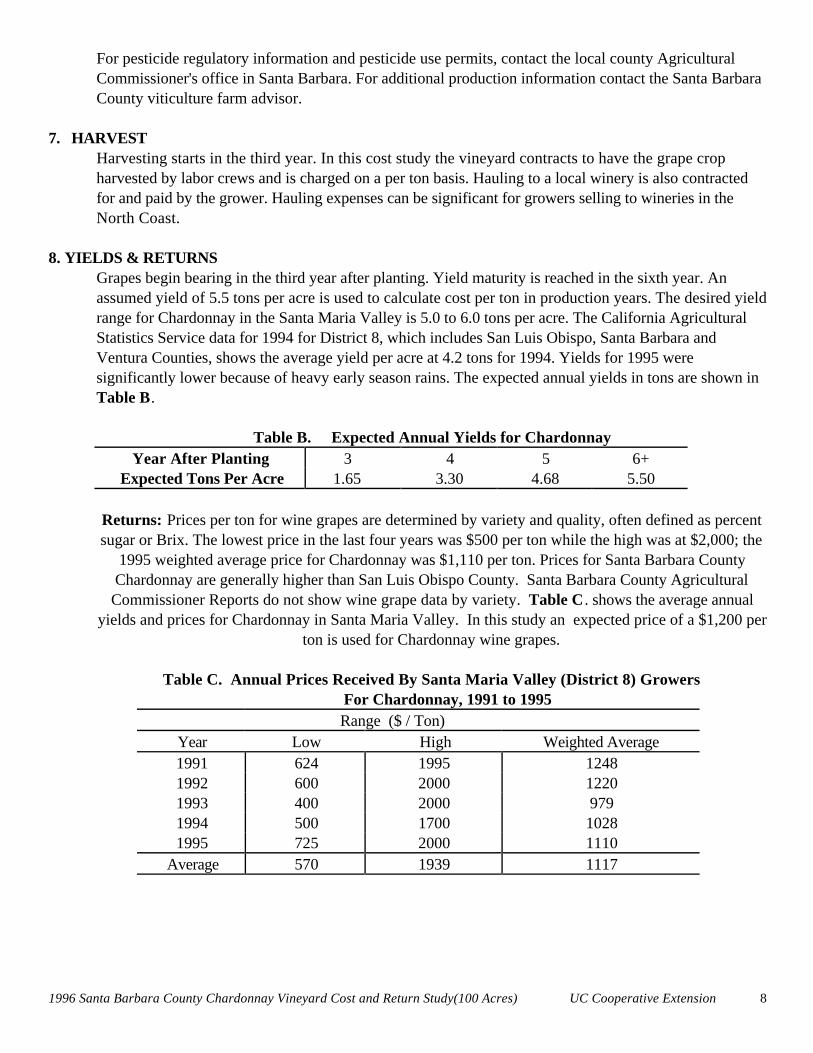
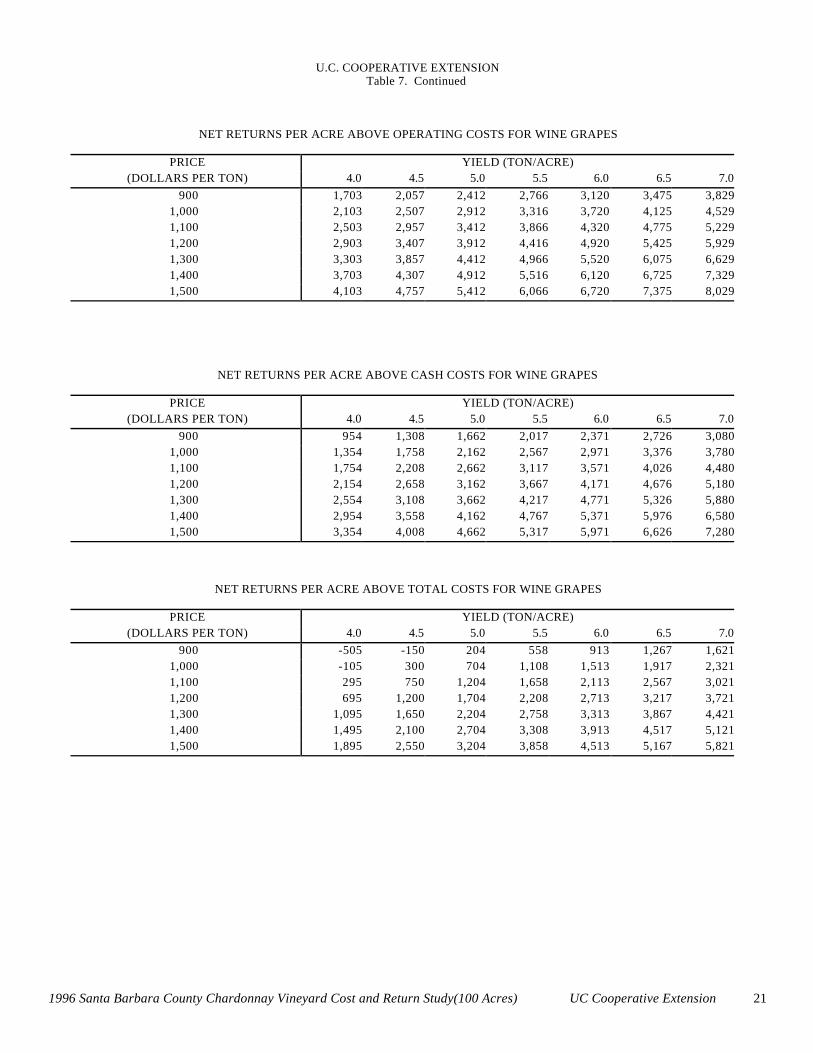
8. YIELDS & RETURNSGrapes begin bearing in the third year after planting. Yield maturity is reached in the sixth year. Anassumed yield of 5.5 tons per acre is used to calculate cost per ton in production years. The desired yieldrange for Chardonnay in the Santa Maria Valley is 5.0 to 6.0 tons per acre. The California AgriculturalStatistics Service data for 1994 for District 8, which includes San Luis Obispo, Santa Barbara andVentura Counties, shows the average yield per acre at 4.2 tons for 1994. Yields for 1995 weresignificantly lower because of heavy early season rains. The expected annual yields in tons are shown inTable B.
Table B. Expected Annual Yields for ChardonnayYear After Planting 3 4 5 6+
Expected Tons Per Acre 1.65 3.30 4.68 5.50
Returns: Prices per ton for wine grapes are determined by variety and quality, often defined as percentsugar or Brix. The lowest price in the last four years was $500 per ton while the high was at $2,000; the
1995 weighted average price for Chardonnay was $1,110 per ton. Prices for Santa Barbara CountyChardonnay are generally higher than San Luis Obispo County. Santa Barbara County AgriculturalCommissioner Reports do not show wine grape data by variety. Table C . shows the average annual
yields and prices for Chardonnay in Santa Maria Valley. In this study an expected price of a $1,200 perton is used for Chardonnay wine grapes.
Table C. Annual Prices Received By Santa Maria Valley (District 8) Growers For Chardonnay, 1991 to 1995
Range ($ / Ton)Year Low High Weighted Average1991 624 1995 12481992 600 2000 12201993 400 2000 9791994 500 1700 10281995 725 2000 1110
Average 570 1939 1117
1996 Santa Barbara County Chardonnay Vineyard Cost and Return Study(100 Acres) UC Cooperative Extension 9
9. RISKRisk is caused by various sources of uncertainty including production, price, and financial. Examples ofthese are frost damage, rain during bloom or just prior to harvest, a decrease in price, and increase ininterest rates. The risks associated with producing wine grapes in the Santa Maria Valley of SantaBarbara County should not be underestimated. While this study makes every effort to model aproduction system based on typical, real world practices, it cannot fully represent agronomic, market,and financial risks which affect the profitability and economic viability of wine grape production.Additionally, establishment of vineyards and the equipment required to properly handle the fruit is verycapital intensive. Growers should consider all of the agronomic and economic risks before committingresources to establishing a vineyard and wine grape production in this region.
10. LABORHourly wages for workers are $8.00 and $6.50 per hour for machine and non-machine workers,respectively. This is based on wages paid by the growers in this study. Adding 34% for WorkersCompensation, Social Security, Medicare, insurance, and other possible benefits gives the labor ratesshown of $10.72 and $8.71 per hour for machine labor and non-machine labor, respectively. Labor foroperations involving machinery are 20% higher than the operation time given in Table 2 to account forthe extra labor involved in equipment set up, moving, maintenance, work breaks, and field repair.Management cost by independent vineyard management company are included as a cash overhead cost.Any return above total costs is considered a return to management and risk.
11. CASH OVERHEADCash overhead consists of various cash expenses paid out during the year that are assigned to the wholefarm, not to a particular operation. These costs include property taxes, interest on operating capital,office expense, liability and property insurance, sanitation services, and equipment repairs.
Property Taxes: Counties charge a base property tax rate of 1% on the assessed value of the property.In some Counties special assessment districts exist and charge additional taxes on property includingequipment, buildings, and improvements. For this study, property taxes are calculated at 1% of theaverage value. Average value equals new cost plus salvage value divided by 2 on a per acre basis.
Interest On Operating Capital: Interest on operating capital is based on cash operating costs and iscalculated monthly until harvest at a nominal rate of 7.89% per year. A nominal interest rate is the goingmarket cost of borrowed funds.
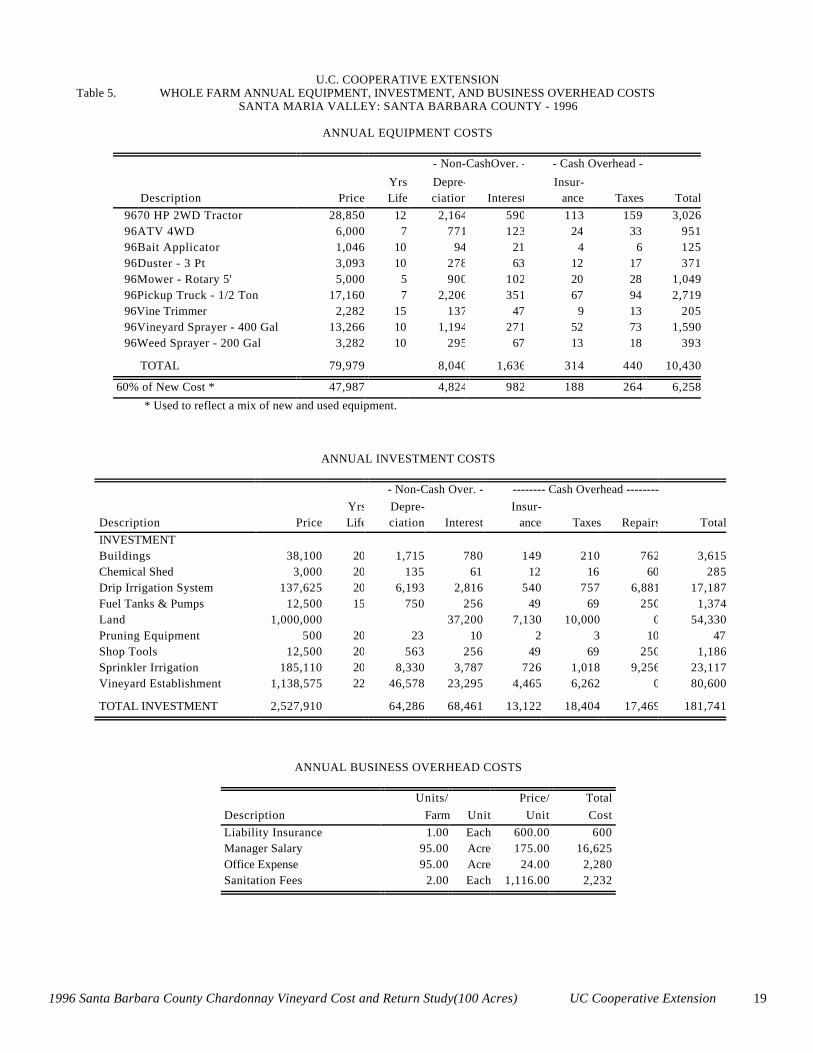
Insurance: Insurance for farm investments vary depending on the assets included and the amount ofcoverage. Property insurance provides coverage for property loss and is charged at 0.713% of theaverage value of the assets over their useful life. Liability insurance covers accidents on the farm andcosts $600 for the entire farm.
Office Expense: Office and business expenses are estimated at $24 per acre. These expenses includeoffice supplies, telephone, computer, fax, copier, bookkeeping, accounting, legal fees, etc.
Sanitation Services: Sanitation services provide two portable toilets for the vineyard and cost $2 peracre per month. The cost for this includes delivery and regular servicing of toilets.
1996 Santa Barbara County Chardonnay Vineyard Cost and Return Study(100 Acres) UC Cooperative Extension 10
Management Fee: A fee for management is included to indicate that a cash cost for professionalsupervision of the vineyard is incurred. If the manager is also the owner a salary would be paid regardlessof any profits received from vineyard production. An expense of $175 per acre per year for aprofessional manager’s time is used. Cash overhead costs are found in Tables 1 , 2, 3, 4, and 5.
12. NON-CASH OVERHEADNon-cash overhead is comprised of depreciation and interest charged on equipment and otherinvestments. Farm equipment on typical vineyard in the Santa Maria Valley may be purchased used.This study shows the current purchase price for new equipment adjusted to 60% of new value toindicate a mix of new and used equipment. Annual equipment and investment costs are shown in Tables1, 2, 3, and 5. They represent depreciation and opportunity cost for each investment on an annual peracre basis.
Depreciation is a reduction in market value of investments due to wear, obsolescence, and age estimatedon a straight line basis. Annual depreciation is calculated as purchase price minus salvage value dividedby years the investment is held. Purchase price and years of life are shown in Table 5.
Interest is charged on investments to account for income foregone (opportunity cost) that could bereceived from an alternative investment. The investments are assumed to be owned outright. Therefore,interest on investments is a non-cash cost. Investments include land, vineyard establishment, irrigationsystem, buildings, and equipment. Interest is calculated as the average value of the investment during itsuseful life, multiplied by 3.72% per year. Average value for equipment and buildings equals new costplus salvage value divided by 2 on a per acre basis.
The average value for land is equal to the purchase price because land does not depreciate. The interestrate used to calculate opportunity cost is estimated as a ten year average of the agricultural sector longrun rate of return to production assets from current income. It is used to reflect the long-term realizedrate of return to these specialized resources that can only be used effectively in the agricultural sector.
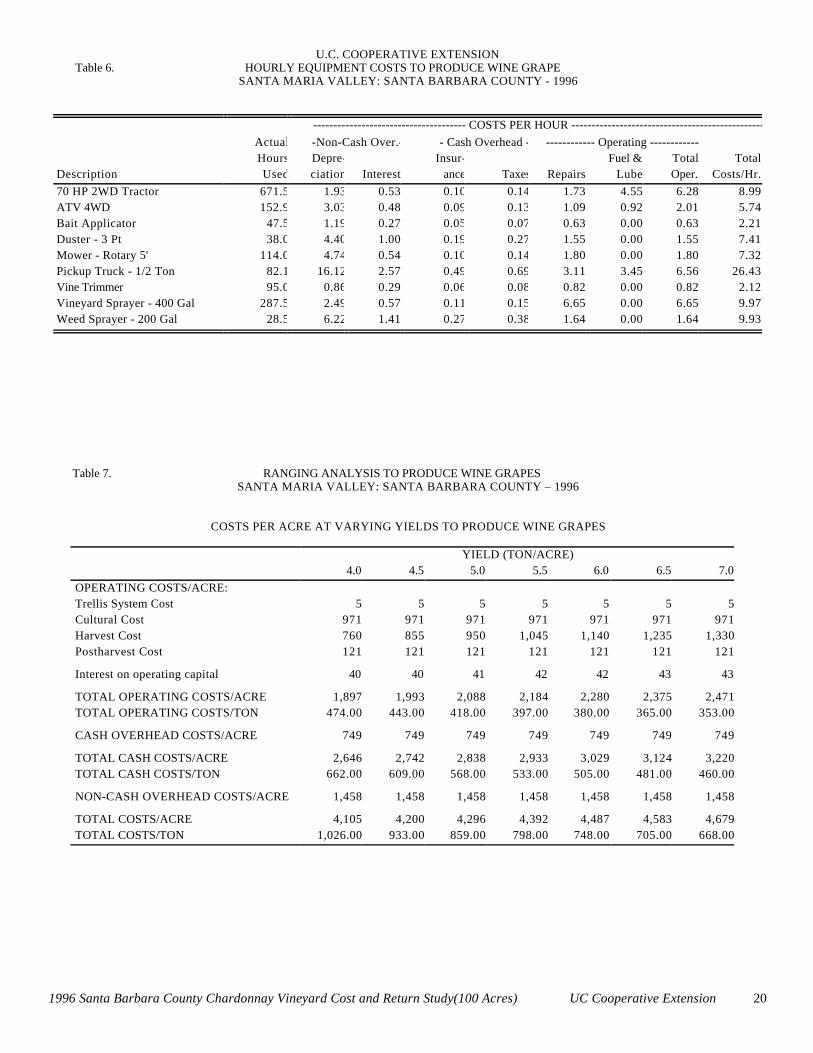
13. EQUIPMENT CASH COSTSEquipment costs are composed of three parts; non-cash overhead, cash overhead, and operating costs.Both of the overhead factors have been discussed in previous sections. The operating costs consist offuel, lubrication, and repairs.
In allocating the equipment costs on a per acre basis, the hourly charges are calculated first and shown inTable 6. Repair costs are based on purchase price, annual hours of use, total hours of life, and repaircoefficients formulated by the American Society of Agricultural Engineers (ASAE). Fuel and lubricationcosts are also determined by ASAE equations based on maximum PTO hp, and type of fuel used. Thefuel and repair cost per acre for each operation in Table 2 is determined by multiplying the total hourlyoperating cost in Table 6 for each piece of equipment used for the cultural practice by the number ofhours per acre for that operation. Tractor time is 10% higher than implement time for a given operationto account for setup time. Prices for on-farm delivery of diesel and gasoline are $1.15 and $1.20 pergallon, respectively.
1996 Santa Barbara County Chardonnay Vineyard Cost and Return Study(100 Acres) UC Cooperative Extension 11
14. ADDENDUM1. Due to rounding, totals may be slightly different from the sum of components.
2. The per acre equipment costs in Table 1 reflect both the value and the level of use (hours and years ofuse) of the machinery complement. Therefore this cost could be different from the per acre value of themachinery complement in Table 4.
.15. ACKNOWLEDGMENT
Appreciation is expressed to Paul Zellman, Staff Research Associate, who was involved at the initialstage of the development of this cost study and Delos Walton, Staff Research Associate, for assisting inthe development of the final report. We also express our appreciation to those growers and othercooperators who provided data for the development of this cost study.
REFERENCES:
1. American Society of Agricultural Engineers. 1992. American Society of Agricultural EngineersStandards Yearbook. St. Joseph, MI.
2. Boelje, Michael D., and Vernon R. Eidman. 1984. Farm Management. John Wiley and Sons. NewYork, NY
3. Statewide IPM Project. 1992. Grape Pest Management. Second ed. Pub. 3343. UC DANR. Oakland,CA.
4. Verdegaal, Paul, Karen Klonsky and Pete Livingston. Sample Costs to Establish a Vineyard andProduce Wine Grapes - Cabernet Sauvignon Variety & Drip Irrigated in the Lodi Appellation ofSacramento and San Joaquin Counties. University of California, Cooperative Extension. 1994.
5. California Agricultural Statistical Service. Section 8 Chardonnay Wine Grape Crush Reports, 1991 -1995. California Department of Food and Agriculture, Sacramento, CA.
1996 Santa Barbara County Chardonnay Vineyard Cost and Return Study(100 Acres) UC Cooperative Extension 12
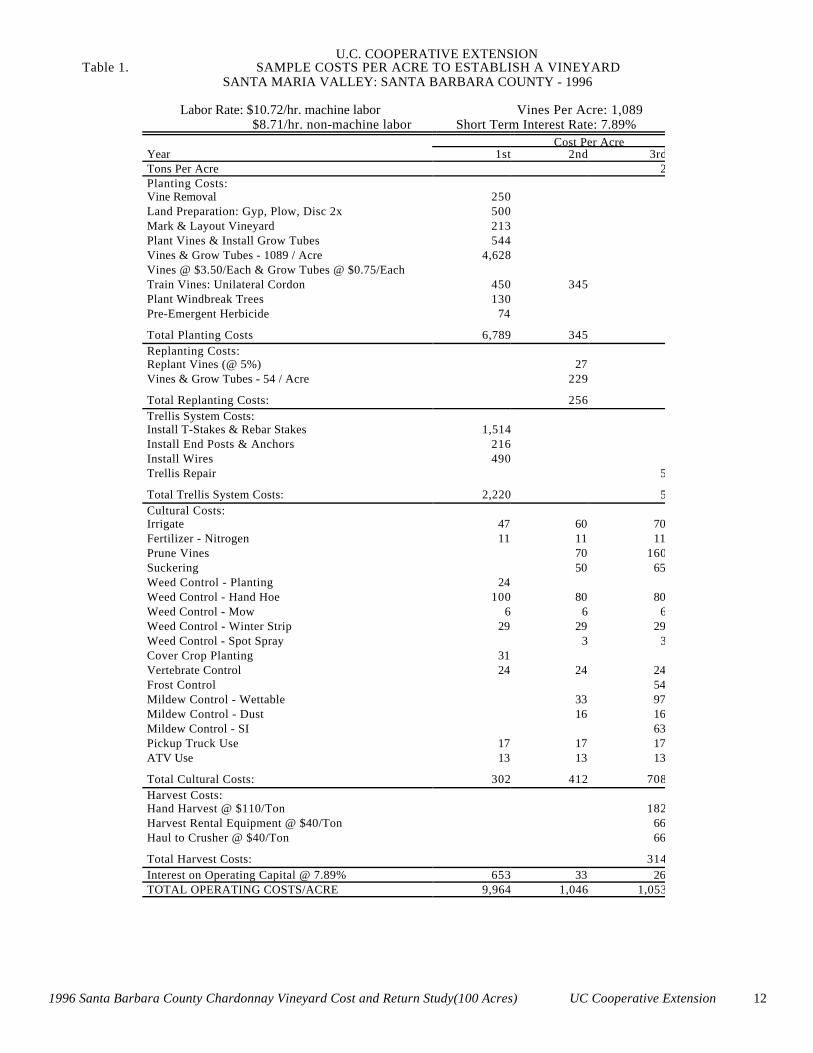
U.C. COOPERATIVE EXTENSION Table 1. SAMPLE COSTS PER ACRE TO ESTABLISH A VINEYARD
SANTA MARIA VALLEY: SANTA BARBARA COUNTY - 1996
Labor Rate: $10.72/hr. machine labor Vines Per Acre: 1,089 $8.71/hr. non-machine labor Short Term Interest Rate: 7.89%
Cost Per AcreYear 1st 2nd 3rdTons Per Acre 2Planting Costs:Vine Removal 250Land Preparation: Gyp, Plow, Disc 2x 500Mark & Layout Vineyard 213Plant Vines & Install Grow Tubes 544Vines & Grow Tubes - 1089 / Acre 4,628Vines @ $3.50/Each & Grow Tubes @ $0.75/EachTrain Vines: Unilateral Cordon 450 345Plant Windbreak Trees 130Pre-Emergent Herbicide 74
Total Planting Costs 6,789 345Replanting Costs:Replant Vines (@ 5%) 27Vines & Grow Tubes - 54 / Acre 229
Total Replanting Costs: 256Trellis System Costs:Install T-Stakes & Rebar Stakes 1,514Install End Posts & Anchors 216Install Wires 490Trellis Repair 5
Total Trellis System Costs: 2,220 5Cultural Costs:Irrigate 47 60 70Fertilizer - Nitrogen 11 11 11Prune Vines 70 160Suckering 50 65Weed Control - Planting 24Weed Control - Hand Hoe 100 80 80Weed Control - Mow 6 6 6Weed Control - Winter Strip 29 29 29Weed Control - Spot Spray 3 3Cover Crop Planting 31Vertebrate Control 24 24 24Frost Control 54Mildew Control - Wettable 33 97Mildew Control - Dust 16 16Mildew Control - SI 63Pickup Truck Use 17 17 17ATV Use 13 13 13
Total Cultural Costs: 302 412 708Harvest Costs:Hand Harvest @ $110/Ton 182Harvest Rental Equipment @ $40/Ton 66Haul to Crusher @ $40/Ton 66
Total Harvest Costs: 314Interest on Operating Capital @ 7.89% 653 33 26TOTAL OPERATING COSTS/ACRE 9,964 1,046 1,053
1996 Santa Barbara County Chardonnay Vineyard Cost and Return Study(100 Acres) UC Cooperative Extension 13
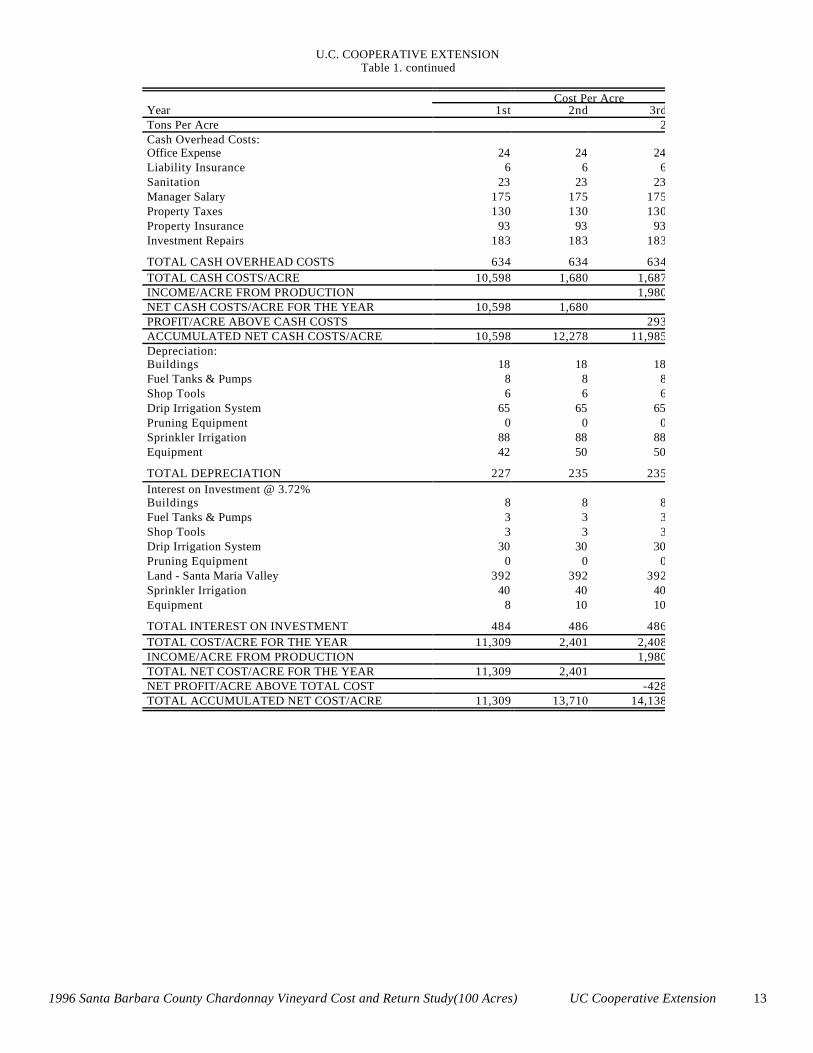
U.C. COOPERATIVE EXTENSIONTable 1. continued
Cost Per AcreYear 1st 2nd 3rdTons Per Acre 2Cash Overhead Costs:Office Expense 24 24 24Liability Insurance 6 6 6Sanitation 23 23 23Manager Salary 175 175 175Property Taxes 130 130 130Property Insurance 93 93 93Investment Repairs 183 183 183
TOTAL CASH OVERHEAD COSTS 634 634 634TOTAL CASH COSTS/ACRE 10,598 1,680 1,687INCOME/ACRE FROM PRODUCTION 1,980NET CASH COSTS/ACRE FOR THE YEAR 10,598 1,680PROFIT/ACRE ABOVE CASH COSTS 293ACCUMULATED NET CASH COSTS/ACRE 10,598 12,278 11,985Depreciation:Buildings 18 18 18Fuel Tanks & Pumps 8 8 8Shop Tools 6 6 6Drip Irrigation System 65 65 65Pruning Equipment 0 0 0Sprinkler Irrigation 88 88 88Equipment 42 50 50
TOTAL DEPRECIATION 227 235 235Interest on Investment @ 3.72%Buildings 8 8 8Fuel Tanks & Pumps 3 3 3Shop Tools 3 3 3Drip Irrigation System 30 30 30Pruning Equipment 0 0 0Land - Santa Maria Valley 392 392 392Sprinkler Irrigation 40 40 40Equipment 8 10 10
TOTAL INTEREST ON INVESTMENT 484 486 486TOTAL COST/ACRE FOR THE YEAR 11,309 2,401 2,408INCOME/ACRE FROM PRODUCTION 1,980TOTAL NET COST/ACRE FOR THE YEAR 11,309 2,401NET PROFIT/ACRE ABOVE TOTAL COST -428TOTAL ACCUMULATED NET COST/ACRE 11,309 13,710 14,138
1996 Santa Barbara County Chardonnay Vineyard Cost and Return Study(100 Acres) UC Cooperative Extension 14
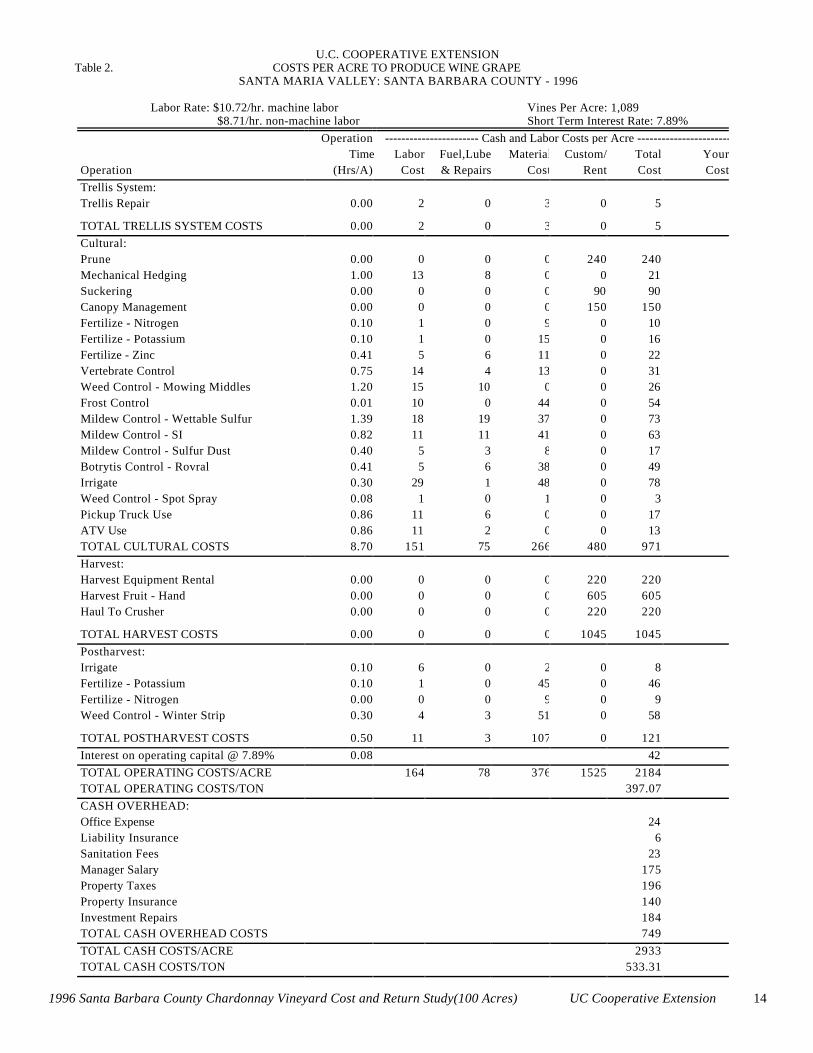
U.C. COOPERATIVE EXTENSION Table 2. COSTS PER ACRE TO PRODUCE WINE GRAPE
SANTA MARIA VALLEY: SANTA BARBARA COUNTY - 1996
Labor Rate: $10.72/hr. machine labor Vines Per Acre: 1,089 $8.71/hr. non-machine labor Short Term Interest Rate: 7.89%
Operation ----------------------- Cash and Labor Costs per Acre -----------------------Time Labor Fuel,Lube Material Custom/ Total Your
Operation (Hrs/A) Cost & Repairs Cost Rent Cost CostTrellis System:Trellis Repair 0.00 2 0 3 0 5
TOTAL TRELLIS SYSTEM COSTS 0.00 2 0 3 0 5Cultural:Prune 0.00 0 0 0 240 240Mechanical Hedging 1.00 13 8 0 0 21Suckering 0.00 0 0 0 90 90Canopy Management 0.00 0 0 0 150 150Fertilize - Nitrogen 0.10 1 0 9 0 10Fertilize - Potassium 0.10 1 0 15 0 16Fertilize - Zinc 0.41 5 6 11 0 22Vertebrate Control 0.75 14 4 13 0 31Weed Control - Mowing Middles 1.20 15 10 0 0 26Frost Control 0.01 10 0 44 0 54Mildew Control - Wettable Sulfur 1.39 18 19 37 0 73Mildew Control - SI 0.82 11 11 41 0 63Mildew Control - Sulfur Dust 0.40 5 3 8 0 17Botrytis Control - Rovral 0.41 5 6 38 0 49Irrigate 0.30 29 1 48 0 78Weed Control - Spot Spray 0.08 1 0 1 0 3Pickup Truck Use 0.86 11 6 0 0 17ATV Use 0.86 11 2 0 0 13TOTAL CULTURAL COSTS 8.70 151 75 266 480 971Harvest:Harvest Equipment Rental 0.00 0 0 0 220 220Harvest Fruit - Hand 0.00 0 0 0 605 605Haul To Crusher 0.00 0 0 0 220 220
TOTAL HARVEST COSTS 0.00 0 0 0 1045 1045Postharvest:Irrigate 0.10 6 0 2 0 8Fertilize - Potassium 0.10 1 0 45 0 46Fertilize - Nitrogen 0.00 0 0 9 0 9Weed Control - Winter Strip 0.30 4 3 51 0 58
TOTAL POSTHARVEST COSTS 0.50 11 3 107 0 121Interest on operating capital @ 7.89% 0.08 42TOTAL OPERATING COSTS/ACRE 164 78 376 1525 2184TOTAL OPERATING COSTS/TON 397.07CASH OVERHEAD:Office Expense 24Liability Insurance 6Sanitation Fees 23Manager Salary 175Property Taxes 196Property Insurance 140Investment Repairs 184TOTAL CASH OVERHEAD COSTS 749TOTAL CASH COSTS/ACRE 2933TOTAL CASH COSTS/TON 533.31
1996 Santa Barbara County Chardonnay Vineyard Cost and Return Study(100 Acres) UC Cooperative Extension 15
U.C. COOPERATIVE EXTENSIONTable 2. continued
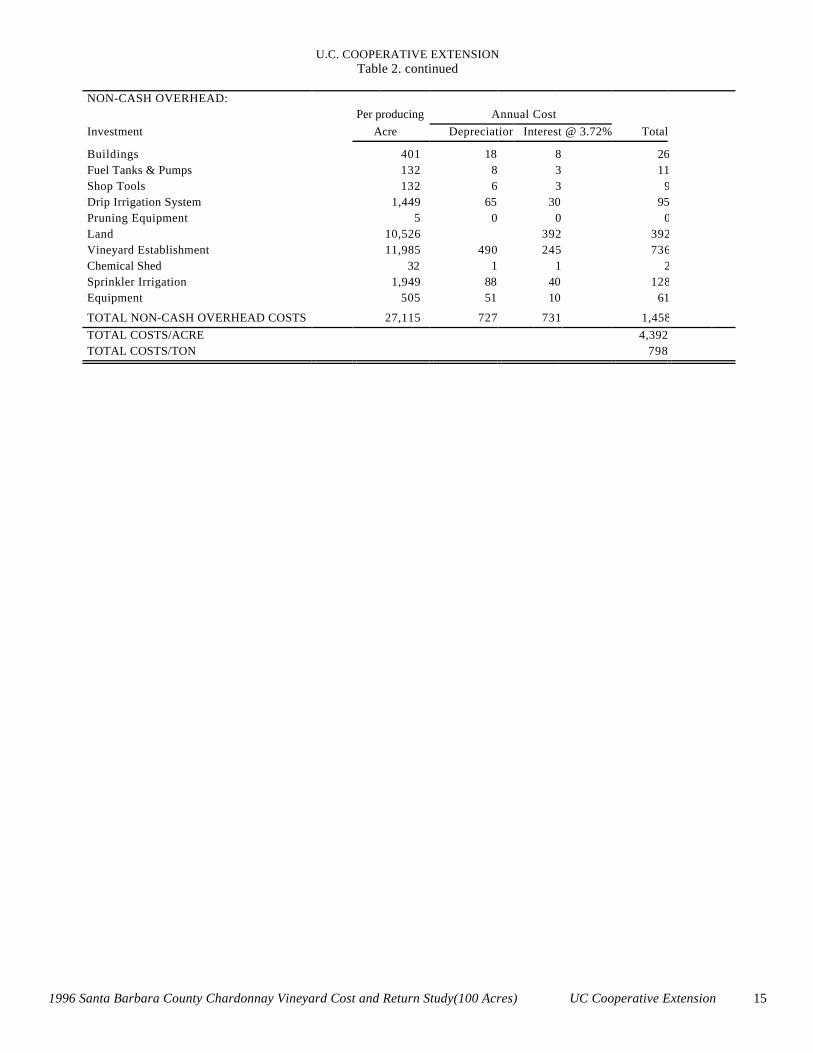
NON-CASH OVERHEAD: Per producing Annual Cost
Investment Acre Depreciation Interest @ 3.72% Total
Buildings 401 18 8 26Fuel Tanks & Pumps 132 8 3 11Shop Tools 132 6 3 9Drip Irrigation System 1,449 65 30 95Pruning Equipment 5 0 0 0Land 10,526 392 392Vineyard Establishment 11,985 490 245 736Chemical Shed 32 1 1 2Sprinkler Irrigation 1,949 88 40 128Equipment 505 51 10 61
TOTAL NON-CASH OVERHEAD COSTS 27,115 727 731 1,458TOTAL COSTS/ACRE 4,392TOTAL COSTS/TON 798
1996 Santa Barbara County Chardonnay Vineyard Cost and Return Study(100 Acres) UC Cooperative Extension 16
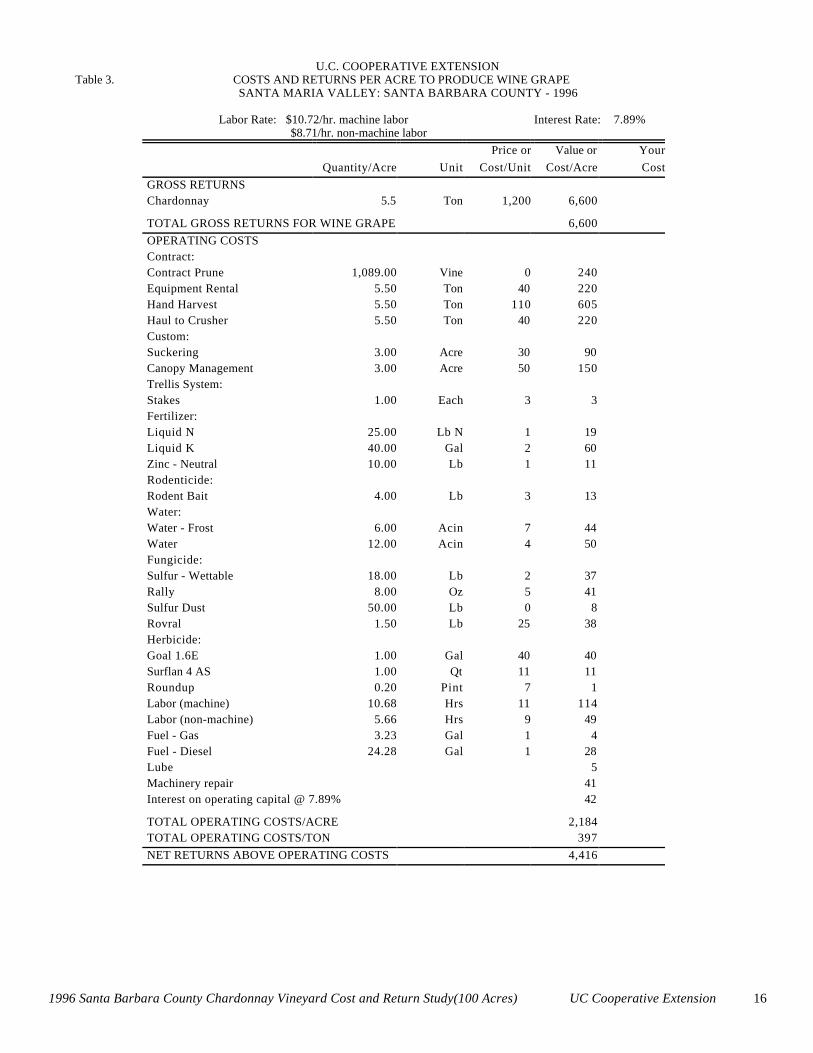
U.C. COOPERATIVE EXTENSION Table 3. COSTS AND RETURNS PER ACRE TO PRODUCE WINE GRAPE
SANTA MARIA VALLEY: SANTA BARBARA COUNTY - 1996
Labor Rate: $10.72/hr. machine labor Interest Rate: 7.89% $8.71/hr. non-machine labor
Price or Value or YourQuantity/Acre Unit Cost/Unit Cost/Acre Cost
GROSS RETURNSChardonnay 5.5 Ton 1,200 6,600
TOTAL GROSS RETURNS FOR WINE GRAPE 6,600OPERATING COSTSContract:Contract Prune 1,089.00 Vine 0 240Equipment Rental 5.50 Ton 40 220Hand Harvest 5.50 Ton 110 605Haul to Crusher 5.50 Ton 40 220Custom:Suckering 3.00 Acre 30 90Canopy Management 3.00 Acre 50 150Trellis System:Stakes 1.00 Each 3 3Fertilizer:Liquid N 25.00 Lb N 1 19Liquid K 40.00 Gal 2 60Zinc - Neutral 10.00 Lb 1 11Rodenticide:Rodent Bait 4.00 Lb 3 13Water:Water - Frost 6.00 Acin 7 44Water 12.00 Acin 4 50Fungicide:Sulfur - Wettable 18.00 Lb 2 37Rally 8.00 Oz 5 41Sulfur Dust 50.00 Lb 0 8Rovral 1.50 Lb 25 38Herbicide:Goal 1.6E 1.00 Gal 40 40Surflan 4 AS 1.00 Qt 11 11Roundup 0.20 Pint 7 1Labor (machine) 10.68 Hrs 11 114Labor (non-machine) 5.66 Hrs 9 49Fuel - Gas 3.23 Gal 1 4Fuel - Diesel 24.28 Gal 1 28Lube 5Machinery repair 41Interest on operating capital @ 7.89% 42
TOTAL OPERATING COSTS/ACRE 2,184TOTAL OPERATING COSTS/TON 397NET RETURNS ABOVE OPERATING COSTS 4,416
1996 Santa Barbara County Chardonnay Vineyard Cost and Return Study(100 Acres) UC Cooperative Extension 17
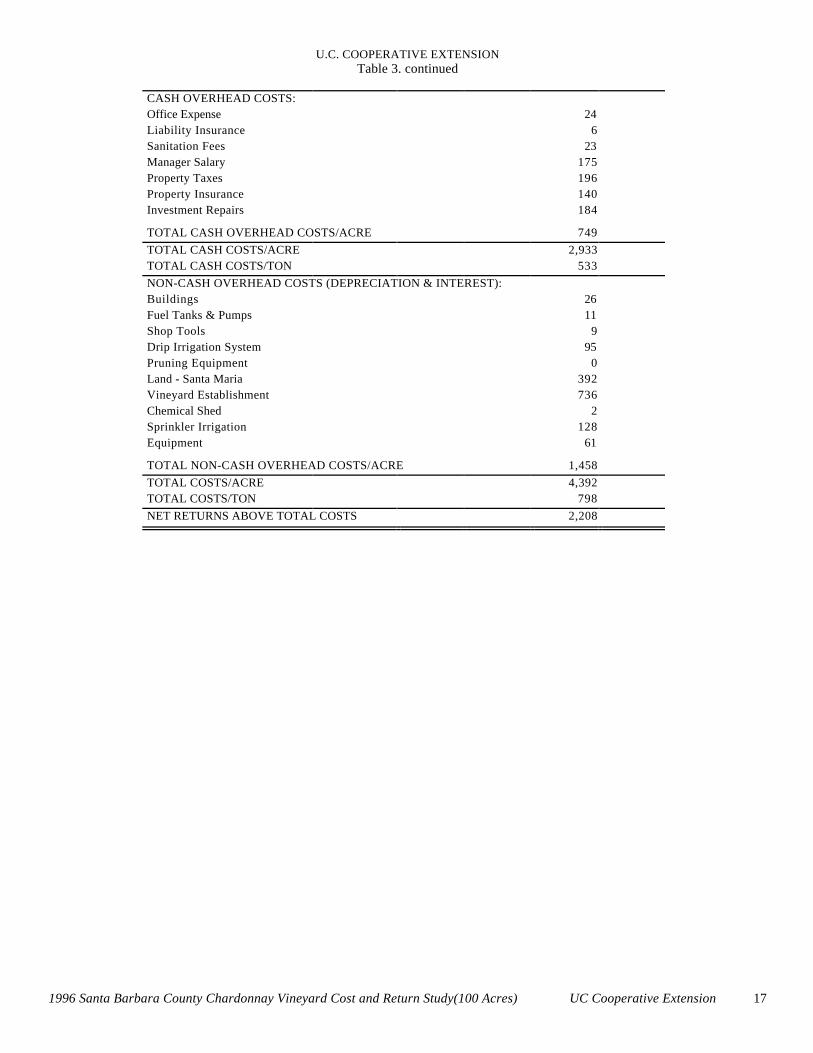
U.C. COOPERATIVE EXTENSIONTable 3. continued
CASH OVERHEAD COSTS:Office Expense 24Liability Insurance 6Sanitation Fees 23Manager Salary 175Property Taxes 196Property Insurance 140Investment Repairs 184
TOTAL CASH OVERHEAD COSTS/ACRE 749TOTAL CASH COSTS/ACRE 2,933TOTAL CASH COSTS/TON 533NON-CASH OVERHEAD COSTS (DEPRECIATION & INTEREST):Buildings 26Fuel Tanks & Pumps 11Shop Tools 9Drip Irrigation System 95Pruning Equipment 0Land - Santa Maria 392Vineyard Establishment 736Chemical Shed 2Sprinkler Irrigation 128Equipment 61
TOTAL NON-CASH OVERHEAD COSTS/ACRE 1,458TOTAL COSTS/ACRE 4,392TOTAL COSTS/TON 798NET RETURNS ABOVE TOTAL COSTS 2,208
1996 Santa Barbara County Chardonnay Vineyard Cost and Return Study(100 Acres) UC Cooperative Extension 18
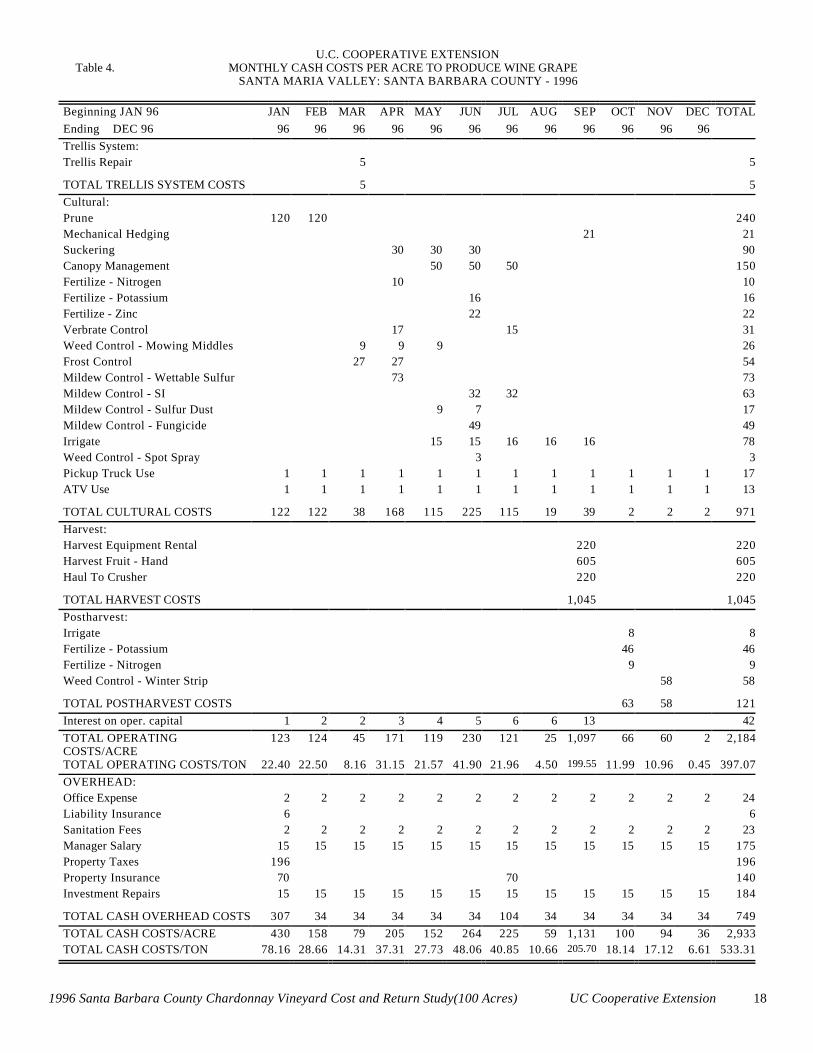
U.C. COOPERATIVE EXTENSION Table 4. MONTHLY CASH COSTS PER ACRE TO PRODUCE WINE GRAPE
SANTA MARIA VALLEY: SANTA BARBARA COUNTY - 1996
Beginning JAN 96 JAN FEB MAR APR MAY JUN JUL AUG SEP OCT NOV DEC TOTALEnding DEC 96 96 96 96 96 96 96 96 96 96 96 96 96Trellis System:Trellis Repair 5 5
TOTAL TRELLIS SYSTEM COSTS 5 5Cultural:Prune 120 120 240Mechanical Hedging 21 21Suckering 30 30 30 90Canopy Management 50 50 50 150Fertilize - Nitrogen 10 10Fertilize - Potassium 16 16Fertilize - Zinc 22 22Verbrate Control 17 15 31Weed Control - Mowing Middles 9 9 9 26Frost Control 27 27 54Mildew Control - Wettable Sulfur 73 73Mildew Control - SI 32 32 63Mildew Control - Sulfur Dust 9 7 17Mildew Control - Fungicide 49 49Irrigate 15 15 16 16 16 78Weed Control - Spot Spray 3 3Pickup Truck Use 1 1 1 1 1 1 1 1 1 1 1 1 17ATV Use 1 1 1 1 1 1 1 1 1 1 1 1 13
TOTAL CULTURAL COSTS 122 122 38 168 115 225 115 19 39 2 2 2 971Harvest:Harvest Equipment Rental 220 220Harvest Fruit - Hand 605 605Haul To Crusher 220 220
TOTAL HARVEST COSTS 1,045 1,045Postharvest:Irrigate 8 8Fertilize - Potassium 46 46Fertilize - Nitrogen 9 9Weed Control - Winter Strip 58 58
TOTAL POSTHARVEST COSTS 63 58 121Interest on oper. capital 1 2 2 3 4 5 6 6 13 42TOTAL OPERATINGCOSTS/ACRE
123 124 45 171 119 230 121 25 1,097 66 60 2 2,184
TOTAL OPERATING COSTS/TON 22.40 22.50 8.16 31.15 21.57 41.90 21.96 4.50 199.55 11.99 10.96 0.45 397.07OVERHEAD:Office Expense 2 2 2 2 2 2 2 2 2 2 2 2 24Liability Insurance 6 6Sanitation Fees 2 2 2 2 2 2 2 2 2 2 2 2 23Manager Salary 15 15 15 15 15 15 15 15 15 15 15 15 175Property Taxes 196 196Property Insurance 70 70 140Investment Repairs 15 15 15 15 15 15 15 15 15 15 15 15 184
TOTAL CASH OVERHEAD COSTS 307 34 34 34 34 34 104 34 34 34 34 34 749TOTAL CASH COSTS/ACRE 430 158 79 205 152 264 225 59 1,131 100 94 36 2,933TOTAL CASH COSTS/TON 78.16 28.66 14.31 37.31 27.73 48.06 40.85 10.66 205.70 18.14 17.12 6.61 533.31
1996 Santa Barbara County Chardonnay Vineyard Cost and Return Study(100 Acres) UC Cooperative Extension 19
U.C. COOPERATIVE EXTENSION Table 5. WHOLE FARM ANNUAL EQUIPMENT, INVESTMENT, AND BUSINESS OVERHEAD COSTS
SANTA MARIA VALLEY: SANTA BARBARA COUNTY - 1996
ANNUAL EQUIPMENT COSTS
- Non-CashOver. - - Cash Overhead -
Yrs Depre- Insur-Description Price Life ciation Interest ance Taxes Total
9670 HP 2WD Tractor 28,850 12 2,164 590 113 159 3,02696ATV 4WD 6,000 7 771 123 24 33 95196Bait Applicator 1,046 10 94 21 4 6 12596Duster - 3 Pt 3,093 10 278 63 12 17 37196Mower - Rotary 5' 5,000 5 900 102 20 28 1,04996Pickup Truck - 1/2 Ton 17,160 7 2,206 351 67 94 2,71996Vine Trimmer 2,282 15 137 47 9 13 20596Vineyard Sprayer - 400 Gal 13,266 10 1,194 271 52 73 1,59096Weed Sprayer - 200 Gal 3,282 10 295 67 13 18 393
TOTAL 79,979 8,040 1,636 314 440 10,430
60% of New Cost * 47,987 4,824 982 188 264 6,258
* Used to reflect a mix of new and used equipment.
ANNUAL INVESTMENT COSTS
- Non-Cash Over. - -------- Cash Overhead --------Yrs Depre- Insur-
Description Price Life ciation Interest ance Taxes Repairs TotalINVESTMENTBuildings 38,100 20 1,715 780 149 210 762 3,615Chemical Shed 3,000 20 135 61 12 16 60 285Drip Irrigation System 137,625 20 6,193 2,816 540 757 6,881 17,187Fuel Tanks & Pumps 12,500 15 750 256 49 69 250 1,374Land 1,000,000 37,200 7,130 10,000 0 54,330Pruning Equipment 500 20 23 10 2 3 10 47Shop Tools 12,500 20 563 256 49 69 250 1,186Sprinkler Irrigation 185,110 20 8,330 3,787 726 1,018 9,256 23,117Vineyard Establishment 1,138,575 22 46,578 23,295 4,465 6,262 0 80,600
TOTAL INVESTMENT 2,527,910 64,286 68,461 13,122 18,404 17,469 181,741
ANNUAL BUSINESS OVERHEAD COSTS
Units/ Price/ TotalDescription Farm Unit Unit CostLiability Insurance 1.00 Each 600.00 600Manager Salary 95.00 Acre 175.00 16,625Office Expense 95.00 Acre 24.00 2,280Sanitation Fees 2.00 Each 1,116.00 2,232
1996 Santa Barbara County Chardonnay Vineyard Cost and Return Study(100 Acres) UC Cooperative Extension 20
U.C. COOPERATIVE EXTENSION Table 6. HOURLY EQUIPMENT COSTS TO PRODUCE WINE GRAPE
SANTA MARIA VALLEY: SANTA BARBARA COUNTY - 1996
-------------------------------------- COSTS PER HOUR ------------------------------------------------Actual -Non-Cash Over.- - Cash Overhead - ------------ Operating ------------Hours Depre- Insur- Fuel & Total Total
Description Used ciation Interest ance Taxes Repairs Lube Oper. Costs/Hr.70 HP 2WD Tractor 671.5 1.93 0.53 0.10 0.14 1.73 4.55 6.28 8.99ATV 4WD 152.9 3.03 0.48 0.09 0.13 1.09 0.92 2.01 5.74Bait Applicator 47.5 1.19 0.27 0.05 0.07 0.63 0.00 0.63 2.21Duster - 3 Pt 38.0 4.40 1.00 0.19 0.27 1.55 0.00 1.55 7.41Mower - Rotary 5' 114.0 4.74 0.54 0.10 0.14 1.80 0.00 1.80 7.32Pickup Truck - 1/2 Ton 82.1 16.12 2.57 0.49 0.69 3.11 3.45 6.56 26.43Vine Trimmer 95.0 0.86 0.29 0.06 0.08 0.82 0.00 0.82 2.12Vineyard Sprayer - 400 Gal 287.5 2.49 0.57 0.11 0.15 6.65 0.00 6.65 9.97Weed Sprayer - 200 Gal 28.5 6.22 1.41 0.27 0.38 1.64 0.00 1.64 9.93
Table 7. RANGING ANALYSIS TO PRODUCE WINE GRAPESSANTA MARIA VALLEY: SANTA BARBARA COUNTY – 1996
COSTS PER ACRE AT VARYING YIELDS TO PRODUCE WINE GRAPES
YIELD (TON/ACRE)4.0 4.5 5.0 5.5 6.0 6.5 7.0
OPERATING COSTS/ACRE:Trellis System Cost 5 5 5 5 5 5 5Cultural Cost 971 971 971 971 971 971 971Harvest Cost 760 855 950 1,045 1,140 1,235 1,330Postharvest Cost 121 121 121 121 121 121 121
Interest on operating capital 40 40 41 42 42 43 43
TOTAL OPERATING COSTS/ACRE 1,897 1,993 2,088 2,184 2,280 2,375 2,471TOTAL OPERATING COSTS/TON 474.00 443.00 418.00 397.00 380.00 365.00 353.00
CASH OVERHEAD COSTS/ACRE 749 749 749 749 749 749 749
TOTAL CASH COSTS/ACRE 2,646 2,742 2,838 2,933 3,029 3,124 3,220TOTAL CASH COSTS/TON 662.00 609.00 568.00 533.00 505.00 481.00 460.00
NON-CASH OVERHEAD COSTS/ACRE 1,458 1,458 1,458 1,458 1,458 1,458 1,458
TOTAL COSTS/ACRE 4,105 4,200 4,296 4,392 4,487 4,583 4,679TOTAL COSTS/TON 1,026.00 933.00 859.00 798.00 748.00 705.00 668.00
1996 Santa Barbara County Chardonnay Vineyard Cost and Return Study(100 Acres) UC Cooperative Extension 21
U.C. COOPERATIVE EXTENSION Table 7. Continued
NET RETURNS PER ACRE ABOVE OPERATING COSTS FOR WINE GRAPES
PRICE YIELD (TON/ACRE)(DOLLARS PER TON) 4.0 4.5 5.0 5.5 6.0 6.5 7.0
900 1,703 2,057 2,412 2,766 3,120 3,475 3,8291,000 2,103 2,507 2,912 3,316 3,720 4,125 4,5291,100 2,503 2,957 3,412 3,866 4,320 4,775 5,2291,200 2,903 3,407 3,912 4,416 4,920 5,425 5,9291,300 3,303 3,857 4,412 4,966 5,520 6,075 6,6291,400 3,703 4,307 4,912 5,516 6,120 6,725 7,3291,500 4,103 4,757 5,412 6,066 6,720 7,375 8,029
NET RETURNS PER ACRE ABOVE CASH COSTS FOR WINE GRAPES
PRICE YIELD (TON/ACRE)(DOLLARS PER TON) 4.0 4.5 5.0 5.5 6.0 6.5 7.0
900 954 1,308 1,662 2,017 2,371 2,726 3,0801,000 1,354 1,758 2,162 2,567 2,971 3,376 3,7801,100 1,754 2,208 2,662 3,117 3,571 4,026 4,4801,200 2,154 2,658 3,162 3,667 4,171 4,676 5,1801,300 2,554 3,108 3,662 4,217 4,771 5,326 5,8801,400 2,954 3,558 4,162 4,767 5,371 5,976 6,5801,500 3,354 4,008 4,662 5,317 5,971 6,626 7,280
NET RETURNS PER ACRE ABOVE TOTAL COSTS FOR WINE GRAPES
PRICE YIELD (TON/ACRE)(DOLLARS PER TON) 4.0 4.5 5.0 5.5 6.0 6.5 7.0
900 -505 -150 204 558 913 1,267 1,6211,000 -105 300 704 1,108 1,513 1,917 2,3211,100 295 750 1,204 1,658 2,113 2,567 3,0211,200 695 1,200 1,704 2,208 2,713 3,217 3,7211,300 1,095 1,650 2,204 2,758 3,313 3,867 4,4211,400 1,495 2,100 2,704 3,308 3,913 4,517 5,1211,500 1,895 2,550 3,204 3,858 4,513 5,167 5,821