Embed Size (px)
Citation preview

2005 Smith Barney Business Services ConferenceMay 12, 2005

1
Forward Looking StatementsForward Looking Statements
This presentation contains statements that are forward looking within the meaning of the Private Securities Litigation Reform Act of 1995. These statements should be considered as estimates only and actual results may ultimately differ from these estimates. Except to the extent required by applicable securities laws, CB Richard Ellis Group, Inc. undertakes no obligation to update or publicly revise any of the forward-looking statements that you may hear today. Please refer to our annual report on Form 10-K and our quarterly reports on Form 10-Q, which are filed with the SEC and available at the SEC’s Web site (http://www.sec.gov), for a full discussion of the risks and other factors, that may impact any estimates that you may hear today. We may make certain statements during the course of this presentation which include references to “non-GAAP financial measures,” as defined by SEC regulations. As required by these regulations, we have providedreconciliations of these measures to what we believe are the most directly comparable GAAP measures, which are attached hereto within the appendix.

2
ParticipantsParticipants
Brett White – President
Ken Kay – Senior Executive Vice President and Chief Financial Officer

3
Overview

4
2x 2x nearest competitorThousands of clients, more than 70% of Fortune 100Q1 2005 Revenue of $538.3 million Q1 2005 Normalized EBITDA of $52.7 million(1)
Strong organic revenue and earnings growth for 2005
#1#1 commercial real estate brokerage
#1#1 appraisal and valuation
#1#1 property and facilities management
#2#2 commercial mortgage brokerage
$15.1$15.1 billion in investment assets under management
Leading Global Brand
Leading Global Brand
Broad Capabilities
Broad Capabilities
Scale, Diversity and Earnings
Power
Scale, Diversity and Earnings
Power
9999 years
50 50 countries
#1#1 in key cities in U.S., Europe and Asia
(1) Excludes integration costs.
The World Class Commercial Real Estate Services ProviderThe World Class Commercial Real Estate Services Provider

5
Global Reach & Local LeadershipGlobal Reach & Local Leadership
CBRE is unique in offering customers global coverage and leading local expertise.CBRE is unique in offering customers global coverage and leading local expertise.
2004 Revenue by Region
New York
London
Los Angeles
Chicago
Sydney
Paris
Washington, D.C.
Madrid
Singapore
LeadingMarket Positions
70%
19%
4%
Americas
AsiaPacific
EMEA7%
Global Investors

6
Diversified Blue Chip Client BaseDiversified Blue Chip Client Base
Indiv iduals/Partnerships
Top 20 customers are less than 9% of total revenue.Top 20 customers are less than 9% of total revenue.
2004 Revenue by Client Type Representative Clients
Corporate
REITS
InsuranceCompanies/
Banks
PensionFunds
Gov ernmentOther
Conduits/Wall St. Firms
Equity/ Opportunity
Funds
Offshore Investors 9%3%
4%
9%
5%
4%
4%27%
19%
16%

7
Full Services PlatformFull Services Platform
Advisory Services
Leasing, sales, divestitures Commission
Revenue Generation
Mortgage brokerage Commission and Servicing Fees
Valuations, appraisals, research
Assignment and Subscription Fees
2004Americas Revenue
Outsourcing Services
Manages properties for owners
Contractual
Revenue Generation
Comprehensive corporate real estate services
Contractual
77%
6%4%
13%

8
JLL 1.4%
TCC 1.8%GBE 1.3%
C&W 2.7%CBRE 5.0%
Other / 3rd Party 61%
$23 Billion US Commercial Real Estate Services Industry (1)
U.S. Market ShareTop 5 = 14.3% Share
Self-Providers 25%
Fragmented IndustryFragmented Industry
Source: External public filings and management es timates as of 12/31/04.(1) Excludi ng investment management.
The market has grown at a 4.3% CAGR from 1994 to 2004.
CBRE 6.9%
JLL 1.0%
GBE 1.4%
TCC 1.8%
C&W 3.2%

9
30%
11%
1%
10%
(2% )
2%
8%
43%
Superior Platform Drives OutperformanceSuperior Platform Drives Outperformance
Our full-service, global platform has allowed us to outperform competitors.Our full-service, global platform has allowed us to outperform competitors.
Competitive Landscape
Services Platform
CBRECBRE
JLLJLL
C&WC&WTCCTCC
Glo
bal R
each
Q1 2002 TTM - Q1 2005 TTM CAGR
(1) Excluding merger related costs, integration costs and one-time IPO compensation expense.
(2) Average based on ABM, ACN, ADP, CEN, FDC, KELYA, MAN, PAYX, RHI, and RMK.
TCCJLLCBRE(1 )
Revenue EBITDA
Best In Class
BusinessServices(2)
CBG JLL TCC Business Services (2)
FY05 P/E(as of 5/6/05) 15.6x 16.8x 17.6x 20.3x

10
Capitalize on Favorable Industry ConditionsCapitalize on Favorable Industry Conditions
Improving Outlook
Source: Torto Wheaton Research’s Overview and Outlook (Office). Data as of Q4 2004.
5.75.54.2
2.92.8
0.4
(7.4)(8.0)(7.2)
13.8
7.37.2
(10)
(5)
0
5
10
15
20
Perc
enta
ge
Vacancy Rate Rent Rates
1998 1999 2000 2001 2002 2003 2004 2005E 2006E 2007E 2008E 2009E

11
THE AMERICAS — Market DynamicsTHE AMERICAS — Market DynamicsCANADAOverall stable economic growth across Canada, especially in the natural resource sectors. Strong investment market activity with increased demand from foreign investors.
USA – SOUTHERN CALIFORNIAFastest growing industrial real estate market in the US fueled by the bustling LA ports and heavy institutional investment. Office leasing market is steadily improving amid minimal new construction coupled with corporate expansion.
MEXICOThe manufacturing sector expanded robustly in 2004 led by growing demand for finished goods from the U.S. The overall office market has improved slightly over the past year with the vacancy rate beginning to drop and stable rents holding. BRAZIL
The stability of the national currency against the U.S. dollar, together with the steady improvement of the GDP, played a key role in the increase in the occupancy of office space in São Paulo and Rio de Janeiro.
USA – WASHINGTON D.C.The strongest office market in the US, with vacancy below 8% and active new construction occurring. A very aggressive office investment market with per square foot prices reaching above the $400 mark.
USA – NEW YORKManhattan leads the U.S. in overall CBD office sales, with more than $11 bill ion in transactions in 2004. Office vacancies in Midtown are dropping with rents beginning to increase while Downtown continues to slowly improve.
USA – CHICAGOThe investment market for office and industrial properties remains very strong. New industrial construction continues to increase.

12
EMEA — Market Dynamics EMEA — Market Dynamics
UNITED KINGDOMRecord level of investment in 2004. London was one of the first markets in Europe to show improvement in office rents
FRANCEGradual economic improvement filtering into office and retail markets. Strong interest from foreign investors, especially in Paris
GERMANYEconomy continues to hamper recovery in occupational markets. German open-ended funds remain active investors abroad
SPAINStrong occupier demand boosts prospects for Madrid and Barcelona office markets. Local investors are particularly active purchasers ITALY
Foreign investment rising, with increasing interest in the office market despite weak occupational indicators
EASTERN EUROPEStrong economic growth and maturing
property markets translates into record levels of investment
SWEDENHealthy economic and real estate prospects boost investment in property markets to the third highest level in the EU-15 in 2004

13
ASIA-PACIFIC — Market DynamicsASIA-PACIFIC — Market Dynamics
CHINAVigorous demand for off ice and industrial space from financial services, insurance industry, logistics, retailing and technology companies
JAPANContinue to draw domestic and offshore funds, and the interest in Japanese property/ REITs remains very keen
INDIAWorldw ide surge in outsourcing boosted off ice markets and occupier demand in general
SOUTH KOREAInvestment market remains yield driven, especially in the off ice sector
SINGAPORELocal REITS have strong appetite for industrial and retail properties. Singapore investors are very influential across Asia
AUSTRALIA & NEW ZEALANDPublicly-listed REITs continued to drive investment sales demand. Investor demand remains strong in all sectors. Off ice leasing activity is on the rebound.

14
Rents Falling
Rents Bottoming
Out
Rental Growth
Accelerating
Rental Growth
Maturing
Brussels
Amsterdam
Washington D.C.
Paris
Stockholm
London
Munich
Berlin B
B
L
S
W
A
MP
• The markets do not necessarily move along the curve in the same direction or at the same speed
Source: CB Richard Ellis
Los AngelesL
MadridM
Markets Clustering at Bottom of CycleMarkets Clustering at Bottom of Cycle
DDallas
N New York
HHong Kong
SSeoul
T Tokyo
M Milan

15
Key Growth Strategies

16
Growth DriversGrowth Drivers
INDUSTRY TRENDS RELATED STRATEGY
Increased vendor consolidation
Capitalize on cross-selling opportunities
Leverage geographic diversity of platform
Capitalize on breadth of service offerings
Selectively seek infill acquisition opportunities
Corporate outsourcing
Single point of contact management
Emphasize multi-market/cross-border capabilities
Focus on Fortune 500 penetration
Invest in enabling IT platforms
Increased capital allocations to real estate
Leverage demographic-driven investment trends and globalization of capital flows
Leverage expertise across all property types
Aggregate the fragmented private client market
Institutional ownership of real estate
Match risk/return profiles
Develop innovative investment vehicles
Grow assets under management
Capitalize on “feet on the ground” global platform

17
Promote Cross-SellingPromote Cross-Selling
$5.1
$4.3
$3.6
$2.4
$5.7
2000 2001 2002 2003 2004
($ in millions)
Facilities Management
Lease Administration
Transaction Management
Project Management
Strategic Planning
Location Consulting
23.4M square feet of facilities managed, 60% growth since 2000
117% growth in project management (2003 over 2000)
CBRE’s client-share has increased 50% and fees doubled over past four years
Initial Services
CurrentServices
CAGR: 24.1%
Rev
enue
s

18
Service Provider ConsolidationService Provider Consolidation
Single point of contact11 million sq. ft. under managementProvide services in all 50 states
No Centralized Management
Strategic RelationshipTactical Relationship
Exclusive Transaction Management Provider
Additional Services- Property Management- Consulting- Appraisals/Valuation
Occasional Brokerage Transactions
CBREMultiple Service Providers
20051985
A CBRE Client for 20 YearsA CBRE Client for 20 Years
Average Revenue Increase of 54% 1
1 Period covering 2000 - 2004

19
Grow Investment Management BusinessGrow Investment Management Business
Real Estate Institutional Ownership($ in billions)
CAGR: 8.2% $15.1$14.4
$11.4
$10.0$10.3
$8.6
$6.1
1998 1999 2000 2001 2002 2003 2004
CBRE’s Assets Under Management($ in billions)
CAGR: 17.1%
$479.3
$423.0$402.8
$372.7$378.7$360.9$349.5
$320.6
$254.4
1996 1997 1998 1999 2000 2001 2002 2003 2004
Source: Institutional Real Estate, Inc.Note: Ownership shown as of June 30th.
Substantial cross-selling of services currently drives approximately $50 million in revenue for CBRE.
Substantial cross-selling of services currently drives approximately $50 million in revenue for CBRE.
Note: Assets under management for 1998-2004 shown as of December 31st.

20
Financial Overview

21
Consistent Long Term GrowthConsistent Long Term Growth
($ in millions)
CBRE has consistently outpaced industry growth. CBRE has consistently outpaced industry growth.
$90.1
$127.2 $117.4
$150.5
$115.0$130.7
$183.2
$300.3$327.6
$20.2 $25.9 $33.7 $41.5$62.0
Organic A cquis ition Normalized EB ITDA
1992 1993 1994 1995 1996 1997 1998 1999 2000 2001 2002 2003 2004
$360$429 $468
$583$730
$1,035
$1,213$1,324
$1,171 $1,170
$1,630
$2,365
$392
TTM Q1 2005
$2,462
(1)
Average Annual Organic Growth: 9%
(1) Normalized EBITDA excludes merger related costs, integration costs and one-time IPO compensation expense.

22
Q1 2005 Business Performance Highlights Q1 2005 Business Performance Highlights
Record Q1 2005 Performance
Q1 2004 Q1 2005
$441.0$538.3
22%
(In millions except EPS)
$25.4$52.7
107%
Revenue Normalized EBITDA1
1. Normalized EBITDA, net income and earnings per share exclude one-time items related to the Insignia acquisition and debt buy-back charges.2. Diluted earnings per share.
($2.6)
$19.0
831%
($0.03)
$0.25
933%
Normalized Net Income1 Normalized EPS1,2

23
34%
38%
9%
8%6% 4% 1%
($ in millions) 2005 2004 % ChangeSales 182.1 138.7 31Leasing 205.5 192.2 7Property and Facilities Management 50.2 43.4 16Appraisal and Valuation 41.1 30.8 33Commercial Mortgage Brokerage 31.1 15.2 105Investment Management 21.1 16.9 25Other 7.2 3.8 89Total 538.3 441.0 22
Q1 2005 Revenue Breakdown Q1 2005 Revenue Breakdown

24
0.0
4.0
8.0
12.0
16.0
2004 2005
2004 10.6
2005 13.3
TTM 1st Quarter EBITDA Mar gin
Continued margin improvement due to:
Robust revenue growth
Operating leverage
EBITDA margins improved by approximately 25% above the same quarter last year
Notes:EBITDA margins exclude one-time merger-related charges and integration expenses.The 2004 TTM margin includes the combined company results for the second quarter of 2003 which was prior to the acquisition of Insignia. Hence, the EBITDA margin for TTM 2004 is presented for informational purposes only and does not purport to represent what CB Richard Ellis’ combined company EBITDA margin would have been had the Insignia acquisition in fact occurred prior to the third quarter of 2003.
Q1 2005 Trailing Twelve Months Normalized EBITDA MarginsQ1 2005 Trailing Twelve Months Normalized EBITDA Margins

25
($ in millions) 3/31/05 12/31/2004 Variance
Cash 157.8 256.9 (99.1)
Tranche B loan 274.1 277.1 (3.0)
Other debt1 21.2 22.5 (1.3)
93/4% senior notes 130.0 130.0 -
111/4% senior subordinated notes2 179.0 205.0 (26.0)
Total debt 604.3 634.6 (30.3)
Stockholders' equity 579.5 560.0 19.5
Total capitalization 1,183.8 1,194.6 (10.8)
Total net debt 446.5 377.7 68.8
As of
1. Excludes $43.8 million and $138.2 million of warehouse f acility at March 31, 2005 and December 31, 2004, respectively, and $2.1 million of non-recourse debt relating to an inv estment in Europe at March 31, 2005.
2. The 2005 balance does not reflect $10.1 million of additional notes repurchased in the 2nd quarter of 2005.
Capitalization Capitalization

26

27
Strong cash flow generator
Low capital intensity
Utilization of internal cash flow
Debt reductionCo-investment activitiesIn-fill acquisitions
Internal Cash Flow
-
20
40
60
80
100
120
140
160
180
200
($ millions)
48
140
Net Income, as adjusted
D&A Cap Ex
(30)
158
1. Excludes capital expenditures, net of concessions, of $5.5 million related to the integration of Insignia.
1
Q1 2005 Trailing Twelve Months Normalized Internal Cash Flow Q1 2005 Trailing Twelve Months Normalized Internal Cash Flow

28
Key Drivers of Earnings GrowthKey Drivers of Earnings Growth
Revenue Growth
Margin Expansion
Market growth
Market share gains
7% - 9% annual revenue growth
Operating leverage12% - 14% annual EBITDA growth
DeleveragingBalance Sheet
Minimum $50 million debt paydown targeted
Revenue growth, margin expansion and deleveraging allow CBRE to achieve substantial earnings growth.
Revenue growth, margin expansion and deleveraging allow CBRE to achieve substantial earnings growth.
=++Significant
EPS Growth
High teens to low 20% annual EPS growth

29
Remember Who We AreRemember Who We Are
A growth-oriented business services enterprise with more than 200 offices around the worldA full service provider with a diverse suite of services to address any commercial real estate needMore than 2X the size of our nearest competitor in terms of 2004 revenueFocused on growing existing client relationships through cross-selling opportunities and a multi-market approachFocused on outperforming the industry in terms of margin expansion and market penetrationAble to significantly leverage our operating structureA strong cash flow generator
Asset intensive
Capital intensiveA REIT or direct property ownerDependent on a few markets, producers or clientsInterest rate dependent
We are: We are not:

30
Appendix

31
Three Months Ended March 31,($ in millions) 2005 2004Normalized EBITDA 52.7 25.4
Less:Merger-related charges related to the Insignia acquisition
- 10.0
Integration costs related to the Insignia acquisition 2.5 5.3
EBITDA 50.2 10.1
Add: Interest income 2.5 1.3 Less: Depreciation and amortization 10.4 16.8 Interest expense 13.6 19.7 Loss on extinguishment of debt 4.9 - Provision (benefit) for income taxes 9.2 (8.5) Net income (loss) 14.6 (16.6)
Reconciliation of Normalized EBITDA to EBITDA to Net Income (Loss)Reconciliation of Normalized EBITDA to EBITDA to Net Income (Loss)
32
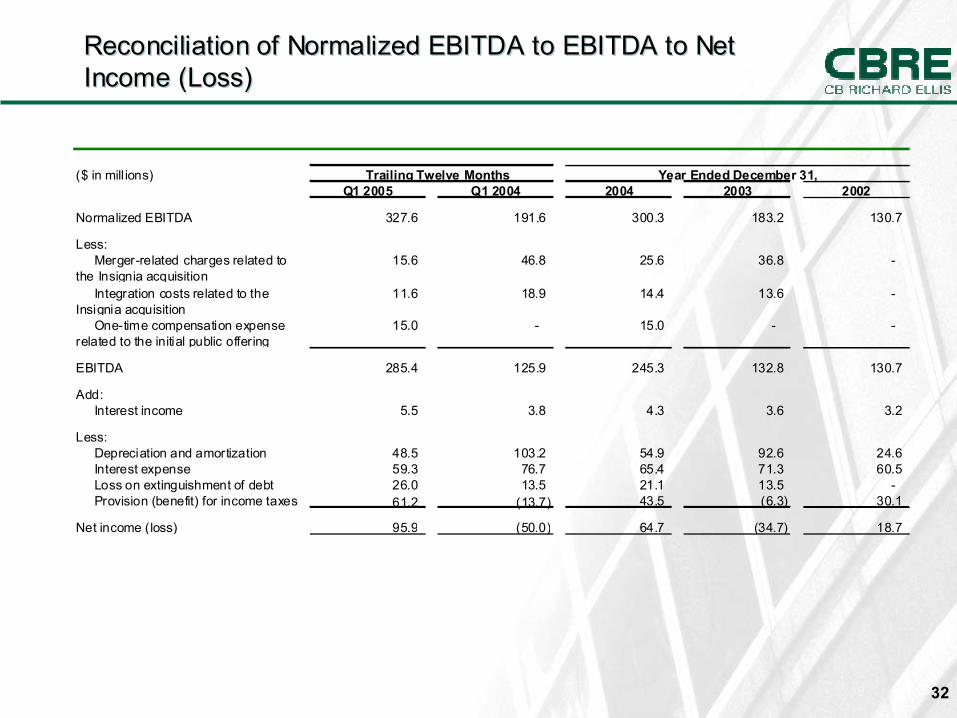
Reconciliation of Normalized EBITDA to EBITDA to Net Income (Loss)Reconciliation of Normalized EBITDA to EBITDA to Net Income (Loss)
($ in mill ions) Trailing Twelve MonthsQ1 2005 Q1 2004 2004 2003 2002
Normalized EBITDA 327.6 191.6 300.3 183.2 130.7
Less: Merger-related charges related to the Insignia acquisition
15.6 46.8 25.6 36.8 -
Integration costs related to the Insignia acquisition
11.6 18.9 14.4 13.6 -
One-time compensation expense related to the initial public offering
15.0 - 15.0 - -
EBITDA 285.4 125.9 245.3 132.8 130.7
Add: Interest income 5.5 3.8 4.3 3.6 3.2
Less: Depreciation and amortization 48.5 103.2 54.9 92.6 24.6 Interest expense 59.3 76.7 65.4 71.3 60.5 Loss on extinguishment of debt 26.0 13.5 21.1 13.5 - Provision (benefit) for income taxes 61.2 (13.7) 43.5 (6.3) 30.1
Net income (loss) 95.9 (50.0) 64.7 (34.7) 18.7
Year Ended December 31,

33
Three Months Ended March 31,($ in millions, except share data) 2005 2004Net income (loss) 14.6 (16.6) Amortization related to net revenue backlog acquired in the Insignia acquisition, net of tax - 4.3
Merger-related charges related to the Insignia acquisition, net of tax - 6.3
Integration costs related to the Insignia acquisition, net of tax 1.5 3.4
Loss on extinguishment of debt, net of tax 2.9 - Net income (loss), as adjusted 19.0 (2.6)
Diluted income (loss) per share, as adjusted 0.25$ (0.03)$
Weighted average shares outstanding for diluted income per share, as adjusted
76,184,725 62,522,176
Reconciliation of Net Income (Loss) to Net Income (Loss), As AdjustedReconciliation of Net Income (Loss) to Net Income (Loss), As Adjusted

34
-
20
40
60
80
100
120
140
160
(a) Amortization expense related to Insignia net revenue backlog
(b) Insignia merger-related and integration costs
(c) One-time IPO related compensation expense
(d) Costs of extinguishment of debt
Net Income,As Adjusted
TTM 1st Quarter 2005 Results
($ millions)
964
140
179
13
ReportedNet Income
(a) (b) (c) (d)
Reconciliation of Net Income to Net Income, As AdjustedReconciliation of Net Income to Net Income, As Adjusted

35


![August 06 Investor (final) [Read-Only]library.corporate-ir.net/library/17/176/176560/items/210430/cbg.pdf · 4 67% 21% EMEA Asia Pacific Americas Global Investment Management 8% 4%](https://img.pdfslide.net/doc/110x75/5c044b2309d3f29b388b79da/august-06-investor-final-read-only-4-67-21-emea-asia-pacific-americas.jpg)