Embed Size (px)
DESCRIPTION
2007 Goodman Rsmas
Citation preview
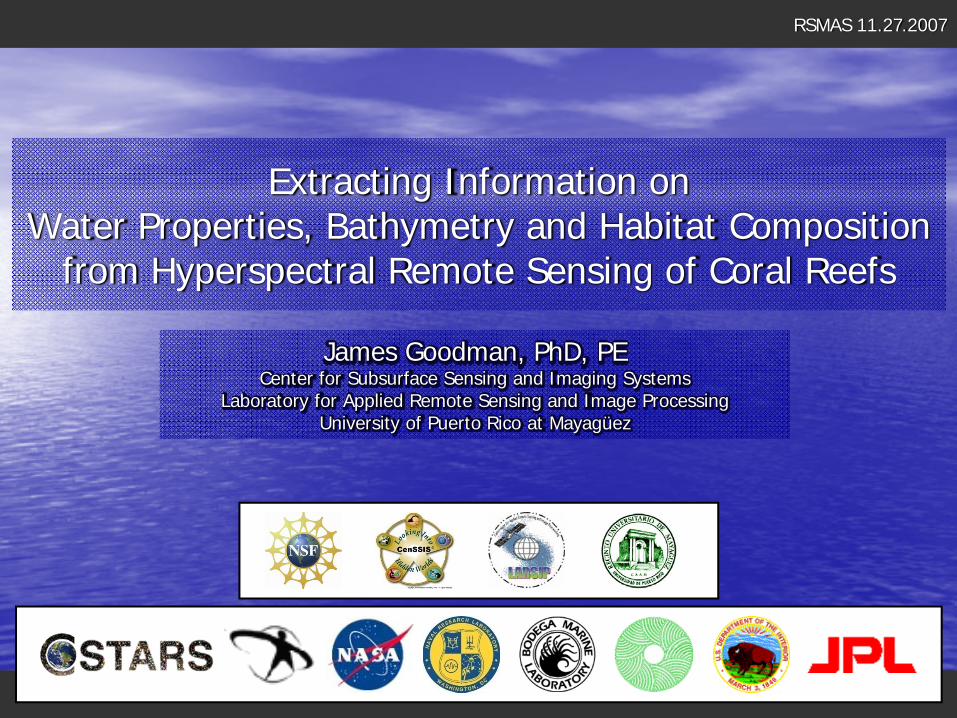
Extracting Information onWater Properties, Bathymetry and Habitat Composition
from Hyperspectral Remote Sensing of Coral Reefs
RSMAS 11.27.2007
James Goodman, PhD, PECenter for Subsurface Sensing and Imaging Systems
Laboratory for Applied Remote Sensing and Image ProcessingUniversity of Puerto Rico at Mayagüez
RSMAS 11.27.2007
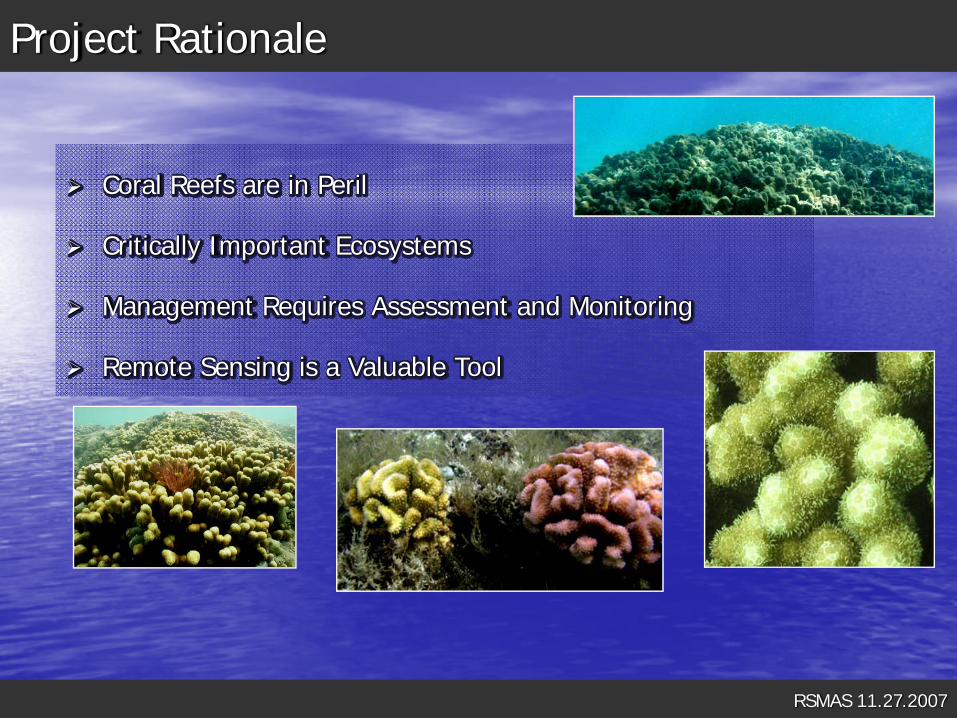
Project Rationale
Coral Reefs are in Peril
Critically Important Ecosystems
Management Requires Assessment and Monitoring
Remote Sensing is a Valuable Tool
RSMAS 11.27.2007
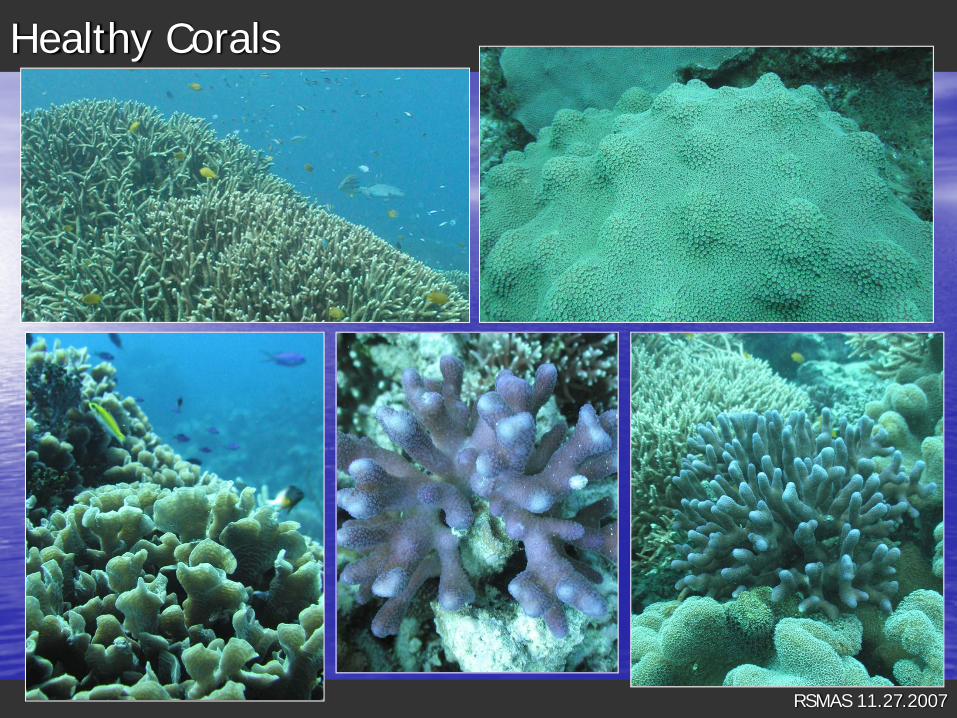
Healthy Corals
RSMAS 11.27.2007
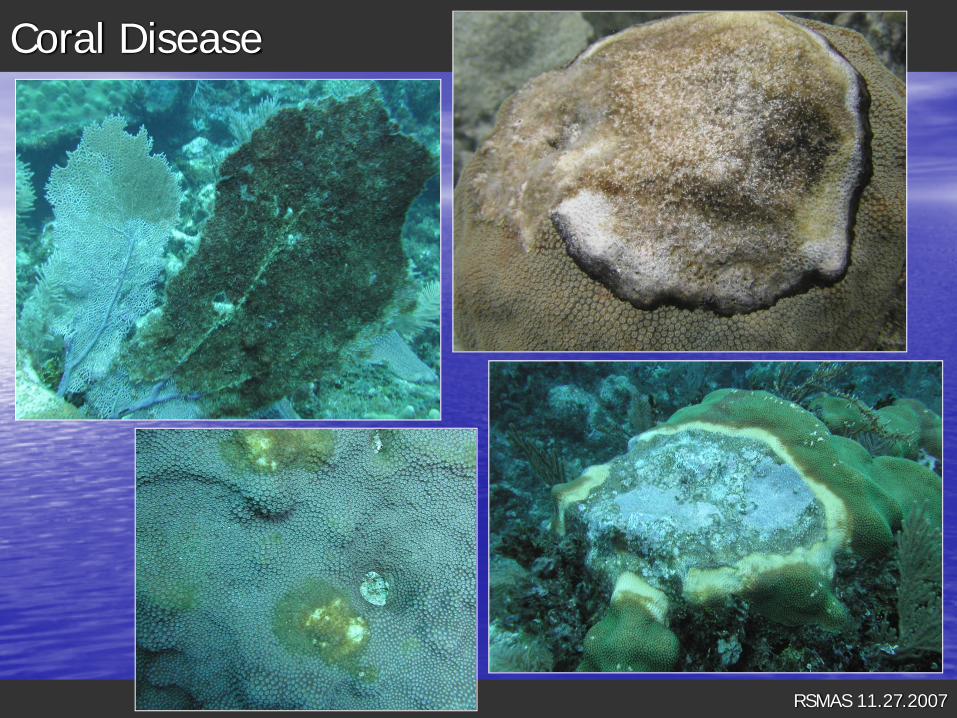
Coral Disease
RSMAS 11.27.2007
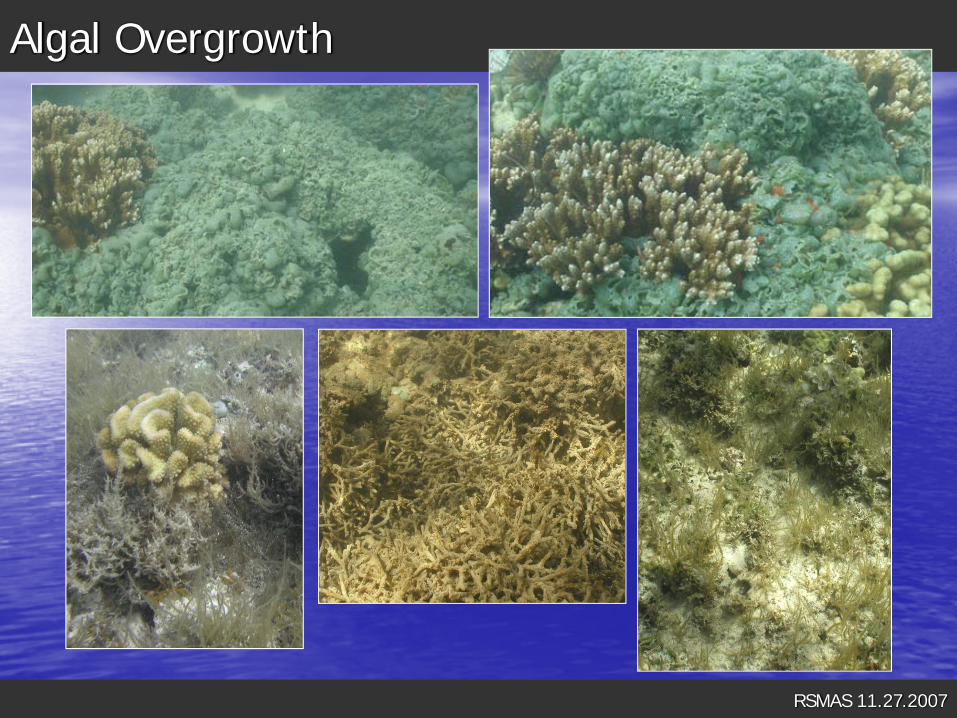
Algal Overgrowth
RSMAS 11.27.2007
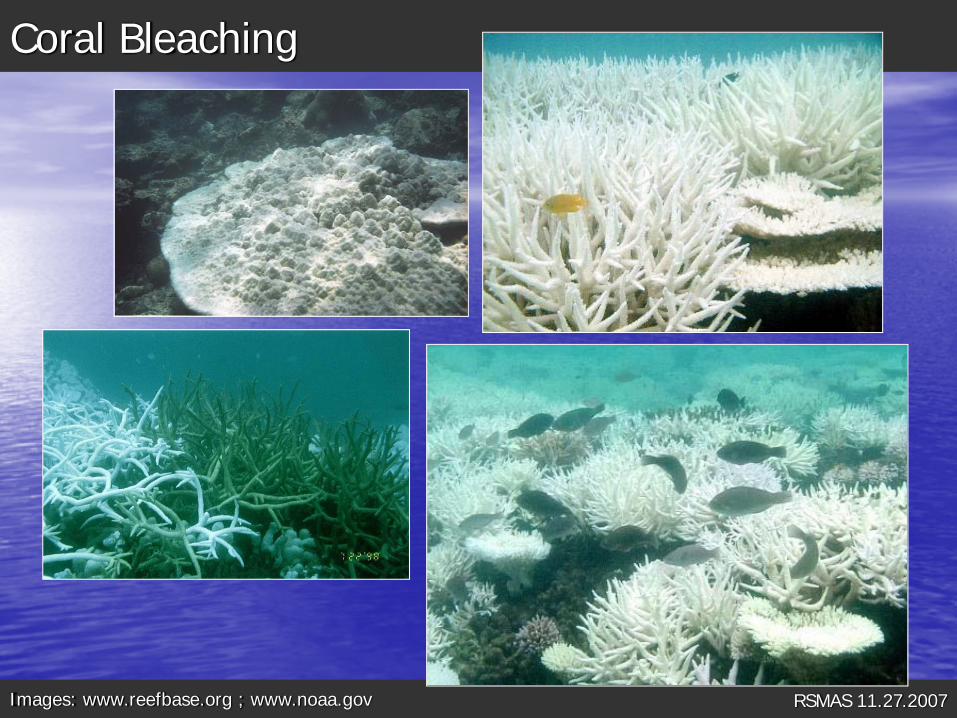
Coral Bleaching
Images: www.reefbase.org ; www.noaa.gov
RSMAS 11.27.2007
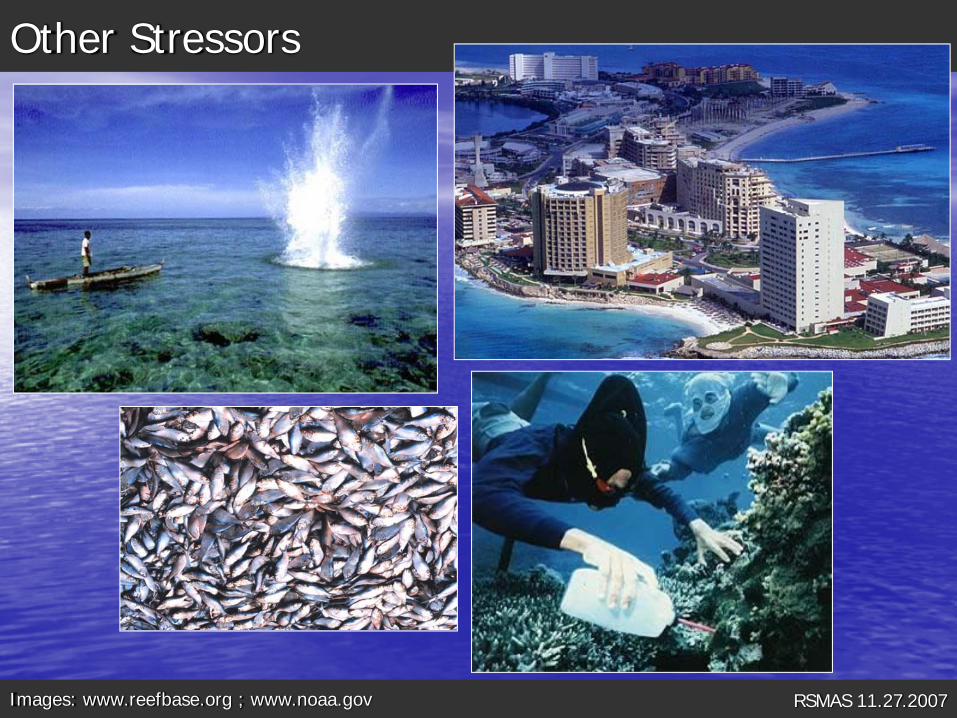
Other Stressors
Images: www.reefbase.org ; www.noaa.gov
RSMAS 11.27.2007
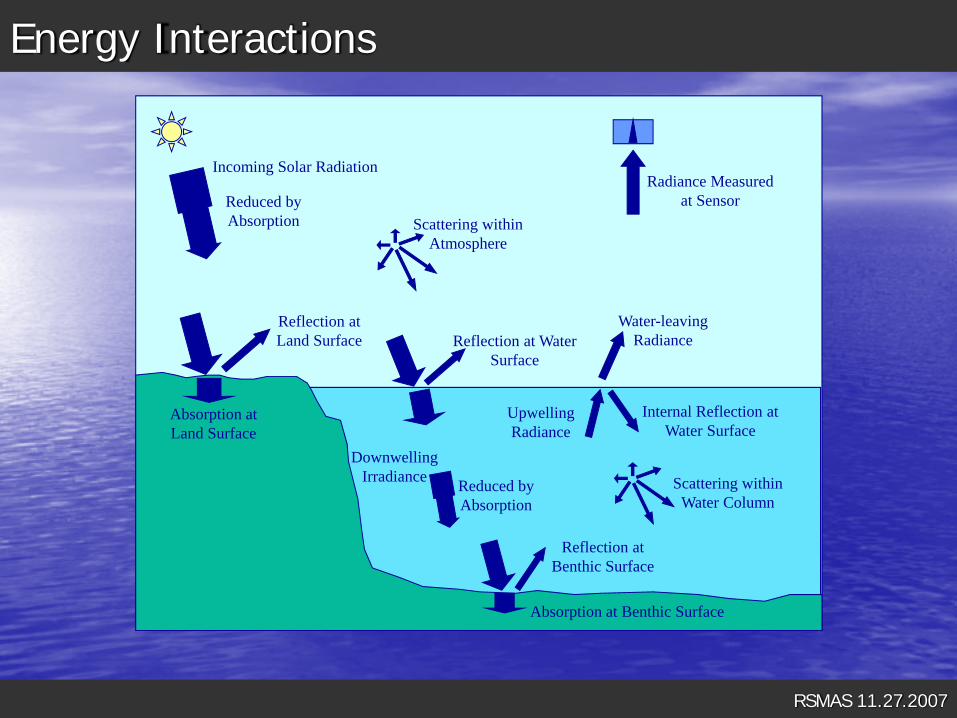
Energy Interactions
Incoming Solar Radiation
Reduced by Absorption Scattering within
Atmosphere
Reflection at Water Surface
Reflection at Benthic Surface
Absorption at Benthic Surface
Scattering within Water Column
Reduced by Absorption
Downwelling Irradiance
Water-leaving Radiance
Upwelling Radiance
Internal Reflection at Water Surface
Reflection at Land Surface
Absorption at Land Surface
Radiance Measured at Sensor
RSMAS 11.27.2007
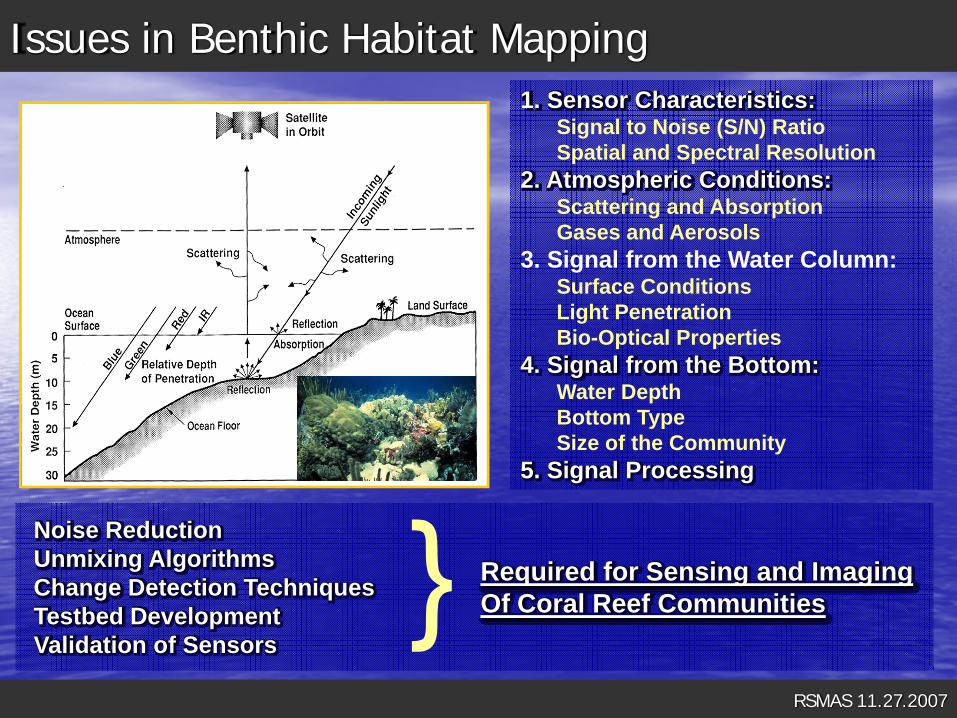
Issues in Benthic Habitat Mapping1. Sensor Characteristics:
Signal to Noise (S/N) RatioSpatial and Spectral Resolution
2. Atmospheric Conditions:Scattering and AbsorptionGases and Aerosols
3. Signal from the Water Column:Surface ConditionsLight PenetrationBio-Optical Properties
4. Signal from the Bottom:Water DepthBottom TypeSize of the Community
5. Signal Processing
Noise ReductionUnmixing AlgorithmsChange Detection TechniquesTestbed DevelopmentValidation of Sensors
Required for Sensing and ImagingOf Coral Reef Communities}
RSMAS 11.27.2007
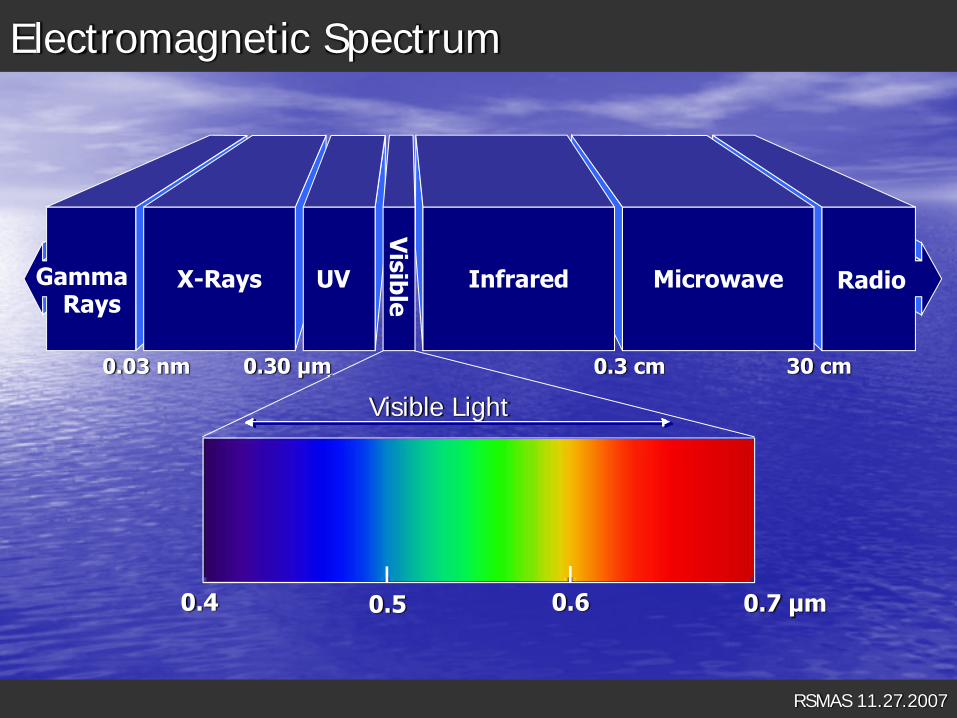
Electromagnetic Spectrum
0.03 nm
0.4 0.5 0.6 0.7 µm
X-Rays InfraredUV Microwave Radio
0.30 µm
Visible
30 cm0.3 cm
Visible Light
GammaRays
RSMAS 11.27.2007NOAA CoRIS <coris.noaa.gov>
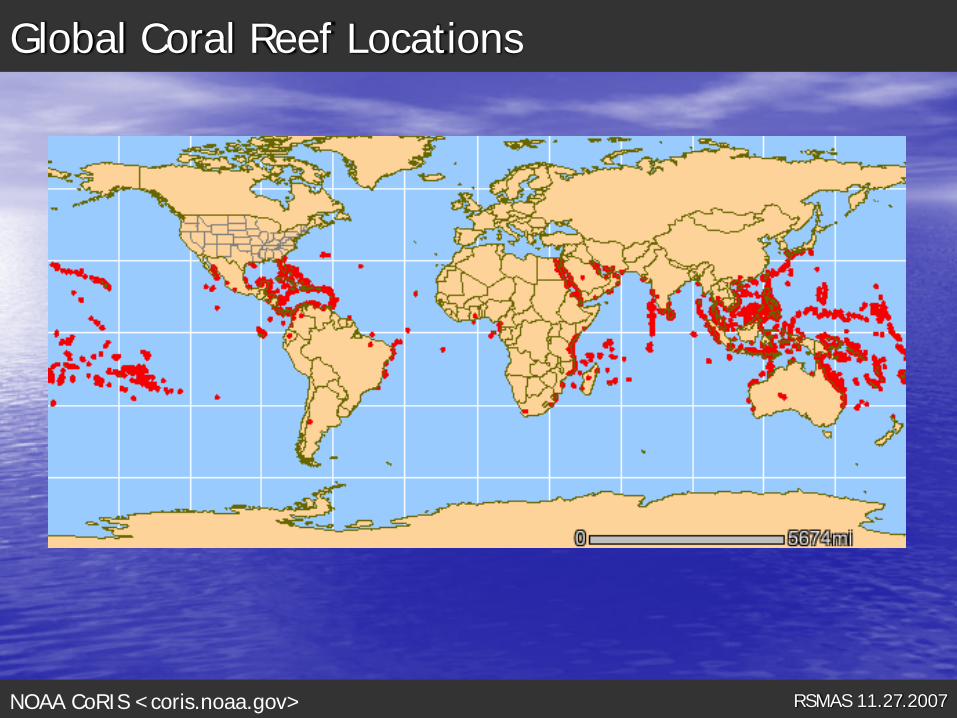
Global Coral Reef Locations
RSMAS 11.27.2007ReefBase <www.reefbase.org>
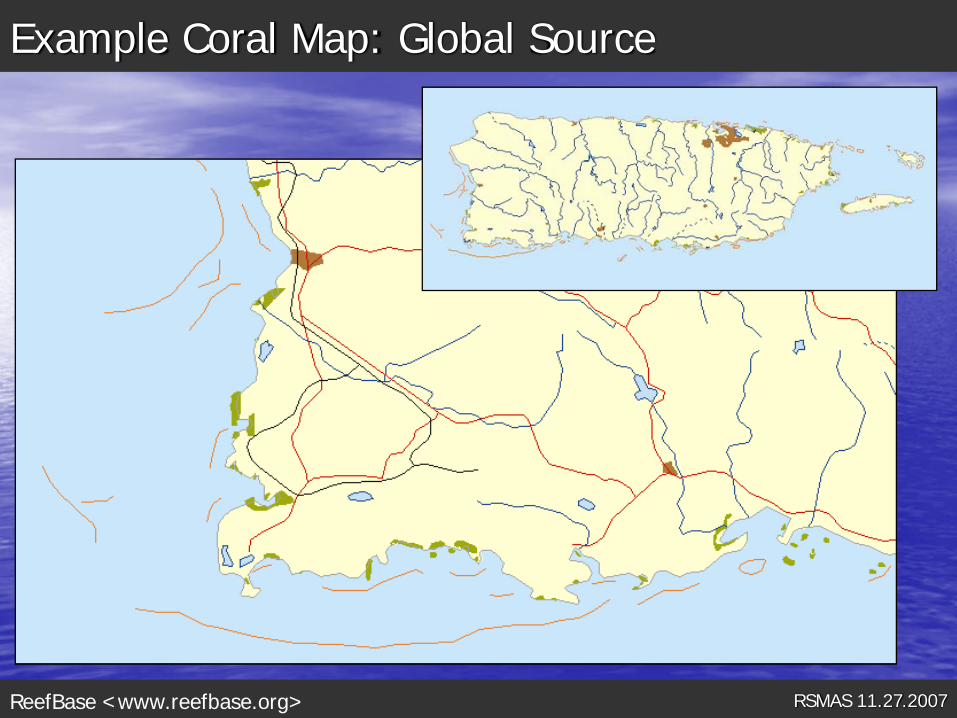
Example Coral Map: Global Source
RSMAS 11.27.2007Millenium Coral Reef Mapping Project: S. Andrefouet
Landsat RGB Reef Classification
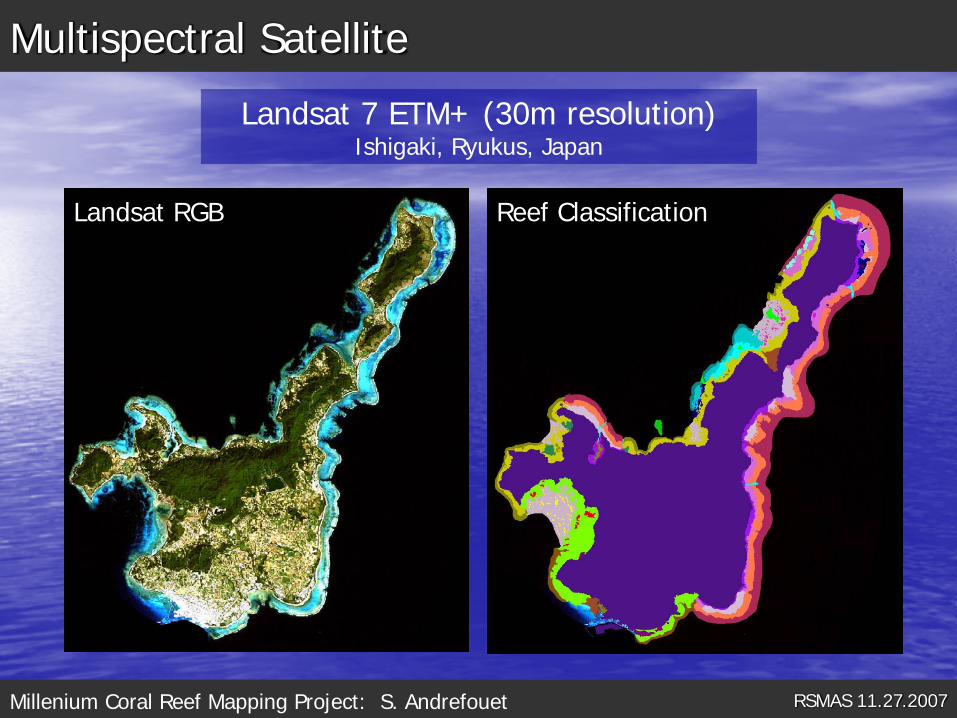
Multispectral Satellite
Landsat 7 ETM+ (30m resolution)Ishigaki, Ryukus, Japan
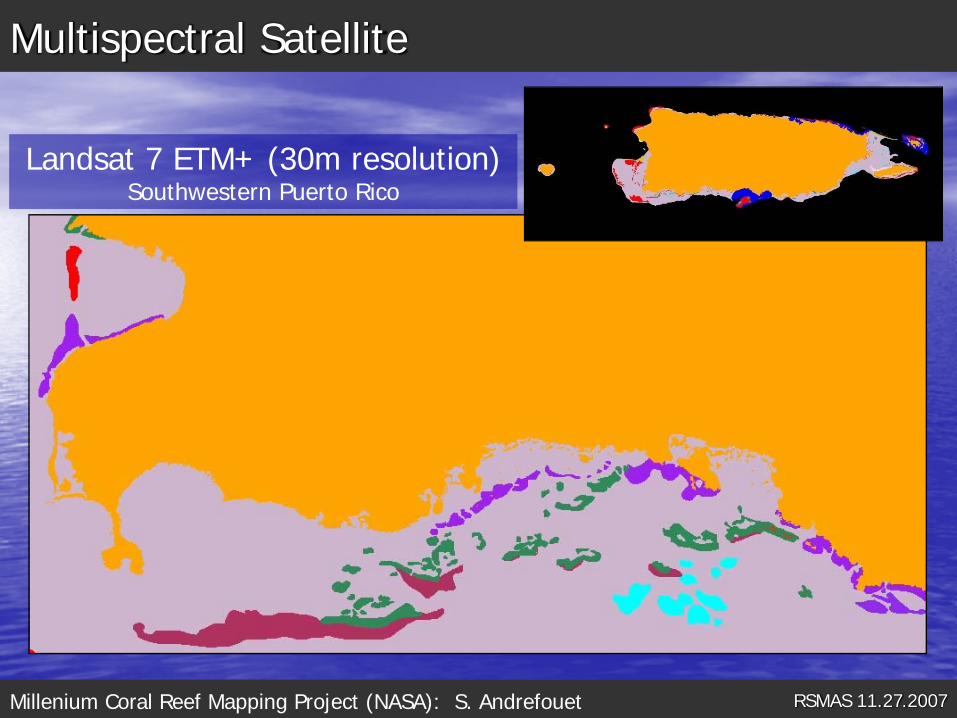
RSMAS 11.27.2007Millenium Coral Reef Mapping Project (NASA): S. Andrefouet
Multispectral Satellite
Landsat 7 ETM+ (30m resolution)Southwestern Puerto Rico
RSMAS 11.27.2007
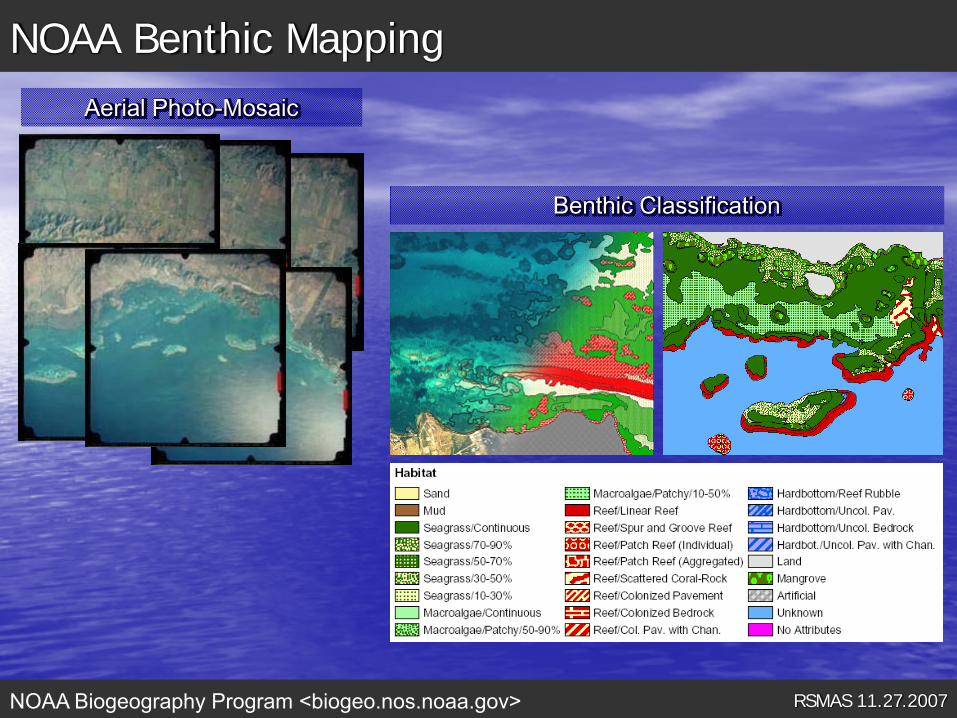
NOAA Benthic Mapping
NOAA Biogeography Program <biogeo.nos.noaa.gov>
Benthic Classification
Aerial Photo-Mosaic
RSMAS 11.27.2007
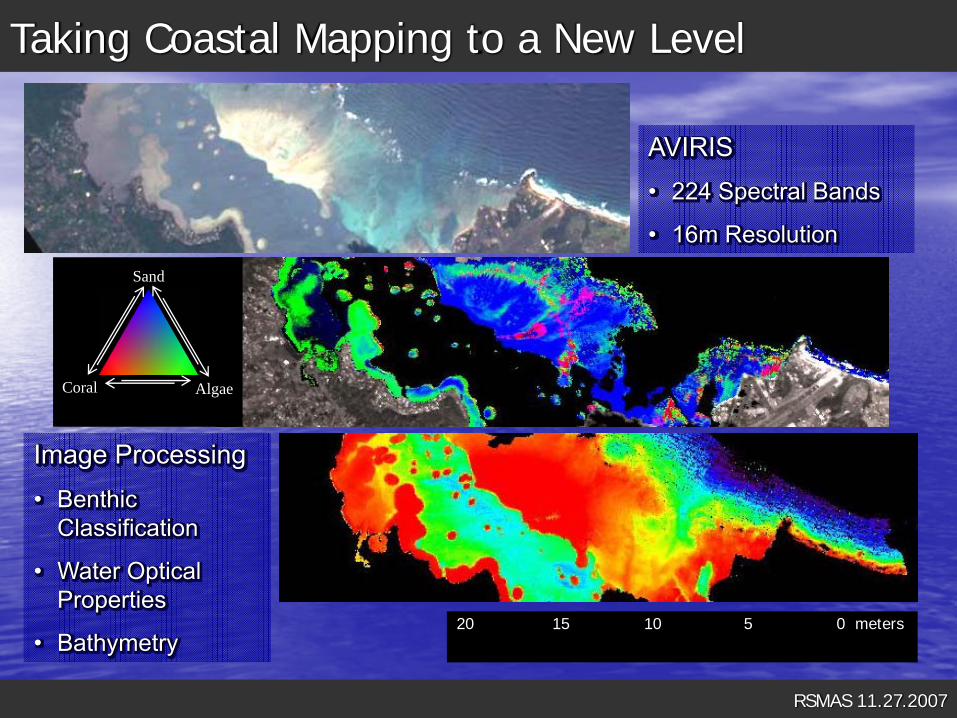
Taking Coastal Mapping to a New Level
0 meters515 1020
AVIRIS• 224 Spectral Bands
• 16m Resolution
Image Processing• Benthic
Classification
• Water Optical Properties
• Bathymetry
Sand
AlgaeCoral
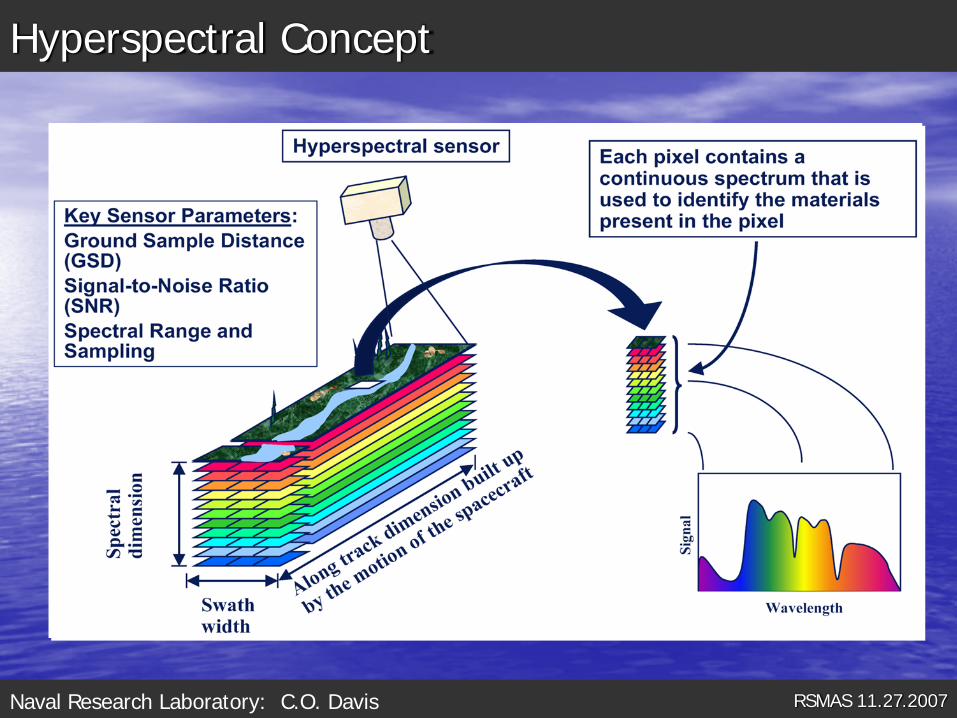
Hyperspectral Concept
RSMAS 11.27.2007Naval Research Laboratory: C.O. Davis
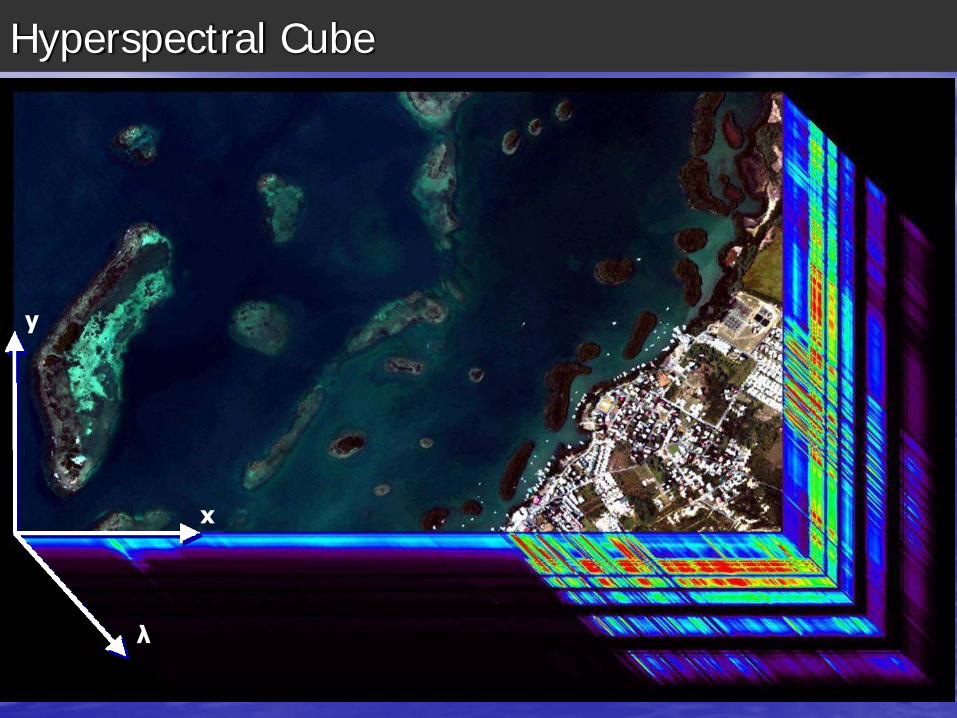
Hyperspectral Cube
y
x
λ
RSMAS 11.27.2007
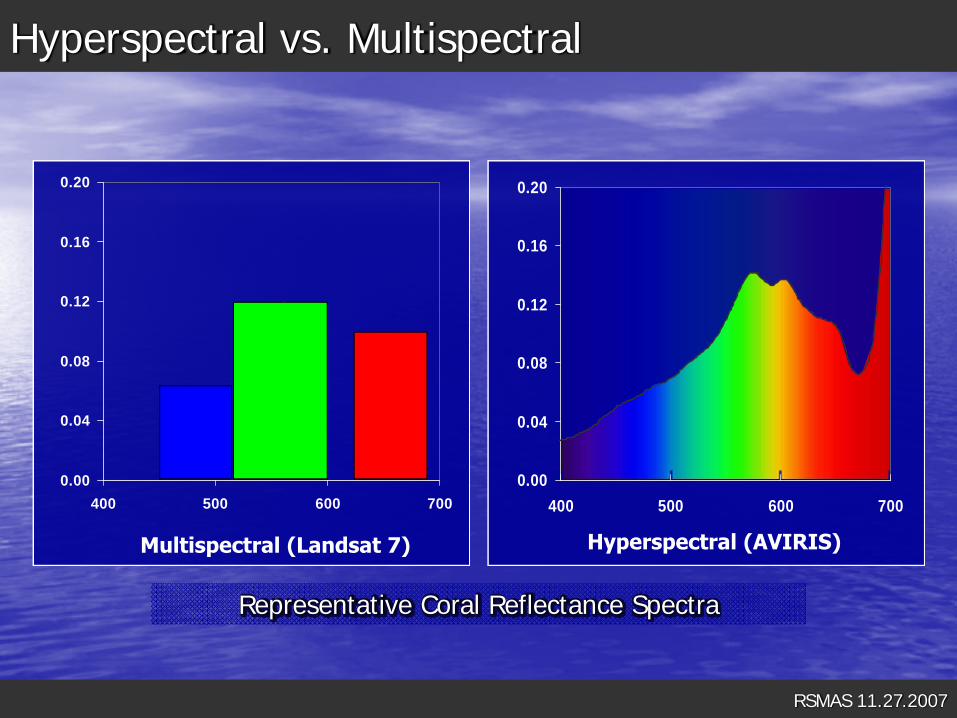
Hyperspectral vs. Multispectral
0.00
0.04
0.08
0.12
0.16
0.20
400 500 600 700
Multispectral (Landsat 7)
0.00
0.04
0.08
0.12
0.16
0.20
400 500 600 700
Hyperspectral (AVIRIS)
Representative Coral Reflectance Spectra
RSMAS 11.27.2007
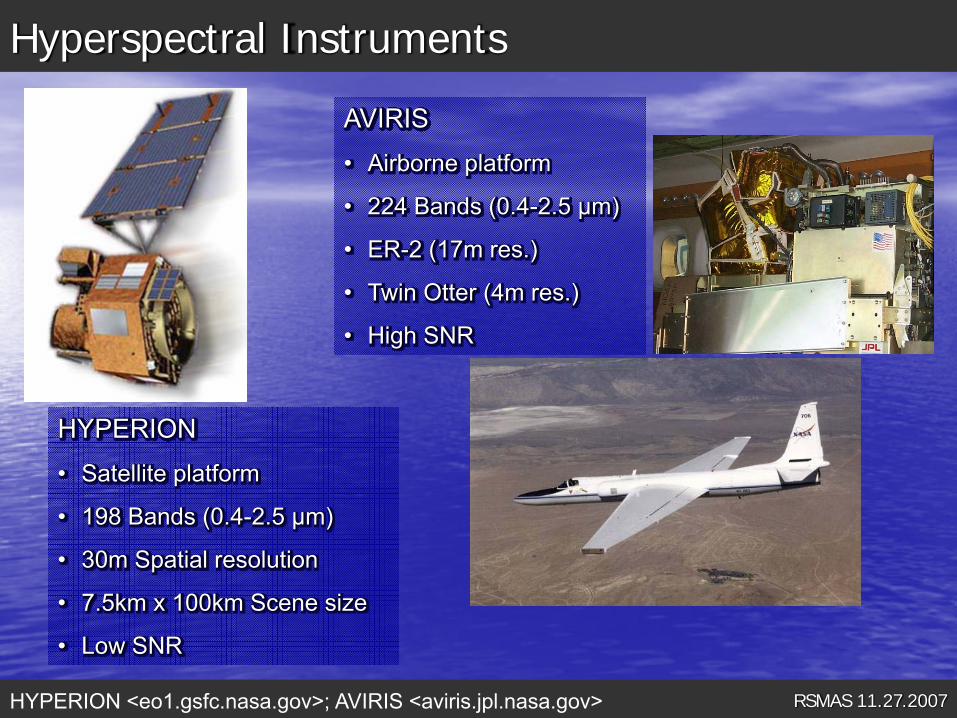
Hyperspectral Instruments
HYPERION• Satellite platform
• 198 Bands (0.4-2.5 μm)
• 30m Spatial resolution
• 7.5km x 100km Scene size
• Low SNR
HYPERION <eo1.gsfc.nasa.gov>; AVIRIS <aviris.jpl.nasa.gov>
AVIRIS• Airborne platform
• 224 Bands (0.4-2.5 μm)
• ER-2 (17m res.)
• Twin Otter (4m res.)
• High SNR
RSMAS 11.27.2007
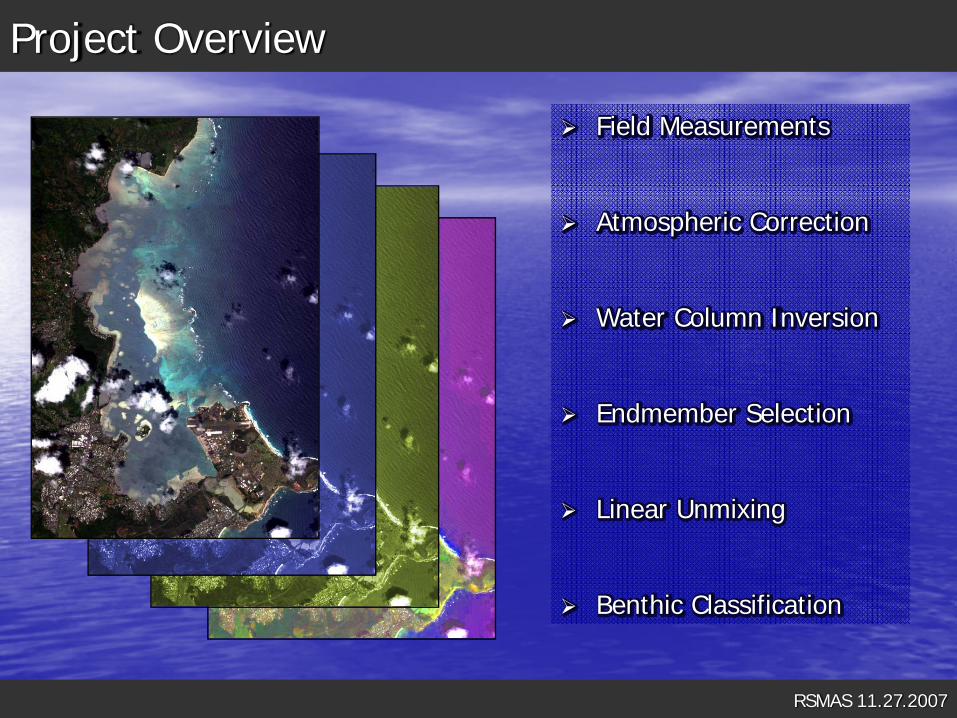
Project Overview
Field Measurements
Atmospheric Correction
Water Column Inversion
Endmember Selection
Linear Unmixing
Benthic Classification

RSMAS 11.27.2007
Analysis Procedure
Atmospheric CorrectionTafkaa
Glint Removal
Inversion ModelSemi-Analytical
Input ParametersAbsorption Properties
Bottom Reflectance
Linear Unmixing Model
AVIRIS
Inversion OutputWater Constituent Properties
Bottom Albedo (550 nm)
Bathymetry
RMSE
Unmixing OutputReef, Algae, Sand Distribution
RMSE
Spectral EndmembersReef, Algae, Sand
Field Spectra
Forward ModelSemi-Analytical
RSMAS 11.27.2007
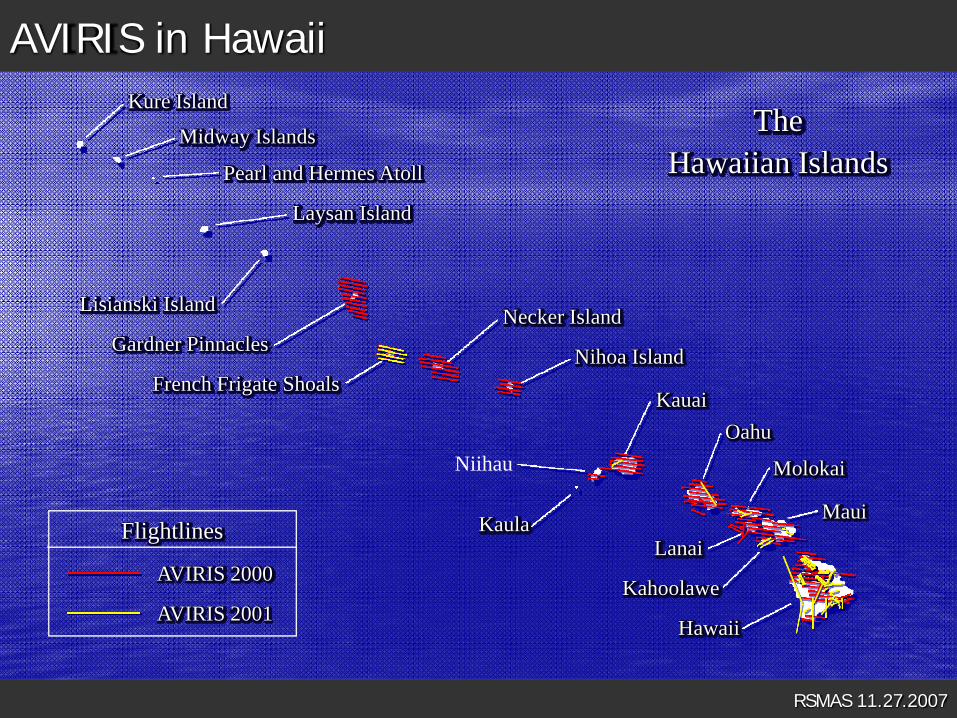
AVIRIS in Hawaii
TheHawaiian Islands
Kure Island
Midway Islands
Pearl and Hermes Atoll
Laysan Island
Lisianski Island
Gardner Pinnacles
French Frigate Shoals
Necker Island
Nihoa Island
Kaula
Niihau
KauaiOahu
Molokai
Hawaii
Kahoolawe
Lanai
Maui
AVIRIS 2000
AVIRIS 2001
Flightlines
RSMAS 11.27.2007
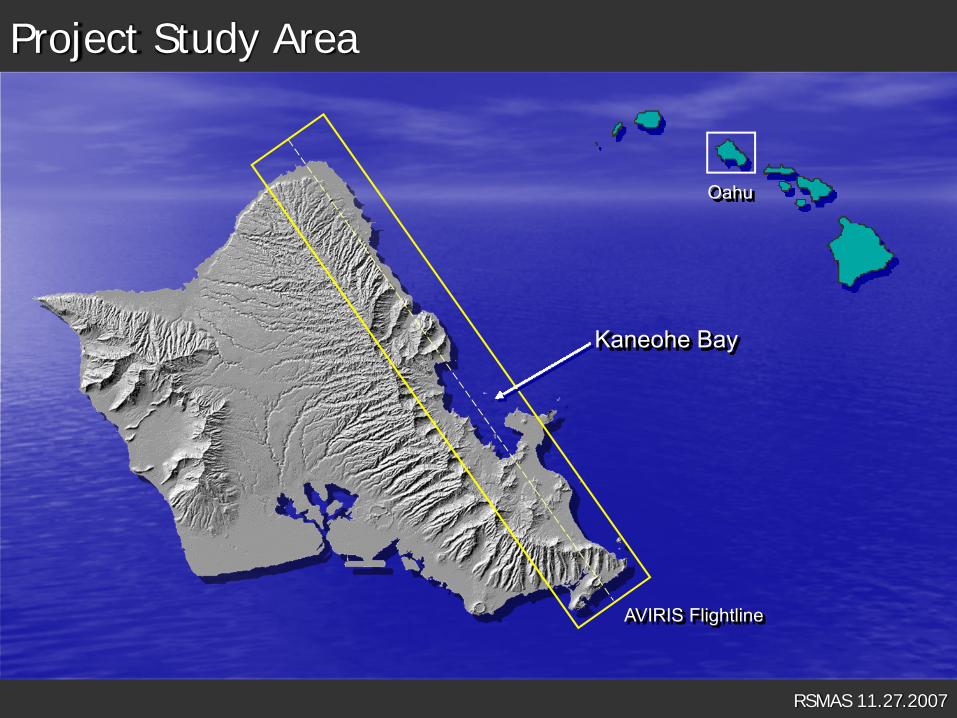
Project Study Area
Kaneohe Bay
Oahu
AVIRIS Flightline
RSMAS 11.27.2007
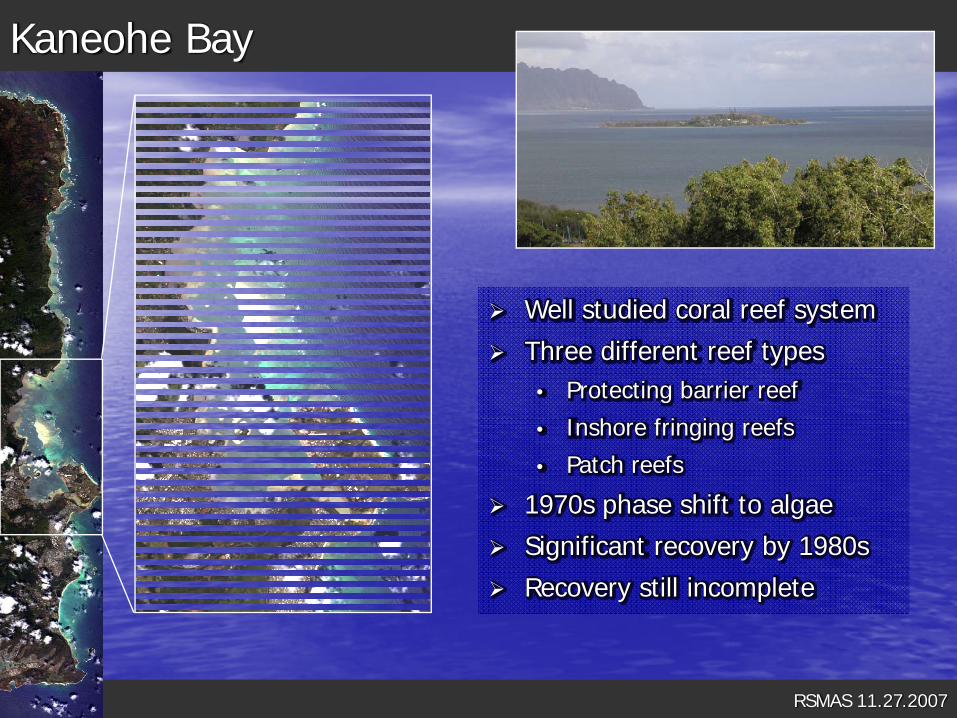
Kaneohe Bay
Well studied coral reef system
Three different reef types• Protecting barrier reef
• Inshore fringing reefs
• Patch reefs
1970s phase shift to algae
Significant recovery by 1980s
Recovery still incomplete
RSMAS 11.27.2007
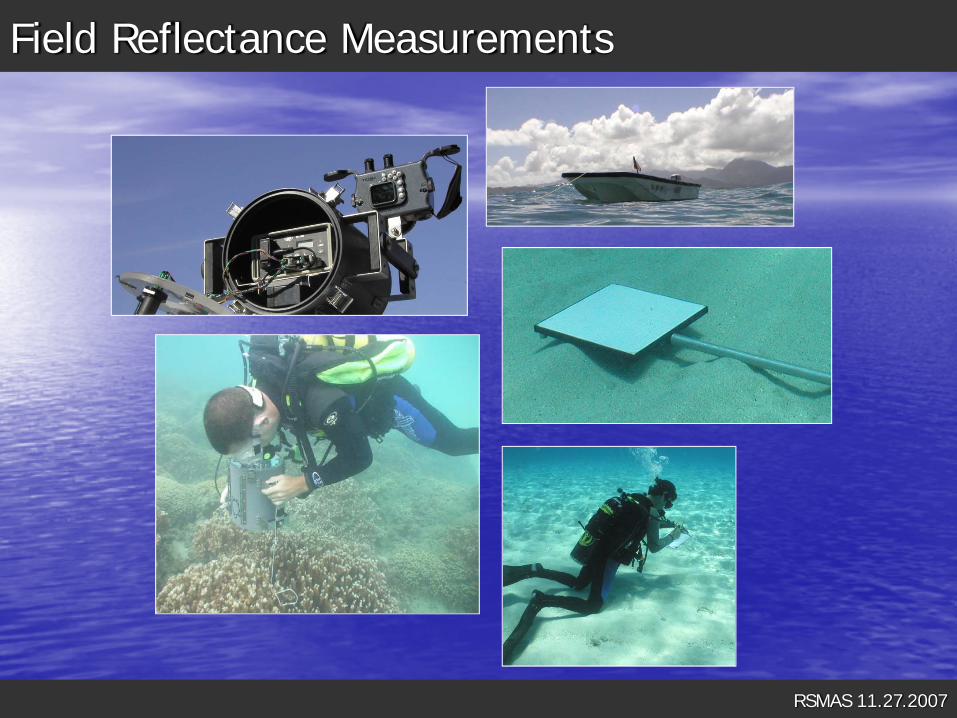
Field Reflectance Measurements
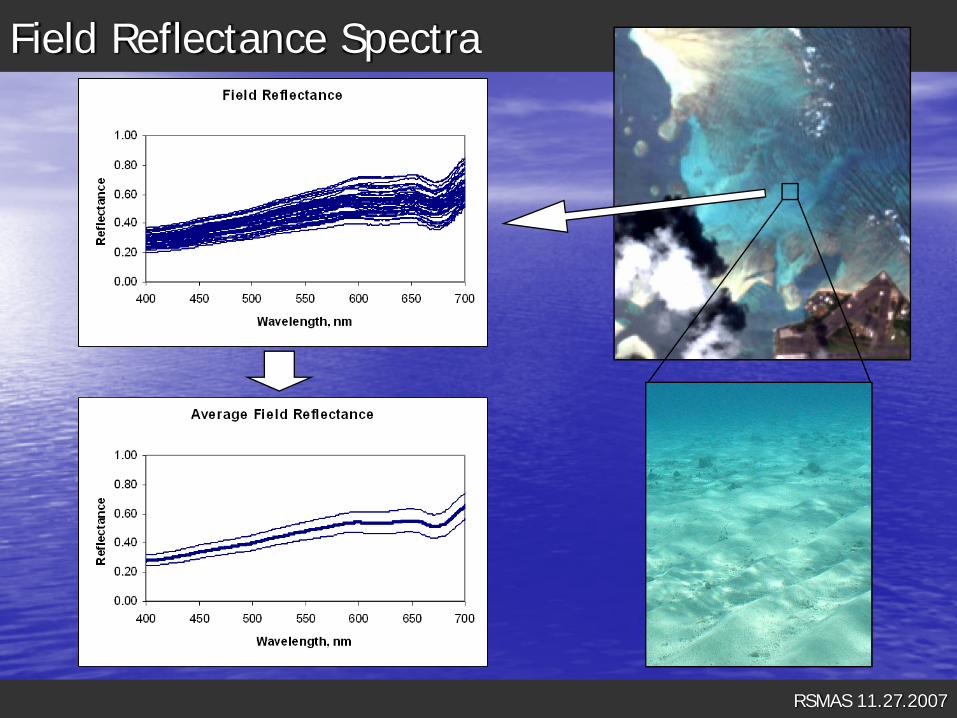
RSMAS 11.27.2007
Field Reflectance Spectra
RSMAS 11.27.2007
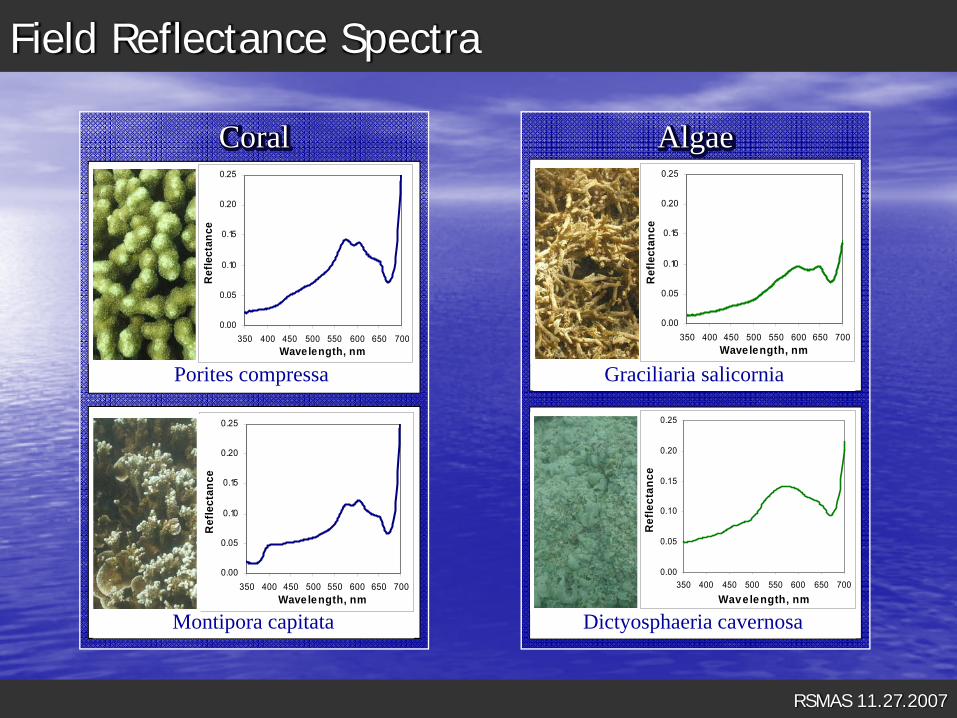
Field Reflectance Spectra
Montipora capitata
0.00
0.05
0.10
0.15
0.20
0.25
350 400 450 500 550 600 650 700Wavelength, nm
Ref
lect
ance
Porites compressa
0.00
0.05
0.10
0.15
0.20
0.25
350 400 450 500 550 600 650 700Wavelength, nm
Ref
lect
ance
Coral
Graciliaria salicornia
0.00
0.05
0.10
0.15
0.20
0.25
350 400 450 500 550 600 650 700Wavelength, nm
Ref
lect
ance
Dictyosphaeria cavernosa
0.00
0.05
0.10
0.15
0.20
0.25
350 400 450 500 550 600 650 700
Wavelength, nm
Ref
lect
ance
Algae
RSMAS 11.27.2007
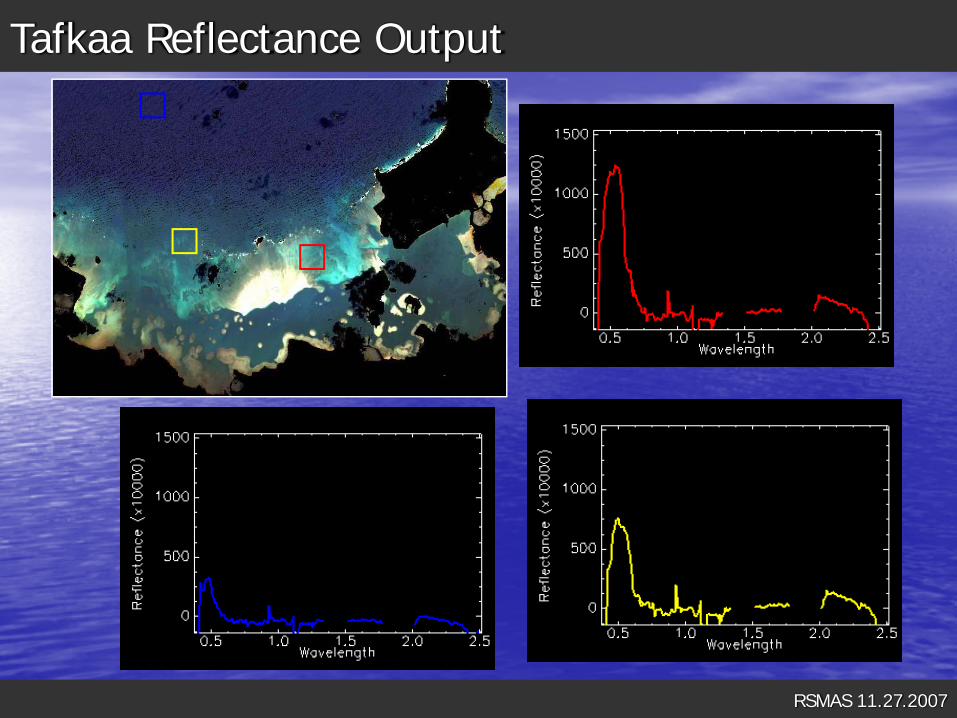
Tafkaa Reflectance Output
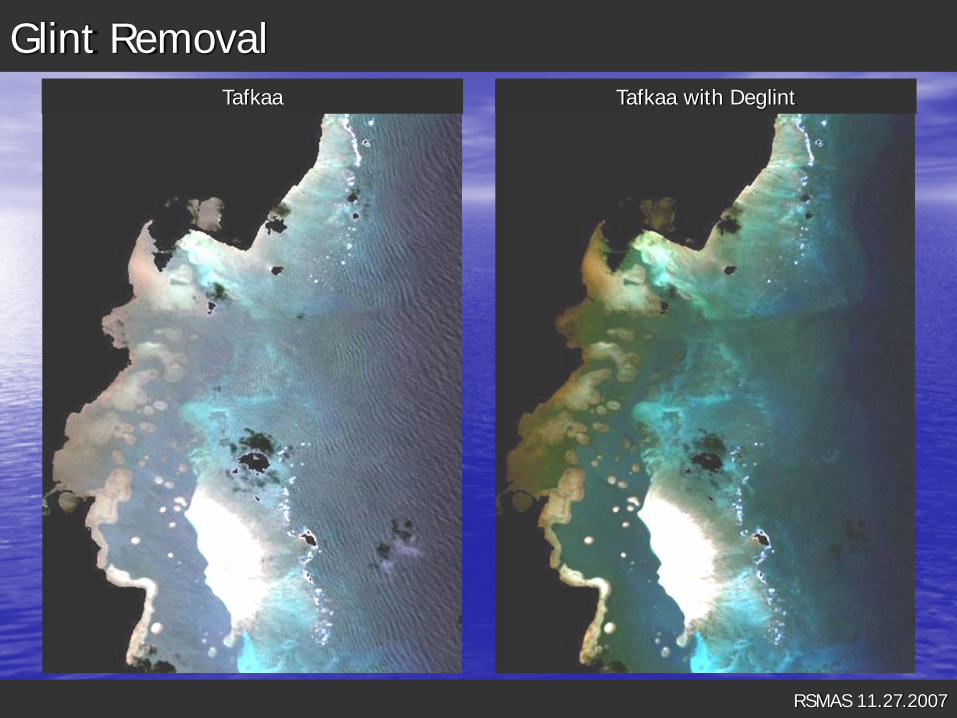
Glint Removal
RSMAS 11.27.2007
Tafkaa with DeglintTafkaa
RSMAS 11.27.2007
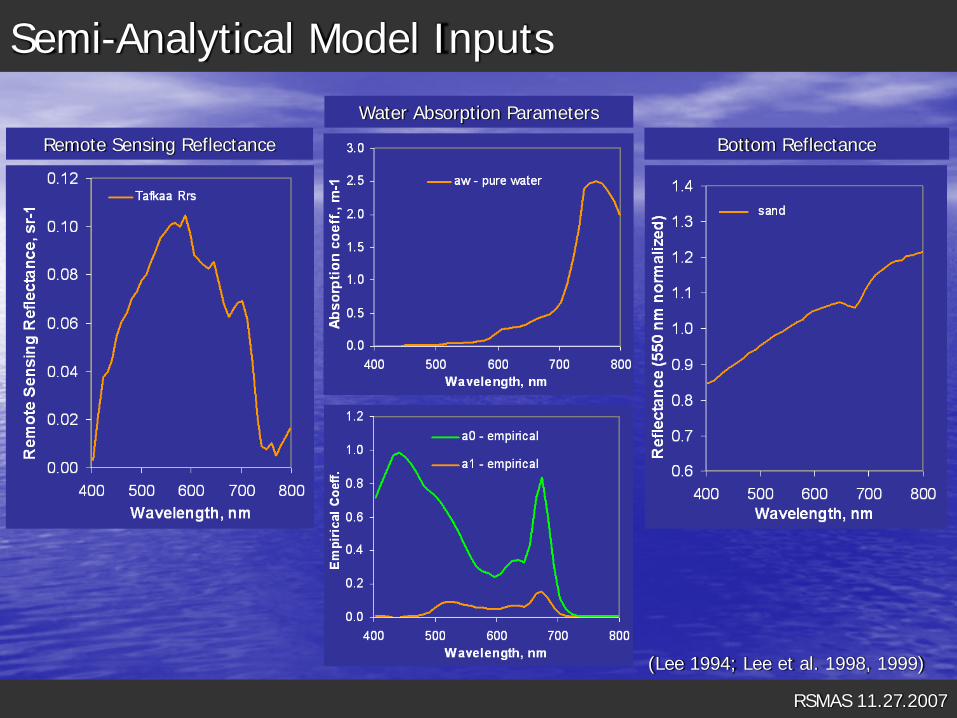
Semi-Analytical Model Inputs
Water Absorption Parameters
Bottom ReflectanceRemote Sensing Reflectance
(Lee 1994; Lee et al. 1998, 1999)
RSMAS 11.27.2007
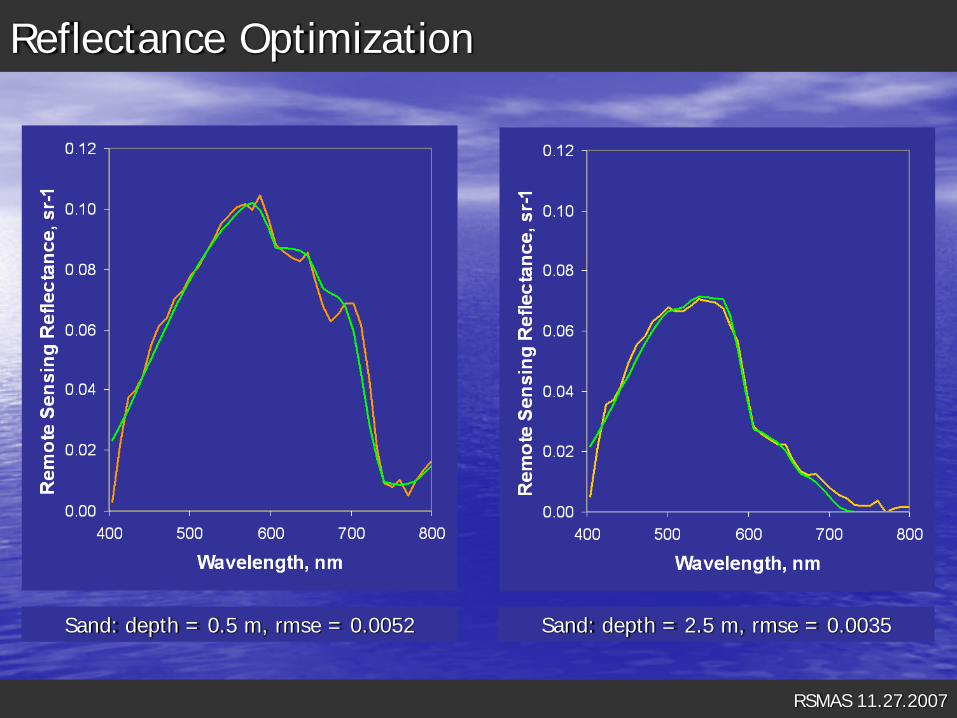
Reflectance Optimization
Sand: depth = 0.5 m, rmse = 0.0052 Sand: depth = 2.5 m, rmse = 0.0035
RSMAS 11.27.2007
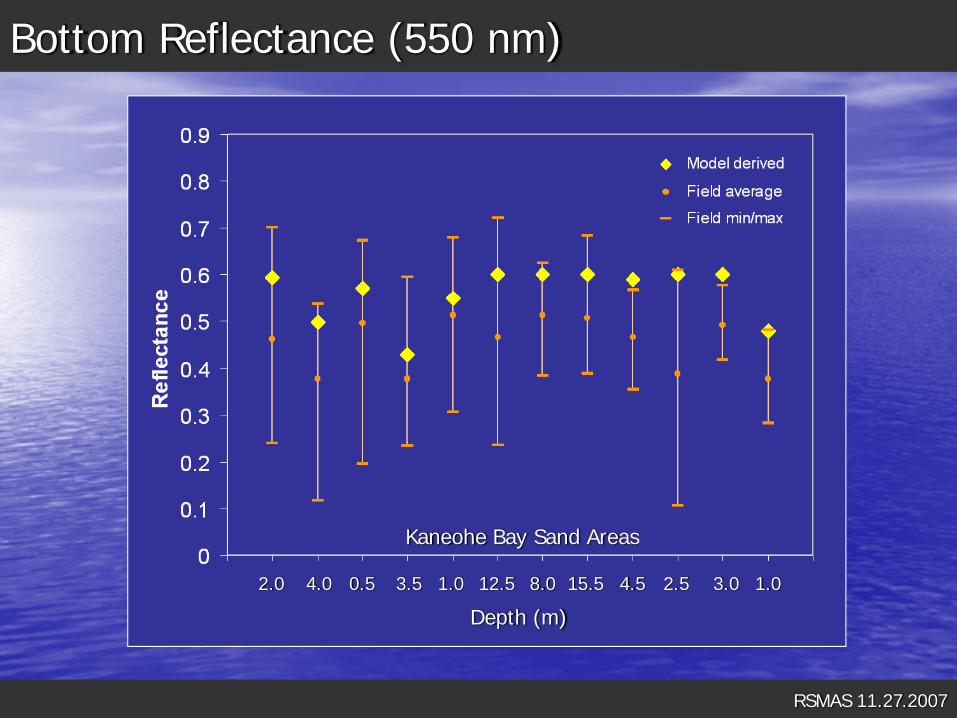
Bottom Reflectance (550 nm)
2.0 4.0 0.5 2.51.0 1.03.04.512.5 8.0 15.5
Kaneohe Bay Sand Areas
3.5
Depth (m)
0
3
6
9
12
15
0 3 6 9 12 15
SHOALS depth, m
Mod
el d
eriv
ed d
epth
, m
RSMAS 11.27.2007
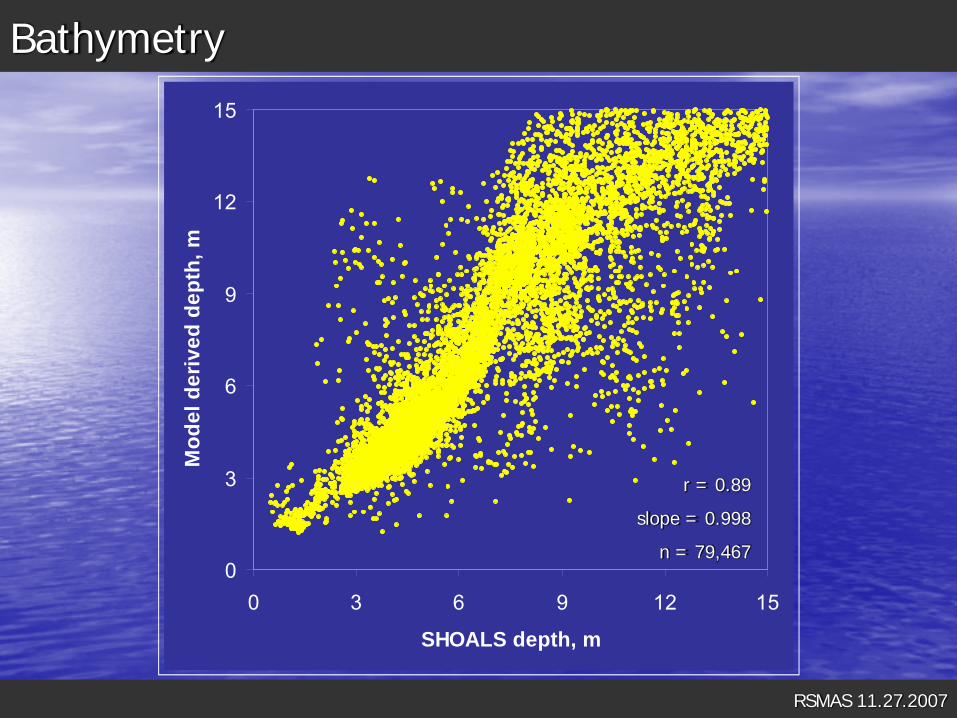
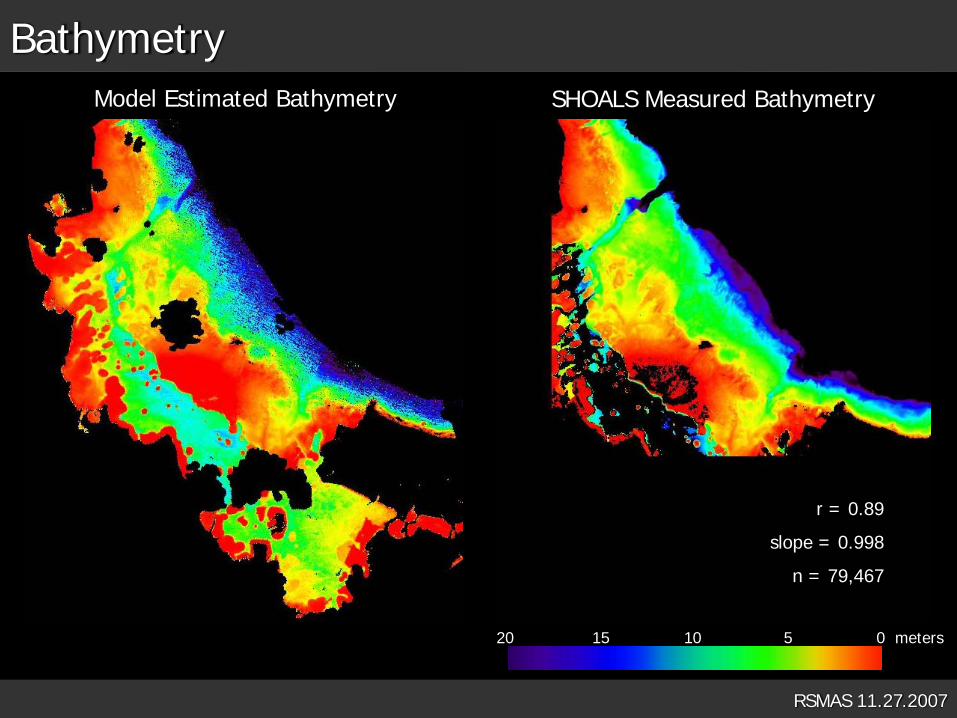
Bathymetry
r = 0.89
slope = 0.998
n = 79,467
RSMAS 11.27.2007
Bathymetry
0 meters515 1020
Model Estimated Bathymetry SHOALS Measured Bathymetry
r = 0.89
slope = 0.998
n = 79,467
RSMAS 11.27.2007
Analysis Procedure
Atmospheric CorrectionTafkaa
Glint Removal
Inversion ModelSemi-Analytical
Input ParametersAbsorption Properties
Bottom Reflectance
Linear Unmixing Model
AVIRIS
Inversion OutputWater Constituent Properties
Bottom Albedo (550 nm)
Bathymetry
RMSE
Unmixing OutputReef, Algae, Sand Distribution
RMSE
Spectral EndmembersReef, Algae, Sand
Field Spectra
Forward ModelSemi-Analytical
RSMAS 11.27.2007
Endmembers
Sand Algae
Coral
CoralAlgae
Sand
0.000
0.020
0.040
0.060
0.080
0.100
0.120
400 500 600 700Wavelength, nm
Rem
ote
Sens
ing
Ref
lect
ance
, sr-1
0.000
0.005
0.010
0.015
0.020
0.025
0.030
400 500 600 700Wavelength, nm
Rem
ote
Sens
ing
Ref
lect
ance
, sr-1
0.000
0.005
0.010
0.015
0.020
0.025
0.030
400 500 600 700
Wavelength, nm
Rem
ote
Sens
ing
Ref
lect
ance
, sr-1
RSMAS 11.27.2007
Endmember Attenuation
0.1 m
1 m
5 m
10 m
0.1 m
1 m
5 m
10 m
0.1 m
1 m
5 m
10 m
Coral Algae Sand
RSMAS 11.27.2007
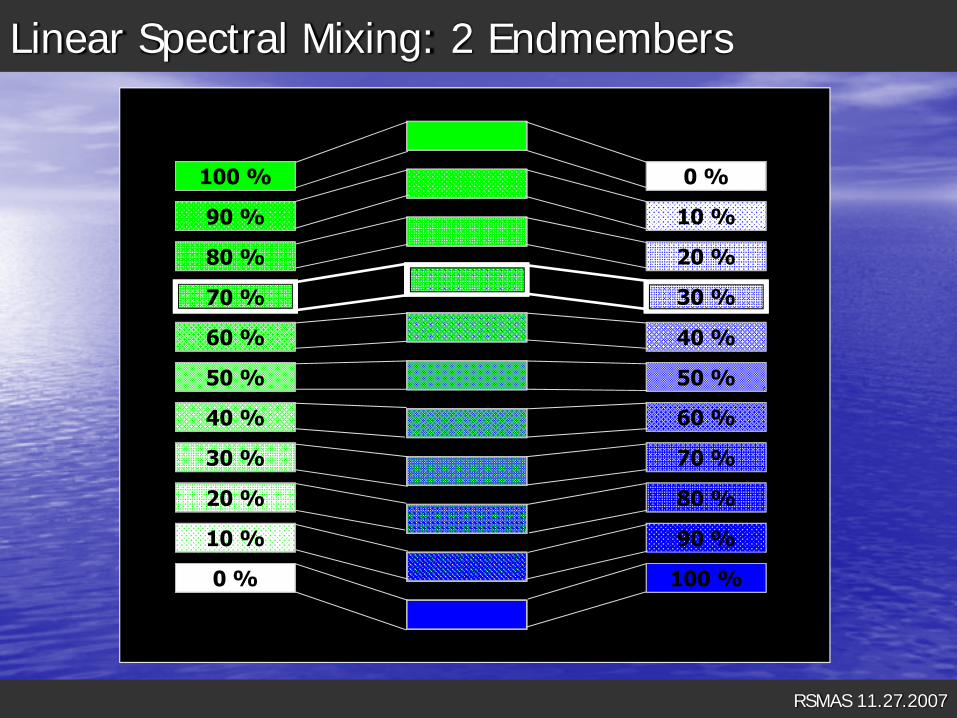
Linear Spectral Mixing: 2 Endmembers
100 %
90 %
80 %
70 %
60 %
50 %
40 %
30 %
20 %
10 %
0 % 100 %
90 %
80 %
70 %
60 %
50 %
40 %
30 %
20 %
10 %
0 %
RSMAS 11.27.2007
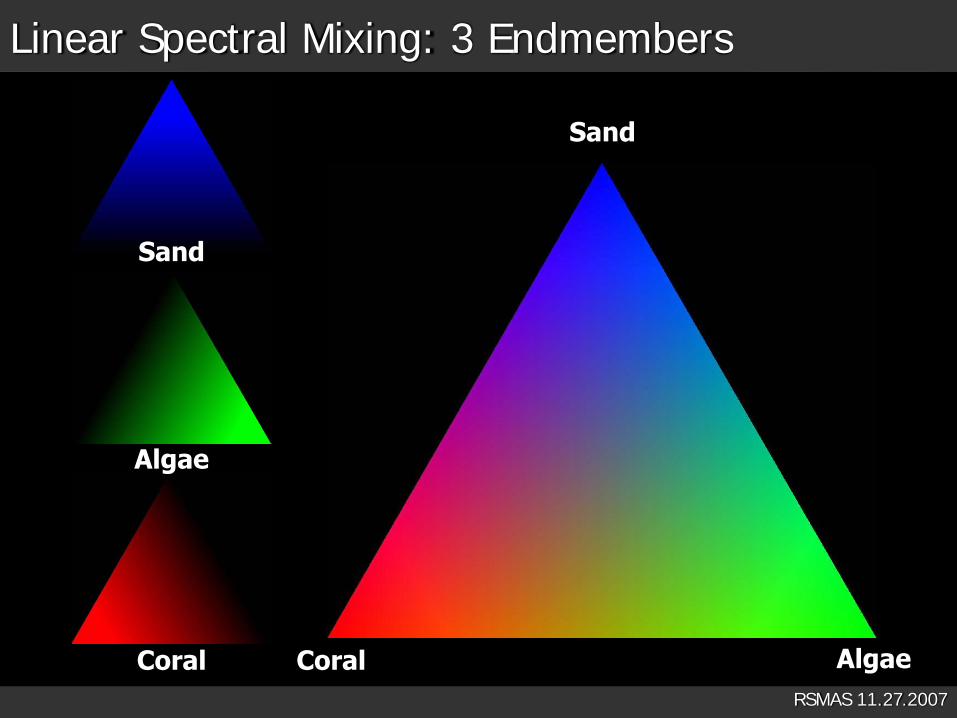
Linear Spectral Mixing: 3 Endmembers
Sand
Sand
Algae
AlgaeCoralCoral
RSMAS 11.27.2007
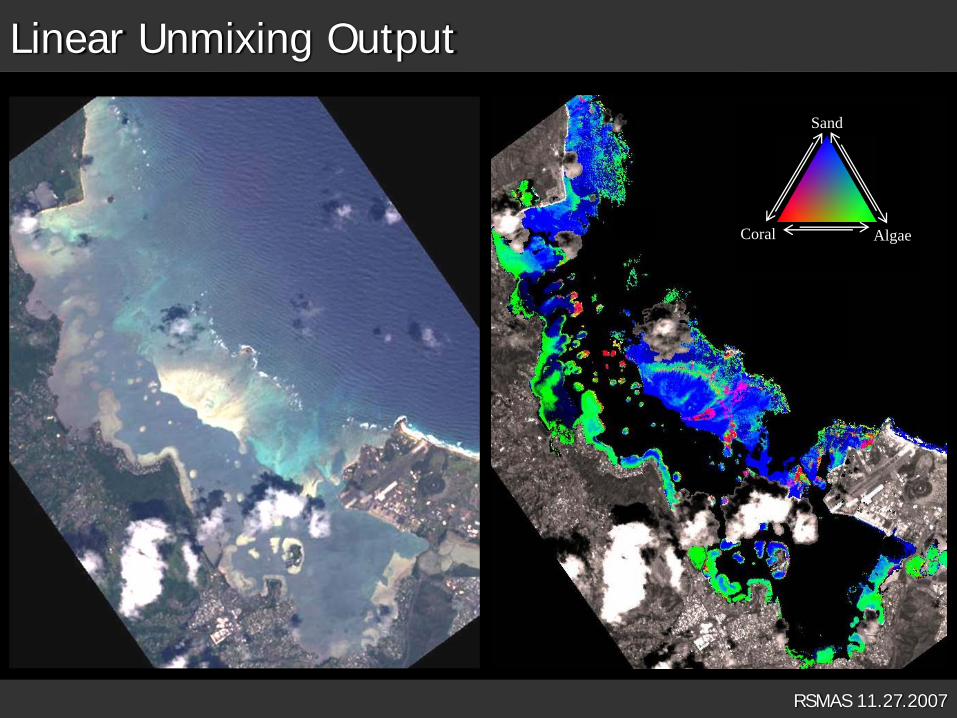
Linear Unmixing Output
Sand
AlgaeCoral
RSMAS 11.27.2007
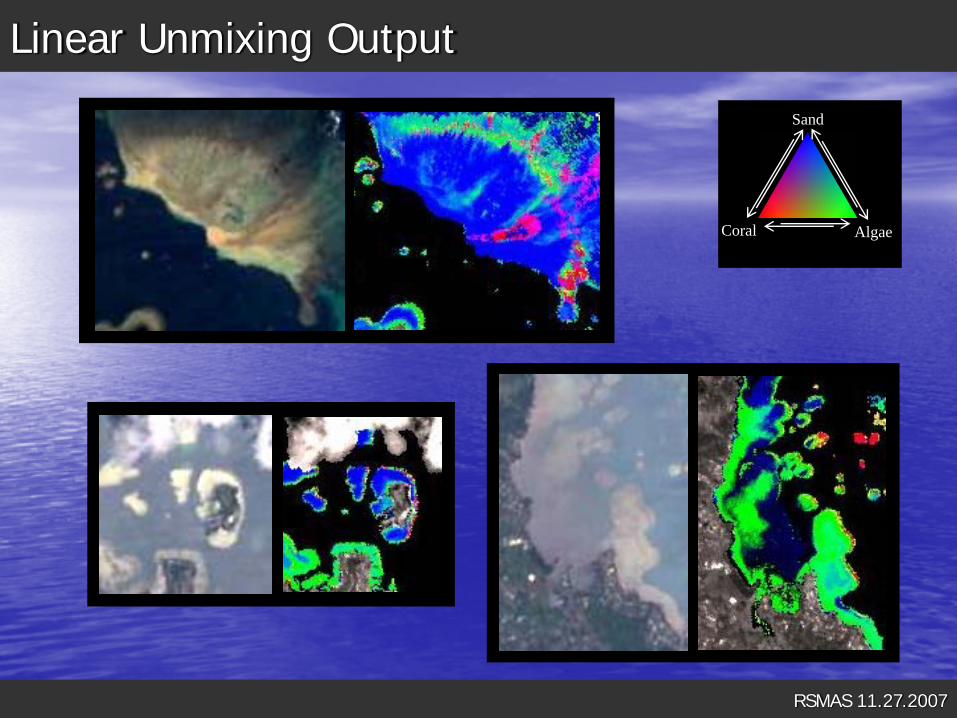
Linear Unmixing Output
Sand
AlgaeCoral
RSMAS 11.27.2007
James A. Goodman, PhD, PE
Center for Subsurface Sensing and Imaging SystemsLaboratory for Applied Remote Sensing and Image Processing
University of Puerto Rico at Mayaguez