Embed Size (px)
Citation preview
8/14/2019 2008 Annual Report January–December Prepared Exclusively for Use By
http://slidepdf.com/reader/full/2008-annual-report-januarydecember-prepared-exclusively-for-use-by 1/8
Prepared exclusivelyfor use by
Beverly-Hanks& Associates
Local market information brought to you courtesy of
Agent Nameaddress
2008AnnualReport
January–December

8/14/2019 2008 Annual Report January–December Prepared Exclusively for Use By
http://slidepdf.com/reader/full/2008-annual-report-januarydecember-prepared-exclusively-for-use-by 2/8
I I don’t know that I have ever witnessed our country so excited about a new year. Most folks areeager to put 2008 as far as possible in the rear view mirror. Those of us in the real estate andconstruction industries can certainly understand why. The statistics in this report bear out the facts
that many of you already know. 2008 was one of the toughest years our marketplace has seen inquite some time. The question on everyone’s mind is “what can we expect in 2009?” Opinions varyquite a bit on this subject. One reality that became crystal clear to many of us in 2008 is that ourlocal economy and real estate market is tied much more closely to the national and world economies
than ever before. Our high quality of life, varied employment base and historically modest levels ofnew construction inventory position our community in much greater stead than most markets in thecountry but certainly do not isolate us from the fact that many Americans have experienced signi cantdecreases in their net worth and/or their liquidity. When combined with continued uncertaintyregarding the economy, consumer con dence is understandably at low levels. From our perspectiveconsumer con dence will be the catalyst that will turn the tide in the real estate industry.The good news is that with the recent inauguration of President Obama our country appears to beoptimistically looking ahead. A new stimulus package containing incentives related to our industrysuch as a homebuyers credit and an increase in the jumbo loan limits could have a signi cantpositive impact upon sales activity. Many markets such as Florida, California and Arizona whichexperienced the most dramatic downturns in real estate sales and values are now experiencingsigni cant increases in sales as buyers believe that prices are now at bargain levels. It also appears
that mortgage interest rates will remain historically low throughout 2009. The combination of thesefactors could lead to positive momentum for the real estate industry. A little bit of positive momentumwill quickly improve consumer con dence in America’s best investment, Real Estate. Once consumer con dence improves we are off and running. Let’s hope all of the above occurs sooner rather thanlater.At Beverly-Hanks and Associates we stand ready to provide you with trusted advice and counselduring these challenging times. We will consider it a privilege to assist you with your real estateneeds, whatever they may be, in 2009.
W. Neal Hanks, Jr.
Your source forthe most up-to-date
real estate information
A personal message from Owner & President
Neal Hanks, Jr.
8/14/2019 2008 Annual Report January–December Prepared Exclusively for Use By
http://slidepdf.com/reader/full/2008-annual-report-januarydecember-prepared-exclusively-for-use-by 3/8JANUA
RY –D
ECEMBER
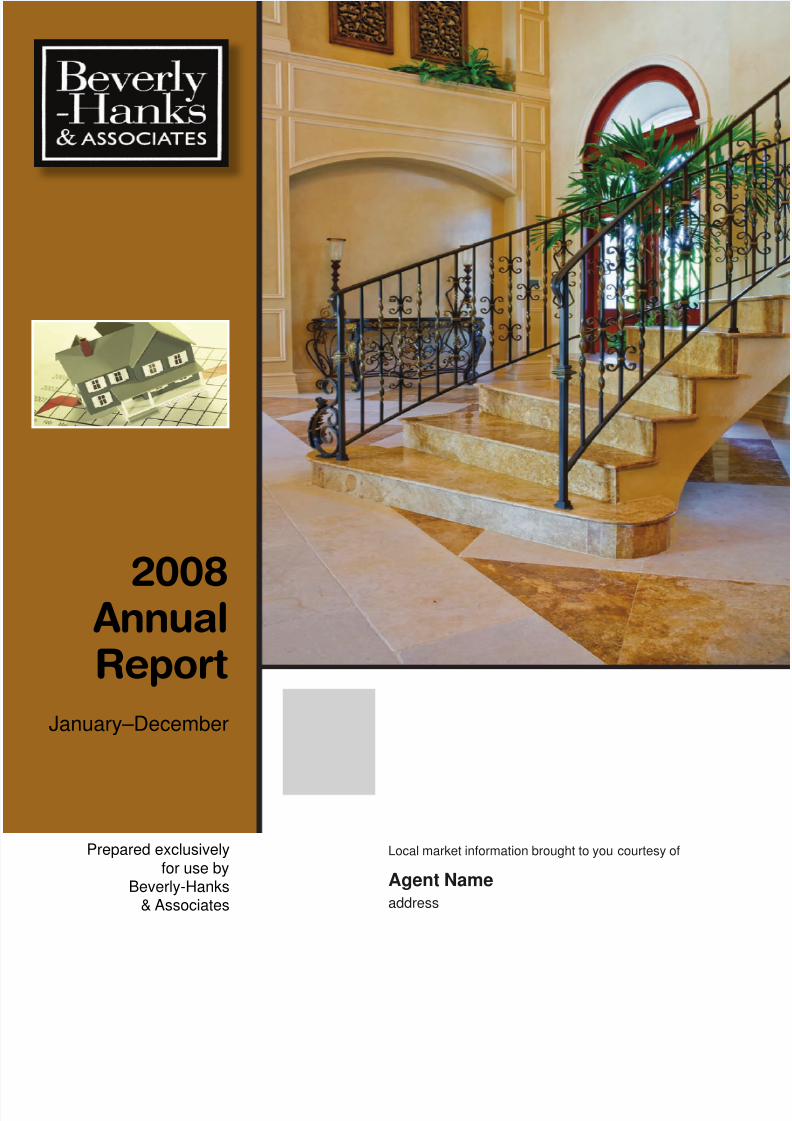
Average Home Selling Price
Number of Homes Sold
NOTE: Information as reported by the North Carolina Mountains Multiple Listing Service. The North Carolina Mountains Multiple Listing Servicedoes not guarantee or is in any way responsible for its accuracy. Data maintained by the Multiple Listing Service may not re ect all realestate activity in the market. These gures are based upon actual closed transactions as reported through the above mentioned service.
* These totals and averages include all sales reported through the North Carolina Mountains Multiple Listing Service.
COUNTY 2008 2007 % change
Buncombe 2,455 3,479 -29.4%Haywood 549 813 -32.5%
Henderson 1,202 1,857 -35.3%Madison 114 170 -32.9%
Polk 105 170 -38.2%Rutherford 174 242 -28.1%
Transylvania 282 430 -34.4%
*TOTAL 5,114 7,527 -32.1%
COUNTY 2008 2007 % change
Buncombe $277,830 $293,651 -5.4%Haywood $220,036 $246,768 -10.8%
Henderson $232,514 $259,254 -10.3%
Madison $236,665 $245,217 -3.5%Polk $283,075 $344,647 -17.9%
Rutherford $222,133 $234,440 -5.2%Transylvania $305,878 $339,777 -10.0%
*TOTAL $257,985 $277,644 -7.1%
2 0 0 8 T o
t a l s
Fact:We have SOLDover 1,600 propertiesthis year.
2 0 0 8 A v e r a g
e s
8/14/2019 2008 Annual Report January–December Prepared Exclusively for Use By
http://slidepdf.com/reader/full/2008-annual-report-januarydecember-prepared-exclusively-for-use-by 4/8
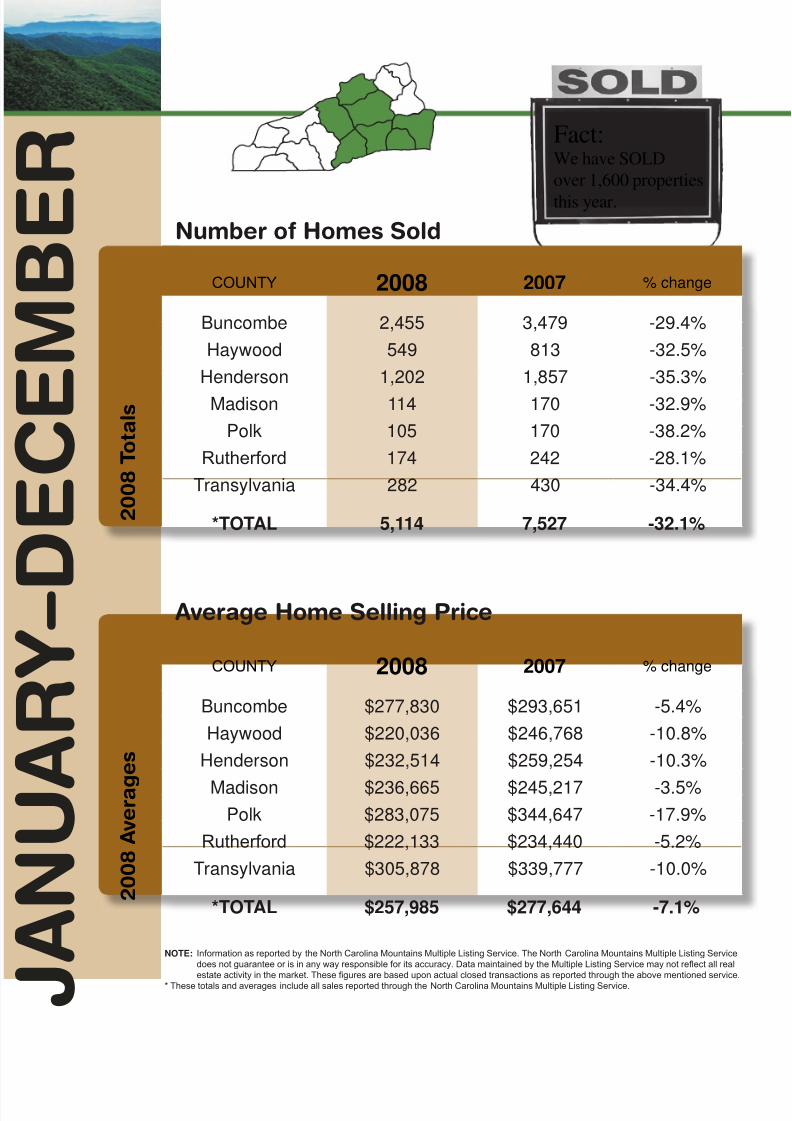
Housing Supply vs. Demand
YTDUnitsSold
YTDMonthlyAverage
Units Sold
1/13/2009ActiveUnits
AbsorptionRate**
PRICE RANGE JAN FEB MAR APR MAY JUN JUL AUG SEP OCT NOV DEC
$0–$74,999 18 21 26 14 18 23 16 18 18 17 15 18 222 18.5 133 7.19$75,000–$149,999 84 96 107 98 99 97 104 96 85 104 58 89 1,117 93.1 950 10.20$150,000–$199,999 75 71 88 98 127 95 106 109 74 86 58 63 1,050 87.5 1,051 12.01$200,000–$249,999 60 77 79 84 98 78 96 84 53 63 51 46 869 72.4 1,004 13.87$250,000–$299,999 46 39 60 58 57 52 58 45 48 47 38 28 577 48.1 908 18.88$300,000–$349,999 25 18 34 28 40 39 29 37 36 22 20 21 349 29.1 561 19.28$350,000–$399,999 11 18 22 27 15 31 27 26 32 20 17 18 264 22.0 620 28.18$400,000–$449,999 12 18 8 15 24 26 14 12 11 17 8 3 168 14.0 330 23.57$450,000–$499,999 8 9 9 10 17 11 13 14 8 10 5 4 118 9.8 388 39.59$500,000–$549,999 10 5 8 10 12 6 16 10 6 7 5 10 105 9.8 198 20.20$550,000–$599,999 6 2 5 8 4 17 6 8 5 5 3 9 78 6.5 255 39.23$600,000–$699,000 6 3 3 7 4 7 5 2 5 6 5 7 60 5.0 271 54.20$700,000–$799,000 3 3 4 4 9 5 4 4 4 2 5 3 50 4.2 179 42.62$800,000–$899,999 2 2 0 3 3 2 4 4 5 5 2 5 37 3.1 144 46.45$900,000–$999,999 1 3 4 3 0 1 5 5 2 3 1 2 30 2.5 104 41.60$1 Million–$1.9 Million 4 6 3 4 3 1 5 7 5 7 2 1 48 4.0 379 94.75$2 Million–$2.9 Million 2 0 0 1 0 0 1 1 0 2 0 0 7 0.6 77 128.33$3 Million–$4.9 Million 0 0 0 0 0 0 0 1 0 0 0 0 1 0.1 21 210$5 Million Plus 0 0 0 0 0 0 0 0 0 0 0 0 0 0.0 9 unknownTOTALS 374 391 460 472 530 491 509 483 397 423 293 327 5,150 429.17 7,584 17.67
Western North Carolina Region
2 0 0 8 T o
t a l s
YTDUnitsSold
YTDMonthlyAverage
Units Sold
1/13/2009ActiveUnits
AbsorptionRate**
PRICE RANGE JAN FEB MAR APR MAY JUN JUL AUG SEP OCT NOV DEC
$0–$74,999 9 8 4 3 6 5 4 3 8 2 4 4 60 5 23 4.60$75,000–$149,999 30 35 42 46 51 46 47 32 29 38 22 33 451 37.6 312 8.30$150,000–$199,999 39 33 55 45 59 48 57 54 33 41 23 31 516 43.0 384 8.93$200,000–$249,999 35 45 44 44 45 37 51 40 21 31 25 22 440 36.7 365 9.95$250,000–$299,999 24 19 29 34 33 27 24 25 23 19 17 10 284 23.7 318 13.42$300,000–$349,999 13 10 16 12 22 23 17 14 21 10 9 7 174 14.5 216 14.60$350,000–$399,999 6 10 17 16 9 13 18 13 22 9 11 9 154 12.8 233 18.20$400,000–$449,999 9 9 3 10 15 12 5 8 4 10 6 2 93 7.7 144 18.70$450,000–$499,999 2 3 3 2 7 7 9 9 4 5 4 2 57 4.8 162 33.75$500,000–$549,999 5 1 6 6 7 4 12 9 3 5 4 8 70 5.8 82 14.14$550,000–$599,999 5 0 3 5 1 9 3 4 3 0 1 8 42 3.5 100 28.57$600,000–$699,000 4 2 1 4 1 5 2 1 3 5 3 5 36 3.0 96 32.00$700,000–$799,000 2 3 3 2 7 3 3 1 2 2 2 2 32 2.7 70 25.93$800,000–$899,999 1 2 0 1 1 1 3 2 2 4 2 4 23 1.9 69 36.32$900,000–$999,999 0 2 3 3 0 1 4 1 0 2 1 0 17 1.4 45 32.14$1 Million–$1.9 Million 4 6 3 1 3 0 2 4 2 6 0 0 31 2.6 195 75.00$2 Million–$2.9 Million 1 0 0 1 0 0 0 0 0 2 0 0 4 0.3 31 103.33$3 Million–$4.9 Million 0 0 0 0 0 0 0 0 0 0 0 0 0 0.0 10 unknown$5 Million Plus 0 0 0 0 0 0 0 0 0 0 0 0 0 0.0 4 unknownTOTALS 189 188 232 235 267 241 261 220 180 191 134 147 2,485 207.1 2,859 13.8
Buncombe County
2 0 0 8 T o
t a l s
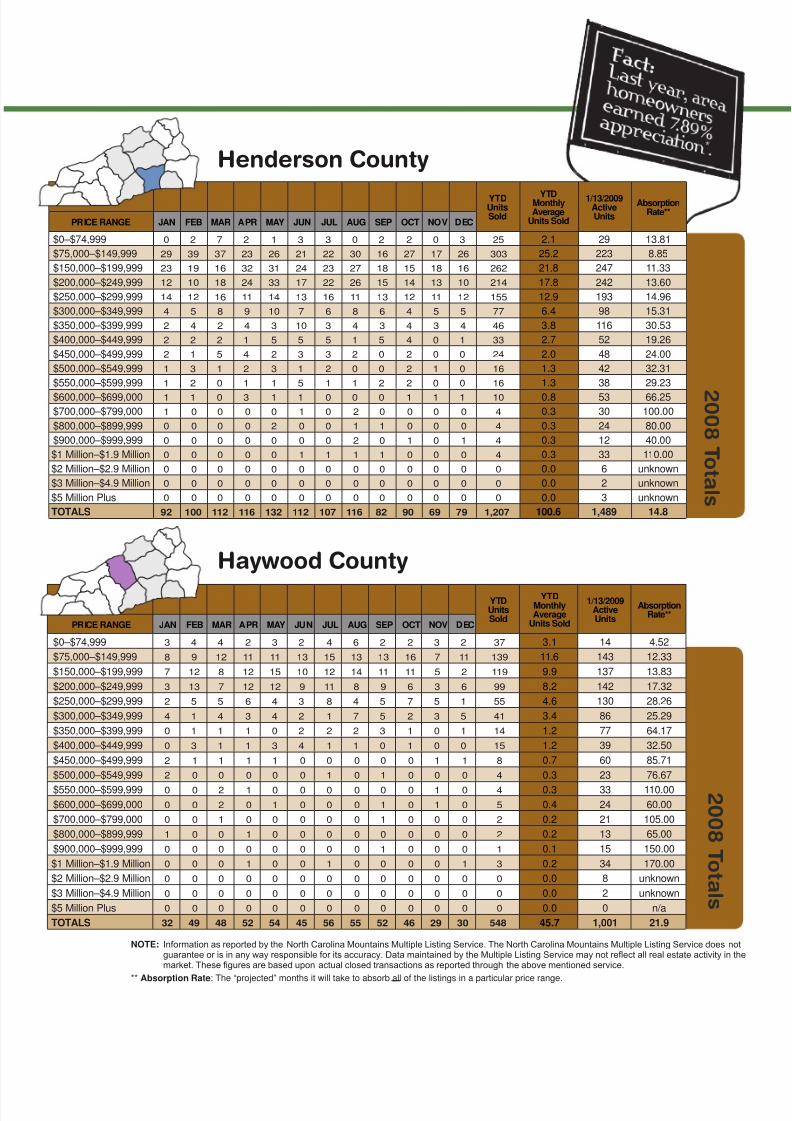
2008 Annual Report
NOTE: Information as reported by the North Carolina Mountains Multiple Listing Service. The North Carolina Mountains Multiple Listing Service does notguarantee or is in any way responsible for its accuracy. Data maintained by the Multiple Listing Service may not re ect all real estate activity in themarket. These gures are based upon actual closed transactions as reported through the above mentioned service.
**Absorption Rate : The “projected” months it will take to absorb all of the listings in a particular price range.
8/14/2019 2008 Annual Report January–December Prepared Exclusively for Use By
http://slidepdf.com/reader/full/2008-annual-report-januarydecember-prepared-exclusively-for-use-by 5/8
2 0 0 8 T o t a l s
2 0 0 8 T o t a l s
NOTE: Information as reported by the North Carolina Mountains Multiple Listing Service. The North Carolina Mountains Multiple Listing Service does notguarantee or is in any way responsible for its accuracy. Data maintained by the Multiple Listing Service may not re ect all real estate activity in themarket. These gures are based upon actual closed transactions as reported through the above mentioned service.
**Absorption Rate : The “projected” months it will take to absorb all of the listings in a particular price range.
YTDUnitsSold
YTDMonthlyAverage
Units Sold
1/13/2009ActiveUnits
AbsorptionRate**
PRICE RANGE JAN FEB MAR APR MAY JUN JUL AUG SEP OCT NOV DEC
$0–$74,999 0 2 7 2 1 3 3 0 2 2 0 3 25 2.1 29 13.81$75,000–$149,999 29 39 37 23 26 21 22 30 16 27 17 26 303 25.2 223 8.85$150,000–$199,999 23 19 16 32 31 24 23 27 18 15 18 16 262 21.8 247 11.33$200,000–$249,999 12 10 18 24 33 17 22 26 15 14 13 10 214 17.8 242 13.60$250,000–$299,999 14 12 16 11 14 13 16 11 13 12 11 12 155 12.9 193 14.96$300,000–$349,999 4 5 8 9 10 7 6 8 6 4 5 5 77 6.4 98 15.31$350,000–$399,999 2 4 2 4 3 10 3 4 3 4 3 4 46 3.8 116 30.53$400,000–$449,999 2 2 2 1 5 5 5 1 5 4 0 1 33 2.7 52 19.26$450,000–$499,999 2 1 5 4 2 3 3 2 0 2 0 0 24 2.0 48 24.00$500,000–$549,999 1 3 1 2 3 1 2 0 0 2 1 0 16 1.3 42 32.31$550,000–$599,999 1 2 0 1 1 5 1 1 2 2 0 0 16 1.3 38 29.23$600,000–$699,000 1 1 0 3 1 1 0 0 0 1 1 1 10 0.8 53 66.25$700,000–$799,000 1 0 0 0 0 1 0 2 0 0 0 0 4 0.3 30 100.00$800,000–$899,999 0 0 0 0 2 0 0 1 1 0 0 0 4 0.3 24 80.00$900,000–$999,999 0 0 0 0 0 0 0 2 0 1 0 1 4 0.3 12 40.00$1 Million–$1.9 Million 0 0 0 0 0 1 1 1 1 0 0 0 4 0.3 33 110.00$2 Million–$2.9 Million 0 0 0 0 0 0 0 0 0 0 0 0 0 0.0 6 unknown$3 Million–$4.9 Million 0 0 0 0 0 0 0 0 0 0 0 0 0 0.0 2 unknown$5 Million Plus 0 0 0 0 0 0 0 0 0 0 0 0 0 0.0 3 unknownTOTALS 92 100 112 116 132 112 107 116 82 90 69 79 1,207 100.6 1,489 14.8
Henderson County
YTDUnitsSold
YTDMonthlyAverage
Units Sold
1/13/2009ActiveUnits
AbsorptionRate**
PRICE RANGE JAN FEB MAR APR MAY JUN JUL AUG SEP OCT NOV DEC
$0–$74,999 3 4 4 2 3 2 4 6 2 2 3 2 37 3.1 14 4.52$75,000–$149,999 8 9 12 11 11 13 15 13 13 16 7 11 139 11.6 143 12.33$150,000–$199,999 7 12 8 12 15 10 12 14 11 11 5 2 119 9.9 137 13.83$200,000–$249,999 3 13 7 12 12 9 11 8 9 6 3 6 99 8.2 142 17.32$250,000–$299,999 2 5 5 6 4 3 8 4 5 7 5 1 55 4.6 130 28.26$300,000–$349,999 4 1 4 3 4 2 1 7 5 2 3 5 41 3.4 86 25.29$350,000–$399,999 0 1 1 1 0 2 2 2 3 1 0 1 14 1.2 77 64.17$400,000–$449,999 0 3 1 1 3 4 1 1 0 1 0 0 15 1.2 39 32.50$450,000–$499,999 2 1 1 1 1 0 0 0 0 0 1 1 8 0.7 60 85.71$500,000–$549,999 2 0 0 0 0 0 1 0 1 0 0 0 4 0.3 23 76.67$550,000–$599,999 0 0 2 1 0 0 0 0 0 0 1 0 4 0.3 33 110.00$600,000–$699,000 0 0 2 0 1 0 0 0 1 0 1 0 5 0.4 24 60.00$700,000–$799,000 0 0 1 0 0 0 0 0 1 0 0 0 2 0.2 21 105.00$800,000–$899,999 1 0 0 1 0 0 0 0 0 0 0 0 2 0.2 13 65.00$900,000–$999,999 0 0 0 0 0 0 0 0 1 0 0 0 1 0.1 15 150.00$1 Million–$1.9 Million 0 0 0 1 0 0 1 0 0 0 0 1 3 0.2 34 170.00$2 Million–$2.9 Million 0 0 0 0 0 0 0 0 0 0 0 0 0 0.0 8 unknown$3 Million–$4.9 Million 0 0 0 0 0 0 0 0 0 0 0 0 0 0.0 2 unknown$5 Million Plus 0 0 0 0 0 0 0 0 0 0 0 0 0 0.0 0 n/aTOTALS 32 49 48 52 54 45 56 55 52 46 29 30 548 45.7 1,001 21.9
Haywood County
8/14/2019 2008 Annual Report January–December Prepared Exclusively for Use By
http://slidepdf.com/reader/full/2008-annual-report-januarydecember-prepared-exclusively-for-use-by 6/8
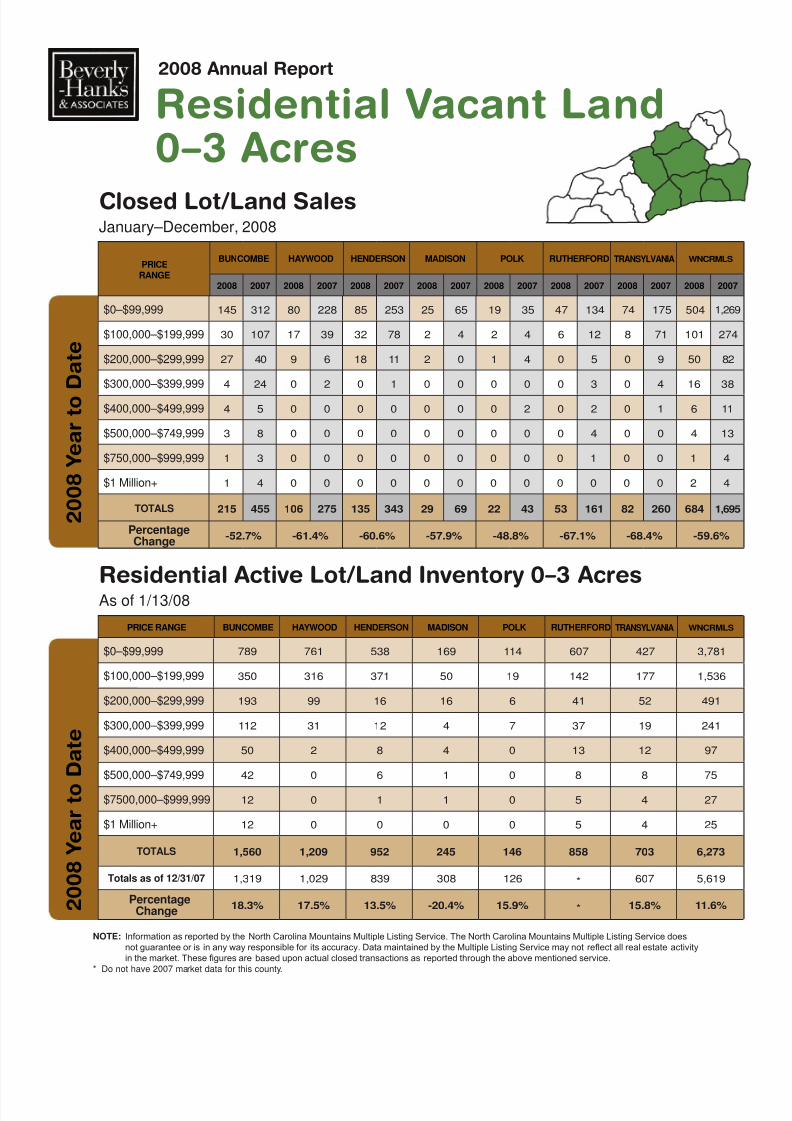
NOTE: Information as reported by the North Carolina Mountains Multiple Listing Service. The North Carolina Mountains Multiple Listing Service doesnot guarantee or is in any way responsible for its accuracy. Data maintained by the Multiple Listing Service may not re ect all real estate activityin the market. These gures are based upon actual closed transactions as reported through the above mentioned service.
* Do not have 2007 market data for this county.
Residential Vacant Land0–3 Acres
2008 Annual Report
PRICERANGE
BUNCOMBE HAYwOOD HENDERSON MADISON POLk RUTHERFORD TRANSYLVANIA wNCRMLS
2008 2007 2008 2007 2008 2007 2008 2007 2008 2007 2008 2007 2008 2007 2008 2007
$0–$99,999 145 312 80 228 85 253 25 65 19 35 47 134 74 175 504 1,269
$100,000–$199,999 30 107 17 39 32 78 2 4 2 4 6 12 8 71 101 274
$200,000–$299,999 27 40 9 6 18 11 2 0 1 4 0 5 0 9 50 82
$300,000–$399,999 4 24 0 2 0 1 0 0 0 0 0 3 0 4 16 38
$400,000–$499,999 4 5 0 0 0 0 0 0 0 2 0 2 0 1 6 11
$500,000–$749,999 3 8 0 0 0 0 0 0 0 0 0 4 0 0 4 13
$750,000–$999,999 1 3 0 0 0 0 0 0 0 0 0 1 0 0 1 4
$1 Million+ 1 4 0 0 0 0 0 0 0 0 0 0 0 0 2 4
TOTALS 215 455 106 275 135 343 29 69 22 43 53 161 82 260 684 1,695
PercentageChange -52.7% -61.4% -60.6% -57.9% -48.8% -67.1% -68.4% -59.6%
Closed Lot/Land SalesJanuary–December, 2008
2 0 0 8 Y e a r
t o D a
t e
PRICE RANGE BUNCOMBE HAYwOOD HENDERSON MADISON POLk RUTHERFORD TRANSYLVANIA wNCRMLS
$0–$99,999 789 761 538 169 114 607 427 3,781
$100,000–$199,999 350 316 371 50 19 142 177 1,536
$200,000–$299,999 193 99 16 16 6 41 52 491
$300,000–$399,999 112 31 12 4 7 37 19 241
$400,000–$499,999 50 2 8 4 0 13 12 97
$500,000–$749,999 42 0 6 1 0 8 8 75
$7500,000–$999,999 12 0 1 1 0 5 4 27
$1 Million+ 12 0 0 0 0 5 4 25
TOTALS 1,560 1,209 952 245 146 858 703 6,273
Totals as of 12/31/07 1,319 1,029 839 308 126 * 607 5,619
PercentageChange 18.3% 17.5% 13.5% -20.4% 15.9% * 15.8% 11.6% 2
0 0 8 Y e a r
t o D a
t e
Residential Active Lot/Land Inventory 0–3 AcresAs of 1/13/08
8/14/2019 2008 Annual Report January–December Prepared Exclusively for Use By
http://slidepdf.com/reader/full/2008-annual-report-januarydecember-prepared-exclusively-for-use-by 7/8
NOTE: Information as reported by the North Carolina Mountains Multiple Listing Service. The North Carolina Mountains Multiple Listing Service doesnot guarantee or is in any way responsible for its accuracy. Data maintained by the Multiple Listing Service may not re ect all real estate activityin the market. These gures are based upon actual closed transactions as reported through the above mentioned service.
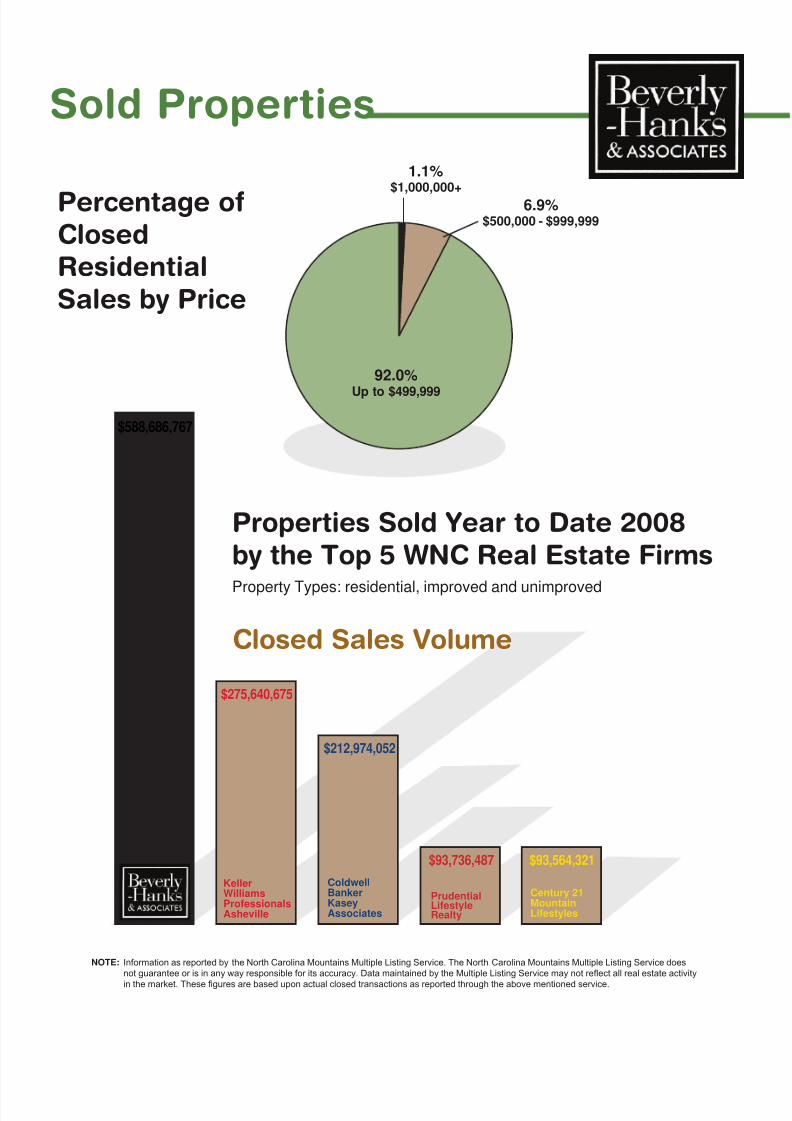
Percentage ofClosedResidentialSales by Price
Sold Properties
Century 21MountainLifestyles
$93,564,321
ColdwellBankerKaseyAssociates
KellerWilliamsProfessionalsAsheville
PrudentialLifestyleRealty
$588,686,767
$275,640,675
$212,974,052
$93,736,487
Closed Sales Volume
Properties Sold Year to Date 2008by the Top 5 WNC Real Estate FirmsProperty Types: residential, improved and unimproved
92.0%Up to $499,999
1.1%$1,000,000+
6.9%$500,000 - $999,999
8/14/2019 2008 Annual Report January–December Prepared Exclusively for Use By
http://slidepdf.com/reader/full/2008-annual-report-januarydecember-prepared-exclusively-for-use-by 8/8
Agent NameAgent AddressAgent AddressAgent Phone
300 Executive ParkAsheville, NC 28801
This edition of the
is being sent to you by Agent Name . It containsvaluable real estate information for Western NorthCarolina. Call (Agent First Name) for professionalreal estate service and accurate, trusted marketinformation: (Agent Phone Number).
Downtown Asheville 828-254-7221South Asheville 828-684-8999Hendersonville 828-697-0515North Asheville 828-251-1800Weaverville 828-658-9500Waynesville 828-452-5809Biltmore Park 828-684-9020Lake Lure 828-62 -8846
www.beverly-hanks.com
2008 Annual Report
5