Embed Size (px)
Citation preview

PPrrooffiilleeXXTT® TTeecchhnniiccaall MMaannuuaall
Fifth Edition April 2008
Profiles International, Inc. Profiles Office Park
5205 Lake Shore Drive Waco, Texas 76710 USA

Copyright © 2008 • ALL RIGHTS RESERVED
Profiles International, Inc. Profiles Office Park
5205 Lake Shore Drive Waco, Texas 76710 USA
www.profilesinternational.com
254.751.1644
The ProfileXT® Technical Manual
Table of Contents Chapter 1: INTRODUCTION .......................................................................... 1-1 The Norm Population ................................................................... 1-4 Demographics of the Norming Population ................................... 1-5 The Target Population for the ProfileXT ....................................... 1-6 The Use of Standardized Scoring ................................................ 1-6 ProfileXT Reliability ....................................................................................... 1-7 Using Job Match Patterns ............................................................................. 1-8 Building Job Match Patterns ................................................................. 1-10 The Job Match Percent ........................................................................ 1-17 Understanding the Percentage Match to a Job Pattern ........................ 1-18 ProfileXT Validity ........................................................................................ 1-20 Meta-analytic Study .............................................................................. 1-20 Specific Examples of the ProfileXT in use ................................................... 1-22 The PXT in use by a Healthcare Organization...................................... 1-22 Participants ................................................................................ 1-22 Job Match Percent ..................................................................... 1-23 Performance Grouping ............................................................... 1-23 Details ........................................................................................ 1-23 Summary ................................................................................... 1-24 The PXT in use by a Mortgage Lending Firm ....................................... 1-24 Participants ................................................................................ 1-24 Job Match Percent ..................................................................... 1-24 Performance Grouping ............................................................... 1-24 Details ........................................................................................ 1-25 Summary ................................................................................... 1-25 The PXT in use by a Financial Organization ........................................ 1-26 Participants ................................................................................ 1-26 Job Match Percent ..................................................................... 1-26 Performance Grouping ............................................................... 1-26 Details ........................................................................................ 1-27 Summary ................................................................................... 1-27 The PXT in use by a Mortgage Lending Organization .......................... 1-27 Participants ................................................................................ 1-28 Job Match Percent ..................................................................... 1-28 Performance Grouping ............................................................... 1-28 Details ........................................................................................ 1-29 Summary ................................................................................... 1-29 ProfileXT Adverse Impact Analysis ............................................................. 1-30 Chapter 2: DEVELOPMENT of the PXT .......................................................... 2-1 The Behavioral Traits Section ....................................................................... 2-1 The Occupational Interests Section ............................................................... 2-3 PXT Occupational Interests Section: Focus on Common Activities............. 2-5
- ToC 1 -
The ProfileXT® Technical Manual
Developing the List of Activities for Each Interests Theme .......... 2-5 Interests Theme Coding ............................................................... 2-6 The Thinking Styles Section .......................................................................... 2-7 Refinement of the Two Learning Scales to Four Scales .............. 2-8 Chapter 3: BEHAVIORAL TRAITS .................................................................. 3-1 Descriptive Statistics ..................................................................................... 3-1 Reliability Analysis ......................................................................................... 3-3 Coefficient Alpha Reliability Analysis ...................................................... 3-4 Test-retest Reliability Analysis ................................................................ 3-5 A Test-retest Study with Employees from the Workforce ............. 3-5 Validity ............................................................................................................ 3-8 The Construct Validity Approach ............................................................ 3-8 Intercorrelation of the PXT Scales ............................................... 3-9 Energy Level and Decisiveness Scales ..................................... 3-10 Assertiveness and Decisiveness Scales .................................... 3-10 Manageability and Attitude Scales ............................................. 3-11 Independence and Manageability Scales .................................. 3-11 Correlation with Other Assessments .................................................... 3-12 The Guilford-Zimmerman Temperament Survey (GZTS) ........... 3-12 Gordon Personal Profile-Inventory (GPP-I) ................................ 3-14 California Psychological Inventory (CPI) .................................... 3-17 The Criterion-Related Validity Approach .......... .....................................3-21 Research Designs Used For Criterion-Related Validation ......... 3-21 Concurrent Validity ............................................................................... 3-21 Predicting Sales Performance ................................................... 3-22 Study 1 ............................................................................ 3-22 Study 2 ............................................................................ 3-23 Study 3 ............................................................................ 3-24 Predicting Customer Service Performance ................................ 3-25 Predicting Management Performance ....................................... 3-26 Study 1 ............................................................................ 3-26 Study 2 ............................................................................ 3-27 Study 3 ............................................................................ 3-28 Study 4 ............................................................................ 3-29 Study 5 ............................................................................ 3-29 Predicting Employee Turnover ................................................... 3-30 Predicting Organization Status .................................................. 3-31 Meta-analysis of the Predictive Utility of Behavioral Traits Percent Matches ........... 3-34 Validation of the Distortion Scale................................................................. 3-35 Adverse Impact ..................................................................................... 3-38 Differences in Mean Raw Score ...................................... 3-38 Differences in Job Match Percent ................................... 3-40 Summary and Conclusions ......................................................................... 3-42
- ToC 2 -
The ProfileXT® Technical Manual
Chapter 4: OCCUPATIONAL INTERESTS ..................................................... 4-1 Descriptive Statistics ..................................................................................... 4-1 Reliability Analysis ......................................................................................... 4-1 Coefficient Alpha Reliability Analysis ...................................................... 4-2 Test-retest Reliability Analysis ................................................................ 4-3 A Test-retest Study with Employees from the Workforce ............. 4-3 Validity ........................................................................................................... 4-5 The Construct Validity Approach ............................................................ 4-5 Intercorrelation of PXT Scales ..................................................... 4-5 Correlation Matrix-Six Occupational Scales: SDS & PXT ............ 4-7 Concurrent Validity ................................................................................. 4-8 Summary of Concurrent Validity Analysis .................................. 4-16 Predictive Validity ................................................................................. 4-18 Meta-analysis of the Predictive Utility of Occupational Interests Percent Matches ........... 4-20 Adverse Impact Studies ........................................................................ 4-22 Raw Score Differences ................................................... 4-22 Differences in Job Match Percent ................................... 4-25 Summary and Conclusions ......................................................................... 4-27 Chapter 5: THINKING STYLES ....................................................................... 5-1 Descriptive Statistics ..................................................................................... 5-1 Reliability Analysis ......................................................................................... 5-1 Test-retest Reliability Analysis ................................................................ 5-2 A Test-retest Study with Employees from the Workforce ............. 5-3 Validity ........................................................................................................... 5-5 Validity in the Educational Environment ................................................. 5-5 Validity in the Industrial Environment ...................................................... 5-5 Meta-analysis of the Predictive Utility of Thinking Styles Percent Matches ... 5-8 Refinement of the Two Learning Scales to Four Scales ............. 5.10 Adverse Impact ........................................................................................ 5-10 Raw Score Differences ......................................................................... 5-10 Differences in Job Match Percent ......................................................... 5-12 Summary and Conclusions ......................................................................... 5-15 Appendix A: REVIEW of the ProfileXT SCALES ............................ Appendix A-1 Behavioral Traits ..................................................................... Appendix A-1 Thinking Styles Scales ........................................................... Appendix A-4 Occupational Interests ............................................................ Appendix A-4 The Distortion Scale ............................................................... Appendix A-6 Appendix B: ADVERSE IMPACT & the 4/5ths RULE ....................... Appendix B-1 Reliability ................................................................................ Appendix B-1 Test Validity ............................................................................ Appendix B-1 Understanding the Job Match Percent ................................... Appendix B-3 Job Classification and Ethnicity .............................................. Appendix B-3
- ToC 3 -
The ProfileXT® Technical Manual
- ToC 4 -
Utilizing Job Patterns: Effect upon Adverse Impact .............. Appendix B-12 Subsequent Salesperson Study ........................................... Appendix B-16 Appendix C: ADVERSE IMPACT RAW SCORES .......................... Appendix C-1 Raw Score Differences: Behavioral Section .......................... Appendix C-1 Raw Score Differences: Interests Section ........................... Appendix C-17 Raw Score Differences: Thinking Styles Section ................. Appendix C-29 Appendix D: ADVERSE IMPACT and JOB MATCH PERCENT ..... Appendix D-1 Appendix E: CASE STUDIES ......................................................... Appendix E-1 The PXT in use by a Credit Union .......................................... Appendix E-1 The PXT in use by a Psychiatric Hospital ............................... Appendix E-2 The PXT in use by a Travel Agency ....................................... Appendix E-3 The PXT in use by a Retail Company ..................................... Appendix E-5 The PXT in use by a Hospital ................................................. Appendix E-6 The PXT in use by an Oil Field Service Company .................. Appendix E-7 The PXT in use by a Technological Consulting Organization . Appendix E-8 The PXT in use by a Data Service Organization .................... Appendix E-9 The PXT in use by a Medical Devices Distribution Organization .................. ........................................................................ Appendix E-11 The PXT in use by an International Pharmaceuticals Sales Organization .... ........................................................................ Appendix E-12 The PXT in use by an Insurance Company .......................... Appendix E-14 The PXT in use by Advertising Sales Organization .............. Appendix E-15 Appendix F: Early Development of Behavioral Scales .................... Appendix F-1 Appendix G: Examples of the ProfileXT Reports ............................ Appendix G-1 Bibliography

The ProfileXT® Technical Manual
References
Alexander, E.R. & Wilkins, R.D. (1982). Performance rating validity: The relationship of objective and subjective measure of performance. Group and Organization Studies, 7, 485-498.
Arvey, R.D. (1979). Fairness in selecting employees. Reading, MA: Addison-Wesley. Barrick, M.R. & Mount, M.K. (1991). The big five personality dimensions and job performance. Personnel Psychology, 44,1-26. Bourdeau, J. (1998). Employment testing manual. Boston, MA: Warren, Gorham & Lamont. Cohen, J. (1988). Statistical power analysis for the behavioral sciences. Hillsdale, NJ: Lawrence Erlbaum. Crocker, L. & Algina, J. (1986). Introduction to classical & modern test theory. Orlando, FL: Holt, Rinehart, and Winston, Inc. Cronbach, L.J. (1984). Essentials of psychological testing (4th edition). San Francisco: Harper & Row. Day, D.V. & Silverman, S.B. (1989). Personality and job performance: Evidence of incremental validity. Personnel Psychology, 42, 25-35. Edens, J.F. (2004). Effects of response distortion on the assessment of divergent facets of psychopathy. Assessment, Vol. 11, No. 1 (109-112). Sage Publications. Field, A.P. (1999). A bluffer’s guide to meta-analysis I: Correlations. Newsletter of the Mathematical, Statistical, and Computing Section of the British Psychological Society, Vol. 7, No. 1. (19991), pp. 16-25. Ghiselli, E.E., (1973). The validity of aptitude tests in personnel selection. Personnel Psychology, 26, 461-477. Goldenberg, S. (1992). Thinking Methodologically. New York: Harper Collins. Gordon, L.V. (1978). Gordon personal profile – Inventory manual. New York: Harcourt Brace Jovanovich. Gottfredson, G.D. & Holland, J.L. (1989). Dictionary of Holland occupational codes (2nd edition). Odessa, FL: Psychological Assessment Resources. Guilford, J.P. & Zimmerman, W.S. (1978). The Guilford-Zimmerman temperament survey: Manual of instructions and interpretations. Beverly Hills, CA: Sheridan Psychological Services, Inc. Guilford, J.P. & Zimmerman, W.S. (1976). The Guilford-Zimmerman temperament survey handbook. San Diego, CA: EDITS. Heneman, R.L. (1986). The relationship between supervisory ratings and results-oriented Measures of performance: A meta-analysis. Personnel Psychology, 39, 811-826. Hogan, R. (1991). Personality and Personality Measurement. M. Dunnette and L. Hough (Eds.) Handbook of Industrial and Organizational Psychology (2nd edition). Palo Alto, CA: Consulting Psychologists Press.
©2008, Profiles International, Inc., Waco, Texas
The ProfileXT® Technical Manual
©2008, Profiles International, Inc., Waco, Texas
Holland, J.L. (1970). Vocational preference inventory manual. Palo Alto, CA: Consulting Psychologists Press. Holland, J.L. (1985a). Making vocational choices: A theory of vocational personalities and work environments. Odess, FL: Psychological Assessment Resources. Holland, J.L. (1985b). The vocational preference inventory. Odessa, FL: Psychological Assessment Resources. Holland, J.L. (1994). The self-directed search. Odessa, FL: Psychological Assessment Resources. Hunter, J.E. & Schmidt, F.L. (2004). Methods of meta-analysis: Correcting error and bias in Research findings (2nd edition). Newbury Park, CA: Sage. Hunter, J.E. & Hunter, R.F. (1984). Validity and utility of alternative predictors of job performance. Psychological Bulletin, 96, 72098. Terman, L.M. & Merrill, M.A. (1960). Stanford-Binet intelligence scale: Manual for the third Revision, Form L-M. Boston, MA: Houghton Mifflin. Thurstone, L.L. (1938). Primary mental abilities: Psychometric monographs, No. 1. Chicago, IL: U. of Chicago Press. U.S. Department of Labor (1977). Dictionary of occupational titles (4th edition). Washington, DC: U.S. Government Printing Office. U.S. Department of Labor (1982). Dictionary of occupational titles (4th edition supplement, 1982). Washington, DC: U.S. Government Printing Office. U.S. Department of Labor (1986). Dictionary of occupational titles (4th edtion supplement, 1986). Washington, DC: U.S. Government Printing Office. U.S. Department of Labor (2000). The nation’s new resource of occupational information. Retrieved July 20, 2000 from: http://www.doleta.gov/programs/onet. U.S. Department of Labor, Employment and Training Administration (1999). Testing and Assessment: An employer’s guide to good practices. Washington, DC: U.S. Printing Press. Vineberg, R. & Joyner, J.H. (1982). Prediction of job performance: Review of military studies. Alexandria, VA: Human Resources Research Organization. Wechsler, David. (1944). Measurement of adult intelligence (3rd edition). Baltimore, MD: Williams & Wilkins. Wechsler, D. (1958). The measure of adult intelligence (4th edition). Baltimore, MD: Williams & Wilkins.
THE PROFILEXT® TECHNICAL MANUAL
©2008, Profiles International, Inc., Waco, Texas
1-1
Chapter 1: INTRODUCTION
This technical document was revised in 2007 to reflect the latest information available concerning our ongoing analysis of the ProfileXT®. Further statistical and technical review will continue, as required, in our effort to keep the assessment and its technical documentation current. Changes to this document include slight reorganization of the chapters, updates to the statistical studies with current data, and editorial content improvements.
In the business world, where it is so easy to duplicate products and undercut prices, the key strategic advantage for most companies is the performance of their employees. Employees who are well matched to their position have higher attendance records, less turnover, higher job satisfaction, and superior job performance. Both the employee and the employer share the benefits of enhanced person-job fit.
As part of the Profiles International, Inc. line of assessment tools for employers, the ProfileXT is designed to facilitate achieving the best possible fit for positions in the working world in which the characteristics measured can be used to help predict job performance. Our clients use the ProfileXT to develop effective work teams, design optimal training programs based on the trainees’ style of learning, help supervisors determine which approach will work best when working with a particular employee, and help develop succession plans.
The ProfileXT is a psychometric instrument whose history extends over the last 25 years. More than 400,000 job applicants and incumbents have participated in its development. These sample groups represent a diverse cross section of ages, ethnic groups, income levels, educational levels, job titles, companies, and industries. The ProfileXT is the result of collaboration between several test development psychologists and specialists coordinated by Profiles International, Inc.
The ProfileXT (PXT) is constructed as a test battery and investigates three areas (Behavioral Traits, Occupational Interests, and Thinking Style) as a part of evaluating how an individual fits into a particular job. By reviewing broad areas of occupational interests, behavioral traits, and thinking style, we expand our ability to discover which areas will be most effective in determining job fit for a given position. By attending to each of the three areas, we enhance the opportunity to identify the factors that will lead to the best job fit.
THE PROFILEXT® TECHNICAL MANUAL
©2008, Profiles International, Inc., Waco, Texas
1-2
These areas are composed of a variety of constructs reported on 20; ten-point standardized STEN scales (see Appendix A for a detailed description of each scale). Each scale represents a construct related to one of three sections found in the ProfileXT:
1. Behavioral Traits: The psychological premise that observable behavior is a reflection of cognitive states suggests there is a relationship between personality and behavior.
2. Occupational Interests: Holland’s person-environment typology theory, “one’s motivation for work can be associated with various interest categories” (Holland, 1979).
3. Thinking Style: Cognitive abilities are a key predictor of success in occupational pursuits (Hunter and Hunter, 1984).
The contribution of each of the three areas to successful job placement is well documented in the literature. These areas were chosen for inclusion in the ProfileXT because of their potential contribution to the goal of successful job placement.
Behavioral or personality traits have been studied for many years as potential indicators of success on the job. Hogan, Hogan, and Roberts (1996) wrote, “The data are reasonably clear that well constructed personality measures are valid predictors of job performance…” The concept that personality factors are predictive of job performance is supported by meta analytic studies reported by others (Barrick and Mount, 1991; Tett, Jackson and Rothstein, 1991).
Cognitive abilities are often used in job selection because of their demonstrated impact on job success (Hunter and Hunter, 1984). They found that “… ability tests are valid across all jobs in predicating job proficiency” (p. 80). These findings were supported by Ghisell (1973) and Vinebery and Joyner (1982).
Holland’s person-environment typology theory, “one’s motivation for work can be associated with various interest categories,” has also stood the test of time in the literature. Holland’s theory is easy to understand, presents clear definitions, is internally consistent and is easy to apply to virtually any position (Gottfredson, Holland and Ogawa, 1982). His division of the world of work into six comprehensive themes lends itself well to the client understanding the results.
THE PROFILEXT® TECHNICAL MANUAL
©2008, Profiles International, Inc., Waco, Texas
1-3
Results from the ProfileXT are prominent in the hiring process when used as a part of the decision making process. All of the three sections provide a unique perception of the Job Match Pattern, the individual’s results, and the necessary considerations as to the job match for that individual. While there is some overlap in these three perspectives, their uniquely different views broaden the information about the individual. When these perspectives are combined with other available information, the expanded information yields improved quality in the decision making process.
In general, the overriding theme of the PXT scales is that while cognitive abilities, occupational interests, and behavioral traits each have demonstrated effectiveness in predicting success on the job, the combination of their unique perspectives into one assessment battery greatly enhances the ability to make good job placements. Together, their combined results offer a greater understanding of the total individual.
To create scales which measure constructs relevant to our underlying theoretical perspective and focus on the core of work-related behavior, a substantial pool of items was developed, administered, and factor analyzed. The resultant constructs we identified satisfied our conceptual and practical needs without creating an overly complex assessment of the countless layers of human personality. In other words, while personality may be described in a great number of constructs, a practical compromise was to focus on nine essential aspects of behavior, six occupational interests, and five measures of learning potential.
Our practical intent is to provide the business community with an easy-to-administer assessment of relevant, work-related constructs which describe the working individual. These constructs, as measured by the PXT scales, provide the assessment user with a variety of relevant and applicable questions to use when interacting with a candidate. Reliability and construct validity analyses met with our expectations; revealing coherent, consistent, and practical scales with which to measure the working population.
A primary use of the ProfileXT, by most clients, is to investigate the potential match an applicant might have to a specific job. This complex task is easily accomplished through the use of the PXT software. The result is information that will guide the interviewer or decision maker to consider important information about the applicant and how well they will fit to the job. The interview questions and coaching comments generated by the software provide better information for making good decisions than has typically been available to the decision maker.
THE PROFILEXT® TECHNICAL MANUAL
©2008, Profiles International, Inc., Waco, Texas
1-4
The scoring of all assessment items is done automatically within the software and the results are presented to the user in the form of STEN scores for each scale and the percentage of match to the specific job under consideration. The confidential reports may be delivered to the individual identified by the client. The test-taker may obtain a copy of the Individual Report which has language describing the test-taker but no scores or reference to the client’s proprietary Job Match Pattern the client has developed.
The Norm Population
The current population used for norming is made up of our target population who will make use of this assessment tool. They are the actual employees and applicants for more than 25,000 organizations in North America. These organizations represent a diverse range of activities including: manufacturing, software development, financial services, law enforcement, public and private education facilities, medical services, professional associations, charities, construction, etc.
The individuals in the norm group have educational attainments ranging from no high school to doctoral level degrees including Medical Doctor, Doctor of Osteopathy, Doctor of Philosophy, Doctor of Education, Doctor of Law, Doctor of Chiropractic, etc. They have developed Job Match Patterns (benchmarks) representing positions at all levels of an organization. The methods for creating these Job Match Patterns include studies of concurrent validity and predictive validity, job analysis surveys, and the refinement of existing Job Match Patterns to fit more perfectly to their situation.
Examples of the more than 25,000 job titles represented in the collection of more than 250,000 Job Match Patterns developed by our clients, include positions found at all levels of the organizations; from custodian to chief executive officer, unskilled worker to professional, laborer to manager.
THE PROFILEXT® TECHNICAL MANUAL
©2008, Profiles International, Inc., Waco, Texas
1-5
Demographics of the Norm Population
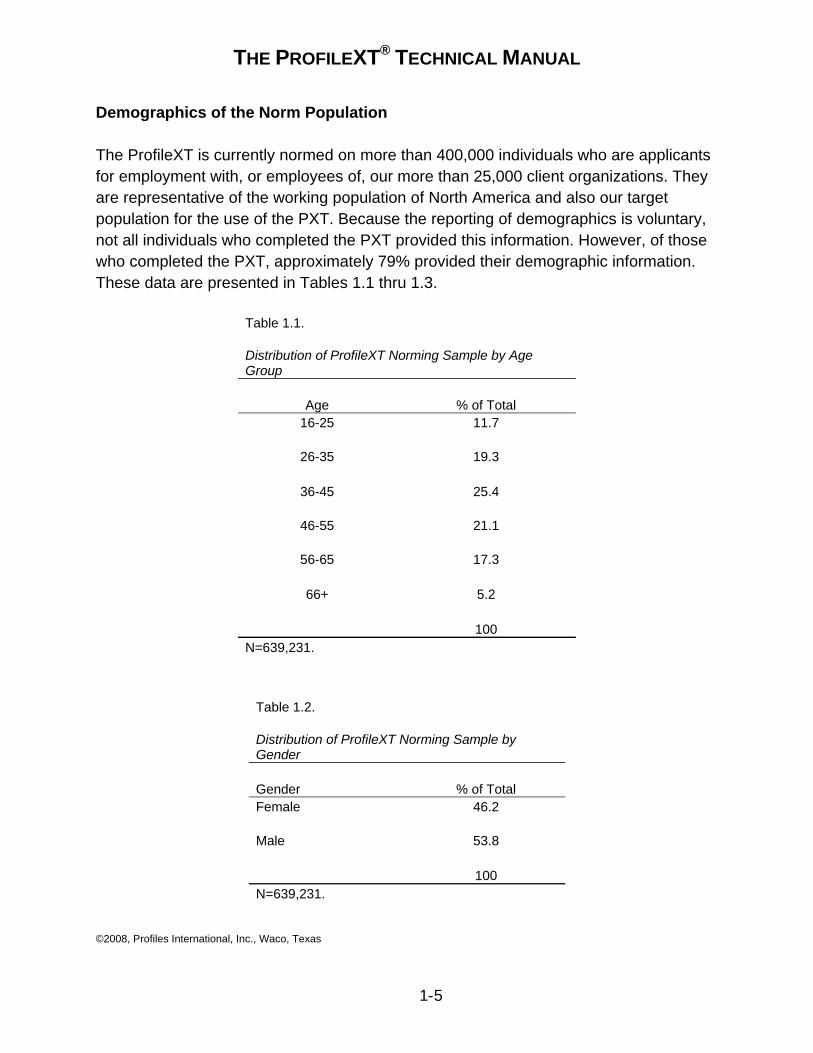
The ProfileXT is currently normed on more than 400,000 individuals who are applicants for employment with, or employees of, our more than 25,000 client organizations. They are representative of the working population of North America and also our target population for the use of the PXT. Because the reporting of demographics is voluntary, not all individuals who completed the PXT provided this information. However, of those who completed the PXT, approximately 79% provided their demographic information. These data are presented in Tables 1.1 thru 1.3.
Table 1.1. Distribution of ProfileXT Norming Sample by Age Group
Age % of Total 16-25 11.7
26-35 19.3
36-45 25.4
46-55 21.1
56-65 17.3
66+ 5.2
100
N=639,231.
Table 1.2. Distribution of ProfileXT Norming Sample by Gender Gender % of Total Female 46.2 Male 53.8 100 N=639,231.
THE PROFILEXT® TECHNICAL MANUAL
©2008, Profiles International, Inc., Waco, Texas
1-6
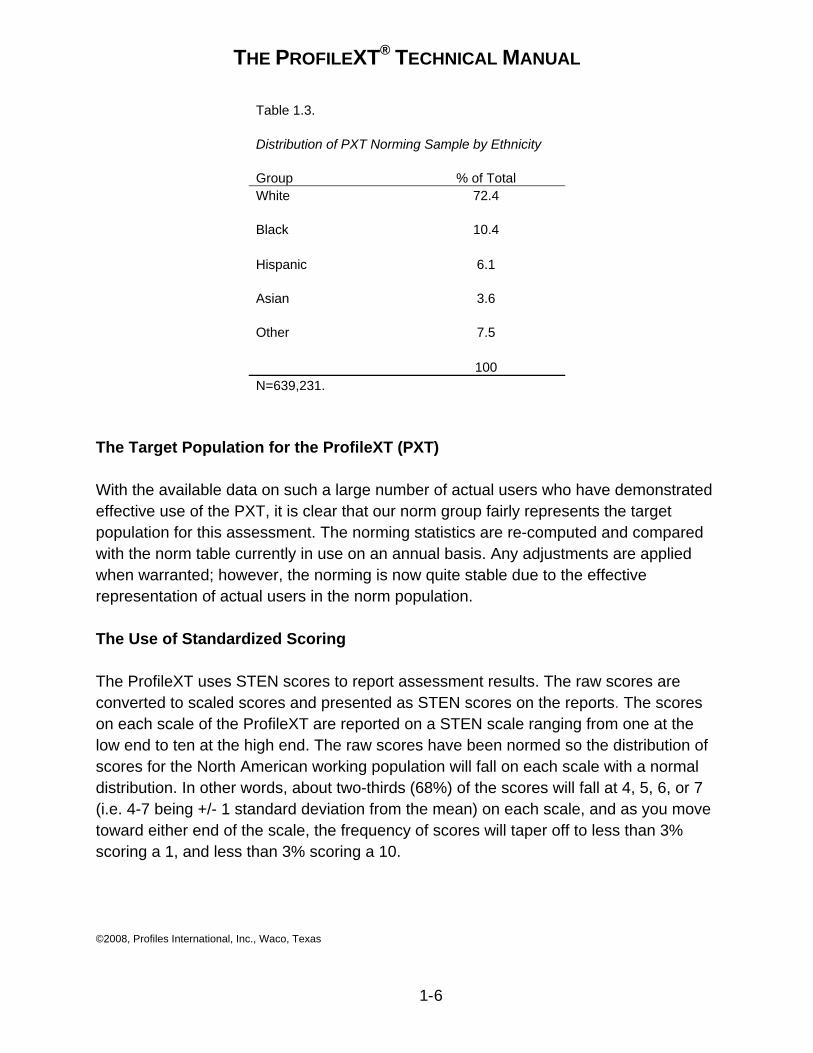
Table 1.3. Distribution of PXT Norming Sample by Ethnicity Group % of Total White 72.4 Black 10.4 Hispanic 6.1 Asian 3.6 Other 7.5 100 N=639,231.
The Target Population for the ProfileXT (PXT)
With the available data on such a large number of actual users who have demonstrated effective use of the PXT, it is clear that our norm group fairly represents the target population for this assessment. The norming statistics are re-computed and compared with the norm table currently in use on an annual basis. Any adjustments are applied when warranted; however, the norming is now quite stable due to the effective representation of actual users in the norm population.
The Use of Standardized Scoring
The ProfileXT uses STEN scores to report assessment results. The raw scores are converted to scaled scores and presented as STEN scores on the reports. The scores on each scale of the ProfileXT are reported on a STEN scale ranging from one at the low end to ten at the high end. The raw scores have been normed so the distribution of scores for the North American working population will fall on each scale with a normal distribution. In other words, about two-thirds (68%) of the scores will fall at 4, 5, 6, or 7 (i.e. 4-7 being +/- 1 standard deviation from the mean) on each scale, and as you move toward either end of the scale, the frequency of scores will taper off to less than 3% scoring a 1, and less than 3% scoring a 10.
THE PROFILEXT® TECHNICAL MANUAL
©2008, Profiles International, Inc., Waco, Texas
1-7
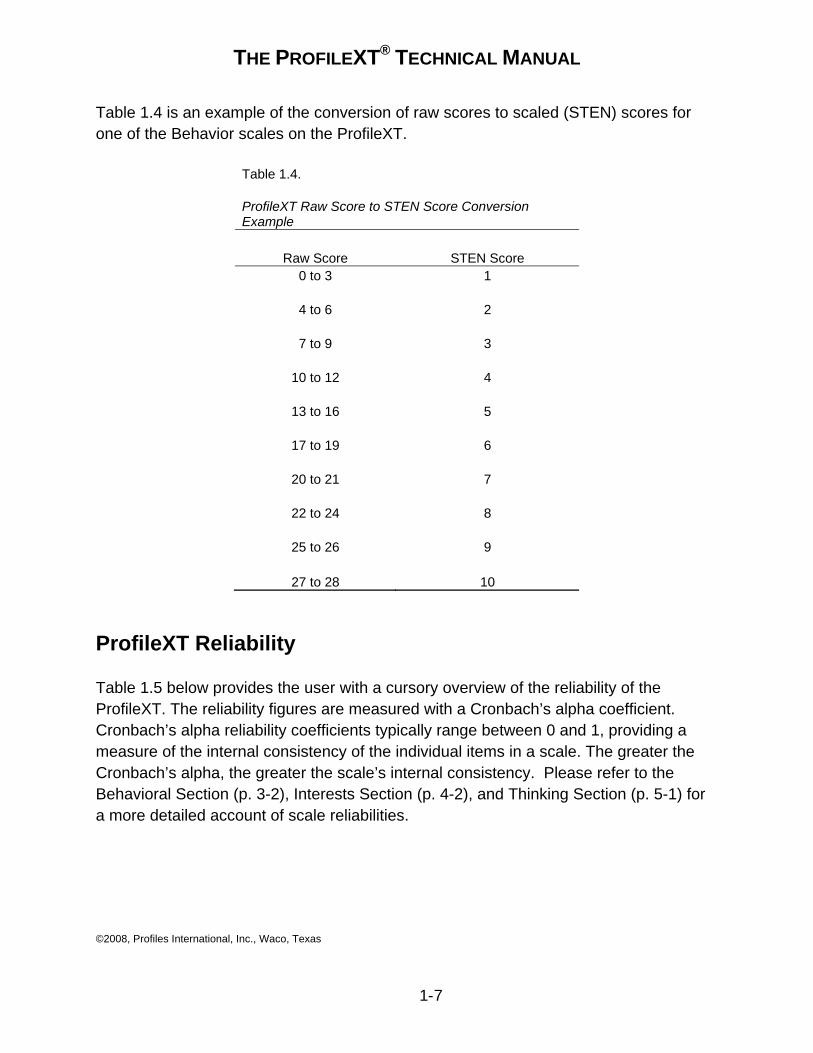
Table 1.4 is an example of the conversion of raw scores to scaled (STEN) scores for one of the Behavior scales on the ProfileXT.
Table 1.4. ProfileXT Raw Score to STEN Score Conversion Example
Raw Score STEN Score 0 to 3 1
4 to 6 2
7 to 9 3
10 to 12 4
13 to 16 5
17 to 19 6
20 to 21 7
22 to 24 8
25 to 26 9
27 to 28 10
ProfileXT Reliability
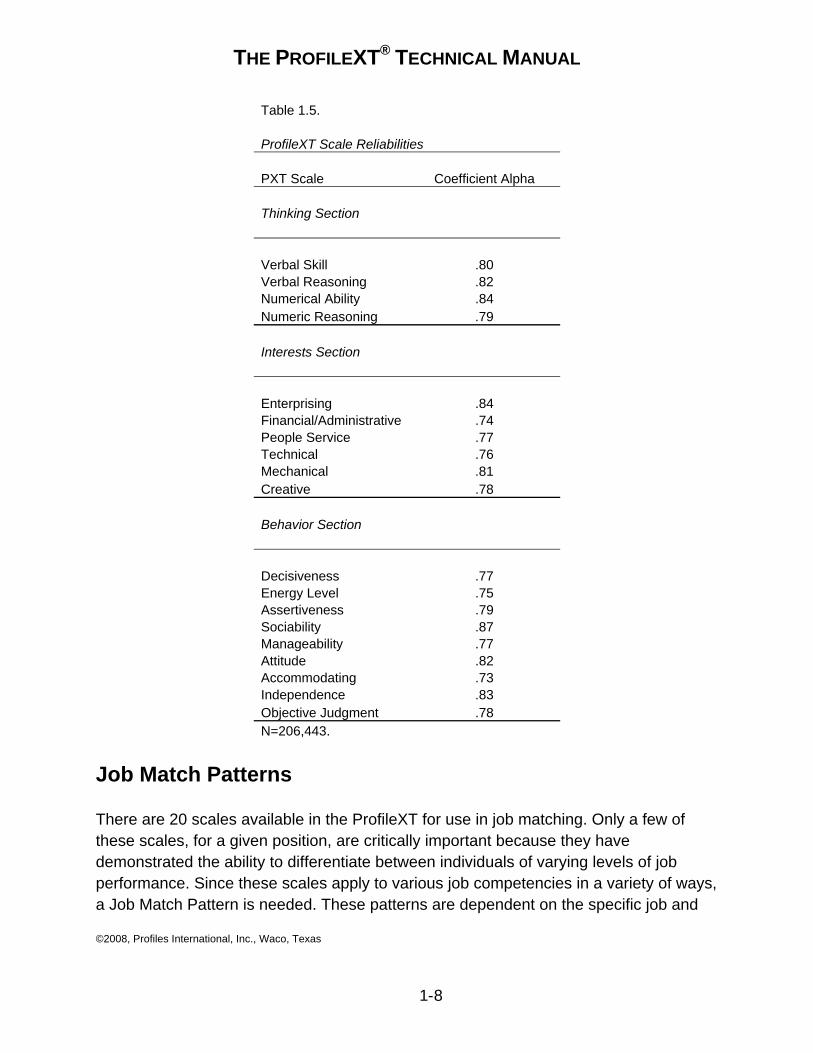
Table 1.5 below provides the user with a cursory overview of the reliability of the ProfileXT. The reliability figures are measured with a Cronbach’s alpha coefficient. Cronbach’s alpha reliability coefficients typically range between 0 and 1, providing a measure of the internal consistency of the individual items in a scale. The greater the Cronbach’s alpha, the greater the scale’s internal consistency. Please refer to the Behavioral Section (p. 3-2), Interests Section (p. 4-2), and Thinking Section (p. 5-1) for a more detailed account of scale reliabilities.
THE PROFILEXT® TECHNICAL MANUAL
©2008, Profiles International, Inc., Waco, Texas
1-8
Table 1.5. ProfileXT Scale Reliabilities PXT Scale Coefficient Alpha Thinking Section Verbal Skill .80 Verbal Reasoning .82 Numerical Ability .84 Numeric Reasoning .79 Interests Section Enterprising .84 Financial/Administrative .74 People Service .77 Technical .76 Mechanical .81 Creative .78 Behavior Section Decisiveness .77 Energy Level .75 Assertiveness .79 Sociability .87 Manageability .77 Attitude .82 Accommodating .73 Independence .83 Objective Judgment .78 N=206,443.
Job Match Patterns
There are 20 scales available in the ProfileXT for use in job matching. Only a few of these scales, for a given position, are critically important because they have demonstrated the ability to differentiate between individuals of varying levels of job performance. Since these scales apply to various job competencies in a variety of ways, a Job Match Pattern is needed. These patterns are dependent on the specific job and
THE PROFILEXT® TECHNICAL MANUAL
©2008, Profiles International, Inc., Waco, Texas
1-9
work environment for each client. By standardizing the job fit process, Job Match Patterns reveal more than individual scores on each scale. The job match process for the ProfileXT represents an effective approach which minimizes the time required to efficiently describe jobs, people, and how well they match. The descriptive process usually starts by examining the score patterns of those who are most successful and those who are least successful within a specific position. The resulting pattern of scores across the various dimensions measured by The ProfileXT serves as the initial pattern, or benchmark, upon which the job matching is based.
The Job Match process has been proven to be both effective and fair when used appropriately. In one study, approximately 300 employees were evaluated to understand the possible impact on minorities when employees were selected using Job Match Patterns. Individuals representing racially mixed groups applied for jobs at an organization that had developed patterns for the positions using criterion validity studies. These positions were at different levels within the organization (i.e. administrative, customer service, skilled trade, technology, supervisory, and management). Utilizing the Rule of 4/5th, it was determined there was no adverse impact on any of the employees studied (i.e. Asian, Black, Hispanic, and White). This study is presented in detail in Appendix B.
A similar study was conducted using a sample of over 900,000 job matching cases. This study utilized a statistical Analysis of Variance to observe the degree of difference between Job Match Percents among ethnic, gender, and age groups. Again, no appreciable differences were found. Appendix D details the statistical research for this study.
The ProfileXT software allows a concurrent study analysis of the incumbents’ PXT scores, the employer completed job analysis survey, and/or a combination of these. The PXT software provides a method for the analysis of the PXT scores for individuals at all levels of job performance to facilitate the building of Job Match Patterns. By using appropriate performance measures for the job under consideration, the patterns help differentiate between those individuals the client has identified as top performers, and those whose performance is less than desired. The client provides the appropriate job performance measure because of their expertise and knowledge of what represents good performance in the position.
The client builds each Job Match Pattern for use in their organization. There are several methods for creating the pattern; the software guides the client through the process.
THE PROFILEXT® TECHNICAL MANUAL
©2008, Profiles International, Inc., Waco, Texas
1-10
The client typically uses the PXT results from two groups of employees with different job performance levels to build a Job Match Pattern. This pattern identifies the measured characteristics that differentiate between these two groups. This Job Match Pattern may then be used to provide additional information about applicants for the position.
Even with a small sample you have a good place to start the process and can develop an approach that allows you to further refine the job pattern with ongoing evaluation. It should be noted that this initial success profile is continuously updated as more empirical information becomes available. It is important for a business to continually maintain the job relevance of the process by which employees are placed.
Using a Job Match Pattern makes it easier to quickly identify when individuals will fit well into positions and when they might have adjustments to make. This information is important for both job placement and job training. The patterns also help determine when more information may be required and will generate interview questions to ask the applicants (Placement Report), or coaching comments for discussion with the supervisors of incumbents (Coaching Report).
Building Job Match Patterns
The purpose of a Job Match Pattern (or benchmark) is to identify the characteristics that differentiate between those who are effective in a position and those who are challenged by the position. There are several approaches commonly used to establish the level of job performance for each individual. Generally, they are quantifiable, behavioral, and directly related to the job.
The Chinese have reported that as far back as 2200 B.C., they were conducting job analysis to establish the characteristics necessary to be successful as a public official. Some of the desired characteristics included horsemanship, poetry, music, archery, arithmetic, and ceremonial rites. It is not reported how these characteristics were measured in the applicants (DuBois, 1964).
In more modern times, specialists have been used to observe workers to decide on the characteristics critical to success on the job. Others have used the approach of interviewing supervisors and other experts to identify the desirable characteristics for success in a position.
THE PROFILEXT® TECHNICAL MANUAL
©2008, Profiles International, Inc., Waco, Texas
1-11
Once the characteristics that predict success were established, the presence of those characteristics in applicants had to be measured to determine their fit to a position. While this traditional approach facilitated job placements, its effectiveness depended on many variables including the expert’s knowledge of which questions to ask supervisors, the accuracy of the supervisor’s knowledge, correctly identifying the actual behaviors for success, associating the characteristics in the employees that influence the actual presence of the desired behaviors, and so forth.
An important trend in the assessment industry has been the use of localized patterns rather than very broad and generalized descriptions of work to help fit employees to exact positions. The ProfileXT focuses on this purpose.
For example, we found that if you built a job pattern to fit a salesperson you would get a wide, generic pattern that poorly differentiates between the effective salesperson selling wholesale auto parts and the one effective in selling women’s shoes. We have also found significant regional differences between successful sales people in New York, California, and Iowa, for example. This is where Job Match Patterns built to fit exact positions becomes critical for successful placements.
The first important step is to identify the criterion necessary for establishing good job performance. These are usually provided by the client because they are the expert in the quality performance they are seeking from their employees. Such quantifiable job performance measures might include sales quota efficiency, error rates, product production levels, customer complaints, etc. Often the job performance measures relate to the presenting problem with which the client is concerned (e.g., poor productivity, high turnover, frequent customer complaints, etc.).
With good job performance measures and the use of criterion validity studies (concurrent), it is then possible to identify the Top Performers in a position as well as those performers who are not as proficient.
The next step is to identify the characteristics of the Top Performers and those of the Bottom Performers using the capabilities of the PXT software. This is done in a two step process. After Top Performers have been identified in the computer, the software produces a preliminary Job Match Pattern (JMP) using proprietary algorithms that consider the various characteristics of the Top Performers’ scores such as mean, median, mode, range, etc. The Bottom Performers are also identified in the computer and the software uses the same algorithms to build a preliminary Job Match Pattern for
THE PROFILEXT® TECHNICAL MANUAL
©2008, Profiles International, Inc., Waco, Texas
1-12
this group. The resulting Job Match Patterns are then compared to help identify the characteristics which differentiate the two groups. With these data, an effective JMP may be developed for use in assessing applicants for the position. The pattern for the scales that do not contribute in the differentiation between the two groups may be made very wide so their impact on the Overall Job Match Percent is minimized.
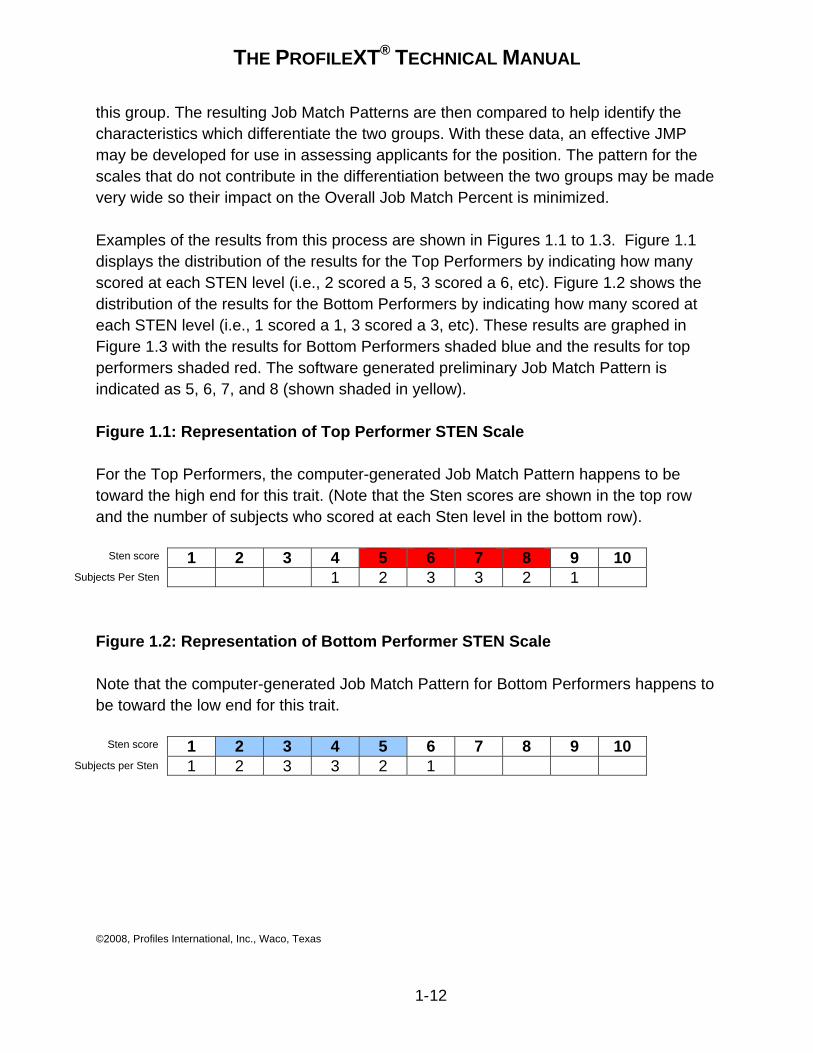
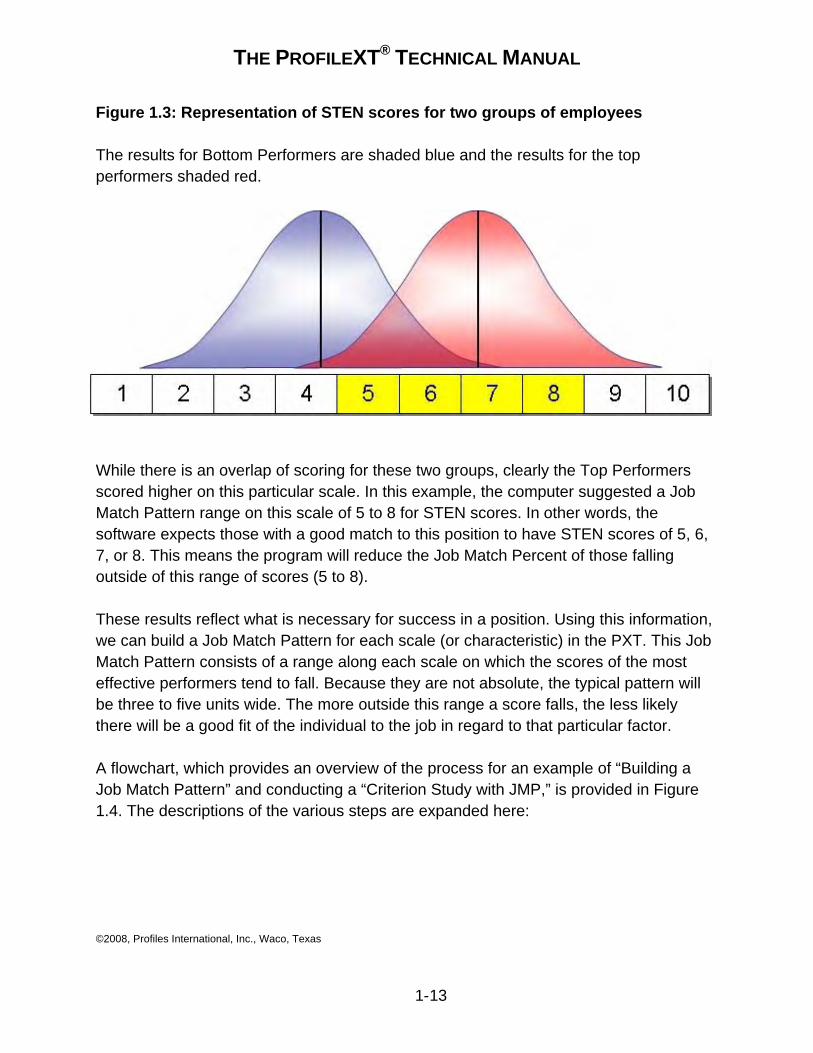
Examples of the results from this process are shown in Figures 1.1 to 1.3. Figure 1.1 displays the distribution of the results for the Top Performers by indicating how many scored at each STEN level (i.e., 2 scored a 5, 3 scored a 6, etc). Figure 1.2 shows the distribution of the results for the Bottom Performers by indicating how many scored at each STEN level (i.e., 1 scored a 1, 3 scored a 3, etc). These results are graphed in Figure 1.3 with the results for Bottom Performers shaded blue and the results for top performers shaded red. The software generated preliminary Job Match Pattern is indicated as 5, 6, 7, and 8 (shown shaded in yellow).
Figure 1.1: Representation of Top Performer STEN Scale
For the Top Performers, the computer-generated Job Match Pattern happens to be toward the high end for this trait. (Note that the Sten scores are shown in the top row and the number of subjects who scored at each Sten level in the bottom row).
1 2 3 4 5 6 7 8 9 10 1 2 3 3 2 1
Figure 1.2: Representation of Bottom Performer STEN Scale
Note that the computer-generated Job Match Pattern for Bottom Performers happens to be toward the low end for this trait.
Sten score
Subjects Per Sten
Sten score
Subjects per Sten 1 2 3 4 5 6 7 8 9 10 1 2 3 3 2 1
THE PROFILEXT® TECHNICAL MANUAL
©2008, Profiles International, Inc., Waco, Texas
1-13
Figure 1.3: Representation of STEN scores for two groups of employees
The results for Bottom Performers are shaded blue and the results for the top performers shaded red.
While there is an overlap of scoring for these two groups, clearly the Top Performers scored higher on this particular scale. In this example, the computer suggested a Job Match Pattern range on this scale of 5 to 8 for STEN scores. In other words, the software expects those with a good match to this position to have STEN scores of 5, 6, 7, or 8. This means the program will reduce the Job Match Percent of those falling outside of this range of scores (5 to 8).
These results reflect what is necessary for success in a position. Using this information, we can build a Job Match Pattern for each scale (or characteristic) in the PXT. This Job Match Pattern consists of a range along each scale on which the scores of the most effective performers tend to fall. Because they are not absolute, the typical pattern will be three to five units wide. The more outside this range a score falls, the less likely there will be a good fit of the individual to the job in regard to that particular factor.
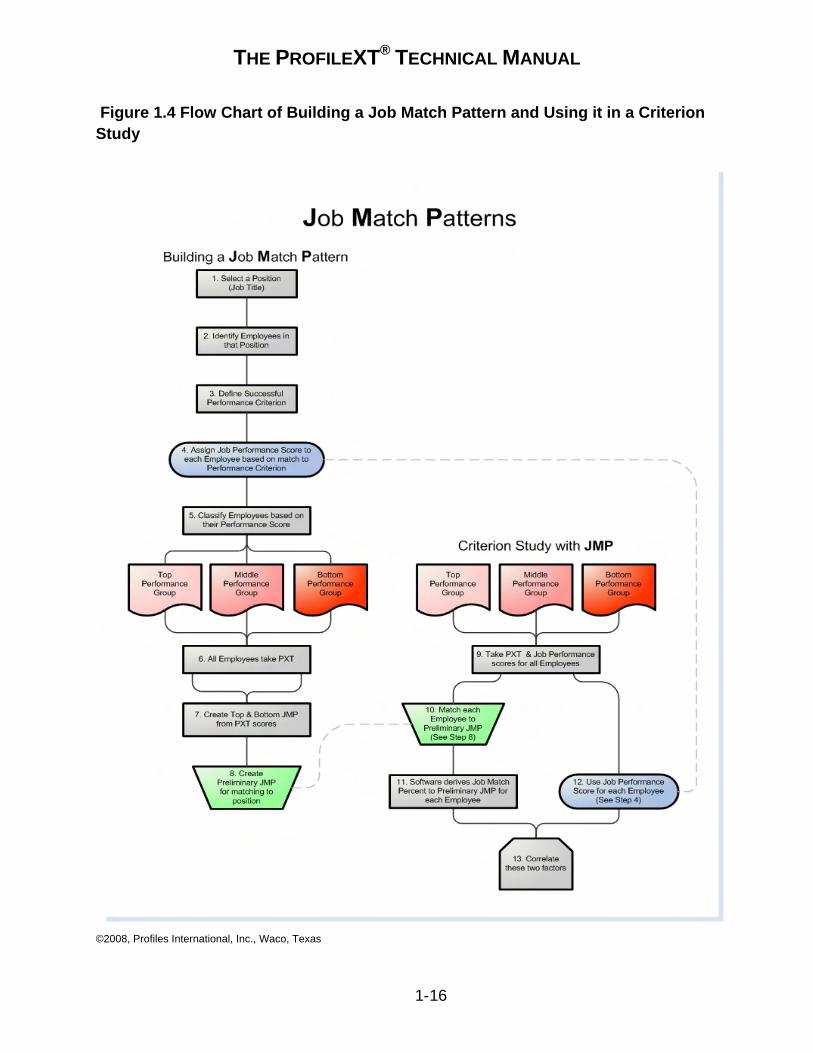
A flowchart, which provides an overview of the process for an example of “Building a Job Match Pattern” and conducting a “Criterion Study with JMP,” is provided in Figure 1.4. The descriptions of the various steps are expanded here:
THE PROFILEXT® TECHNICAL MANUAL
©2008, Profiles International, Inc., Waco, Texas
1-14
Building a Job Match Pattern (JMP)
1. Select Position. The client must select a specific position to use for building a Job Match Pattern. It should be specific and easy to identify, such as Route Salesperson or Counter Salesperson, rather than the more generic title of Salesperson.
2. Identify Employees in Position. All employees who are working in the identified position should be involved in the process.
3. Define Successful Performance Criterion. It is critical the criterion defining success be behavioral and quantifiable. Something like “makes good sales,” will not be very effective because it lacks clarity and is not quantifiable as stated. A better choice would be “sales greater than quota last year.”
4. Assign Job Performance Score. Assign a score to each employee based on their match to the Performance Criterion.
5. Classify Employees Based on Match to Criterion. Using the quantifiable criterion identified in step 3, classify each employ into three groups: Top Performers, Middle Performers, and Bottom Performers.
6. All Take the PXT. Have all participants complete the ProfileXT so their results will be available for the following steps.
7. Create Top and Bottom JMP From PXT Results. Use the software to build a Job Match Pattern (JMP) for the Top Performers and another JMP for the Bottom Performers. These will be used to identify the characteristics that help differentiate between the members of each group.
8. Create Preliminary JMP for Matching to Position. Once a JMP is built, all participants (Top, Middle, and Bottom) will be matched to the pattern. This process yields a Job Match Percent for each employee.
The next step in the process is to take the Overall Job Match Percent for each employee in the position under study and combine this information with the criterion value established earlier in step four. These two measurements are then analyzed and their relationship to one another (correlation) is investigated with a concurrent criterion validation study.
THE PROFILEXT® TECHNICAL MANUAL
©2008, Profiles International, Inc., Waco, Texas
1-15
9. Take PXT & Job Performance Scores for all Employees. The two variables considered in the criterion study are Job Performance (from the employer’s assessment in step four), and the PXT scores for each employee.
10. and 11. Match each Employee to the Preliminary JMP (created earlier in step eight). As each employee is matched to a Job Match Pattern (JMP), a Job Match Percent is computed. This Job Match Percent reflects the degree of fit for the employee to that particular JMP where the higher the percent match, the greater the match to the pattern. This Job Match Percent is the dependent variable for the criterion studies.
12. The Job Performance score (from step four) for each employee is the independent variable for the criterion studies.
13. Appropriate statistics are used to correlate the Job Match Percent scores and the Job Performance scores. This is the basic design of many of the criterion studies conducted by the users of the PXT, in both concurrent validity studies, and predictive validity studies.
The relationship between the Overall Job Match Percent for each employee and their actual job performance makes the PXT an important part of the decision making process on future job placements.
THE PROFILEXT® TECHNICAL MANUAL
©2008, Profiles International, Inc., Waco, Texas
1-16
Figure 1.4 Flow Chart of Building a Job Match Pattern and Using it in a Criterion Study
THE PROFILEXT® TECHNICAL MANUAL
©2008, Profiles International, Inc., Waco, Texas
1-17
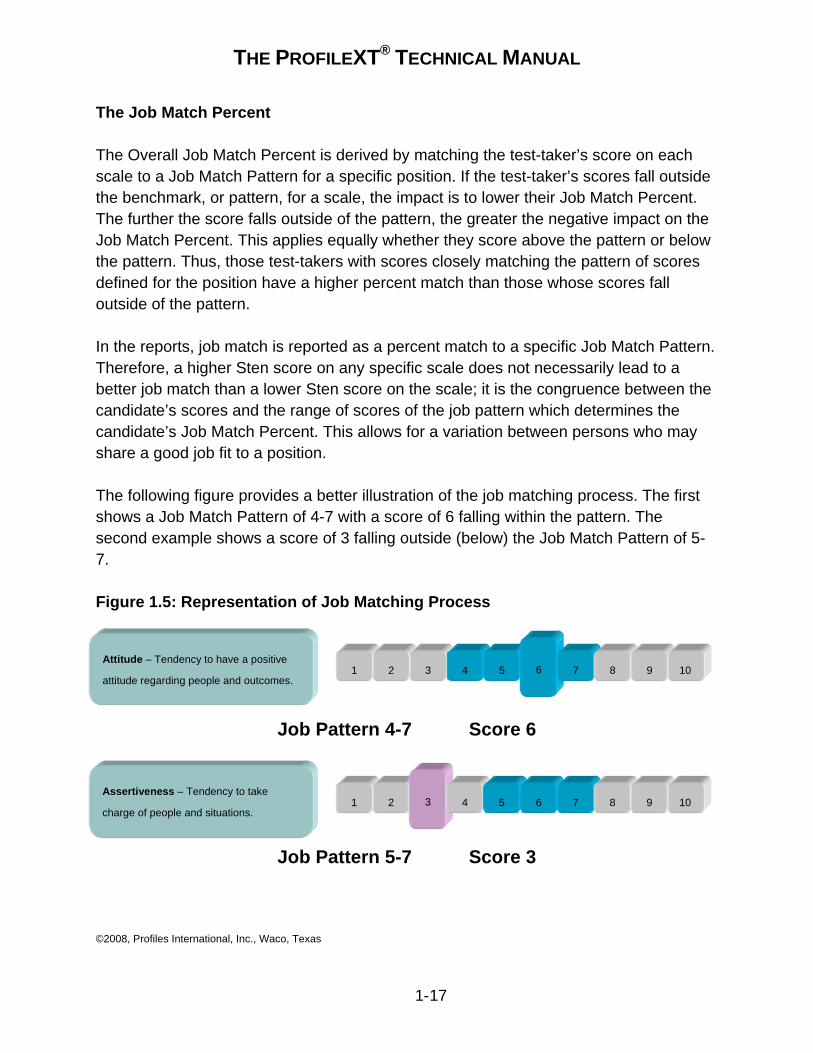
The Job Match Percent
The Overall Job Match Percent is derived by matching the test-taker’s score on each scale to a Job Match Pattern for a specific position. If the test-taker’s scores fall outside the benchmark, or pattern, for a scale, the impact is to lower their Job Match Percent. The further the score falls outside of the pattern, the greater the negative impact on the Job Match Percent. This applies equally whether they score above the pattern or below the pattern. Thus, those test-takers with scores closely matching the pattern of scores defined for the position have a higher percent match than those whose scores fall outside of the pattern.
In the reports, job match is reported as a percent match to a specific Job Match Pattern. Therefore, a higher Sten score on any specific scale does not necessarily lead to a better job match than a lower Sten score on the scale; it is the congruence between the candidate’s scores and the range of scores of the job pattern which determines the candidate’s Job Match Percent. This allows for a variation between persons who may share a good job fit to a position.
The following figure provides a better illustration of the job matching process. The first shows a Job Match Pattern of 4-7 with a score of 6 falling within the pattern. The second example shows a score of 3 falling outside (below) the Job Match Pattern of 5-7.
Figure 1.5: Representation of Job Matching Process
Job Pattern 4-7 Score 6
Job Pattern 5-7 Score 3
Attitude – Tendency to have a positive
attitude regarding people and outcomes. 1 2 3 6 7 8 9 4 5 10
Assertiveness – Tendency to take
charge of people and situations. 1 2 3 4 5 6 7 8 9 10
THE PROFILEXT® TECHNICAL MANUAL
©2008, Profiles International, Inc., Waco, Texas
1-18
Once a good Job Match Pattern has been established, it may be used to evaluate anyone who has taken the ProfileXT. The Job Match Pattern is composed of a range of scores for each scale. This range represents the area in which those who are expected to fit most easily into the job will score. The more outside this range (pattern) a score falls, the less likely there will be a good fit of the individual to the job in regard to that particular factor. Job Match Percentage points are deducted for scoring outside the pattern. As mentioned earlier, job match is reported as a percent match to a specific Job Match Pattern.
The Overall Job Match Percents computed will range from 0% to 100%. A separate match will be provided for each of the three areas (Thinking Style, Occupational Interests, and Behavioral Traits), as well as the Overall Job Match Percent. The Overall Job Match Percent is especially useful to quickly identify individuals who may be a good match for the job; the percent matches for the three subsections can be used for a more in depth analysis of job fit. The higher the match reported, the higher the expectancy the individual will fit well into the job under consideration.
Criterion validity studies (predictive) conducted by our clients have demonstrated that those individuals with high Overall Job Match Percents have a greater probability of being successful in that position than those with low Overall Job Match Percents.
Understanding the Percentage Match to a Job Match Pattern
The ProfileXT displays an Overall Job Match Percent to a selected Job Match Pattern. This Job Match Percent number allows for the general comparison of an individual’s results with a theoretical individual who is an exact match to a specified Job Match Pattern.
The overall match is computed using a complex formula. The result of this computation is impacted by several factors including the number of scales under consideration, the width of the pattern for each scale, and the number of scales in a given section (e.g. Thinking Style, Occupational Interests, and Behavioral Traits). Understanding the actual formula is not necessary for a general understanding of the process. For the purpose of this discussion, let’s simplify the computations and just assume everyone starts as a percentage match of 100 to the pattern under consideration.
Initially, each scale is considered separately. If the individual’s score falls anywhere inside the specified pattern, no action is taken, however, if the obtained score is outside
THE PROFILEXT® TECHNICAL MANUAL
©2008, Profiles International, Inc., Waco, Texas
1-19
the pattern percentage match points are subtracted from the overall match. As the obtained score falls a greater distance from the pattern on any scale, more percentage match points are deducted from the original 100 points.
For instance, if the pattern was from 6 to 8, and the obtained score was a 6, 7, or 8, the overall match would not be impacted. If the obtained score was a 5 (one STEN outside of the Pattern), then 2 match points might be deducted while an obtained score of 4 might cause a deduction of 3 match points. Once each scale in a section has been considered, the total match for that section is computed.
Because the overall match to a Job Match Pattern may be an important part of placing an individual in a job (up to 1/3 of the decision), comparing the overall match for several individuals who are being considered for that job is appropriate. The greater the overall match percent number, the greater the probability the individual will successfully fit into the job under consideration.
It is important that overall match scores for applicants on a given assessment be compared with one another to provide information on relative job fit. This information is an important part of the process of making placement decisions.
For example, there might be four individuals under consideration for the same position. Their PXT results may result in Overall Job Match Percent scores of 94, 87, 72, and 68. It is easy to see which individual is the closest match to the Job Match Pattern under consideration.
The reports provided by the PXT will help guide the user, as they investigate job fit, by providing interview questions related to the scales when the applicant scored outside of the Job Match Pattern. In a placement situation, these interview questions enrich the quality of the interview by providing focus on areas for potential difficulties associated with the fit to the job.
Because the interpretations generated by the ProfileXT are provided in reports written in common business language, they require no psychological interpretation by the user. This allows the PXT to be used by those with no special psychological training.
While this job pattern approach to matching individuals to a job provides information of great value and should be a major part of the placement decision, the results from any test should never make up more than a third of the final placement decision. This is
THE PROFILEXT® TECHNICAL MANUAL
©2008, Profiles International, Inc., Waco, Texas
1-20
especially true when accurate job performance information is available on existing employees.
ProfileXT Validity
Meta-analytic Study
The most accurate and representative data results from the studies conducted by the actual users of the PXT. Many of these criterion studies are conducted with the support of our Client Service executives. This provides us with an understanding of how the study was conducted and gives us confidence in the numbers reports. Because these studies result from real situations, very often the number of subjects is rather small. A representative sampling of these studies from actual PXT applications has been combined in this meta-analysis.
A meta-analysis is a statistical technique in which the results of a large number of independent but related studies are combined to determine the average effect of a particular treatment or intervention. This technique has been found particularly useful when a researcher is faced with resolving contradictory research findings or when calculating outcomes for small sample sizes that lack the statistical power to produce significant findings. This is the main advantage of meta-analysis. In effect, the samples are pooled thus creating a larger sample. As a statistical given, the larger the sample, the greater the confidence in the results.
The data for this analysis is the product of case studies provided by the Profiles International, Inc. Client Services Department. In each of these case studies the participant’s performance was evaluated by the organization to which they belonged. Each participant had taken the ProfileXT assessment. An individual pattern was then built for each position in the study using actual performance results and relevant job performance measures (for more information on building patterns see pages 14 and 15 in this chapter). A correlational relationship between the Overall Job Match Percents of the Top and Bottom Performers, and their performance rating, was then calculated for each study. Using the Hunter and Schmidt Method (Hunter and Schmidt, 2004), the correlations of each individual study were weighted by the sample size, summed, and then divided by the number of participants across all samples.
THE PROFILEXT® TECHNICAL MANUAL
©2008, Profiles International, Inc., Waco, Texas
1-21
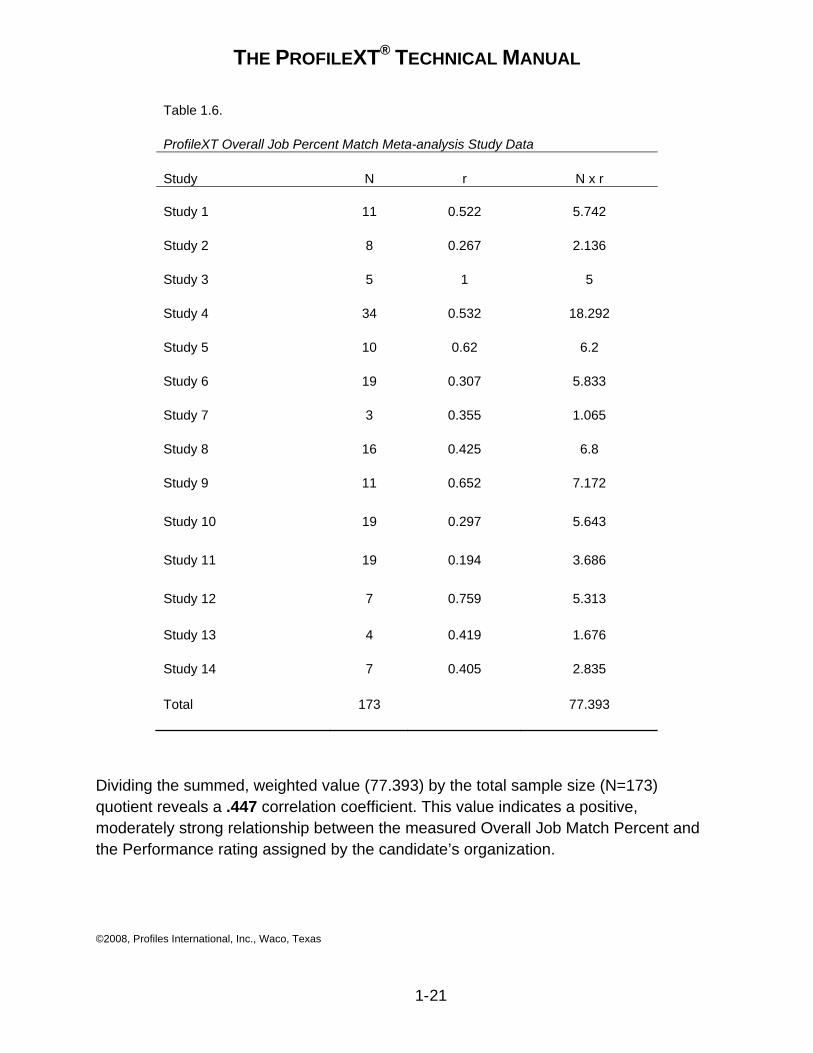
Table 1.6. ProfileXT Overall Job Percent Match Meta-analysis Study Data Study N r N x r Study 1 11 0.522 5.742 Study 2 8 0.267 2.136 Study 3 5 1 5 Study 4 34 0.532 18.292 Study 5 10 0.62 6.2 Study 6 19 0.307 5.833 Study 7 3 0.355 1.065 Study 8 16 0.425 6.8 Study 9 11 0.652 7.172 Study 10 19 0.297 5.643 Study 11 19 0.194 3.686 Study 12 7 0.759 5.313 Study 13 4 0.419 1.676 Study 14 7 0.405 2.835 Total 173 77.393
Dividing the summed, weighted value (77.393) by the total sample size (N=173) quotient reveals a .447 correlation coefficient. This value indicates a positive, moderately strong relationship between the measured Overall Job Match Percent and the Performance rating assigned by the candidate’s organization.
THE PROFILEXT® TECHNICAL MANUAL
©2008, Profiles International, Inc., Waco, Texas
1-22
The next step is to calculate credibility intervals by adding or subtracting the square root of the estimated population variance multiplied by 1.96 (to provide a 95% interval) from the true study effect of .447.
95% Credibility Interval upper = .567
95% Credibility Interval lower = .327
As suggested by this analysis, the Overall Job Match Percents acquired from this sample of seven studies and 173 job candidates indicates good predictive utility of the organizational performance ratings.
Specific Examples the ProfileXT in Use
The following studies demonstrate typical applications of the ProfileXT. One study was conducted by a for-profit company and the other by a government organization. The results demonstrate how the ProfileXT produces information that significantly improves the employee selection and placement process within an organization. More importantly, this process saves companies a substantial amount of money and time.
The PXT in use by a Healthcare Organization
A healthcare organization faced with low employee productivity wished to find a way to increase the frequency of hiring employees who excelled in their positions. Presented with this problem, the current study was conducted to examine the relationship between employee productivity and Job Match according to the ProfileXT.
Participants
The current study was comprised of 60 Enrollment Specialists. In this position, 88% of the participants were female, 35% Hispanic, 30% Caucasian, and 21% African American. Seventy eight percent of the sample reported ages between 18 and 44 years with the highest frequency in the 25-34 age range. Each employee who participated in the study had taken the ProfileXT and had their performance evaluated on a five-point rating scale by a superior within the company. These company performance evaluations revealed 13 employees exceeding expectations (rated four or five) and six employees
THE PROFILEXT® TECHNICAL MANUAL
©2008, Profiles International, Inc., Waco, Texas
1-23
failing to meet expectations (rated one or two). The remainder of the sample, 41 individuals, met performance expectations (rated three).
Job Match Pattern
In a concurrent study format, a Job Match Pattern was developed for the Enrollment Specialist position using the ProfileXT. The 13 current Top Performing Enrollment Specialists served as the basis to formulate the Job Match Pattern. The pattern now serves as a benchmark to which other employees can be matched.
Performance Grouping
With the Enrollment Specialist Job Match Pattern created, all 60 Enrollment Specialists were matched against the pattern. After a review of the sample’s ProfileXT Percent Matches, an overall Job Match Percent of 78%, or better, best identified Top Performing employees and was selected as a breakpoint to represent a good match to the Job Match Pattern.
This study demonstrated that the pattern efficiently identifies top performers:
• Top Performers correctly identified as Top Performers by the pattern: 9 of 13 • Bottom Performers incorrectly identified as Top Performers by the pattern: 2 of 6
Of the 60 employees included in the study, 34 met, or exceeded, the benchmark set. Nine of the thirteen (69%) Top Performers were included in this group while only two of the six (33%) Bottom Performers were a match for the pattern. Thus, the pattern is differentiating Top and Bottom performers as delineated by the company’s own performance evaluations.
Details
The company expressed the belief that their hiring practices have become more consistent since using the ProfileXT. The organizational leaders of the company feel more confident and have become more assured in their hiring decisions knowing that the PXT is based on the objective evaluation of employee attributes.
THE PROFILEXT® TECHNICAL MANUAL
©2008, Profiles International, Inc., Waco, Texas
1-24
Summary
Using the ProfileXT to benchmark employees, the organization has shown the ability to successfully screen Enrollment Specialist candidates. Of the 34 individuals who either met, or exceeded, the Job Match Pattern benchmark, only 5.8% (2 of 34) of these employees were bottom performers. Additionally, approximately 70% of the top performers (9 of 13) were included in this group. Clearly, selection practices can be improved by using Job Match Patterns created by the ProfileXT.
The PXT in use by a Mortgage Lending Firm
A large lending firm located in Texas wished to increase its Branch Manager productivity through improved hiring practices. The firm turned to the ProfileXT, a pre-employment instrument designed to aid in employee selection through the measurement of key job related traits, interests, and abilities. A study was conducted to examine the relationship between employee productivity and Job Match to ProfileXT.
Participants
The study was comprised of 46 Branch Managers. In this position, 66% of the participants were male, 88% Caucasian, and participants selected the 35-44 age range with the highest frequency. Each employee who participated in the study had taken the ProfileXT and had their performance evaluated via an average of the employee’s revenue generation by a superior from within the company. These company performance evaluations revealed ten employees as Top Performers and nine employees as Bottom Performers.
Job Match Pattern
In a concurrent study format, a Job Match Pattern was developed for the Branch Manager position using the ProfileXT. A sample of the ten current Top Performing Branch Managers served as the basis to formulate the Job Match Pattern. This pattern now serves as the benchmark to which others can be matched.
Performance Grouping
With the Branch Manager Job Match Pattern created, all 46 Branch Managers were matched against the pattern. After a review of the sample’s ProfileXT Percent Matches,
THE PROFILEXT® TECHNICAL MANUAL
©2008, Profiles International, Inc., Waco, Texas
1-25
an overall Job Match Percent of 80%, or better, best identified Top Performing employees and was selected as a breakpoint to represent a good match to the Job Match Pattern.
Analysis of the data has demonstrated that the pattern efficiently identifies Top Performers:
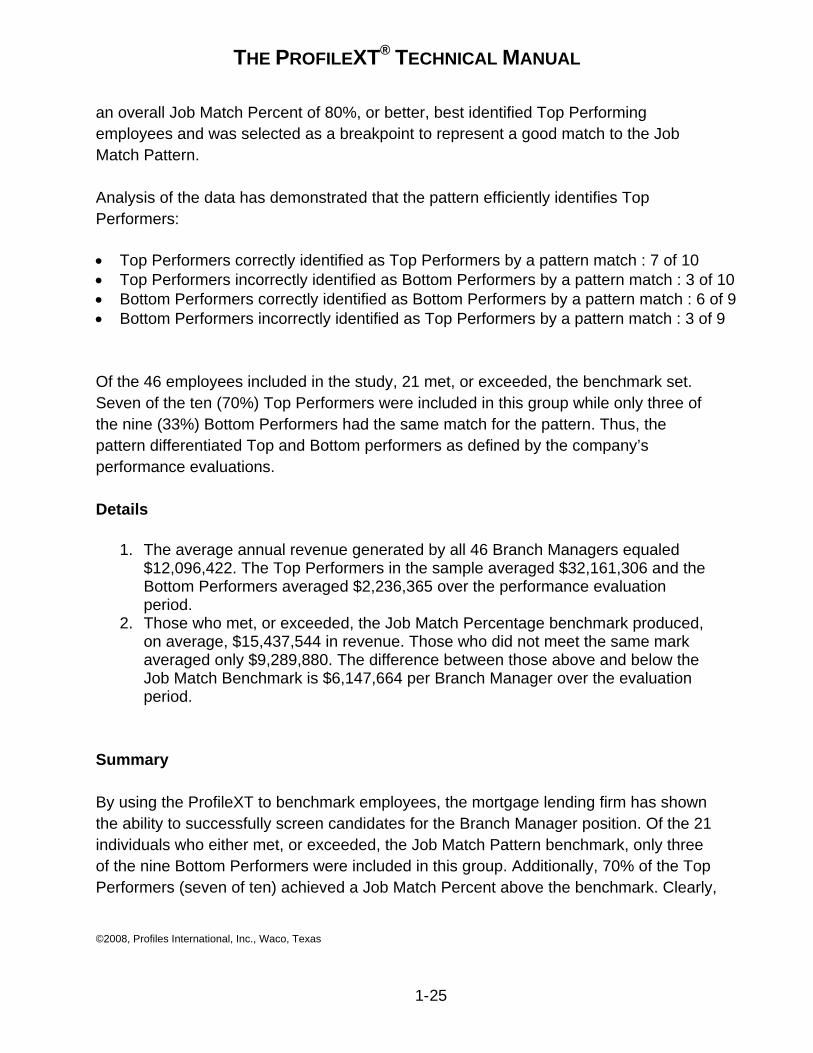
• Top Performers correctly identified as Top Performers by a pattern match : 7 of 10 • Top Performers incorrectly identified as Bottom Performers by a pattern match : 3 of 10 • Bottom Performers correctly identified as Bottom Performers by a pattern match : 6 of 9 • Bottom Performers incorrectly identified as Top Performers by a pattern match : 3 of 9
Of the 46 employees included in the study, 21 met, or exceeded, the benchmark set. Seven of the ten (70%) Top Performers were included in this group while only three of the nine (33%) Bottom Performers had the same match for the pattern. Thus, the pattern differentiated Top and Bottom performers as defined by the company’s performance evaluations.
Details
1. The average annual revenue generated by all 46 Branch Managers equaled $12,096,422. The Top Performers in the sample averaged $32,161,306 and the Bottom Performers averaged $2,236,365 over the performance evaluation period.
2. Those who met, or exceeded, the Job Match Percentage benchmark produced, on average, $15,437,544 in revenue. Those who did not meet the same mark averaged only $9,289,880. The difference between those above and below the Job Match Benchmark is $6,147,664 per Branch Manager over the evaluation period.
Summary
By using the ProfileXT to benchmark employees, the mortgage lending firm has shown the ability to successfully screen candidates for the Branch Manager position. Of the 21 individuals who either met, or exceeded, the Job Match Pattern benchmark, only three of the nine Bottom Performers were included in this group. Additionally, 70% of the Top Performers (seven of ten) achieved a Job Match Percent above the benchmark. Clearly,
THE PROFILEXT® TECHNICAL MANUAL
©2008, Profiles International, Inc., Waco, Texas
1-26
selection practices were improved by using Job Match Patterns created by the ProfileXT.
The PXT in use by a Financial Organization
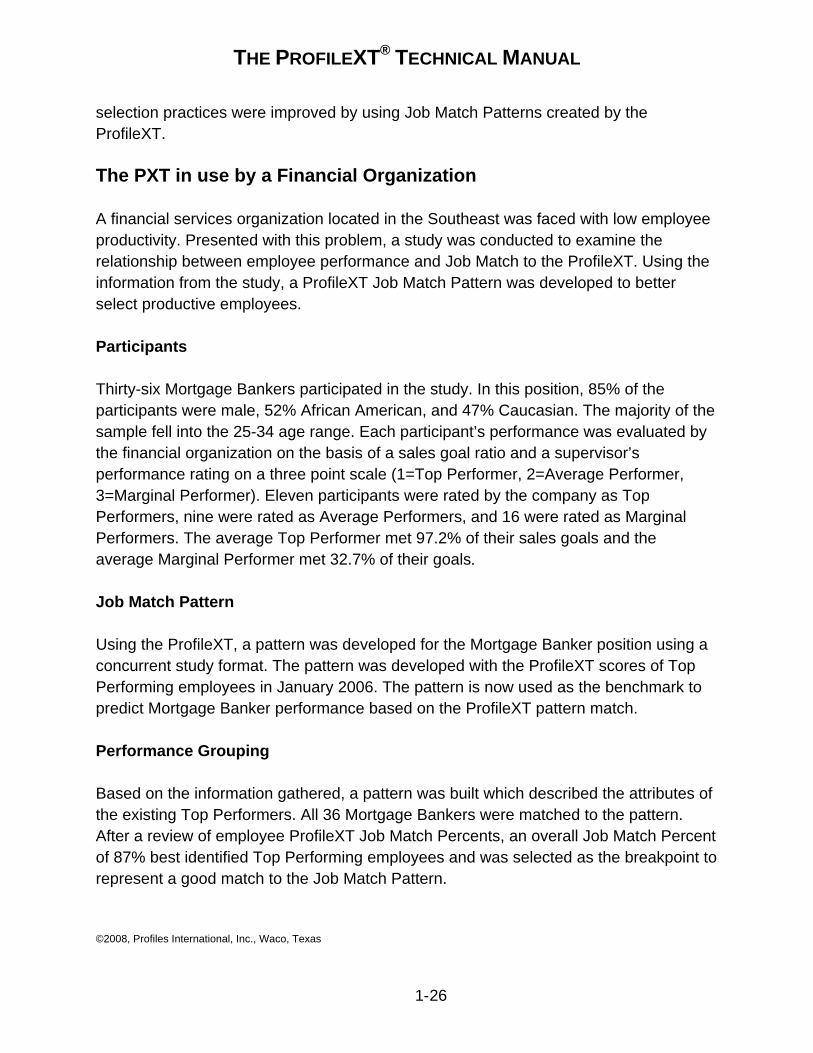
A financial services organization located in the Southeast was faced with low employee productivity. Presented with this problem, a study was conducted to examine the relationship between employee performance and Job Match to the ProfileXT. Using the information from the study, a ProfileXT Job Match Pattern was developed to better select productive employees.
Participants
Thirty-six Mortgage Bankers participated in the study. In this position, 85% of the participants were male, 52% African American, and 47% Caucasian. The majority of the sample fell into the 25-34 age range. Each participant’s performance was evaluated by the financial organization on the basis of a sales goal ratio and a supervisor’s performance rating on a three point scale (1=Top Performer, 2=Average Performer, 3=Marginal Performer). Eleven participants were rated by the company as Top Performers, nine were rated as Average Performers, and 16 were rated as Marginal Performers. The average Top Performer met 97.2% of their sales goals and the average Marginal Performer met 32.7% of their goals.
Job Match Pattern
Using the ProfileXT, a pattern was developed for the Mortgage Banker position using a concurrent study format. The pattern was developed with the ProfileXT scores of Top Performing employees in January 2006. The pattern is now used as the benchmark to predict Mortgage Banker performance based on the ProfileXT pattern match.
Performance Grouping
Based on the information gathered, a pattern was built which described the attributes of the existing Top Performers. All 36 Mortgage Bankers were matched to the pattern. After a review of employee ProfileXT Job Match Percents, an overall Job Match Percent of 87% best identified Top Performing employees and was selected as the breakpoint to represent a good match to the Job Match Pattern.
THE PROFILEXT® TECHNICAL MANUAL
©2008, Profiles International, Inc., Waco, Texas
1-27
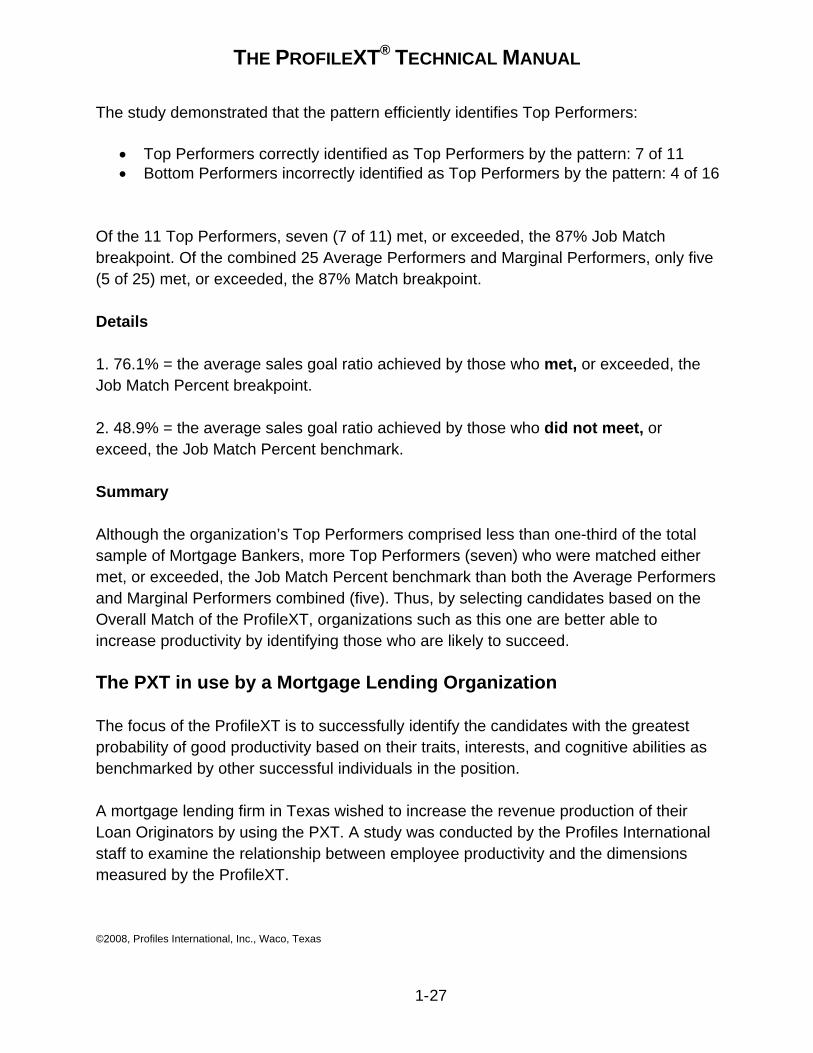
The study demonstrated that the pattern efficiently identifies Top Performers:
• Top Performers correctly identified as Top Performers by the pattern: 7 of 11 • Bottom Performers incorrectly identified as Top Performers by the pattern: 4 of 16
Of the 11 Top Performers, seven (7 of 11) met, or exceeded, the 87% Job Match breakpoint. Of the combined 25 Average Performers and Marginal Performers, only five (5 of 25) met, or exceeded, the 87% Match breakpoint.
Details
1. 76.1% = the average sales goal ratio achieved by those who met, or exceeded, the Job Match Percent breakpoint.
2. 48.9% = the average sales goal ratio achieved by those who did not meet, or exceed, the Job Match Percent benchmark.
Summary
Although the organization’s Top Performers comprised less than one-third of the total sample of Mortgage Bankers, more Top Performers (seven) who were matched either met, or exceeded, the Job Match Percent benchmark than both the Average Performers and Marginal Performers combined (five). Thus, by selecting candidates based on the Overall Match of the ProfileXT, organizations such as this one are better able to increase productivity by identifying those who are likely to succeed.
The PXT in use by a Mortgage Lending Organization
The focus of the ProfileXT is to successfully identify the candidates with the greatest probability of good productivity based on their traits, interests, and cognitive abilities as benchmarked by other successful individuals in the position.
A mortgage lending firm in Texas wished to increase the revenue production of their Loan Originators by using the PXT. A study was conducted by the Profiles International staff to examine the relationship between employee productivity and the dimensions measured by the ProfileXT.
THE PROFILEXT® TECHNICAL MANUAL
©2008, Profiles International, Inc., Waco, Texas
1-28
Participants
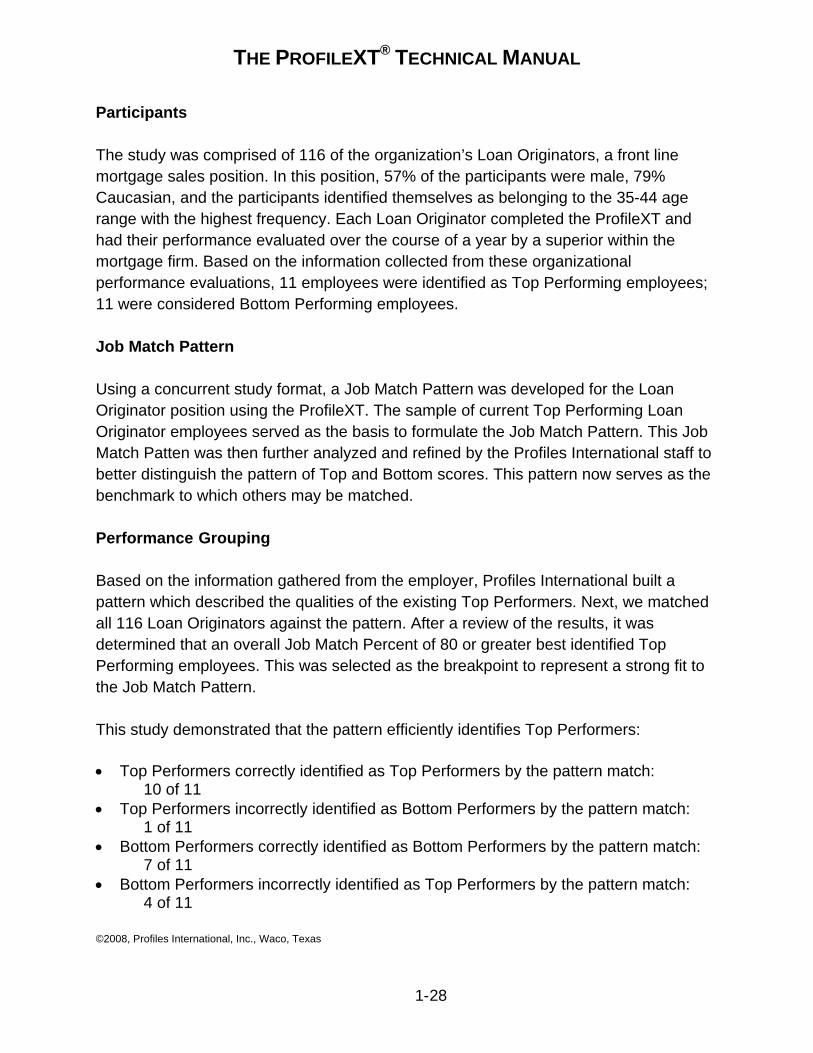
The study was comprised of 116 of the organization’s Loan Originators, a front line mortgage sales position. In this position, 57% of the participants were male, 79% Caucasian, and the participants identified themselves as belonging to the 35-44 age range with the highest frequency. Each Loan Originator completed the ProfileXT and had their performance evaluated over the course of a year by a superior within the mortgage firm. Based on the information collected from these organizational performance evaluations, 11 employees were identified as Top Performing employees; 11 were considered Bottom Performing employees.
Job Match Pattern
Using a concurrent study format, a Job Match Pattern was developed for the Loan Originator position using the ProfileXT. The sample of current Top Performing Loan Originator employees served as the basis to formulate the Job Match Pattern. This Job Match Patten was then further analyzed and refined by the Profiles International staff to better distinguish the pattern of Top and Bottom scores. This pattern now serves as the benchmark to which others may be matched.
Performance Grouping
Based on the information gathered from the employer, Profiles International built a pattern which described the qualities of the existing Top Performers. Next, we matched all 116 Loan Originators against the pattern. After a review of the results, it was determined that an overall Job Match Percent of 80 or greater best identified Top Performing employees. This was selected as the breakpoint to represent a strong fit to the Job Match Pattern.
This study demonstrated that the pattern efficiently identifies Top Performers:
• Top Performers correctly identified as Top Performers by the pattern match: 10 of 11
• Top Performers incorrectly identified as Bottom Performers by the pattern match: 1 of 11
• Bottom Performers correctly identified as Bottom Performers by the pattern match: 7 of 11
• Bottom Performers incorrectly identified as Top Performers by the pattern match: 4 of 11
THE PROFILEXT® TECHNICAL MANUAL
©2008, Profiles International, Inc., Waco, Texas
1-29
Of the 116 participants, 62 obtained a Job Match Percent of 80% or greater. Ten of the 11 Top Performing Loan Originator employees, or 91%, were identified as having a strong fit to the Job Match Pattern. Only 36%, or four of the 11 Bottom Performers, achieved the same mark.
Details
1. The average annual revenue generated by all Loan Originators in the sample equaled $10,397,058. Top Performers in the sample averaged $39,221,312 in sales. Conversely, over the same evaluation period, the Bottom Performers in this position generated an average of $1,411,084. The average difference in sales generated by the Top and Bottom performing Loan Originators totaled $37,810,228.
2. The average revenue generated by the 62 Loan Originators who achieved an 80% Job Match Pattern equaled $11,110,280. The 54 Loan Originators, who did not achieve an 80% Job Match Pattern, generated an average of $4,879,269. This is an average difference of $6,231,011 per Loan Originator based solely on the strength of fit to the PXT Job Match Pattern.
Summary
By using the ProfileXT to benchmark the Loan Originator position, the mortgage lending firm has shown the ability to successfully screen candidates. Of the 11 Top Performing Loan Originators in the firm, ten met, or exceeded, the 80% Job Match Percent breakpoint which identifies a good fit to the position. Conversely, only four of the 11 Bottom Performing Loan Originators were able to achieve the same level. Furthermore, the 62 individuals who achieved a Job Match Percent of 80% or higher produced, on average, $6,231,011 more in revenue per Loan Originator over the evaluation period than those who failed to achieve this same level. Using Job Match Patterns to benchmark the Loan Originator position, the mortgage lending firm will increase the odds of selecting Top Performing Loan Originator candidates in the future.
These brief summaries reflect results typical for companies who are using the Job Match Pattern approach with the ProfileXT. The results for similar studies are reported in Appendix E.
THE PROFILEXT® TECHNICAL MANUAL
©2008, Profiles International, Inc., Waco, Texas
1-30
ProfileXT Adverse Impact Analysis
The focus of the PXT is to provide a valid and reliable assessment tool to be used in the selection and placement process. This aim also entails that the tool be fair to ethnic, gender, and age groups. The information presented below is designed to provide the user with a brief, but succinct, account of the evidence supporting the egalitarian nature of the ProfileXT. For a more detailed account of adverse impact see Appendix B, Appendix C, and Appendix D.
As discussed earlier, the Job Match Percent is derived by matching the test-taker’s score on each scale to a Job Match Pattern of scores for a specific position. If the test-taker’s scores fall outside of the benchmark, or pattern, for a scale, the impact is to lower their Job Match Percent. The further the score falls outside of the pattern, the greater the negative impact on the Job Match Percent. This applies equally if they score above the pattern or below the pattern. Thus, those test-takers with scores closely matching the pattern of scores defined for the position will have a higher percent match than those whose scores fall outside of the pattern.
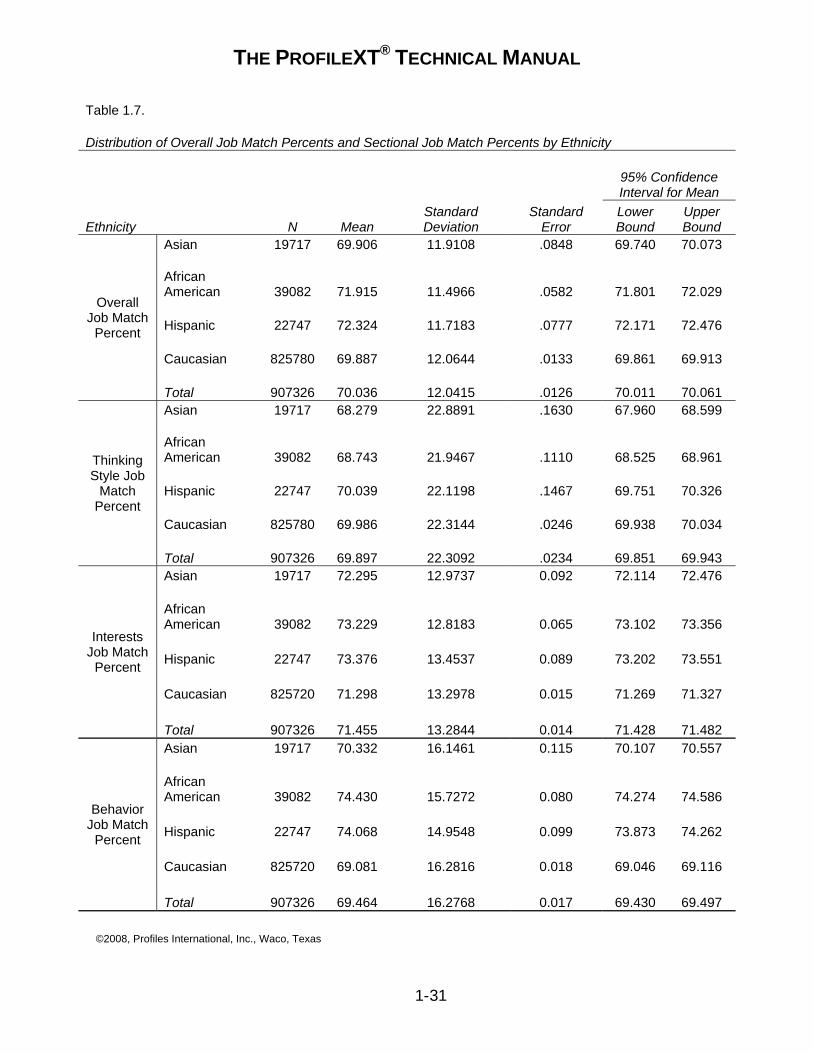
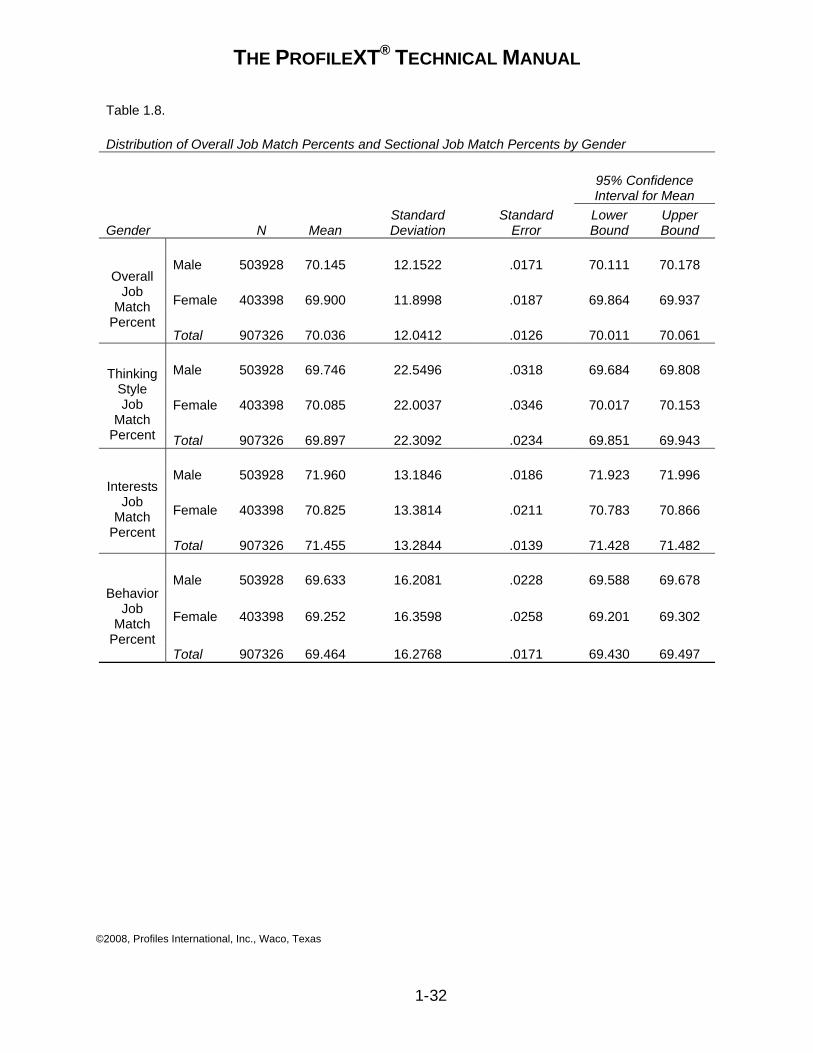
As seen in Table1.7, Table 1.8, and Table 1.9, across a sample of 906,326 test-takers the mean Job Match Percents of the demographic groups do not differ in any practical way. The subjects in the study represent individuals who have actually been matched to Job Match Patterns during the actual use of the PXT in the world of work in the USA. We have made some assumptions about these job match situations:
1. The applicants have applied for actual positions where they felt they would have a reasonable fit to the job.
2. The Job Match Patterns for the jobs in question are valid patterns for each position in the study.
3. Some applicants have misjudged their fit to the position. 4. Not all applicants were placed into the position for which they applied.
THE PROFILEXT® TECHNICAL MANUAL
©2008, Profiles International, Inc., Waco, Texas
1-31
Table 1.7. Distribution of Overall Job Match Percents and Sectional Job Match Percents by Ethnicity
95% Confidence Interval for Mean
Ethnicity N Mean Standard Deviation
Standard Error
Lower Bound
Upper Bound
Overall Job Match
Percent
Asian 19717 69.906 11.9108 .0848 69.740 70.073 African American 39082 71.915 11.4966 .0582 71.801 72.029 Hispanic 22747 72.324 11.7183 .0777 72.171 72.476 Caucasian 825780 69.887 12.0644 .0133 69.861 69.913 Total 907326 70.036 12.0415 .0126 70.011 70.061
Thinking Style Job
Match Percent
Asian 19717 68.279 22.8891 .1630 67.960 68.599 African American 39082 68.743 21.9467 .1110 68.525 68.961 Hispanic 22747 70.039 22.1198 .1467 69.751 70.326 Caucasian 825780 69.986 22.3144 .0246 69.938 70.034 Total 907326 69.897 22.3092 .0234 69.851 69.943
Interests Job Match
Percent
Asian 19717 72.295 12.9737 0.092 72.114 72.476 African American 39082 73.229 12.8183 0.065 73.102 73.356 Hispanic 22747 73.376 13.4537 0.089 73.202 73.551 Caucasian 825720 71.298 13.2978 0.015 71.269 71.327 Total 907326 71.455 13.2844 0.014 71.428 71.482
Behavior Job Match
Percent
Asian 19717 70.332 16.1461 0.115 70.107 70.557 African American 39082 74.430 15.7272 0.080 74.274 74.586 Hispanic 22747 74.068 14.9548 0.099 73.873 74.262 Caucasian 825720 69.081 16.2816 0.018 69.046 69.116 Total 907326 69.464 16.2768 0.017 69.430 69.497
THE PROFILEXT® TECHNICAL MANUAL
©2008, Profiles International, Inc., Waco, Texas
1-32
Table 1.8. Distribution of Overall Job Match Percents and Sectional Job Match Percents by Gender
95% Confidence Interval for Mean
Gender N Mean Standard Deviation
Standard Error
Lower Bound
Upper Bound
Overall Job
Match Percent
Male 503928 70.145 12.1522 .0171 70.111 70.178 Female 403398 69.900 11.8998 .0187 69.864 69.937 Total 907326 70.036 12.0412 .0126 70.011 70.061
Thinking
Style Job
Match Percent
Male 503928 69.746 22.5496 .0318 69.684 69.808 Female 403398 70.085 22.0037 .0346 70.017 70.153 Total 907326 69.897 22.3092 .0234 69.851 69.943
Interests Job
Match Percent
Male 503928 71.960 13.1846 .0186 71.923 71.996 Female 403398 70.825 13.3814 .0211 70.783 70.866 Total 907326 71.455 13.2844 .0139 71.428 71.482
Behavior Job
Match Percent
Male 503928 69.633 16.2081 .0228 69.588 69.678 Female 403398 69.252 16.3598 .0258 69.201 69.302 Total 907326 69.464 16.2768 .0171 69.430 69.497
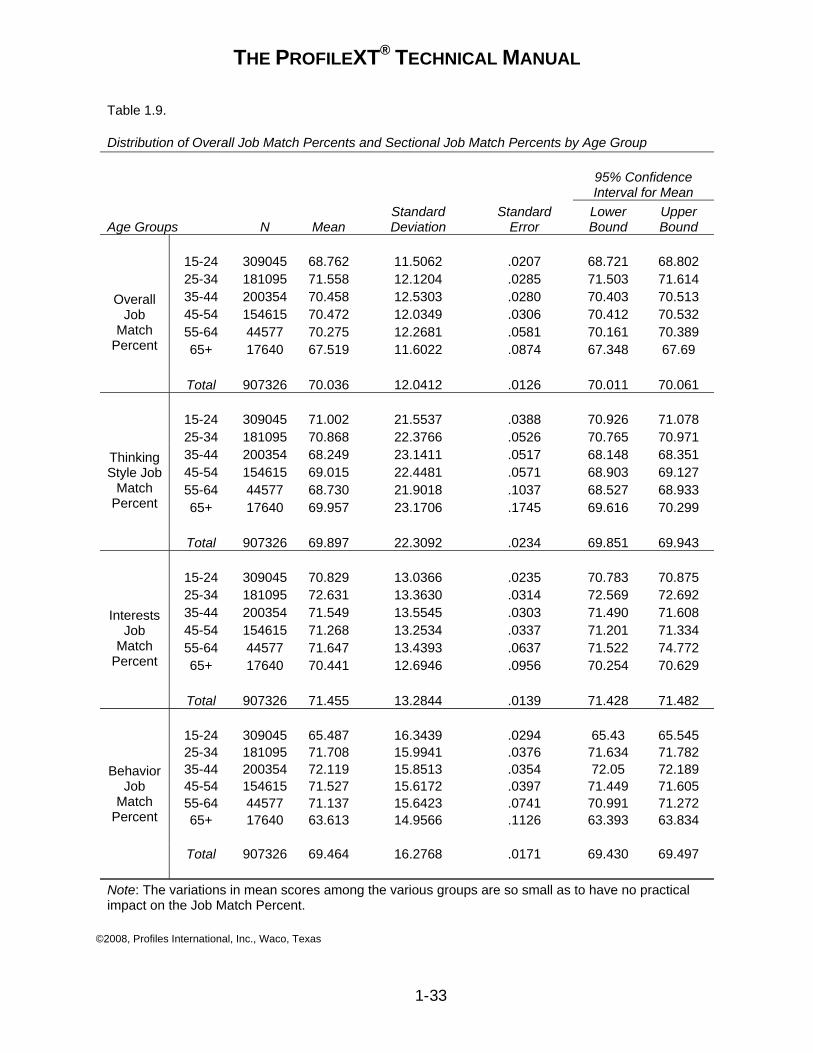
THE PROFILEXT® TECHNICAL MANUAL
©2008, Profiles International, Inc., Waco, Texas
1-33
Table 1.9. Distribution of Overall Job Match Percents and Sectional Job Match Percents by Age Group
95% Confidence Interval for Mean
Age Groups N Mean Standard Deviation
Standard Error
Lower Bound
Upper Bound
Overall Job
Match Percent
15-24 309045 68.762 11.5062 .0207 68.721 68.802 25-34 181095 71.558 12.1204 .0285 71.503 71.614 35-44 200354 70.458 12.5303 .0280 70.403 70.513 45-54 154615 70.472 12.0349 .0306 70.412 70.532 55-64 44577 70.275 12.2681 .0581 70.161 70.389 65+ 17640 67.519 11.6022 .0874 67.348 67.69
Total 907326 70.036 12.0412 .0126 70.011 70.061
Thinking Style Job
Match Percent
15-24 309045 71.002 21.5537 .0388 70.926 71.078 25-34 181095 70.868 22.3766 .0526 70.765 70.971 35-44 200354 68.249 23.1411 .0517 68.148 68.351 45-54 154615 69.015 22.4481 .0571 68.903 69.127 55-64 44577 68.730 21.9018 .1037 68.527 68.933 65+ 17640 69.957 23.1706 .1745 69.616 70.299
Total 907326 69.897 22.3092 .0234 69.851 69.943
Interests Job
Match Percent
15-24 309045 70.829 13.0366 .0235 70.783 70.875 25-34 181095 72.631 13.3630 .0314 72.569 72.692 35-44 200354 71.549 13.5545 .0303 71.490 71.608 45-54 154615 71.268 13.2534 .0337 71.201 71.334 55-64 44577 71.647 13.4393 .0637 71.522 74.772 65+ 17640 70.441 12.6946 .0956 70.254 70.629
Total 907326 71.455 13.2844 .0139 71.428 71.482
Behavior Job
Match Percent
15-24 309045 65.487 16.3439 .0294 65.43 65.545 25-34 181095 71.708 15.9941 .0376 71.634 71.782 35-44 200354 72.119 15.8513 .0354 72.05 72.189 45-54 154615 71.527 15.6172 .0397 71.449 71.605 55-64 44577 71.137 15.6423 .0741 70.991 71.272 65+ 17640 63.613 14.9566 .1126 63.393 63.834
Total 907326 69.464 16.2768 .0171 69.430 69.497
Note: The variations in mean scores among the various groups are so small as to have no practical impact on the Job Match Percent.

THE PROFILEXT® TECHNICAL MANUAL
©2008, Profiles International, Inc., Waco, Texas
1-34
Profiles International, Inc. recognizes the need for continuing efforts to ensure the ProfileXT has no adverse effects on any ethnic, gender, or age group that may take the assessment. As seen in Table1.7, Table 1.8, and Table 1.9, across a sample of 906,326 test-takers, the mean Job Match Percents of the demographic groups do not differ in any practical way. These data support our efforts to develop an impartial test for use in making selection and placement decisions.
THE PROFILEXT® TECHNICAL MANUAL
©2008 Profiles International, Inc., Waco, Texas
2-1
Chapter 2: DEVELOPMENT OF THE ProfileXT
The ProfileXT® has a long history of assessment development. Throughout its development and the norming process, applicants and employees of actual client companies have been used. These individuals represent the best source of information about the target population for whom the assessment has been developed.
This chapter summarizes how we arrived at the current form of the assessment, from its early days of pen and paper administration to its current status as a dynamic online assessment. The PXT is an assessment battery composed of three distinct sections. Each of the three sections of the PXT (Behavioral Traits, Occupational Interests, and Thinking Style) has its own developmental history, as detailed in this chapter of the Technical Manual.
The ProfileXT was developed from The Profile by modifying two of the three sections, Behavioral Traits and Occupational Interests. Details concerning our definitions for the constructs measured by the PXT may be found in Appendix A.
The Behavioral Traits Section
The literature discusses the efficacy of using personality or behavioral characteristics to predict success on the job in some detail. The use of personality in job selection got a boost in the early 1990’s when the U. S. Government started looking carefully at the adverse impact of selection methods in use at that time. Because personality tests tended to have less adverse impact than other testing approaches, they became more commonly used for selection in business.
The presence, or absence, of a particular personality trait is not necessarily good or bad by itself. However, the degree to which a personality trait is found in an individual can have a significant impact on their success in a specific job. When success in a job calls for behaviors related to specific personality characteristics, those who have those characteristics find the behaviors come more naturally to them. They tend to be more comfortable in the job than those who have to behave in a manner not typical to their normal personality.
The Profile, the original instrument, had 218 questions in the Behavioral Traits section. In the current instrument, the ProfileXT, the number of questions was reduced to 182.
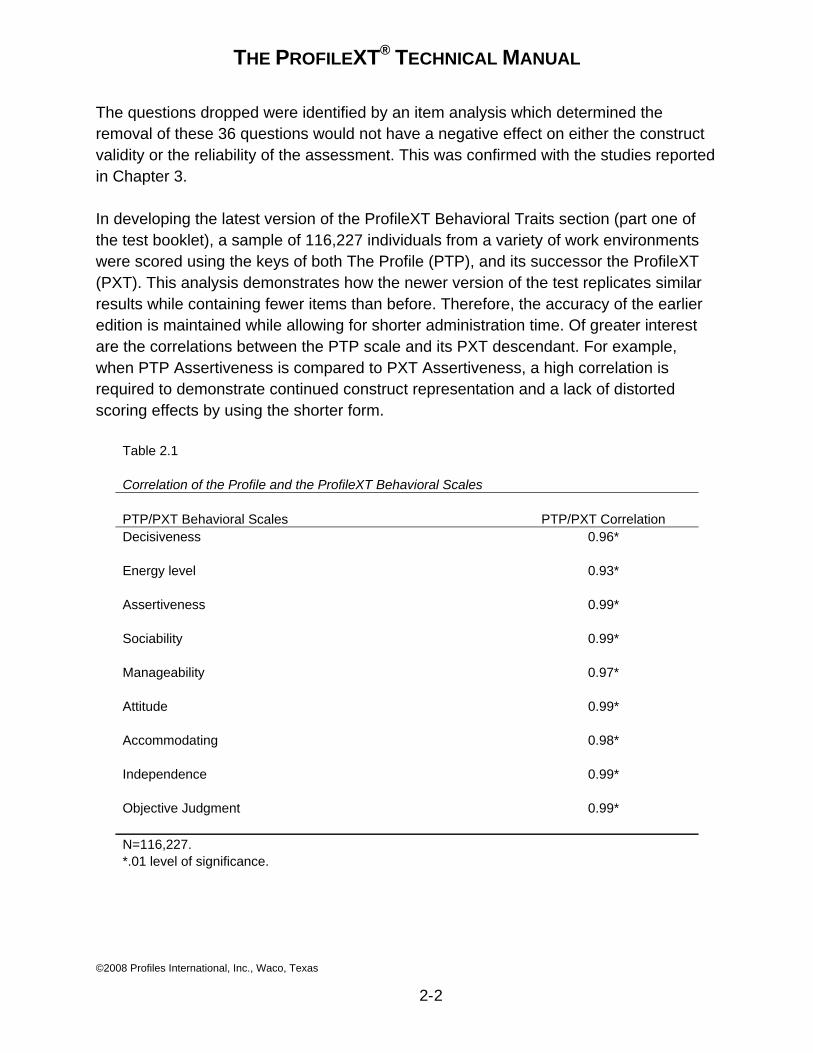
THE PROFILEXT® TECHNICAL MANUAL
©2008 Profiles International, Inc., Waco, Texas
2-2
The questions dropped were identified by an item analysis which determined the removal of these 36 questions would not have a negative effect on either the construct validity or the reliability of the assessment. This was confirmed with the studies reported in Chapter 3.
In developing the latest version of the ProfileXT Behavioral Traits section (part one of the test booklet), a sample of 116,227 individuals from a variety of work environments were scored using the keys of both The Profile (PTP), and its successor the ProfileXT (PXT). This analysis demonstrates how the newer version of the test replicates similar results while containing fewer items than before. Therefore, the accuracy of the earlier edition is maintained while allowing for shorter administration time. Of greater interest are the correlations between the PTP scale and its PXT descendant. For example, when PTP Assertiveness is compared to PXT Assertiveness, a high correlation is required to demonstrate continued construct representation and a lack of distorted scoring effects by using the shorter form.
Table 2.1 Correlation of the Profile and the ProfileXT Behavioral Scales PTP/PXT Behavioral Scales PTP/PXT Correlation Decisiveness 0.96* Energy level 0.93* Assertiveness 0.99* Sociability 0.99* Manageability 0.97* Attitude 0.99* Accommodating 0.98* Independence 0.99* Objective Judgment 0.99* N=116,227. *.01 level of significance.
THE PROFILEXT® TECHNICAL MANUAL
©2008 Profiles International, Inc., Waco, Texas
2-3
The results demonstrate the strength of this update and the ability of the PXT to maintain the constructs familiar to PTP users. Additionally, the high correlations between versions of the assessment suggest our previous studies of validity continue to be relevant for the ProfileXT.
The Occupational Interests Section
We considered two approaches to measuring and reporting interests when making the decision about the approach to use in the PXT. Both approaches are well documented in the literature. The first reports on interests using three categories: people, data, and things. The second more common approach uses Holland’s six constructs of enterprising, conventional, social, investigative, realistic, and artistic. The use of six scales rather than three allows a finer granulation in describing people’s interests and their fit to the job. Also, research using the Holland scales is widely available in the literature. This includes the O*NET system which has become very rich in detail.
Historically speaking, Holland’s “Vocational Preference Inventory” (1985) is widely regarded as the standard of occupational interests measurements. It has generated more empirical research than any other interests assessment tool. A large body of research supports its reliability and validity.
The Occupational Interests inventory in the ProfileXT parallels the underlying theory found in the “Vocational Preference Inventory” and related vocational and career guidance materials such as the “Self-Directed Search” (1994) and the “Dictionary of Holland Occupational Codes” (1989). The ProfileXT was specifically developed to measure an individual’s level of interest in the six major occupational themes originated by Holland’s theory. Psychologists, career counselors, and H.R. consultants who are familiar with the “Vocational Preference Inventory” and Holland’s occupational classification system will quickly see the obvious similarities between these two interest category systems.
Holland’s classification system uses six occupational themes to characterize occupations, often referred to as RIASEC, an acronym for Holland’s six theme designations. Table 2.2 describes these six occupational themes and compares them with the six occupational themes measured by the ProfileXT Interests section.
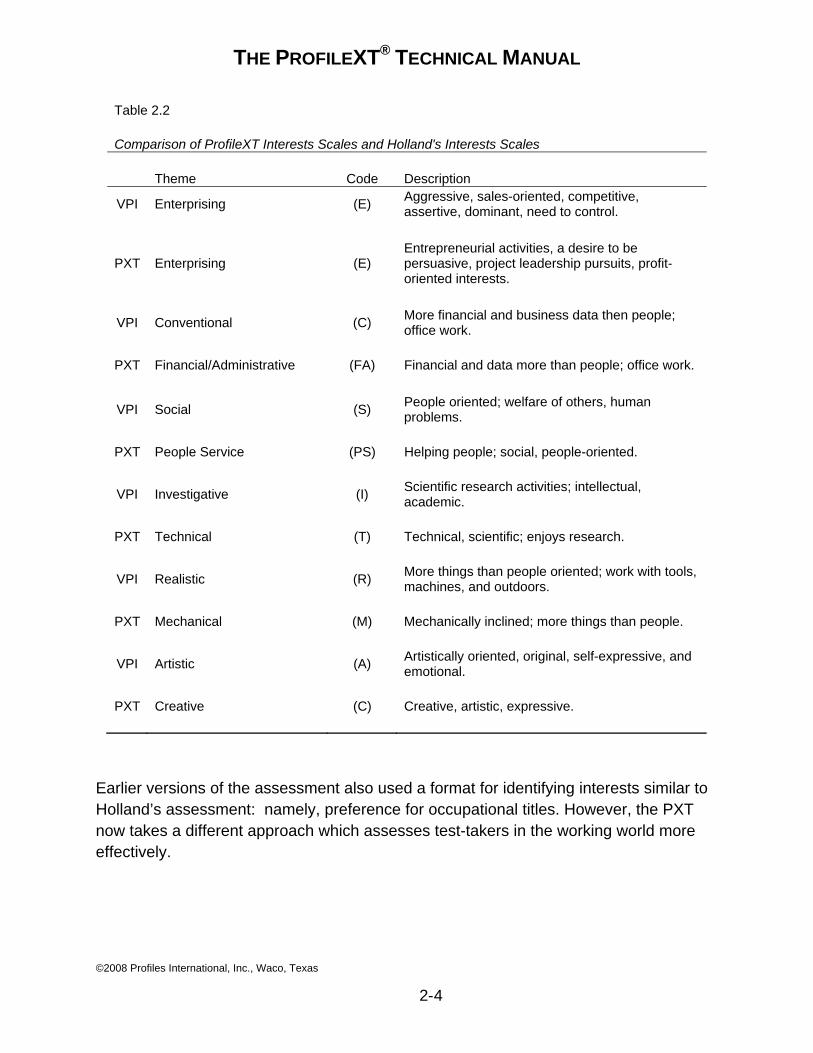
THE PROFILEXT® TECHNICAL MANUAL
©2008 Profiles International, Inc., Waco, Texas
2-4
Table 2.2 Comparison of ProfileXT Interests Scales and Holland's Interests Scales Theme Code Description
VPI Enterprising (E) Aggressive, sales-oriented, competitive, assertive, dominant, need to control.
PXT Enterprising (E) Entrepreneurial activities, a desire to be persuasive, project leadership pursuits, profit-oriented interests.
VPI Conventional (C) More financial and business data then people; office work.
PXT Financial/Administrative (FA) Financial and data more than people; office work.
VPI Social (S) People oriented; welfare of others, human problems.
PXT People Service (PS) Helping people; social, people-oriented.
VPI Investigative (I) Scientific research activities; intellectual, academic.
PXT Technical (T) Technical, scientific; enjoys research.
VPI Realistic (R) More things than people oriented; work with tools, machines, and outdoors.
PXT Mechanical (M) Mechanically inclined; more things than people.
VPI Artistic (A) Artistically oriented, original, self-expressive, and emotional.
PXT Creative (C) Creative, artistic, expressive.
Earlier versions of the assessment also used a format for identifying interests similar to Holland’s assessment: namely, preference for occupational titles. However, the PXT now takes a different approach which assesses test-takers in the working world more effectively.
THE PROFILEXT® TECHNICAL MANUAL
©2008 Profiles International, Inc., Waco, Texas
2-5
PXT Occupational Interests Section: A Focus on Common Activities In The Profile, Occupational Interests scores were determined by the indication of one’s interest in specific occupations from a list of 84 occupations. While this approach proved effective, it was determined that an expression of interest in commonly identifiable activities could also be used and would appeal to a larger population of users. In the ProfileXT, 110 common, everyday activities are presented in pairs and a preference level between each pair is given. This resulted in 55 questions for this section, one for each pairing.
The ProfileXT format uses activities rather than occupational titles to assess interests. Each occupational title as used in other methodologies, while valid, may carry additional values, meanings, and implications to the test-taker that go beyond basic interest. Income, status, educational requirements, and other aspects associated with the occupational title may create spurious responses on an inventory. Therefore, the ProfileXT uses common, everyday activities easily recognizable and relatable to a diversity of test-takers.
Developing the List of Activities for Each Interests Theme
The Dictionary of Occupational Titles was a primary resource in creating the list of activities associated with each of the 84 occupations established for use in the Profile. The list of activities for each occupation was reviewed by each member of a panel of five psychologists experienced in occupational assessments. The activities determined to be confusing to an assessment-taker or to have a gender bias were eliminated if a majority of the panel members voted to eliminate them. This resulted in a list of 276 activities representing all six of Holland’s themes.
A representative sample of 63 individuals who were employees of a service organization or independent sales agents were given a questionnaire and asked to indicate if they would enjoy doing each activity with a “Yes” or “No” response. Fifty-one individuals in the group were also asked to complete the Self Directed Search (1994).
Factor analysis of the results revealed six strong clusters and three smaller clusters. The panel identified the six primary clusters as matching the six Holland interests groups. The strongest 20 items were identified for each of the six interests groups giving a total of 120 activities.
The Self Directed Search (SDS) results created a rank-ordering of all six interests for the 51 individuals who completed that assessment. A Pearson correlation coefficient
THE PROFILEXT® TECHNICAL MANUAL
©2008 Profiles International, Inc., Waco, Texas
2-6
comparing these SDS orderings with the rank-ordering results from the 120 item experimental measure was .83. These 120 items were accepted as having good equivalence with the SDS results.
It was determined that 55 pairings of statements, using the 110 strongest items, would provide an acceptable combination of robustness with a realistic consideration of time restraints for assessing the test-taker in a business setting. The pairings were randomly assigned to give appropriate exposure to the various combinations of themes.
Interests Theme Coding
The items and scales for the PXT Occupational Interests Inventory were developed in accordance with the following guidelines:
♦ The items should be generally well understood and recognizable by a diversity of test-takers.
♦ The questions should be a representative and systematic sampling of relatively independent and relevant theme-related activities.
♦ The items should produce six theme-related scales, which are independent from each other and individually homogeneous (internally consistent).
♦ The questions should be generally neutral with regard to gender and personal experience.
♦ The items and scales should be correlated with the Self Directed Search (1994), Vocational Preference Inventory (1985), and the Dictionary of Holland Occupational Codes (1989).
The PXT Occupational Interests Inventory consists of 55 items of paired activities’ comparisons which represent six general interests themes. Details concerning our definitions for the constructs measured by the PXT may be found in Appendix A.
Holland’s six occupational themes were used to form a three-letter code symbolizing a subject’s three highest interests categories, such as ECS, RIE, and CSE which are useful when assessing the degree of compatibility between a person’s interests and thousands of occupational codes contained in the Dictionary of Holland Occupational Codes (DHOC). The premise is that the closer the match between an individual and an occupational group, the more likely it is the individual will be well suited to that occupational group.
THE PROFILEXT® TECHNICAL MANUAL
©2008 Profiles International, Inc., Waco, Texas
2-7
The Occupational Interests Inventory found in the ProfileXT also produces three-letter codes such as EFP, MTE, and FPE that are comparable to the codes contained in the Dictionary of Holland Occupational Codes. The PXT Interests codes go a step further by the nature of their relationship to current information gathered by the U.S. Department of Labor’s Occupational Network (O*Net), as well as to each user’s Job Match Pattern.
The PXT Occupational Interests Inventory can provide a guide to vocational and career exploration for individuals seeking a general idea of their occupational preferences. It is also useful for those who have established a career but want to examine similar careers. The PXT Occupational Interests Inventory may also assist those re-entering the workforce with a general idea of the type of work they would find interesting and enjoyable.
The Thinking Style Section
Researchers developing measurements aimed at cognitive abilities have always struggled with the definition of cognitive ability, or thinking. Thurstone (1938) and others used measures based on common theories at the time, expanding upon them as more was learned. Later researchers used their own particular measures to define thinking (Wechsler 1944, Terman, et. al. 1960) but required a more individually administered testing approach to accomplish that feat. Still later, researchers expanded the definition of thinking to include everything from visual and auditory thinking to emotion-based learning.
As with any measure, the Thinking Style Section of the ProfileXT starts with a definition. Thinking Style refers to the ability to use old learning applied to new experiences in order to measure the flexibility of thinking required to grasp concepts in a job or training setting. It was this definition which prompted the initial research and has specific applicability to what are considered job-related requirements that all employees must possess.
The Original Test of General Learning (TOGL) was developed in 1988 by Dr. S.G. Howard from a large pool of items consisting of numeric and verbal learning items. The item pool was reviewed by a panel of psychologists as to difficulty and appropriateness to the work environment.
These items were submitted to a group of 325 subjects with an educational achievement level from 9th grade through a graduate degree. The subject pool was aged 15-28, 58% male, 68% White, 13% Black, 18% Hispanic, and 1% other. Item
THE PROFILEXT® TECHNICAL MANUAL
©2008 Profiles International, Inc., Waco, Texas
2-8
analysis of these data indicated the best items to be selected by type and level of difficulty. The items were arranged in increasing difficulty with numeric and verbal items mixed together.
The resulting question set consisted of 84 items. Of these, 42 made up the Verbal Learning Scale and 42 the Numerical Learning Scale. The Thinking Style section consists of multiple-choice questions and began, at its inception, as the Test of General Learning (TOGL) and the Measurement of General Abilities (MGA). They were developed as individually administered tests of verbal, numerical, general learning, and reasoning skills.
These tests have proven to be good measures of a person's cognitive flexibility and comfort level in different learning settings. Since their initial development, they have been used to help support selection and career development decisions. When used with a selection and training program, both the TOGL and the MGA have been shown to be valuable tools for assessing an employees' potential, as is demonstrated in Chapter 5 of this document.
The initial development of the Thinking Style scales was conducted in 1988. Using an approach favored by measures of thinking style and learning potential, a large pool of questions were developed consisting of both numerical and verbal items. The questions were submitted to an item analysis in which the best questions were selected by subject ability covered and level of difficulty. They were then arranged in order of increasing difficulty with numeric and verbal questions in repeating pattern order.
In their original form, and as the ProfileXT, the assessments in their American English form are intended for use only with individuals familiar with the English language and who are literate at or above the sixth grade level. Our international versions follow the same guidelines: to be used by those fluent in the local language. Details concerning our definitions for the Thinking Styles constructs measured by the PXT may be found in Appendix A.
Refinement of the Two Learning Scales into Four Learning Scales
Initially, the test consisted of 42 questions comprising the Numerical Learning Scale and 42 questions comprising the Verbal Learning Scale. The numeric portion of the test required an individual to respond to number series, calculations, or word problems. For verbal questions, the scale asked a person to render either a synonym or an antonym.
THE PROFILEXT® TECHNICAL MANUAL
©2008 Profiles International, Inc., Waco, Texas
2-9
To facilitate analysis of the results in The Profile, the earliest edition of the current ProfileXT, these two scales were divided into four scales. The Verbal Learning Scale became the Verbal Skill Scale (18 questions) and the Verbal Reasoning Scale (20 questions), while the Numerical Learning Scale became the Numerical Ability Scale (22 questions) and the Numeric Reasoning Scale (17 questions). This provided a total of 77 questions for the Thinking Style section. The Learning Index score in the Thinking Style section is a composite of each of the other four Thinking Style scales. The raw scores from all four Thinking Style sections (all 77 questions) are combined to create a Learning Index raw score. This raw score is normed as a fifth, independent score.
The development process of converting from two scales to four scales is covered in detail in Chapter 5 of this Technical Manual.
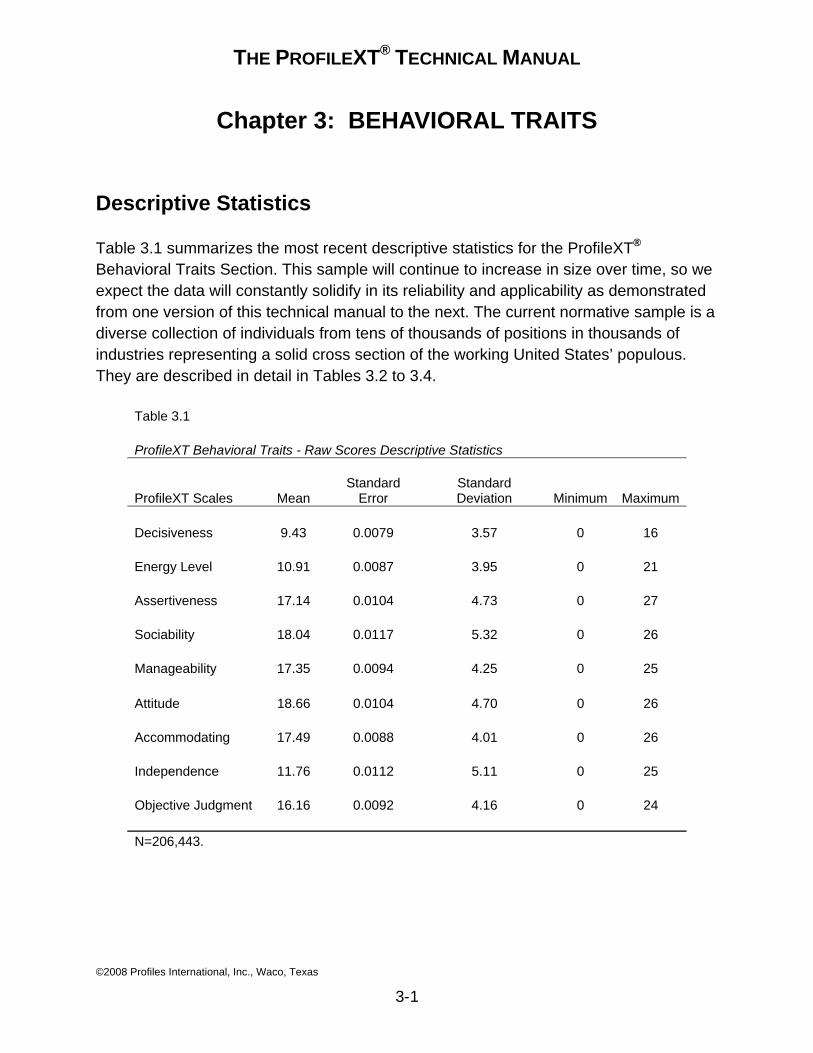
THE PROFILEXT® TECHNICAL MANUAL
©2008 Profiles International, Inc., Waco, Texas
3-1
Chapter 3: BEHAVIORAL TRAITS
Descriptive Statistics
Table 3.1 summarizes the most recent descriptive statistics for the ProfileXT® Behavioral Traits Section. This sample will continue to increase in size over time, so we expect the data will constantly solidify in its reliability and applicability as demonstrated from one version of this technical manual to the next. The current normative sample is a diverse collection of individuals from tens of thousands of positions in thousands of industries representing a solid cross section of the working United States’ populous. They are described in detail in Tables 3.2 to 3.4.
Table 3.1 ProfileXT Behavioral Traits - Raw Scores Descriptive Statistics
ProfileXT Scales Mean Standard
Error Standard Deviation Minimum Maximum
Decisiveness 9.43 0.0079 3.57 0 16 Energy Level 10.91 0.0087 3.95 0 21 Assertiveness 17.14 0.0104 4.73 0 27 Sociability 18.04 0.0117 5.32 0 26 Manageability 17.35 0.0094 4.25 0 25 Attitude 18.66 0.0104 4.70 0 26 Accommodating 17.49 0.0088 4.01 0 26 Independence 11.76 0.0112 5.11 0 25 Objective Judgment 16.16 0.0092 4.16 0 24 N=206,443.
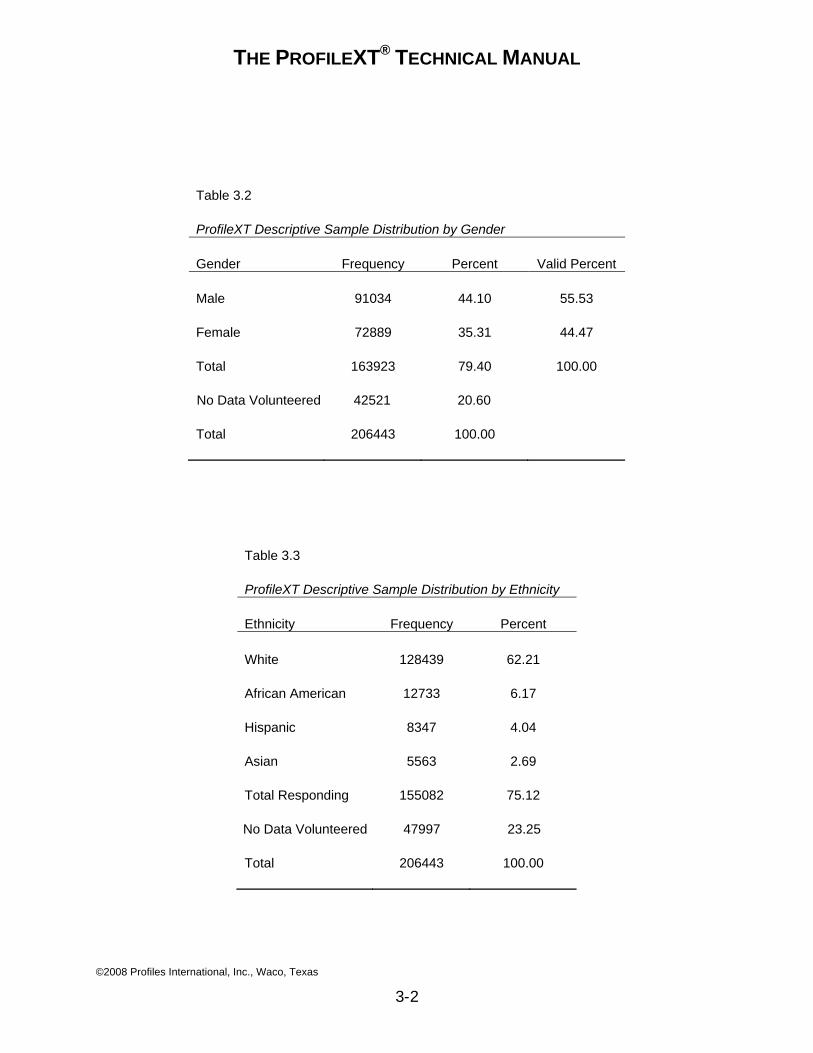
THE PROFILEXT® TECHNICAL MANUAL
©2008 Profiles International, Inc., Waco, Texas
3-2
Table 3.2 ProfileXT Descriptive Sample Distribution by Gender Gender Frequency Percent Valid Percent Male 91034 44.10 55.53 Female 72889 35.31 44.47 Total 163923 79.40 100.00
No Data Volunteered 42521 20.60 Total 206443 100.00
Table 3.3 ProfileXT Descriptive Sample Distribution by Ethnicity Ethnicity Frequency Percent White 128439 62.21 African American 12733 6.17 Hispanic 8347 4.04 Asian 5563 2.69 Total Responding 155082 75.12
No Data Volunteered 47997 23.25 Total 206443 100.00
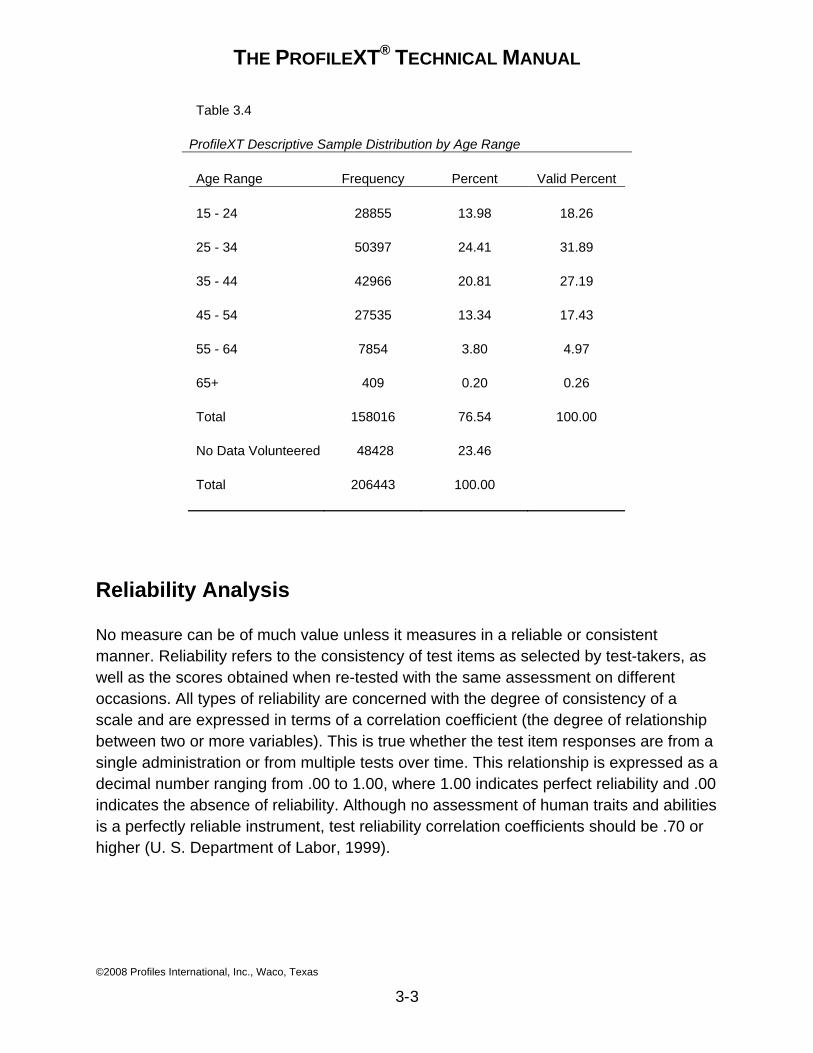
THE PROFILEXT® TECHNICAL MANUAL
©2008 Profiles International, Inc., Waco, Texas
3-3
Table 3.4
ProfileXT Descriptive Sample Distribution by Age Range Age Range Frequency Percent Valid Percent 15 - 24 28855 13.98 18.26 25 - 34 50397 24.41 31.89 35 - 44 42966 20.81 27.19 45 - 54 27535 13.34 17.43 55 - 64 7854 3.80 4.97 65+ 409 0.20 0.26 Total 158016 76.54 100.00 No Data Volunteered 48428 23.46 Total 206443 100.00
Reliability Analysis
No measure can be of much value unless it measures in a reliable or consistent manner. Reliability refers to the consistency of test items as selected by test-takers, as well as the scores obtained when re-tested with the same assessment on different occasions. All types of reliability are concerned with the degree of consistency of a scale and are expressed in terms of a correlation coefficient (the degree of relationship between two or more variables). This is true whether the test item responses are from a single administration or from multiple tests over time. This relationship is expressed as a decimal number ranging from .00 to 1.00, where 1.00 indicates perfect reliability and .00 indicates the absence of reliability. Although no assessment of human traits and abilities is a perfectly reliable instrument, test reliability correlation coefficients should be .70 or higher (U. S. Department of Labor, 1999).
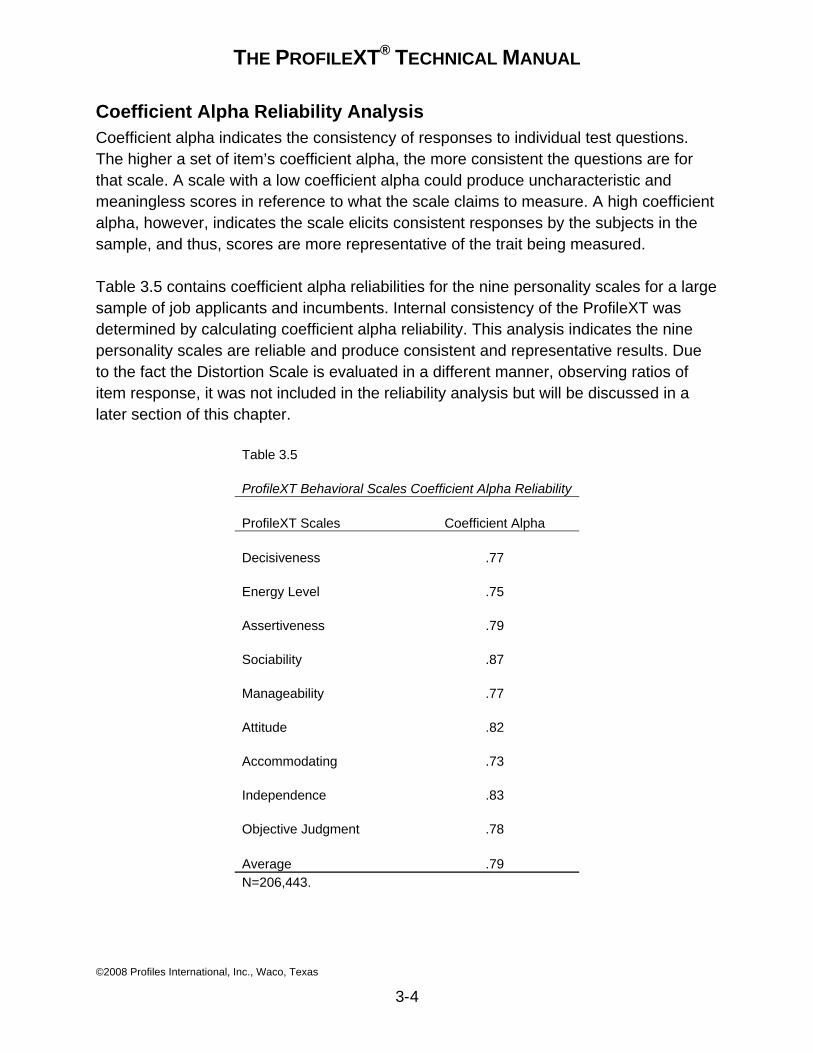
THE PROFILEXT® TECHNICAL MANUAL
©2008 Profiles International, Inc., Waco, Texas
3-4
Coefficient Alpha Reliability Analysis Coefficient alpha indicates the consistency of responses to individual test questions. The higher a set of item’s coefficient alpha, the more consistent the questions are for that scale. A scale with a low coefficient alpha could produce uncharacteristic and meaningless scores in reference to what the scale claims to measure. A high coefficient alpha, however, indicates the scale elicits consistent responses by the subjects in the sample, and thus, scores are more representative of the trait being measured.
Table 3.5 contains coefficient alpha reliabilities for the nine personality scales for a large sample of job applicants and incumbents. Internal consistency of the ProfileXT was determined by calculating coefficient alpha reliability. This analysis indicates the nine personality scales are reliable and produce consistent and representative results. Due to the fact the Distortion Scale is evaluated in a different manner, observing ratios of item response, it was not included in the reliability analysis but will be discussed in a later section of this chapter.
Table 3.5 ProfileXT Behavioral Scales Coefficient Alpha Reliability ProfileXT Scales Coefficient Alpha Decisiveness .77 Energy Level .75 Assertiveness .79 Sociability .87 Manageability .77 Attitude .82 Accommodating .73 Independence .83 Objective Judgment .78 Average .79 N=206,443.
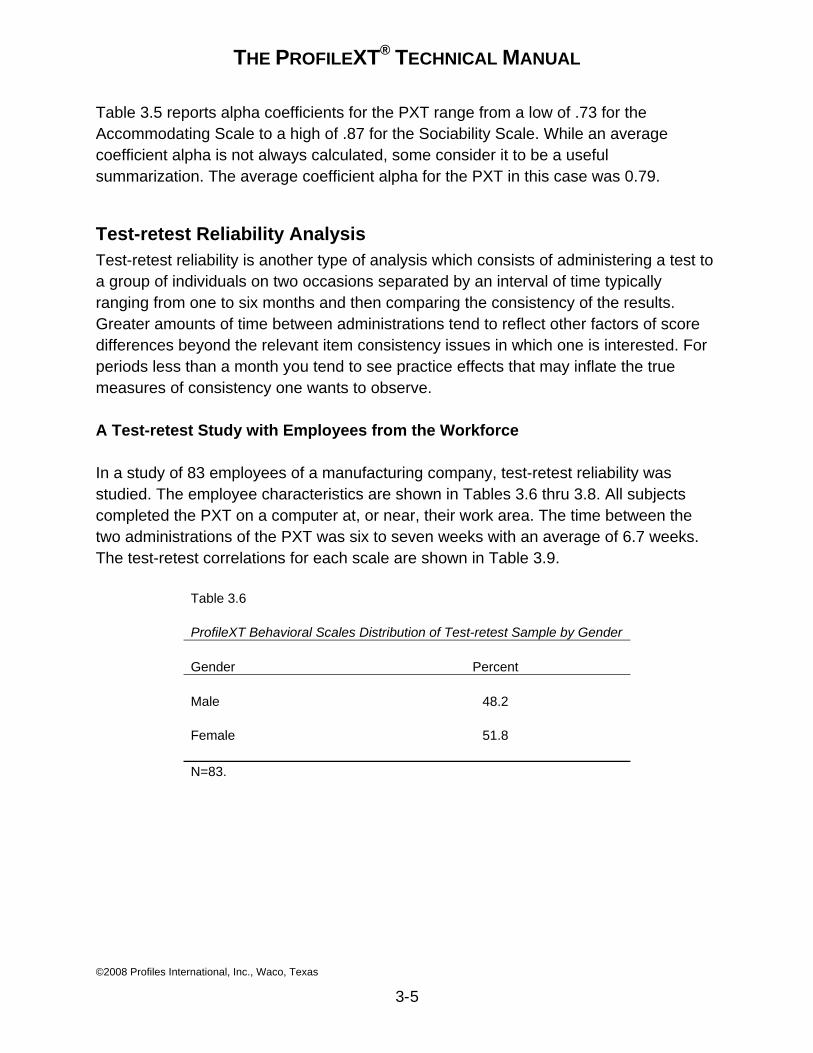
THE PROFILEXT® TECHNICAL MANUAL
©2008 Profiles International, Inc., Waco, Texas
3-5
Table 3.5 reports alpha coefficients for the PXT range from a low of .73 for the Accommodating Scale to a high of .87 for the Sociability Scale. While an average coefficient alpha is not always calculated, some consider it to be a useful summarization. The average coefficient alpha for the PXT in this case was 0.79.
Test-retest Reliability Analysis Test-retest reliability is another type of analysis which consists of administering a test to a group of individuals on two occasions separated by an interval of time typically ranging from one to six months and then comparing the consistency of the results. Greater amounts of time between administrations tend to reflect other factors of score differences beyond the relevant item consistency issues in which one is interested. For periods less than a month you tend to see practice effects that may inflate the true measures of consistency one wants to observe.
A Test-retest Study with Employees from the Workforce
In a study of 83 employees of a manufacturing company, test-retest reliability was studied. The employee characteristics are shown in Tables 3.6 thru 3.8. All subjects completed the PXT on a computer at, or near, their work area. The time between the two administrations of the PXT was six to seven weeks with an average of 6.7 weeks. The test-retest correlations for each scale are shown in Table 3.9.
Table 3.6 ProfileXT Behavioral Scales Distribution of Test-retest Sample by Gender Gender Percent Male 48.2 Female 51.8 N=83.
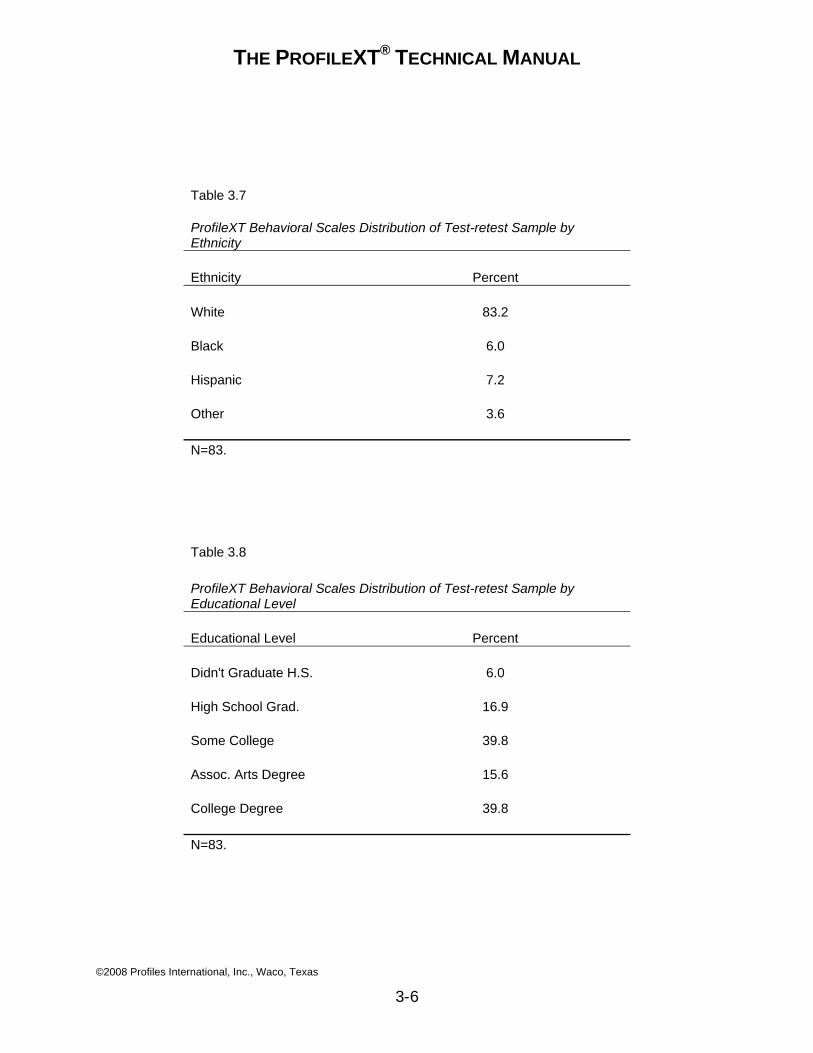
THE PROFILEXT® TECHNICAL MANUAL
©2008 Profiles International, Inc., Waco, Texas
3-6
Table 3.7 ProfileXT Behavioral Scales Distribution of Test-retest Sample by Ethnicity Ethnicity Percent White 83.2 Black 6.0 Hispanic 7.2 Other 3.6 N=83.
Table 3.8 ProfileXT Behavioral Scales Distribution of Test-retest Sample by Educational Level Educational Level Percent Didn't Graduate H.S. 6.0 High School Grad. 16.9 Some College 39.8 Assoc. Arts Degree 15.6 College Degree 39.8 N=83.
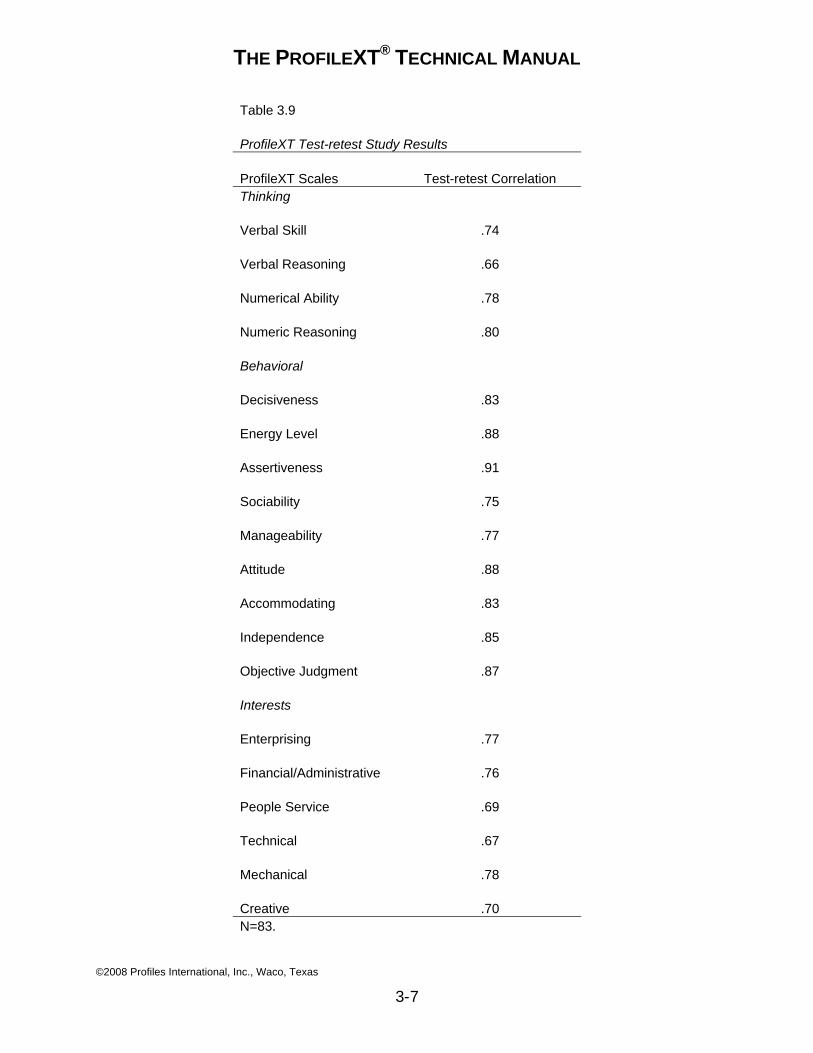
THE PROFILEXT® TECHNICAL MANUAL
©2008 Profiles International, Inc., Waco, Texas
3-7
Table 3.9 ProfileXT Test-retest Study Results ProfileXT Scales Test-retest Correlation Thinking Verbal Skill .74 Verbal Reasoning .66 Numerical Ability .78 Numeric Reasoning .80 Behavioral Decisiveness .83 Energy Level .88 Assertiveness .91 Sociability .75 Manageability .77 Attitude .88 Accommodating .83 Independence .85 Objective Judgment .87 Interests Enterprising .77 Financial/Administrative .76 People Service .69 Technical .67 Mechanical .78 Creative .70 N=83.
THE PROFILEXT® TECHNICAL MANUAL
©2008 Profiles International, Inc., Waco, Texas
3-8
The results from this study, using employees of a manufacturing company are typical of out target population. The higher correlation can be explained by their completing the assessments in a work environment and perhaps taking the task more seriously. These results show good test-retest reliability for all scales.
Validity
Validity is the extent to which an assessment measures what it is designed to measure. The concept of validity refers to the appropriateness, or accuracy, of inferences or decisions made about individuals based on assessment results. It is important from both a business and legal perspective that organizations answer the question regarding the validity of the inference underlying the selection process. If the inference is not valid, organizations stand to waste their business investment on selection assessments and risk legal challenges to their hiring and placement decisions. That inference almost always involves measurements of performance which are measurable, objective, and relevant to success on the job.
Assessment validation refers to the process of gathering evidence to support the inferences being made by an assessment. Various approaches to gathering validity evidence are described below.
The Construct Validity Approach Construct validity refers to the extent to which an assessment and its scales are a relevant measure of a particular construct or trait. Construct validity addresses the question, “How well does the assessment measure what it was designed to measure?”
Although there are different methods for evaluating construct validity, two of the most informative methods include examining the correlation coefficients (1) among the scales within the new instrument, and (2) between the new instrument and other psychological measures which have been shown to measure the same or similar constructs in a valid fashion. The pattern of correlations should be consistent with expectations based on what these scales were intended to measure. Scales that measure related personality constructs should be highly correlated whereas scales that measure unrelated constructs should not correlate highly.
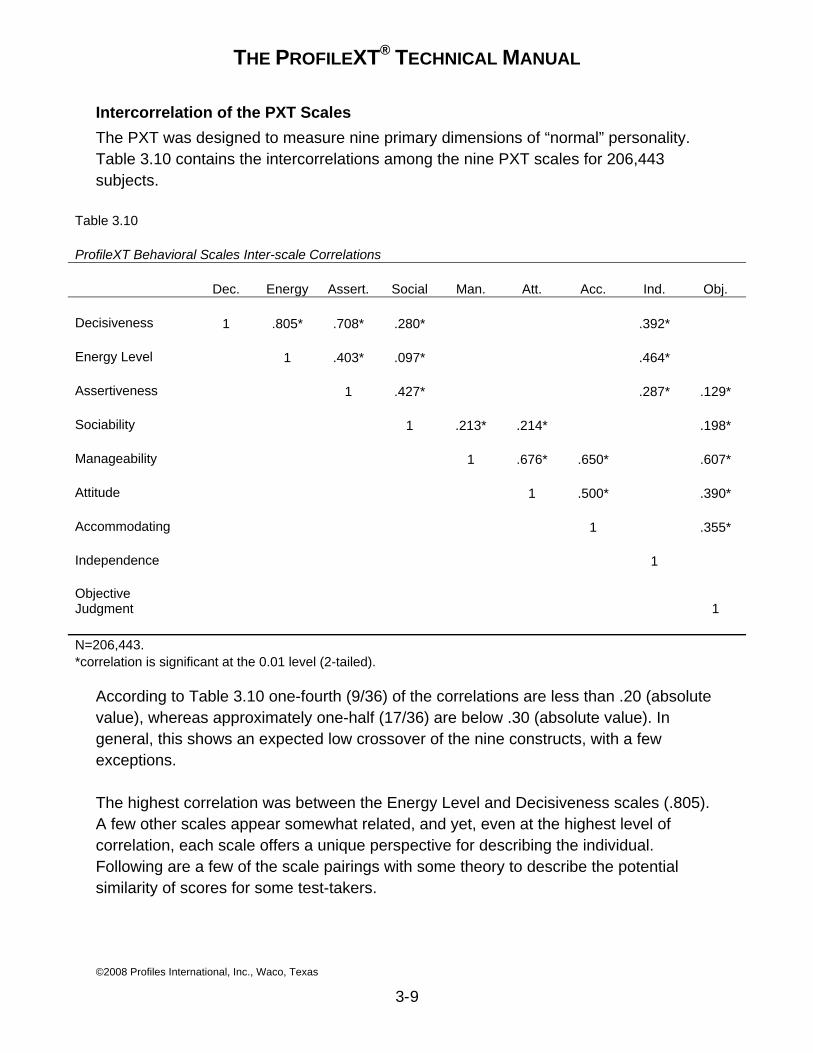
THE PROFILEXT® TECHNICAL MANUAL
©2008 Profiles International, Inc., Waco, Texas
3-9
Intercorrelation of the PXT Scales The PXT was designed to measure nine primary dimensions of “normal” personality. Table 3.10 contains the intercorrelations among the nine PXT scales for 206,443 subjects.
Table 3.10 ProfileXT Behavioral Scales Inter-scale Correlations Dec. Energy Assert. Social Man. Att. Acc. Ind. Obj. Decisiveness 1 .805* .708* .280* .392* Energy Level 1 .403* .097* .464* Assertiveness 1 .427* .287* .129* Sociability 1 .213* .214* .198* Manageability 1 .676* .650* .607* Attitude 1 .500* .390* Accommodating 1 .355* Independence 1 Objective Judgment 1 N=206,443. *correlation is significant at the 0.01 level (2-tailed).
According to Table 3.10 one-fourth (9/36) of the correlations are less than .20 (absolute value), whereas approximately one-half (17/36) are below .30 (absolute value). In general, this shows an expected low crossover of the nine constructs, with a few exceptions.
The highest correlation was between the Energy Level and Decisiveness scales (.805). A few other scales appear somewhat related, and yet, even at the highest level of correlation, each scale offers a unique perspective for describing the individual. Following are a few of the scale pairings with some theory to describe the potential similarity of scores for some test-takers.

THE PROFILEXT® TECHNICAL MANUAL
©2008 Profiles International, Inc., Waco, Texas
3-10
Energy Level and Decisiveness Scales Generally speaking, one’s energy level and decisiveness are related to a common sense of urgency. That is, high scores on the Energy Level scale indicate the motivation to maintain a fast pace, to seek out excitement, and to generate a sense of activity. High scores on the Decisiveness scale indicate the tendency to act with minimal hesitation in what one wishes to do or to risk making a mistake due to a sense of urgency. The degree of the correlation between these two scales supports the view that people who are spontaneous and decisive are more likely to act on their initial decisions with a sense of urgency, and that this urgency feeds back into their high energy level. Similarly, people who are not fast-paced or who do not seek the stimulation of vigorous experiences are generally not inclined to act with decisiveness.
Those individuals whose scores on Decisiveness and Energy Level do not correspond are likely to demonstrate their stronger trait while being tempered by the other. High Energy people with low Decisiveness may become distracted by details, breaking down their ability to make a decision quickly. Highly decisive individuals with a low Energy Level may not express their sense of urgency, even when decision making comes rapidly for them, leaving others confused as to the power of their determination.
Assertiveness and Decisiveness Scales In general terms, assertiveness and decisiveness are related to a person’s willingness to express confidence. That is, high scores on the Assertiveness scale indicate a willingness to stand behind one’s assertions and influence others to one’s way of thinking. High scores on the Decisiveness scale indicate a tendency to exclude doubt from one’s beliefs and act confidently in what one wishes to do, to risk making a mistake due to confidence in what one perceives as being correct and reliable. The degree of correlation between these two scales supports the view that people who are decisive are more likely to express their beliefs to others in a confident manner. Similarly, people who avoid forcing ideas or actions on others are inclined to feel doubt or to avoid risk in decision making.
Those individuals whose scores on Assertiveness and Decisiveness do not correspond are likely to demonstrate their stronger trait while being tempered by the other. Highly assertive individuals with low Decisiveness scores may not be driven to take quick action so much as to be influential and prominent. Highly decisive individuals with low Assertiveness scores may not be perceived as strong and driven leaders, yet are often prepared to act upon the most expedient plan.
THE PROFILEXT® TECHNICAL MANUAL
©2008 Profiles International, Inc., Waco, Texas
3-11
Manageability and Attitude Scales Both of these scales relate to an individual’s style of perceiving the motivations of others. Those who are highly manageable tend to accept the authority held by others, acting in a compliant way. Those whose Manageability scores are lower tend to avoid the restrictions of rules and procedures as often as possible. High Attitude describes those who trust others and rarely suspect bad intentions in others whereas those with low Attitude scores almost never take the motivations and behaviors of others at face value. They tend to be more vigilant and wary.
Because the general tendency appears to be that high scores of Manageability may be related to high scores in Attitude, one could surmise that trust and compliance are concurrent features. Likewise, it appears that those who are wary of the agendas of others are also somewhat wary of personal strictures and unquestioning devotion. These assumptions follow conventional wisdom, even though the two traits involved are unique and separate concepts.
The interesting situation is one in which an individual’s scores do not follow the trend; for example, one is highly trusting (High Attitude) but low in compliance (Low Manageability), or vice versa, demonstrating very little interpersonal trust while acting in a compliant fashion. In such a case, this individual’s manager may decide to develop a productive means for supervising such a person, taking into consideration the individual’s contrasting perceptions and perceived intentions.
Independence and Manageability Scales Along similar lines, people who are more self-reliant, autonomous, self-sufficient, and who show a willingness to reach their goals by means of their own choosing are less inclined to accept strictures and protocols than people who tend to require more structure and guidance to accomplish their objectives. This is an inverse relationship, unlike the previous two mentioned. Higher scores on one scale have a tendency to correspond to lower scores on the other.
Those individuals whose Independence and Manageability scores do not correspond in this fashion are likely to demonstrate a unique synthesis of these two traits. Highly Independent individuals with high Manageability scores do not often have problems following the demands of procedure and protocol, yet they manage to pursue their responsibilities in a self-directed fashion. They adapt to procedure while exercising as much self-determination as possible. They set their own goals and methods while adhering to the rules. Individuals who are not particularly Independent while achieving
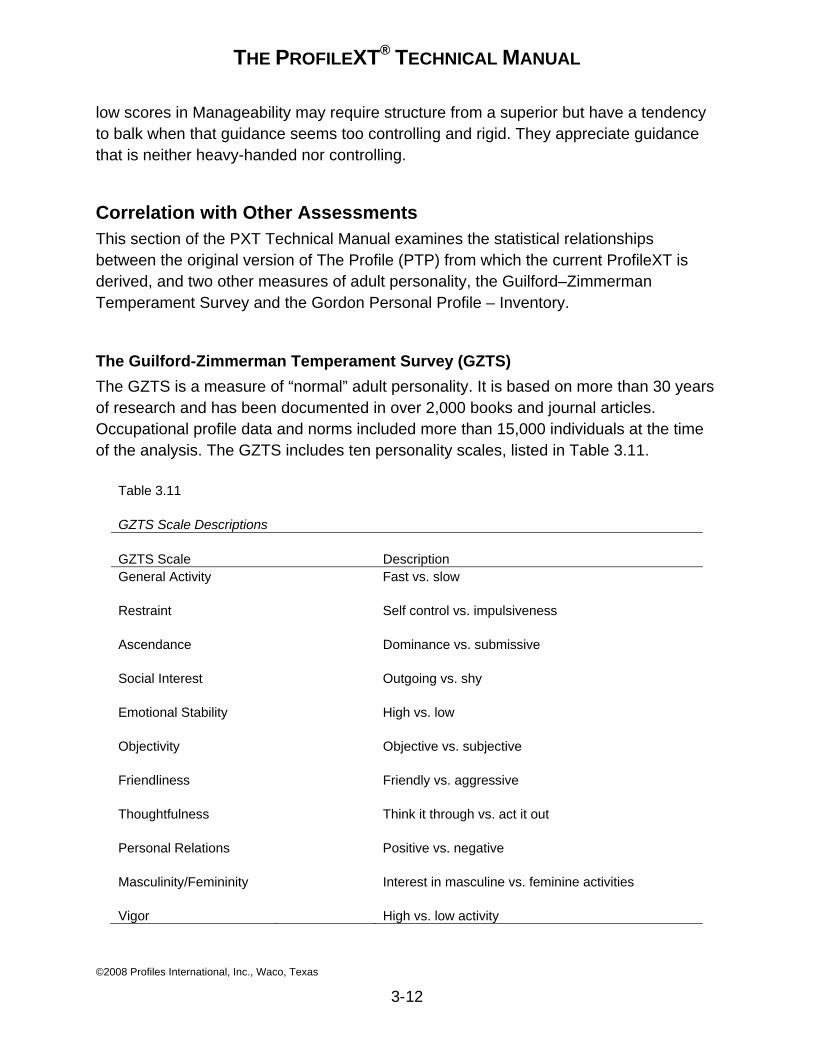
THE PROFILEXT® TECHNICAL MANUAL
©2008 Profiles International, Inc., Waco, Texas
3-12
low scores in Manageability may require structure from a superior but have a tendency to balk when that guidance seems too controlling and rigid. They appreciate guidance that is neither heavy-handed nor controlling.
Correlation with Other Assessments This section of the PXT Technical Manual examines the statistical relationships between the original version of The Profile (PTP) from which the current ProfileXT is derived, and two other measures of adult personality, the Guilford–Zimmerman Temperament Survey and the Gordon Personal Profile – Inventory.
The Guilford-Zimmerman Temperament Survey (GZTS) The GZTS is a measure of “normal” adult personality. It is based on more than 30 years of research and has been documented in over 2,000 books and journal articles. Occupational profile data and norms included more than 15,000 individuals at the time of the analysis. The GZTS includes ten personality scales, listed in Table 3.11.
Table 3.11 GZTS Scale Descriptions GZTS Scale Description General Activity Fast vs. slow Restraint Self control vs. impulsiveness Ascendance Dominance vs. submissive Social Interest Outgoing vs. shy Emotional Stability High vs. low Objectivity Objective vs. subjective Friendliness Friendly vs. aggressive Thoughtfulness Think it through vs. act it out Personal Relations Positive vs. negative Masculinity/Femininity Interest in masculine vs. feminine activities Vigor High vs. low activity
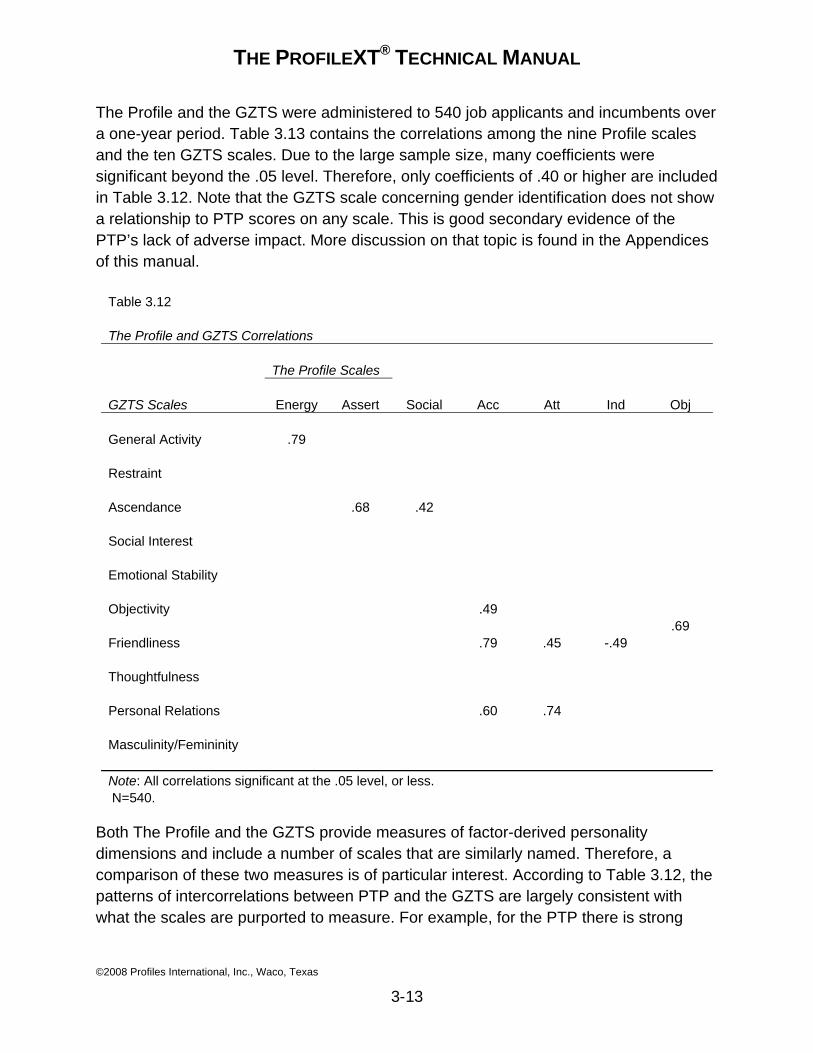
THE PROFILEXT® TECHNICAL MANUAL
©2008 Profiles International, Inc., Waco, Texas
3-13
The Profile and the GZTS were administered to 540 job applicants and incumbents over a one-year period. Table 3.13 contains the correlations among the nine Profile scales and the ten GZTS scales. Due to the large sample size, many coefficients were significant beyond the .05 level. Therefore, only coefficients of .40 or higher are included in Table 3.12. Note that the GZTS scale concerning gender identification does not show a relationship to PTP scores on any scale. This is good secondary evidence of the PTP’s lack of adverse impact. More discussion on that topic is found in the Appendices of this manual.
Table 3.12 The Profile and GZTS Correlations The Profile Scales GZTS Scales Energy Assert Social Acc Att Ind Obj General Activity .79 Restraint Ascendance .68 .42 Social Interest Emotional Stability Objectivity .49 .69 Friendliness .79 .45 -.49 Thoughtfulness Personal Relations .60 .74 Masculinity/Femininity Note: All correlations significant at the .05 level, or less. N=540.
Both The Profile and the GZTS provide measures of factor-derived personality dimensions and include a number of scales that are similarly named. Therefore, a comparison of these two measures is of particular interest. According to Table 3.12, the patterns of intercorrelations between PTP and the GZTS are largely consistent with what the scales are purported to measure. For example, for the PTP there is strong
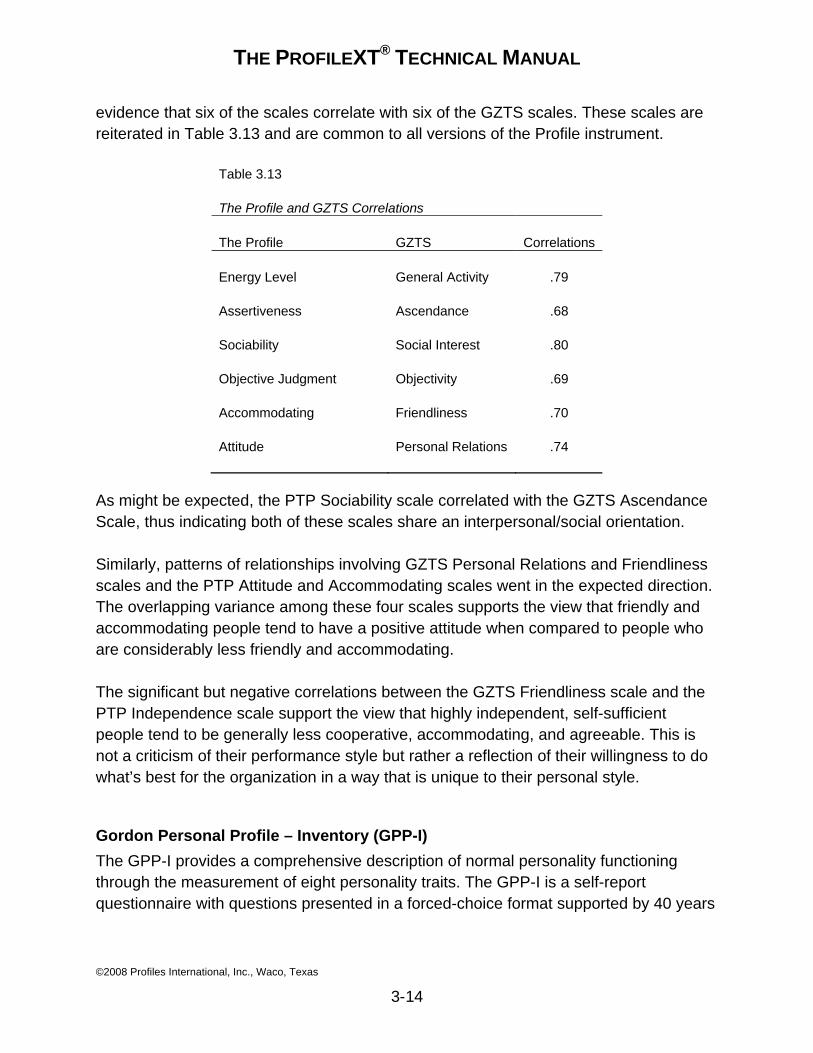
THE PROFILEXT® TECHNICAL MANUAL
©2008 Profiles International, Inc., Waco, Texas
3-14
evidence that six of the scales correlate with six of the GZTS scales. These scales are reiterated in Table 3.13 and are common to all versions of the Profile instrument.
Table 3.13 The Profile and GZTS Correlations The Profile GZTS Correlations Energy Level General Activity .79 Assertiveness Ascendance .68 Sociability Social Interest .80 Objective Judgment Objectivity .69 Accommodating Friendliness .70 Attitude Personal Relations .74
As might be expected, the PTP Sociability scale correlated with the GZTS Ascendance Scale, thus indicating both of these scales share an interpersonal/social orientation.
Similarly, patterns of relationships involving GZTS Personal Relations and Friendliness scales and the PTP Attitude and Accommodating scales went in the expected direction. The overlapping variance among these four scales supports the view that friendly and accommodating people tend to have a positive attitude when compared to people who are considerably less friendly and accommodating.
The significant but negative correlations between the GZTS Friendliness scale and the PTP Independence scale support the view that highly independent, self-sufficient people tend to be generally less cooperative, accommodating, and agreeable. This is not a criticism of their performance style but rather a reflection of their willingness to do what’s best for the organization in a way that is unique to their personal style.
Gordon Personal Profile – Inventory (GPP-I) The GPP-I provides a comprehensive description of normal personality functioning through the measurement of eight personality traits. The GPP-I is a self-report questionnaire with questions presented in a forced-choice format supported by 40 years
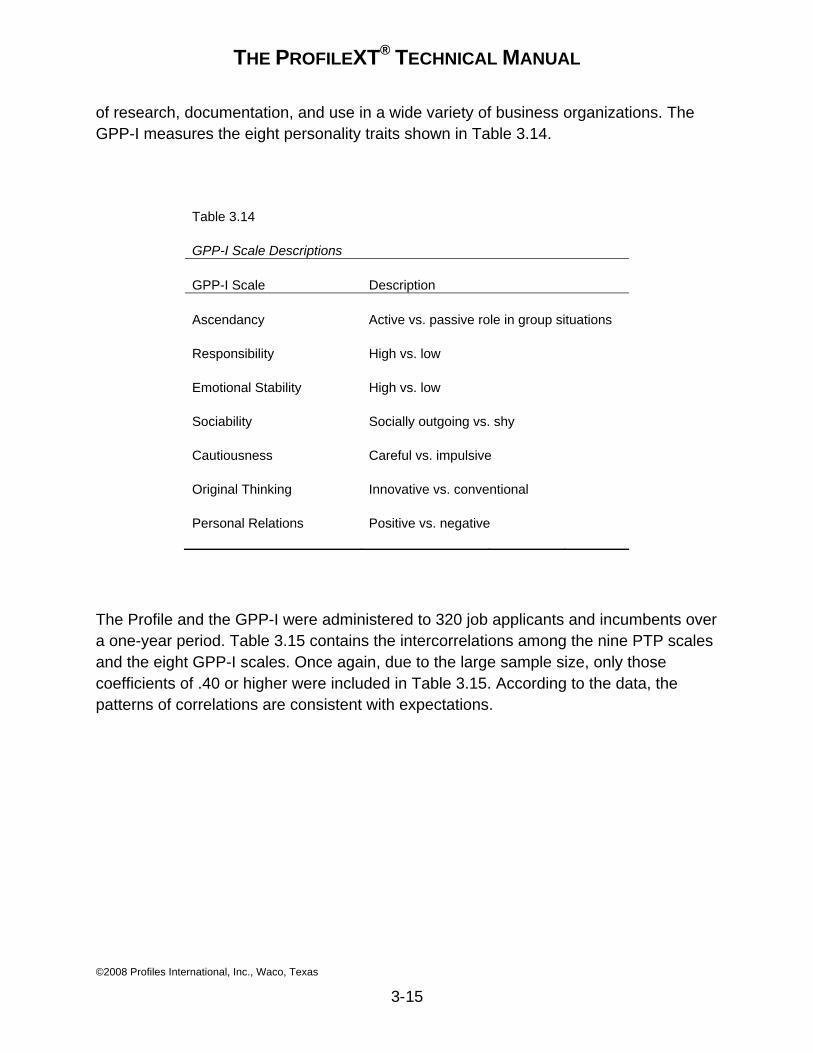
THE PROFILEXT® TECHNICAL MANUAL
©2008 Profiles International, Inc., Waco, Texas
3-15
of research, documentation, and use in a wide variety of business organizations. The GPP-I measures the eight personality traits shown in Table 3.14.
Table 3.14 GPP-I Scale Descriptions GPP-I Scale Description Ascendancy Active vs. passive role in group situations Responsibility High vs. low Emotional Stability High vs. low Sociability Socially outgoing vs. shy Cautiousness Careful vs. impulsive Original Thinking Innovative vs. conventional Personal Relations Positive vs. negative
The Profile and the GPP-I were administered to 320 job applicants and incumbents over a one-year period. Table 3.15 contains the intercorrelations among the nine PTP scales and the eight GPP-I scales. Once again, due to the large sample size, only those coefficients of .40 or higher were included in Table 3.15. According to the data, the patterns of correlations are consistent with expectations.
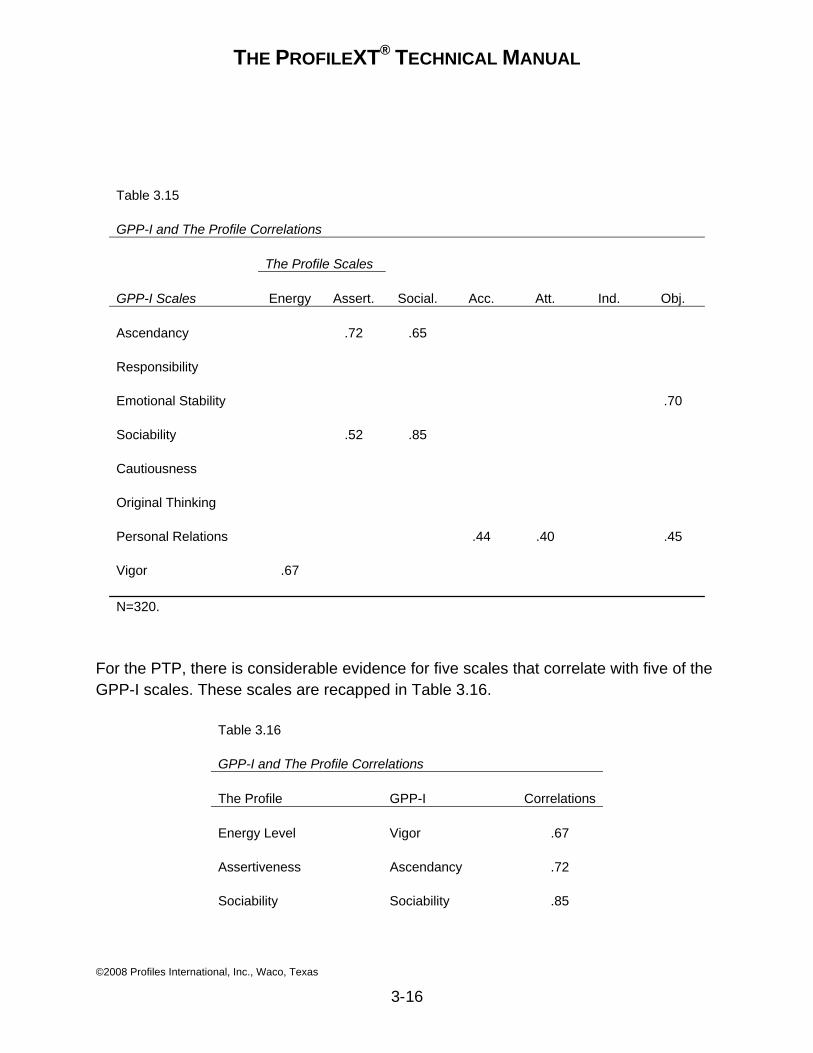
THE PROFILEXT® TECHNICAL MANUAL
©2008 Profiles International, Inc., Waco, Texas
3-16
Table 3.15 GPP-I and The Profile Correlations The Profile Scales GPP-I Scales Energy Assert. Social. Acc. Att. Ind. Obj. Ascendancy .72 .65 Responsibility Emotional Stability .70 Sociability .52 .85 Cautiousness Original Thinking Personal Relations .44 .40 .45 Vigor .67 N=320.
For the PTP, there is considerable evidence for five scales that correlate with five of the GPP-I scales. These scales are recapped in Table 3.16.
Table 3.16 GPP-I and The Profile Correlations The Profile GPP-I Correlations Energy Level Vigor .67 Assertiveness Ascendancy .72 Sociability Sociability .85
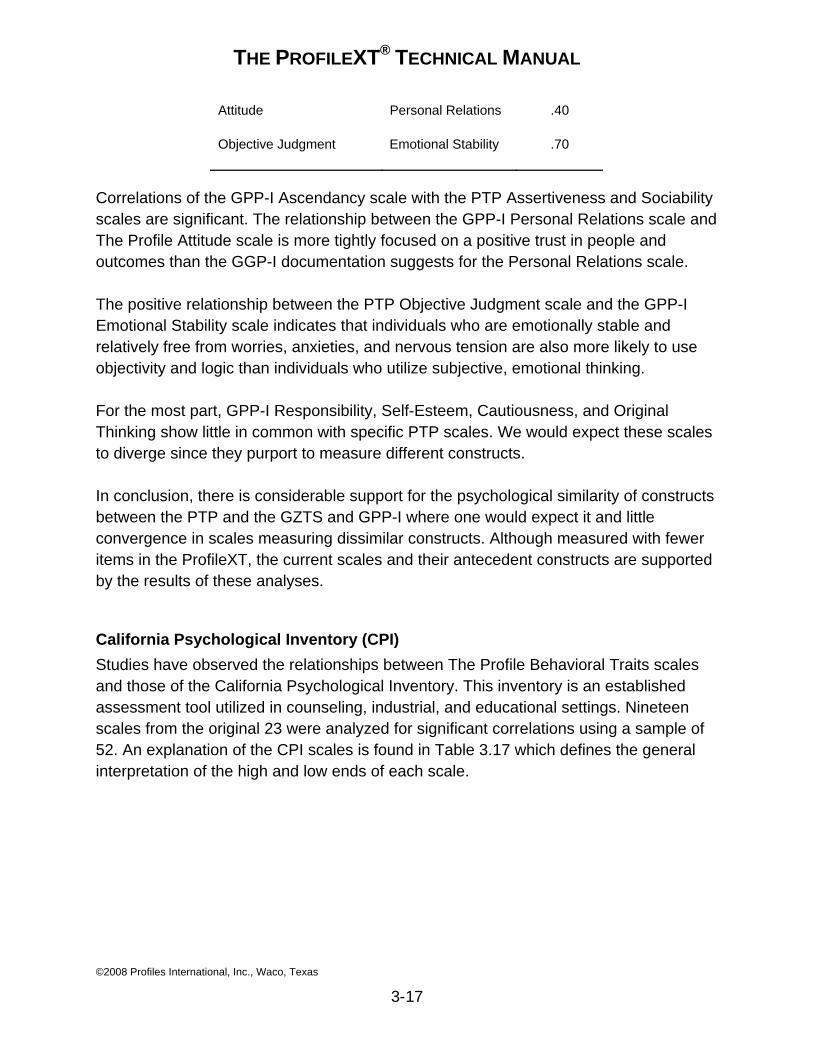
THE PROFILEXT® TECHNICAL MANUAL
©2008 Profiles International, Inc., Waco, Texas
3-17
Attitude Personal Relations .40 Objective Judgment Emotional Stability .70
Correlations of the GPP-I Ascendancy scale with the PTP Assertiveness and Sociability scales are significant. The relationship between the GPP-I Personal Relations scale and The Profile Attitude scale is more tightly focused on a positive trust in people and outcomes than the GGP-I documentation suggests for the Personal Relations scale.
The positive relationship between the PTP Objective Judgment scale and the GPP-I Emotional Stability scale indicates that individuals who are emotionally stable and relatively free from worries, anxieties, and nervous tension are also more likely to use objectivity and logic than individuals who utilize subjective, emotional thinking.
For the most part, GPP-I Responsibility, Self-Esteem, Cautiousness, and Original Thinking show little in common with specific PTP scales. We would expect these scales to diverge since they purport to measure different constructs.
In conclusion, there is considerable support for the psychological similarity of constructs between the PTP and the GZTS and GPP-I where one would expect it and little convergence in scales measuring dissimilar constructs. Although measured with fewer items in the ProfileXT, the current scales and their antecedent constructs are supported by the results of these analyses.
California Psychological Inventory (CPI) Studies have observed the relationships between The Profile Behavioral Traits scales and those of the California Psychological Inventory. This inventory is an established assessment tool utilized in counseling, industrial, and educational settings. Nineteen scales from the original 23 were analyzed for significant correlations using a sample of 52. An explanation of the CPI scales is found in Table 3.17 which defines the general interpretation of the high and low ends of each scale.
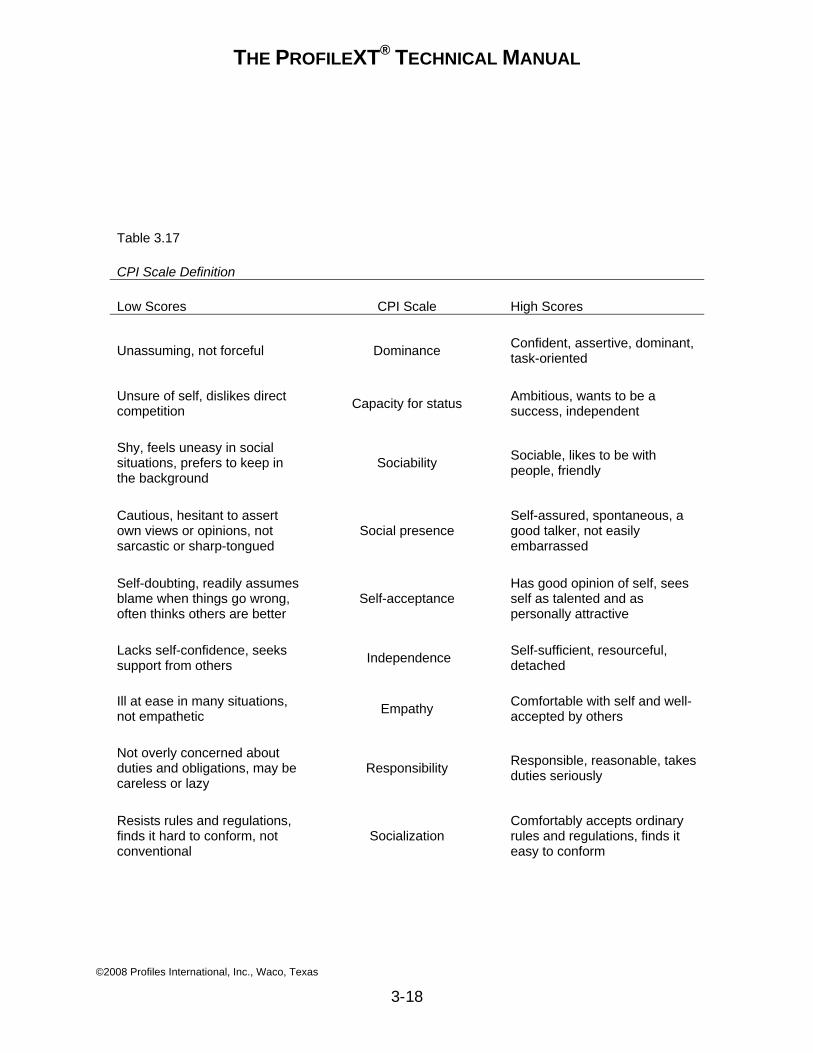
THE PROFILEXT® TECHNICAL MANUAL
©2008 Profiles International, Inc., Waco, Texas
3-18
Table 3.17 CPI Scale Definition Low Scores CPI Scale High Scores
Unassuming, not forceful Dominance Confident, assertive, dominant, task-oriented
Unsure of self, dislikes direct competition Capacity for status Ambitious, wants to be a
success, independent Shy, feels uneasy in social situations, prefers to keep in the background
Sociability Sociable, likes to be with people, friendly
Cautious, hesitant to assert own views or opinions, not sarcastic or sharp-tongued
Social presence Self-assured, spontaneous, a good talker, not easily embarrassed
Self-doubting, readily assumes blame when things go wrong, often thinks others are better
Self-acceptance Has good opinion of self, sees self as talented and as personally attractive
Lacks self-confidence, seeks support from others Independence Self-sufficient, resourceful,
detached Ill at ease in many situations, not empathetic Empathy Comfortable with self and well-
accepted by others Not overly concerned about duties and obligations, may be careless or lazy
Responsibility Responsible, reasonable, takes duties seriously
Resists rules and regulations, finds it hard to conform, not conventional
Socialization Comfortably accepts ordinary rules and regulations, finds it easy to conform
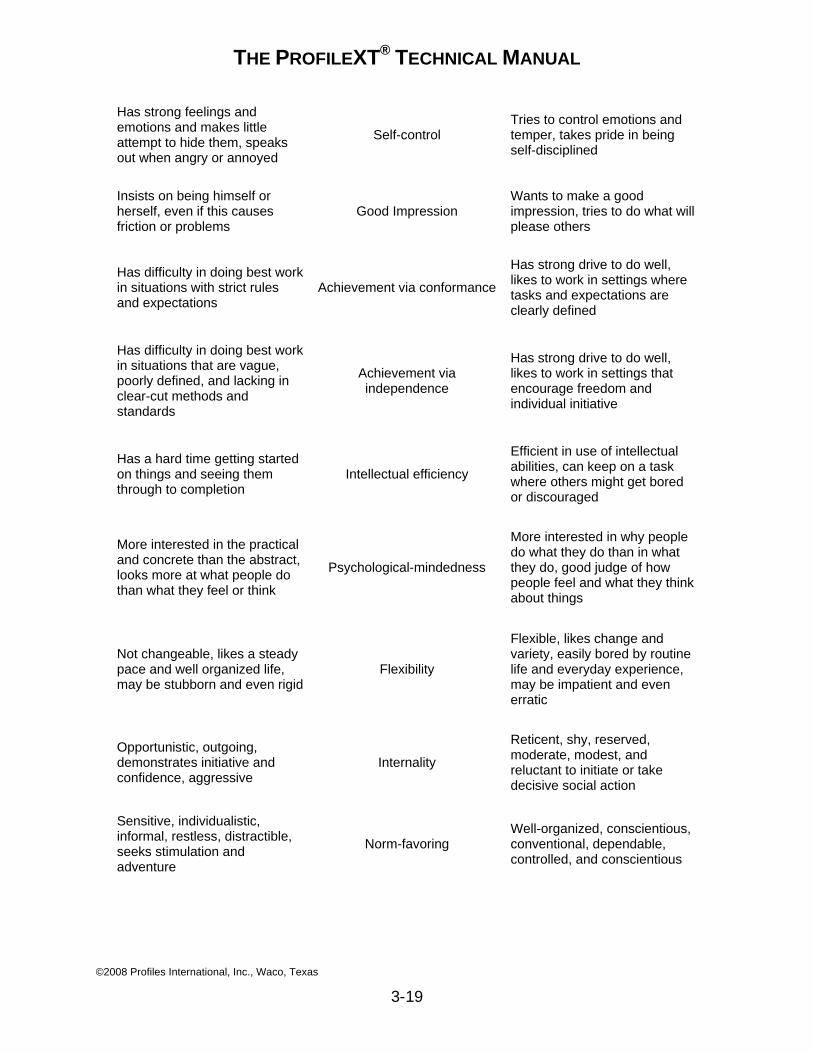
THE PROFILEXT® TECHNICAL MANUAL
©2008 Profiles International, Inc., Waco, Texas
3-19
Has strong feelings and emotions and makes little attempt to hide them, speaks out when angry or annoyed
Self-control Tries to control emotions and temper, takes pride in being self-disciplined
Insists on being himself or herself, even if this causes friction or problems
Good Impression Wants to make a good impression, tries to do what will please others
Has difficulty in doing best work in situations with strict rules and expectations
Achievement via conformance
Has strong drive to do well, likes to work in settings where tasks and expectations are clearly defined
Has difficulty in doing best work in situations that are vague, poorly defined, and lacking in clear-cut methods and standards
Achievement via independence
Has strong drive to do well, likes to work in settings that encourage freedom and individual initiative
Has a hard time getting started on things and seeing them through to completion
Intellectual efficiency
Efficient in use of intellectual abilities, can keep on a task where others might get bored or discouraged
More interested in the practical and concrete than the abstract, looks more at what people do than what they feel or think
Psychological-mindedness
More interested in why people do what they do than in what they do, good judge of how people feel and what they think about things
Not changeable, likes a steady pace and well organized life, may be stubborn and even rigid
Flexibility
Flexible, likes change and variety, easily bored by routine life and everyday experience, may be impatient and even erratic
Opportunistic, outgoing, demonstrates initiative and confidence, aggressive
Internality
Reticent, shy, reserved, moderate, modest, and reluctant to initiate or take decisive social action
Sensitive, individualistic, informal, restless, distractible, seeks stimulation and adventure
Norm-favoring Well-organized, conscientious, conventional, dependable, controlled, and conscientious
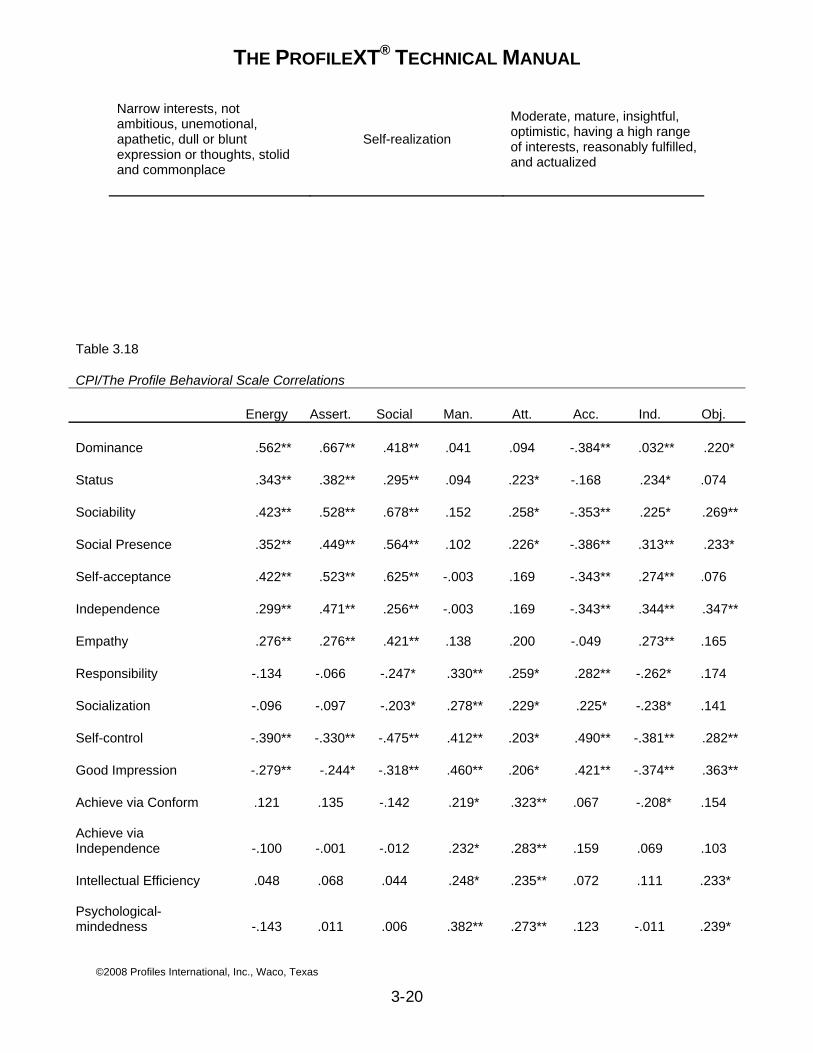
THE PROFILEXT® TECHNICAL MANUAL
©2008 Profiles International, Inc., Waco, Texas
3-20
Narrow interests, not ambitious, unemotional, apathetic, dull or blunt expression or thoughts, stolid and commonplace
Self-realization
Moderate, mature, insightful, optimistic, having a high range of interests, reasonably fulfilled, and actualized
Table 3.18 CPI/The Profile Behavioral Scale Correlations Energy Assert. Social Man. Att. Acc. Ind. Obj. Dominance .562** .667** .418** .041 .094 -.384** .032** .220* Status .343** .382** .295** .094 .223* -.168 .234* .074 Sociability .423** .528** .678** .152 .258* -.353** .225* .269** Social Presence .352** .449** .564** .102 .226* -.386** .313** .233* Self-acceptance .422** .523** .625** -.003 .169 -.343** .274** .076 Independence .299** .471** .256** -.003 .169 -.343** .344** .347** Empathy .276** .276** .421** .138 .200 -.049 .273** .165 Responsibility -.134 -.066 -.247* .330** .259* .282** -.262* .174 Socialization -.096 -.097 -.203* .278** .229* .225* -.238* .141 Self-control -.390** -.330** -.475** .412** .203* .490** -.381** .282** Good Impression -.279** -.244* -.318** .460** .206* .421** -.374** .363** Achieve via Conform .121 .135 -.142 .219* .323** .067 -.208* .154 Achieve via Independence -.100 -.001 -.012 .232* .283** .159 .069 .103 Intellectual Efficiency .048 .068 .044 .248* .235** .072 .111 .233* Psychological-mindedness -.143 .011 .006 .382** .273** .123 -.011 .239*
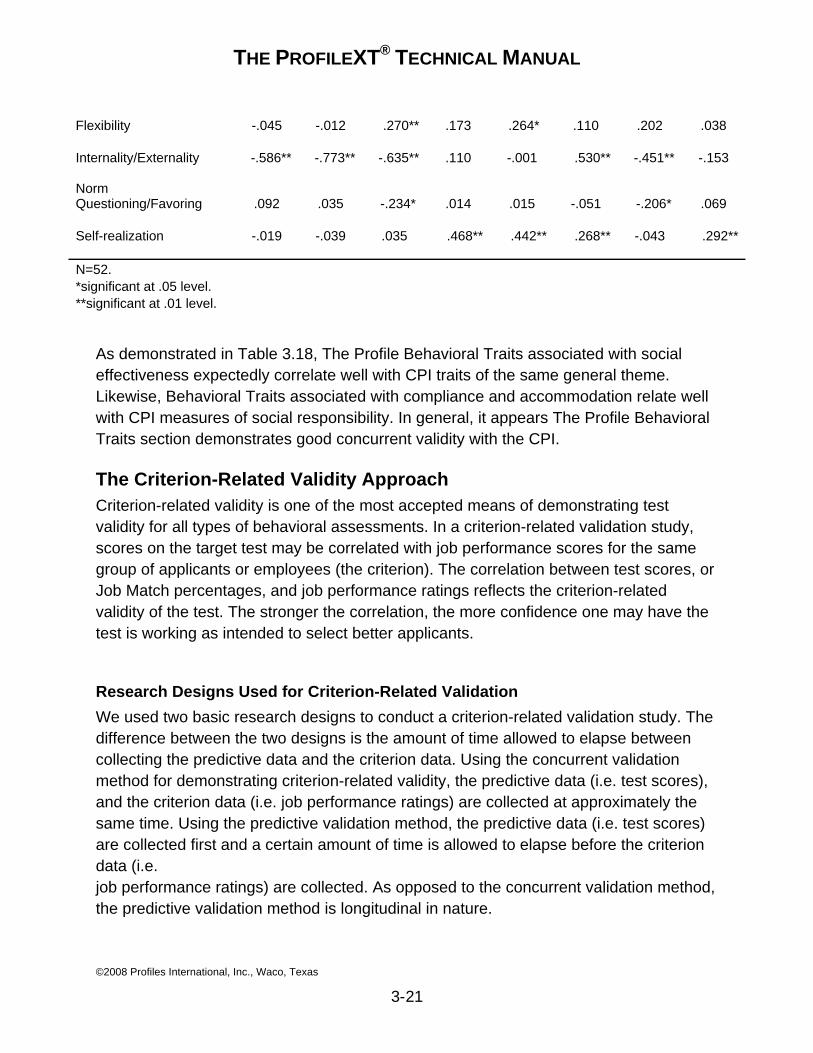
THE PROFILEXT® TECHNICAL MANUAL
©2008 Profiles International, Inc., Waco, Texas
3-21
Flexibility -.045 -.012 .270** .173 .264* .110 .202 .038 Internality/Externality -.586** -.773** -.635** .110 -.001 .530** -.451** -.153 Norm Questioning/Favoring .092 .035 -.234* .014 .015 -.051 -.206* .069 Self-realization -.019 -.039 .035 .468** .442** .268** -.043 .292** N=52. *significant at .05 level. **significant at .01 level.
As demonstrated in Table 3.18, The Profile Behavioral Traits associated with social effectiveness expectedly correlate well with CPI traits of the same general theme. Likewise, Behavioral Traits associated with compliance and accommodation relate well with CPI measures of social responsibility. In general, it appears The Profile Behavioral Traits section demonstrates good concurrent validity with the CPI.
The Criterion-Related Validity Approach Criterion-related validity is one of the most accepted means of demonstrating test validity for all types of behavioral assessments. In a criterion-related validation study, scores on the target test may be correlated with job performance scores for the same group of applicants or employees (the criterion). The correlation between test scores, or Job Match percentages, and job performance ratings reflects the criterion-related validity of the test. The stronger the correlation, the more confidence one may have the test is working as intended to select better applicants.
Research Designs Used for Criterion-Related Validation We used two basic research designs to conduct a criterion-related validation study. The difference between the two designs is the amount of time allowed to elapse between collecting the predictive data and the criterion data. Using the concurrent validation method for demonstrating criterion-related validity, the predictive data (i.e. test scores), and the criterion data (i.e. job performance ratings) are collected at approximately the same time. Using the predictive validation method, the predictive data (i.e. test scores) are collected first and a certain amount of time is allowed to elapse before the criterion data (i.e. job performance ratings) are collected. As opposed to the concurrent validation method, the predictive validation method is longitudinal in nature.
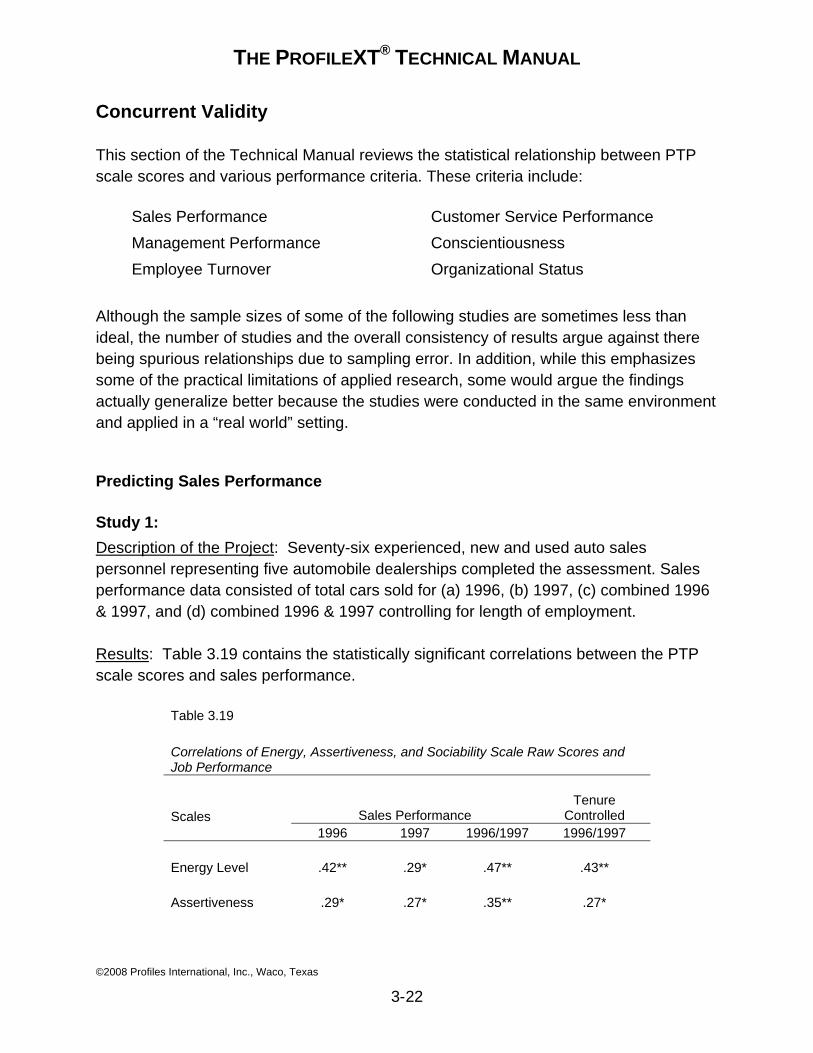
THE PROFILEXT® TECHNICAL MANUAL
©2008 Profiles International, Inc., Waco, Texas
3-22
Concurrent Validity
This section of the Technical Manual reviews the statistical relationship between PTP scale scores and various performance criteria. These criteria include:
Sales Performance Customer Service Performance Management Performance Conscientiousness Employee Turnover Organizational Status
Although the sample sizes of some of the following studies are sometimes less than ideal, the number of studies and the overall consistency of results argue against there being spurious relationships due to sampling error. In addition, while this emphasizes some of the practical limitations of applied research, some would argue the findings actually generalize better because the studies were conducted in the same environment and applied in a “real world” setting.
Predicting Sales Performance
Study 1: Description of the Project: Seventy-six experienced, new and used auto sales personnel representing five automobile dealerships completed the assessment. Sales performance data consisted of total cars sold for (a) 1996, (b) 1997, (c) combined 1996 & 1997, and (d) combined 1996 & 1997 controlling for length of employment.
Results: Table 3.19 contains the statistically significant correlations between the PTP scale scores and sales performance.
Table 3.19 Correlations of Energy, Assertiveness, and Sociability Scale Raw Scores and Job Performance
Scales Sales Performance Tenure
Controlled 1996 1997 1996/1997 1996/1997
Energy Level .42** .29* .47** .43** Assertiveness .29* .27* .35** .27*
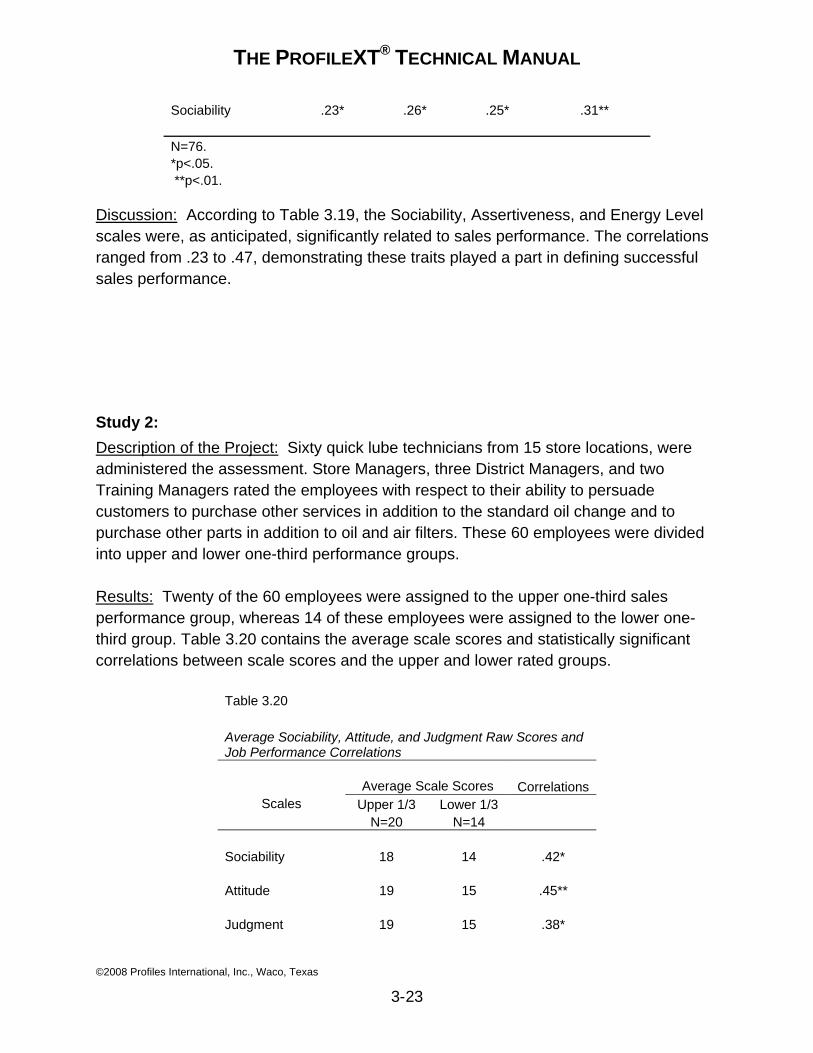
THE PROFILEXT® TECHNICAL MANUAL
©2008 Profiles International, Inc., Waco, Texas
3-23
Sociability .23* .26* .25* .31** N=76. *p<.05. **p<.01.
Discussion: According to Table 3.19, the Sociability, Assertiveness, and Energy Level scales were, as anticipated, significantly related to sales performance. The correlations ranged from .23 to .47, demonstrating these traits played a part in defining successful sales performance.
Study 2: Description of the Project: Sixty quick lube technicians from 15 store locations, were administered the assessment. Store Managers, three District Managers, and two Training Managers rated the employees with respect to their ability to persuade customers to purchase other services in addition to the standard oil change and to purchase other parts in addition to oil and air filters. These 60 employees were divided into upper and lower one-third performance groups.
Results: Twenty of the 60 employees were assigned to the upper one-third sales performance group, whereas 14 of these employees were assigned to the lower one-third group. Table 3.20 contains the average scale scores and statistically significant correlations between scale scores and the upper and lower rated groups.
Table 3.20 Average Sociability, Attitude, and Judgment Raw Scores and Job Performance Correlations
Scales Average Scale Scores Correlations
Upper 1/3 Lower 1/3 N=20 N=14
Sociability 18 14 .42* Attitude 19 15 .45** Judgment 19 15 .38*
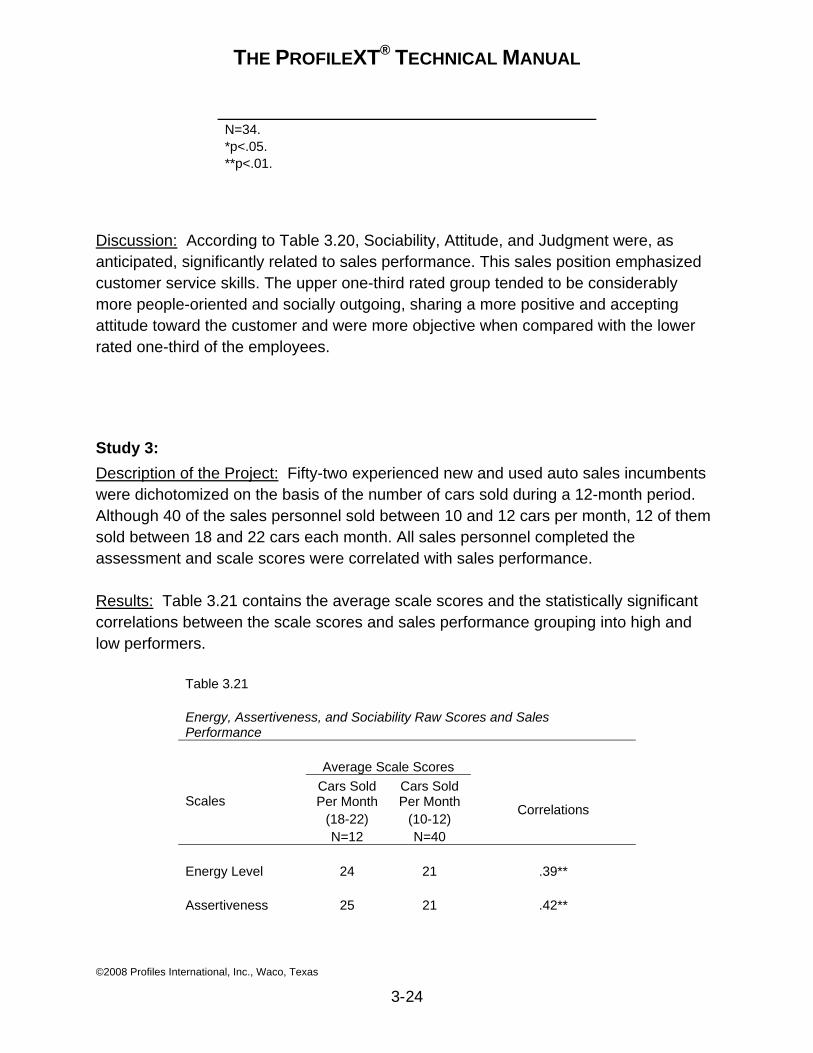
THE PROFILEXT® TECHNICAL MANUAL
©2008 Profiles International, Inc., Waco, Texas
3-24
N=34. *p<.05. **p<.01.
Discussion: According to Table 3.20, Sociability, Attitude, and Judgment were, as anticipated, significantly related to sales performance. This sales position emphasized customer service skills. The upper one-third rated group tended to be considerably more people-oriented and socially outgoing, sharing a more positive and accepting attitude toward the customer and were more objective when compared with the lower rated one-third of the employees.
Study 3: Description of the Project: Fifty-two experienced new and used auto sales incumbents were dichotomized on the basis of the number of cars sold during a 12-month period. Although 40 of the sales personnel sold between 10 and 12 cars per month, 12 of them sold between 18 and 22 cars each month. All sales personnel completed the assessment and scale scores were correlated with sales performance.
Results: Table 3.21 contains the average scale scores and the statistically significant correlations between the scale scores and sales performance grouping into high and low performers.
Table 3.21 Energy, Assertiveness, and Sociability Raw Scores and Sales Performance
Scales
Average Scale Scores Cars Sold Per Month
Cars Sold Per Month Correlations
(18-22) (10-12) N=12 N=40
Energy Level 24 21 .39** Assertiveness 25 21 .42**
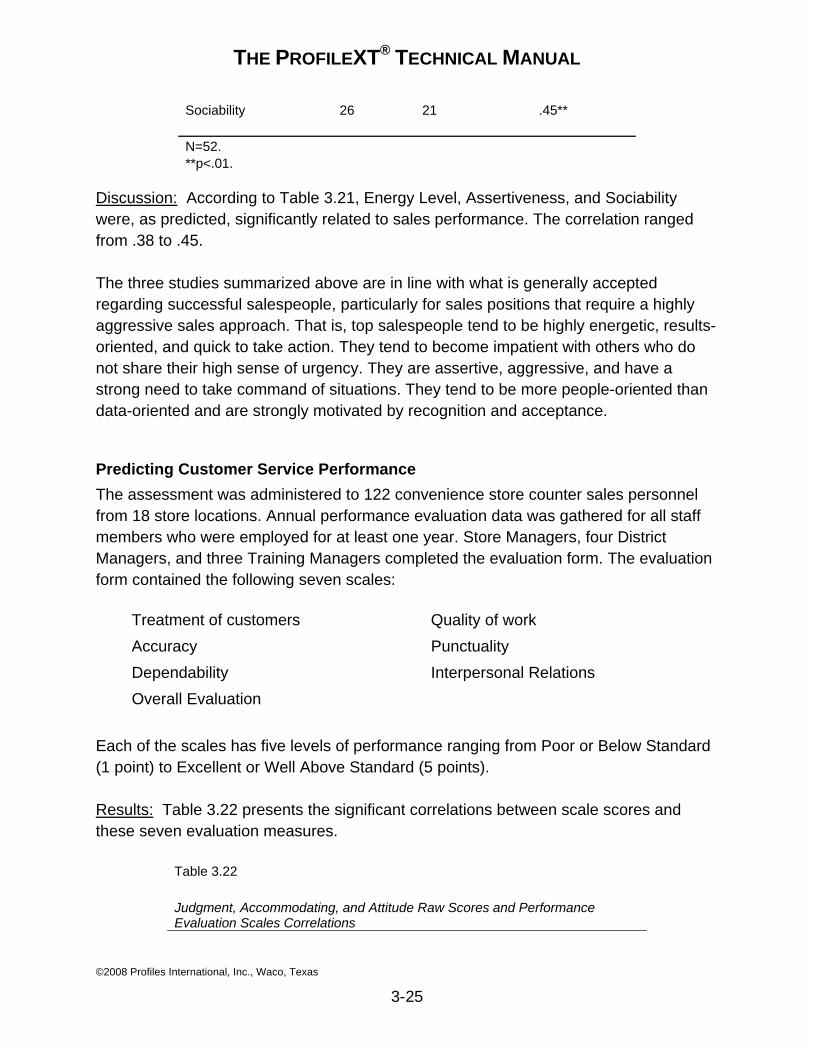
THE PROFILEXT® TECHNICAL MANUAL
©2008 Profiles International, Inc., Waco, Texas
3-25
Sociability 26 21 .45** N=52. **p<.01.
Discussion: According to Table 3.21, Energy Level, Assertiveness, and Sociability were, as predicted, significantly related to sales performance. The correlation ranged from .38 to .45.
The three studies summarized above are in line with what is generally accepted regarding successful salespeople, particularly for sales positions that require a highly aggressive sales approach. That is, top salespeople tend to be highly energetic, results-oriented, and quick to take action. They tend to become impatient with others who do not share their high sense of urgency. They are assertive, aggressive, and have a strong need to take command of situations. They tend to be more people-oriented than data-oriented and are strongly motivated by recognition and acceptance.
Predicting Customer Service Performance The assessment was administered to 122 convenience store counter sales personnel from 18 store locations. Annual performance evaluation data was gathered for all staff members who were employed for at least one year. Store Managers, four District Managers, and three Training Managers completed the evaluation form. The evaluation form contained the following seven scales:
Treatment of customers Quality of work Accuracy Punctuality Dependability Interpersonal Relations Overall Evaluation
Each of the scales has five levels of performance ranging from Poor or Below Standard (1 point) to Excellent or Well Above Standard (5 points).
Results: Table 3.22 presents the significant correlations between scale scores and these seven evaluation measures.
Table 3.22 Judgment, Accommodating, and Attitude Raw Scores and Performance Evaluation Scales Correlations
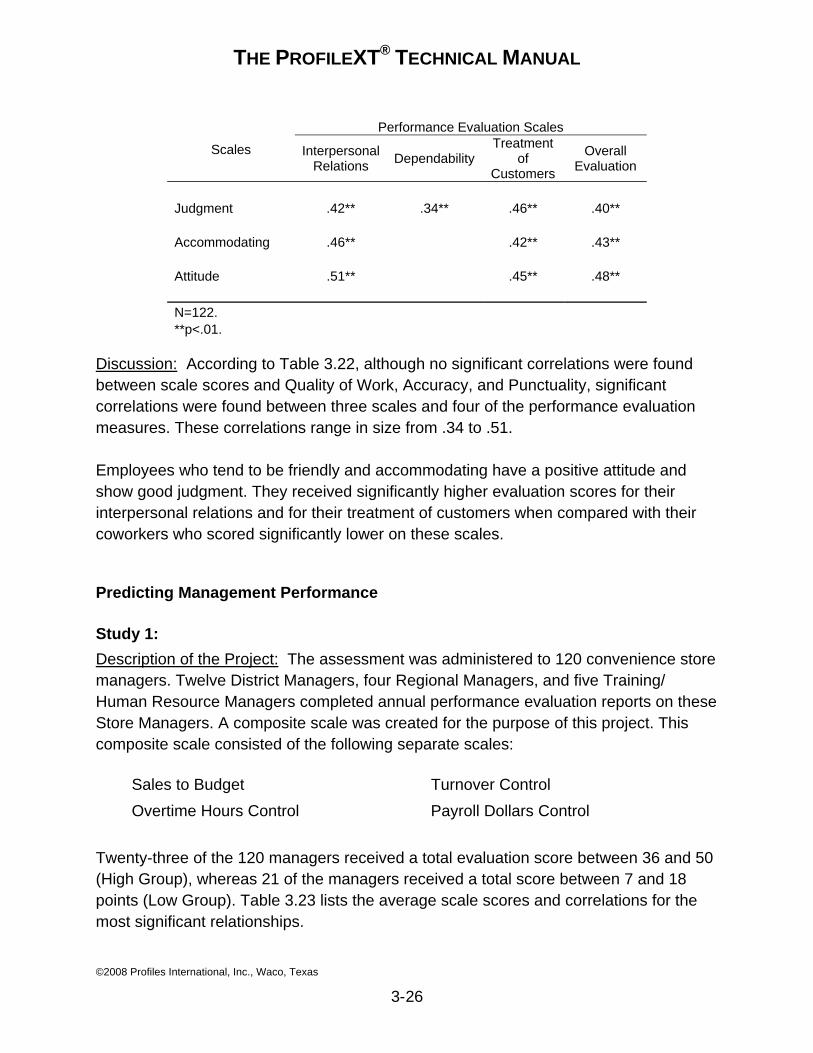
THE PROFILEXT® TECHNICAL MANUAL
©2008 Profiles International, Inc., Waco, Texas
3-26
Scales
Performance Evaluation Scales
Interpersonal Relations Dependability
Treatment of
Customers
Overall Evaluation
Judgment .42** .34** .46** .40** Accommodating .46** .42** .43** Attitude .51** .45** .48** N=122. **p<.01.
Discussion: According to Table 3.22, although no significant correlations were found between scale scores and Quality of Work, Accuracy, and Punctuality, significant correlations were found between three scales and four of the performance evaluation measures. These correlations range in size from .34 to .51.
Employees who tend to be friendly and accommodating have a positive attitude and show good judgment. They received significantly higher evaluation scores for their interpersonal relations and for their treatment of customers when compared with their coworkers who scored significantly lower on these scales.
Predicting Management Performance
Study 1: Description of the Project: The assessment was administered to 120 convenience store managers. Twelve District Managers, four Regional Managers, and five Training/ Human Resource Managers completed annual performance evaluation reports on these Store Managers. A composite scale was created for the purpose of this project. This composite scale consisted of the following separate scales:
Sales to Budget Turnover Control Overtime Hours Control Payroll Dollars Control
Twenty-three of the 120 managers received a total evaluation score between 36 and 50 (High Group), whereas 21 of the managers received a total score between 7 and 18 points (Low Group). Table 3.23 lists the average scale scores and correlations for the most significant relationships.
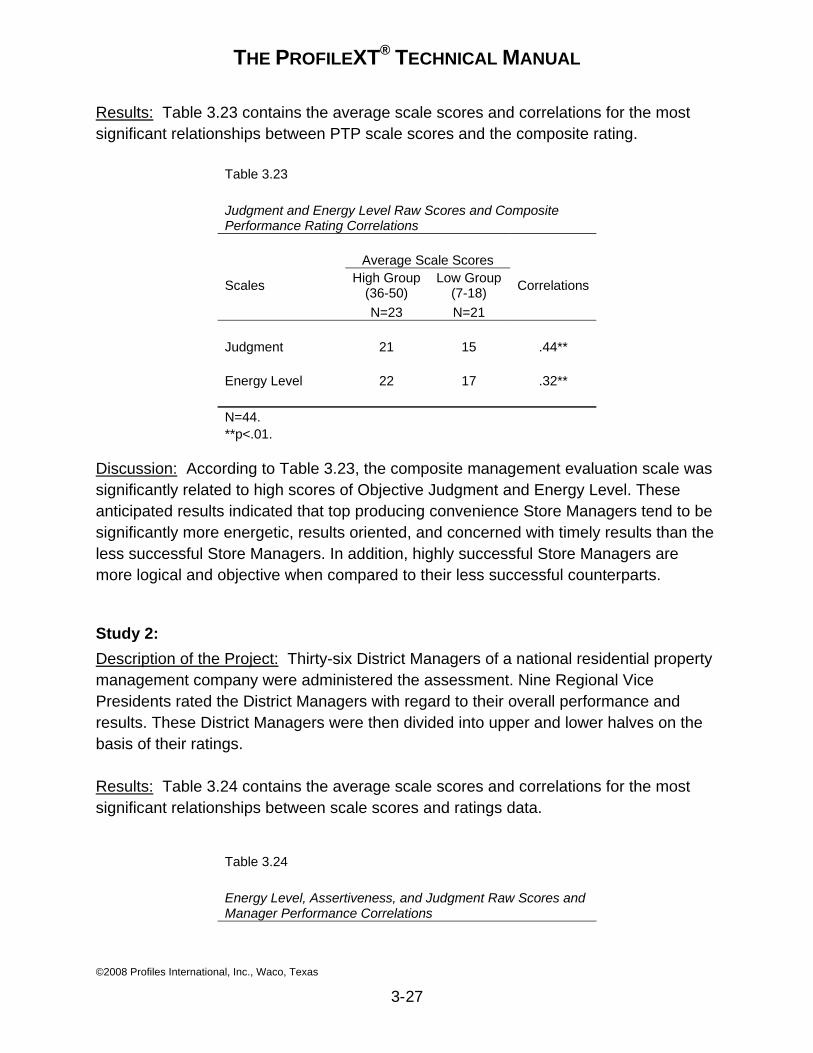
THE PROFILEXT® TECHNICAL MANUAL
©2008 Profiles International, Inc., Waco, Texas
3-27
Results: Table 3.23 contains the average scale scores and correlations for the most significant relationships between PTP scale scores and the composite rating.
Table 3.23 Judgment and Energy Level Raw Scores and Composite Performance Rating Correlations
Scales
Average Scale Scores
Correlations High Group (36-50)
Low Group (7-18)
N=23 N=21 Judgment 21 15 .44** Energy Level 22 17 .32** N=44. **p<.01.
Discussion: According to Table 3.23, the composite management evaluation scale was significantly related to high scores of Objective Judgment and Energy Level. These anticipated results indicated that top producing convenience Store Managers tend to be significantly more energetic, results oriented, and concerned with timely results than the less successful Store Managers. In addition, highly successful Store Managers are more logical and objective when compared to their less successful counterparts.
Study 2: Description of the Project: Thirty-six District Managers of a national residential property management company were administered the assessment. Nine Regional Vice Presidents rated the District Managers with regard to their overall performance and results. These District Managers were then divided into upper and lower halves on the basis of their ratings.
Results: Table 3.24 contains the average scale scores and correlations for the most significant relationships between scale scores and ratings data.
Table 3.24 Energy Level, Assertiveness, and Judgment Raw Scores and Manager Performance Correlations
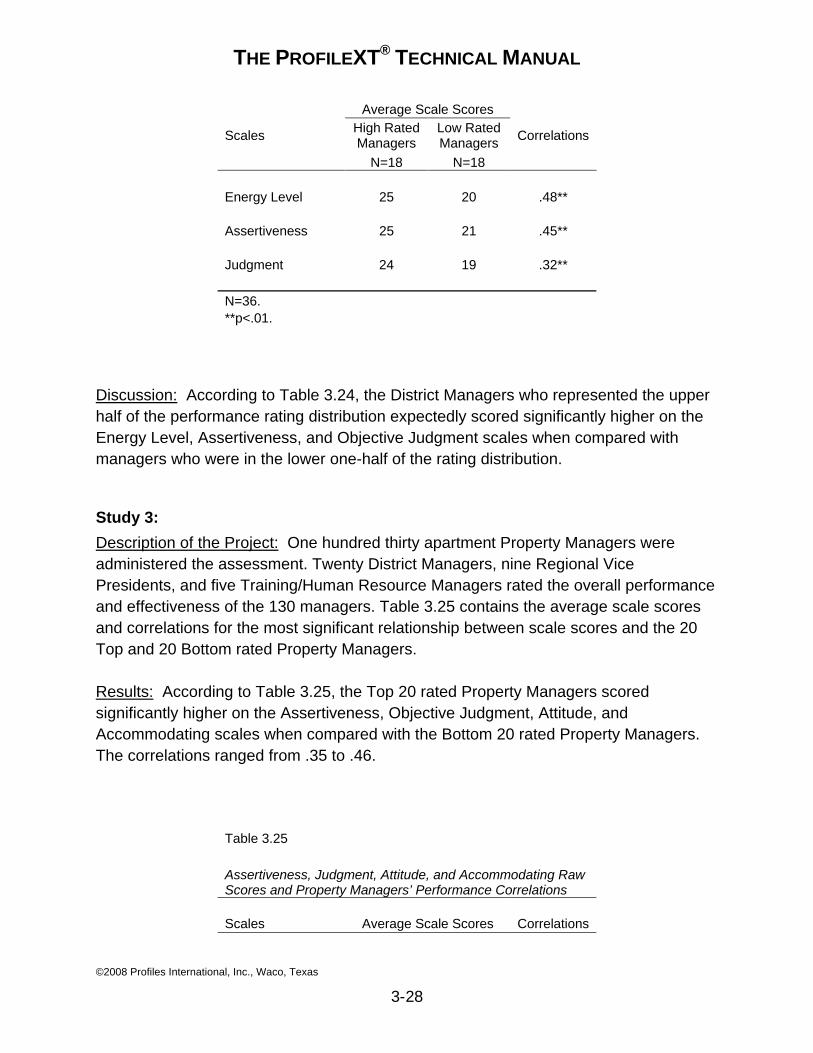
THE PROFILEXT® TECHNICAL MANUAL
©2008 Profiles International, Inc., Waco, Texas
3-28
Scales
Average Scale Scores
Correlations High Rated Managers
Low Rated Managers
N=18 N=18 Energy Level 25 20 .48** Assertiveness 25 21 .45** Judgment 24 19 .32** N=36. **p<.01.
Discussion: According to Table 3.24, the District Managers who represented the upper half of the performance rating distribution expectedly scored significantly higher on the Energy Level, Assertiveness, and Objective Judgment scales when compared with managers who were in the lower one-half of the rating distribution.
Study 3: Description of the Project: One hundred thirty apartment Property Managers were administered the assessment. Twenty District Managers, nine Regional Vice Presidents, and five Training/Human Resource Managers rated the overall performance and effectiveness of the 130 managers. Table 3.25 contains the average scale scores and correlations for the most significant relationship between scale scores and the 20 Top and 20 Bottom rated Property Managers.
Results: According to Table 3.25, the Top 20 rated Property Managers scored significantly higher on the Assertiveness, Objective Judgment, Attitude, and Accommodating scales when compared with the Bottom 20 rated Property Managers. The correlations ranged from .35 to .46.
Table 3.25 Assertiveness, Judgment, Attitude, and Accommodating Raw Scores and Property Managers’ Performance Correlations Scales Average Scale Scores Correlations
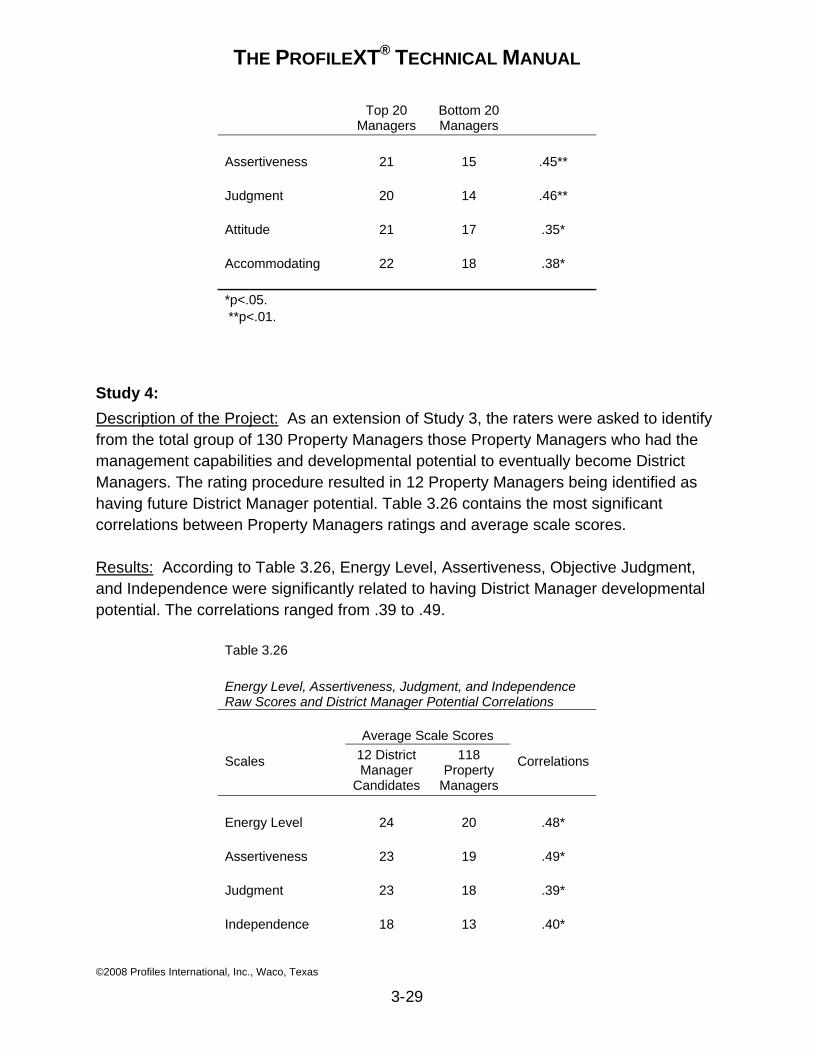
THE PROFILEXT® TECHNICAL MANUAL
©2008 Profiles International, Inc., Waco, Texas
3-29
Top 20 Managers
Bottom 20 Managers
Assertiveness 21 15 .45** Judgment 20 14 .46** Attitude 21 17 .35* Accommodating 22 18 .38* *p<.05. **p<.01.
Study 4: Description of the Project: As an extension of Study 3, the raters were asked to identify from the total group of 130 Property Managers those Property Managers who had the management capabilities and developmental potential to eventually become District Managers. The rating procedure resulted in 12 Property Managers being identified as having future District Manager potential. Table 3.26 contains the most significant correlations between Property Managers ratings and average scale scores.
Results: According to Table 3.26, Energy Level, Assertiveness, Objective Judgment, and Independence were significantly related to having District Manager developmental potential. The correlations ranged from .39 to .49.
Table 3.26 Energy Level, Assertiveness, Judgment, and Independence Raw Scores and District Manager Potential Correlations
Scales
Average Scale Scores
Correlations 12 District Manager
Candidates
118 Property
Managers Energy Level 24 20 .48* Assertiveness 23 19 .49* Judgment 23 18 .39* Independence 18 13 .40*
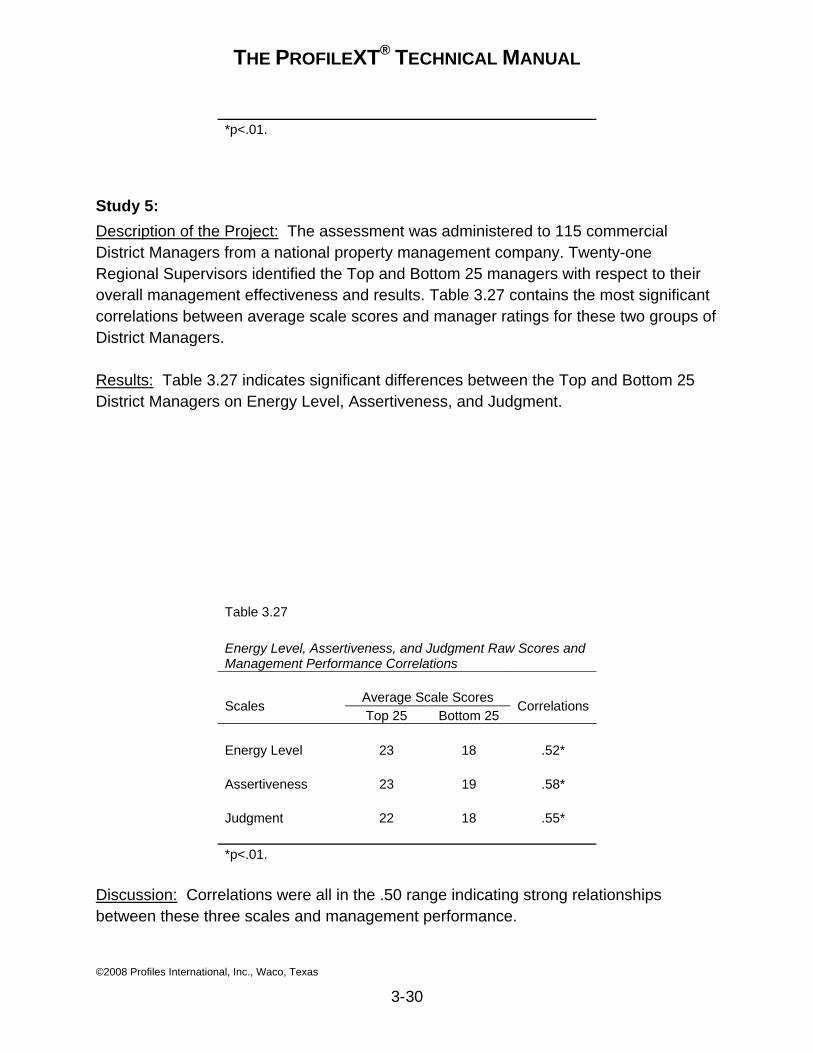
THE PROFILEXT® TECHNICAL MANUAL
©2008 Profiles International, Inc., Waco, Texas
3-30
*p<.01.
Study 5: Description of the Project: The assessment was administered to 115 commercial District Managers from a national property management company. Twenty-one Regional Supervisors identified the Top and Bottom 25 managers with respect to their overall management effectiveness and results. Table 3.27 contains the most significant correlations between average scale scores and manager ratings for these two groups of District Managers.
Results: Table 3.27 indicates significant differences between the Top and Bottom 25 District Managers on Energy Level, Assertiveness, and Judgment.
Table 3.27 Energy Level, Assertiveness, and Judgment Raw Scores and Management Performance Correlations
Scales Average Scale Scores Correlations Top 25 Bottom 25
Energy Level 23 18 .52* Assertiveness 23 19 .58* Judgment 22 18 .55* *p<.01.
Discussion: Correlations were all in the .50 range indicating strong relationships between these three scales and management performance.
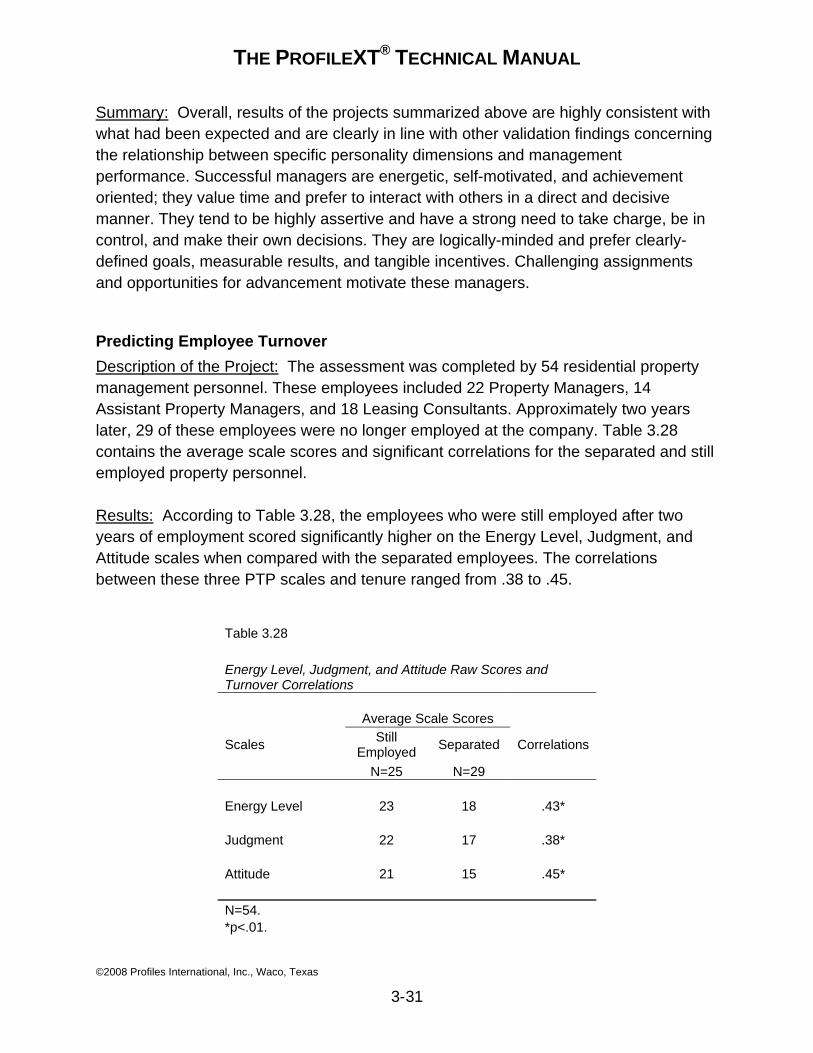
THE PROFILEXT® TECHNICAL MANUAL
©2008 Profiles International, Inc., Waco, Texas
3-31
Summary: Overall, results of the projects summarized above are highly consistent with what had been expected and are clearly in line with other validation findings concerning the relationship between specific personality dimensions and management performance. Successful managers are energetic, self-motivated, and achievement oriented; they value time and prefer to interact with others in a direct and decisive manner. They tend to be highly assertive and have a strong need to take charge, be in control, and make their own decisions. They are logically-minded and prefer clearly-defined goals, measurable results, and tangible incentives. Challenging assignments and opportunities for advancement motivate these managers.
Predicting Employee Turnover Description of the Project: The assessment was completed by 54 residential property management personnel. These employees included 22 Property Managers, 14 Assistant Property Managers, and 18 Leasing Consultants. Approximately two years later, 29 of these employees were no longer employed at the company. Table 3.28 contains the average scale scores and significant correlations for the separated and still employed property personnel.
Results: According to Table 3.28, the employees who were still employed after two years of employment scored significantly higher on the Energy Level, Judgment, and Attitude scales when compared with the separated employees. The correlations between these three PTP scales and tenure ranged from .38 to .45.
Table 3.28 Energy Level, Judgment, and Attitude Raw Scores and Turnover Correlations
Scales
Average Scale Scores
Correlations Still Employed Separated
N=25 N=29 Energy Level 23 18 .43* Judgment 22 17 .38* Attitude 21 15 .45* N=54. *p<.01.
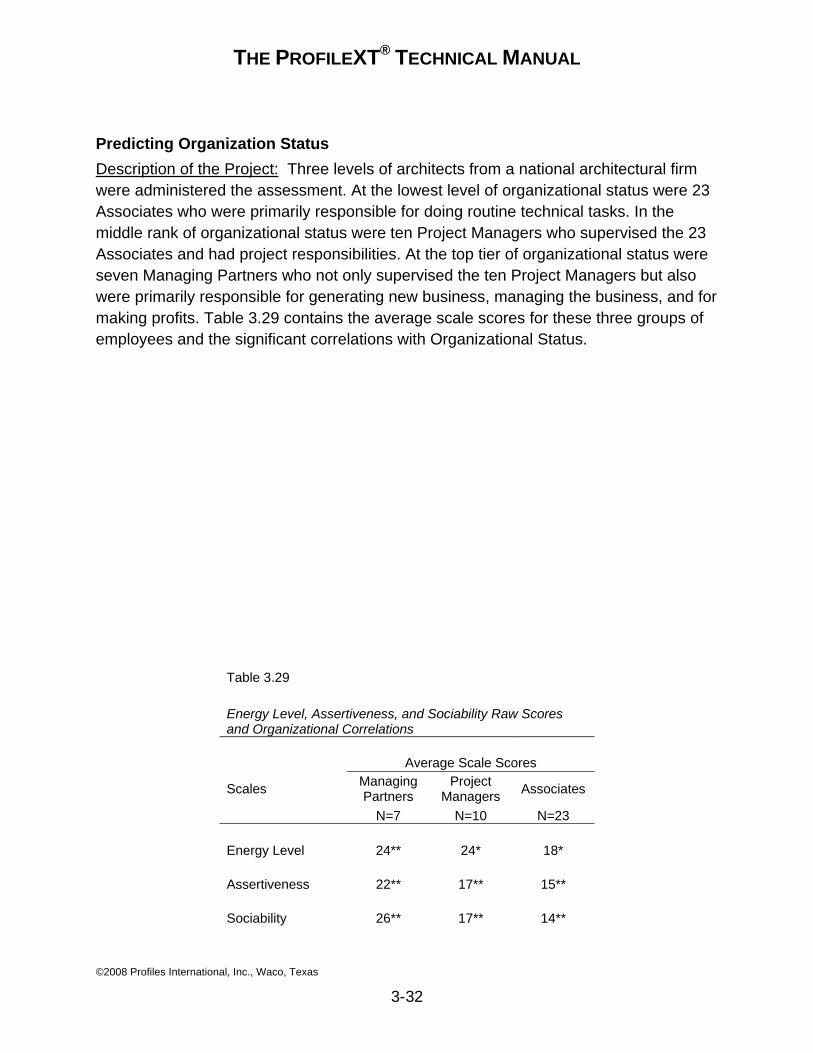
THE PROFILEXT® TECHNICAL MANUAL
©2008 Profiles International, Inc., Waco, Texas
3-32
Predicting Organization Status Description of the Project: Three levels of architects from a national architectural firm were administered the assessment. At the lowest level of organizational status were 23 Associates who were primarily responsible for doing routine technical tasks. In the middle rank of organizational status were ten Project Managers who supervised the 23 Associates and had project responsibilities. At the top tier of organizational status were seven Managing Partners who not only supervised the ten Project Managers but also were primarily responsible for generating new business, managing the business, and for making profits. Table 3.29 contains the average scale scores for these three groups of employees and the significant correlations with Organizational Status.
Table 3.29 Energy Level, Assertiveness, and Sociability Raw Scores and Organizational Correlations
Scales
Average Scale Scores Managing Partners
Project Managers Associates
N=7 N=10 N=23 Energy Level 24** 24* 18* Assertiveness 22** 17** 15** Sociability 26** 17** 14**
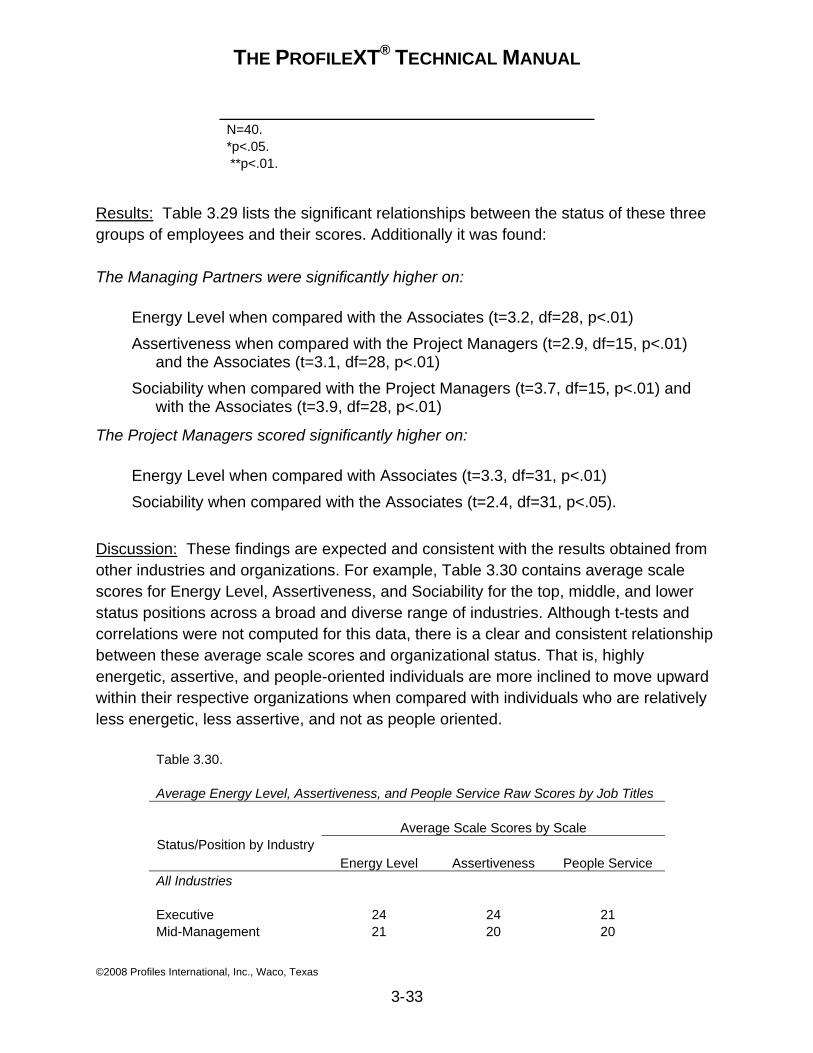
THE PROFILEXT® TECHNICAL MANUAL
©2008 Profiles International, Inc., Waco, Texas
3-33
N=40. *p<.05. **p<.01.
Results: Table 3.29 lists the significant relationships between the status of these three groups of employees and their scores. Additionally it was found:
The Managing Partners were significantly higher on:
Energy Level when compared with the Associates (t=3.2, df=28, p<.01) Assertiveness when compared with the Project Managers (t=2.9, df=15, p<.01)
and the Associates (t=3.1, df=28, p<.01) Sociability when compared with the Project Managers (t=3.7, df=15, p<.01) and
with the Associates (t=3.9, df=28, p<.01)
The Project Managers scored significantly higher on:
Energy Level when compared with Associates (t=3.3, df=31, p<.01) Sociability when compared with the Associates (t=2.4, df=31, p<.05).
Discussion: These findings are expected and consistent with the results obtained from other industries and organizations. For example, Table 3.30 contains average scale scores for Energy Level, Assertiveness, and Sociability for the top, middle, and lower status positions across a broad and diverse range of industries. Although t-tests and correlations were not computed for this data, there is a clear and consistent relationship between these average scale scores and organizational status. That is, highly energetic, assertive, and people-oriented individuals are more inclined to move upward within their respective organizations when compared with individuals who are relatively less energetic, less assertive, and not as people oriented.
Table 3.30. Average Energy Level, Assertiveness, and People Service Raw Scores by Job Titles
Status/Position by Industry Average Scale Scores by Scale
Energy Level Assertiveness People Service
All Industries Executive 24 24 21 Mid-Management 21 20 20
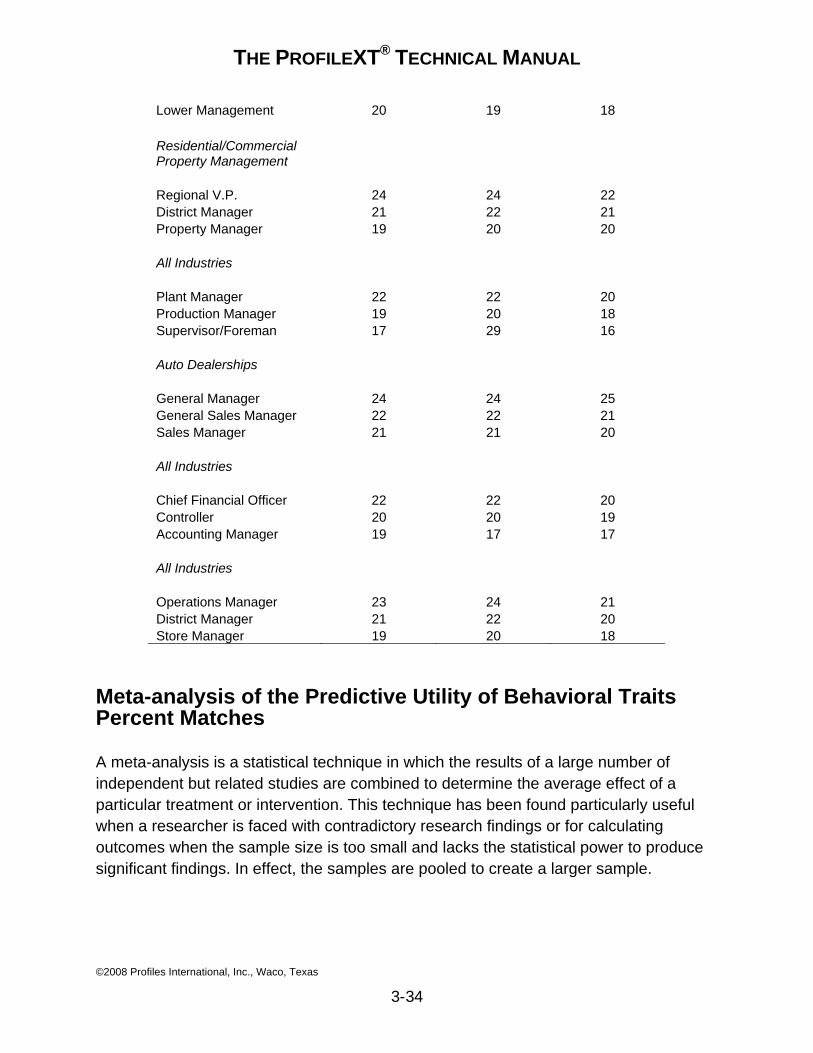
THE PROFILEXT® TECHNICAL MANUAL
©2008 Profiles International, Inc., Waco, Texas
3-34
Lower Management 20 19 18 Residential/Commercial Property Management Regional V.P. 24 24 22 District Manager 21 22 21 Property Manager 19 20 20 All Industries Plant Manager 22 22 20 Production Manager 19 20 18 Supervisor/Foreman 17 29 16 Auto Dealerships General Manager 24 24 25 General Sales Manager 22 22 21 Sales Manager 21 21 20 All Industries Chief Financial Officer 22 22 20 Controller 20 20 19 Accounting Manager 19 17 17 All Industries Operations Manager 23 24 21 District Manager 21 22 20 Store Manager 19 20 18
Meta-analysis of the Predictive Utility of Behavioral Traits Percent Matches
A meta-analysis is a statistical technique in which the results of a large number of independent but related studies are combined to determine the average effect of a particular treatment or intervention. This technique has been found particularly useful when a researcher is faced with contradictory research findings or for calculating outcomes when the sample size is too small and lacks the statistical power to produce significant findings. In effect, the samples are pooled to create a larger sample.
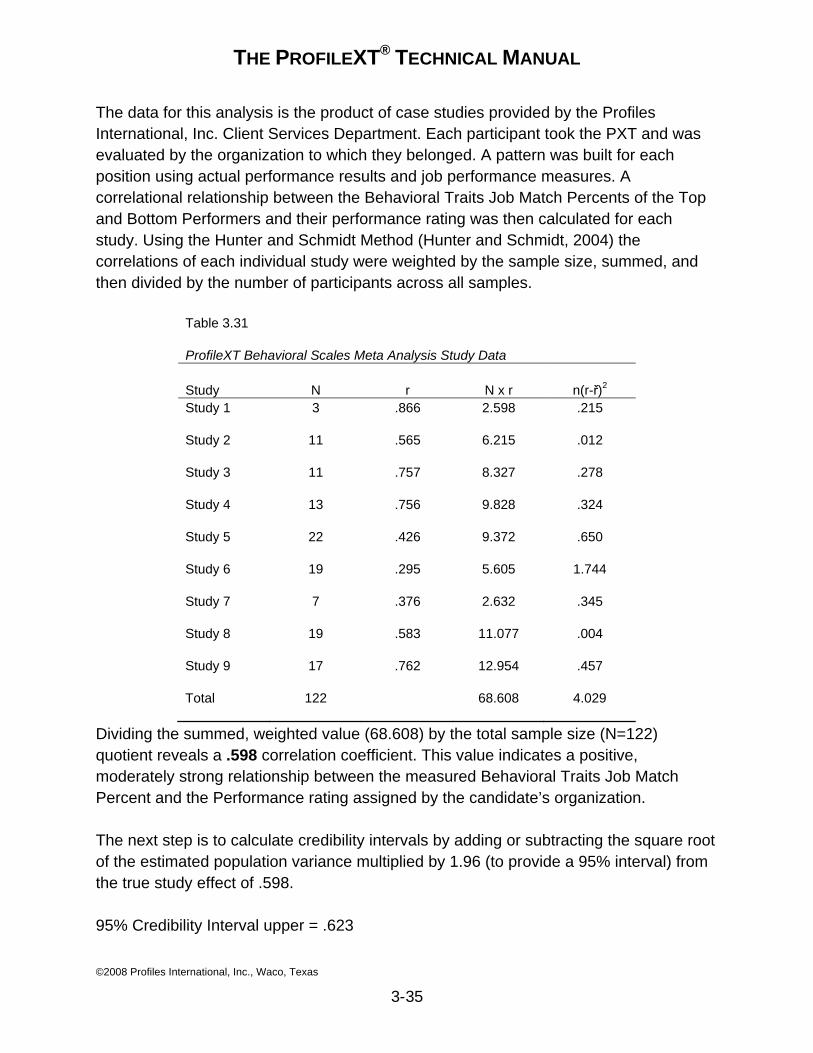
THE PROFILEXT® TECHNICAL MANUAL
©2008 Profiles International, Inc., Waco, Texas
3-35
The data for this analysis is the product of case studies provided by the Profiles International, Inc. Client Services Department. Each participant took the PXT and was evaluated by the organization to which they belonged. A pattern was built for each position using actual performance results and job performance measures. A correlational relationship between the Behavioral Traits Job Match Percents of the Top and Bottom Performers and their performance rating was then calculated for each study. Using the Hunter and Schmidt Method (Hunter and Schmidt, 2004) the correlations of each individual study were weighted by the sample size, summed, and then divided by the number of participants across all samples.
Table 3.31 ProfileXT Behavioral Scales Meta Analysis Study Data Study N r N x r n(r-ř)2 Study 1 3 .866 2.598 .215 Study 2 11 .565 6.215 .012 Study 3 11 .757 8.327 .278 Study 4 13 .756 9.828 .324 Study 5 22 .426 9.372 .650 Study 6 19 .295 5.605 1.744 Study 7 7 .376 2.632 .345 Study 8 19 .583 11.077 .004 Study 9 17 .762 12.954 .457 Total 122 68.608 4.029
Dividing the summed, weighted value (68.608) by the total sample size (N=122) quotient reveals a .598 correlation coefficient. This value indicates a positive, moderately strong relationship between the measured Behavioral Traits Job Match Percent and the Performance rating assigned by the candidate’s organization.
The next step is to calculate credibility intervals by adding or subtracting the square root of the estimated population variance multiplied by 1.96 (to provide a 95% interval) from the true study effect of .598.
95% Credibility Interval upper = .623
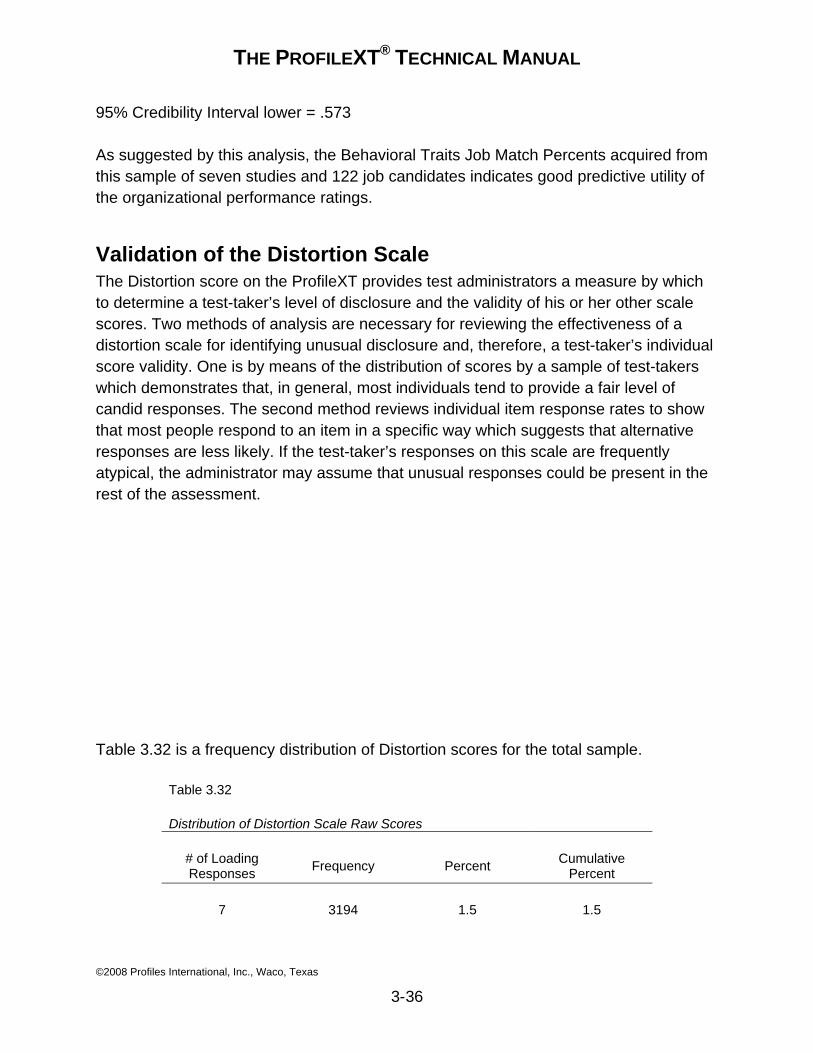
THE PROFILEXT® TECHNICAL MANUAL
©2008 Profiles International, Inc., Waco, Texas
3-36
95% Credibility Interval lower = .573
As suggested by this analysis, the Behavioral Traits Job Match Percents acquired from this sample of seven studies and 122 job candidates indicates good predictive utility of the organizational performance ratings.
Validation of the Distortion Scale The Distortion score on the ProfileXT provides test administrators a measure by which to determine a test-taker’s level of disclosure and the validity of his or her other scale scores. Two methods of analysis are necessary for reviewing the effectiveness of a distortion scale for identifying unusual disclosure and, therefore, a test-taker’s individual score validity. One is by means of the distribution of scores by a sample of test-takers which demonstrates that, in general, most individuals tend to provide a fair level of candid responses. The second method reviews individual item response rates to show that most people respond to an item in a specific way which suggests that alternative responses are less likely. If the test-taker’s responses on this scale are frequently atypical, the administrator may assume that unusual responses could be present in the rest of the assessment.
Table 3.32 is a frequency distribution of Distortion scores for the total sample.
Table 3.32 Distribution of Distortion Scale Raw Scores
# of Loading Responses Frequency Percent Cumulative
Percent
7 3194 1.5 1.5
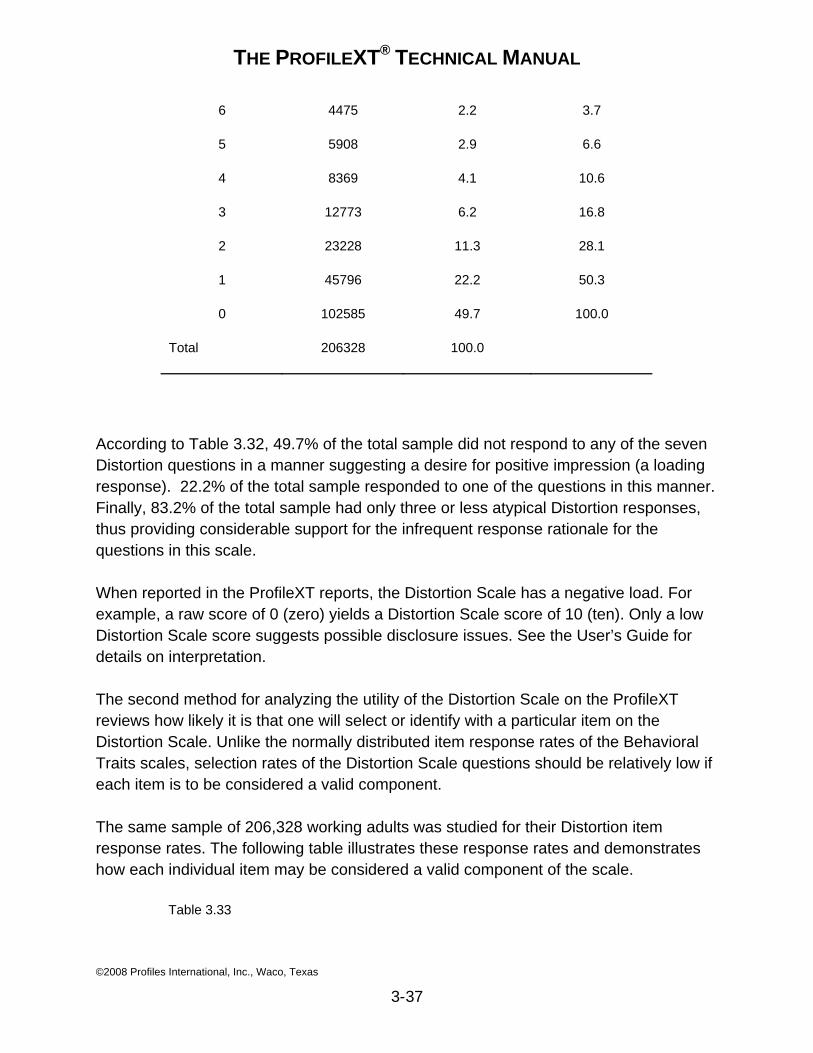
THE PROFILEXT® TECHNICAL MANUAL
©2008 Profiles International, Inc., Waco, Texas
3-37
6 4475 2.2 3.7 5 5908 2.9 6.6 4 8369 4.1 10.6 3 12773 6.2 16.8 2 23228 11.3 28.1 1 45796 22.2 50.3 0 102585 49.7 100.0
Total 206328 100.0
According to Table 3.32, 49.7% of the total sample did not respond to any of the seven Distortion questions in a manner suggesting a desire for positive impression (a loading response). 22.2% of the total sample responded to one of the questions in this manner. Finally, 83.2% of the total sample had only three or less atypical Distortion responses, thus providing considerable support for the infrequent response rationale for the questions in this scale.
When reported in the ProfileXT reports, the Distortion Scale has a negative load. For example, a raw score of 0 (zero) yields a Distortion Scale score of 10 (ten). Only a low Distortion Scale score suggests possible disclosure issues. See the User’s Guide for details on interpretation.
The second method for analyzing the utility of the Distortion Scale on the ProfileXT reviews how likely it is that one will select or identify with a particular item on the Distortion Scale. Unlike the normally distributed item response rates of the Behavioral Traits scales, selection rates of the Distortion Scale questions should be relatively low if each item is to be considered a valid component.
The same sample of 206,328 working adults was studied for their Distortion item response rates. The following table illustrates these response rates and demonstrates how each individual item may be considered a valid component of the scale.
Table 3.33
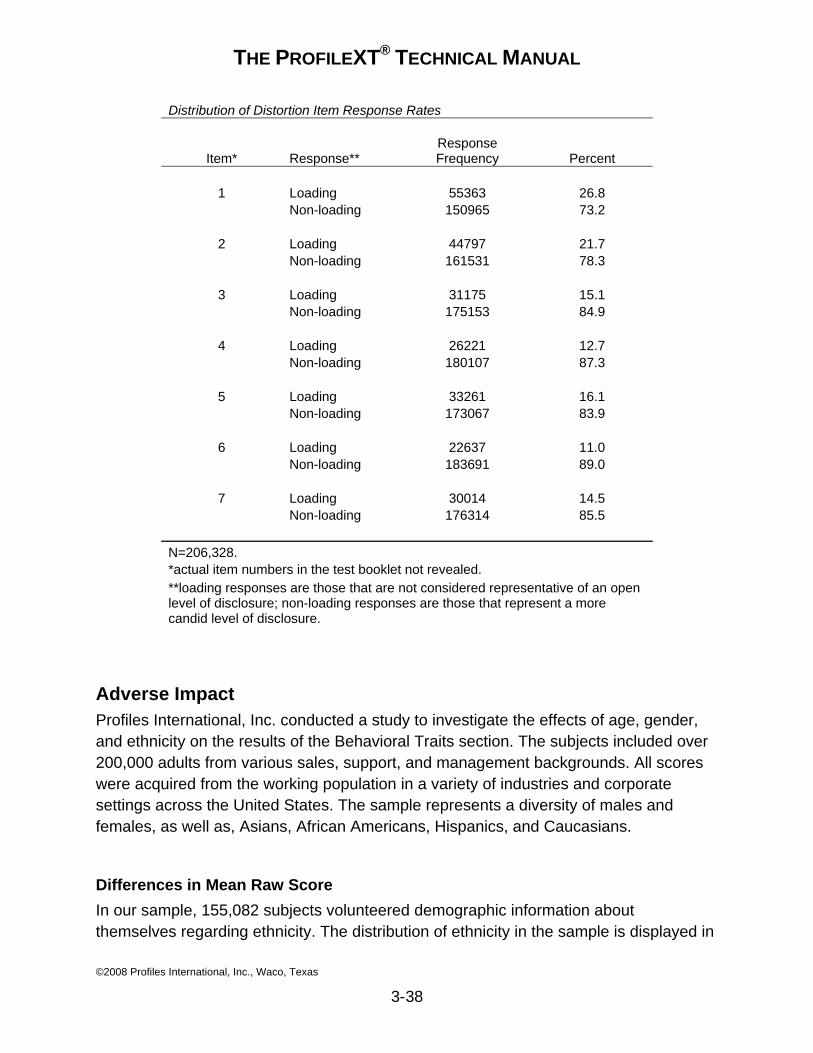
THE PROFILEXT® TECHNICAL MANUAL
©2008 Profiles International, Inc., Waco, Texas
3-38
Distribution of Distortion Item Response Rates
Item* Response** Response Frequency Percent
1 Loading 55363 26.8 Non-loading 150965 73.2 2 Loading 44797 21.7 Non-loading 161531 78.3 3 Loading 31175 15.1 Non-loading 175153 84.9 4 Loading 26221 12.7 Non-loading 180107 87.3 5 Loading 33261 16.1 Non-loading 173067 83.9 6 Loading 22637 11.0 Non-loading 183691 89.0 7 Loading 30014 14.5 Non-loading 176314 85.5
N=206,328. *actual item numbers in the test booklet not revealed. **loading responses are those that are not considered representative of an open level of disclosure; non-loading responses are those that represent a more candid level of disclosure.
Adverse Impact Profiles International, Inc. conducted a study to investigate the effects of age, gender, and ethnicity on the results of the Behavioral Traits section. The subjects included over 200,000 adults from various sales, support, and management backgrounds. All scores were acquired from the working population in a variety of industries and corporate settings across the United States. The sample represents a diversity of males and females, as well as, Asians, African Americans, Hispanics, and Caucasians.
Differences in Mean Raw Score In our sample, 155,082 subjects volunteered demographic information about themselves regarding ethnicity. The distribution of ethnicity in the sample is displayed in
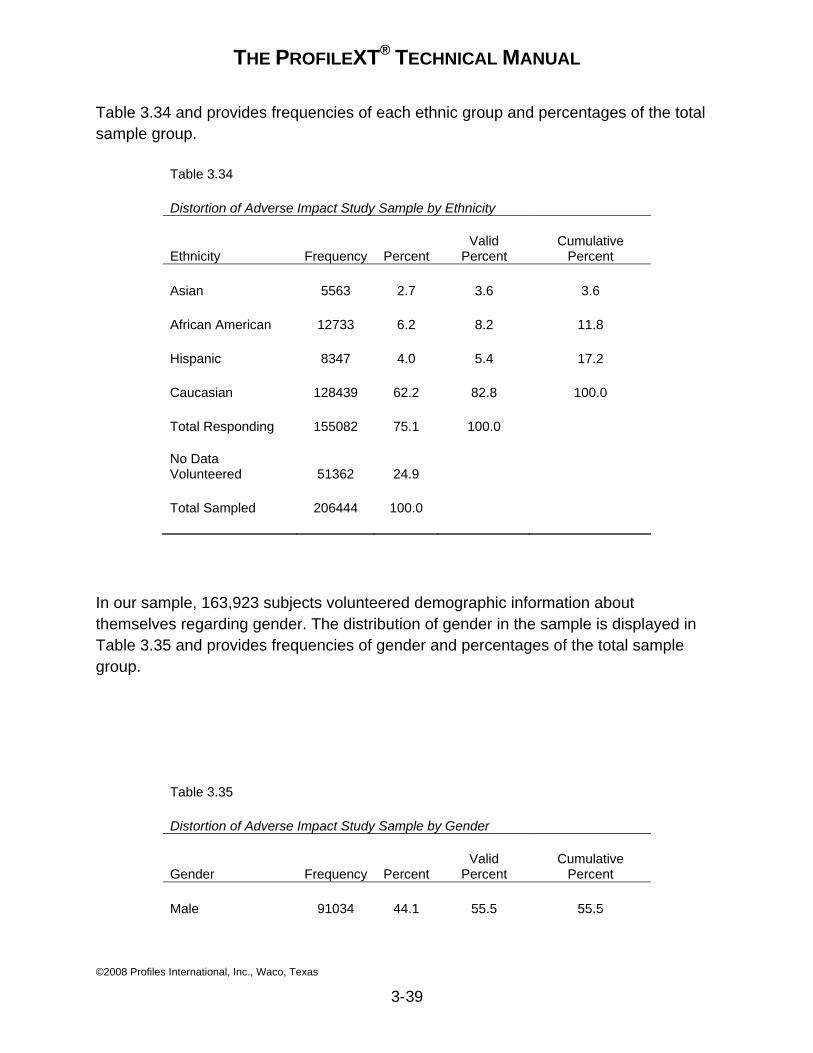
THE PROFILEXT® TECHNICAL MANUAL
©2008 Profiles International, Inc., Waco, Texas
3-39
Table 3.34 and provides frequencies of each ethnic group and percentages of the total sample group.
Table 3.34 Distortion of Adverse Impact Study Sample by Ethnicity
Ethnicity Frequency Percent Valid
Percent Cumulative
Percent Asian 5563 2.7 3.6 3.6 African American 12733 6.2 8.2 11.8 Hispanic 8347 4.0 5.4 17.2 Caucasian 128439 62.2 82.8 100.0 Total Responding 155082 75.1 100.0 No Data Volunteered 51362 24.9 Total Sampled 206444 100.0
In our sample, 163,923 subjects volunteered demographic information about themselves regarding gender. The distribution of gender in the sample is displayed in Table 3.35 and provides frequencies of gender and percentages of the total sample group.
Table 3.35 Distortion of Adverse Impact Study Sample by Gender
Gender Frequency Percent Valid
Percent Cumulative
Percent Male 91034 44.1 55.5 55.5
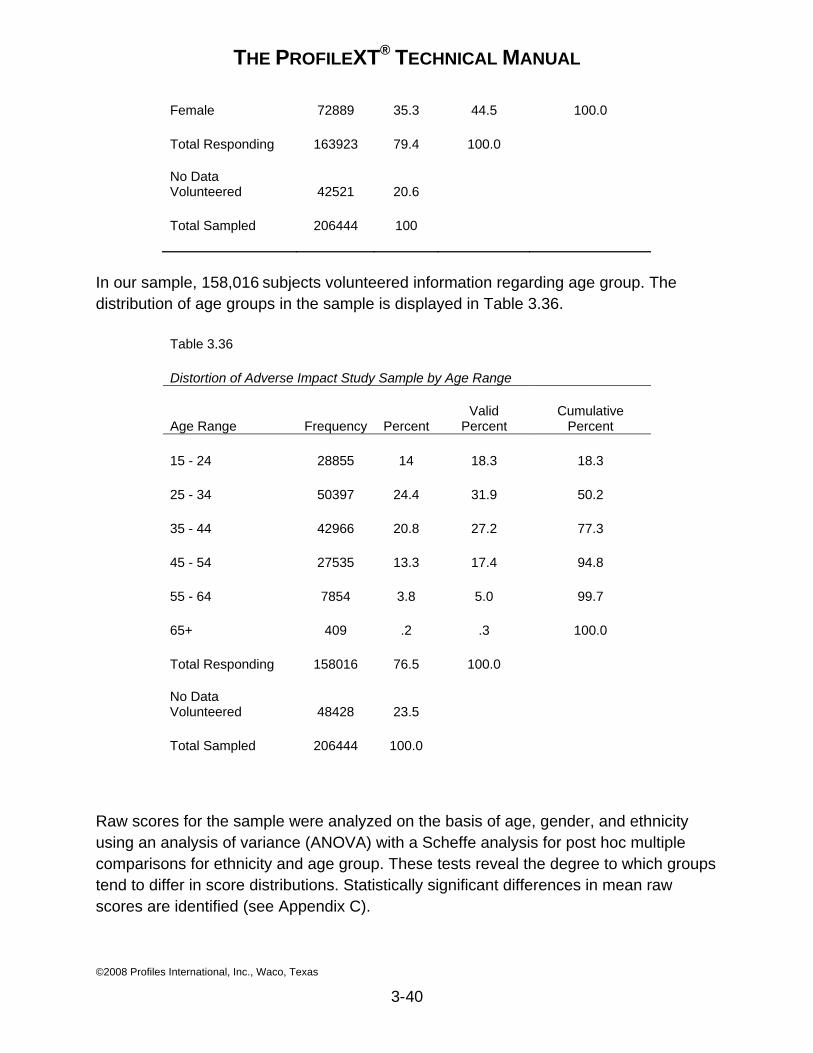
THE PROFILEXT® TECHNICAL MANUAL
©2008 Profiles International, Inc., Waco, Texas
3-40
Female 72889 35.3 44.5 100.0 Total Responding 163923 79.4 100.0 No Data Volunteered 42521 20.6 Total Sampled 206444 100
In our sample, 158,016 subjects volunteered information regarding age group. The distribution of age groups in the sample is displayed in Table 3.36.
Table 3.36 Distortion of Adverse Impact Study Sample by Age Range
Age Range Frequency Percent Valid
Percent Cumulative
Percent 15 - 24 28855 14 18.3 18.3 25 - 34 50397 24.4 31.9 50.2 35 - 44 42966 20.8 27.2 77.3 45 - 54 27535 13.3 17.4 94.8 55 - 64 7854 3.8 5.0 99.7 65+ 409 .2 .3 100.0 Total Responding 158016 76.5 100.0 No Data Volunteered 48428 23.5 Total Sampled 206444 100.0
Raw scores for the sample were analyzed on the basis of age, gender, and ethnicity using an analysis of variance (ANOVA) with a Scheffe analysis for post hoc multiple comparisons for ethnicity and age group. These tests reveal the degree to which groups tend to differ in score distributions. Statistically significant differences in mean raw scores are identified (see Appendix C).
THE PROFILEXT® TECHNICAL MANUAL
©2008 Profiles International, Inc., Waco, Texas
3-41
We noted how the mean raw score differences between groups on each scale are quite small; only one or two raw score points difference on average. This has no practical effect on an individual’s Overall Pattern Match. Although these differences may be designated as significantly different from a statistical perspective due to the large sample sizes, the small variances are slight and have no practical effect on an individual’s selection potential.
Differences in Job Match Percent What must be determined at this point is whether the final appraisal of a candidate’s scores adversely impacts individuals based on their ethnicity, age, or gender. This is the bottom line, so to speak, by which a candidate is assessed.
That appraisal, in the ProfileXT, is referred to as the Job Match Percent. There are four appraisal scores used in the ProfileXT: Behavioral, Interests, Thinking Style, and Overall Job Match Percents. Decision makers may reference these percentages as a summary estimation of the candidate’s potential in the job. If these percentages adversely impact individuals, then the assessment is doing both the decision maker and the candidate a disservice.
A study was conducted which demonstrates the effectiveness of the Job Match Percents and their associated Job Match Patterns to remove adverse impact despite the slight variances noted among individual raw scores in the sample. The sample included over 900,000 administrations of ProfileXT scores matched to Job Match Patterns. This sample of administrations included a variety of ethnicities, age groups, and both genders selected from job matching cases across the United States in a variety of industrial and corporate settings.
In each case, a candidate was matched to a Job Match Pattern. Self-selection for each job is inherent for each case. In other words, members of the sample chose what pattern to which they were to be matched by becoming candidates for those jobs. Approximately 200,000 Job Match Patterns were included in the study representing a wide range of job types. In every case, each candidate was assumed to be qualified for candidacy for the job and it’s Job Match Pattern.
Table 3.37 displays the ethnic distribution of the sample.
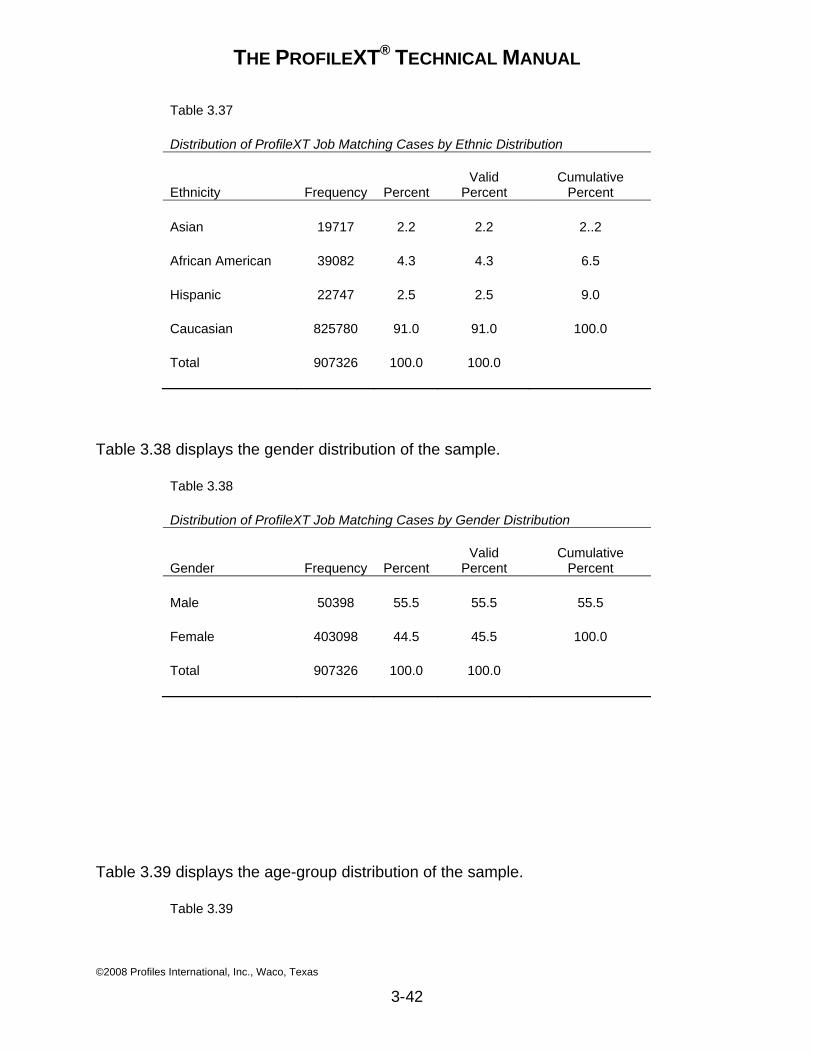
THE PROFILEXT® TECHNICAL MANUAL
©2008 Profiles International, Inc., Waco, Texas
3-42
Table 3.37 Distribution of ProfileXT Job Matching Cases by Ethnic Distribution
Ethnicity Frequency Percent Valid
Percent Cumulative
Percent Asian 19717 2.2 2.2 2..2 African American 39082 4.3 4.3 6.5 Hispanic 22747 2.5 2.5 9.0 Caucasian 825780 91.0 91.0 100.0 Total 907326 100.0 100.0
Table 3.38 displays the gender distribution of the sample.
Table 3.38 Distribution of ProfileXT Job Matching Cases by Gender Distribution
Gender Frequency Percent Valid
Percent Cumulative
Percent Male 50398 55.5 55.5 55.5 Female 403098 44.5 45.5 100.0 Total 907326 100.0 100.0
Table 3.39 displays the age-group distribution of the sample.
Table 3.39
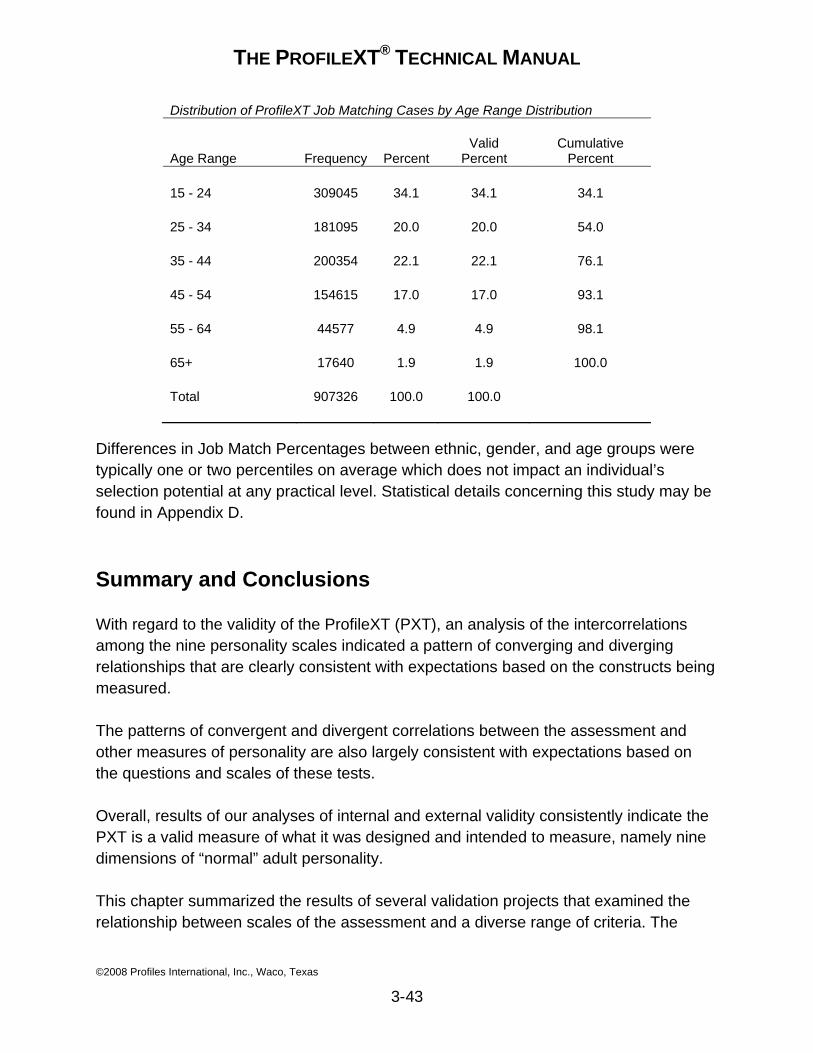
THE PROFILEXT® TECHNICAL MANUAL
©2008 Profiles International, Inc., Waco, Texas
3-43
Distribution of ProfileXT Job Matching Cases by Age Range Distribution
Age Range Frequency Percent Valid
Percent Cumulative
Percent 15 - 24 309045 34.1 34.1 34.1 25 - 34 181095 20.0 20.0 54.0 35 - 44 200354 22.1 22.1 76.1 45 - 54 154615 17.0 17.0 93.1 55 - 64 44577 4.9 4.9 98.1 65+ 17640 1.9 1.9 100.0 Total 907326 100.0 100.0
Differences in Job Match Percentages between ethnic, gender, and age groups were typically one or two percentiles on average which does not impact an individual’s selection potential at any practical level. Statistical details concerning this study may be found in Appendix D.
Summary and Conclusions
With regard to the validity of the ProfileXT (PXT), an analysis of the intercorrelations among the nine personality scales indicated a pattern of converging and diverging relationships that are clearly consistent with expectations based on the constructs being measured.
The patterns of convergent and divergent correlations between the assessment and other measures of personality are also largely consistent with expectations based on the questions and scales of these tests.
Overall, results of our analyses of internal and external validity consistently indicate the PXT is a valid measure of what it was designed and intended to measure, namely nine dimensions of “normal” adult personality.
This chapter summarized the results of several validation projects that examined the relationship between scales of the assessment and a diverse range of criteria. The
THE PROFILEXT® TECHNICAL MANUAL
©2008 Profiles International, Inc., Waco, Texas
3-44
results of these projects provided consistent and substantial support for the predictive validity of the assessment. Correlations between scale scores and measures of sales success, management performance, customer service, conscientiousness, turnover, and organizational status were consistently significant. These studies support the concurrent validity of the PXT when job performance is the criterion.
We observed that the ProfileXT Energy Level and Assertiveness scales tend to be significantly related to sales success, management performance, and organizational status, whereas the Attitude, Accommodating, and Objective Judgment scales tend to be significantly related to customer service effectiveness, employee conscientiousness, and appropriate turnover/retention.
Statistical analyses of the ProfileXT clearly indicate the PXT job matching process provides an accurate measure of nine dimensions of “normal” adult personality that are useful for predicting a number of important business-related criteria without adversely impacting individuals by virtue of their ethnicity, gender, or age.
Finally, as Profiles International, Inc. introduces the ProfileXT to other nations, we continue to study samples from around the world, in many languages, and for a variety of cultures. Research in this area continues in conjunction with our domestic studies.
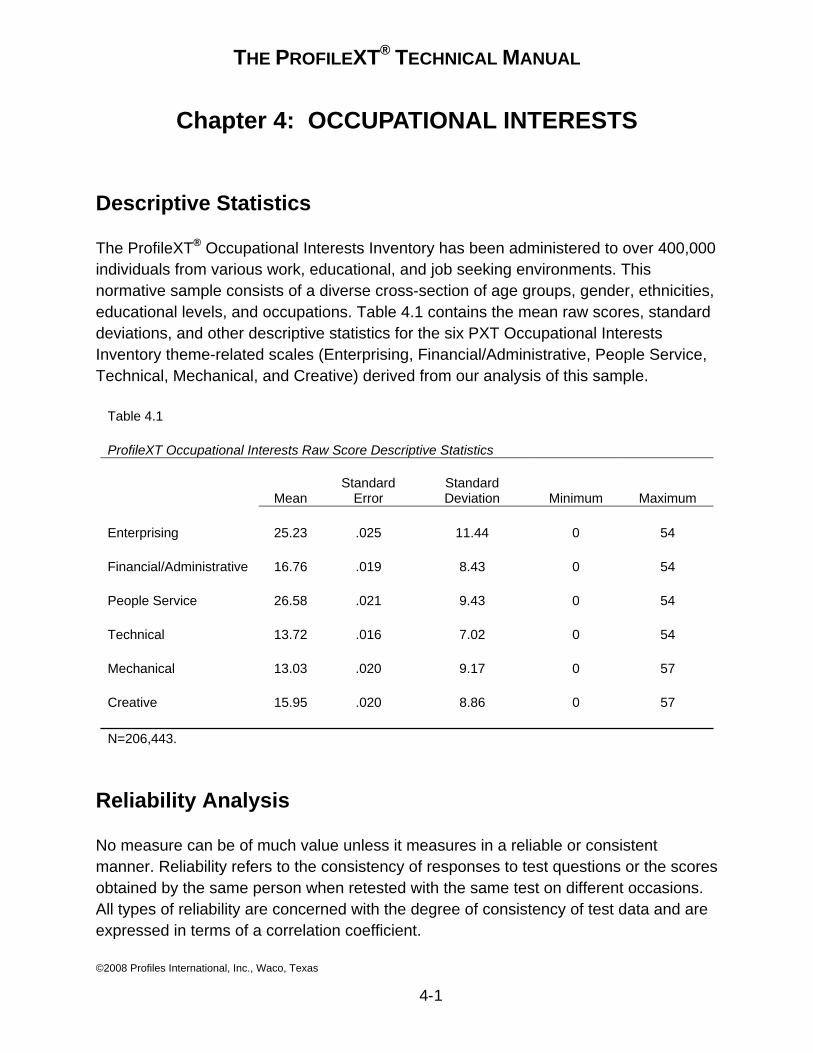
THE PROFILEXT® TECHNICAL MANUAL
©2008 Profiles International, Inc., Waco, Texas
4-1
Chapter 4: OCCUPATIONAL INTERESTS
Descriptive Statistics
The ProfileXT® Occupational Interests Inventory has been administered to over 400,000 individuals from various work, educational, and job seeking environments. This normative sample consists of a diverse cross-section of age groups, gender, ethnicities, educational levels, and occupations. Table 4.1 contains the mean raw scores, standard deviations, and other descriptive statistics for the six PXT Occupational Interests Inventory theme-related scales (Enterprising, Financial/Administrative, People Service, Technical, Mechanical, and Creative) derived from our analysis of this sample.
Table 4.1 ProfileXT Occupational Interests Raw Score Descriptive Statistics
Mean Standard
Error Standard Deviation Minimum Maximum
Enterprising 25.23 .025 11.44 0 54 Financial/Administrative 16.76 .019 8.43 0 54 People Service 26.58 .021 9.43 0 54 Technical 13.72 .016 7.02 0 54 Mechanical 13.03 .020 9.17 0 57 Creative 15.95 .020 8.86 0 57 N=206,443.
Reliability Analysis
No measure can be of much value unless it measures in a reliable or consistent manner. Reliability refers to the consistency of responses to test questions or the scores obtained by the same person when retested with the same test on different occasions. All types of reliability are concerned with the degree of consistency of test data and are expressed in terms of a correlation coefficient.
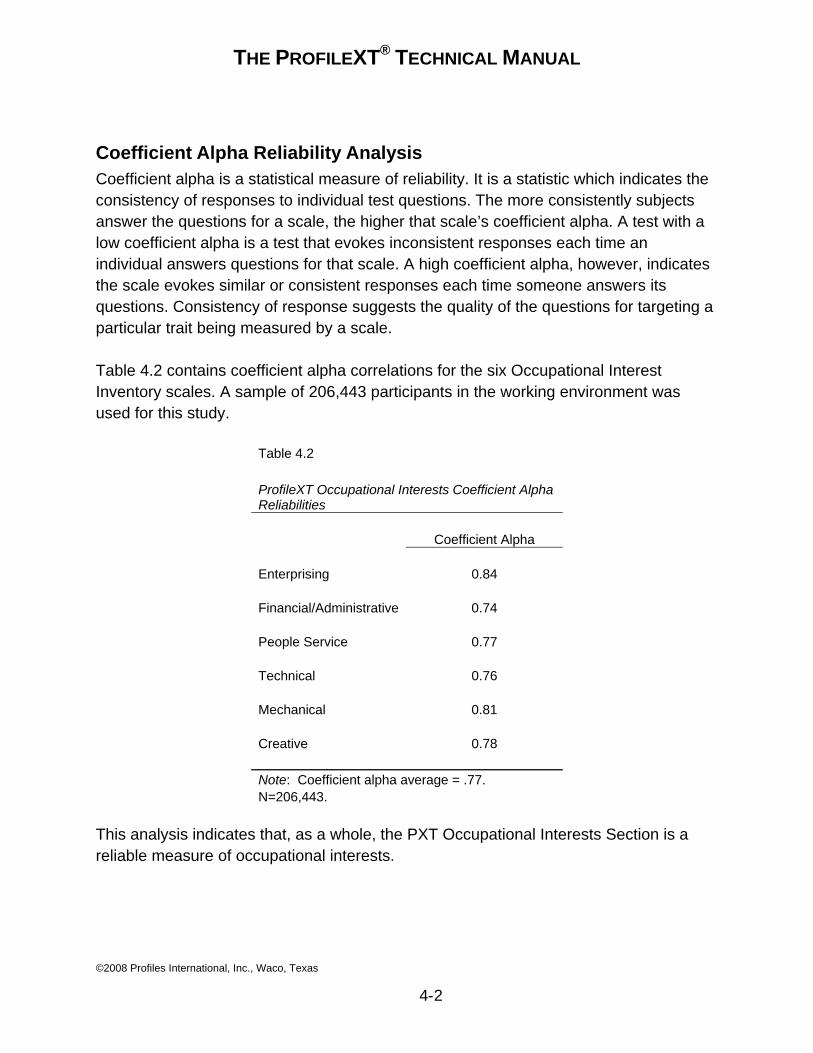
THE PROFILEXT® TECHNICAL MANUAL
©2008 Profiles International, Inc., Waco, Texas
4-2
Coefficient Alpha Reliability Analysis Coefficient alpha is a statistical measure of reliability. It is a statistic which indicates the consistency of responses to individual test questions. The more consistently subjects answer the questions for a scale, the higher that scale’s coefficient alpha. A test with a low coefficient alpha is a test that evokes inconsistent responses each time an individual answers questions for that scale. A high coefficient alpha, however, indicates the scale evokes similar or consistent responses each time someone answers its questions. Consistency of response suggests the quality of the questions for targeting a particular trait being measured by a scale.
Table 4.2 contains coefficient alpha correlations for the six Occupational Interest Inventory scales. A sample of 206,443 participants in the working environment was used for this study.
Table 4.2 ProfileXT Occupational Interests Coefficient Alpha Reliabilities Coefficient Alpha Enterprising 0.84 Financial/Administrative 0.74 People Service 0.77 Technical 0.76 Mechanical 0.81 Creative 0.78 Note: Coefficient alpha average = .77. N=206,443.
This analysis indicates that, as a whole, the PXT Occupational Interests Section is a reliable measure of occupational interests.
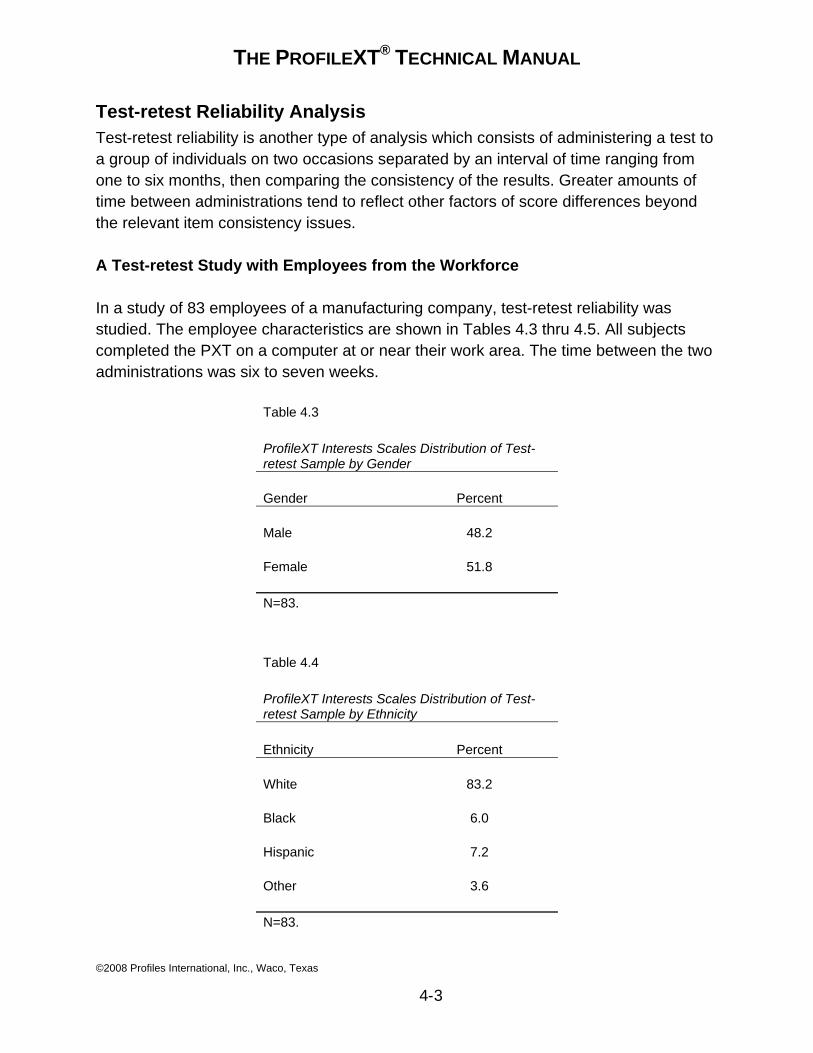
THE PROFILEXT® TECHNICAL MANUAL
©2008 Profiles International, Inc., Waco, Texas
4-3
Test-retest Reliability Analysis Test-retest reliability is another type of analysis which consists of administering a test to a group of individuals on two occasions separated by an interval of time ranging from one to six months, then comparing the consistency of the results. Greater amounts of time between administrations tend to reflect other factors of score differences beyond the relevant item consistency issues.
A Test-retest Study with Employees from the Workforce
In a study of 83 employees of a manufacturing company, test-retest reliability was studied. The employee characteristics are shown in Tables 4.3 thru 4.5. All subjects completed the PXT on a computer at or near their work area. The time between the two administrations was six to seven weeks.
Table 4.3 ProfileXT Interests Scales Distribution of Test-retest Sample by Gender Gender Percent Male 48.2 Female 51.8 N=83.
Table 4.4 ProfileXT Interests Scales Distribution of Test-retest Sample by Ethnicity Ethnicity Percent White 83.2 Black 6.0 Hispanic 7.2 Other 3.6 N=83.
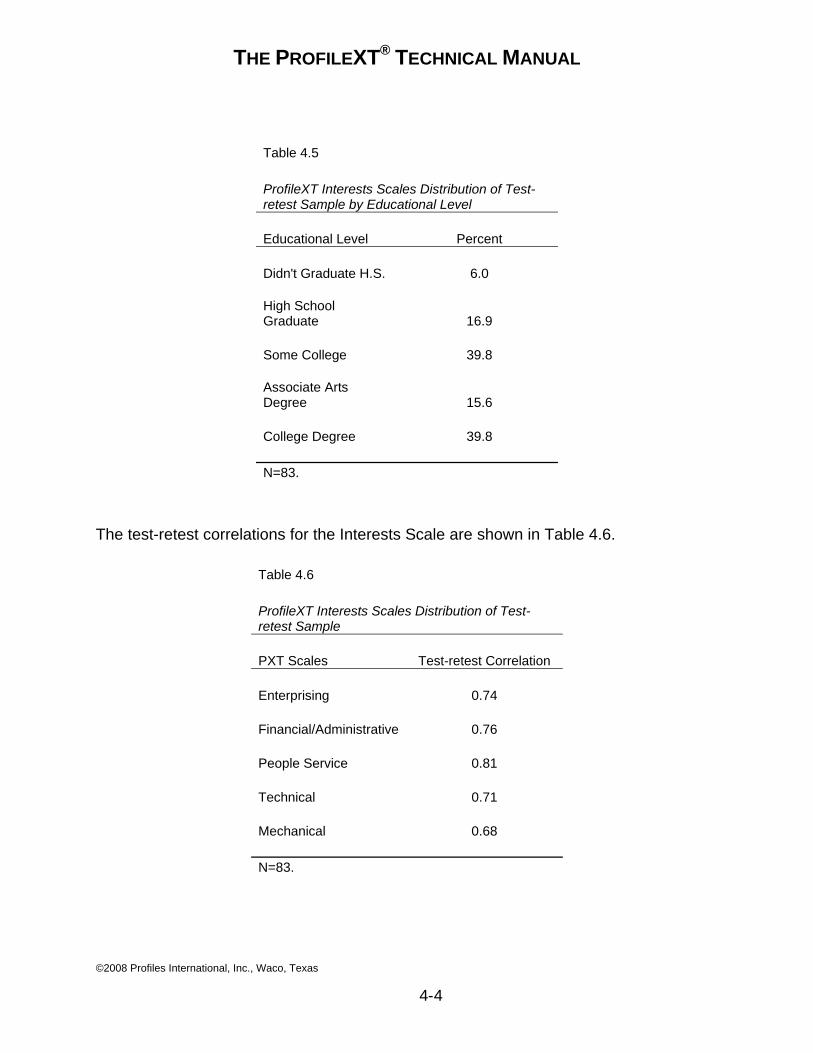
THE PROFILEXT® TECHNICAL MANUAL
©2008 Profiles International, Inc., Waco, Texas
4-4
Table 4.5 ProfileXT Interests Scales Distribution of Test-retest Sample by Educational Level Educational Level Percent Didn't Graduate H.S. 6.0 High School Graduate 16.9 Some College 39.8 Associate Arts Degree 15.6 College Degree 39.8 N=83.
The test-retest correlations for the Interests Scale are shown in Table 4.6.
Table 4.6 ProfileXT Interests Scales Distribution of Test-retest Sample PXT Scales Test-retest Correlation Enterprising 0.74 Financial/Administrative 0.76 People Service 0.81 Technical 0.71 Mechanical 0.68 N=83.
THE PROFILEXT® TECHNICAL MANUAL
©2008 Profiles International, Inc., Waco, Texas
4-5
The results of this study using employees of a manufacturing company are typical of our target population. The higher level of correlation may be explained by their completing the assessments in a work environment and perhaps taking the task more seriously. These results show good test-retest reliability for all scales.
Validity
Validity of assessments concerns how applicable and relevant the results are for actual decision making purposes. Various methods used for demonstrating the validity of the PXT Occupational Interest Section are provided below.
The Construct Validity Approach Construct validity refers to the extent to which a measure is an accurate gauge of a particular construct or trait. Construct validity addresses the questions “What does this scale measure? How well does it measure what it was designed and purported to measure?”
Although there are different methods for evaluating construct validity, two of the most informative methods include examining the correlation coefficients (1) among the scales within the new instrument and (2) between the new instrument and other psychological measures which have been shown to measure the same or similar constructs. The pattern of correlations should be consistent with expectations based on what these scales were intended to measure. Scales that measure related personality constructs should be highly correlated whereas scales that measure unrelated constructs should not correlate well.
Intercorrelation of PXT Scales The PXT Occupational Interests Section was designed to measure six primary dimensions of work-related and non-vocational activities. Table 4.7 contains the correlations among the six PXT Occupational Interests Scales for 206,443 job applicants and incumbents.
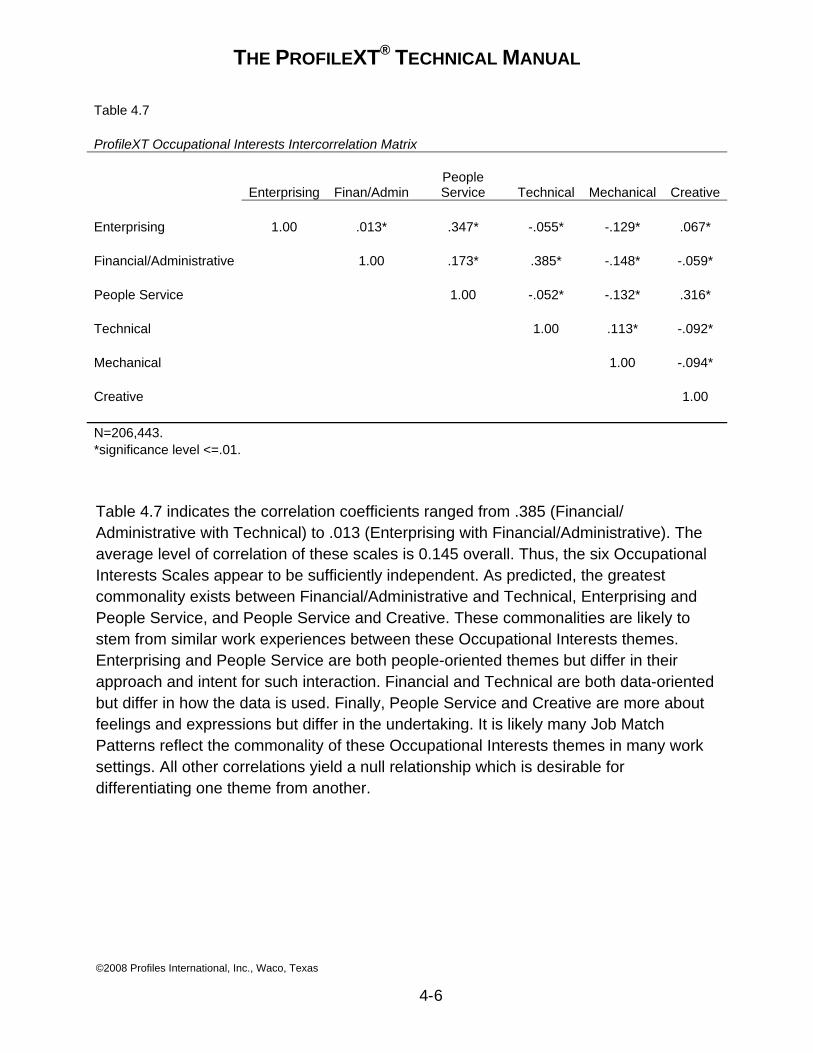
THE PROFILEXT® TECHNICAL MANUAL
©2008 Profiles International, Inc., Waco, Texas
4-6
Table 4.7 ProfileXT Occupational Interests Intercorrelation Matrix
Enterprising Finan/AdminPeople Service Technical Mechanical Creative
Enterprising 1.00 .013* .347* -.055* -.129* .067* Financial/Administrative 1.00 .173* .385* -.148* -.059* People Service 1.00 -.052* -.132* .316* Technical 1.00 .113* -.092* Mechanical 1.00 -.094* Creative 1.00 N=206,443. *significance level <=.01.
Table 4.7 indicates the correlation coefficients ranged from .385 (Financial/ Administrative with Technical) to .013 (Enterprising with Financial/Administrative). The average level of correlation of these scales is 0.145 overall. Thus, the six Occupational Interests Scales appear to be sufficiently independent. As predicted, the greatest commonality exists between Financial/Administrative and Technical, Enterprising and People Service, and People Service and Creative. These commonalities are likely to stem from similar work experiences between these Occupational Interests themes. Enterprising and People Service are both people-oriented themes but differ in their approach and intent for such interaction. Financial and Technical are both data-oriented but differ in how the data is used. Finally, People Service and Creative are more about feelings and expressions but differ in the undertaking. It is likely many Job Match Patterns reflect the commonality of these Occupational Interests themes in many work settings. All other correlations yield a null relationship which is desirable for differentiating one theme from another.
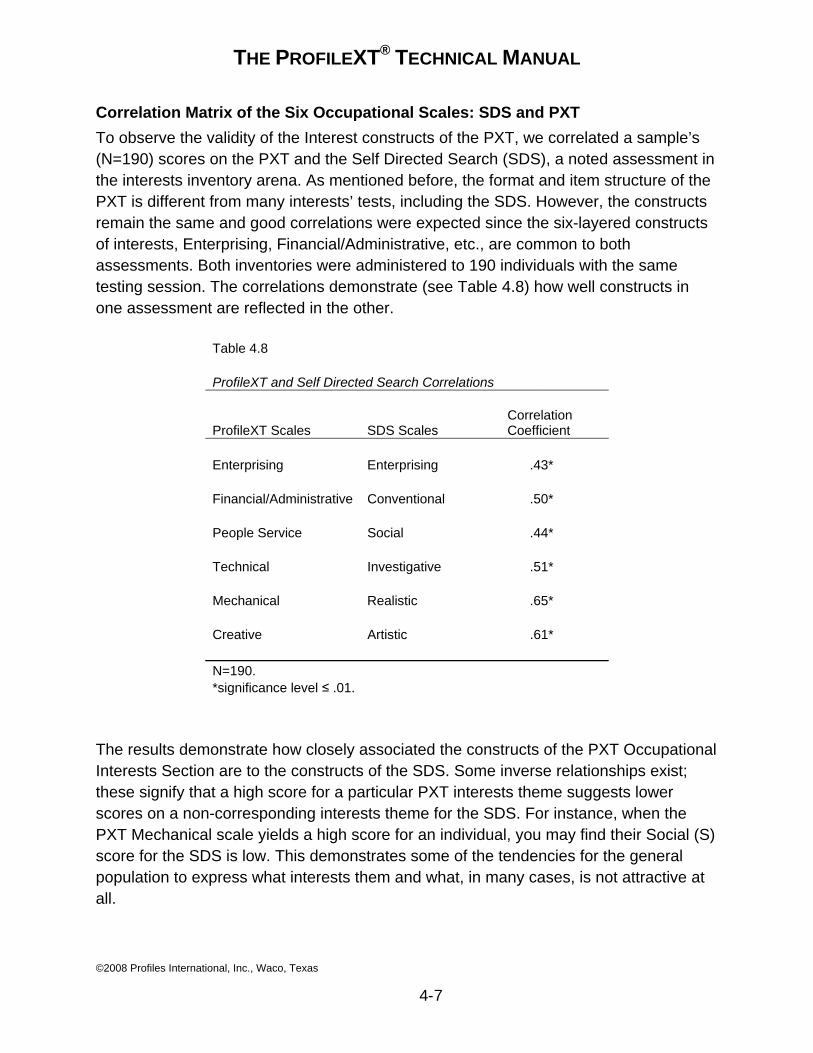
THE PROFILEXT® TECHNICAL MANUAL
©2008 Profiles International, Inc., Waco, Texas
4-7
Correlation Matrix of the Six Occupational Scales: SDS and PXT To observe the validity of the Interest constructs of the PXT, we correlated a sample’s (N=190) scores on the PXT and the Self Directed Search (SDS), a noted assessment in the interests inventory arena. As mentioned before, the format and item structure of the PXT is different from many interests’ tests, including the SDS. However, the constructs remain the same and good correlations were expected since the six-layered constructs of interests, Enterprising, Financial/Administrative, etc., are common to both assessments. Both inventories were administered to 190 individuals with the same testing session. The correlations demonstrate (see Table 4.8) how well constructs in one assessment are reflected in the other.
Table 4.8 ProfileXT and Self Directed Search Correlations
ProfileXT Scales SDS Scales Correlation Coefficient
Enterprising Enterprising .43* Financial/Administrative Conventional .50* People Service Social .44* Technical Investigative .51* Mechanical Realistic .65* Creative Artistic .61* N=190. *significance level ≤ .01.
The results demonstrate how closely associated the constructs of the PXT Occupational Interests Section are to the constructs of the SDS. Some inverse relationships exist; these signify that a high score for a particular PXT interests theme suggests lower scores on a non-corresponding interests theme for the SDS. For instance, when the PXT Mechanical scale yields a high score for an individual, you may find their Social (S) score for the SDS is low. This demonstrates some of the tendencies for the general population to express what interests them and what, in many cases, is not attractive at all.
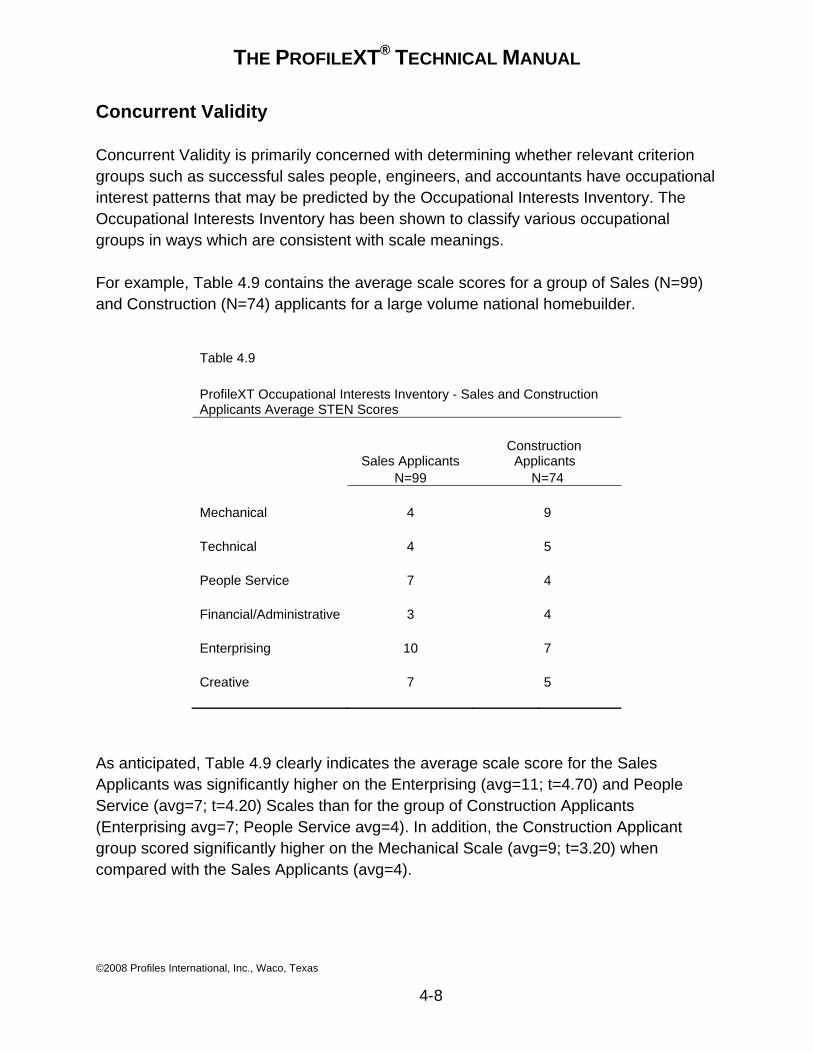
THE PROFILEXT® TECHNICAL MANUAL
©2008 Profiles International, Inc., Waco, Texas
4-8
Concurrent Validity
Concurrent Validity is primarily concerned with determining whether relevant criterion groups such as successful sales people, engineers, and accountants have occupational interest patterns that may be predicted by the Occupational Interests Inventory. The Occupational Interests Inventory has been shown to classify various occupational groups in ways which are consistent with scale meanings.
For example, Table 4.9 contains the average scale scores for a group of Sales (N=99) and Construction (N=74) applicants for a large volume national homebuilder.
Table 4.9 ProfileXT Occupational Interests Inventory - Sales and Construction Applicants Average STEN Scores
Sales Applicants Construction Applicants
N=99 N=74 Mechanical 4 9 Technical 4 5 People Service 7 4 Financial/Administrative 3 4 Enterprising 10 7 Creative 7 5
As anticipated, Table 4.9 clearly indicates the average scale score for the Sales Applicants was significantly higher on the Enterprising (avg=11; t=4.70) and People Service (avg=7; t=4.20) Scales than for the group of Construction Applicants (Enterprising avg=7; People Service avg=4). In addition, the Construction Applicant group scored significantly higher on the Mechanical Scale (avg=9; t=3.20) when compared with the Sales Applicants (avg=4).
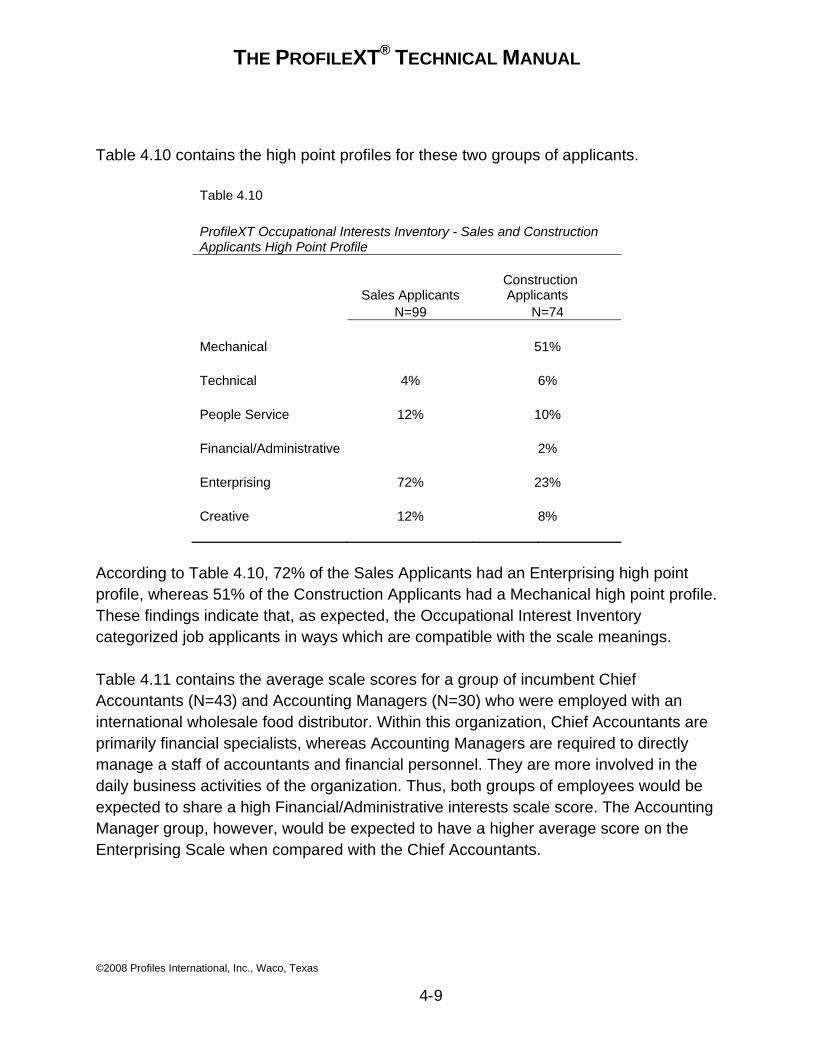
THE PROFILEXT® TECHNICAL MANUAL
©2008 Profiles International, Inc., Waco, Texas
4-9
Table 4.10 contains the high point profiles for these two groups of applicants.
Table 4.10 ProfileXT Occupational Interests Inventory - Sales and Construction Applicants High Point Profile
Sales Applicants Construction Applicants
N=99 N=74 Mechanical 51% Technical 4% 6% People Service 12% 10% Financial/Administrative 2% Enterprising 72% 23% Creative 12% 8%
According to Table 4.10, 72% of the Sales Applicants had an Enterprising high point profile, whereas 51% of the Construction Applicants had a Mechanical high point profile. These findings indicate that, as expected, the Occupational Interest Inventory categorized job applicants in ways which are compatible with the scale meanings.
Table 4.11 contains the average scale scores for a group of incumbent Chief Accountants (N=43) and Accounting Managers (N=30) who were employed with an international wholesale food distributor. Within this organization, Chief Accountants are primarily financial specialists, whereas Accounting Managers are required to directly manage a staff of accountants and financial personnel. They are more involved in the daily business activities of the organization. Thus, both groups of employees would be expected to share a high Financial/Administrative interests scale score. The Accounting Manager group, however, would be expected to have a higher average score on the Enterprising Scale when compared with the Chief Accountants.
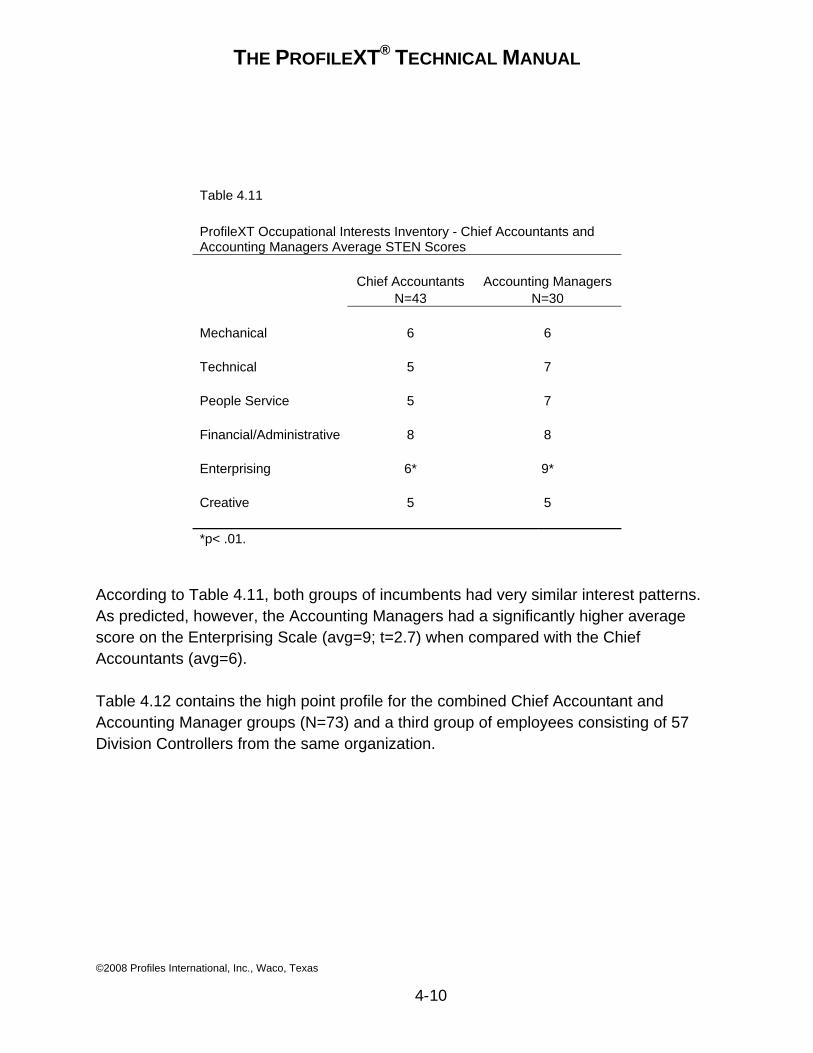
THE PROFILEXT® TECHNICAL MANUAL
©2008 Profiles International, Inc., Waco, Texas
4-10
Table 4.11 ProfileXT Occupational Interests Inventory - Chief Accountants and Accounting Managers Average STEN Scores Chief Accountants Accounting Managers N=43 N=30 Mechanical 6 6 Technical 5 7 People Service 5 7 Financial/Administrative 8 8 Enterprising 6* 9* Creative 5 5 *p< .01.
According to Table 4.11, both groups of incumbents had very similar interest patterns. As predicted, however, the Accounting Managers had a significantly higher average score on the Enterprising Scale (avg=9; t=2.7) when compared with the Chief Accountants (avg=6).
Table 4.12 contains the high point profile for the combined Chief Accountant and Accounting Manager groups (N=73) and a third group of employees consisting of 57 Division Controllers from the same organization.
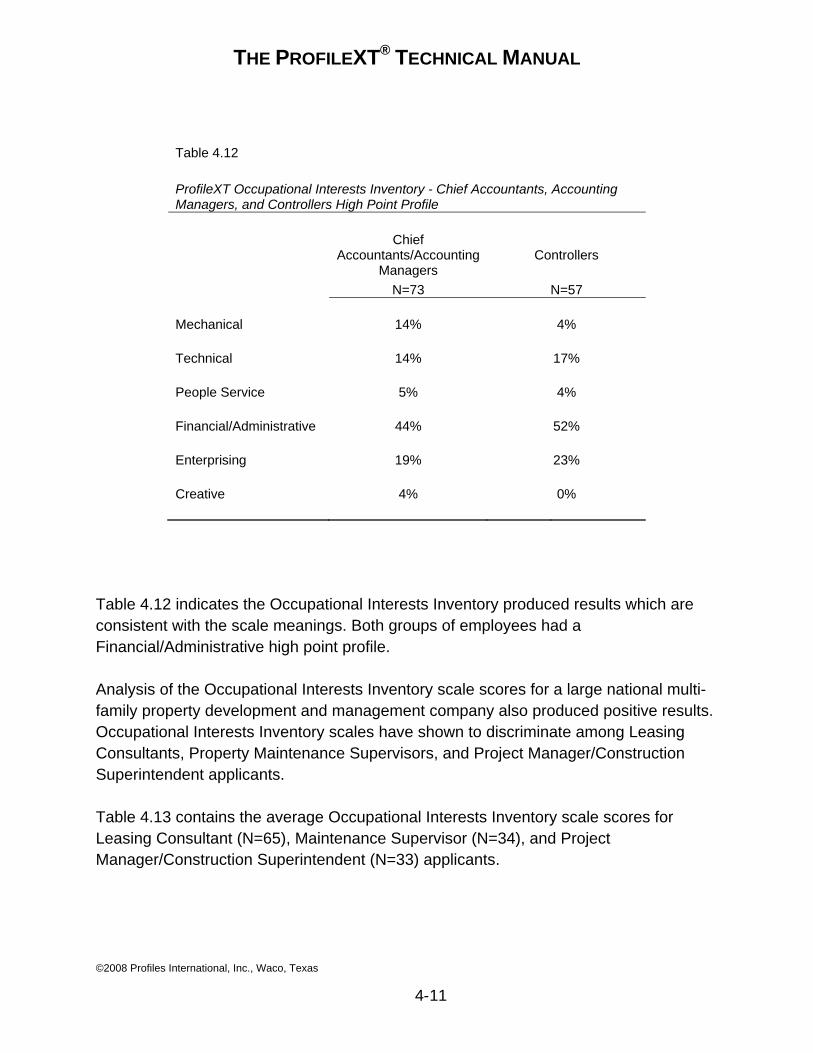
THE PROFILEXT® TECHNICAL MANUAL
©2008 Profiles International, Inc., Waco, Texas
4-11
Table 4.12 ProfileXT Occupational Interests Inventory - Chief Accountants, Accounting Managers, and Controllers High Point Profile
Chief Accountants/Accounting
Managers Controllers
N=73 N=57 Mechanical 14% 4% Technical 14% 17% People Service 5% 4% Financial/Administrative 44% 52% Enterprising 19% 23% Creative 4% 0%
Table 4.12 indicates the Occupational Interests Inventory produced results which are consistent with the scale meanings. Both groups of employees had a Financial/Administrative high point profile.
Analysis of the Occupational Interests Inventory scale scores for a large national multi-family property development and management company also produced positive results. Occupational Interests Inventory scales have shown to discriminate among Leasing Consultants, Property Maintenance Supervisors, and Project Manager/Construction Superintendent applicants.
Table 4.13 contains the average Occupational Interests Inventory scale scores for Leasing Consultant (N=65), Maintenance Supervisor (N=34), and Project Manager/Construction Superintendent (N=33) applicants.
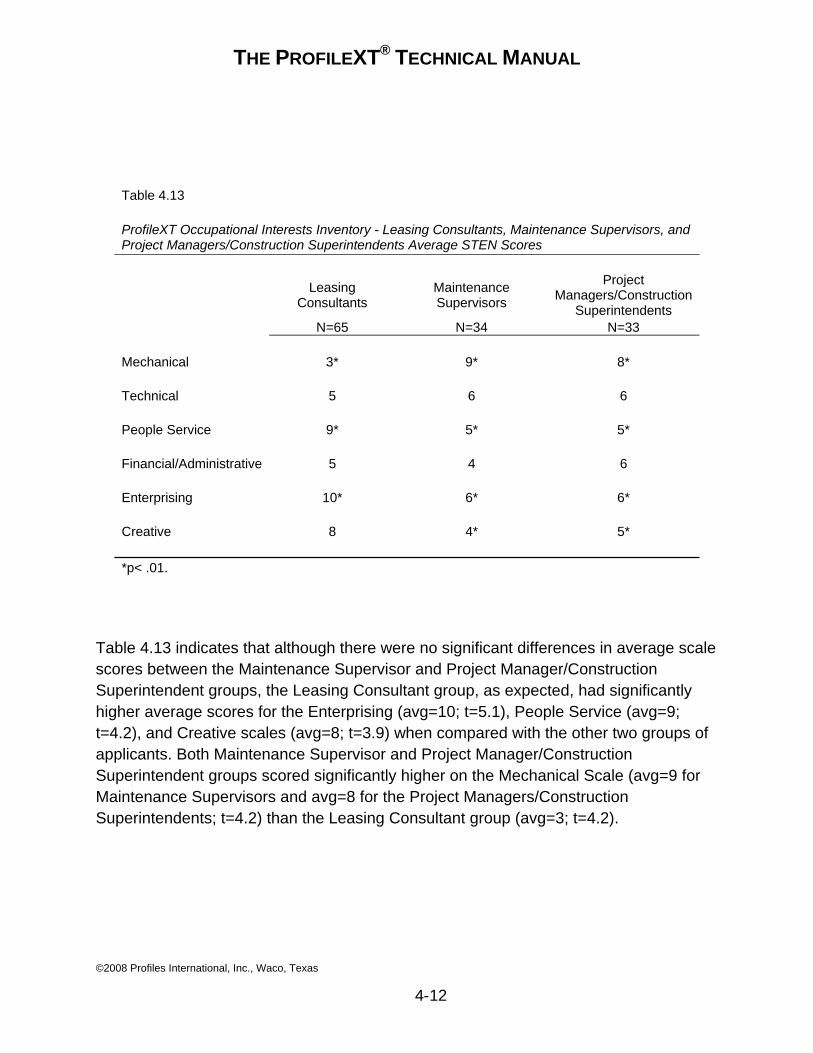
THE PROFILEXT® TECHNICAL MANUAL
©2008 Profiles International, Inc., Waco, Texas
4-12
Table 4.13 ProfileXT Occupational Interests Inventory - Leasing Consultants, Maintenance Supervisors, and Project Managers/Construction Superintendents Average STEN Scores Leasing
Consultants Maintenance Supervisors
Project Managers/Construction
Superintendents N=65 N=34 N=33 Mechanical 3* 9* 8* Technical 5 6 6 People Service 9* 5* 5* Financial/Administrative 5 4 6 Enterprising 10* 6* 6* Creative 8 4* 5* *p< .01.
Table 4.13 indicates that although there were no significant differences in average scale scores between the Maintenance Supervisor and Project Manager/Construction Superintendent groups, the Leasing Consultant group, as expected, had significantly higher average scores for the Enterprising (avg=10; t=5.1), People Service (avg=9; t=4.2), and Creative scales (avg=8; t=3.9) when compared with the other two groups of applicants. Both Maintenance Supervisor and Project Manager/Construction Superintendent groups scored significantly higher on the Mechanical Scale (avg=9 for Maintenance Supervisors and avg=8 for the Project Managers/Construction Superintendents; t=4.2) than the Leasing Consultant group (avg=3; t=4.2).
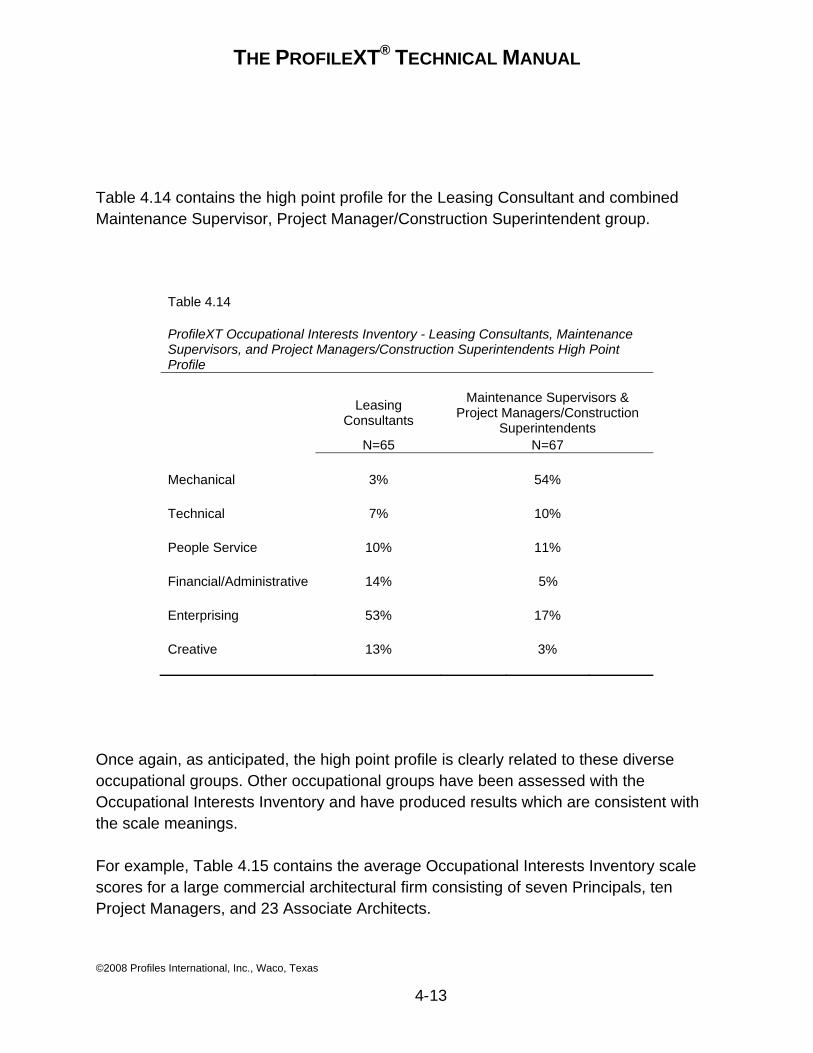
THE PROFILEXT® TECHNICAL MANUAL
©2008 Profiles International, Inc., Waco, Texas
4-13
Table 4.14 contains the high point profile for the Leasing Consultant and combined Maintenance Supervisor, Project Manager/Construction Superintendent group.
Table 4.14 ProfileXT Occupational Interests Inventory - Leasing Consultants, Maintenance Supervisors, and Project Managers/Construction Superintendents High Point Profile Leasing
Consultants
Maintenance Supervisors & Project Managers/Construction
Superintendents N=65 N=67 Mechanical 3% 54% Technical 7% 10% People Service 10% 11% Financial/Administrative 14% 5% Enterprising 53% 17% Creative 13% 3%
Once again, as anticipated, the high point profile is clearly related to these diverse occupational groups. Other occupational groups have been assessed with the Occupational Interests Inventory and have produced results which are consistent with the scale meanings.
For example, Table 4.15 contains the average Occupational Interests Inventory scale scores for a large commercial architectural firm consisting of seven Principals, ten Project Managers, and 23 Associate Architects.
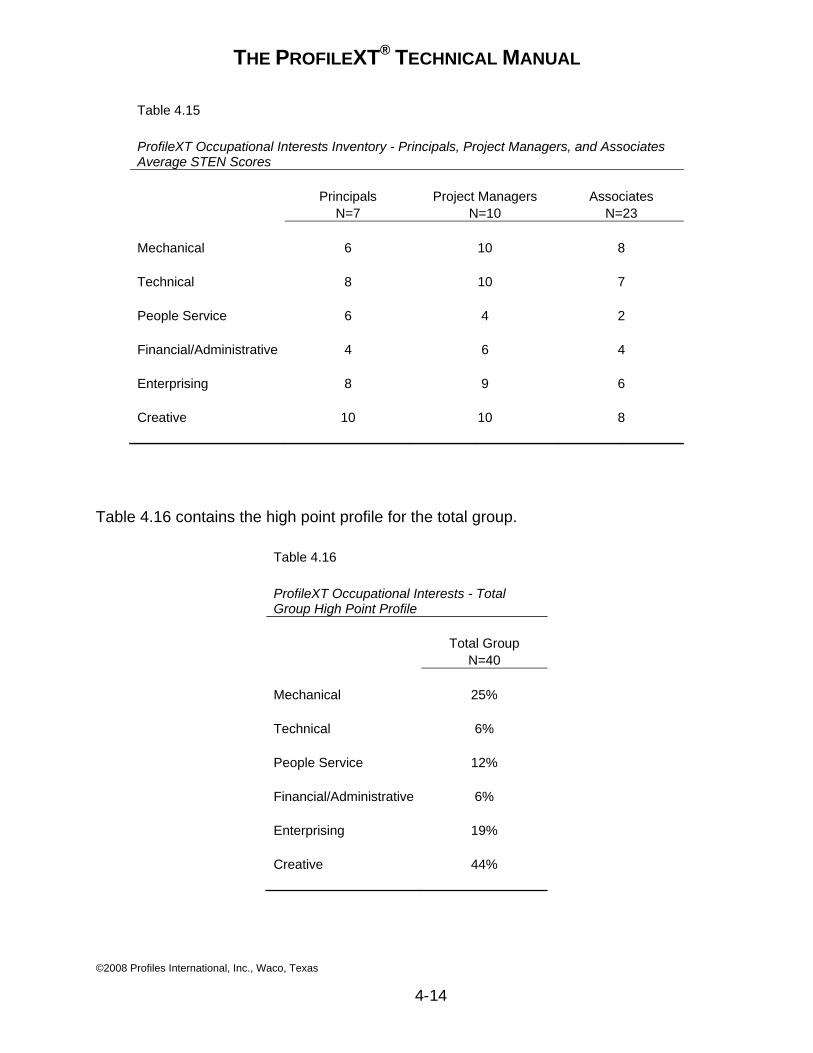
THE PROFILEXT® TECHNICAL MANUAL
©2008 Profiles International, Inc., Waco, Texas
4-14
Table 4.15 ProfileXT Occupational Interests Inventory - Principals, Project Managers, and Associates Average STEN Scores Principals Project Managers Associates N=7 N=10 N=23 Mechanical 6 10 8 Technical 8 10 7 People Service 6 4 2 Financial/Administrative 4 6 4 Enterprising 8 9 6 Creative 10 10 8
Table 4.16 contains the high point profile for the total group.
Table 4.16 ProfileXT Occupational Interests - Total Group High Point Profile Total Group N=40 Mechanical 25% Technical 6% People Service 12% Financial/Administrative 6% Enterprising 19% Creative 44%
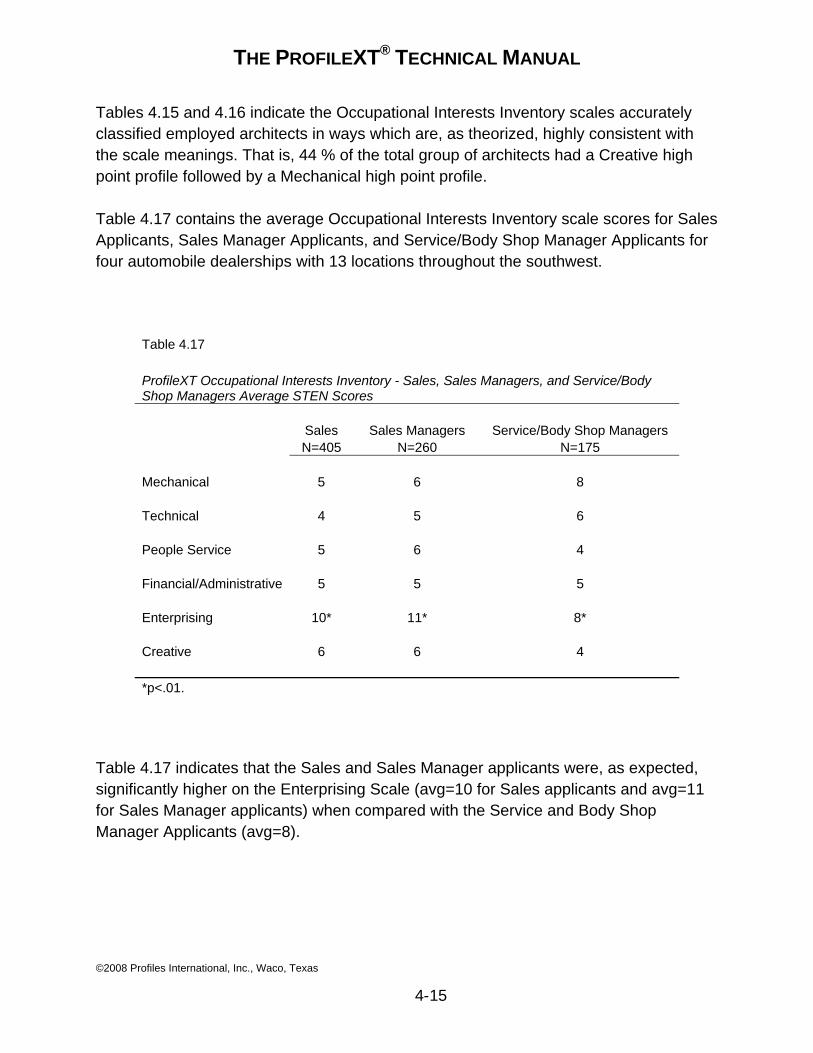
THE PROFILEXT® TECHNICAL MANUAL
©2008 Profiles International, Inc., Waco, Texas
4-15
Tables 4.15 and 4.16 indicate the Occupational Interests Inventory scales accurately classified employed architects in ways which are, as theorized, highly consistent with the scale meanings. That is, 44 % of the total group of architects had a Creative high point profile followed by a Mechanical high point profile.
Table 4.17 contains the average Occupational Interests Inventory scale scores for Sales Applicants, Sales Manager Applicants, and Service/Body Shop Manager Applicants for four automobile dealerships with 13 locations throughout the southwest.
Table 4.17 ProfileXT Occupational Interests Inventory - Sales, Sales Managers, and Service/Body Shop Managers Average STEN Scores Sales Sales Managers Service/Body Shop Managers N=405 N=260 N=175 Mechanical 5 6 8 Technical 4 5 6 People Service 5 6 4 Financial/Administrative 5 5 5 Enterprising 10* 11* 8* Creative 6 6 4 *p<.01.
Table 4.17 indicates that the Sales and Sales Manager applicants were, as expected, significantly higher on the Enterprising Scale (avg=10 for Sales applicants and avg=11 for Sales Manager applicants) when compared with the Service and Body Shop Manager Applicants (avg=8).
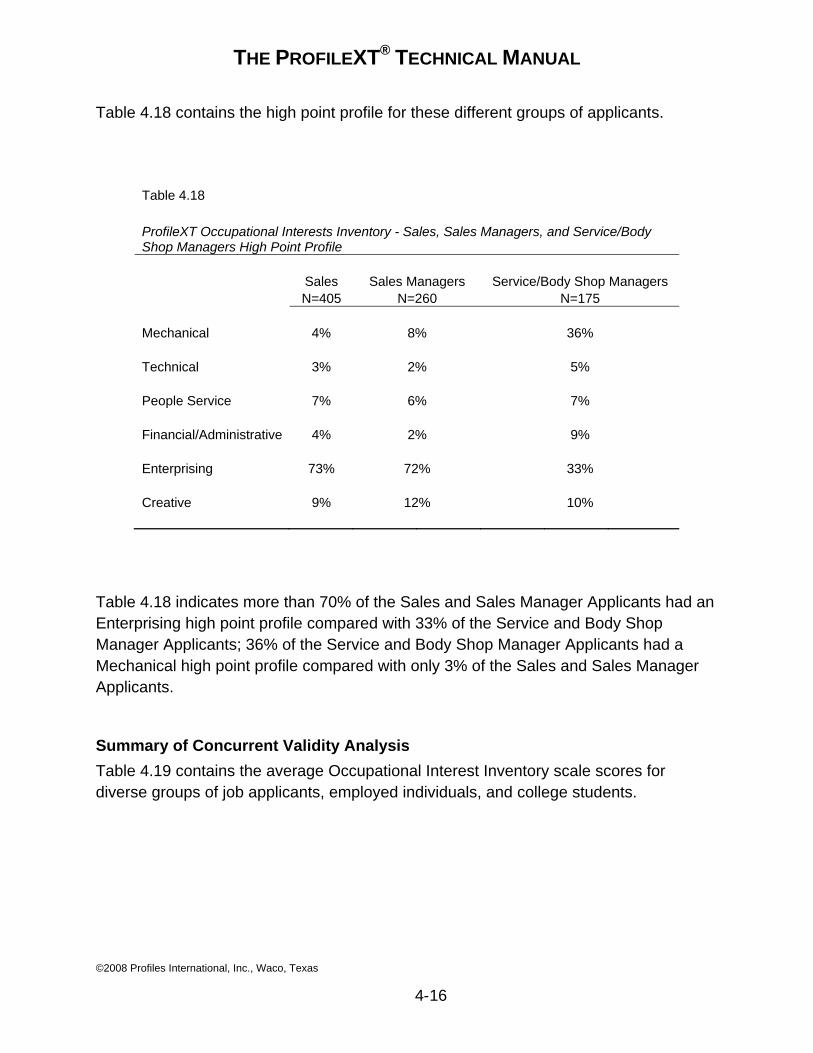
THE PROFILEXT® TECHNICAL MANUAL
©2008 Profiles International, Inc., Waco, Texas
4-16
Table 4.18 contains the high point profile for these different groups of applicants.
Table 4.18 ProfileXT Occupational Interests Inventory - Sales, Sales Managers, and Service/Body Shop Managers High Point Profile Sales Sales Managers Service/Body Shop Managers N=405 N=260 N=175 Mechanical 4% 8% 36% Technical 3% 2% 5% People Service 7% 6% 7% Financial/Administrative 4% 2% 9% Enterprising 73% 72% 33% Creative 9% 12% 10%
Table 4.18 indicates more than 70% of the Sales and Sales Manager Applicants had an Enterprising high point profile compared with 33% of the Service and Body Shop Manager Applicants; 36% of the Service and Body Shop Manager Applicants had a Mechanical high point profile compared with only 3% of the Sales and Sales Manager Applicants.
Summary of Concurrent Validity Analysis Table 4.19 contains the average Occupational Interest Inventory scale scores for diverse groups of job applicants, employed individuals, and college students.
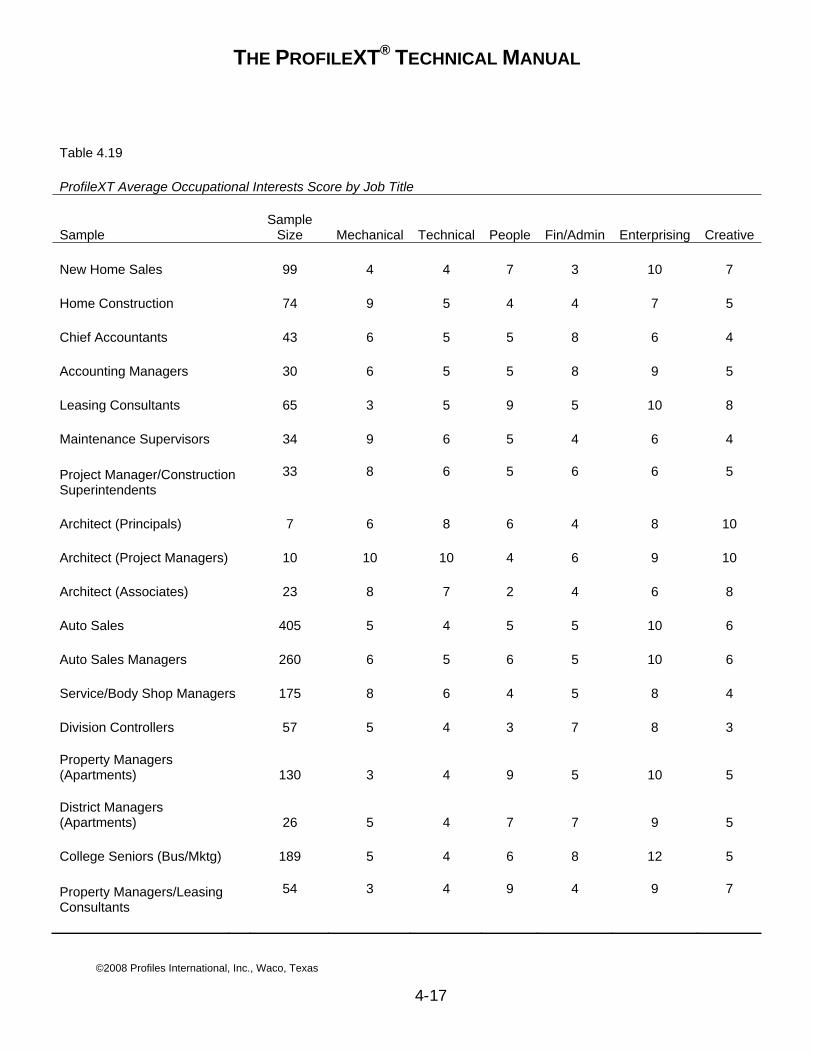
THE PROFILEXT® TECHNICAL MANUAL
©2008 Profiles International, Inc., Waco, Texas
4-17
Table 4.19 ProfileXT Average Occupational Interests Score by Job Title
Sample Sample
Size Mechanical Technical People Fin/Admin Enterprising Creative New Home Sales 99 4 4 7 3 10 7 Home Construction 74 9 5 4 4 7 5 Chief Accountants 43 6 5 5 8 6 4 Accounting Managers 30 6 5 5 8 9 5 Leasing Consultants 65 3 5 9 5 10 8 Maintenance Supervisors 34 9 6 5 4 6 4 Project Manager/Construction Superintendents
33 8 6 5 6 6 5
Architect (Principals) 7 6 8 6 4 8 10 Architect (Project Managers) 10 10 10 4 6 9 10 Architect (Associates) 23 8 7 2 4 6 8 Auto Sales 405 5 4 5 5 10 6 Auto Sales Managers 260 6 5 6 5 10 6 Service/Body Shop Managers 175 8 6 4 5 8 4 Division Controllers 57 5 4 3 7 8 3 Property Managers (Apartments) 130 3 4 9 5 10 5 District Managers (Apartments) 26 5 4 7 7 9 5 College Seniors (Bus/Mktg) 189 5 4 6 8 12 5 Property Managers/Leasing Consultants
54 3 4 9 4 9 7
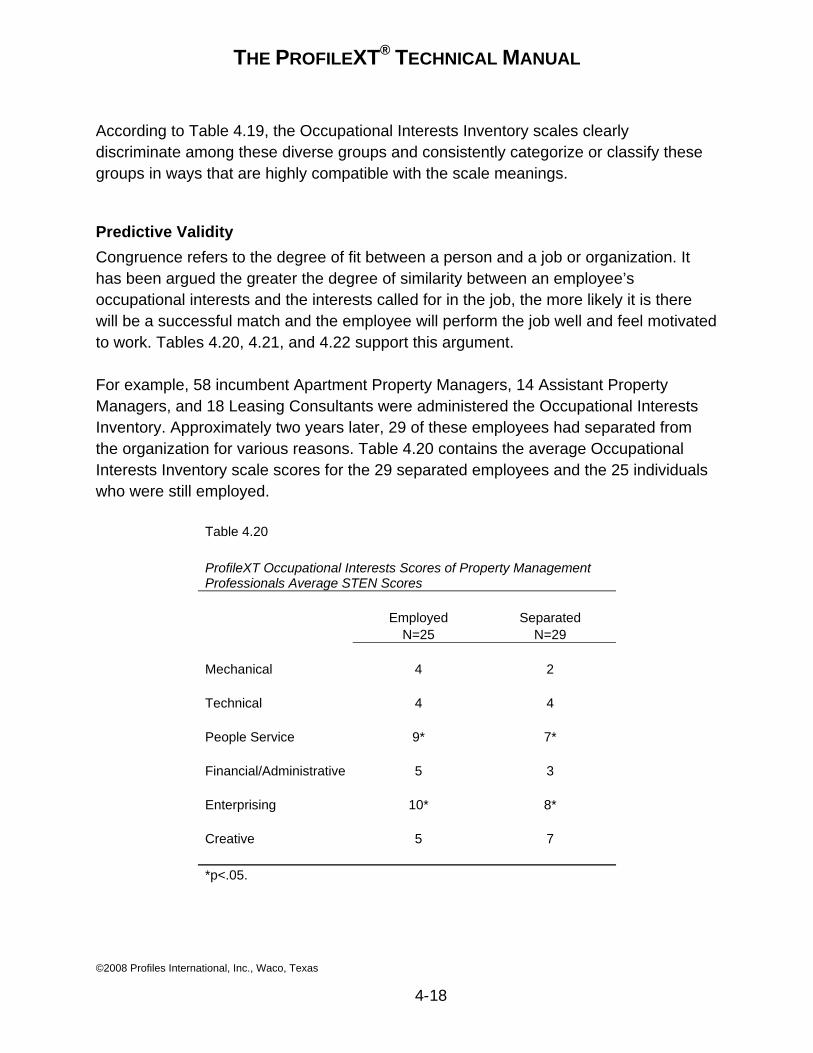
THE PROFILEXT® TECHNICAL MANUAL
©2008 Profiles International, Inc., Waco, Texas
4-18
According to Table 4.19, the Occupational Interests Inventory scales clearly discriminate among these diverse groups and consistently categorize or classify these groups in ways that are highly compatible with the scale meanings.
Predictive Validity Congruence refers to the degree of fit between a person and a job or organization. It has been argued the greater the degree of similarity between an employee’s occupational interests and the interests called for in the job, the more likely it is there will be a successful match and the employee will perform the job well and feel motivated to work. Tables 4.20, 4.21, and 4.22 support this argument.
For example, 58 incumbent Apartment Property Managers, 14 Assistant Property Managers, and 18 Leasing Consultants were administered the Occupational Interests Inventory. Approximately two years later, 29 of these employees had separated from the organization for various reasons. Table 4.20 contains the average Occupational Interests Inventory scale scores for the 29 separated employees and the 25 individuals who were still employed.
Table 4.20 ProfileXT Occupational Interests Scores of Property Management Professionals Average STEN Scores Employed Separated N=25 N=29 Mechanical 4 2 Technical 4 4 People Service 9* 7* Financial/Administrative 5 3 Enterprising 10* 8* Creative 5 7 *p<.05.
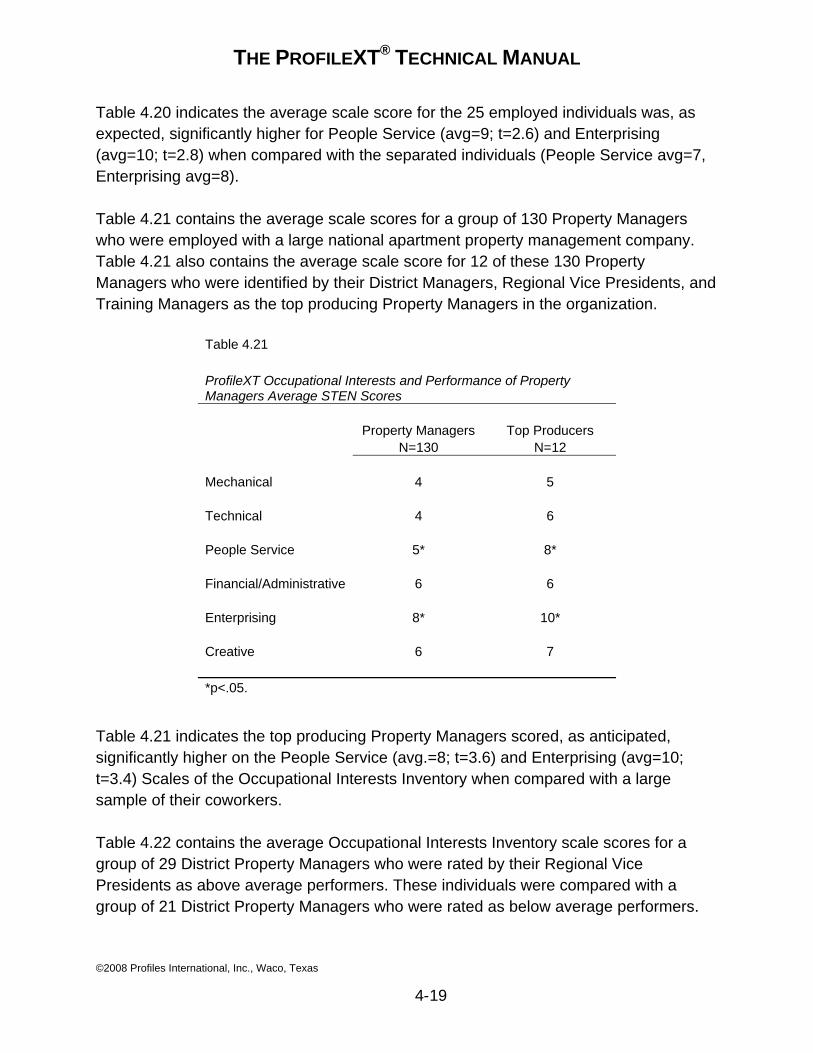
THE PROFILEXT® TECHNICAL MANUAL
©2008 Profiles International, Inc., Waco, Texas
4-19
Table 4.20 indicates the average scale score for the 25 employed individuals was, as expected, significantly higher for People Service (avg=9; t=2.6) and Enterprising (avg=10; t=2.8) when compared with the separated individuals (People Service avg=7, Enterprising avg=8).
Table 4.21 contains the average scale scores for a group of 130 Property Managers who were employed with a large national apartment property management company. Table 4.21 also contains the average scale score for 12 of these 130 Property Managers who were identified by their District Managers, Regional Vice Presidents, and Training Managers as the top producing Property Managers in the organization.
Table 4.21 ProfileXT Occupational Interests and Performance of Property Managers Average STEN Scores Property Managers Top Producers N=130 N=12 Mechanical 4 5 Technical 4 6 People Service 5* 8* Financial/Administrative 6 6 Enterprising 8* 10* Creative 6 7 *p<.05.
Table 4.21 indicates the top producing Property Managers scored, as anticipated, significantly higher on the People Service (avg.=8; t=3.6) and Enterprising (avg=10; t=3.4) Scales of the Occupational Interests Inventory when compared with a large sample of their coworkers.
Table 4.22 contains the average Occupational Interests Inventory scale scores for a group of 29 District Property Managers who were rated by their Regional Vice Presidents as above average performers. These individuals were compared with a group of 21 District Property Managers who were rated as below average performers.
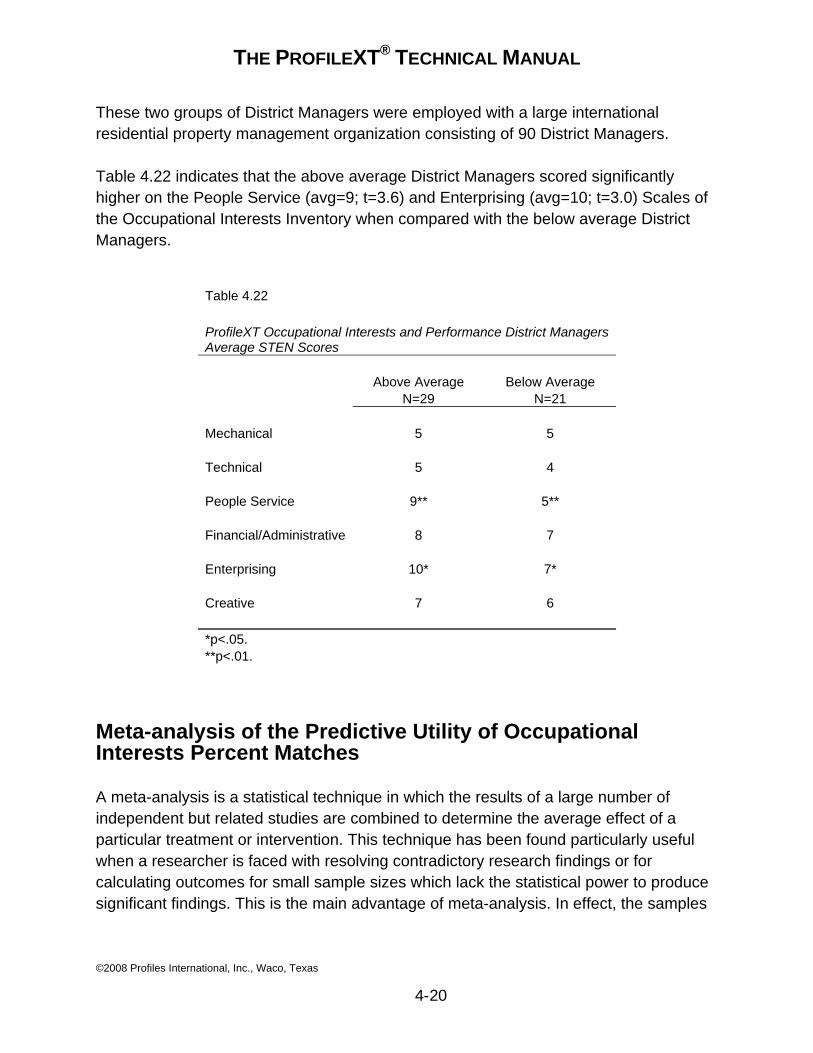
THE PROFILEXT® TECHNICAL MANUAL
©2008 Profiles International, Inc., Waco, Texas
4-20
These two groups of District Managers were employed with a large international residential property management organization consisting of 90 District Managers.
Table 4.22 indicates that the above average District Managers scored significantly higher on the People Service (avg=9; t=3.6) and Enterprising (avg=10; t=3.0) Scales of the Occupational Interests Inventory when compared with the below average District Managers.
Table 4.22 ProfileXT Occupational Interests and Performance District Managers Average STEN Scores Above Average Below Average N=29 N=21 Mechanical 5 5 Technical 5 4 People Service 9** 5** Financial/Administrative 8 7 Enterprising 10* 7* Creative 7 6 *p<.05. **p<.01.
Meta-analysis of the Predictive Utility of Occupational Interests Percent Matches
A meta-analysis is a statistical technique in which the results of a large number of independent but related studies are combined to determine the average effect of a particular treatment or intervention. This technique has been found particularly useful when a researcher is faced with resolving contradictory research findings or for calculating outcomes for small sample sizes which lack the statistical power to produce significant findings. This is the main advantage of meta-analysis. In effect, the samples
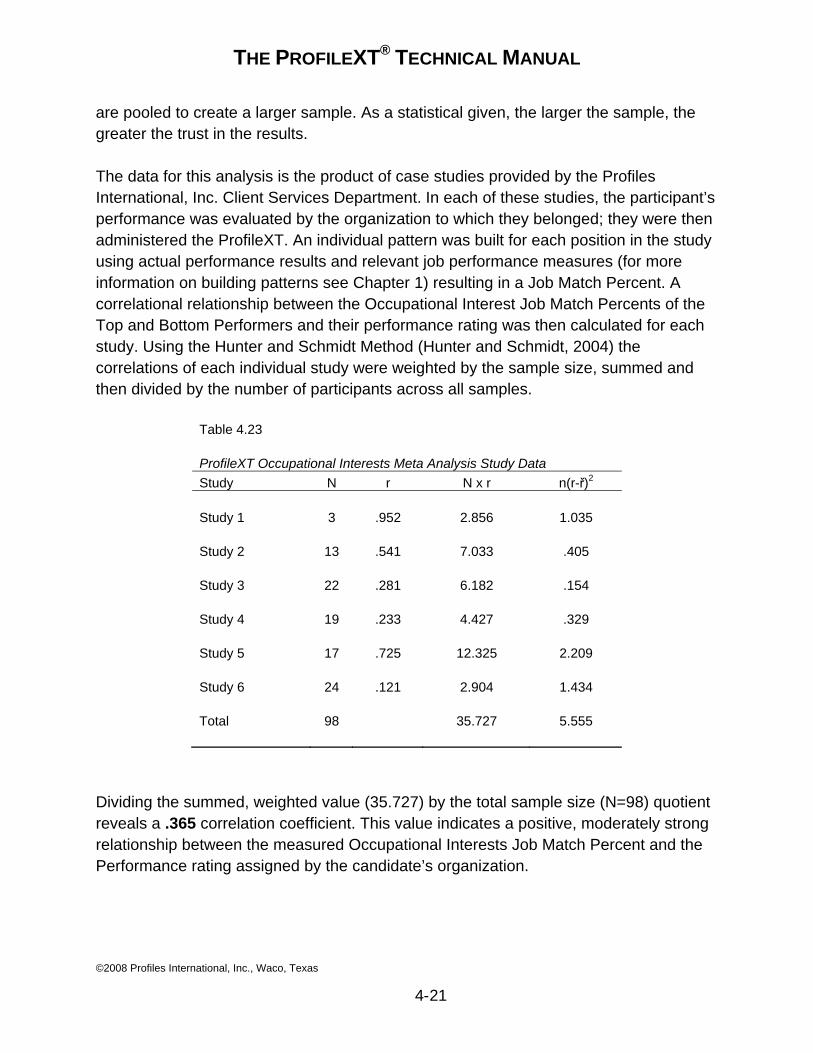
THE PROFILEXT® TECHNICAL MANUAL
©2008 Profiles International, Inc., Waco, Texas
4-21
are pooled to create a larger sample. As a statistical given, the larger the sample, the greater the trust in the results.
The data for this analysis is the product of case studies provided by the Profiles International, Inc. Client Services Department. In each of these studies, the participant’s performance was evaluated by the organization to which they belonged; they were then administered the ProfileXT. An individual pattern was built for each position in the study using actual performance results and relevant job performance measures (for more information on building patterns see Chapter 1) resulting in a Job Match Percent. A correlational relationship between the Occupational Interest Job Match Percents of the Top and Bottom Performers and their performance rating was then calculated for each study. Using the Hunter and Schmidt Method (Hunter and Schmidt, 2004) the correlations of each individual study were weighted by the sample size, summed and then divided by the number of participants across all samples.
Table 4.23 ProfileXT Occupational Interests Meta Analysis Study Data Study N r N x r n(r-ř)2 Study 1 3 .952 2.856 1.035 Study 2 13 .541 7.033 .405 Study 3 22 .281 6.182 .154 Study 4 19 .233 4.427 .329 Study 5 17 .725 12.325 2.209 Study 6 24 .121 2.904 1.434 Total 98 35.727 5.555
Dividing the summed, weighted value (35.727) by the total sample size (N=98) quotient reveals a .365 correlation coefficient. This value indicates a positive, moderately strong relationship between the measured Occupational Interests Job Match Percent and the Performance rating assigned by the candidate’s organization.
THE PROFILEXT® TECHNICAL MANUAL
©2008 Profiles International, Inc., Waco, Texas
4-22
The next step is to calculate credibility intervals by adding to or subtracting the square root of the estimated population variance multiplied by 1.96 (to provide a 95% interval) from the true study effect of .365.
95% Credibility Interval upper = .799
95% Credibility Interval lower = -.0689
As suggested by this analysis, the Occupational Interests Job Match Percents acquired from this sample of seven studies and 98 job candidates indicates good predictive utility of the organizational performance ratings.
Adverse Impact Studies The results of the PXT Occupational Interests section were analyzed with regard to the effects of gender, age, and ethnicity on the results. In some cases, demographic differences may be seen among interests. Various explanations apply, including cultural differences or interests based upon the upbringing and experiences common to those of a particular demographic designation. However, even when differences appear to exist between raw scores on a statistical level, the application of the Job Match Pattern system found in the ProfileXT alleviates these differences which are rarely larger than a single raw score. Because Job Match Patterns are at least three STENs wide, any differences noted here are easily removed on a comprehensive level.
Raw Score Differences In our sample, 155,082 subjects volunteered demographic information about themselves in regards to ethnicity. The distribution of ethnicity in the sample is represented in Table 4.24 and provides the frequencies of each ethnic group and percentages of the total sample population.
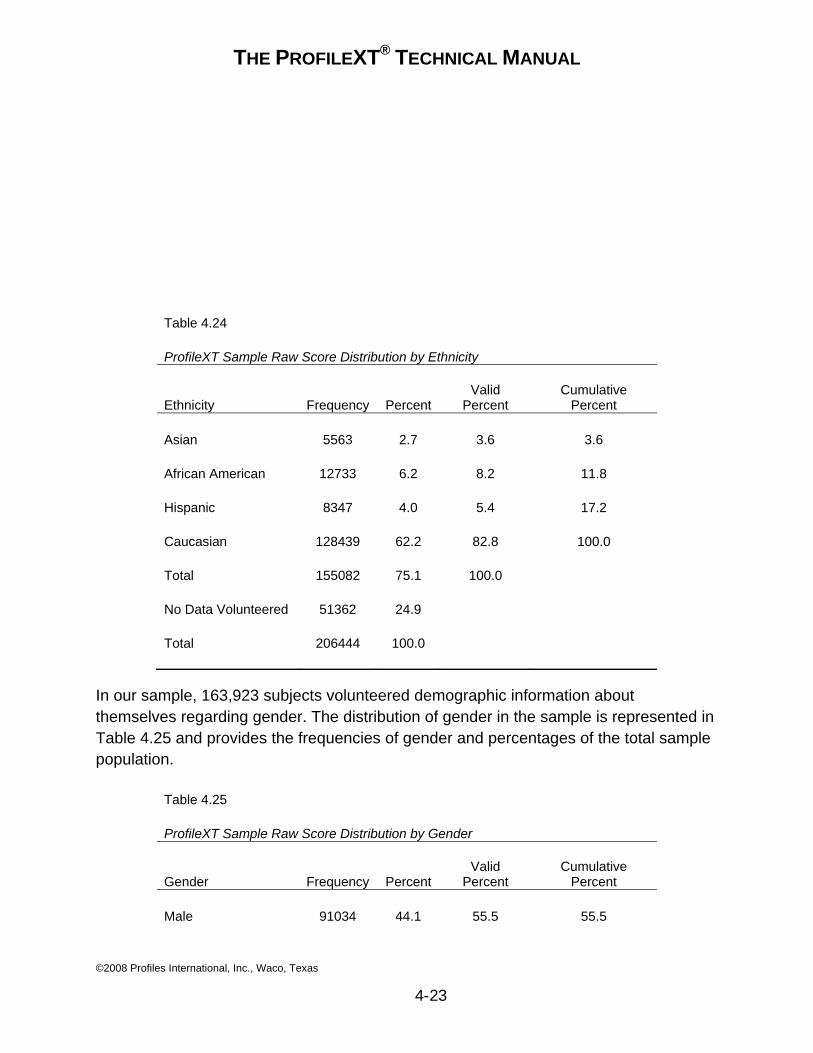
THE PROFILEXT® TECHNICAL MANUAL
©2008 Profiles International, Inc., Waco, Texas
4-23
Table 4.24 ProfileXT Sample Raw Score Distribution by Ethnicity
Ethnicity Frequency Percent Valid
Percent Cumulative
Percent Asian 5563 2.7 3.6 3.6 African American 12733 6.2 8.2 11.8 Hispanic 8347 4.0 5.4 17.2 Caucasian 128439 62.2 82.8 100.0 Total 155082 75.1 100.0 No Data Volunteered 51362 24.9 Total 206444 100.0
In our sample, 163,923 subjects volunteered demographic information about themselves regarding gender. The distribution of gender in the sample is represented in Table 4.25 and provides the frequencies of gender and percentages of the total sample population.
Table 4.25 ProfileXT Sample Raw Score Distribution by Gender
Gender Frequency Percent Valid
Percent Cumulative
Percent Male 91034 44.1 55.5 55.5
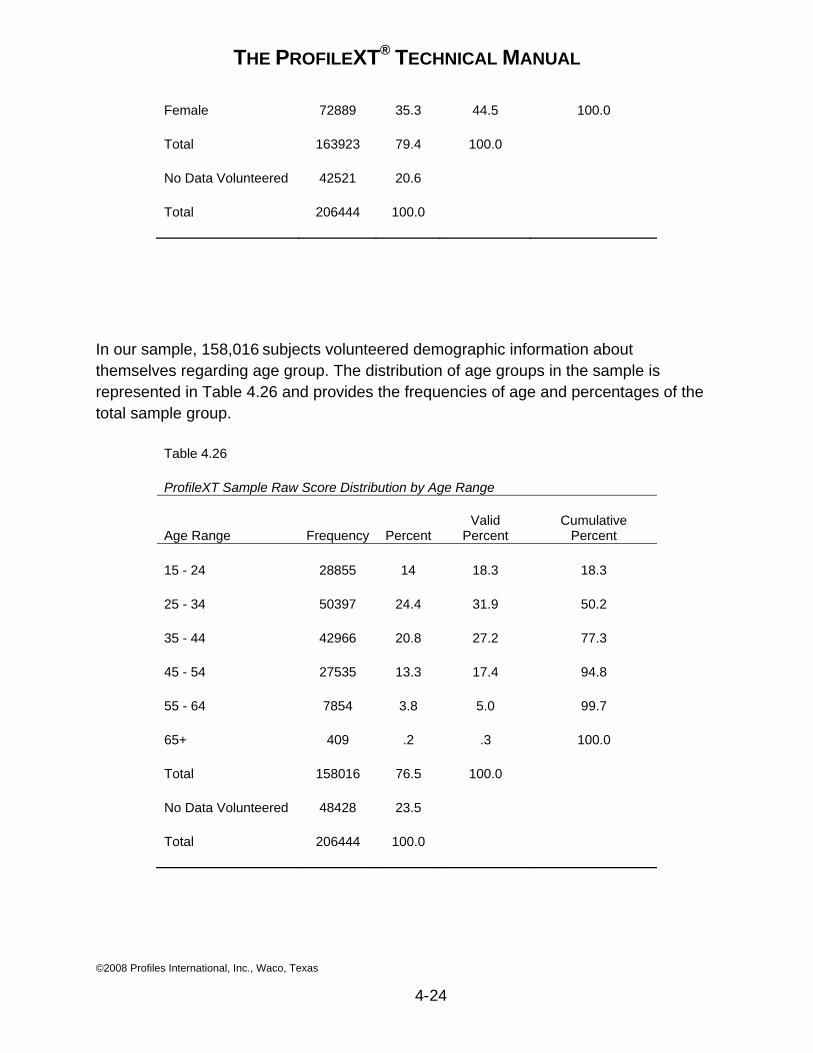
THE PROFILEXT® TECHNICAL MANUAL
©2008 Profiles International, Inc., Waco, Texas
4-24
Female 72889 35.3 44.5 100.0 Total 163923 79.4 100.0 No Data Volunteered 42521 20.6 Total 206444 100.0
In our sample, 158,016 subjects volunteered demographic information about themselves regarding age group. The distribution of age groups in the sample is represented in Table 4.26 and provides the frequencies of age and percentages of the total sample group.
Table 4.26 ProfileXT Sample Raw Score Distribution by Age Range
Age Range Frequency Percent Valid
Percent Cumulative
Percent 15 - 24 28855 14 18.3 18.3 25 - 34 50397 24.4 31.9 50.2 35 - 44 42966 20.8 27.2 77.3 45 - 54 27535 13.3 17.4 94.8 55 - 64 7854 3.8 5.0 99.7 65+ 409 .2 .3 100.0 Total 158016 76.5 100.0 No Data Volunteered 48428 23.5 Total 206444 100.0
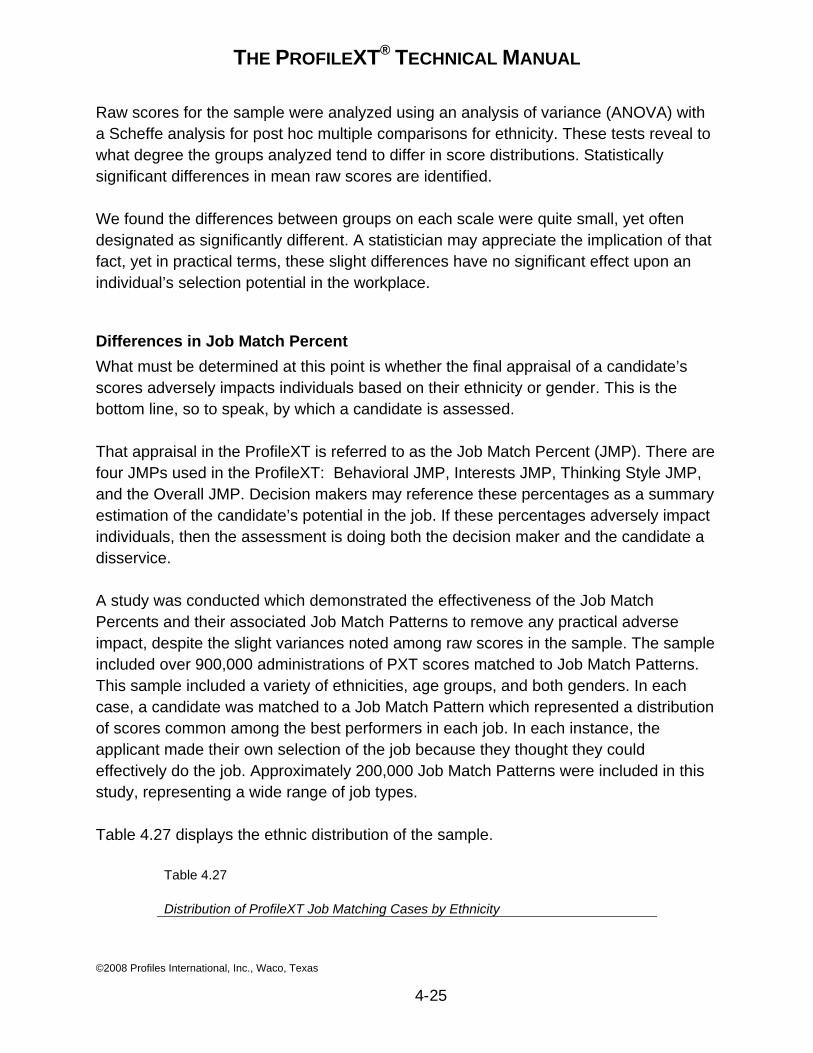
THE PROFILEXT® TECHNICAL MANUAL
©2008 Profiles International, Inc., Waco, Texas
4-25
Raw scores for the sample were analyzed using an analysis of variance (ANOVA) with a Scheffe analysis for post hoc multiple comparisons for ethnicity. These tests reveal to what degree the groups analyzed tend to differ in score distributions. Statistically significant differences in mean raw scores are identified.
We found the differences between groups on each scale were quite small, yet often designated as significantly different. A statistician may appreciate the implication of that fact, yet in practical terms, these slight differences have no significant effect upon an individual’s selection potential in the workplace.
Differences in Job Match Percent What must be determined at this point is whether the final appraisal of a candidate’s scores adversely impacts individuals based on their ethnicity or gender. This is the bottom line, so to speak, by which a candidate is assessed.
That appraisal in the ProfileXT is referred to as the Job Match Percent (JMP). There are four JMPs used in the ProfileXT: Behavioral JMP, Interests JMP, Thinking Style JMP, and the Overall JMP. Decision makers may reference these percentages as a summary estimation of the candidate’s potential in the job. If these percentages adversely impact individuals, then the assessment is doing both the decision maker and the candidate a disservice.
A study was conducted which demonstrated the effectiveness of the Job Match Percents and their associated Job Match Patterns to remove any practical adverse impact, despite the slight variances noted among raw scores in the sample. The sample included over 900,000 administrations of PXT scores matched to Job Match Patterns. This sample included a variety of ethnicities, age groups, and both genders. In each case, a candidate was matched to a Job Match Pattern which represented a distribution of scores common among the best performers in each job. In each instance, the applicant made their own selection of the job because they thought they could effectively do the job. Approximately 200,000 Job Match Patterns were included in this study, representing a wide range of job types.
Table 4.27 displays the ethnic distribution of the sample.
Table 4.27 Distribution of ProfileXT Job Matching Cases by Ethnicity
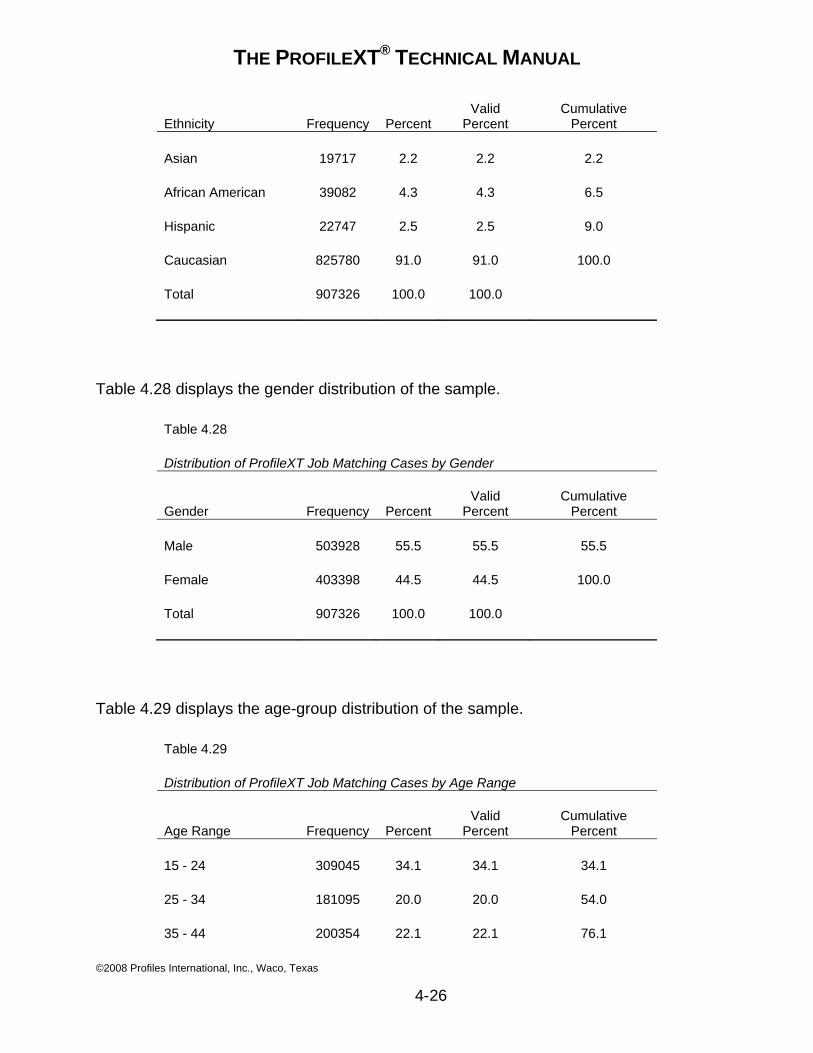
THE PROFILEXT® TECHNICAL MANUAL
©2008 Profiles International, Inc., Waco, Texas
4-26
Ethnicity Frequency Percent Valid
Percent Cumulative
Percent Asian 19717 2.2 2.2 2.2 African American 39082 4.3 4.3 6.5 Hispanic 22747 2.5 2.5 9.0 Caucasian 825780 91.0 91.0 100.0 Total 907326 100.0 100.0
Table 4.28 displays the gender distribution of the sample.
Table 4.28 Distribution of ProfileXT Job Matching Cases by Gender
Gender Frequency Percent Valid
Percent Cumulative
Percent Male 503928 55.5 55.5 55.5 Female 403398 44.5 44.5 100.0 Total 907326 100.0 100.0
Table 4.29 displays the age-group distribution of the sample.
Table 4.29 Distribution of ProfileXT Job Matching Cases by Age Range
Age Range Frequency Percent Valid
Percent Cumulative
Percent 15 - 24 309045 34.1 34.1 34.1 25 - 34 181095 20.0 20.0 54.0 35 - 44 200354 22.1 22.1 76.1
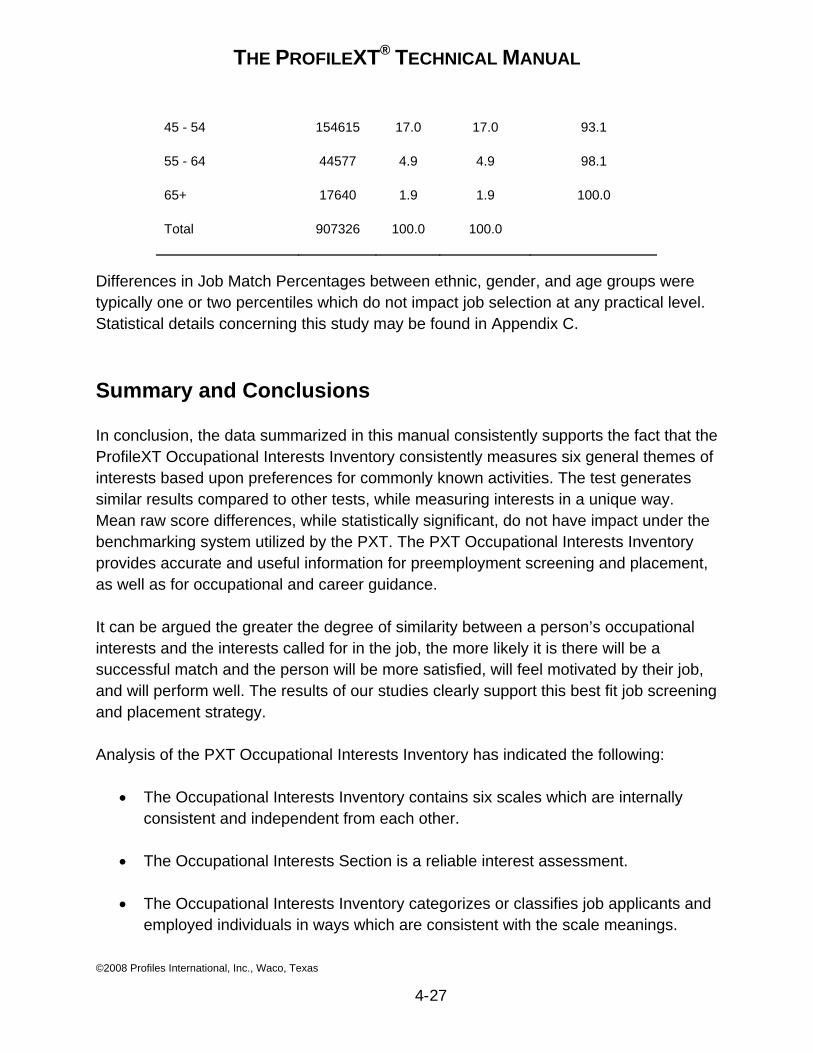
THE PROFILEXT® TECHNICAL MANUAL
©2008 Profiles International, Inc., Waco, Texas
4-27
45 - 54 154615 17.0 17.0 93.1 55 - 64 44577 4.9 4.9 98.1 65+ 17640 1.9 1.9 100.0 Total 907326 100.0 100.0
Differences in Job Match Percentages between ethnic, gender, and age groups were typically one or two percentiles which do not impact job selection at any practical level. Statistical details concerning this study may be found in Appendix C.
Summary and Conclusions
In conclusion, the data summarized in this manual consistently supports the fact that the ProfileXT Occupational Interests Inventory consistently measures six general themes of interests based upon preferences for commonly known activities. The test generates similar results compared to other tests, while measuring interests in a unique way. Mean raw score differences, while statistically significant, do not have impact under the benchmarking system utilized by the PXT. The PXT Occupational Interests Inventory provides accurate and useful information for preemployment screening and placement, as well as for occupational and career guidance.
It can be argued the greater the degree of similarity between a person’s occupational interests and the interests called for in the job, the more likely it is there will be a successful match and the person will be more satisfied, will feel motivated by their job, and will perform well. The results of our studies clearly support this best fit job screening and placement strategy.
Analysis of the PXT Occupational Interests Inventory has indicated the following:
• The Occupational Interests Inventory contains six scales which are internally consistent and independent from each other.
• The Occupational Interests Section is a reliable interest assessment.
• The Occupational Interests Inventory categorizes or classifies job applicants and employed individuals in ways which are consistent with the scale meanings.
THE PROFILEXT® TECHNICAL MANUAL
©2008 Profiles International, Inc., Waco, Texas
4-28
• While an occasional, statistically significant difference between demographic groups was noted, there should be no impact on the selection process when Job Match Patterns are utilized (see Appendices B-D for details).
Finally, as Profiles International, Inc. introduces the ProfileXT to other nations, we continue to study samples from around the world in many languages and for a variety of cultures. Research in this area continues in conjunction with our domestic studies.
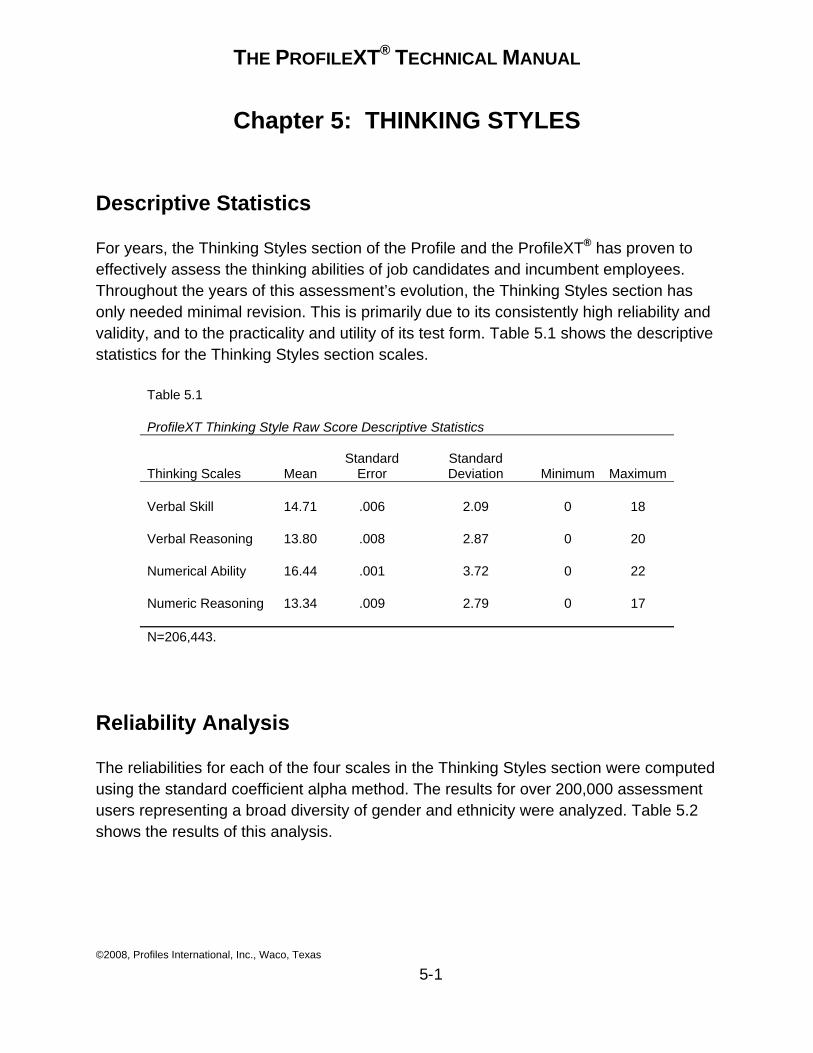
THE PROFILEXT® TECHNICAL MANUAL
©2008, Profiles International, Inc., Waco, Texas
5-1
Chapter 5: THINKING STYLES
Descriptive Statistics
For years, the Thinking Styles section of the Profile and the ProfileXT® has proven to effectively assess the thinking abilities of job candidates and incumbent employees. Throughout the years of this assessment’s evolution, the Thinking Styles section has only needed minimal revision. This is primarily due to its consistently high reliability and validity, and to the practicality and utility of its test form. Table 5.1 shows the descriptive statistics for the Thinking Styles section scales.
Table 5.1 ProfileXT Thinking Style Raw Score Descriptive Statistics
Thinking Scales Mean Standard
Error Standard Deviation Minimum Maximum
Verbal Skill 14.71 .006 2.09 0 18 Verbal Reasoning 13.80 .008 2.87 0 20 Numerical Ability 16.44 .001 3.72 0 22 Numeric Reasoning 13.34 .009 2.79 0 17 N=206,443.
Reliability Analysis
The reliabilities for each of the four scales in the Thinking Styles section were computed using the standard coefficient alpha method. The results for over 200,000 assessment users representing a broad diversity of gender and ethnicity were analyzed. Table 5.2 shows the results of this analysis.
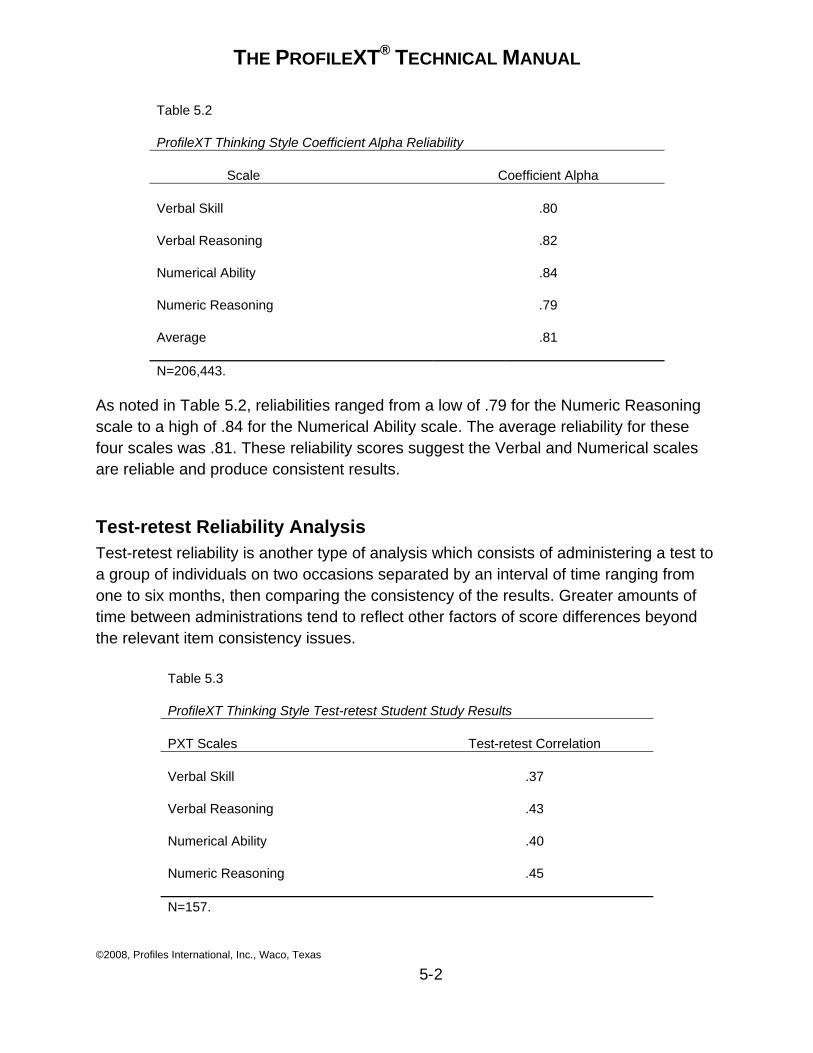
THE PROFILEXT® TECHNICAL MANUAL
©2008, Profiles International, Inc., Waco, Texas
5-2
Table 5.2 ProfileXT Thinking Style Coefficient Alpha Reliability
Scale Coefficient Alpha Verbal Skill .80 Verbal Reasoning .82 Numerical Ability .84 Numeric Reasoning .79 Average .81 N=206,443.
As noted in Table 5.2, reliabilities ranged from a low of .79 for the Numeric Reasoning scale to a high of .84 for the Numerical Ability scale. The average reliability for these four scales was .81. These reliability scores suggest the Verbal and Numerical scales are reliable and produce consistent results.
Test-retest Reliability Analysis Test-retest reliability is another type of analysis which consists of administering a test to a group of individuals on two occasions separated by an interval of time ranging from one to six months, then comparing the consistency of the results. Greater amounts of time between administrations tend to reflect other factors of score differences beyond the relevant item consistency issues.
Table 5.3 ProfileXT Thinking Style Test-retest Student Study Results PXT Scales Test-retest Correlation Verbal Skill .37 Verbal Reasoning .43 Numerical Ability .40 Numeric Reasoning .45 N=157.
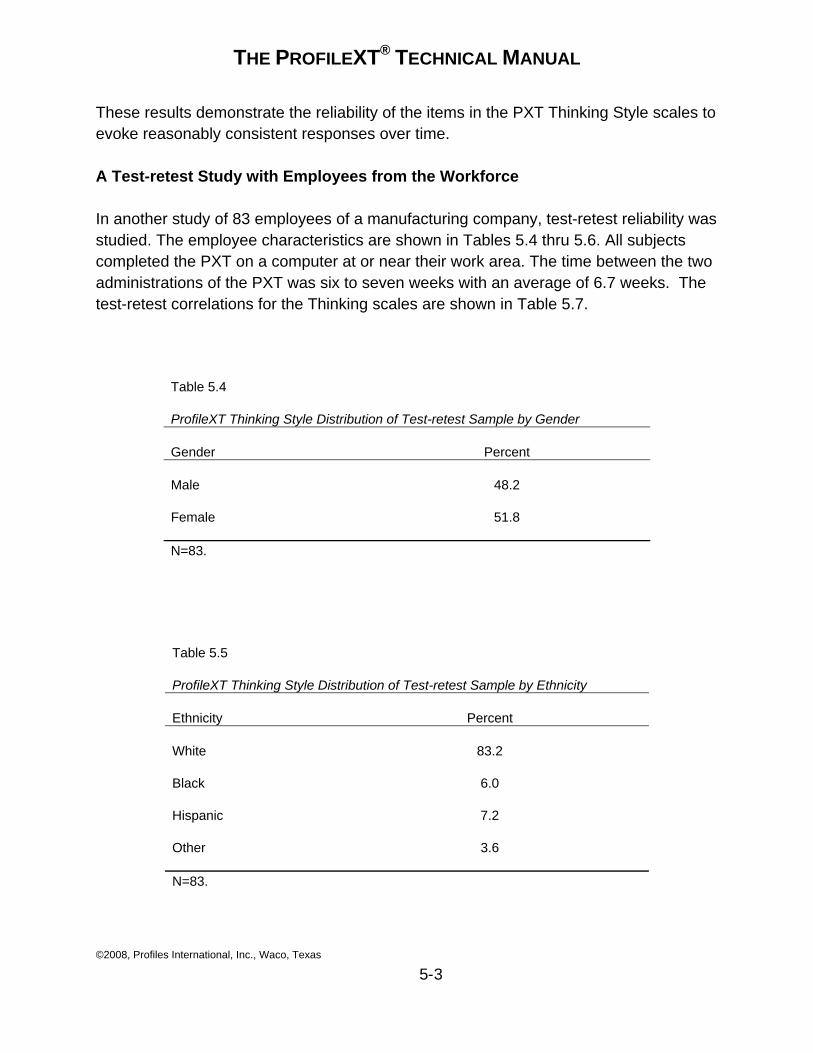
THE PROFILEXT® TECHNICAL MANUAL
©2008, Profiles International, Inc., Waco, Texas
5-3
These results demonstrate the reliability of the items in the PXT Thinking Style scales to evoke reasonably consistent responses over time.
A Test-retest Study with Employees from the Workforce
In another study of 83 employees of a manufacturing company, test-retest reliability was studied. The employee characteristics are shown in Tables 5.4 thru 5.6. All subjects completed the PXT on a computer at or near their work area. The time between the two administrations of the PXT was six to seven weeks with an average of 6.7 weeks. The test-retest correlations for the Thinking scales are shown in Table 5.7.
Table 5.4 ProfileXT Thinking Style Distribution of Test-retest Sample by Gender Gender Percent Male 48.2 Female 51.8 N=83.
Table 5.5 ProfileXT Thinking Style Distribution of Test-retest Sample by Ethnicity Ethnicity Percent White 83.2 Black 6.0 Hispanic 7.2 Other 3.6 N=83.
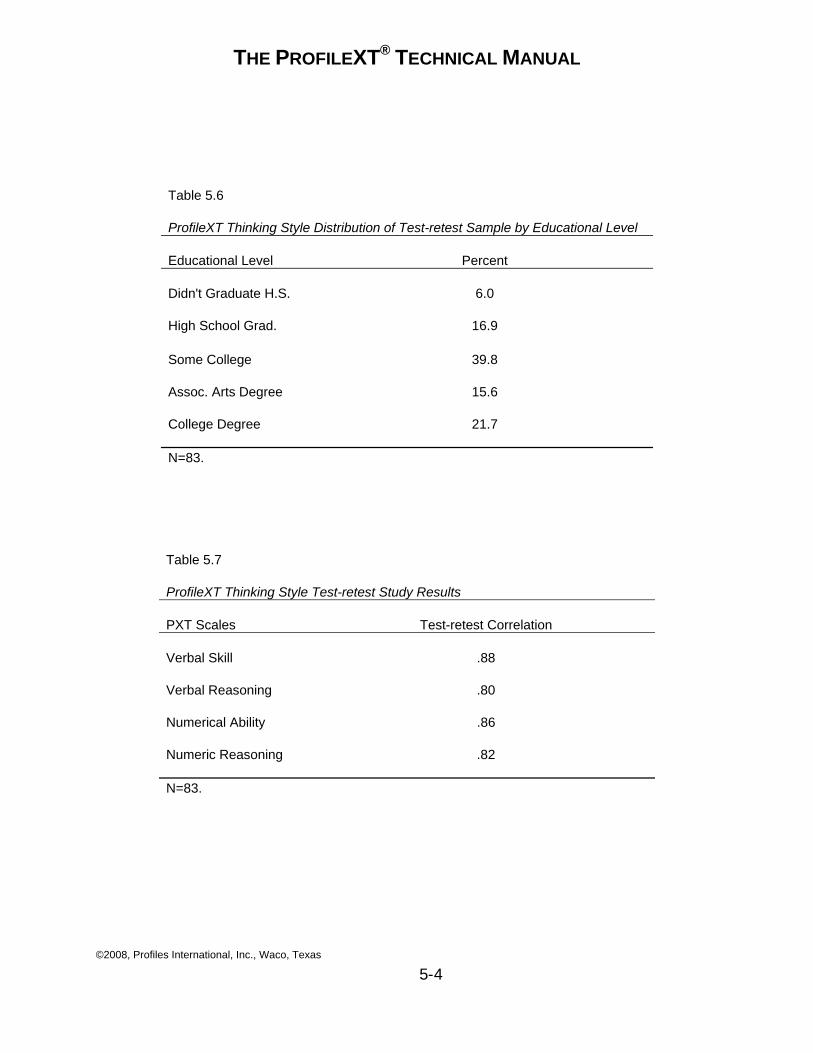
THE PROFILEXT® TECHNICAL MANUAL
©2008, Profiles International, Inc., Waco, Texas
5-4
Table 5.6 ProfileXT Thinking Style Distribution of Test-retest Sample by Educational Level Educational Level Percent Didn't Graduate H.S. 6.0 High School Grad. 16.9 Some College 39.8 Assoc. Arts Degree 15.6 College Degree 21.7 N=83.
Table 5.7 ProfileXT Thinking Style Test-retest Study Results PXT Scales Test-retest Correlation Verbal Skill .88 Verbal Reasoning .80 Numerical Ability .86 Numeric Reasoning .82 N=83.
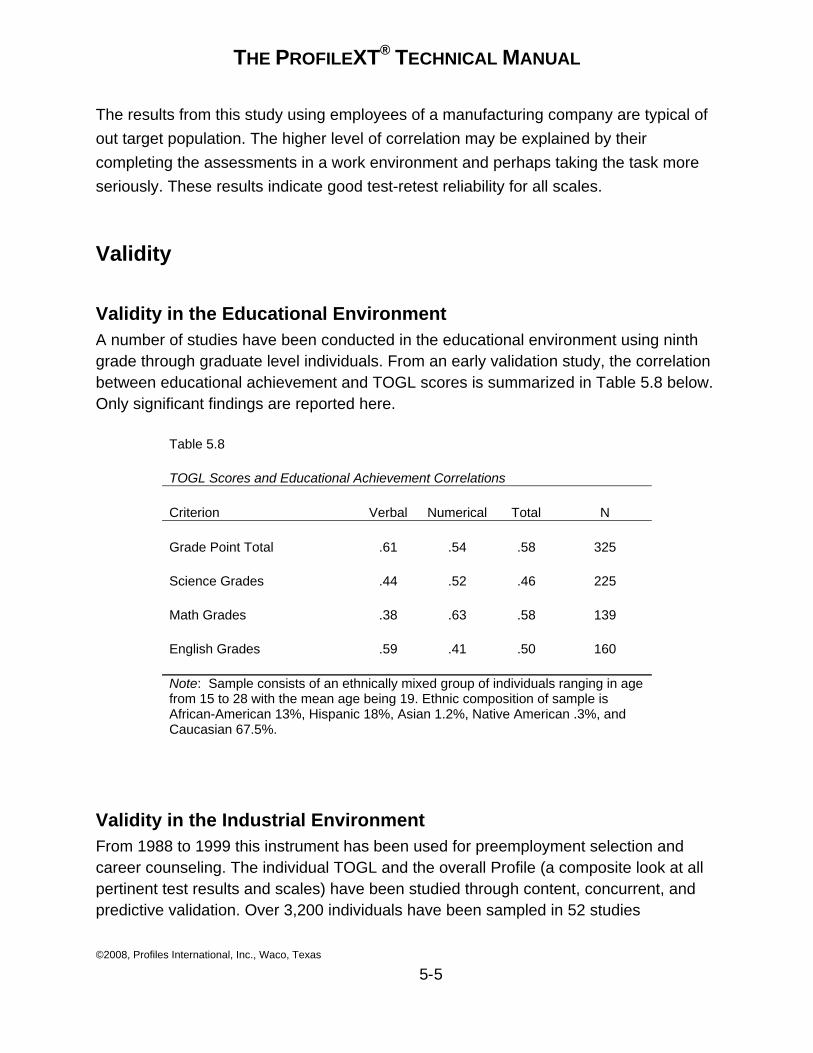
THE PROFILEXT® TECHNICAL MANUAL
©2008, Profiles International, Inc., Waco, Texas
5-5
The results from this study using employees of a manufacturing company are typical of out target population. The higher level of correlation may be explained by their completing the assessments in a work environment and perhaps taking the task more seriously. These results indicate good test-retest reliability for all scales.
Validity
Validity in the Educational Environment A number of studies have been conducted in the educational environment using ninth grade through graduate level individuals. From an early validation study, the correlation between educational achievement and TOGL scores is summarized in Table 5.8 below. Only significant findings are reported here.
Table 5.8 TOGL Scores and Educational Achievement Correlations Criterion Verbal Numerical Total N Grade Point Total .61 .54 .58 325 Science Grades .44 .52 .46 225 Math Grades .38 .63 .58 139 English Grades .59 .41 .50 160 Note: Sample consists of an ethnically mixed group of individuals ranging in age from 15 to 28 with the mean age being 19. Ethnic composition of sample is African-American 13%, Hispanic 18%, Asian 1.2%, Native American .3%, and Caucasian 67.5%.
Validity in the Industrial Environment From 1988 to 1999 this instrument has been used for preemployment selection and career counseling. The individual TOGL and the overall Profile (a composite look at all pertinent test results and scales) have been studied through content, concurrent, and predictive validation. Over 3,200 individuals have been sampled in 52 studies
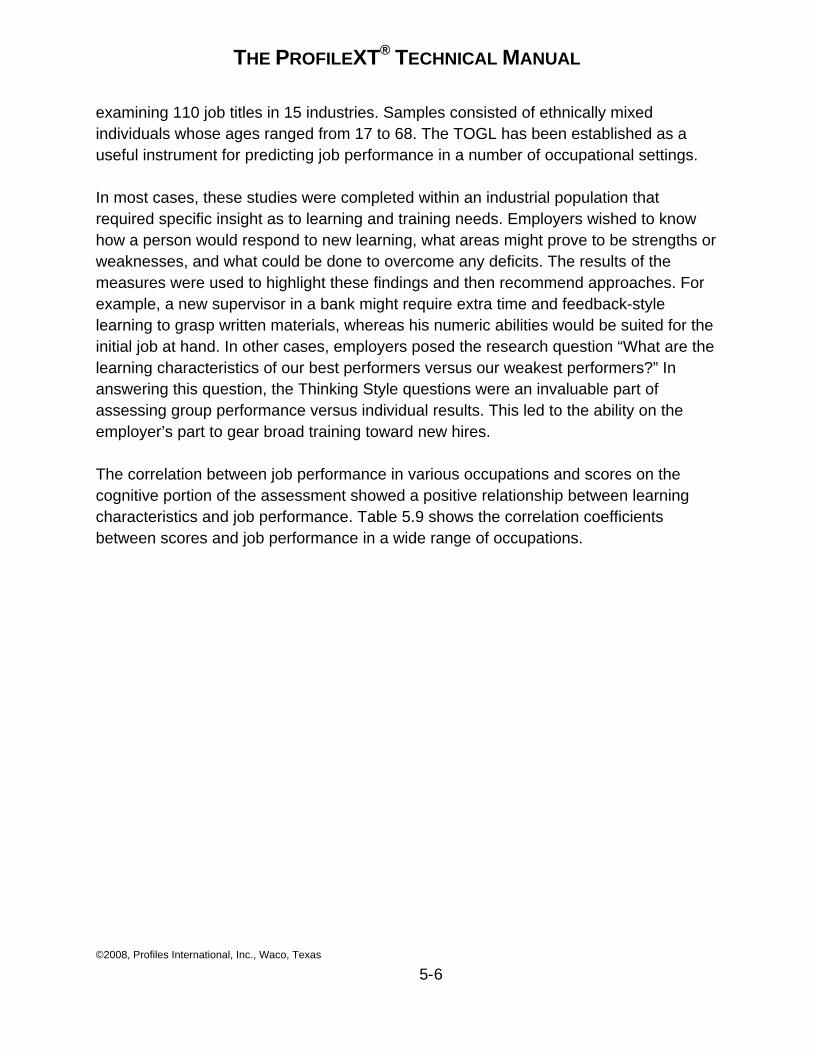
THE PROFILEXT® TECHNICAL MANUAL
©2008, Profiles International, Inc., Waco, Texas
5-6
examining 110 job titles in 15 industries. Samples consisted of ethnically mixed individuals whose ages ranged from 17 to 68. The TOGL has been established as a useful instrument for predicting job performance in a number of occupational settings.
In most cases, these studies were completed within an industrial population that required specific insight as to learning and training needs. Employers wished to know how a person would respond to new learning, what areas might prove to be strengths or weaknesses, and what could be done to overcome any deficits. The results of the measures were used to highlight these findings and then recommend approaches. For example, a new supervisor in a bank might require extra time and feedback-style learning to grasp written materials, whereas his numeric abilities would be suited for the initial job at hand. In other cases, employers posed the research question “What are the learning characteristics of our best performers versus our weakest performers?” In answering this question, the Thinking Style questions were an invaluable part of assessing group performance versus individual results. This led to the ability on the employer’s part to gear broad training toward new hires.
The correlation between job performance in various occupations and scores on the cognitive portion of the assessment showed a positive relationship between learning characteristics and job performance. Table 5.9 shows the correlation coefficients between scores and job performance in a wide range of occupations.
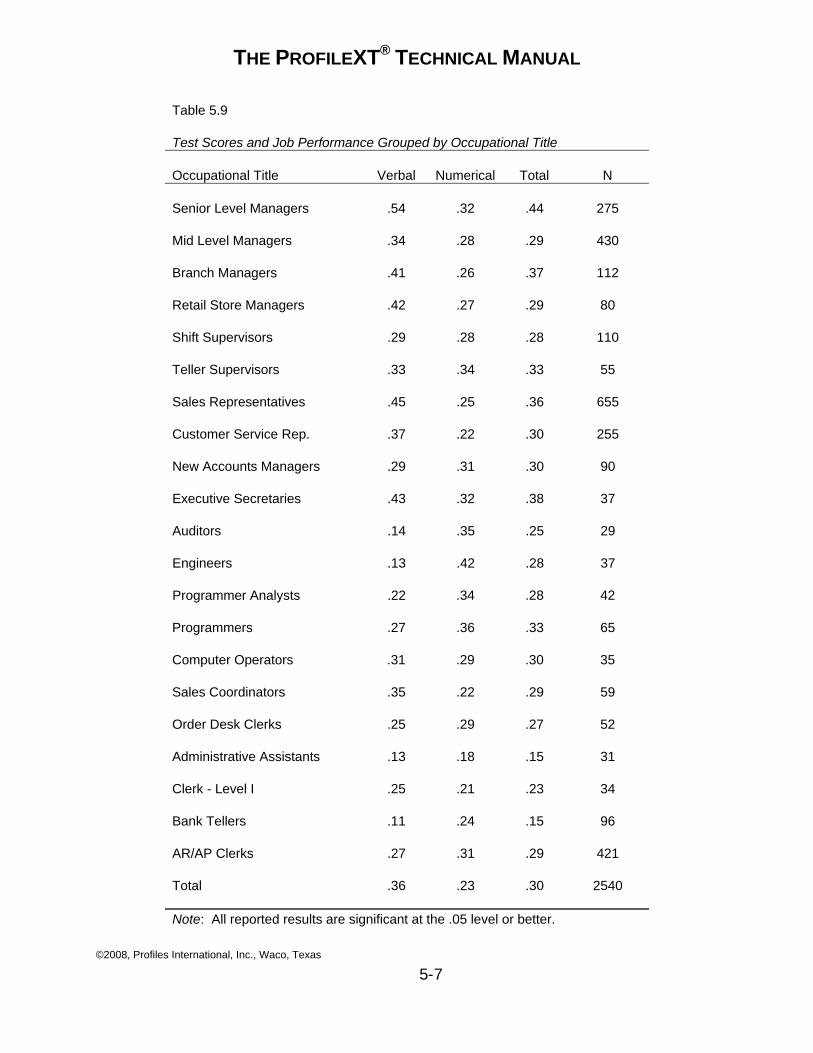
THE PROFILEXT® TECHNICAL MANUAL
©2008, Profiles International, Inc., Waco, Texas
5-7
Table 5.9 Test Scores and Job Performance Grouped by Occupational Title Occupational Title Verbal Numerical Total N Senior Level Managers .54 .32 .44 275 Mid Level Managers .34 .28 .29 430 Branch Managers .41 .26 .37 112 Retail Store Managers .42 .27 .29 80 Shift Supervisors .29 .28 .28 110 Teller Supervisors .33 .34 .33 55 Sales Representatives .45 .25 .36 655 Customer Service Rep. .37 .22 .30 255 New Accounts Managers .29 .31 .30 90 Executive Secretaries .43 .32 .38 37 Auditors .14 .35 .25 29 Engineers .13 .42 .28 37 Programmer Analysts .22 .34 .28 42 Programmers .27 .36 .33 65 Computer Operators .31 .29 .30 35 Sales Coordinators .35 .22 .29 59 Order Desk Clerks .25 .29 .27 52 Administrative Assistants .13 .18 .15 31 Clerk - Level I .25 .21 .23 34 Bank Tellers .11 .24 .15 96 AR/AP Clerks .27 .31 .29 421 Total .36 .23 .30 2540 Note: All reported results are significant at the .05 level or better.
THE PROFILEXT® TECHNICAL MANUAL
©2008, Profiles International, Inc., Waco, Texas
5-8
Meta-analysis of the Predictive Utility of Thinking Style Percent Matches
A meta-analysis is a statistical technique in which the results of a large number of independent but related studies are combined to determine the average effect of a particular treatment or intervention. This technique has been found particularly useful when a researcher is faced with resolving contradictory research findings or for calculating outcomes for small sample sizes that lack the statistical power to produce significant findings. This is the main advantage of meta-analysis. In effect, the samples are pooled to create a larger sample. As a statistical given, the larger the sample, the greater the trust in the results.
The data for this analysis is the product of case studies provided by the Profiles International, Inc. Client Services Department. In each of these studies the participant’s performance was evaluated by the organization to which they belonged and then administered the ProfileXT. An individual pattern was built for each position in the study using actual performance results and relevant job performance measures (for more information on building patterns see Chapter 1) resulting in a Job Match Percent. A correlational relationship between the Thinking Styles Job Match Percents of the Top and Bottom Performers and their performance rating was then calculated for each study. Using the Hunter and Schmidt Method (Hunter and Schmidt, 2004) the correlations of each individual study were weighted by the sample size, summed and then divided by the number of participants across all samples.
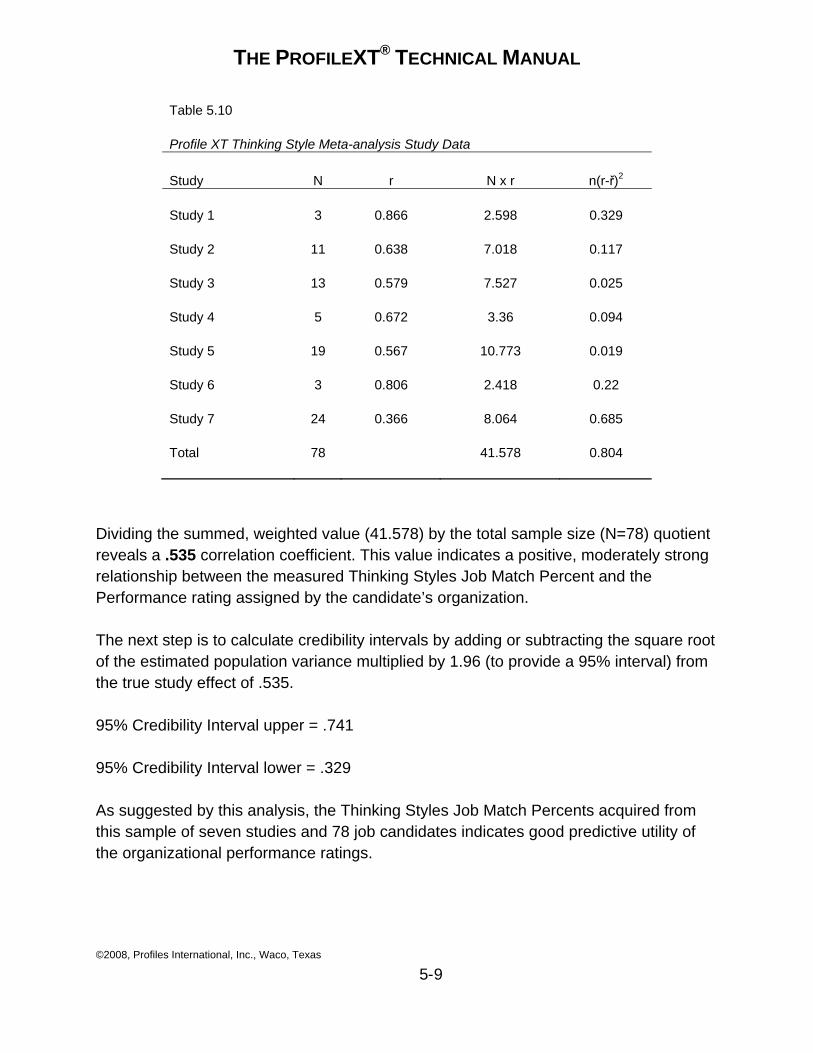
THE PROFILEXT® TECHNICAL MANUAL
©2008, Profiles International, Inc., Waco, Texas
5-9
Table 5.10 Profile XT Thinking Style Meta-analysis Study Data Study N r N x r n(r-ř)2 Study 1 3 0.866 2.598 0.329 Study 2 11 0.638 7.018 0.117 Study 3 13 0.579 7.527 0.025 Study 4 5 0.672 3.36 0.094 Study 5 19 0.567 10.773 0.019 Study 6 3 0.806 2.418 0.22 Study 7 24 0.366 8.064 0.685 Total 78 41.578 0.804
Dividing the summed, weighted value (41.578) by the total sample size (N=78) quotient reveals a .535 correlation coefficient. This value indicates a positive, moderately strong relationship between the measured Thinking Styles Job Match Percent and the Performance rating assigned by the candidate’s organization.
The next step is to calculate credibility intervals by adding or subtracting the square root of the estimated population variance multiplied by 1.96 (to provide a 95% interval) from the true study effect of .535.
95% Credibility Interval upper = .741
95% Credibility Interval lower = .329
As suggested by this analysis, the Thinking Styles Job Match Percents acquired from this sample of seven studies and 78 job candidates indicates good predictive utility of the organizational performance ratings.
THE PROFILEXT® TECHNICAL MANUAL
©2008, Profiles International, Inc., Waco, Texas
5-10
Refinement of the Two Learning Scales to Four Scales
While the two scale approach had demonstrated its effectiveness in selection, a decision was made to separate the abstract, or reasoning, portion of each scale from the ability portion. This was done to provide greater analysis of the cognitive characteristics of those completing the assessment.
To refine the identification of different aspects of both numerical and verbal abilities, Numerical and Verbal were sub-divided into two scales. The result was the four scales currently in use: Verbal Skill, Verbal Reasoning, Numerical Ability, and Numeric Reasoning.
A group of professionals in assessment development reviewed the 42 items on each original scale and sorted them into groups measuring either ability or skill, and a more abstract set called reasoning. Additional items were added to broaden the scope of the item content.
This new question set was submitted to a group of 137 employees at three different companies. They ranged in age from 19 to 57, education from High School to Graduate degree, and were 54% female. Item analysis of the results was used to select the items for use on each scale. This resulted in the following distribution of the 77 items selected: Verbal Skill-18, Verbal Reasoning-20, Numerical Ability-22, and Numeric Reasoning-17.
Adverse Impact
Profiles International, Inc. conducted a study to investigate the effects of gender and ethnicity on the results of the Thinking Styles section. The subjects included over 200,000 adults from various sales, support, and management backgrounds. All scores were acquired from the working population in a variety of industries and corporate settings across the United States. The sample represented a diversity of males, females, Asians, African Americans, Hispanics, and Caucasians.
Raw Score Differences In our sample, 155,082 subjects volunteered ethnic demographic information. The distribution of ethnicity in the sample is represented in Table 5.11 and provides the frequencies of each ethnic group and percentages of the total sample population.
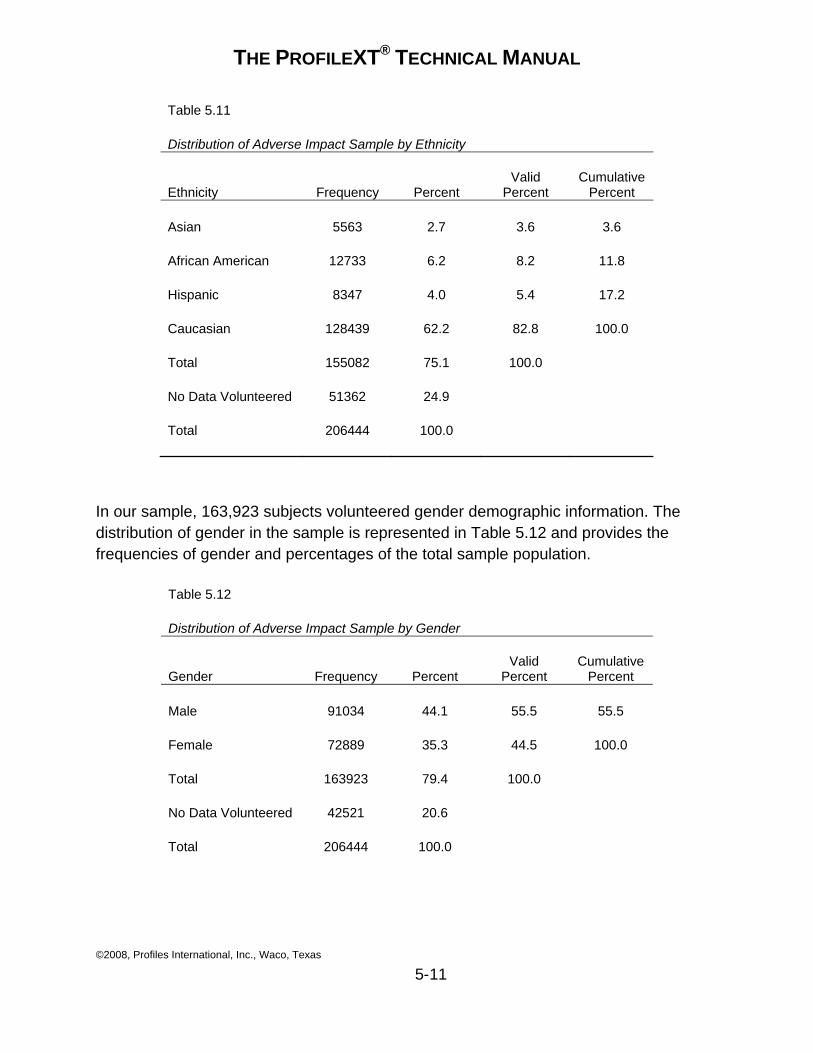
THE PROFILEXT® TECHNICAL MANUAL
©2008, Profiles International, Inc., Waco, Texas
5-11
Table 5.11 Distribution of Adverse Impact Sample by Ethnicity
Ethnicity Frequency Percent Valid
Percent Cumulative
Percent Asian 5563 2.7 3.6 3.6 African American 12733 6.2 8.2 11.8 Hispanic 8347 4.0 5.4 17.2 Caucasian 128439 62.2 82.8 100.0 Total 155082 75.1 100.0 No Data Volunteered 51362 24.9 Total 206444 100.0
In our sample, 163,923 subjects volunteered gender demographic information. The distribution of gender in the sample is represented in Table 5.12 and provides the frequencies of gender and percentages of the total sample population.
Table 5.12 Distribution of Adverse Impact Sample by Gender
Gender Frequency Percent Valid
Percent Cumulative
Percent Male 91034 44.1 55.5 55.5 Female 72889 35.3 44.5 100.0 Total 163923 79.4 100.0 No Data Volunteered 42521 20.6 Total 206444 100.0
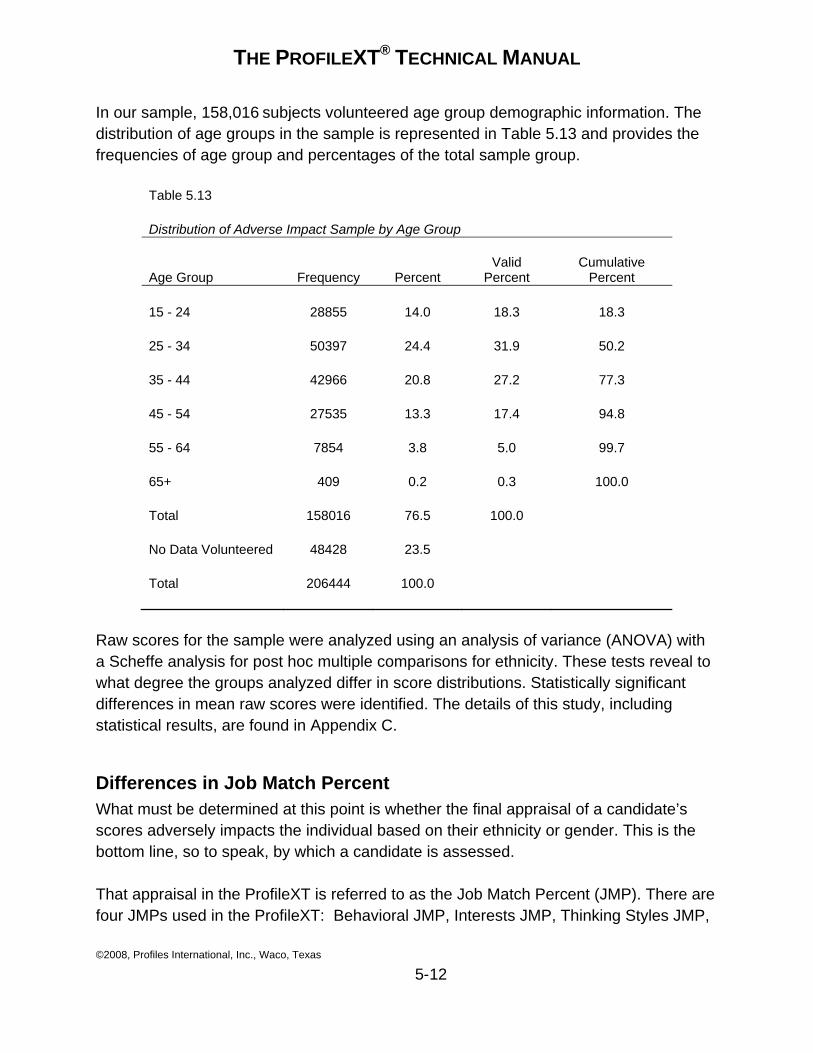
THE PROFILEXT® TECHNICAL MANUAL
©2008, Profiles International, Inc., Waco, Texas
5-12
In our sample, 158,016 subjects volunteered age group demographic information. The distribution of age groups in the sample is represented in Table 5.13 and provides the frequencies of age group and percentages of the total sample group.
Table 5.13 Distribution of Adverse Impact Sample by Age Group
Age Group Frequency Percent Valid
Percent Cumulative
Percent 15 - 24 28855 14.0 18.3 18.3 25 - 34 50397 24.4 31.9 50.2 35 - 44 42966 20.8 27.2 77.3 45 - 54 27535 13.3 17.4 94.8 55 - 64 7854 3.8 5.0 99.7 65+ 409 0.2 0.3 100.0 Total 158016 76.5 100.0 No Data Volunteered 48428 23.5 Total 206444 100.0
Raw scores for the sample were analyzed using an analysis of variance (ANOVA) with a Scheffe analysis for post hoc multiple comparisons for ethnicity. These tests reveal to what degree the groups analyzed differ in score distributions. Statistically significant differences in mean raw scores were identified. The details of this study, including statistical results, are found in Appendix C.
Differences in Job Match Percent What must be determined at this point is whether the final appraisal of a candidate’s scores adversely impacts the individual based on their ethnicity or gender. This is the bottom line, so to speak, by which a candidate is assessed.
That appraisal in the ProfileXT is referred to as the Job Match Percent (JMP). There are four JMPs used in the ProfileXT: Behavioral JMP, Interests JMP, Thinking Styles JMP,
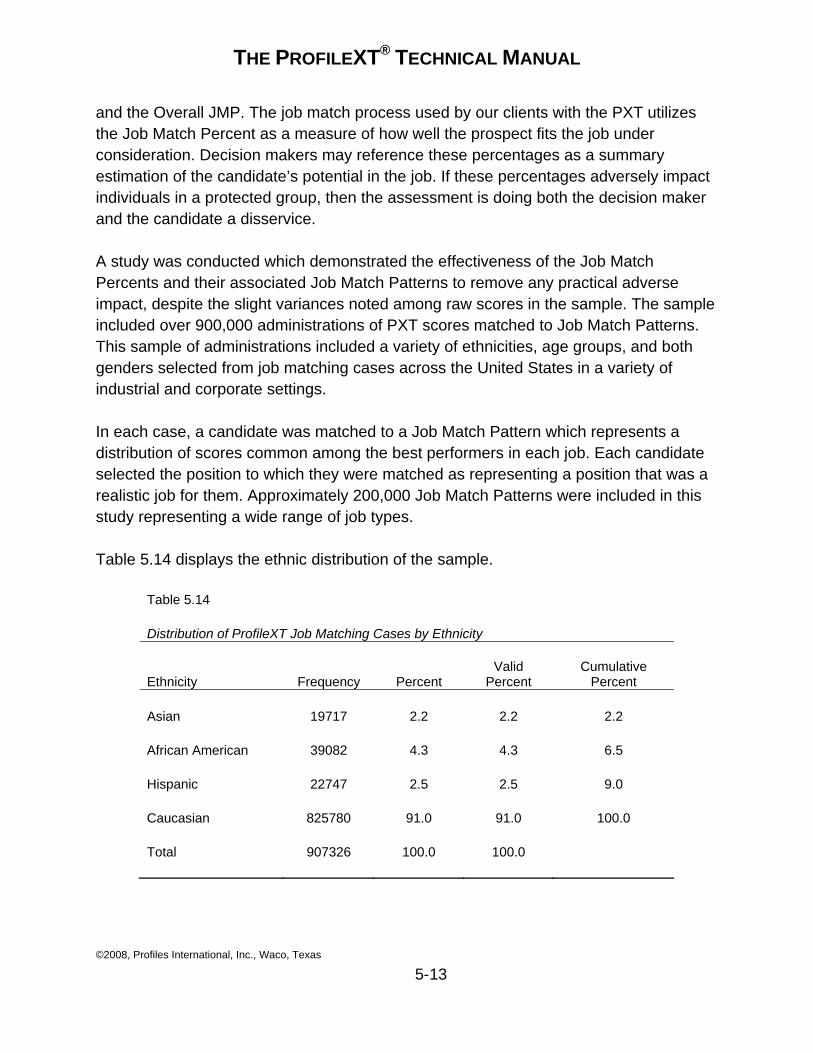
THE PROFILEXT® TECHNICAL MANUAL
©2008, Profiles International, Inc., Waco, Texas
5-13
and the Overall JMP. The job match process used by our clients with the PXT utilizes the Job Match Percent as a measure of how well the prospect fits the job under consideration. Decision makers may reference these percentages as a summary estimation of the candidate’s potential in the job. If these percentages adversely impact individuals in a protected group, then the assessment is doing both the decision maker and the candidate a disservice.
A study was conducted which demonstrated the effectiveness of the Job Match Percents and their associated Job Match Patterns to remove any practical adverse impact, despite the slight variances noted among raw scores in the sample. The sample included over 900,000 administrations of PXT scores matched to Job Match Patterns. This sample of administrations included a variety of ethnicities, age groups, and both genders selected from job matching cases across the United States in a variety of industrial and corporate settings.
In each case, a candidate was matched to a Job Match Pattern which represents a distribution of scores common among the best performers in each job. Each candidate selected the position to which they were matched as representing a position that was a realistic job for them. Approximately 200,000 Job Match Patterns were included in this study representing a wide range of job types.
Table 5.14 displays the ethnic distribution of the sample.
Table 5.14 Distribution of ProfileXT Job Matching Cases by Ethnicity
Ethnicity Frequency Percent Valid
Percent Cumulative
Percent Asian 19717 2.2 2.2 2.2 African American 39082 4.3 4.3 6.5 Hispanic 22747 2.5 2.5 9.0 Caucasian 825780 91.0 91.0 100.0 Total 907326 100.0 100.0
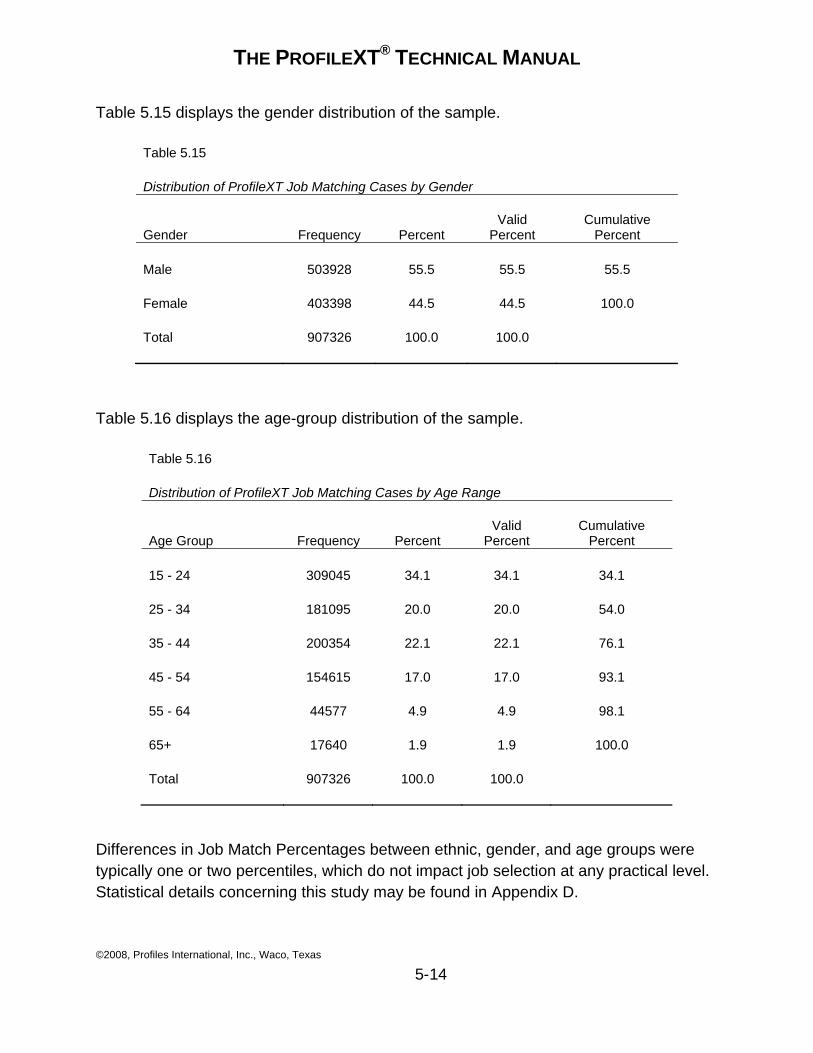
THE PROFILEXT® TECHNICAL MANUAL
©2008, Profiles International, Inc., Waco, Texas
5-14
Table 5.15 displays the gender distribution of the sample.
Table 5.15 Distribution of ProfileXT Job Matching Cases by Gender
Gender Frequency Percent Valid
Percent Cumulative
Percent Male 503928 55.5 55.5 55.5 Female 403398 44.5 44.5 100.0 Total 907326 100.0 100.0
Table 5.16 displays the age-group distribution of the sample.
Table 5.16 Distribution of ProfileXT Job Matching Cases by Age Range
Age Group Frequency Percent Valid
Percent Cumulative
Percent 15 - 24 309045 34.1 34.1 34.1 25 - 34 181095 20.0 20.0 54.0 35 - 44 200354 22.1 22.1 76.1 45 - 54 154615 17.0 17.0 93.1 55 - 64 44577 4.9 4.9 98.1 65+ 17640 1.9 1.9 100.0 Total 907326 100.0 100.0
Differences in Job Match Percentages between ethnic, gender, and age groups were typically one or two percentiles, which do not impact job selection at any practical level. Statistical details concerning this study may be found in Appendix D.
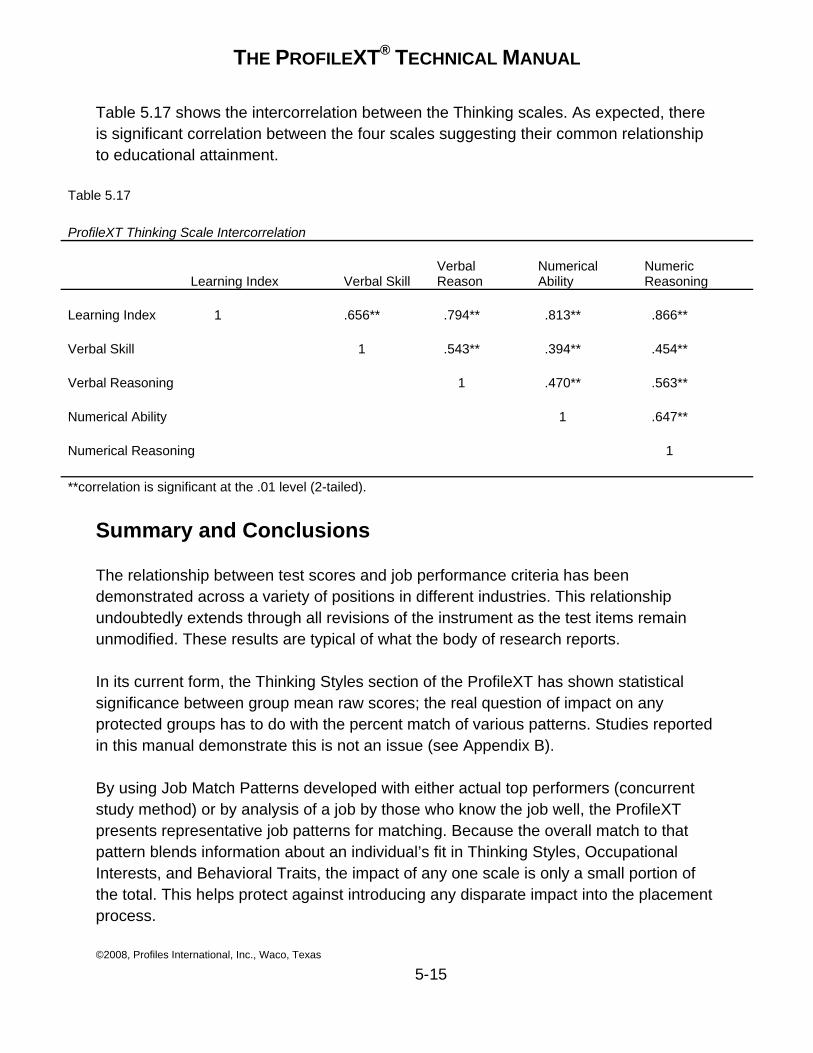
THE PROFILEXT® TECHNICAL MANUAL
©2008, Profiles International, Inc., Waco, Texas
5-15
Table 5.17 shows the intercorrelation between the Thinking scales. As expected, there is significant correlation between the four scales suggesting their common relationship to educational attainment.
Table 5.17 ProfileXT Thinking Scale Intercorrelation
Learning Index Verbal Skill Verbal Reason
Numerical Ability
Numeric Reasoning
Learning Index 1 .656** .794** .813** .866** Verbal Skill 1 .543** .394** .454** Verbal Reasoning 1 .470** .563** Numerical Ability 1 .647** Numerical Reasoning 1 **correlation is significant at the .01 level (2-tailed).
Summary and Conclusions
The relationship between test scores and job performance criteria has been demonstrated across a variety of positions in different industries. This relationship undoubtedly extends through all revisions of the instrument as the test items remain unmodified. These results are typical of what the body of research reports.
In its current form, the Thinking Styles section of the ProfileXT has shown statistical significance between group mean raw scores; the real question of impact on any protected groups has to do with the percent match of various patterns. Studies reported in this manual demonstrate this is not an issue (see Appendix B).
By using Job Match Patterns developed with either actual top performers (concurrent study method) or by analysis of a job by those who know the job well, the ProfileXT presents representative job patterns for matching. Because the overall match to that pattern blends information about an individual’s fit in Thinking Styles, Occupational Interests, and Behavioral Traits, the impact of any one scale is only a small portion of the total. This helps protect against introducing any disparate impact into the placement process.
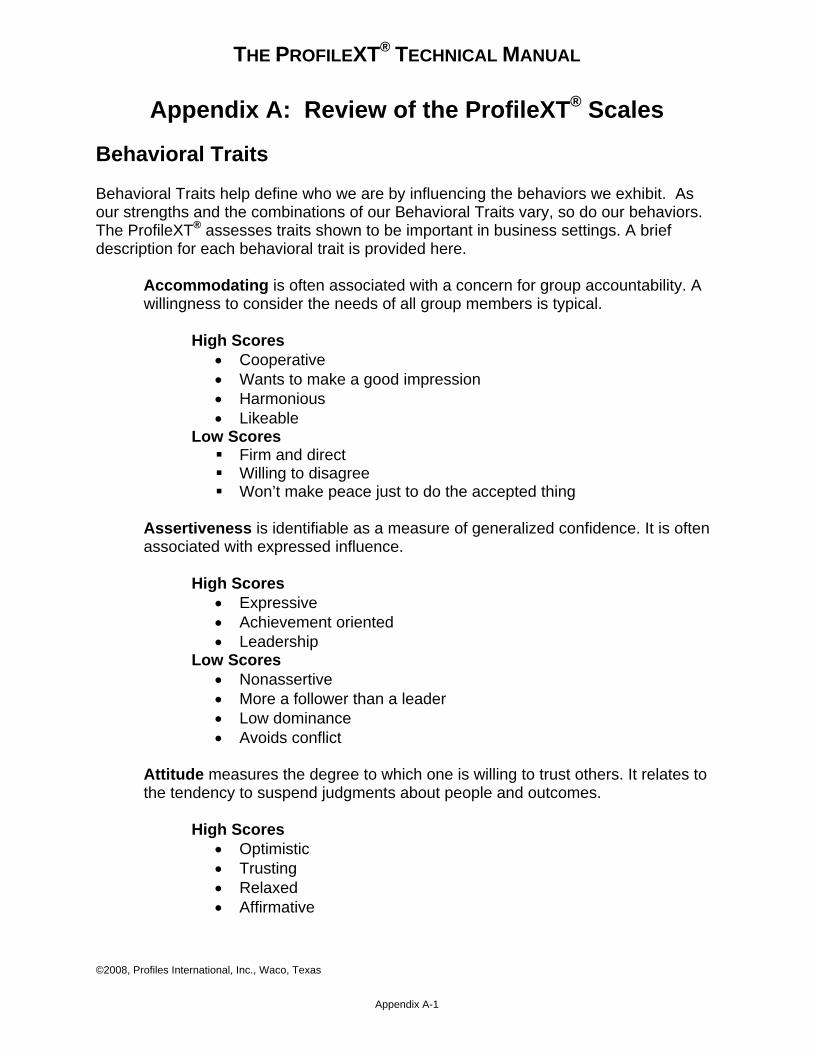
THE PROFILEXT® TECHNICAL MANUAL
Appendix A: Review of the ProfileXT® Scales Behavioral Traits Behavioral Traits help define who we are by influencing the behaviors we exhibit. As our strengths and the combinations of our Behavioral Traits vary, so do our behaviors. The ProfileXT® assesses traits shown to be important in business settings. A brief description for each behavioral trait is provided here.
Accommodating is often associated with a concern for group accountability. A willingness to consider the needs of all group members is typical.
High Scores • Cooperative • Wants to make a good impression • Harmonious • Likeable
Low Scores Firm and direct Willing to disagree Won’t make peace just to do the accepted thing
Assertiveness is identifiable as a measure of generalized confidence. It is often associated with expressed influence.
High Scores • Expressive • Achievement oriented • Leadership
Low Scores • Nonassertive • More a follower than a leader • Low dominance • Avoids conflict
Attitude measures the degree to which one is willing to trust others. It relates to the tendency to suspend judgments about people and outcomes.
High Scores • Optimistic • Trusting • Relaxed • Affirmative
©2008, Profiles International, Inc., Waco, Texas
Appendix A-1
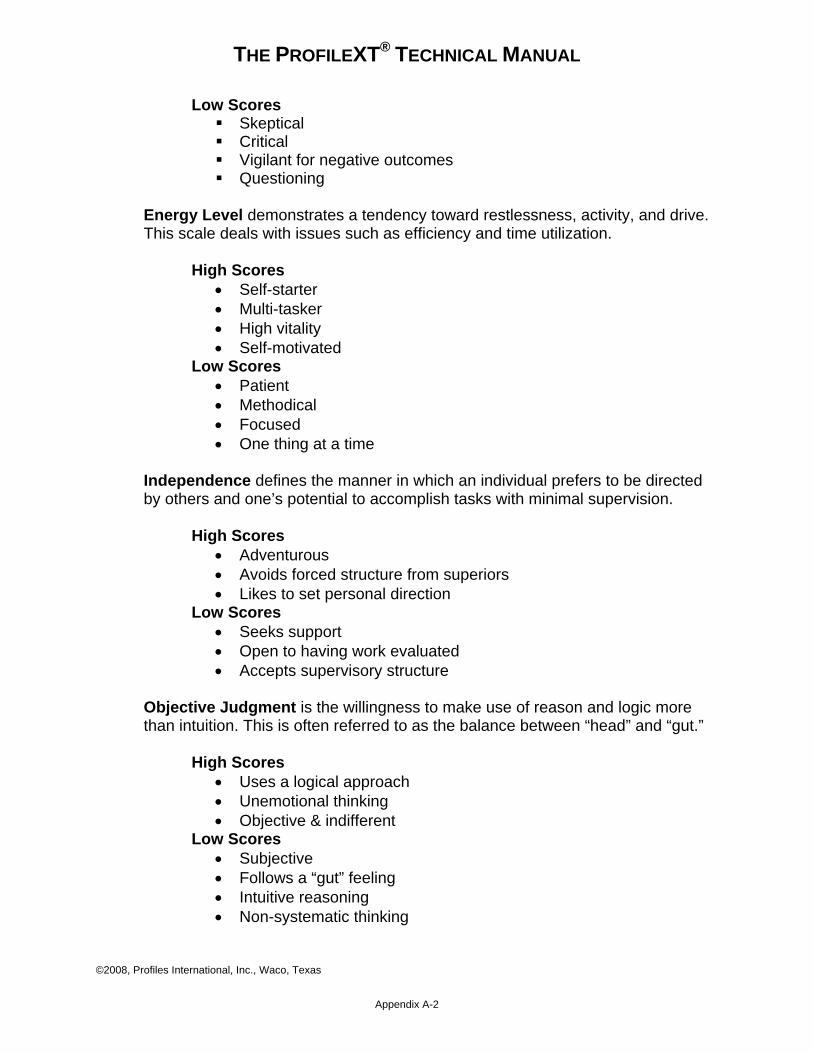
THE PROFILEXT® TECHNICAL MANUAL
Low Scores Skeptical Critical Vigilant for negative outcomes Questioning
Energy Level demonstrates a tendency toward restlessness, activity, and drive. This scale deals with issues such as efficiency and time utilization.
High Scores • Self-starter • Multi-tasker • High vitality • Self-motivated
Low Scores • Patient • Methodical • Focused • One thing at a time
Independence defines the manner in which an individual prefers to be directed by others and one’s potential to accomplish tasks with minimal supervision.
High Scores • Adventurous • Avoids forced structure from superiors • Likes to set personal direction
Low Scores • Seeks support • Open to having work evaluated • Accepts supervisory structure
Objective Judgment is the willingness to make use of reason and logic more than intuition. This is often referred to as the balance between “head” and “gut.”
High Scores • Uses a logical approach • Unemotional thinking • Objective & indifferent
Low Scores • Subjective • Follows a “gut” feeling • Intuitive reasoning • Non-systematic thinking
©2008, Profiles International, Inc., Waco, Texas
Appendix A-2
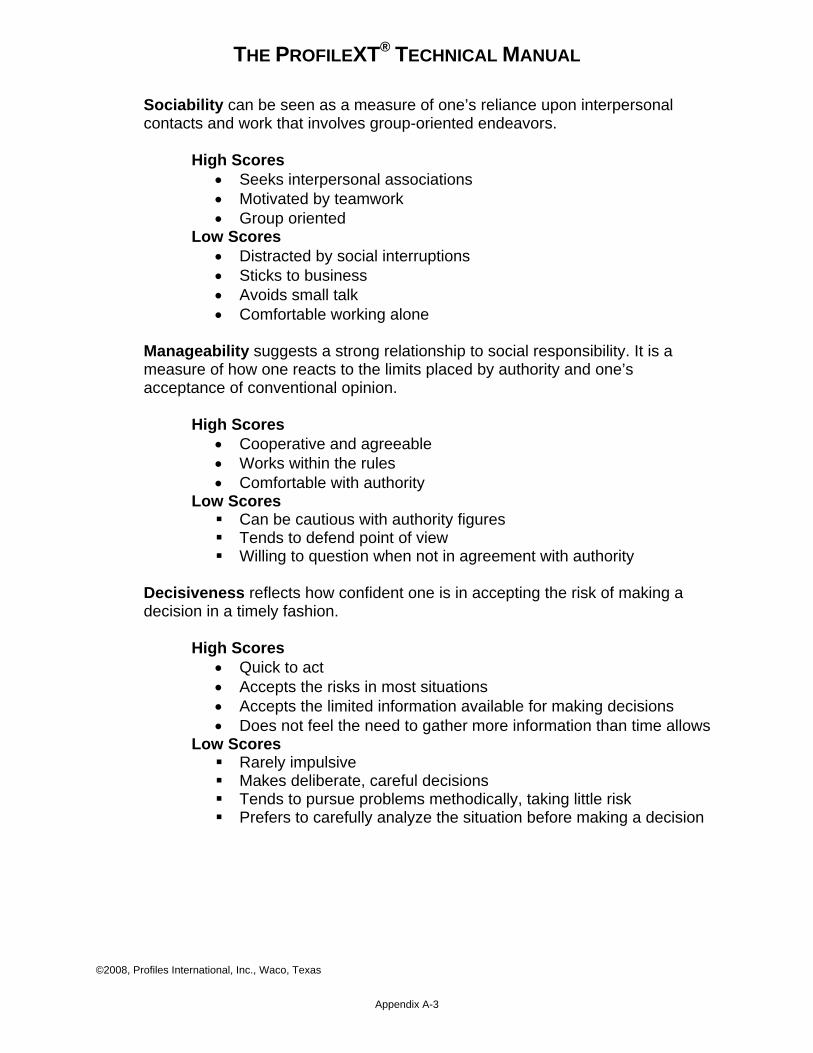
THE PROFILEXT® TECHNICAL MANUAL
Sociability can be seen as a measure of one’s reliance upon interpersonal contacts and work that involves group-oriented endeavors.
High Scores • Seeks interpersonal associations • Motivated by teamwork • Group oriented
Low Scores • Distracted by social interruptions • Sticks to business • Avoids small talk • Comfortable working alone
Manageability suggests a strong relationship to social responsibility. It is a measure of how one reacts to the limits placed by authority and one’s acceptance of conventional opinion.
High Scores • Cooperative and agreeable • Works within the rules • Comfortable with authority
Low Scores Can be cautious with authority figures Tends to defend point of view Willing to question when not in agreement with authority
Decisiveness reflects how confident one is in accepting the risk of making a decision in a timely fashion.
High Scores • Quick to act • Accepts the risks in most situations • Accepts the limited information available for making decisions • Does not feel the need to gather more information than time allows
Low Scores Rarely impulsive Makes deliberate, careful decisions Tends to pursue problems methodically, taking little risk Prefers to carefully analyze the situation before making a decision
©2008, Profiles International, Inc., Waco, Texas
Appendix A-3
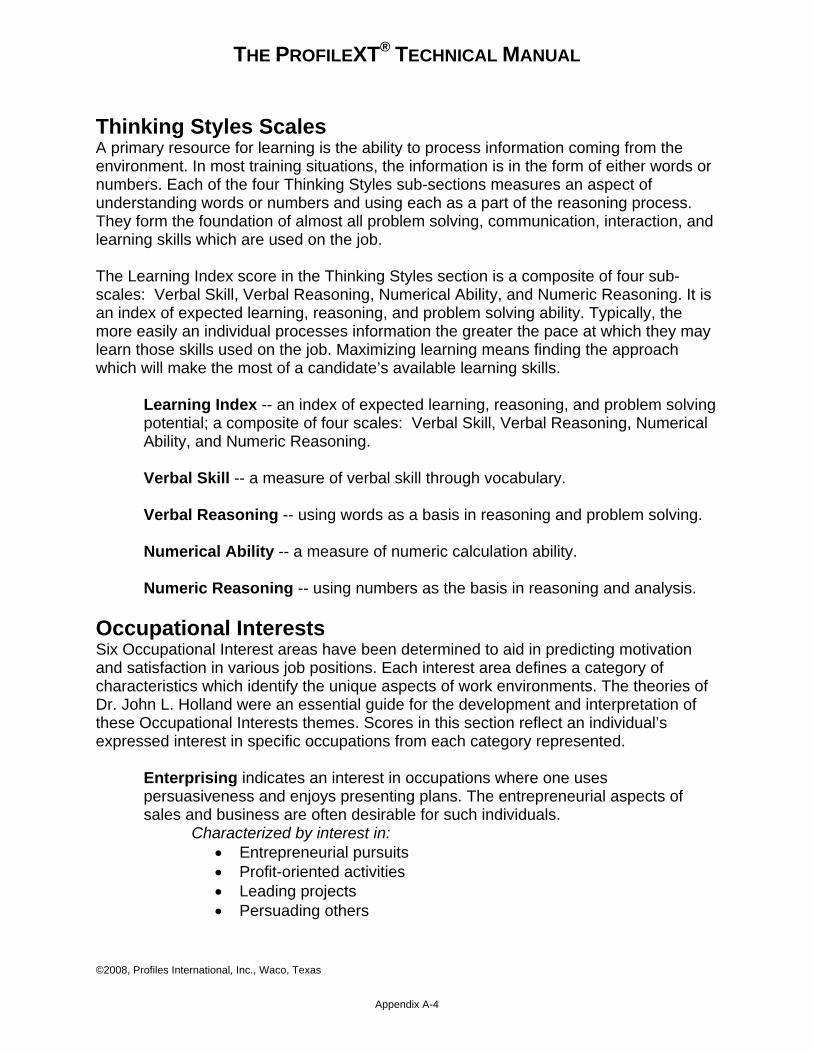
THE PROFILEXT® TECHNICAL MANUAL
Thinking Styles Scales A primary resource for learning is the ability to process information coming from the environment. In most training situations, the information is in the form of either words or numbers. Each of the four Thinking Styles sub-sections measures an aspect of understanding words or numbers and using each as a part of the reasoning process. They form the foundation of almost all problem solving, communication, interaction, and learning skills which are used on the job. The Learning Index score in the Thinking Styles section is a composite of four sub-scales: Verbal Skill, Verbal Reasoning, Numerical Ability, and Numeric Reasoning. It is an index of expected learning, reasoning, and problem solving ability. Typically, the more easily an individual processes information the greater the pace at which they may learn those skills used on the job. Maximizing learning means finding the approach which will make the most of a candidate’s available learning skills.
Learning Index -- an index of expected learning, reasoning, and problem solving potential; a composite of four scales: Verbal Skill, Verbal Reasoning, Numerical Ability, and Numeric Reasoning.
Verbal Skill -- a measure of verbal skill through vocabulary.
Verbal Reasoning -- using words as a basis in reasoning and problem solving.
Numerical Ability -- a measure of numeric calculation ability.
Numeric Reasoning -- using numbers as the basis in reasoning and analysis.
Occupational Interests Six Occupational Interest areas have been determined to aid in predicting motivation and satisfaction in various job positions. Each interest area defines a category of characteristics which identify the unique aspects of work environments. The theories of Dr. John L. Holland were an essential guide for the development and interpretation of these Occupational Interests themes. Scores in this section reflect an individual’s expressed interest in specific occupations from each category represented.
Enterprising indicates an interest in occupations where one uses persuasiveness and enjoys presenting plans. The entrepreneurial aspects of sales and business are often desirable for such individuals.
Characterized by interest in: • Entrepreneurial pursuits • Profit-oriented activities • Leading projects • Persuading others
©2008, Profiles International, Inc., Waco, Texas
Appendix A-4
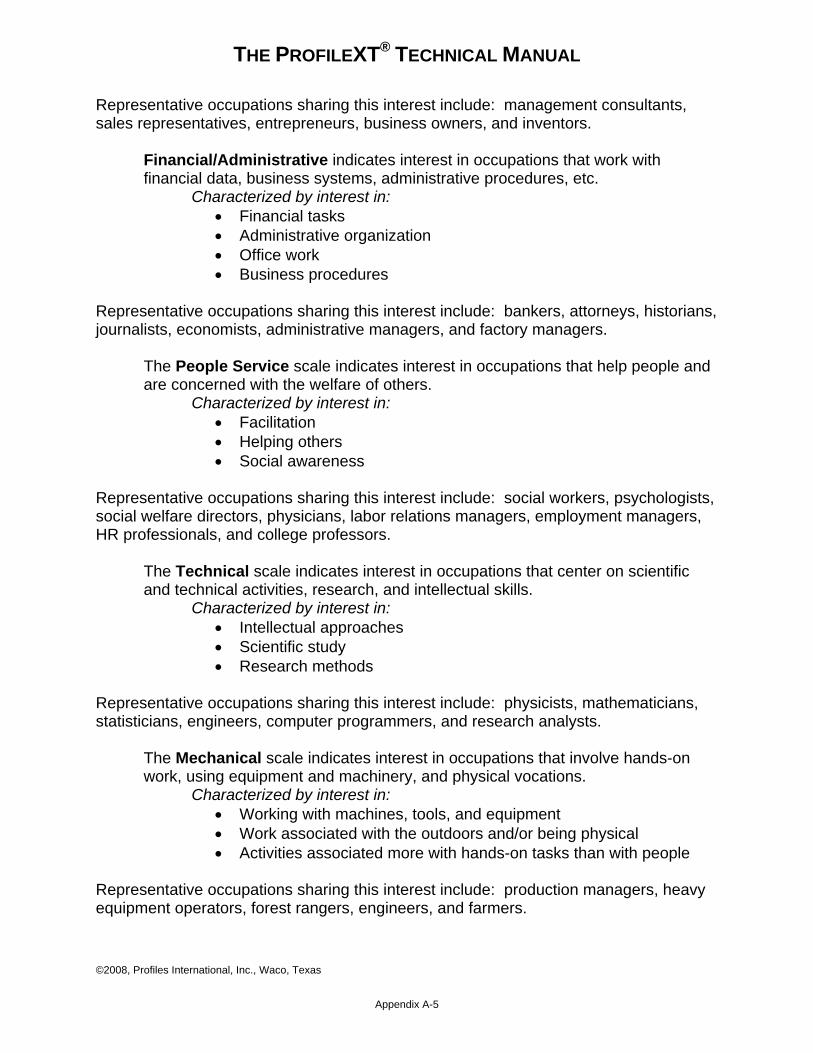
THE PROFILEXT® TECHNICAL MANUAL
Representative occupations sharing this interest include: management consultants, sales representatives, entrepreneurs, business owners, and inventors.
Financial/Administrative indicates interest in occupations that work with financial data, business systems, administrative procedures, etc.
Characterized by interest in: • Financial tasks • Administrative organization • Office work • Business procedures
Representative occupations sharing this interest include: bankers, attorneys, historians, journalists, economists, administrative managers, and factory managers.
The People Service scale indicates interest in occupations that help people and are concerned with the welfare of others.
Characterized by interest in: • Facilitation • Helping others • Social awareness
Representative occupations sharing this interest include: social workers, psychologists, social welfare directors, physicians, labor relations managers, employment managers, HR professionals, and college professors.
The Technical scale indicates interest in occupations that center on scientific and technical activities, research, and intellectual skills.
Characterized by interest in: • Intellectual approaches • Scientific study • Research methods
Representative occupations sharing this interest include: physicists, mathematicians, statisticians, engineers, computer programmers, and research analysts.
The Mechanical scale indicates interest in occupations that involve hands-on work, using equipment and machinery, and physical vocations.
Characterized by interest in: • Working with machines, tools, and equipment • Work associated with the outdoors and/or being physical • Activities associated more with hands-on tasks than with people
Representative occupations sharing this interest include: production managers, heavy equipment operators, forest rangers, engineers, and farmers. ©2008, Profiles International, Inc., Waco, Texas
Appendix A-5
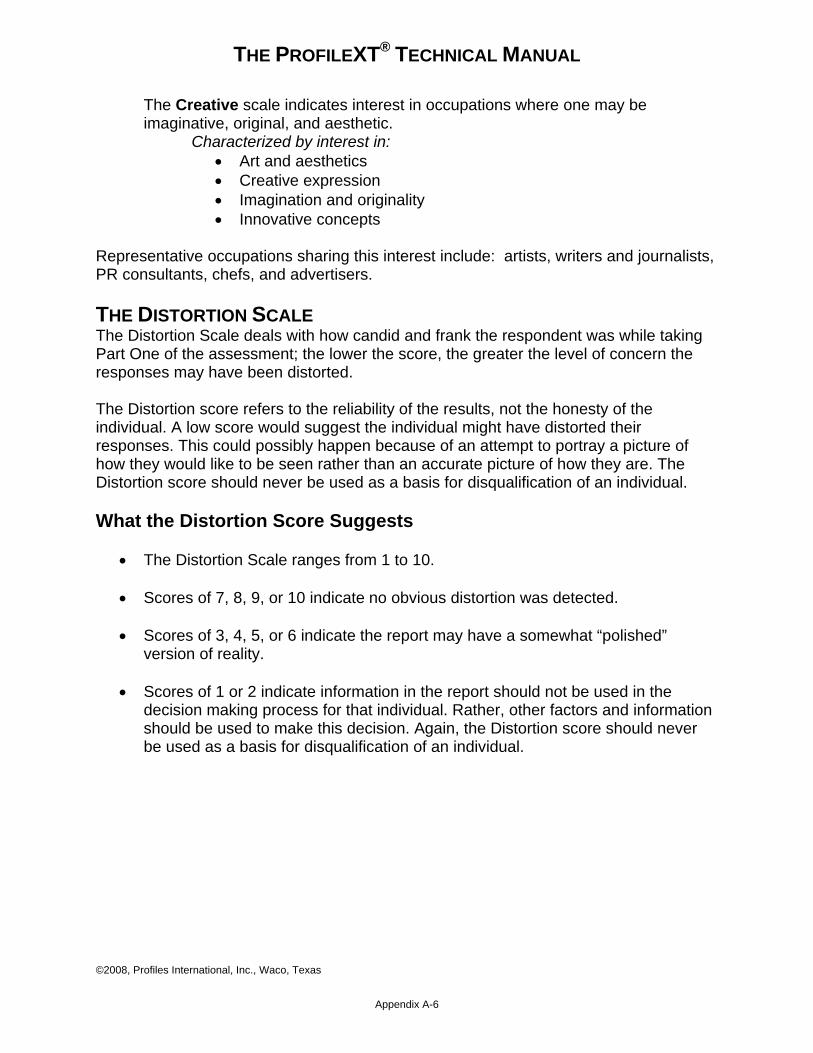
THE PROFILEXT® TECHNICAL MANUAL
©2008, Profiles International, Inc., Waco, Texas
Appendix A-6
The Creative scale indicates interest in occupations where one may be imaginative, original, and aesthetic.
Characterized by interest in: • Art and aesthetics • Creative expression • Imagination and originality • Innovative concepts
Representative occupations sharing this interest include: artists, writers and journalists, PR consultants, chefs, and advertisers. THE DISTORTION SCALE The Distortion Scale deals with how candid and frank the respondent was while taking Part One of the assessment; the lower the score, the greater the level of concern the responses may have been distorted. The Distortion score refers to the reliability of the results, not the honesty of the individual. A low score would suggest the individual might have distorted their responses. This could possibly happen because of an attempt to portray a picture of how they would like to be seen rather than an accurate picture of how they are. The Distortion score should never be used as a basis for disqualification of an individual.
What the Distortion Score Suggests
• The Distortion Scale ranges from 1 to 10.
• Scores of 7, 8, 9, or 10 indicate no obvious distortion was detected.
• Scores of 3, 4, 5, or 6 indicate the report may have a somewhat “polished”
version of reality.
• Scores of 1 or 2 indicate information in the report should not be used in the decision making process for that individual. Rather, other factors and information should be used to make this decision. Again, the Distortion score should never be used as a basis for disqualification of an individual.
THE PROFILEXT® TECHNICAL MANUAL
©2008, Profiles International, Inc., Waco, Texas
Appendix B-1
Appendix B: Adverse Impact PXT & the Rule of 4/5ths
Obtaining fairness in job placements is an appropriate objective for everyone. In service of that idea, government agencies have provided guidelines that suggest some important considerations for using tests. A common thread throughout these guidelines is that the instruments used should be appropriate and no protected sub-group of individuals should be treated unfairly.
The use of The ProfileXT® and its Job Match Percent (JMP) system help the user maintain fairness in their placement of people. This section of the PXT Technical Manual Appendices will discuss some of these considerations and how they are met with the ProfileXT.
Reliability
The ProfileXT Technical Manual reports on three different types of reliability: test-retest reliability, split-half reliability, and coefficient alpha reliability. The coefficient alpha estimates reliability based on the internal consistency of the scales; test-retest estimates reliability based on two different administrations to the same individuals; and split-half estimates reliability by testing one half of the questions on each scale against the other half.
The reported reliabilities are within the guidelines provided by the appropriate agencies. The total number of questions on the ProfileXT is important because one of the factors involved in increasing testing reliability is the number of items for each scale. This is why the more reliable instruments tend to have more questions and take longer to complete.
Test Validity
There are three types of validity typically considered in test construction and use. They are content validity, construct validity, and criterion-related validity. Each is defined briefly below.
THE PROFILEXT® TECHNICAL MANUAL
©2008, Profiles International, Inc., Waco, Texas
Appendix B-2
Content Validity - the content of the assessment process is representative of important aspects of performance on the job.
Construct Validity - the assessment process measures the degree to which candidates have identifiable characteristics which have been determined to be important for successful job performance. This is a two-step process; first, establish what “construct” the test measures, and second, show that this construct is important for successful performance of the job.
Criterion-Related Validity - this assessment process is predictive of, or significantly correlated with, important elements of work behaviors (successful performance on the job). There are two types of Criterion-Related Validity: 1) Concurrent validity -- ratings for the selection process and ratings for current job performance are statistically correlated and 2) Predictive validity -- ratings for the selection process and future job performance are statistically correlated.
The Uniform Guidelines on Employee Selection Procedures (1978) requires employers to produce evidence of validity only when it has been demonstrated that the test adversely affects the employment opportunities of a protected race, gender, or ethnic group. If there is no adverse impact there is no validation requirement under these guidelines.
Adverse impact is typically analyzed using the 4/5th rule. What this rule basically suggests is to first compute the percentage of applicants who were selected from the most selected group and second, be sure that at least 4/5th percent of all the protected groups were also selected. To summarize, if there were 20 males and 10 females who applied for a position and 10 of the males were hired (selection rate =50%), then at least four of the females should have also been selected (selection rate should equal 4/5th of 50% or 40%).
The Uniform Guideline reviews the results of the overall selection process when they look for adverse impact. This means the total selection process should be reviewed to ensure it has no adverse impact on a protected group. This makes it important for an organization to consistently review the selection process in order to ensure members of the protected groups are selected at a selection rate that is at least 80% of the selection rate of the most typically represented group.
THE PROFILEXT® TECHNICAL MANUAL
©2008, Profiles International, Inc., Waco, Texas
Appendix B-3
Understanding the Job Match Percent
The Job Match Percent represents how closely an individual’s scores across the entire range of the instrument match a job pattern. Once the job pattern has been developed for each scale, an individual score can be compared to those patterns. Where their scores fall outside the pattern there is a decrement made to the percent match. The further outside the pattern the score falls, the greater the decrement. The sum for all scales represents the total job match.
In use, this match percent becomes an important piece of the consideration for job placement. Some users establish a number such as 70%; those who score above this percentage may be viewed more favorably in the interview process than those who score below the percentage. In this way, the percentage match to the pattern becomes one of the important pieces when making a placement decision.
Because the intent of the regulations suggests that the overall process must be considered when investigating the issue of disparate impact, we reviewed the relationship of achieving a certain percentage match to a pattern (such as 70%) and membership in any of the protected groups. It was assumed that achieving a percentage match of at least 70% was considered for inclusion for this part of the selection process. Again, the primary interest was whether the members of all groups would be included at a selection rate within the guidelines provided by the regulations. To test compliance of The Profile with the Uniform Guidelines two studies were conducted which analyzed mean percent matches and selection rates for a sample of diverse candidates with the results presented in the following sections.
Job Classification and Ethnicity
In order to understand the analysis of mean scores on The ProfileXT, a look at adverse impact is necessary. The primary concern is whether a particular group (ethnicity, age, or gender) is significantly impacted by a specific scale on the assessment. It was also necessary to remove any secondary factors that may contribute to differences in mean scores for a group. By categorizing a sample by its job classification the intention was to remove secondary factors like educational requirements for a particular job which may spuriously skew the means as demonstrated in previous statistical analyses. If one job classification requires education and experiences that are rare for another job classification and the diversity of the two jobs differs, then this may create an erroneous effect of disparate impact. Thus, by analyzing mean scores within each job classification

THE PROFILEXT® TECHNICAL MANUAL
©2008, Profiles International, Inc., Waco, Texas
Appendix B-4
separately, we hope to narrow significant results to just the effects of ethnicity and the social disadvantages suggested by present-day societal norms. This helps define the causal factor involved.
Seven job classifications were developed to categorize the sample group’s occupational composition. These seven groupings were developed by the Research & Development team with conceptual generalization and representation being our primary concerns. These groups included Administration, Skilled Labor, Sales, Technology, Professionals, Management, and Customer Service. Among the original sample, these job classifications represented the greatest balance of representation and differentiation possible. In order to be considered acceptably diverse a particular job classification should have an ethnic composition that sufficiently matches that of the general population. Only one group did not represent sufficient diversity to be included in this study: Sales. Thus, with six representative job classifications, the study was ready to begin. (Note: The Sales Group was investigated in a subsequent study, which is discussed in the last section of this Appendix.)
Each group’s composite of ethnicity is noted in the following table. Initially, each job classification was analyzed by comparing the mean scores for each ethnic group for significant differences. In some cases a specific ethnic group demonstrated a mean score on a scale higher than the remainder of the sample. While this is of statistical significance, having higher or lower scores does not necessarily demonstrate adverse impact against a protected group until benchmarks are utilized for job selection. Of primary concern was finding instances in which the majority ethnic group (Whites) demonstrated a mean score significantly different than any or all of the minority groups (Asian, Black, & Hispanic).
In no case did any scale categorically impact all ethnic minority groups within a particular job classification. This is positive information but instances of one-to-one impact (one minority group impacted) are still important to discuss.
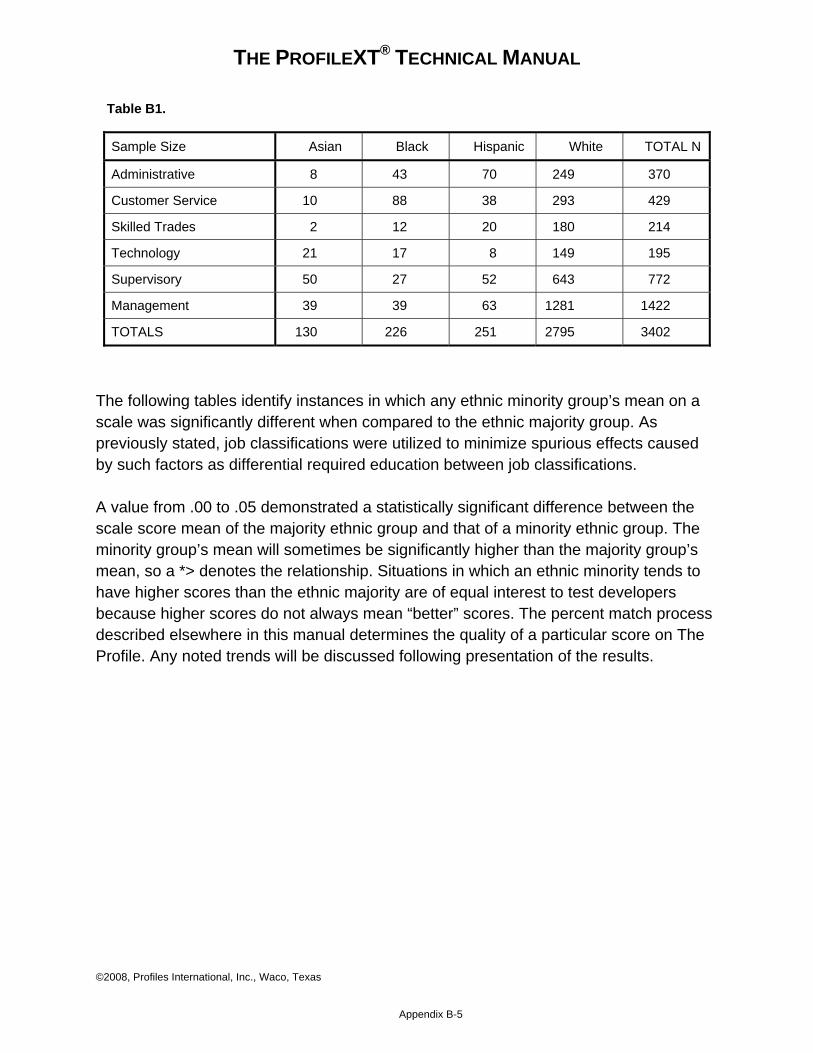
THE PROFILEXT® TECHNICAL MANUAL
©2008, Profiles International, Inc., Waco, Texas
Appendix B-5
Table B1.
Sample Size Asian Black Hispanic White TOTAL N
Administrative 8 43 70 249 370
Customer Service 10 88 38 293 429
Skilled Trades 2 12 20 180 214
Technology 21 17 8 149 195
Supervisory 50 27 52 643 772
Management 39 39 63 1281 1422
TOTALS 130 226 251 2795 3402
The following tables identify instances in which any ethnic minority group’s mean on a scale was significantly different when compared to the ethnic majority group. As previously stated, job classifications were utilized to minimize spurious effects caused by such factors as differential required education between job classifications.
A value from .00 to .05 demonstrated a statistically significant difference between the scale score mean of the majority ethnic group and that of a minority ethnic group. The minority group’s mean will sometimes be significantly higher than the majority group’s mean, so a *> denotes the relationship. Situations in which an ethnic minority tends to have higher scores than the ethnic majority are of equal interest to test developers because higher scores do not always mean “better” scores. The percent match process described elsewhere in this manual determines the quality of a particular score on The Profile. Any noted trends will be discussed following presentation of the results.
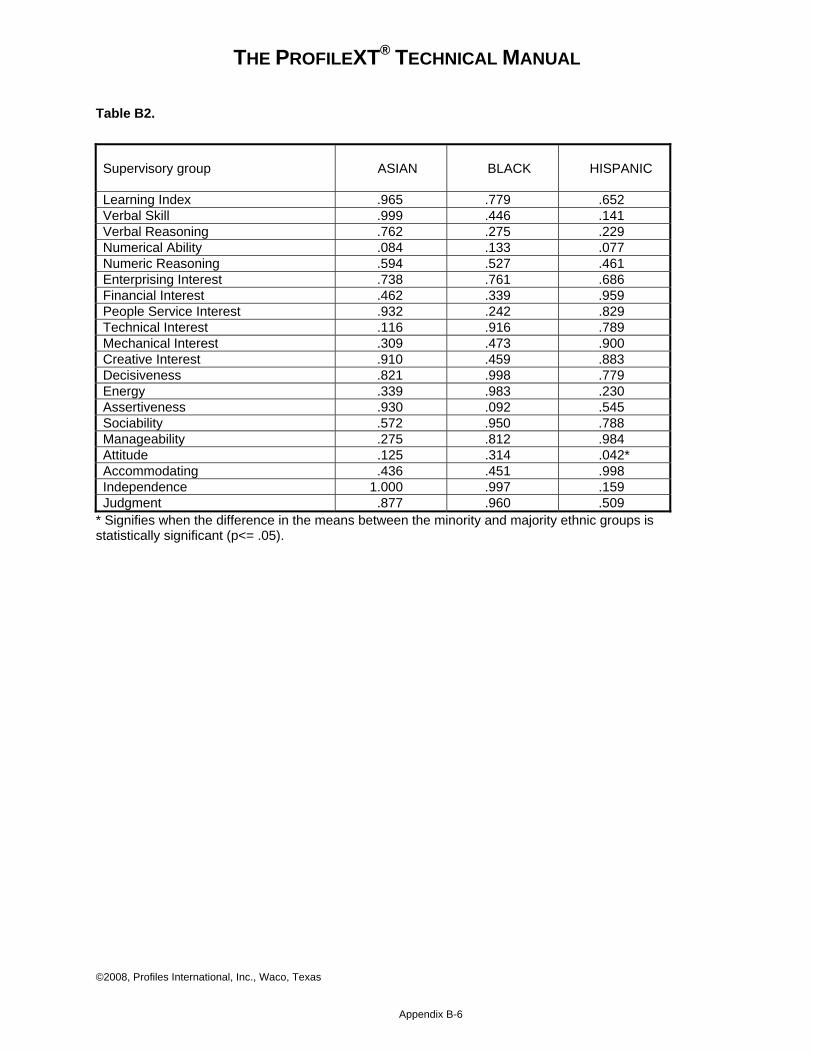
THE PROFILEXT® TECHNICAL MANUAL
©2008, Profiles International, Inc., Waco, Texas
Appendix B-6
Table B2.
Supervisory group
ASIAN BLACK HISPANIC
Learning Index .965 .779 .652 Verbal Skill .999 .446 .141 Verbal Reasoning .762 .275 .229 Numerical Ability .084 .133 .077 Numeric Reasoning .594 .527 .461 Enterprising Interest .738 .761 .686 Financial Interest .462 .339 .959 People Service Interest .932 .242 .829 Technical Interest .116 .916 .789 Mechanical Interest .309 .473 .900 Creative Interest .910 .459 .883 Decisiveness .821 .998 .779 Energy .339 .983 .230 Assertiveness .930 .092 .545 Sociability .572 .950 .788 Manageability .275 .812 .984 Attitude .125 .314 .042* Accommodating .436 .451 .998 Independence 1.000 .997 .159 Judgment .877 .960 .509
* Signifies when the difference in the means between the minority and majority ethnic groups is statistically significant (p<= .05).
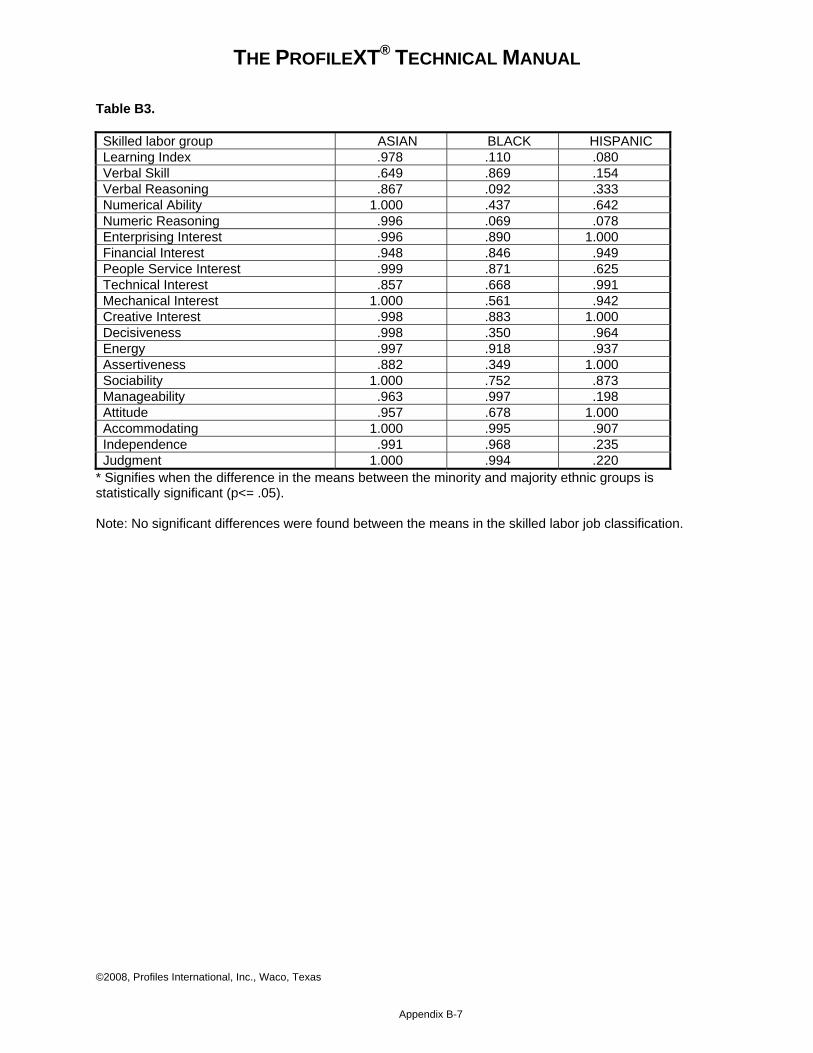
THE PROFILEXT® TECHNICAL MANUAL
©2008, Profiles International, Inc., Waco, Texas
Appendix B-7
Table B3. Skilled labor group ASIAN BLACK HISPANIC Learning Index .978 .110 .080 Verbal Skill .649 .869 .154 Verbal Reasoning .867 .092 .333 Numerical Ability 1.000 .437 .642 Numeric Reasoning .996 .069 .078 Enterprising Interest .996 .890 1.000 Financial Interest .948 .846 .949 People Service Interest .999 .871 .625 Technical Interest .857 .668 .991 Mechanical Interest 1.000 .561 .942 Creative Interest .998 .883 1.000 Decisiveness .998 .350 .964 Energy .997 .918 .937 Assertiveness .882 .349 1.000 Sociability 1.000 .752 .873 Manageability .963 .997 .198 Attitude .957 .678 1.000 Accommodating 1.000 .995 .907 Independence .991 .968 .235 Judgment 1.000 .994 .220
* Signifies when the difference in the means between the minority and majority ethnic groups is statistically significant (p<= .05). Note: No significant differences were found between the means in the skilled labor job classification.

THE PROFILEXT® TECHNICAL MANUAL
©2008, Profiles International, Inc., Waco, Texas
Appendix B-8
Table B4. Administrative group ASIAN BLACK HISPANIC Learning Index .849 .327 .431 Verbal Skill .798 .210 .213 Verbal Reasoning .424 .172 .142 Numerical Ability .785 .370 .067 Numeric Reasoning .603 .217 .109 Enterprising Interest .770 .316 .125 Financial Interest .642 .802 .929 People Service Interest .806 .080 .256 Technical Interest .630 .943 1.000 Mechanical Interest .822 .951 .184 Creative Interest .711 1.000 .213 Decisiveness .973 .367 .138 Energy .902 .031* .201 Assertiveness .999 .610 .873 Sociability .895 .937* .993 Manageability .702 .043* .869 Attitude .316 .434 .612 Accommodating .639 .042* .062 Independence .520 .617 .743 Judgment .817 .062 .642
* Signifies when the difference in the means between the minority and majority ethnic groups is statistically significant (p<= .05).

THE PROFILEXT® TECHNICAL MANUAL
©2008, Profiles International, Inc., Waco, Texas
Appendix B-9
Table B5. Management group ASIAN BLACK HISPANIC Learning Index .998 .179 .299 Verbal Skill .056 .034* .031* Verbal Reasoning .171 .142 .125 Numerical Ability .091 .840 .791 Numeric Reasoning .923 .420 .340 Enterprising Interest .816 .985 .948 Financial Interest .054 .533 .079 People Service Interest .992 .299 .894 Technical Interest .900 .972 .993 Mechanical Interest .921 .321 .843 Creative Interest .963 .354 .844 Decisiveness 1.000 .169 .937 Energy 1.000 .627 .990 Assertiveness .995 .487 .780 Sociability .987 1.000 .979 Manageability .340 .171 .821 Attitude .843 .041* .035* Accommodating .299 .731 .669 Independence .992 .198 .307 Judgment .727 .210 .954
* Signifies when the difference in the means between the minority and majority ethnic groups is statistically significant (p<= .05)

THE PROFILEXT® TECHNICAL MANUAL
©2008, Profiles International, Inc., Waco, Texas
Appendix B-10
Table B6. Technology group ASIAN BLACK HISPANIC Learning Index .433 .045* .127 Verbal Skill .541 .983 .242 Verbal Reasoning .672 .124 .105 Numerical Ability .591 .323 .828 Numeric Reasoning .968 .113 .216 Enterprising Interest .951 .993 .952 Financial Interest .558 .137 .998 People Service Interest .044* .973 .777 Technical Interest .041* .817 .999 Mechanical Interest .999 .125 1.000 Creative Interest .875 .968 .985 Decisiveness .989 .933 .890 Energy .039* .995 .959 Assertiveness .861 .059 .920 Sociability .967 .948 .950 Manageability .875 .991 .999 Attitude .176 .975 .984 Accommodating .115 .922 .928 Independence .997 .875 .865 Judgment .968 .953 .982
* Signifies when the difference in the means between the minority and majority ethnic groups is statistically significant (p<= .05)
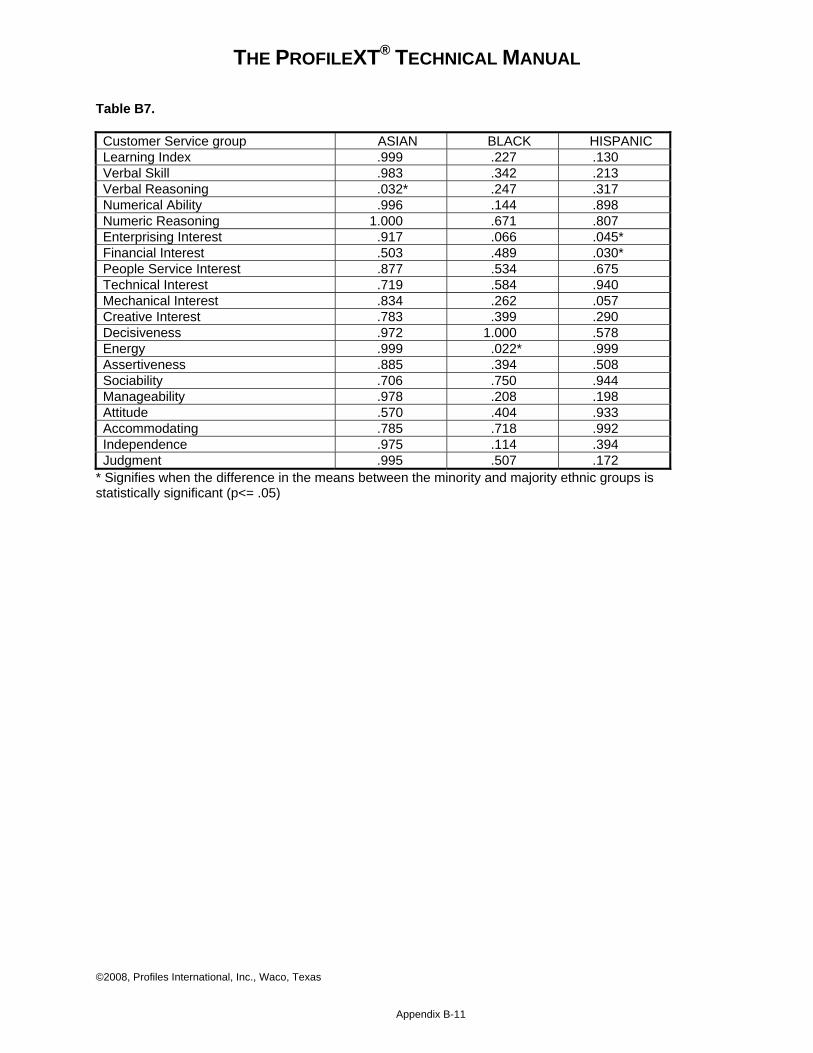
THE PROFILEXT® TECHNICAL MANUAL
©2008, Profiles International, Inc., Waco, Texas
Appendix B-11
Table B7. Customer Service group ASIAN BLACK HISPANIC Learning Index .999 .227 .130 Verbal Skill .983 .342 .213 Verbal Reasoning .032* .247 .317 Numerical Ability .996 .144 .898 Numeric Reasoning 1.000 .671 .807 Enterprising Interest .917 .066 .045* Financial Interest .503 .489 .030* People Service Interest .877 .534 .675 Technical Interest .719 .584 .940 Mechanical Interest .834 .262 .057 Creative Interest .783 .399 .290 Decisiveness .972 1.000 .578 Energy .999 .022* .999 Assertiveness .885 .394 .508 Sociability .706 .750 .944 Manageability .978 .208 .198 Attitude .570 .404 .933 Accommodating .785 .718 .992 Independence .975 .114 .394 Judgment .995 .507 .172
* Signifies when the difference in the means between the minority and majority ethnic groups is statistically significant (p<= .05)
THE PROFILEXT® TECHNICAL MANUAL
©2008, Profiles International, Inc., Waco, Texas
Appendix B-12
Overall, this analysis demonstrates the significant differences between mean scores of each ethnic group are not consistent across the various job classifications. Differences suggest a trend of variance are most notable for individual job classifications but do not surface across the sample as a whole. The Thinking Section means demonstrate no conclusive effect against minority groups across all the job classifications. There appears to be a trend, however, in the Thinking Section so job relevance issues may need to be addressed by the user when making hiring decisions.
Some trends do seem apparent within individual job classifications including scales in which a minority ethnic group tends to demonstrate higher scores than the majority group. One example is the African-American sample of Customer Service employees in which mean scores are significantly higher for the People Service and Financial Interests. This is not seen as a disadvantage and should not impact EEOC compliances.
It is suggested that throughout the selection process and the relevant job criteria are reviewed by the user to determine which scales are most pertinent for a particular position, and that these findings are supported by objective performance data. This criterion for job-relatedness, attributable to inherent relevance to the job, helps to counter adverse impact. Since there is no evident trend of impact across all job classifications to be found, the development of relevant benchmarks for a particular job should demonstrate low, if not negligible, impact against any individual taking the test. Even if there is a slight impact, there will be no significant effect on the job match percent or matching to the job. A discussion follows concerning the development of benchmarks and the relationship to adverse impact, including highlights of a study to determine the effectiveness of utilizing benchmarks for candidate selection.
Utilization of Job Patterns: Effect upon Adverse Impact Issues
The ProfileXT makes use of job patterns to determine the fit of a candidate for a particular job. The job patterns have been designed to reflect the characteristics of those who have proven to be effective in a given job. This job matching process contributes to the overall fairness of the selection tool, while maintaining good utility in defining how well an individual matches a particular position. Discussion of the development of the ProfileXT job patterns can be found in the Technical Manual for that product. For the purposes of this level of the analysis, suffice to say that each job pattern is developed to represent the combination of traits, interests, and abilities that
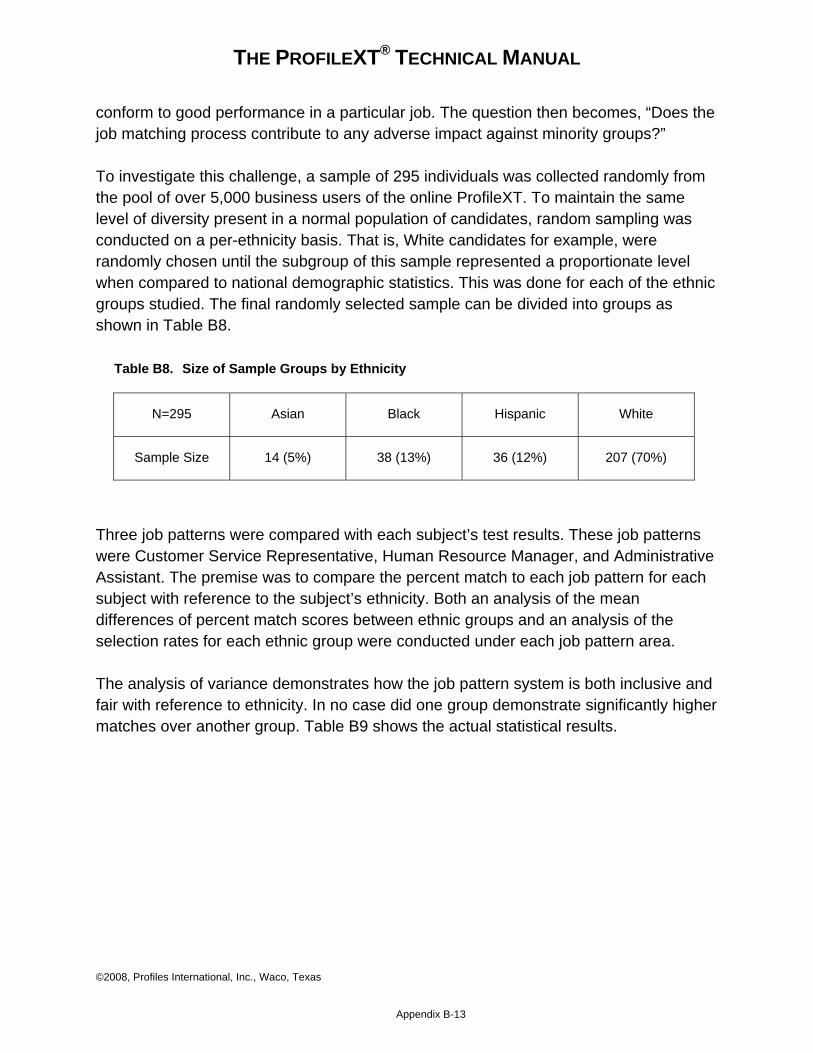
THE PROFILEXT® TECHNICAL MANUAL
©2008, Profiles International, Inc., Waco, Texas
Appendix B-13
conform to good performance in a particular job. The question then becomes, “Does the job matching process contribute to any adverse impact against minority groups?”
To investigate this challenge, a sample of 295 individuals was collected randomly from the pool of over 5,000 business users of the online ProfileXT. To maintain the same level of diversity present in a normal population of candidates, random sampling was conducted on a per-ethnicity basis. That is, White candidates for example, were randomly chosen until the subgroup of this sample represented a proportionate level when compared to national demographic statistics. This was done for each of the ethnic groups studied. The final randomly selected sample can be divided into groups as shown in Table B8.
Table B8. Size of Sample Groups by Ethnicity
N=295 Asian Black Hispanic White
Sample Size 14 (5%) 38 (13%) 36 (12%) 207 (70%)
Three job patterns were compared with each subject’s test results. These job patterns were Customer Service Representative, Human Resource Manager, and Administrative Assistant. The premise was to compare the percent match to each job pattern for each subject with reference to the subject’s ethnicity. Both an analysis of the mean differences of percent match scores between ethnic groups and an analysis of the selection rates for each ethnic group were conducted under each job pattern area.
The analysis of variance demonstrates how the job pattern system is both inclusive and fair with reference to ethnicity. In no case did one group demonstrate significantly higher matches over another group. Table B9 shows the actual statistical results.
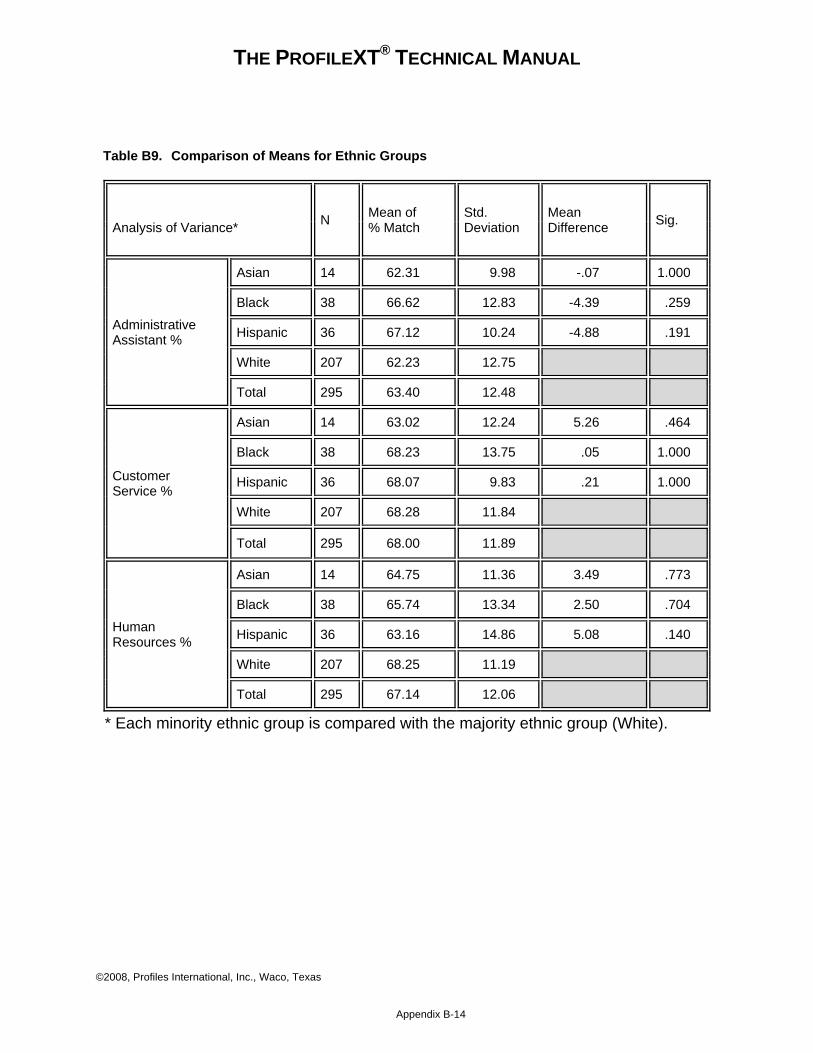
THE PROFILEXT® TECHNICAL MANUAL
©2008, Profiles International, Inc., Waco, Texas
Appendix B-14
Table B9. Comparison of Means for Ethnic Groups
Analysis of Variance* N Mean of
% Match Std. Deviation
Mean Difference Sig.
Administrative Assistant %
Asian 14 62.31 9.98 -.07 1.000
Black 38 66.62 12.83 -4.39 .259
Hispanic 36 67.12 10.24 -4.88 .191
White 207 62.23 12.75
Total 295 63.40 12.48
Customer Service %
Asian 14 63.02 12.24 5.26 .464
Black 38 68.23 13.75 .05 1.000
Hispanic 36 68.07 9.83 .21 1.000
White 207 68.28 11.84
Total 295 68.00 11.89
Human Resources %
Asian 14 64.75 11.36 3.49 .773
Black 38 65.74 13.34 2.50 .704
Hispanic 36 63.16 14.86 5.08 .140
White 207 68.25 11.19
Total 295 67.14 12.06
* Each minority ethnic group is compared with the majority ethnic group (White).
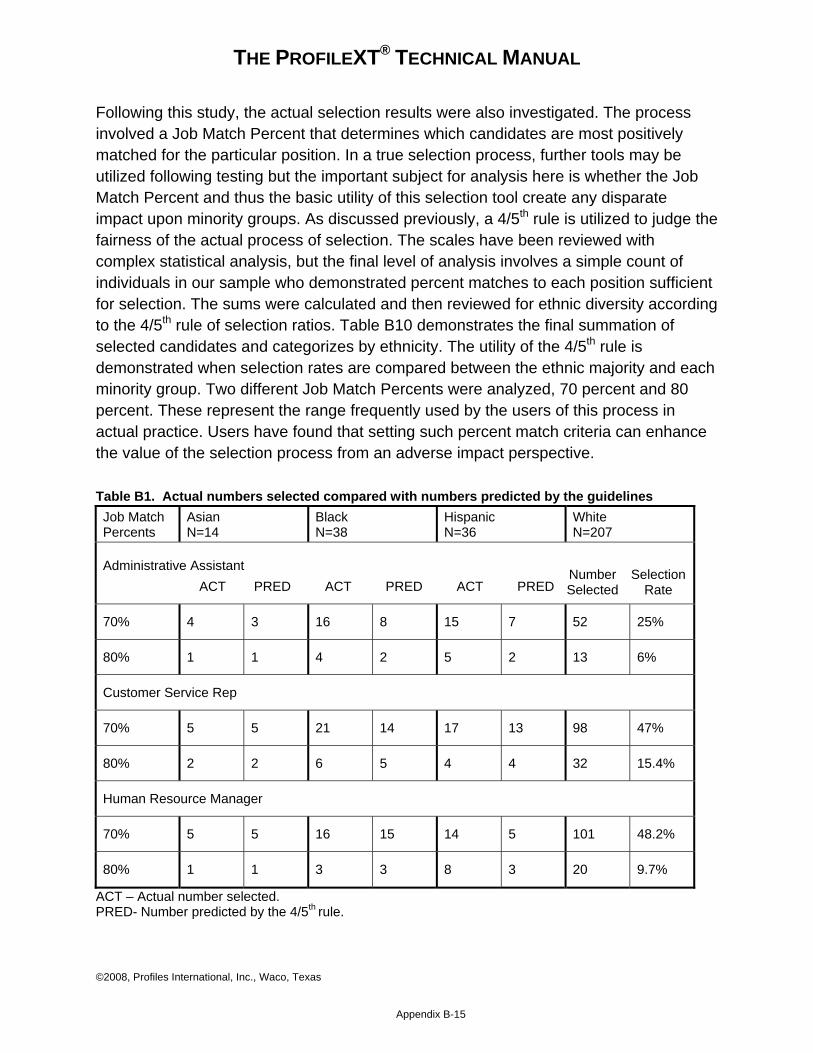
THE PROFILEXT® TECHNICAL MANUAL
©2008, Profiles International, Inc., Waco, Texas
Appendix B-15
Following this study, the actual selection results were also investigated. The process involved a Job Match Percent that determines which candidates are most positively matched for the particular position. In a true selection process, further tools may be utilized following testing but the important subject for analysis here is whether the Job Match Percent and thus the basic utility of this selection tool create any disparate impact upon minority groups. As discussed previously, a 4/5th rule is utilized to judge the fairness of the actual process of selection. The scales have been reviewed with complex statistical analysis, but the final level of analysis involves a simple count of individuals in our sample who demonstrated percent matches to each position sufficient for selection. The sums were calculated and then reviewed for ethnic diversity according to the 4/5th rule of selection ratios. Table B10 demonstrates the final summation of selected candidates and categorizes by ethnicity. The utility of the 4/5th rule is demonstrated when selection rates are compared between the ethnic majority and each minority group. Two different Job Match Percents were analyzed, 70 percent and 80 percent. These represent the range frequently used by the users of this process in actual practice. Users have found that setting such percent match criteria can enhance the value of the selection process from an adverse impact perspective.
Table B1. Actual numbers selected compared with numbers predicted by the guidelines Job Match Percents
Asian N=14
Black N=38
Hispanic N=36
White N=207
Administrative Assistant
70% 4 3 16 8 15 7 52 25%
80% 1 1 4 2 5 2 13 6%
Customer Service Rep
70% 5 5 21 14 17 13 98 47%
80% 2 2 6 5 4 4 32 15.4%
Human Resource Manager
70% 5 5 16 15 14 5 101 48.2%
80% 1 1 3 3 8 3 20 9.7%
Number Selected ACT PRED ACT PRED ACT PRED
Selection Rate
ACT – Actual number selected. PRED- Number predicted by the 4/5th rule.
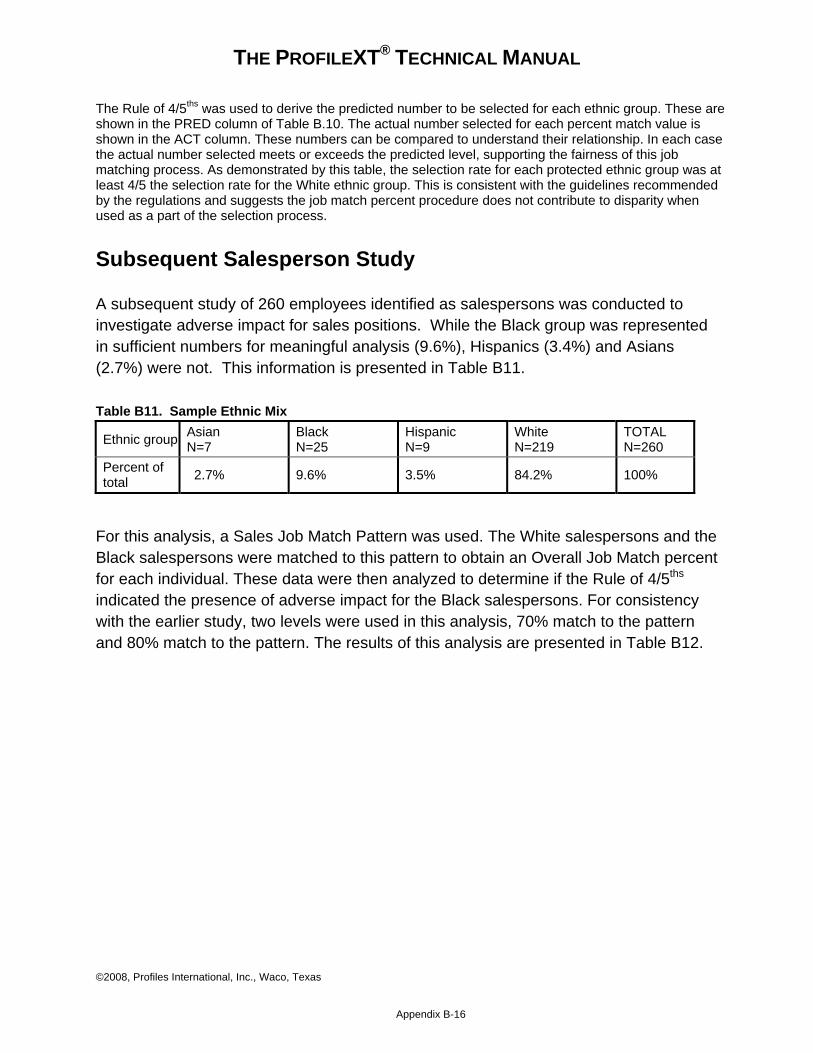
THE PROFILEXT® TECHNICAL MANUAL
©2008, Profiles International, Inc., Waco, Texas
Appendix B-16
The Rule of 4/5ths was used to derive the predicted number to be selected for each ethnic group. These are shown in the PRED column of Table B.10. The actual number selected for each percent match value is shown in the ACT column. These numbers can be compared to understand their relationship. In each case the actual number selected meets or exceeds the predicted level, supporting the fairness of this job matching process. As demonstrated by this table, the selection rate for each protected ethnic group was at least 4/5 the selection rate for the White ethnic group. This is consistent with the guidelines recommended by the regulations and suggests the job match percent procedure does not contribute to disparity when used as a part of the selection process.
Subsequent Salesperson Study
A subsequent study of 260 employees identified as salespersons was conducted to investigate adverse impact for sales positions. While the Black group was represented in sufficient numbers for meaningful analysis (9.6%), Hispanics (3.4%) and Asians (2.7%) were not. This information is presented in Table B11.
Table B11. Sample Ethnic Mix
Ethnic group Asian N=7
Black N=25
Hispanic N=9
White N=219
TOTAL N=260
Percent of total 2.7% 9.6% 3.5% 84.2% 100%
For this analysis, a Sales Job Match Pattern was used. The White salespersons and the Black salespersons were matched to this pattern to obtain an Overall Job Match percent for each individual. These data were then analyzed to determine if the Rule of 4/5ths indicated the presence of adverse impact for the Black salespersons. For consistency with the earlier study, two levels were used in this analysis, 70% match to the pattern and 80% match to the pattern. The results of this analysis are presented in Table B12.
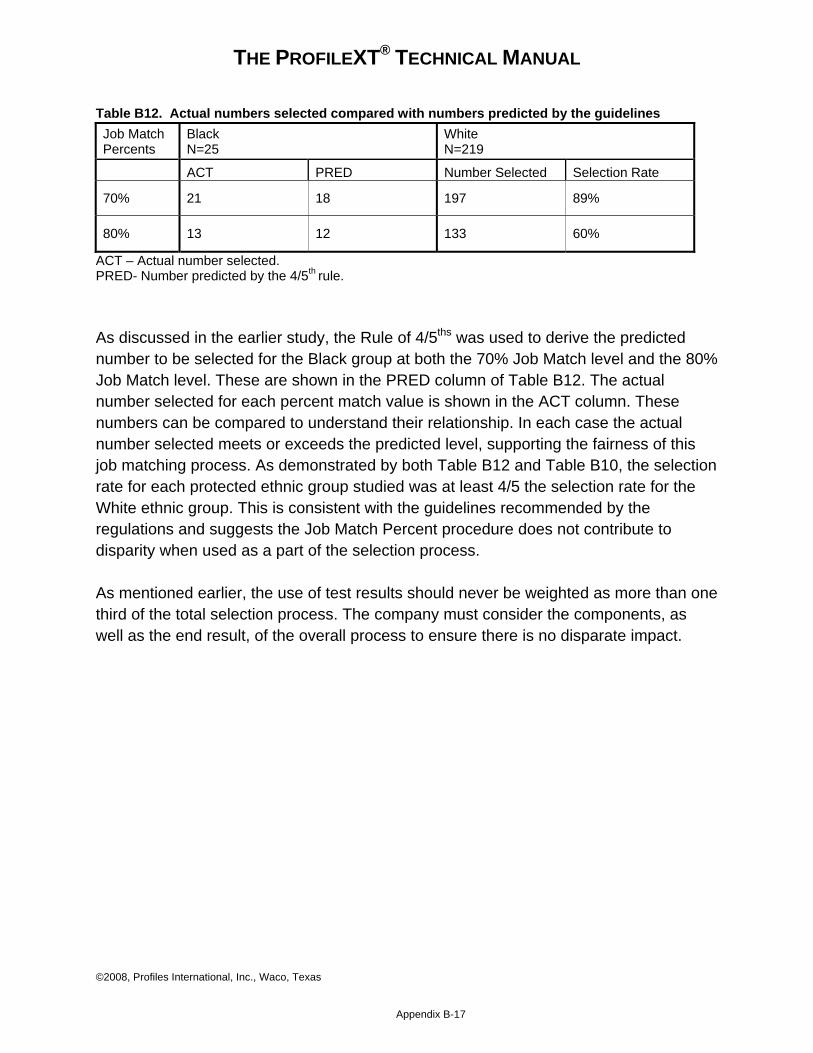
THE PROFILEXT® TECHNICAL MANUAL
©2008, Profiles International, Inc., Waco, Texas
Appendix B-17
Table B12. Actual numbers selected compared with numbers predicted by the guidelines Job Match Percents
Black N=25
White N=219
ACT PRED Number Selected Selection Rate
70% 21 18 197 89%
80% 13 12 133 60%
ACT – Actual number selected. PRED- Number predicted by the 4/5th rule.
As discussed in the earlier study, the Rule of 4/5ths was used to derive the predicted number to be selected for the Black group at both the 70% Job Match level and the 80% Job Match level. These are shown in the PRED column of Table B12. The actual number selected for each percent match value is shown in the ACT column. These numbers can be compared to understand their relationship. In each case the actual number selected meets or exceeds the predicted level, supporting the fairness of this job matching process. As demonstrated by both Table B12 and Table B10, the selection rate for each protected ethnic group studied was at least 4/5 the selection rate for the White ethnic group. This is consistent with the guidelines recommended by the regulations and suggests the Job Match Percent procedure does not contribute to disparity when used as a part of the selection process.
As mentioned earlier, the use of test results should never be weighted as more than one third of the total selection process. The company must consider the components, as well as the end result, of the overall process to ensure there is no disparate impact.
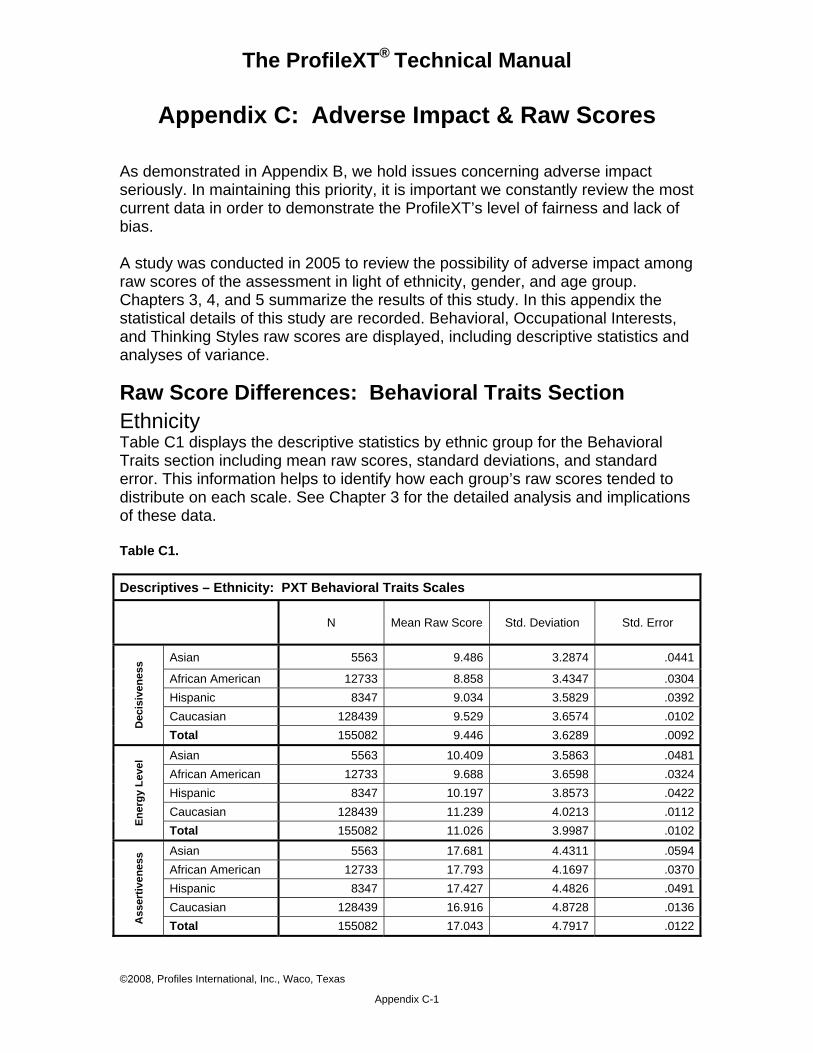
The ProfileXT® Technical Manual
Appendix C: Adverse Impact & Raw Scores
As demonstrated in Appendix B, we hold issues concerning adverse impact seriously. In maintaining this priority, it is important we constantly review the most current data in order to demonstrate the ProfileXT’s level of fairness and lack of bias. A study was conducted in 2005 to review the possibility of adverse impact among raw scores of the assessment in light of ethnicity, gender, and age group. Chapters 3, 4, and 5 summarize the results of this study. In this appendix the statistical details of this study are recorded. Behavioral, Occupational Interests, and Thinking Styles raw scores are displayed, including descriptive statistics and analyses of variance.
Raw Score Differences: Behavioral Traits Section Ethnicity Table C1 displays the descriptive statistics by ethnic group for the Behavioral Traits section including mean raw scores, standard deviations, and standard error. This information helps to identify how each group’s raw scores tended to distribute on each scale. See Chapter 3 for the detailed analysis and implications of these data. Table C1. Descriptives – Ethnicity: PXT Behavioral Traits Scales
N Mean Raw Score Std. Deviation Std. Error
Dec
isiv
enes
s Asian 5563 9.486 3.2874 .0441
African American 12733 8.858 3.4347 .0304Hispanic 8347 9.034 3.5829 .0392Caucasian 128439 9.529 3.6574 .0102Total 155082 9.446 3.6289 .0092
Ener
gy L
evel
Asian 5563 10.409 3.5863 .0481African American 12733 9.688 3.6598 .0324Hispanic 8347 10.197 3.8573 .0422Caucasian 128439 11.239 4.0213 .0112Total 155082 11.026 3.9987 .0102
Ass
ertiv
enes
s Asian 5563 17.681 4.4311 .0594African American 12733 17.793 4.1697 .0370Hispanic 8347 17.427 4.4826 .0491Caucasian 128439 16.916 4.8728 .0136Total 155082 17.043 4.7917 .0122
©2008, Profiles International, Inc., Waco, Texas
Appendix C-1
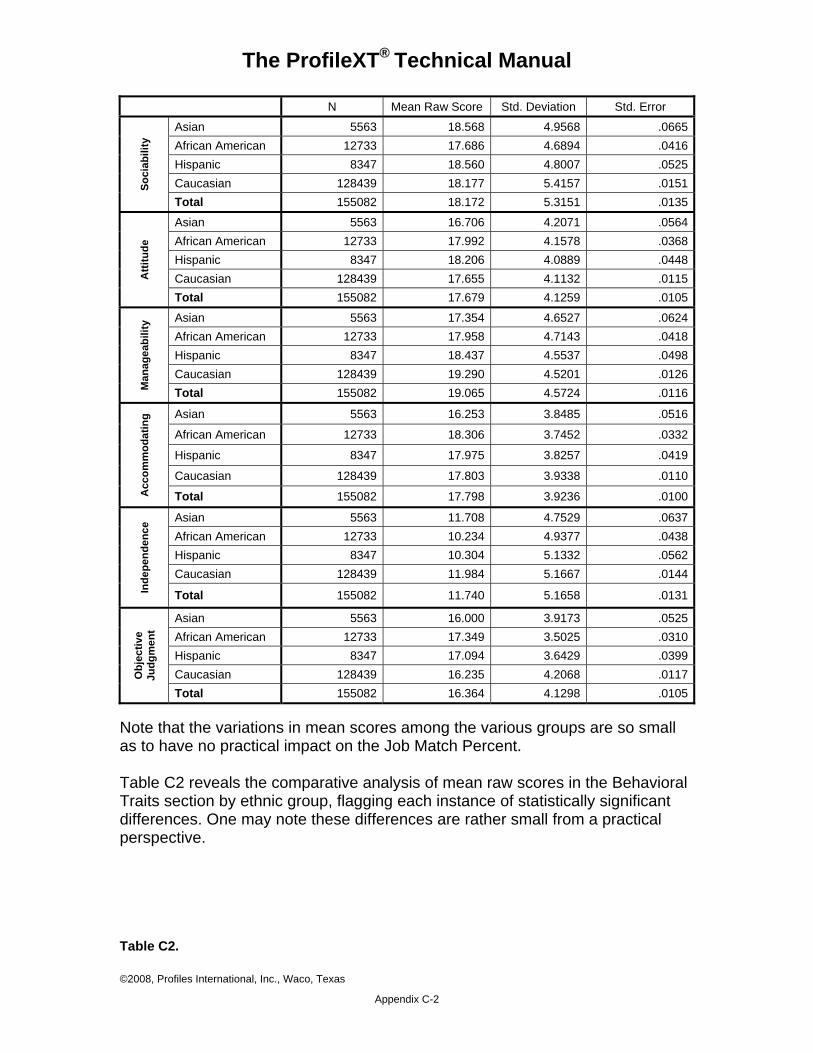
The ProfileXT® Technical Manual
N Mean Raw Score Std. Deviation Std. Error
Soci
abili
ty Asian 5563 18.568 4.9568 .0665
African American 12733 17.686 4.6894 .0416Hispanic 8347 18.560 4.8007 .0525Caucasian 128439 18.177 5.4157 .0151Total 155082 18.172 5.3151 .0135
Atti
tude
Asian 5563 16.706 4.2071 .0564African American 12733 17.992 4.1578 .0368Hispanic 8347 18.206 4.0889 .0448Caucasian 128439 17.655 4.1132 .0115Total 155082 17.679 4.1259 .0105
Man
agea
bilit
y Asian 5563 17.354 4.6527 .0624African American 12733 17.958 4.7143 .0418Hispanic 8347 18.437 4.5537 .0498Caucasian 128439 19.290 4.5201 .0126Total 155082 19.065 4.5724 .0116
Acc
omm
odat
ing Asian 5563 16.253 3.8485 .0516
African American 12733 18.306 3.7452 .0332
Hispanic 8347 17.975 3.8257 .0419
Caucasian 128439 17.803 3.9338 .0110
Total 155082 17.798 3.9236 .0100
Inde
pend
ence
Asian 5563 11.708 4.7529 .0637African American 12733 10.234 4.9377 .0438Hispanic 8347 10.304 5.1332 .0562Caucasian 128439 11.984 5.1667 .0144
Total 155082 11.740 5.1658 .0131
Obj
ectiv
e Ju
dgm
ent
Asian 5563 16.000 3.9173 .0525African American 12733 17.349 3.5025 .0310Hispanic 8347 17.094 3.6429 .0399Caucasian 128439 16.235 4.2068 .0117Total 155082 16.364 4.1298 .0105
Note that the variations in mean scores among the various groups are so small as to have no practical impact on the Job Match Percent. Table C2 reveals the comparative analysis of mean raw scores in the Behavioral Traits section by ethnic group, flagging each instance of statistically significant differences. One may note these differences are rather small from a practical perspective. Table C2.
©2008, Profiles International, Inc., Waco, Texas
Appendix C-2
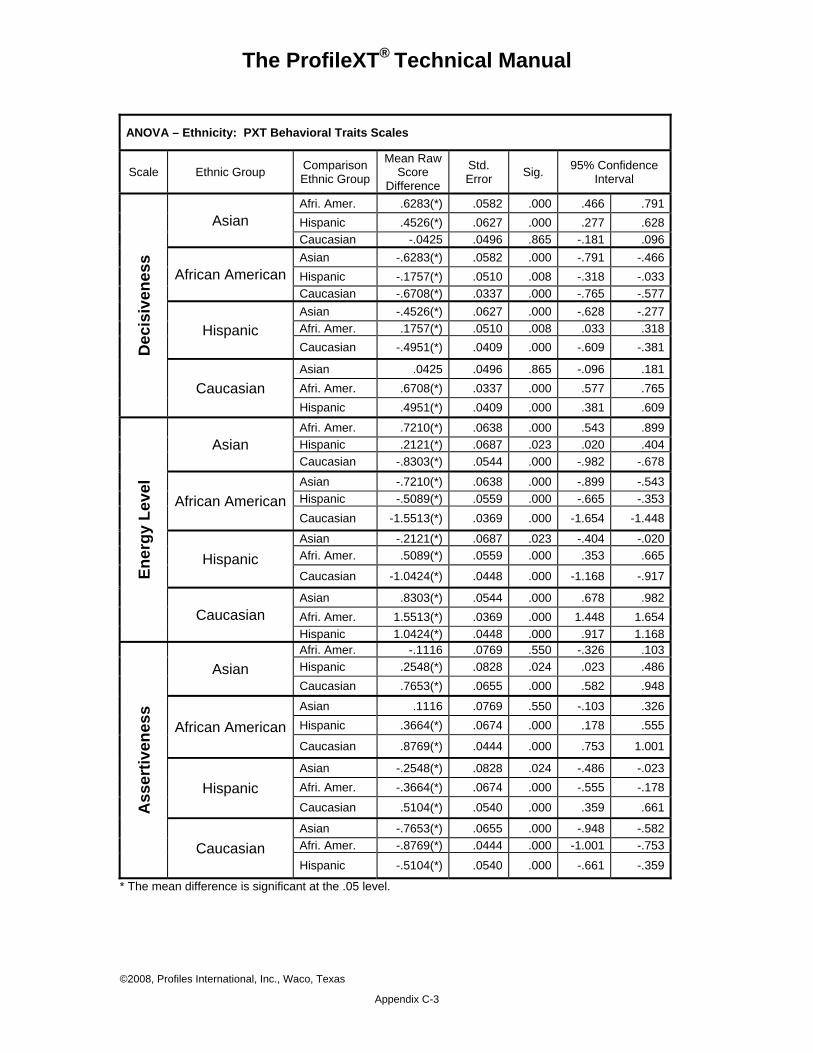
The ProfileXT® Technical Manual
ANOVA – Ethnicity: PXT Behavioral Traits Scales
Scale Ethnic Group Comparison Ethnic Group
Mean Raw Score
Difference
Std. Error Sig. 95% Confidence
Interval
Dec
isiv
enes
s
Asian Afri. Amer. .6283(*) .0582 .000 .466 .791Hispanic .4526(*) .0627 .000 .277 .628Caucasian -.0425 .0496 .865 -.181 .096
African American Asian -.6283(*) .0582 .000 -.791 -.466Hispanic -.1757(*) .0510 .008 -.318 -.033Caucasian -.6708(*) .0337 .000 -.765 -.577
Hispanic Asian -.4526(*) .0627 .000 -.628 -.277Afri. Amer. .1757(*) .0510 .008 .033 .318Caucasian -.4951(*) .0409 .000 -.609 -.381
Caucasian Asian .0425 .0496 .865 -.096 .181Afri. Amer. .6708(*) .0337 .000 .577 .765Hispanic .4951(*) .0409 .000 .381 .609
Ener
gy L
evel
Asian Afri. Amer. .7210(*) .0638 .000 .543 .899Hispanic .2121(*) .0687 .023 .020 .404Caucasian -.8303(*) .0544 .000 -.982 -.678
African American Asian -.7210(*) .0638 .000 -.899 -.543Hispanic -.5089(*) .0559 .000 -.665 -.353Caucasian -1.5513(*) .0369 .000 -1.654 -1.448
Hispanic Asian -.2121(*) .0687 .023 -.404 -.020Afri. Amer. .5089(*) .0559 .000 .353 .665
Caucasian -1.0424(*) .0448 .000 -1.168 -.917
Caucasian Asian .8303(*) .0544 .000 .678 .982Afri. Amer. 1.5513(*) .0369 .000 1.448 1.654Hispanic 1.0424(*) .0448 .000 .917 1.168
Ass
ertiv
enes
s
Asian Afri. Amer. -.1116 .0769 .550 -.326 .103Hispanic .2548(*) .0828 .024 .023 .486Caucasian .7653(*) .0655 .000 .582 .948
African American Asian .1116 .0769 .550 -.103 .326Hispanic .3664(*) .0674 .000 .178 .555
Caucasian .8769(*) .0444 .000 .753 1.001
Hispanic Asian -.2548(*) .0828 .024 -.486 -.023Afri. Amer. -.3664(*) .0674 .000 -.555 -.178
Caucasian .5104(*) .0540 .000 .359 .661
Caucasian Asian -.7653(*) .0655 .000 -.948 -.582Afri. Amer. -.8769(*) .0444 .000 -1.001 -.753
Hispanic -.5104(*) .0540 .000 -.661 -.359
* The mean difference is significant at the .05 level.
©2008, Profiles International, Inc., Waco, Texas
Appendix C-3
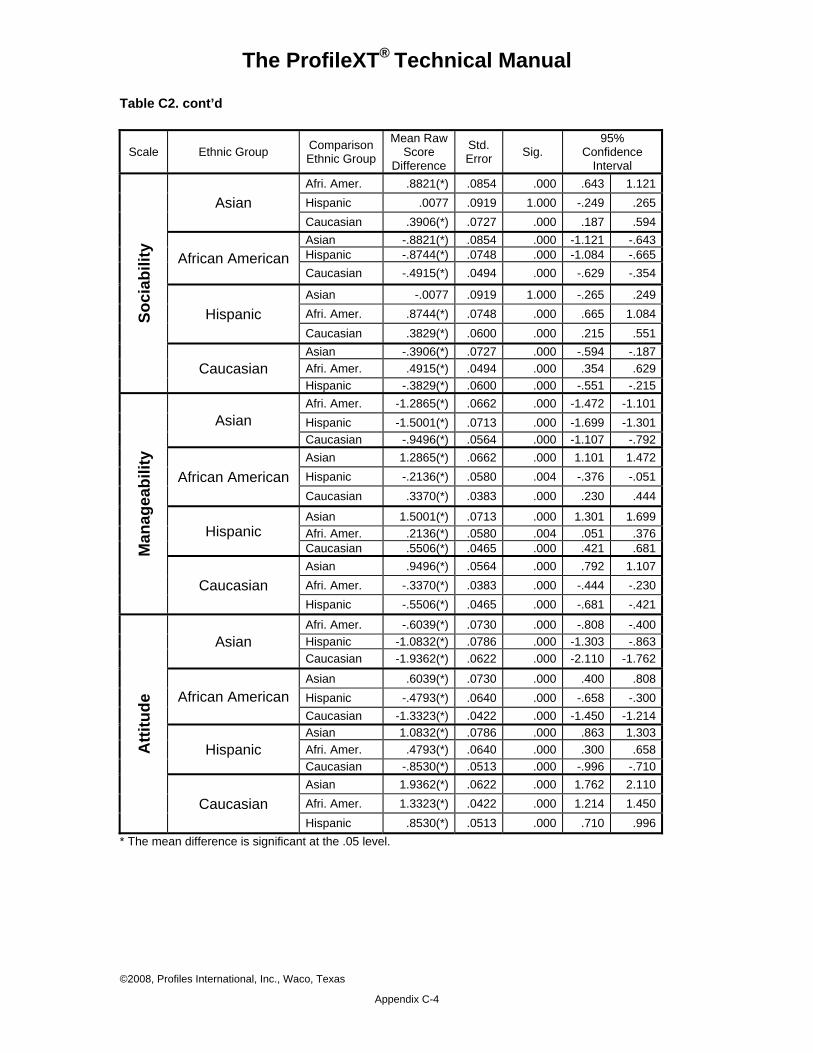
The ProfileXT® Technical Manual
Table C2. cont’d
Scale Ethnic Group Comparison Ethnic Group
Mean Raw Score
Difference
Std. Error Sig.
95% Confidence
Interval
Soci
abili
ty
Asian Afri. Amer. .8821(*) .0854 .000 .643 1.121Hispanic .0077 .0919 1.000 -.249 .265Caucasian .3906(*) .0727 .000 .187 .594
African American Asian -.8821(*) .0854 .000 -1.121 -.643Hispanic -.8744(*) .0748 .000 -1.084 -.665Caucasian -.4915(*) .0494 .000 -.629 -.354
Hispanic Asian -.0077 .0919 1.000 -.265 .249Afri. Amer. .8744(*) .0748 .000 .665 1.084Caucasian .3829(*) .0600 .000 .215 .551
Caucasian Asian -.3906(*) .0727 .000 -.594 -.187Afri. Amer. .4915(*) .0494 .000 .354 .629Hispanic -.3829(*) .0600 .000 -.551 -.215
Man
agea
bilit
y
Asian Afri. Amer. -1.2865(*) .0662 .000 -1.472 -1.101Hispanic -1.5001(*) .0713 .000 -1.699 -1.301Caucasian -.9496(*) .0564 .000 -1.107 -.792
African American Asian 1.2865(*) .0662 .000 1.101 1.472Hispanic -.2136(*) .0580 .004 -.376 -.051Caucasian .3370(*) .0383 .000 .230 .444
Hispanic Asian 1.5001(*) .0713 .000 1.301 1.699Afri. Amer. .2136(*) .0580 .004 .051 .376Caucasian .5506(*) .0465 .000 .421 .681
Caucasian Asian .9496(*) .0564 .000 .792 1.107Afri. Amer. -.3370(*) .0383 .000 -.444 -.230Hispanic -.5506(*) .0465 .000 -.681 -.421
Atti
tude
Asian Afri. Amer. -.6039(*) .0730 .000 -.808 -.400Hispanic -1.0832(*) .0786 .000 -1.303 -.863Caucasian -1.9362(*) .0622 .000 -2.110 -1.762
African American Asian .6039(*) .0730 .000 .400 .808Hispanic -.4793(*) .0640 .000 -.658 -.300Caucasian -1.3323(*) .0422 .000 -1.450 -1.214
Hispanic Asian 1.0832(*) .0786 .000 .863 1.303Afri. Amer. .4793(*) .0640 .000 .300 .658Caucasian -.8530(*) .0513 .000 -.996 -.710
Caucasian Asian 1.9362(*) .0622 .000 1.762 2.110Afri. Amer. 1.3323(*) .0422 .000 1.214 1.450Hispanic .8530(*) .0513 .000 .710 .996
* The mean difference is significant at the .05 level.
©2008, Profiles International, Inc., Waco, Texas
Appendix C-4
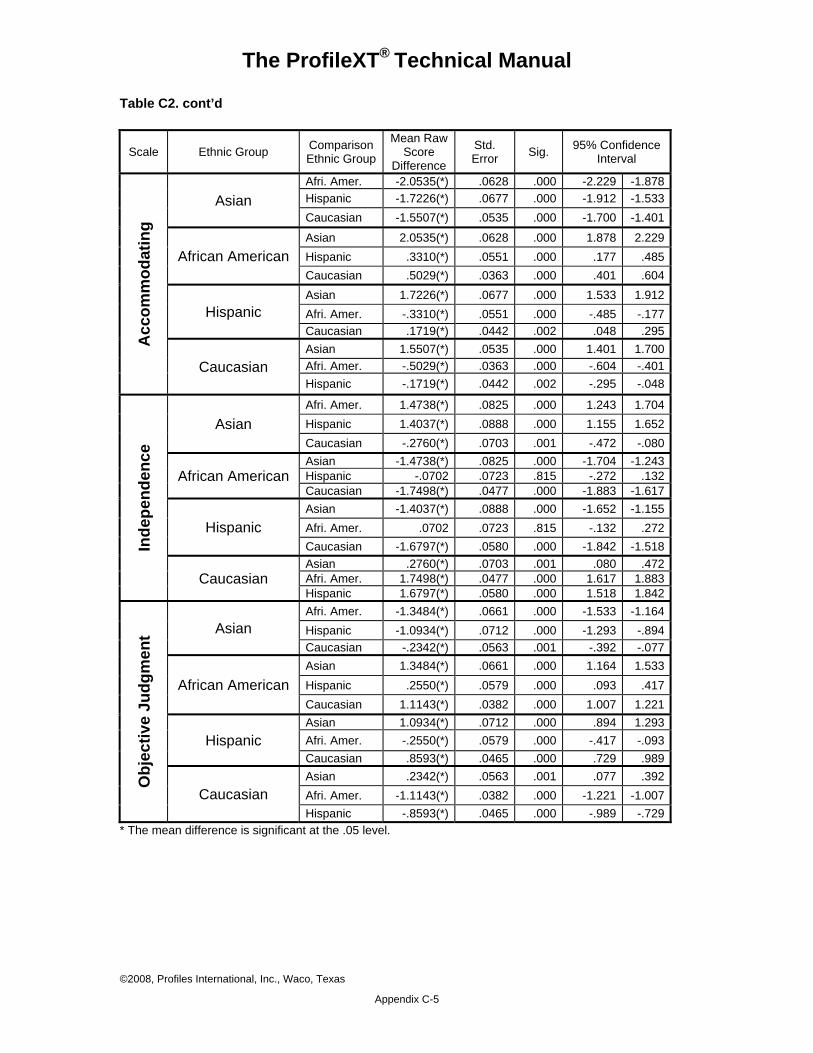
The ProfileXT® Technical Manual
Table C2. cont’d
Scale Ethnic Group Comparison Ethnic Group
Mean Raw Score
Difference
Std. Error Sig. 95% Confidence
Interval A
ccom
mod
atin
g
Asian Afri. Amer. -2.0535(*) .0628 .000 -2.229 -1.878Hispanic -1.7226(*) .0677 .000 -1.912 -1.533Caucasian -1.5507(*) .0535 .000 -1.700 -1.401
African American Asian 2.0535(*) .0628 .000 1.878 2.229Hispanic .3310(*) .0551 .000 .177 .485Caucasian .5029(*) .0363 .000 .401 .604
Hispanic Asian 1.7226(*) .0677 .000 1.533 1.912Afri. Amer. -.3310(*) .0551 .000 -.485 -.177Caucasian .1719(*) .0442 .002 .048 .295
Caucasian Asian 1.5507(*) .0535 .000 1.401 1.700Afri. Amer. -.5029(*) .0363 .000 -.604 -.401Hispanic -.1719(*) .0442 .002 -.295 -.048
Inde
pend
ence
Asian Afri. Amer. 1.4738(*) .0825 .000 1.243 1.704Hispanic 1.4037(*) .0888 .000 1.155 1.652Caucasian -.2760(*) .0703 .001 -.472 -.080
African American Asian -1.4738(*) .0825 .000 -1.704 -1.243Hispanic -.0702 .0723 .815 -.272 .132Caucasian -1.7498(*) .0477 .000 -1.883 -1.617
Hispanic Asian -1.4037(*) .0888 .000 -1.652 -1.155Afri. Amer. .0702 .0723 .815 -.132 .272Caucasian -1.6797(*) .0580 .000 -1.842 -1.518
Caucasian Asian .2760(*) .0703 .001 .080 .472Afri. Amer. 1.7498(*) .0477 .000 1.617 1.883Hispanic 1.6797(*) .0580 .000 1.518 1.842
Obj
ectiv
e Ju
dgm
ent Asian
Afri. Amer. -1.3484(*) .0661 .000 -1.533 -1.164Hispanic -1.0934(*) .0712 .000 -1.293 -.894Caucasian -.2342(*) .0563 .001 -.392 -.077
African American Asian 1.3484(*) .0661 .000 1.164 1.533Hispanic .2550(*) .0579 .000 .093 .417Caucasian 1.1143(*) .0382 .000 1.007 1.221
Hispanic Asian 1.0934(*) .0712 .000 .894 1.293Afri. Amer. -.2550(*) .0579 .000 -.417 -.093Caucasian .8593(*) .0465 .000 .729 .989
Caucasian Asian .2342(*) .0563 .001 .077 .392Afri. Amer. -1.1143(*) .0382 .000 -1.221 -1.007Hispanic -.8593(*) .0465 .000 -.989 -.729
* The mean difference is significant at the .05 level.
©2008, Profiles International, Inc., Waco, Texas
Appendix C-5
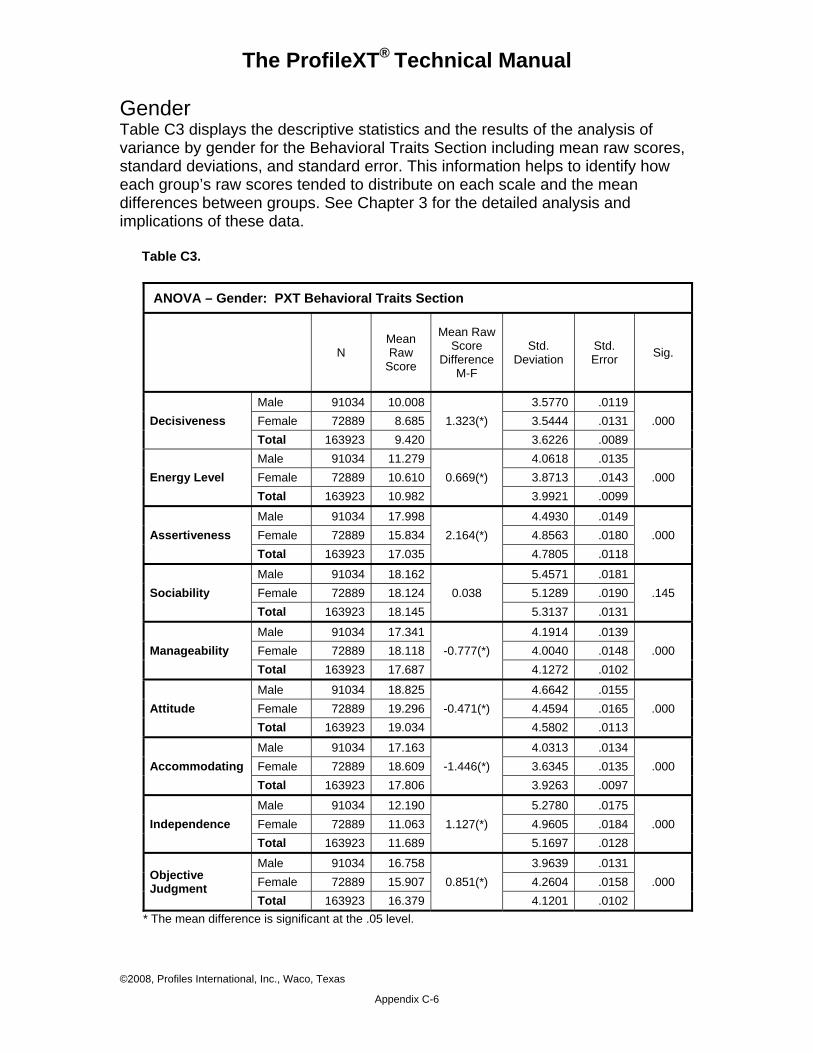
The ProfileXT® Technical Manual
Gender Table C3 displays the descriptive statistics and the results of the analysis of variance by gender for the Behavioral Traits Section including mean raw scores, standard deviations, and standard error. This information helps to identify how each group’s raw scores tended to distribute on each scale and the mean differences between groups. See Chapter 3 for the detailed analysis and implications of these data. Table C3.
ANOVA – Gender: PXT Behavioral Traits Section
N
Mean Raw
Score
Mean Raw Score
DifferenceM-F
Std. Deviation
Std. Error Sig.
Decisiveness Male 91034 10.008
1.323(*) 3.5770 .0119
.000 Female 72889 8.685 3.5444 .0131 Total 163923 9.420 3.6226 .0089
Energy Level Male 91034 11.279
0.669(*) 4.0618 .0135
.000 Female 72889 10.610 3.8713 .0143 Total 163923 10.982 3.9921 .0099
Assertiveness Male 91034 17.998
2.164(*) 4.4930 .0149
.000 Female 72889 15.834 4.8563 .0180 Total 163923 17.035 4.7805 .0118
Sociability Male 91034 18.162
0.038 5.4571 .0181
.145 Female 72889 18.124 5.1289 .0190 Total 163923 18.145 5.3137 .0131
Manageability Male 91034 17.341
-0.777(*) 4.1914 .0139
.000 Female 72889 18.118 4.0040 .0148 Total 163923 17.687 4.1272 .0102
Attitude Male 91034 18.825
-0.471(*) 4.6642 .0155
.000 Female 72889 19.296 4.4594 .0165 Total 163923 19.034 4.5802 .0113
Accommodating Male 91034 17.163
-1.446(*) 4.0313 .0134
.000 Female 72889 18.609 3.6345 .0135 Total 163923 17.806 3.9263 .0097
Independence Male 91034 12.190
1.127(*) 5.2780 .0175
.000 Female 72889 11.063 4.9605 .0184 Total 163923 11.689 5.1697 .0128
Objective Judgment
Male 91034 16.7580.851(*)
3.9639 .0131 .000 Female 72889 15.907 4.2604 .0158
Total 163923 16.379 4.1201 .0102 * The mean difference is significant at the .05 level.
©2008, Profiles International, Inc., Waco, Texas
Appendix C-6
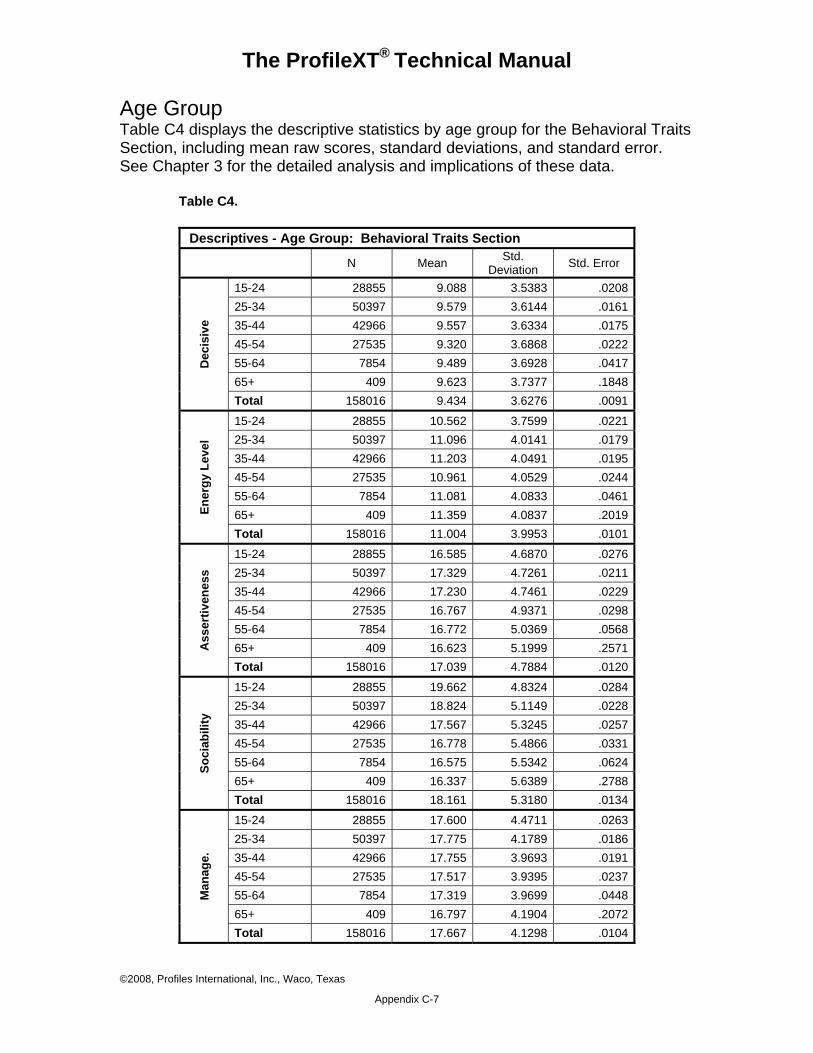
The ProfileXT® Technical Manual
Age Group Table C4 displays the descriptive statistics by age group for the Behavioral Traits Section, including mean raw scores, standard deviations, and standard error. See Chapter 3 for the detailed analysis and implications of these data. Table C4.
Descriptives - Age Group: Behavioral Traits Section
N Mean Std. Deviation Std. Error
Dec
isiv
e
15-24 28855 9.088 3.5383 .0208 25-34 50397 9.579 3.6144 .0161 35-44 42966 9.557 3.6334 .0175 45-54 27535 9.320 3.6868 .0222 55-64 7854 9.489 3.6928 .0417 65+ 409 9.623 3.7377 .1848 Total 158016 9.434 3.6276 .0091
Ener
gy L
evel
15-24 28855 10.562 3.7599 .0221 25-34 50397 11.096 4.0141 .0179 35-44 42966 11.203 4.0491 .0195 45-54 27535 10.961 4.0529 .0244 55-64 7854 11.081 4.0833 .0461 65+ 409 11.359 4.0837 .2019 Total 158016 11.004 3.9953 .0101
Ass
ertiv
enes
s
15-24 28855 16.585 4.6870 .0276 25-34 50397 17.329 4.7261 .0211 35-44 42966 17.230 4.7461 .0229 45-54 27535 16.767 4.9371 .0298 55-64 7854 16.772 5.0369 .0568 65+ 409 16.623 5.1999 .2571 Total 158016 17.039 4.7884 .0120
Soci
abili
ty
15-24 28855 19.662 4.8324 .0284 25-34 50397 18.824 5.1149 .0228 35-44 42966 17.567 5.3245 .0257 45-54 27535 16.778 5.4866 .0331 55-64 7854 16.575 5.5342 .0624 65+ 409 16.337 5.6389 .2788 Total 158016 18.161 5.3180 .0134
Man
age.
15-24 28855 17.600 4.4711 .0263 25-34 50397 17.775 4.1789 .0186 35-44 42966 17.755 3.9693 .0191 45-54 27535 17.517 3.9395 .0237 55-64 7854 17.319 3.9699 .0448 65+ 409 16.797 4.1904 .2072 Total 158016 17.667 4.1298 .0104
©2008, Profiles International, Inc., Waco, Texas
Appendix C-7
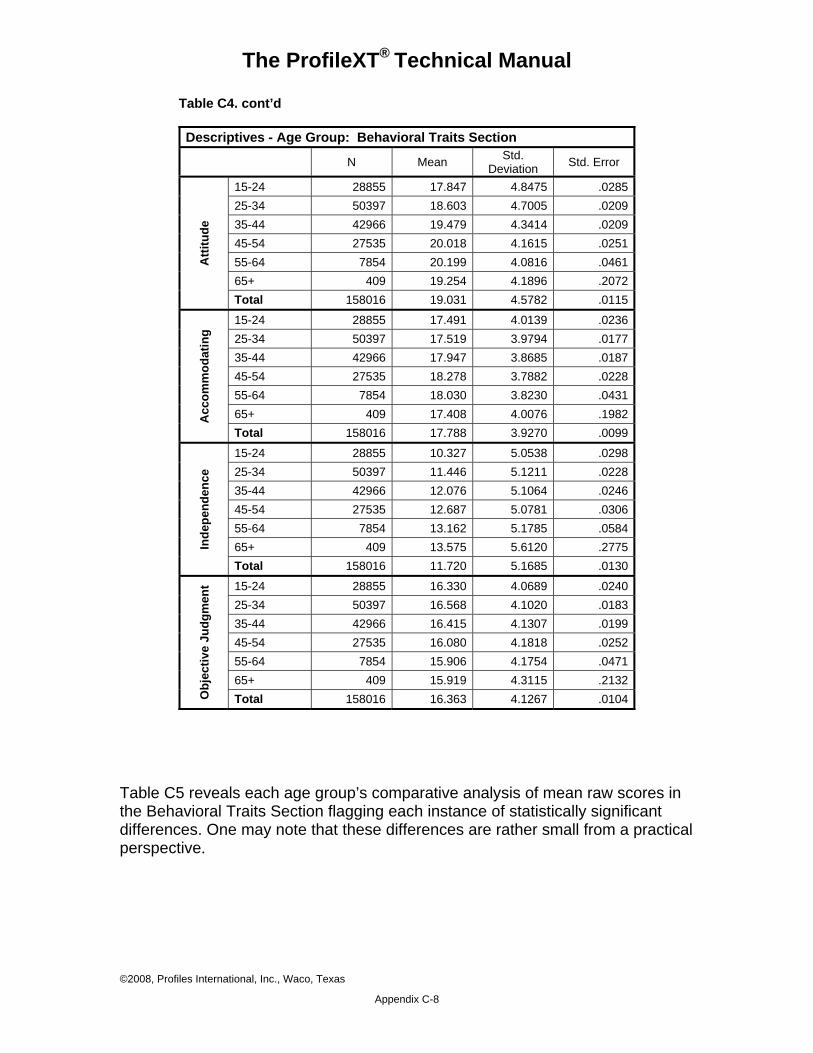
The ProfileXT® Technical Manual
Table C4. cont’d
Descriptives - Age Group: Behavioral Traits Section
N Mean Std. Deviation Std. Error
Atti
tude
15-24 28855 17.847 4.8475 .0285 25-34 50397 18.603 4.7005 .0209 35-44 42966 19.479 4.3414 .0209 45-54 27535 20.018 4.1615 .0251 55-64 7854 20.199 4.0816 .0461 65+ 409 19.254 4.1896 .2072 Total 158016 19.031 4.5782 .0115
Acc
omm
odat
ing
15-24 28855 17.491 4.0139 .0236 25-34 50397 17.519 3.9794 .0177 35-44 42966 17.947 3.8685 .0187 45-54 27535 18.278 3.7882 .0228 55-64 7854 18.030 3.8230 .0431 65+ 409 17.408 4.0076 .1982 Total 158016 17.788 3.9270 .0099
Inde
pend
ence
15-24 28855 10.327 5.0538 .0298 25-34 50397 11.446 5.1211 .0228 35-44 42966 12.076 5.1064 .0246 45-54 27535 12.687 5.0781 .0306 55-64 7854 13.162 5.1785 .0584 65+ 409 13.575 5.6120 .2775 Total 158016 11.720 5.1685 .0130
Obj
ectiv
e Ju
dgm
ent 15-24 28855 16.330 4.0689 .0240
25-34 50397 16.568 4.1020 .0183 35-44 42966 16.415 4.1307 .0199 45-54 27535 16.080 4.1818 .0252 55-64 7854 15.906 4.1754 .0471 65+ 409 15.919 4.3115 .2132 Total 158016 16.363 4.1267 .0104
Table C5 reveals each age group’s comparative analysis of mean raw scores in the Behavioral Traits Section flagging each instance of statistically significant differences. One may note that these differences are rather small from a practical perspective.
©2008, Profiles International, Inc., Waco, Texas
Appendix C-8

The ProfileXT® Technical Manual
Table C5.
ANOVA - Age Group: Behavioral Traits Section
Dependent Variable
(I) Reference Age Group
(J) Focus Age Group
Mean Difference
(I-J) Std. Error Sig.
95% Confidence Interval Lower Bound
Upper Bound
Dec
isiv
enes
s
15-24
25-34 -.4908(*) .0267 .000 -.580 -.40235-44 -.4694(*) .0276 .000 -.561 -.37845-54 -.2316(*) .0305 .000 -.333 -.13055-64 -.4007(*) .0461 .000 -.554 -.24765+ -.5355 .1804 .117 -1.136 .065
25-34
15-24 .4908(*) .0267 .000 .402 .58035-44 .0214 .0238 .977 -.058 .10145-54 .2592(*) .0271 .000 .169 .35055-64 .0901 .0439 .521 -.056 .23665+ -.0447 .1799 1.000 -.643 .554
35-44
15-24 .4694(*) .0276 .000 .378 .56125-34 -.0214 .0238 .977 -.101 .05845-54 .2379(*) .0280 .000 .145 .33155-64 .0687 .0445 .793 -.079 .21765+ -.0661 .1800 1.000 -.665 .533
45-54
15-24 .2316(*) .0305 .000 .130 .33325-34 -.2592(*) .0271 .000 -.350 -.16935-44 -.2379(*) .0280 .000 -.331 -.14555-64 -.1691(*) .0463 .021 -.323 -.01565+ -.3040 .1805 .725 -.904 .297
55-64
15-24 .4007(*) .0461 .000 .247 .55425-34 -.0901 .0439 .521 -.236 .05635-44 -.0687 .0445 .793 -.217 .07945-54 .1691(*) .0463 .021 .015 .32365+ -.1348 .1837 .991 -.746 .477
65+
15-24 .5355 .1804 .117 -.065 1.13625-34 .0447 .1799 1.000 -.554 .64335-44 .0661 .1800 1.000 -.533 .66545-54 .3040 .1805 .725 -.297 .90455-64 .1348 .1837 .991 -.477 .746
* The mean difference is significant at the .05 level.
©2008, Profiles International, Inc., Waco, Texas
Appendix C-9

The ProfileXT® Technical Manual
Table C5. cont’d
ANOVA- Age Group: Behavioral Traits Section
Dependent Variable
(I) Reference Age Group
(J) Focus Age Group
Mean Difference
(I-J) Std. Error Sig.
95% Confidence Interval Lower Bound
Upper Bound
Ener
gy L
evel
15-24
25-34 -.5344(*) .0294 .000 -.632 -.43635-44 -.6406(*) .0304 .000 -.742 -.54045-54 -.3989(*) .0336 .000 -.511 -.28755-64 -.5191(*) .0508 .000 -.688 -.35065+ -.7974(*) .1986 .007 -1.458 -.136
25-34
15-24 .5344(*) .0294 .000 .436 .63235-44 -.1062(*) .0262 .006 -.193 -.01945-54 .1355(*) .0299 .001 .036 .23555-64 .0153 .0484 1.000 -.146 .17665+ -.2630 .1980 .881 -.922 .396
35-44
15-24 .6406(*) .0304 .000 .540 .74225-34 .1062(*) .0262 .006 .019 .19345-54 .2417(*) .0308 .000 .139 .34455-64 .1215 .0490 .291 -.041 .28465+ -.1568 .1982 .987 -.816 .503
45-54
15-24 .3989(*) .0336 .000 .287 .51125-34 -.1355(*) .0299 .001 -.235 -.03635-44 -.2417(*) .0308 .000 -.344 -.13955-64 -.1202 .0510 .353 -.290 .05065+ -.3985 .1987 .546 -1.060 .263
55-64
15-24 .5191(*) .0508 .000 .350 .68825-34 -.0153 .0484 1.000 -.176 .14635-44 -.1215 .0490 .291 -.284 .04145-54 .1202 .0510 .353 -.050 .29065+ -.2783 .2023 .864 -.951 .395
65+
15-24 .7974(*) .1986 .007 .136 1.45825-34 .2630 .1980 .881 -.396 .92235-44 .1568 .1982 .987 -.503 .81645-54 .3985 .1987 .546 -.263 1.06055-64 .2783 .2023 .864 -.395 .951
* The mean difference is significant at the .05 level.
©2008, Profiles International, Inc., Waco, Texas
Appendix C-10

The ProfileXT® Technical Manual
Table C5. cont’d
ANOVA - Age Group: Behavioral Traits Section
Dependent Variable
(I) Reference Age Group
(J) Focus Age Group
Mean Difference
(I-J) Std. Error Sig.
95% Confidence Interval Lower Bound
Upper Bound
Ass
ertiv
enes
s
15-24
25-34 -.7439(*) .0353 .000 -.861 -.62735-44 -.6452(*) .0364 .000 -.766 -.52445-54 -.1821(*) .0403 .001 -.316 -.04855-64 -.1869 .0608 .093 -.389 .01565+ -.0384 .2380 1.000 -.830 .753
25-34
15-24 .7439(*) .0353 .000 .627 .86135-44 .0987 .0314 .078 -.006 .20345-54 .5619(*) .0358 .000 .443 .68155-64 .5570(*) .0580 .000 .364 .75065+ .7055 .2373 .116 -.084 1.495
35-44
15-24 .6452(*) .0364 .000 .524 .76625-34 -.0987 .0314 .078 -.203 .00645-54 .4631(*) .0369 .000 .340 .58655-64 .4583(*) .0586 .000 .263 .65365+ .6068 .2374 .258 -.183 1.397
45-54
15-24 .1821(*) .0403 .001 .048 .31625-34 -.5619(*) .0358 .000 -.681 -.44335-44 -.4631(*) .0369 .000 -.586 -.34055-64 -.0048 .0611 1.000 -.208 .19965+ .1437 .2381 .996 -.648 .936
55-64
15-24 .1869 .0608 .093 -.015 .38925-34 -.5570(*) .0580 .000 -.750 -.36435-44 -.4583(*) .0586 .000 -.653 -.26345-54 .0048 .0611 1.000 -.199 .20865+ .1485 .2424 .996 -.658 .955
65+
15-24 .0384 .2380 1.000 -.753 .83025-34 -.7055 .2373 .116 -1.495 .08435-44 -.6068 .2374 .258 -1.397 .18345-54 -.1437 .2381 .996 -.936 .64855-64 -.1485 .2424 .996 -.955 .658
* The mean difference is significant at the .05 level.
©2008, Profiles International, Inc., Waco, Texas
Appendix C-11

The ProfileXT® Technical Manual
Table C5.
ANOVA - Age Group: Behavioral Traits Section
Dependent Variable
(I) Reference Age Group
(J) Focus Age Group
Mean Difference
(I-J) Std. Error Sig.
95% Confidence Interval Lower Bound
Upper Bound
Soci
abili
ty
15-24
25-34 .8380(*) .0385 .000 .710 .96635-44 2.0950(*) .0397 .000 1.963 2.22745-54 2.8844(*) .0439 .000 2.738 3.03155-64 3.0869(*) .0663 .000 2.866 3.30865+ 3.3247(*) .2595 .000 2.461 4.188
25-34
15-24 -.8380(*) .0385 .000 -.966 -.71035-44 1.2570(*) .0342 .000 1.143 1.37145-54 2.0465(*) .0391 .000 1.917 2.17655-64 2.2489(*) .0632 .000 2.039 2.45965+ 2.4867(*) .2588 .000 1.626 3.348
35-44
15-24 -2.0950(*) .0397 .000 -2.227 -1.96325-34 -1.2570(*) .0342 .000 -1.371 -1.14345-54 .7895(*) .0402 .000 .656 .92355-64 .9919(*) .0640 .000 .779 1.20565+ 1.2297(*) .2590 .000 .368 2.091
45-54
15-24 -2.8844(*) .0439 .000 -3.031 -2.73825-34 -2.0465(*) .0391 .000 -2.176 -1.91735-44 -.7895(*) .0402 .000 -.923 -.65655-64 .2024 .0667 .101 -.019 .42465+ .4403 .2596 .719 -.424 1.304
55-64
15-24 -3.0869(*) .0663 .000 -3.308 -2.86625-34 -2.2489(*) .0632 .000 -2.459 -2.03935-44 -.9919(*) .0640 .000 -1.205 -.77945-54 -.2024 .0667 .101 -.424 .01965+ .2378 .2644 .976 -.642 1.117
65+
15-24 -3.3247(*) .2595 .000 -4.188 -2.46125-34 -2.4867(*) .2588 .000 -3.348 -1.62635-44 -1.2297(*) .2590 .000 -2.091 -.36845-54 -.4403 .2596 .719 -1.304 .42455-64 -.2378 .2644 .976 -1.117 .642
* The mean difference is significant at the .05 level.
©2008, Profiles International, Inc., Waco, Texas
Appendix C-12
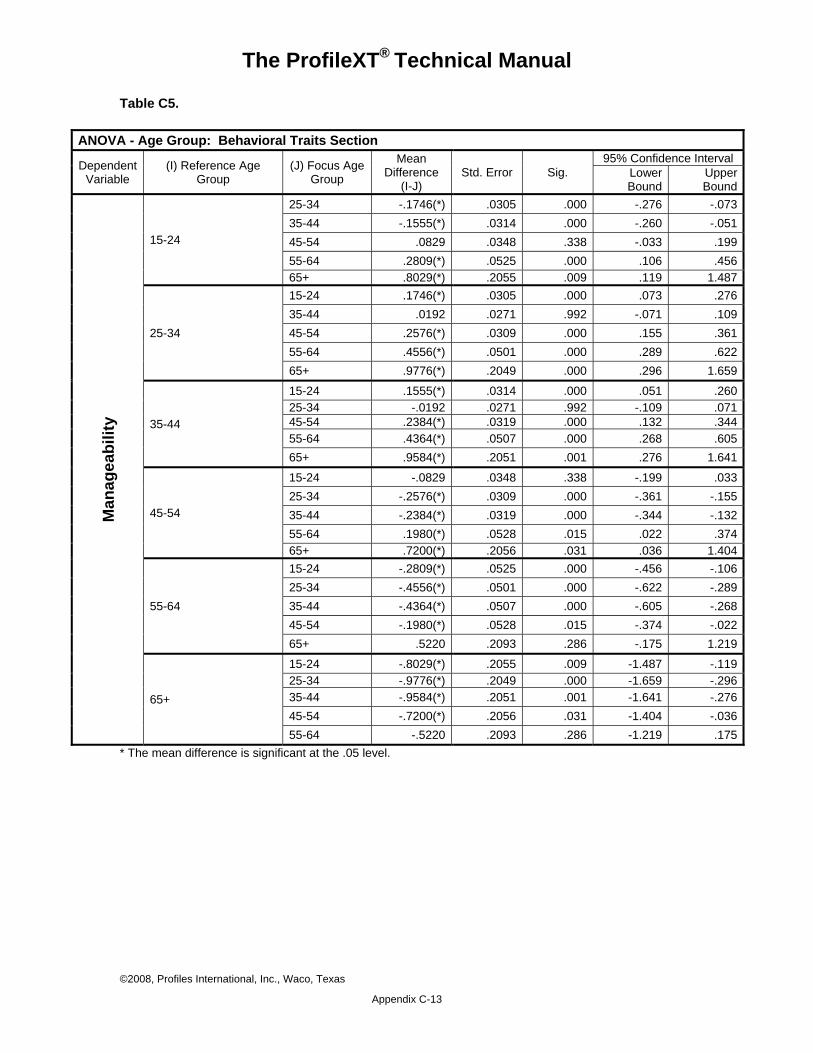
The ProfileXT® Technical Manual
Table C5.
ANOVA - Age Group: Behavioral Traits Section
Dependent Variable
(I) Reference Age Group
(J) Focus Age Group
Mean Difference
(I-J) Std. Error Sig.
95% Confidence Interval Lower Bound
Upper Bound
Man
agea
bilit
y
15-24
25-34 -.1746(*) .0305 .000 -.276 -.07335-44 -.1555(*) .0314 .000 -.260 -.05145-54 .0829 .0348 .338 -.033 .19955-64 .2809(*) .0525 .000 .106 .45665+ .8029(*) .2055 .009 .119 1.487
25-34
15-24 .1746(*) .0305 .000 .073 .27635-44 .0192 .0271 .992 -.071 .10945-54 .2576(*) .0309 .000 .155 .36155-64 .4556(*) .0501 .000 .289 .62265+ .9776(*) .2049 .000 .296 1.659
35-44
15-24 .1555(*) .0314 .000 .051 .26025-34 -.0192 .0271 .992 -.109 .07145-54 .2384(*) .0319 .000 .132 .34455-64 .4364(*) .0507 .000 .268 .60565+ .9584(*) .2051 .001 .276 1.641
45-54
15-24 -.0829 .0348 .338 -.199 .03325-34 -.2576(*) .0309 .000 -.361 -.15535-44 -.2384(*) .0319 .000 -.344 -.13255-64 .1980(*) .0528 .015 .022 .37465+ .7200(*) .2056 .031 .036 1.404
55-64
15-24 -.2809(*) .0525 .000 -.456 -.10625-34 -.4556(*) .0501 .000 -.622 -.28935-44 -.4364(*) .0507 .000 -.605 -.26845-54 -.1980(*) .0528 .015 -.374 -.02265+ .5220 .2093 .286 -.175 1.219
65+
15-24 -.8029(*) .2055 .009 -1.487 -.11925-34 -.9776(*) .2049 .000 -1.659 -.29635-44 -.9584(*) .2051 .001 -1.641 -.27645-54 -.7200(*) .2056 .031 -1.404 -.03655-64 -.5220 .2093 .286 -1.219 .175
* The mean difference is significant at the .05 level.
©2008, Profiles International, Inc., Waco, Texas
Appendix C-13
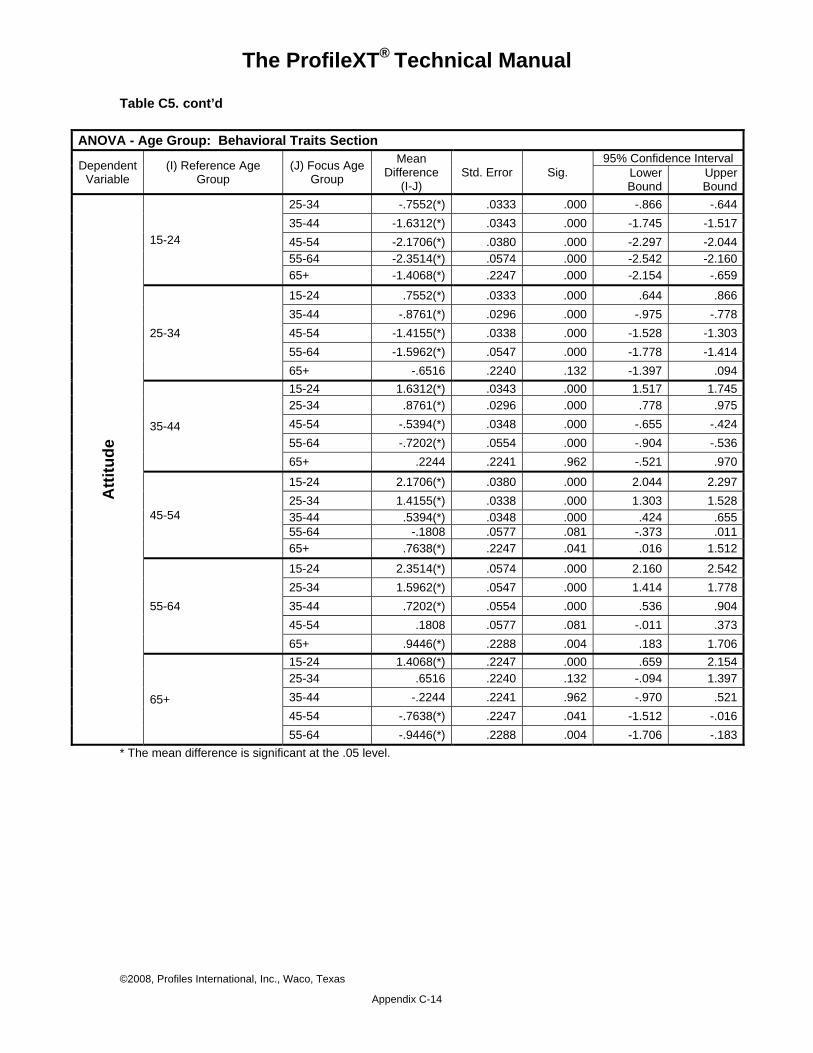
The ProfileXT® Technical Manual
Table C5. cont’d
ANOVA - Age Group: Behavioral Traits Section
Dependent Variable
(I) Reference Age Group
(J) Focus Age Group
Mean Difference
(I-J) Std. Error Sig.
95% Confidence Interval Lower Bound
Upper Bound
Atti
tude
15-24
25-34 -.7552(*) .0333 .000 -.866 -.64435-44 -1.6312(*) .0343 .000 -1.745 -1.51745-54 -2.1706(*) .0380 .000 -2.297 -2.04455-64 -2.3514(*) .0574 .000 -2.542 -2.16065+ -1.4068(*) .2247 .000 -2.154 -.659
25-34
15-24 .7552(*) .0333 .000 .644 .86635-44 -.8761(*) .0296 .000 -.975 -.77845-54 -1.4155(*) .0338 .000 -1.528 -1.30355-64 -1.5962(*) .0547 .000 -1.778 -1.41465+ -.6516 .2240 .132 -1.397 .094
35-44
15-24 1.6312(*) .0343 .000 1.517 1.74525-34 .8761(*) .0296 .000 .778 .97545-54 -.5394(*) .0348 .000 -.655 -.42455-64 -.7202(*) .0554 .000 -.904 -.53665+ .2244 .2241 .962 -.521 .970
45-54
15-24 2.1706(*) .0380 .000 2.044 2.29725-34 1.4155(*) .0338 .000 1.303 1.52835-44 .5394(*) .0348 .000 .424 .65555-64 -.1808 .0577 .081 -.373 .01165+ .7638(*) .2247 .041 .016 1.512
55-64
15-24 2.3514(*) .0574 .000 2.160 2.54225-34 1.5962(*) .0547 .000 1.414 1.77835-44 .7202(*) .0554 .000 .536 .90445-54 .1808 .0577 .081 -.011 .37365+ .9446(*) .2288 .004 .183 1.706
65+
15-24 1.4068(*) .2247 .000 .659 2.15425-34 .6516 .2240 .132 -.094 1.39735-44 -.2244 .2241 .962 -.970 .52145-54 -.7638(*) .2247 .041 -1.512 -.01655-64 -.9446(*) .2288 .004 -1.706 -.183
* The mean difference is significant at the .05 level.
©2008, Profiles International, Inc., Waco, Texas
Appendix C-14

The ProfileXT® Technical Manual
Table C5. cont’d
ANOVA - Age Group: Behavioral Traits Section
Dependent Variable
(I) Reference Age Group
(J) Focus Age Group
Mean Difference
(I-J) Std. Error Sig.
95% Confidence Interval Lower Bound
Upper Bound
Acc
omm
odat
ing
1.00
2.00 -.0284 .0289 .965 -.125 .0683.00 -.4566(*) .0298 .000 -.556 -.3574.00 -.7874(*) .0330 .000 -.897 -.6785.00 -.5392(*) .0498 .000 -.705 -.3736.00 .0825 .1950 .999 -.566 .731
2.00
1.00 .0284 .0289 .965 -.068 .1253.00 -.4282(*) .0257 .000 -.514 -.3434.00 -.7590(*) .0293 .000 -.857 -.6615.00 -.5108(*) .0475 .000 -.669 -.3536.00 .1109 .1944 .997 -.536 .758
3.00
1.00 .4566(*) .0298 .000 .357 .5562.00 .4282(*) .0257 .000 .343 .5144.00 -.3308(*) .0302 .000 -.431 -.2305.00 -.0826 .0480 .707 -.242 .0776.00 .5391 .1945 .175 -.108 1.186
4.00
1.00 .7874(*) .0330 .000 .678 .8972.00 .7590(*) .0293 .000 .661 .8573.00 .3308(*) .0302 .000 .230 .4315.00 .2481(*) .0501 .000 .081 .4156.00 .8699(*) .1950 .001 .221 1.519
5.00
1.00 .5392(*) .0498 .000 .373 .7052.00 .5108(*) .0475 .000 .353 .6693.00 .0826 .0480 .707 -.077 .2424.00 -.2481(*) .0501 .000 -.415 -.0816.00 .6217 .1986 .081 -.039 1.282
6.00
1.00 -.0825 .1950 .999 -.731 .5662.00 -.1109 .1944 .997 -.758 .5363.00 -.5391 .1945 .175 -1.186 .1084.00 -.8699(*) .1950 .001 -1.519 -.2215.00 -.6217 .1986 .081 -1.282 .039
* The mean difference is significant at the .05 level.
©2008, Profiles International, Inc., Waco, Texas
Appendix C-15

The ProfileXT® Technical Manual
Table C5. Cont’d
ANOVA - Age Group: Behavioral Traits Section
Dependent Variable
(I) Reference Age Group
(J) Focus Age Group
Mean Difference
(I-J) Std. Error Sig.
95% Confidence Interval Lower Bound
Upper Bound
Inde
pend
ence
15-24
25-34 -1.1191(*) .0377 .000 -1.244 -.99435-44 -1.7489(*) .0388 .000 -1.878 -1.62045-54 -2.3599(*) .0430 .000 -2.503 -2.21755-64 -2.8356(*) .0649 .000 -3.052 -2.62065+ -3.2477(*) .2540 .000 -4.093 -2.402
25-34
15-24 1.1191(*) .0377 .000 .994 1.24435-44 -.6298(*) .0335 .000 -.741 -.51845-54 -1.2408(*) .0382 .000 -1.368 -1.11455-64 -1.7164(*) .0619 .000 -1.922 -1.51165+ -2.1286(*) .2533 .000 -2.971 -1.286
35-44
15-24 1.7489(*) .0388 .000 1.620 1.87825-34 .6298(*) .0335 .000 .518 .74145-54 -.6110(*) .0394 .000 -.742 -.48055-64 -1.0866(*) .0626 .000 -1.295 -.87865+ -1.4987(*) .2535 .000 -2.342 -.655
45-54
15-24 2.3599(*) .0430 .000 2.217 2.50325-34 1.2408(*) .0382 .000 1.114 1.36835-44 .6110(*) .0394 .000 .480 .74255-64 -.4756(*) .0653 .000 -.693 -.25865+ -.8877(*) .2541 .032 -1.733 -.042
55-64
15-24 2.8356(*) .0649 .000 2.620 3.05225-34 1.7164(*) .0619 .000 1.511 1.92235-44 1.0866(*) .0626 .000 .878 1.29545-54 .4756(*) .0653 .000 .258 .69365+ -.4121 .2587 .771 -1.273 .449
65+
15-24 3.2477(*) .2540 .000 2.402 4.09325-34 2.1286(*) .2533 .000 1.286 2.97135-44 1.4987(*) .2535 .000 .655 2.34245-54 .8877(*) .2541 .032 .042 1.73355-64 .4121 .2587 .771 -.449 1.273
* The mean difference is significant at the .05 level.
©2008, Profiles International, Inc., Waco, Texas
Appendix C-16
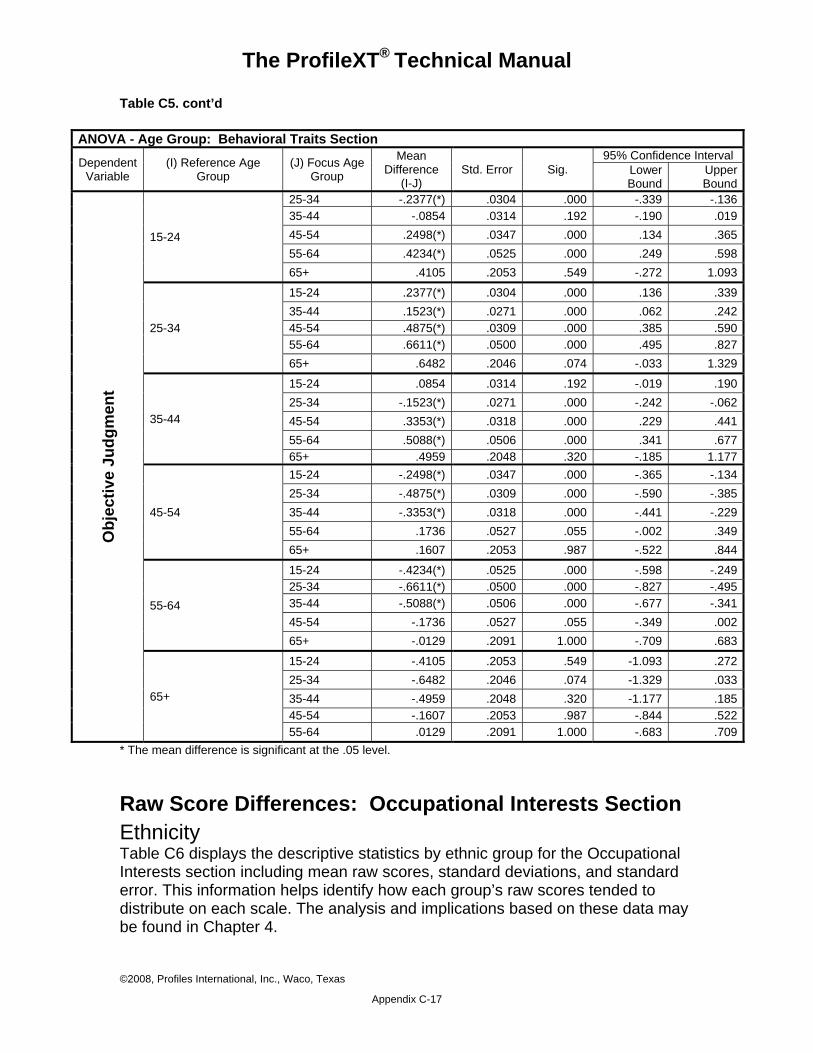
The ProfileXT® Technical Manual
Table C5. cont’d
ANOVA - Age Group: Behavioral Traits Section
Dependent Variable
(I) Reference Age Group
(J) Focus Age Group
Mean Difference
(I-J) Std. Error Sig.
95% Confidence Interval Lower Bound
Upper Bound
Obj
ectiv
e Ju
dgm
ent
15-24
25-34 -.2377(*) .0304 .000 -.339 -.13635-44 -.0854 .0314 .192 -.190 .01945-54 .2498(*) .0347 .000 .134 .36555-64 .4234(*) .0525 .000 .249 .59865+ .4105 .2053 .549 -.272 1.093
25-34
15-24 .2377(*) .0304 .000 .136 .33935-44 .1523(*) .0271 .000 .062 .24245-54 .4875(*) .0309 .000 .385 .59055-64 .6611(*) .0500 .000 .495 .82765+ .6482 .2046 .074 -.033 1.329
35-44
15-24 .0854 .0314 .192 -.019 .19025-34 -.1523(*) .0271 .000 -.242 -.06245-54 .3353(*) .0318 .000 .229 .44155-64 .5088(*) .0506 .000 .341 .67765+ .4959 .2048 .320 -.185 1.177
45-54
15-24 -.2498(*) .0347 .000 -.365 -.13425-34 -.4875(*) .0309 .000 -.590 -.38535-44 -.3353(*) .0318 .000 -.441 -.22955-64 .1736 .0527 .055 -.002 .34965+ .1607 .2053 .987 -.522 .844
55-64
15-24 -.4234(*) .0525 .000 -.598 -.24925-34 -.6611(*) .0500 .000 -.827 -.49535-44 -.5088(*) .0506 .000 -.677 -.34145-54 -.1736 .0527 .055 -.349 .00265+ -.0129 .2091 1.000 -.709 .683
65+
15-24 -.4105 .2053 .549 -1.093 .27225-34 -.6482 .2046 .074 -1.329 .03335-44 -.4959 .2048 .320 -1.177 .18545-54 -.1607 .2053 .987 -.844 .52255-64 .0129 .2091 1.000 -.683 .709
* The mean difference is significant at the .05 level.
Raw Score Differences: Occupational Interests Section Ethnicity Table C6 displays the descriptive statistics by ethnic group for the Occupational Interests section including mean raw scores, standard deviations, and standard error. This information helps identify how each group’s raw scores tended to distribute on each scale. The analysis and implications based on these data may be found in Chapter 4.
©2008, Profiles International, Inc., Waco, Texas
Appendix C-17
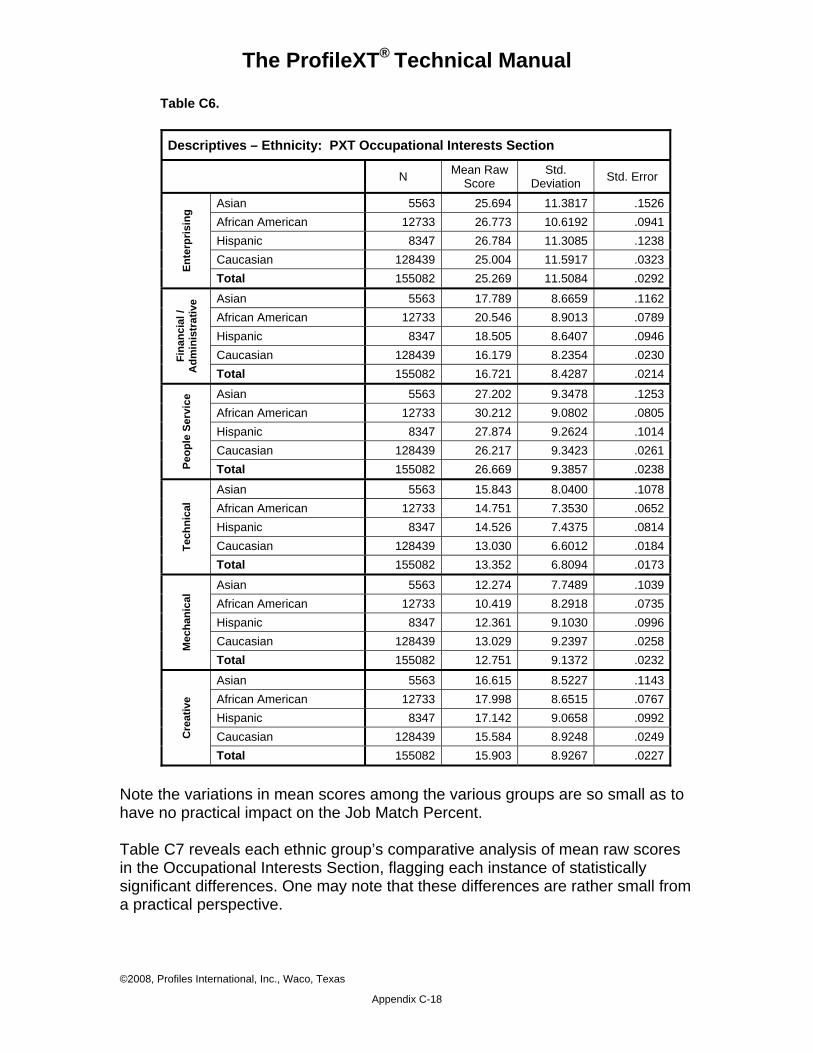
The ProfileXT® Technical Manual
Table C6.
Descriptives – Ethnicity: PXT Occupational Interests Section
N Mean Raw Score
Std. Deviation Std. Error
Ente
rpris
ing
Asian 5563 25.694 11.3817 .1526African American 12733 26.773 10.6192 .0941Hispanic 8347 26.784 11.3085 .1238Caucasian 128439 25.004 11.5917 .0323Total 155082 25.269 11.5084 .0292
Fina
ncia
l /
Adm
inis
trat
ive Asian 5563 17.789 8.6659 .1162
African American 12733 20.546 8.9013 .0789Hispanic 8347 18.505 8.6407 .0946Caucasian 128439 16.179 8.2354 .0230Total 155082 16.721 8.4287 .0214
Peop
le S
ervi
ce Asian 5563 27.202 9.3478 .1253
African American 12733 30.212 9.0802 .0805Hispanic 8347 27.874 9.2624 .1014Caucasian 128439 26.217 9.3423 .0261Total 155082 26.669 9.3857 .0238
Tech
nica
l
Asian 5563 15.843 8.0400 .1078African American 12733 14.751 7.3530 .0652Hispanic 8347 14.526 7.4375 .0814Caucasian 128439 13.030 6.6012 .0184Total 155082 13.352 6.8094 .0173
Mec
hani
cal
Asian 5563 12.274 7.7489 .1039African American 12733 10.419 8.2918 .0735Hispanic 8347 12.361 9.1030 .0996Caucasian 128439 13.029 9.2397 .0258Total 155082 12.751 9.1372 .0232
Cre
ativ
e
Asian 5563 16.615 8.5227 .1143African American 12733 17.998 8.6515 .0767Hispanic 8347 17.142 9.0658 .0992Caucasian 128439 15.584 8.9248 .0249Total 155082 15.903 8.9267 .0227
Note the variations in mean scores among the various groups are so small as to have no practical impact on the Job Match Percent. Table C7 reveals each ethnic group’s comparative analysis of mean raw scores in the Occupational Interests Section, flagging each instance of statistically significant differences. One may note that these differences are rather small from a practical perspective.
©2008, Profiles International, Inc., Waco, Texas
Appendix C-18
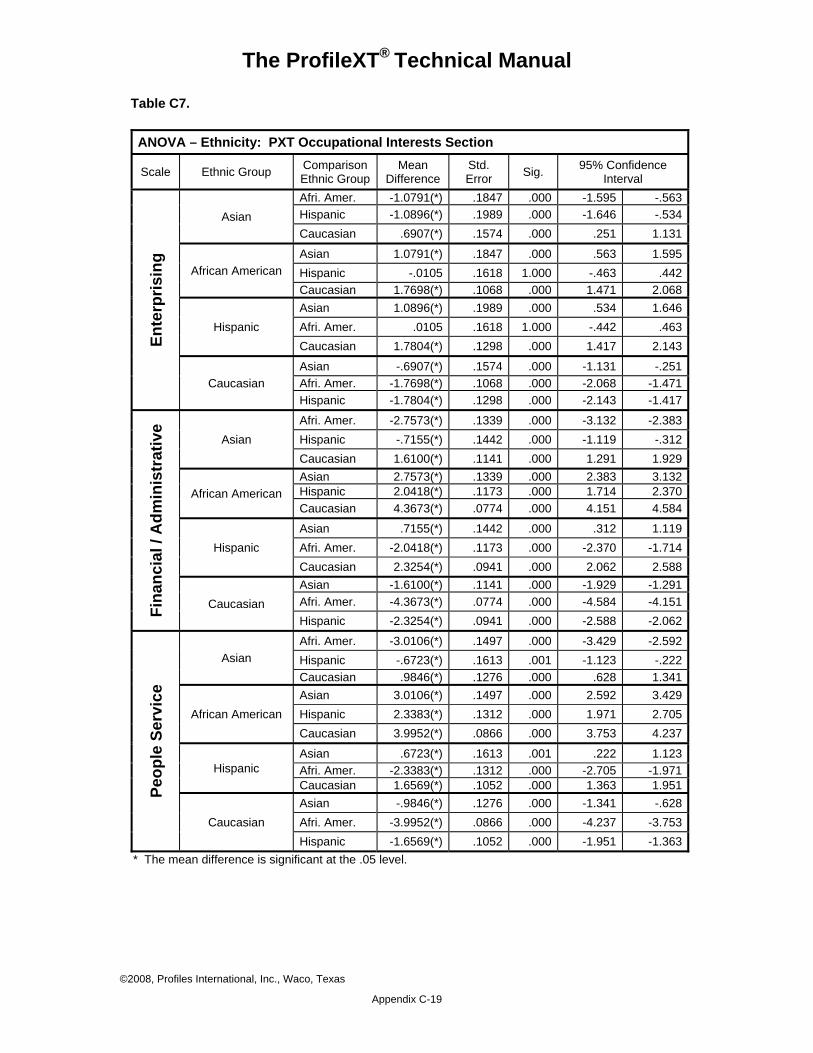
The ProfileXT® Technical Manual
Table C7.
ANOVA – Ethnicity: PXT Occupational Interests Section
Scale Ethnic Group Comparison Ethnic Group
Mean Difference
Std. Error Sig. 95% Confidence
Interval
Ente
rpris
ing
Asian Afri. Amer. -1.0791(*) .1847 .000 -1.595 -.563Hispanic -1.0896(*) .1989 .000 -1.646 -.534Caucasian .6907(*) .1574 .000 .251 1.131
African American Asian 1.0791(*) .1847 .000 .563 1.595Hispanic -.0105 .1618 1.000 -.463 .442Caucasian 1.7698(*) .1068 .000 1.471 2.068
Hispanic Asian 1.0896(*) .1989 .000 .534 1.646Afri. Amer. .0105 .1618 1.000 -.442 .463Caucasian 1.7804(*) .1298 .000 1.417 2.143
Caucasian Asian -.6907(*) .1574 .000 -1.131 -.251Afri. Amer. -1.7698(*) .1068 .000 -2.068 -1.471Hispanic -1.7804(*) .1298 .000 -2.143 -1.417
Fina
ncia
l / A
dmin
istr
ativ
e
Asian Afri. Amer. -2.7573(*) .1339 .000 -3.132 -2.383Hispanic -.7155(*) .1442 .000 -1.119 -.312Caucasian 1.6100(*) .1141 .000 1.291 1.929
African American Asian 2.7573(*) .1339 .000 2.383 3.132Hispanic 2.0418(*) .1173 .000 1.714 2.370Caucasian 4.3673(*) .0774 .000 4.151 4.584
Hispanic Asian .7155(*) .1442 .000 .312 1.119Afri. Amer. -2.0418(*) .1173 .000 -2.370 -1.714Caucasian 2.3254(*) .0941 .000 2.062 2.588
Caucasian Asian -1.6100(*) .1141 .000 -1.929 -1.291Afri. Amer. -4.3673(*) .0774 .000 -4.584 -4.151Hispanic -2.3254(*) .0941 .000 -2.588 -2.062
Peop
le S
ervi
ce
Asian Afri. Amer. -3.0106(*) .1497 .000 -3.429 -2.592Hispanic -.6723(*) .1613 .001 -1.123 -.222Caucasian .9846(*) .1276 .000 .628 1.341
African American Asian 3.0106(*) .1497 .000 2.592 3.429Hispanic 2.3383(*) .1312 .000 1.971 2.705Caucasian 3.9952(*) .0866 .000 3.753 4.237
Hispanic Asian .6723(*) .1613 .001 .222 1.123Afri. Amer. -2.3383(*) .1312 .000 -2.705 -1.971Caucasian 1.6569(*) .1052 .000 1.363 1.951
Caucasian Asian -.9846(*) .1276 .000 -1.341 -.628Afri. Amer. -3.9952(*) .0866 .000 -4.237 -3.753Hispanic -1.6569(*) .1052 .000 -1.951 -1.363
* The mean difference is significant at the .05 level.
©2008, Profiles International, Inc., Waco, Texas
Appendix C-19
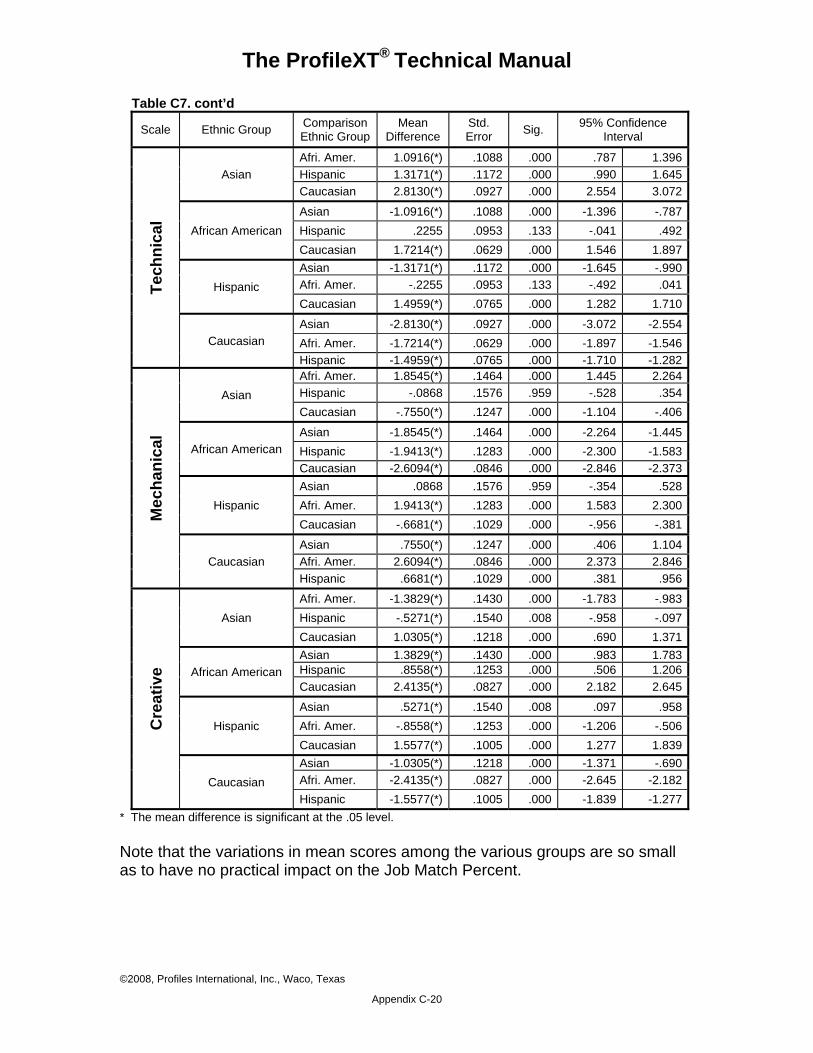
The ProfileXT® Technical Manual
Table C7. cont’d Scale Ethnic Group Comparison
Ethnic GroupMean
Difference Std. Error Sig. 95% Confidence
Interval
Tech
nica
l Asian
Afri. Amer. 1.0916(*) .1088 .000 .787 1.396Hispanic 1.3171(*) .1172 .000 .990 1.645Caucasian 2.8130(*) .0927 .000 2.554 3.072
African American Asian -1.0916(*) .1088 .000 -1.396 -.787Hispanic .2255 .0953 .133 -.041 .492Caucasian 1.7214(*) .0629 .000 1.546 1.897
Hispanic Asian -1.3171(*) .1172 .000 -1.645 -.990Afri. Amer. -.2255 .0953 .133 -.492 .041Caucasian 1.4959(*) .0765 .000 1.282 1.710
Caucasian Asian -2.8130(*) .0927 .000 -3.072 -2.554Afri. Amer. -1.7214(*) .0629 .000 -1.897 -1.546Hispanic -1.4959(*) .0765 .000 -1.710 -1.282
Mec
hani
cal
Asian Afri. Amer. 1.8545(*) .1464 .000 1.445 2.264Hispanic -.0868 .1576 .959 -.528 .354Caucasian -.7550(*) .1247 .000 -1.104 -.406
African American Asian -1.8545(*) .1464 .000 -2.264 -1.445Hispanic -1.9413(*) .1283 .000 -2.300 -1.583Caucasian -2.6094(*) .0846 .000 -2.846 -2.373
Hispanic Asian .0868 .1576 .959 -.354 .528Afri. Amer. 1.9413(*) .1283 .000 1.583 2.300Caucasian -.6681(*) .1029 .000 -.956 -.381
Caucasian Asian .7550(*) .1247 .000 .406 1.104Afri. Amer. 2.6094(*) .0846 .000 2.373 2.846Hispanic .6681(*) .1029 .000 .381 .956
Cre
ativ
e
Asian Afri. Amer. -1.3829(*) .1430 .000 -1.783 -.983Hispanic -.5271(*) .1540 .008 -.958 -.097Caucasian 1.0305(*) .1218 .000 .690 1.371
African American Asian 1.3829(*) .1430 .000 .983 1.783Hispanic .8558(*) .1253 .000 .506 1.206Caucasian 2.4135(*) .0827 .000 2.182 2.645
Hispanic Asian .5271(*) .1540 .008 .097 .958Afri. Amer. -.8558(*) .1253 .000 -1.206 -.506Caucasian 1.5577(*) .1005 .000 1.277 1.839
Caucasian Asian -1.0305(*) .1218 .000 -1.371 -.690Afri. Amer. -2.4135(*) .0827 .000 -2.645 -2.182Hispanic -1.5577(*) .1005 .000 -1.839 -1.277
* The mean difference is significant at the .05 level. Note that the variations in mean scores among the various groups are so small as to have no practical impact on the Job Match Percent.
©2008, Profiles International, Inc., Waco, Texas
Appendix C-20
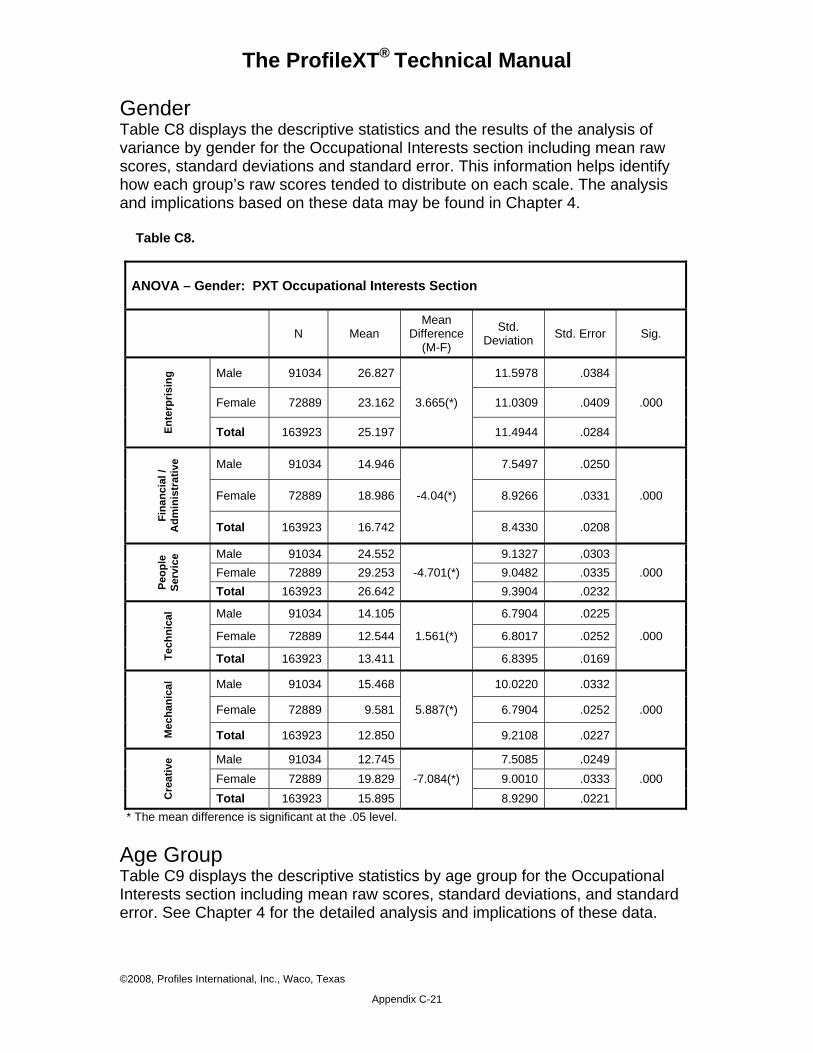
The ProfileXT® Technical Manual
Gender Table C8 displays the descriptive statistics and the results of the analysis of variance by gender for the Occupational Interests section including mean raw scores, standard deviations and standard error. This information helps identify how each group’s raw scores tended to distribute on each scale. The analysis and implications based on these data may be found in Chapter 4. Table C8.
ANOVA – Gender: PXT Occupational Interests Section
N Mean Mean
Difference (M-F)
Std. Deviation Std. Error Sig.
Ente
rpris
ing Male 91034 26.827
3.665(*)
11.5978 .0384
.000 Female 72889 23.162 11.0309 .0409
Total 163923 25.197 11.4944 .0284
Fina
ncia
l /
Adm
inis
trat
ive Male 91034 14.946
-4.04(*)
7.5497 .0250
.000 Female 72889 18.986 8.9266 .0331
Total 163923 16.742 8.4330 .0208
Peop
le
Serv
ice Male 91034 24.552
-4.701(*) 9.1327 .0303
.000 Female 72889 29.253 9.0482 .0335 Total 163923 26.642 9.3904 .0232
Tech
nica
l Male 91034 14.105
1.561(*)
6.7904 .0225
.000 Female 72889 12.544 6.8017 .0252
Total 163923 13.411 6.8395 .0169
Mec
hani
cal Male 91034 15.468
5.887(*)
10.0220 .0332
.000 Female 72889 9.581 6.7904 .0252
Total 163923 12.850 9.2108 .0227
Cre
ativ
e Male 91034 12.745-7.084(*)
7.5085 .0249 .000 Female 72889 19.829 9.0010 .0333
Total 163923 15.895 8.9290 .0221 * The mean difference is significant at the .05 level. Age Group Table C9 displays the descriptive statistics by age group for the Occupational Interests section including mean raw scores, standard deviations, and standard error. See Chapter 4 for the detailed analysis and implications of these data.
©2008, Profiles International, Inc., Waco, Texas
Appendix C-21
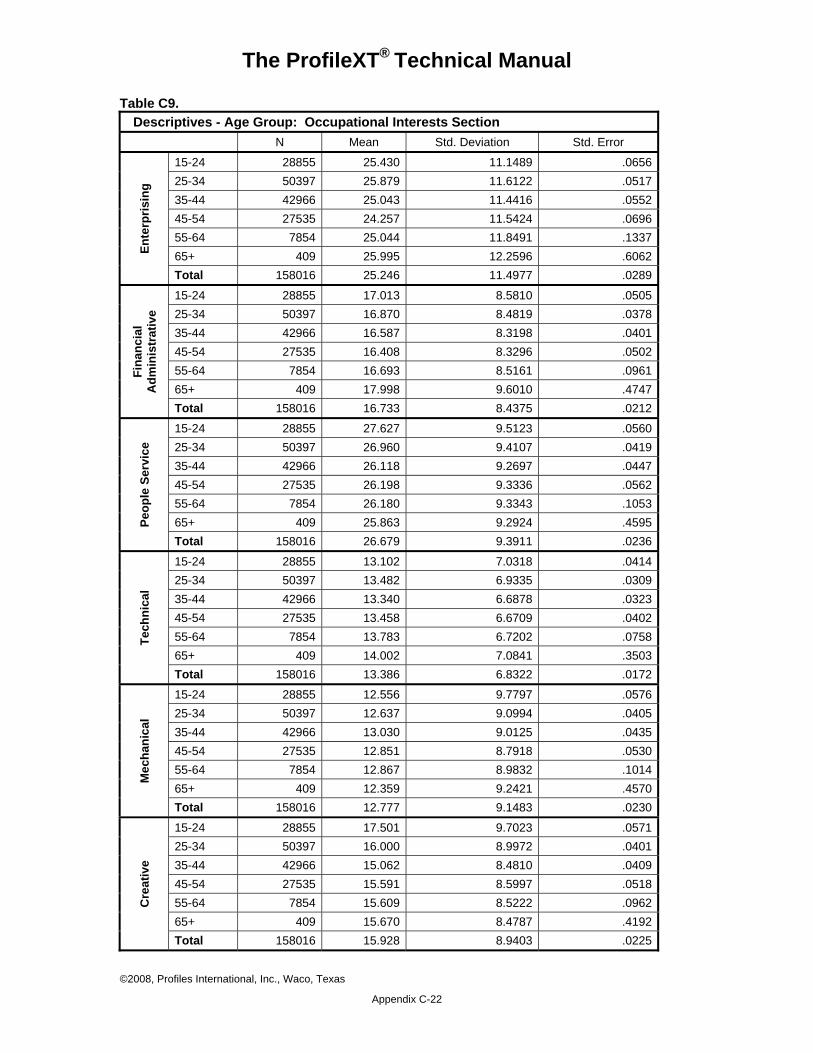
The ProfileXT® Technical Manual
Table C9. Descriptives - Age Group: Occupational Interests Section
N Mean Std. Deviation Std. Error En
terp
risin
g 15-24 28855 25.430 11.1489 .0656 25-34 50397 25.879 11.6122 .0517 35-44 42966 25.043 11.4416 .0552 45-54 27535 24.257 11.5424 .0696 55-64 7854 25.044 11.8491 .1337 65+ 409 25.995 12.2596 .6062 Total 158016 25.246 11.4977 .0289
Fina
ncia
l A
dmin
istr
ativ
e
15-24 28855 17.013 8.5810 .0505 25-34 50397 16.870 8.4819 .0378 35-44 42966 16.587 8.3198 .0401 45-54 27535 16.408 8.3296 .0502 55-64 7854 16.693 8.5161 .0961 65+ 409 17.998 9.6010 .4747 Total 158016 16.733 8.4375 .0212
Peop
le S
ervi
ce
15-24 28855 27.627 9.5123 .0560 25-34 50397 26.960 9.4107 .0419 35-44 42966 26.118 9.2697 .0447 45-54 27535 26.198 9.3336 .0562 55-64 7854 26.180 9.3343 .1053 65+ 409 25.863 9.2924 .4595 Total 158016 26.679 9.3911 .0236
Tech
nica
l
15-24 28855 13.102 7.0318 .0414 25-34 50397 13.482 6.9335 .0309 35-44 42966 13.340 6.6878 .0323 45-54 27535 13.458 6.6709 .0402 55-64 7854 13.783 6.7202 .0758 65+ 409 14.002 7.0841 .3503 Total 158016 13.386 6.8322 .0172
Mec
hani
cal
15-24 28855 12.556 9.7797 .0576 25-34 50397 12.637 9.0994 .0405 35-44 42966 13.030 9.0125 .0435 45-54 27535 12.851 8.7918 .0530 55-64 7854 12.867 8.9832 .1014 65+ 409 12.359 9.2421 .4570 Total 158016 12.777 9.1483 .0230
Cre
ativ
e
15-24 28855 17.501 9.7023 .0571 25-34 50397 16.000 8.9972 .0401 35-44 42966 15.062 8.4810 .0409 45-54 27535 15.591 8.5997 .0518 55-64 7854 15.609 8.5222 .0962 65+ 409 15.670 8.4787 .4192 Total 158016 15.928 8.9403 .0225
©2008, Profiles International, Inc., Waco, Texas
Appendix C-22
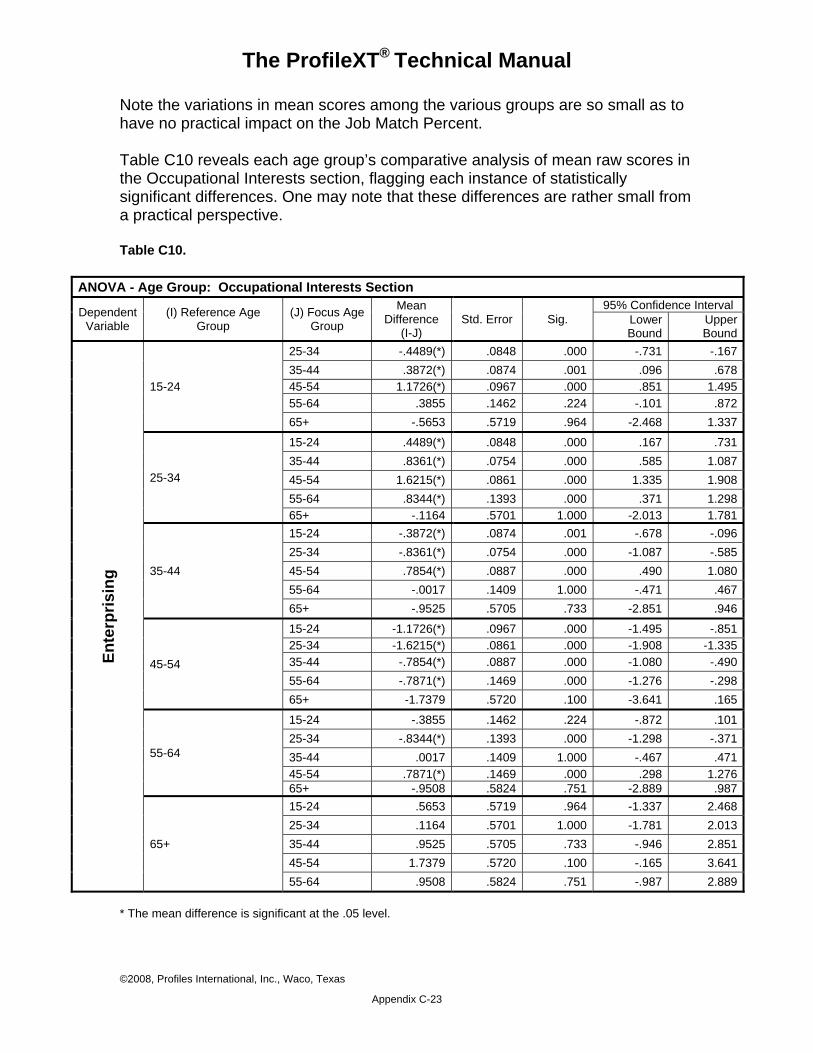
The ProfileXT® Technical Manual
Note the variations in mean scores among the various groups are so small as to have no practical impact on the Job Match Percent. Table C10 reveals each age group’s comparative analysis of mean raw scores in the Occupational Interests section, flagging each instance of statistically significant differences. One may note that these differences are rather small from a practical perspective. Table C10.
ANOVA - Age Group: Occupational Interests Section
Dependent Variable
(I) Reference Age Group
(J) Focus Age Group
Mean Difference
(I-J) Std. Error Sig.
95% Confidence Interval Lower Bound
Upper Bound
Ente
rpris
ing
15-24
25-34 -.4489(*) .0848 .000 -.731 -.16735-44 .3872(*) .0874 .001 .096 .67845-54 1.1726(*) .0967 .000 .851 1.49555-64 .3855 .1462 .224 -.101 .87265+ -.5653 .5719 .964 -2.468 1.337
25-34
15-24 .4489(*) .0848 .000 .167 .73135-44 .8361(*) .0754 .000 .585 1.08745-54 1.6215(*) .0861 .000 1.335 1.90855-64 .8344(*) .1393 .000 .371 1.29865+ -.1164 .5701 1.000 -2.013 1.781
35-44
15-24 -.3872(*) .0874 .001 -.678 -.09625-34 -.8361(*) .0754 .000 -1.087 -.58545-54 .7854(*) .0887 .000 .490 1.08055-64 -.0017 .1409 1.000 -.471 .46765+ -.9525 .5705 .733 -2.851 .946
45-54
15-24 -1.1726(*) .0967 .000 -1.495 -.85125-34 -1.6215(*) .0861 .000 -1.908 -1.33535-44 -.7854(*) .0887 .000 -1.080 -.49055-64 -.7871(*) .1469 .000 -1.276 -.29865+ -1.7379 .5720 .100 -3.641 .165
55-64
15-24 -.3855 .1462 .224 -.872 .10125-34 -.8344(*) .1393 .000 -1.298 -.37135-44 .0017 .1409 1.000 -.467 .47145-54 .7871(*) .1469 .000 .298 1.27665+ -.9508 .5824 .751 -2.889 .987
65+
15-24 .5653 .5719 .964 -1.337 2.46825-34 .1164 .5701 1.000 -1.781 2.01335-44 .9525 .5705 .733 -.946 2.85145-54 1.7379 .5720 .100 -.165 3.64155-64 .9508 .5824 .751 -.987 2.889
* The mean difference is significant at the .05 level.
©2008, Profiles International, Inc., Waco, Texas
Appendix C-23

The ProfileXT® Technical Manual
Table C10. cont’d
ANOVA - Age Group: Occupational Interests Section
Dependent Variable
(I) Reference Age Group
(J) Focus Age Group
Mean Difference
(I-J) Std. Error Sig.
95% Confidence Interval Lower Bound
Upper Bound
Fina
ncia
l/Adm
inis
trat
ive
15-24
25-34 .1438 .0623 .376 -.063 .35135-44 .4262(*) .0642 .000 .213 .64045-54 .6053(*) .0711 .000 .369 .84255-64 .3206 .1074 .112 -.037 .67865+ -.9842 .4200 .359 -2.382 .413
25-34
15-24 -.1438 .0623 .376 -.351 .06335-44 .2824(*) .0554 .000 .098 .46745-54 .4615(*) .0632 .000 .251 .67255-64 .1768 .1023 .702 -.164 .51765+ -1.1280 .4188 .202 -2.521 .265
35-44
15-24 -.4262(*) .0642 .000 -.640 -.21325-34 -.2824(*) .0554 .000 -.467 -.09845-54 .1791 .0651 .182 -.038 .39655-64 -.1056 .1035 .959 -.450 .23965+ -1.4104(*) .4191 .045 -2.805 -.016
45-54
15-24 -.6053(*) .0711 .000 -.842 -.36925-34 -.4615(*) .0632 .000 -.672 -.25135-44 -.1791 .0651 .182 -.396 .03855-64 -.2847 .1079 .224 -.644 .07465+ -1.5895(*) .4202 .014 -2.987 -.191
55-64
15-24 -.3206 .1074 .112 -.678 .03725-34 -.1768 .1023 .702 -.517 .16435-44 .1056 .1035 .959 -.239 .45045-54 .2847 .1079 .224 -.074 .64465+ -1.3048 .4278 .098 -2.728 .119
65+
15-24 .9842 .4200 .359 -.413 2.38225-34 1.1280 .4188 .202 -.265 2.52135-44 1.4104(*) .4191 .045 .016 2.80545-54 1.5895(*) .4202 .014 .191 2.98755-64 1.3048 .4278 .098 -.119 2.728
* The mean difference is significant at the .05 level.
©2008, Profiles International, Inc., Waco, Texas
Appendix C-24

The ProfileXT® Technical Manual
Table C10. cont’d
ANOVA, Age Group – Occupational Interests Section
Dependent Variable
(I) Reference Age Group
(J) Focus Age Group
Mean Difference
(I-J) Std. Error Sig.
95% Confidence Interval Lower Bound
Upper Bound
Peop
le S
ervi
ce
15-24
25-34 .6672(*) .0692 .000 .437 .89735-44 1.5094(*) .0713 .000 1.272 1.74745-54 1.4291(*) .0790 .000 1.166 1.69255-64 1.4469(*) .1193 .000 1.050 1.84465+ 1.7642(*) .4668 .014 .211 3.317
25-34
15-24 -.6672(*) .0692 .000 -.897 -.43735-44 .8423(*) .0616 .000 .637 1.04745-54 .7619(*) .0702 .000 .528 .99655-64 .7797(*) .1137 .000 .401 1.15865+ 1.0970 .4654 .352 -.451 2.645
35-44
15-24 -1.5094(*) .0713 .000 -1.747 -1.27225-34 -.8423(*) .0616 .000 -1.047 -.63745-54 -.0804 .0724 .942 -.321 .16055-64 -.0626 .1150 .998 -.445 .32065+ .2548 .4657 .998 -1.295 1.804
45-54
15-24 -1.4291(*) .0790 .000 -1.692 -1.16625-34 -.7619(*) .0702 .000 -.996 -.52835-44 .0804 .0724 .942 -.160 .32155-64 .0178 .1199 1.000 -.381 .41765+ .3351 .4669 .992 -1.218 1.889
55-64
15-24 -1.4469(*) .1193 .000 -1.844 -1.05025-34 -.7797(*) .1137 .000 -1.158 -.40135-44 .0626 .1150 .998 -.320 .44545-54 -.0178 .1199 1.000 -.417 .38165+ .3173 .4754 .994 -1.265 1.899
65+
15-24 -1.7642(*) .4668 .014 -3.317 -.21125-34 -1.0970 .4654 .352 -2.645 .45135-44 -.2548 .4657 .998 -1.804 1.29545-54 -.3351 .4669 .992 -1.889 1.21855-64 -.3173 .4754 .994 -1.899 1.265
* The mean difference is significant at the .05 level.
©2008, Profiles International, Inc., Waco, Texas
Appendix C-25

The ProfileXT® Technical Manual
Table C10. cont’d
ANOVA - Age Group: Occupational Interests Section
Dependent Variable
(I) Reference Age Group
(J) Focus Age Group
Mean Difference
(I-J) Std. Error Sig.
95% Confidence Interval Lower Bound
Upper Bound
Tech
nica
l
15-24
25-34 -.3801(*) .0504 .000 -.548 -.21235-44 -.2380(*) .0520 .001 -.411 -.06545-54 -.3561(*) .0575 .000 -.548 -.16555-64 -.6810(*) .0869 .000 -.970 -.39265+ -.9009 .3401 .219 -2.033 .231
25-34
15-24 .3801(*) .0504 .000 .212 .54835-44 .1421 .0448 .074 -.007 .29145-54 .0240 .0512 .999 -.146 .19455-64 -.3009(*) .0829 .022 -.577 -.02565+ -.5208 .3391 .798 -1.649 .607
35-44
15-24 .2380(*) .0520 .001 .065 .41125-34 -.1421 .0448 .074 -.291 .00745-54 -.1181 .0527 .414 -.294 .05755-64 -.4430(*) .0838 .000 -.722 -.16465+ -.6629 .3393 .576 -1.792 .466
45-54
15-24 .3561(*) .0575 .000 .165 .54825-34 -.0240 .0512 .999 -.194 .14635-44 .1181 .0527 .414 -.057 .29455-64 -.3249(*) .0874 .017 -.616 -.03465+ -.5448 .3402 .767 -1.677 .587
55-64
15-24 .6810(*) .0869 .000 .392 .97025-34 .3009(*) .0829 .022 .025 .57735-44 .4430(*) .0838 .000 .164 .72245-54 .3249(*) .0874 .017 .034 .61665+ -.2199 .3464 .995 -1.373 .933
65+
15-24 .9009 .3401 .219 -.231 2.03325-34 .5208 .3391 .798 -.607 1.64935-44 .6629 .3393 .576 -.466 1.79245-54 .5448 .3402 .767 -.587 1.67755-64 .2199 .3464 .995 -.933 1.373
* The mean difference is significant at the .05 level.
©2008, Profiles International, Inc., Waco, Texas
Appendix C-26

The ProfileXT® Technical Manual
Table C10. cont’d
ANOVA - Age Group: Occupational Interests Section
Dependent Variable
(I) Reference Age Group
(J) Focus Age Group
Mean Difference
(I-J) Std. Error Sig.
95% Confidence Interval Lower Bound
Upper Bound
Mec
hani
cal
15-24
25-34 -.0809 .0675 .920 -.306 .14435-44 -.4739(*) .0696 .000 -.706 -.24245-54 -.2957(*) .0771 .012 -.552 -.03955-64 -.3112 .1164 .210 -.699 .07665+ .1963 .4555 .999 -1.319 1.712
25-34
15-24 .0809 .0675 .920 -.144 .30635-44 -.3930(*) .0601 .000 -.593 -.19345-54 -.2148 .0685 .080 -.443 .01355-64 -.2304 .1110 .506 -.600 .13965+ .2772 .4541 .996 -1.234 1.788
35-44
15-24 .4739(*) .0696 .000 .242 .70625-34 .3930(*) .0601 .000 .193 .59345-54 .1782 .0706 .272 -.057 .41355-64 .1627 .1122 .835 -.211 .53665+ .6702 .4544 .824 -.842 2.182
45-54
15-24 .2957(*) .0771 .012 .039 .55225-34 .2148 .0685 .080 -.013 .44335-44 -.1782 .0706 .272 -.413 .05755-64 -.0156 .1170 1.000 -.405 .37465+ .4920 .4556 .948 -1.024 2.008
55-64
15-24 .3112 .1164 .210 -.076 .69925-34 .2304 .1110 .506 -.139 .60035-44 -.1627 .1122 .835 -.536 .21145-54 .0156 .1170 1.000 -.374 .40565+ .5075 .4639 .945 -1.036 2.051
65+
15-24 -.1963 .4555 .999 -1.712 1.31925-34 -.2772 .4541 .996 -1.788 1.23435-44 -.6702 .4544 .824 -2.182 .84245-54 -.4920 .4556 .948 -2.008 1.02455-64 -.5075 .4639 .945 -2.051 1.036
* The mean difference is significant at the .05 level.
©2008, Profiles International, Inc., Waco, Texas
Appendix C-27
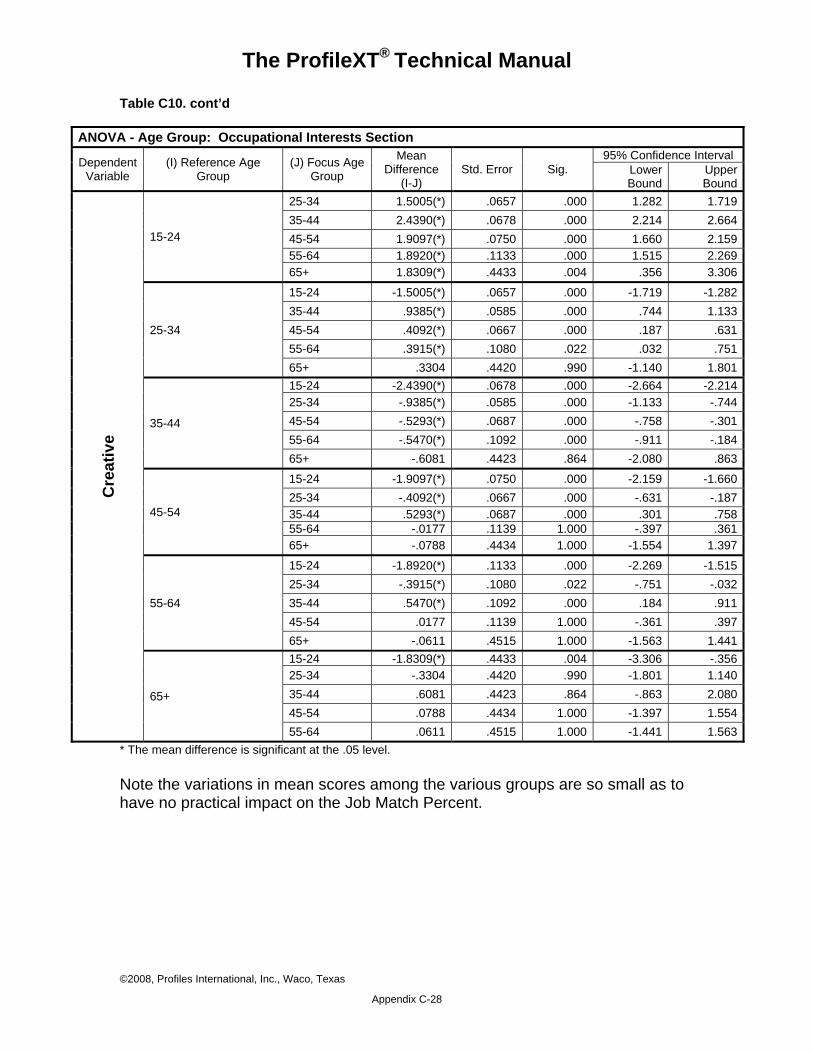
The ProfileXT® Technical Manual
Table C10. cont’d
ANOVA - Age Group: Occupational Interests Section
Dependent Variable
(I) Reference Age Group
(J) Focus Age Group
Mean Difference
(I-J) Std. Error Sig.
95% Confidence Interval Lower Bound
Upper Bound
Cre
ativ
e
15-24
25-34 1.5005(*) .0657 .000 1.282 1.71935-44 2.4390(*) .0678 .000 2.214 2.66445-54 1.9097(*) .0750 .000 1.660 2.15955-64 1.8920(*) .1133 .000 1.515 2.26965+ 1.8309(*) .4433 .004 .356 3.306
25-34
15-24 -1.5005(*) .0657 .000 -1.719 -1.28235-44 .9385(*) .0585 .000 .744 1.13345-54 .4092(*) .0667 .000 .187 .63155-64 .3915(*) .1080 .022 .032 .75165+ .3304 .4420 .990 -1.140 1.801
35-44
15-24 -2.4390(*) .0678 .000 -2.664 -2.21425-34 -.9385(*) .0585 .000 -1.133 -.74445-54 -.5293(*) .0687 .000 -.758 -.30155-64 -.5470(*) .1092 .000 -.911 -.18465+ -.6081 .4423 .864 -2.080 .863
45-54
15-24 -1.9097(*) .0750 .000 -2.159 -1.66025-34 -.4092(*) .0667 .000 -.631 -.18735-44 .5293(*) .0687 .000 .301 .75855-64 -.0177 .1139 1.000 -.397 .36165+ -.0788 .4434 1.000 -1.554 1.397
55-64
15-24 -1.8920(*) .1133 .000 -2.269 -1.51525-34 -.3915(*) .1080 .022 -.751 -.03235-44 .5470(*) .1092 .000 .184 .91145-54 .0177 .1139 1.000 -.361 .39765+ -.0611 .4515 1.000 -1.563 1.441
65+
15-24 -1.8309(*) .4433 .004 -3.306 -.35625-34 -.3304 .4420 .990 -1.801 1.14035-44 .6081 .4423 .864 -.863 2.08045-54 .0788 .4434 1.000 -1.397 1.55455-64 .0611 .4515 1.000 -1.441 1.563
* The mean difference is significant at the .05 level. Note the variations in mean scores among the various groups are so small as to have no practical impact on the Job Match Percent.
©2008, Profiles International, Inc., Waco, Texas
Appendix C-28
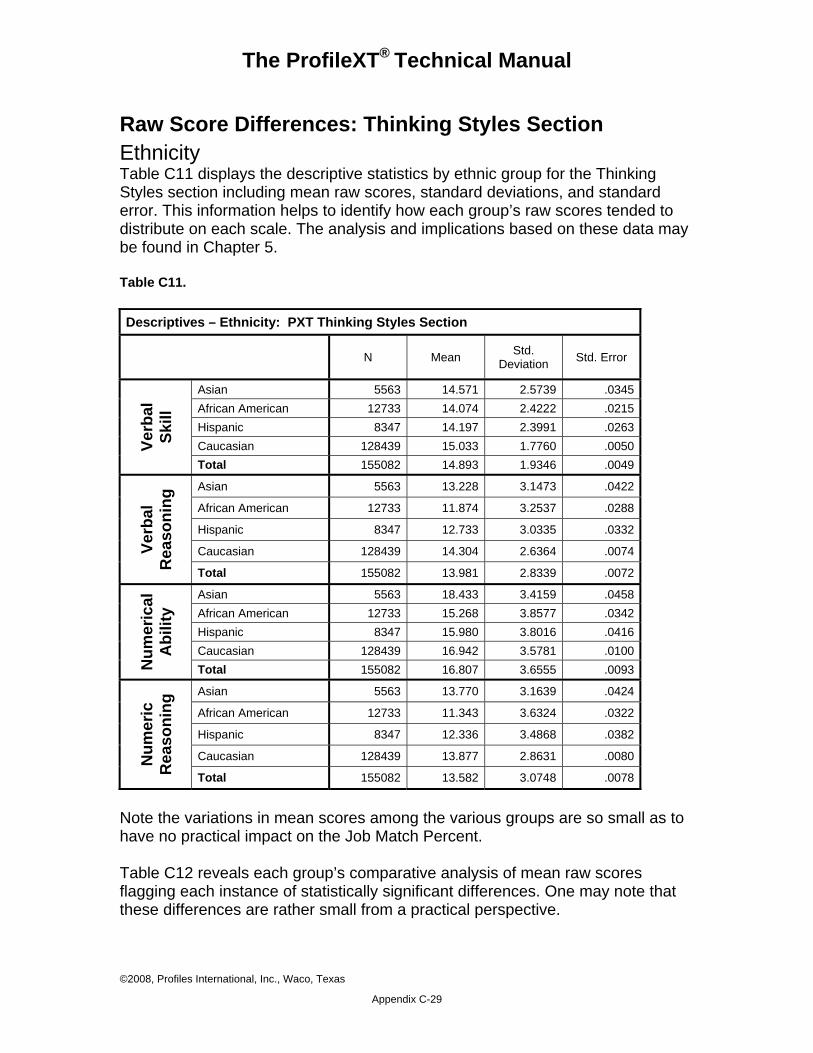
The ProfileXT® Technical Manual
Raw Score Differences: Thinking Styles Section Ethnicity Table C11 displays the descriptive statistics by ethnic group for the Thinking Styles section including mean raw scores, standard deviations, and standard error. This information helps to identify how each group’s raw scores tended to distribute on each scale. The analysis and implications based on these data may be found in Chapter 5. Table C11. Descriptives – Ethnicity: PXT Thinking Styles Section
N Mean Std.
Deviation Std. Error
Verb
al
Skill
Asian 5563 14.571 2.5739 .0345 African American 12733 14.074 2.4222 .0215 Hispanic 8347 14.197 2.3991 .0263 Caucasian 128439 15.033 1.7760 .0050 Total 155082 14.893 1.9346 .0049
Verb
al
Rea
soni
ng Asian 5563 13.228 3.1473 .0422
African American 12733 11.874 3.2537 .0288
Hispanic 8347 12.733 3.0335 .0332
Caucasian 128439 14.304 2.6364 .0074
Total 155082 13.981 2.8339 .0072
Num
eric
al
Abi
lity
Asian 5563 18.433 3.4159 .0458 African American 12733 15.268 3.8577 .0342 Hispanic 8347 15.980 3.8016 .0416 Caucasian 128439 16.942 3.5781 .0100 Total 155082 16.807 3.6555 .0093
Num
eric
R
easo
ning
Asian 5563 13.770 3.1639 .0424
African American 12733 11.343 3.6324 .0322
Hispanic 8347 12.336 3.4868 .0382
Caucasian 128439 13.877 2.8631 .0080
Total 155082 13.582 3.0748 .0078
Note the variations in mean scores among the various groups are so small as to have no practical impact on the Job Match Percent. Table C12 reveals each group’s comparative analysis of mean raw scores flagging each instance of statistically significant differences. One may note that these differences are rather small from a practical perspective.
©2008, Profiles International, Inc., Waco, Texas
Appendix C-29
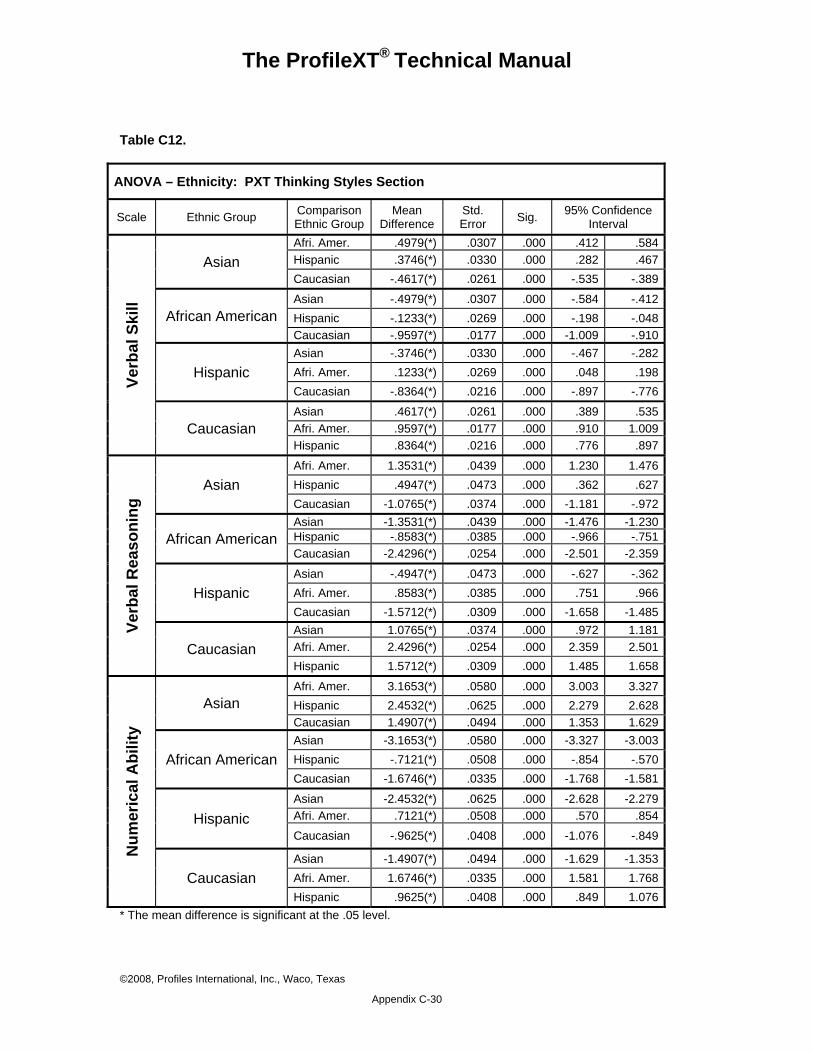
The ProfileXT® Technical Manual
Table C12.
ANOVA – Ethnicity: PXT Thinking Styles Section
Scale Ethnic Group Comparison Ethnic Group
Mean Difference
Std. Error Sig. 95% Confidence
Interval
Verb
al S
kill
Asian Afri. Amer. .4979(*) .0307 .000 .412 .584Hispanic .3746(*) .0330 .000 .282 .467Caucasian -.4617(*) .0261 .000 -.535 -.389
African American Asian -.4979(*) .0307 .000 -.584 -.412Hispanic -.1233(*) .0269 .000 -.198 -.048Caucasian -.9597(*) .0177 .000 -1.009 -.910
Hispanic Asian -.3746(*) .0330 .000 -.467 -.282Afri. Amer. .1233(*) .0269 .000 .048 .198Caucasian -.8364(*) .0216 .000 -.897 -.776
Caucasian Asian .4617(*) .0261 .000 .389 .535Afri. Amer. .9597(*) .0177 .000 .910 1.009Hispanic .8364(*) .0216 .000 .776 .897
Verb
al R
easo
ning
Asian Afri. Amer. 1.3531(*) .0439 .000 1.230 1.476Hispanic .4947(*) .0473 .000 .362 .627Caucasian -1.0765(*) .0374 .000 -1.181 -.972
African American Asian -1.3531(*) .0439 .000 -1.476 -1.230Hispanic -.8583(*) .0385 .000 -.966 -.751Caucasian -2.4296(*) .0254 .000 -2.501 -2.359
Hispanic Asian -.4947(*) .0473 .000 -.627 -.362Afri. Amer. .8583(*) .0385 .000 .751 .966Caucasian -1.5712(*) .0309 .000 -1.658 -1.485
Caucasian Asian 1.0765(*) .0374 .000 .972 1.181Afri. Amer. 2.4296(*) .0254 .000 2.359 2.501Hispanic 1.5712(*) .0309 .000 1.485 1.658
Num
eric
al A
bilit
y
Asian Afri. Amer. 3.1653(*) .0580 .000 3.003 3.327Hispanic 2.4532(*) .0625 .000 2.279 2.628Caucasian 1.4907(*) .0494 .000 1.353 1.629
African American Asian -3.1653(*) .0580 .000 -3.327 -3.003Hispanic -.7121(*) .0508 .000 -.854 -.570Caucasian -1.6746(*) .0335 .000 -1.768 -1.581
Hispanic Asian -2.4532(*) .0625 .000 -2.628 -2.279Afri. Amer. .7121(*) .0508 .000 .570 .854
Caucasian -.9625(*) .0408 .000 -1.076 -.849
Caucasian Asian -1.4907(*) .0494 .000 -1.629 -1.353Afri. Amer. 1.6746(*) .0335 .000 1.581 1.768Hispanic .9625(*) .0408 .000 .849 1.076
* The mean difference is significant at the .05 level.
©2008, Profiles International, Inc., Waco, Texas
Appendix C-30
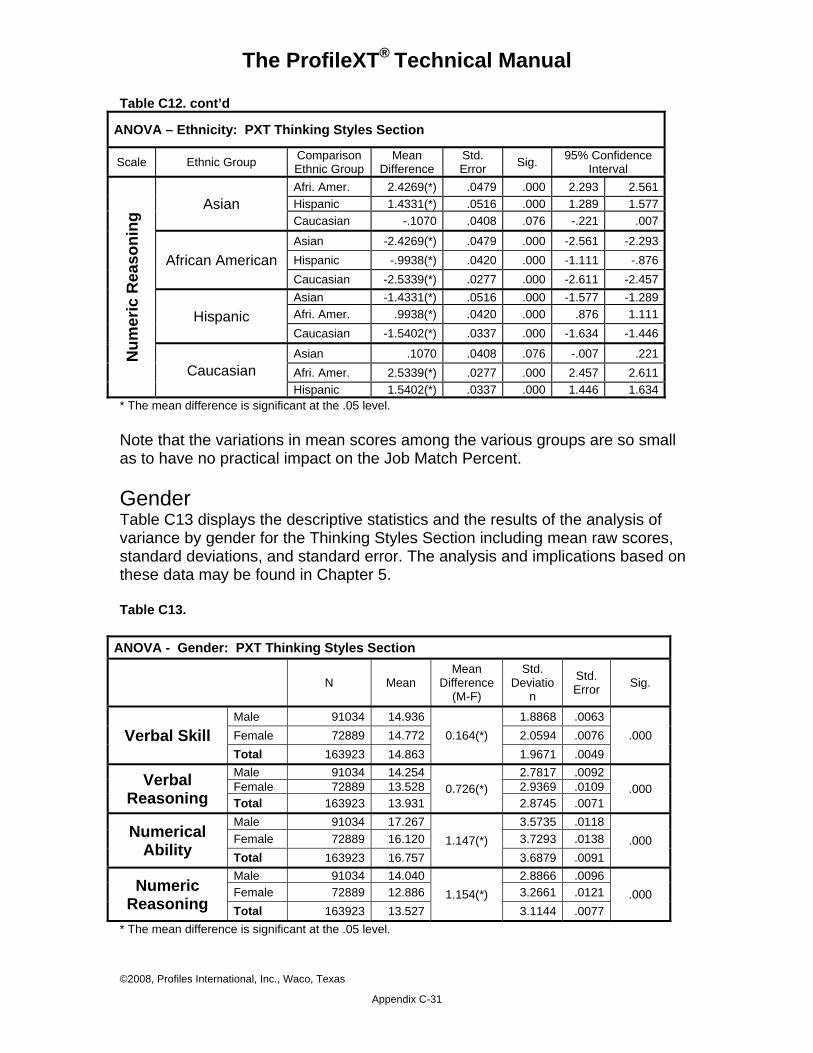
The ProfileXT® Technical Manual
Table C12. cont’d
ANOVA – Ethnicity: PXT Thinking Styles Section
Scale Ethnic Group Comparison Ethnic Group
Mean Difference
Std. Error Sig. 95% Confidence
Interval
Num
eric
Rea
soni
ng Asian
Afri. Amer. 2.4269(*) .0479 .000 2.293 2.561Hispanic 1.4331(*) .0516 .000 1.289 1.577Caucasian -.1070 .0408 .076 -.221 .007
African American Asian -2.4269(*) .0479 .000 -2.561 -2.293Hispanic -.9938(*) .0420 .000 -1.111 -.876Caucasian -2.5339(*) .0277 .000 -2.611 -2.457
Hispanic Asian -1.4331(*) .0516 .000 -1.577 -1.289Afri. Amer. .9938(*) .0420 .000 .876 1.111Caucasian -1.5402(*) .0337 .000 -1.634 -1.446
Caucasian Asian .1070 .0408 .076 -.007 .221Afri. Amer. 2.5339(*) .0277 .000 2.457 2.611Hispanic 1.5402(*) .0337 .000 1.446 1.634
* The mean difference is significant at the .05 level. Note that the variations in mean scores among the various groups are so small as to have no practical impact on the Job Match Percent. Gender Table C13 displays the descriptive statistics and the results of the analysis of variance by gender for the Thinking Styles Section including mean raw scores, standard deviations, and standard error. The analysis and implications based on these data may be found in Chapter 5. Table C13.
ANOVA - Gender: PXT Thinking Styles Section
N Mean
Mean Difference
(M-F)
Std. Deviatio
n
Std. Error Sig.
Verbal Skill Male 91034 14.936
0.164(*) 1.8868 .0063
.000 Female 72889 14.772 2.0594 .0076 Total 163923 14.863 1.9671 .0049
Verbal Reasoning
Male 91034 14.2540.726(*)
2.7817 .0092 .000 Female 72889 13.528 2.9369 .0109
Total 163923 13.931 2.8745 .0071
Numerical Ability
Male 91034 17.2671.147(*)
3.5735 .0118 .000 Female 72889 16.120 3.7293 .0138
Total 163923 16.757 3.6879 .0091
Numeric Reasoning
Male 91034 14.0401.154(*)
2.8866 .0096 .000 Female 72889 12.886 3.2661 .0121
Total 163923 13.527 3.1144 .0077 * The mean difference is significant at the .05 level.
©2008, Profiles International, Inc., Waco, Texas
Appendix C-31
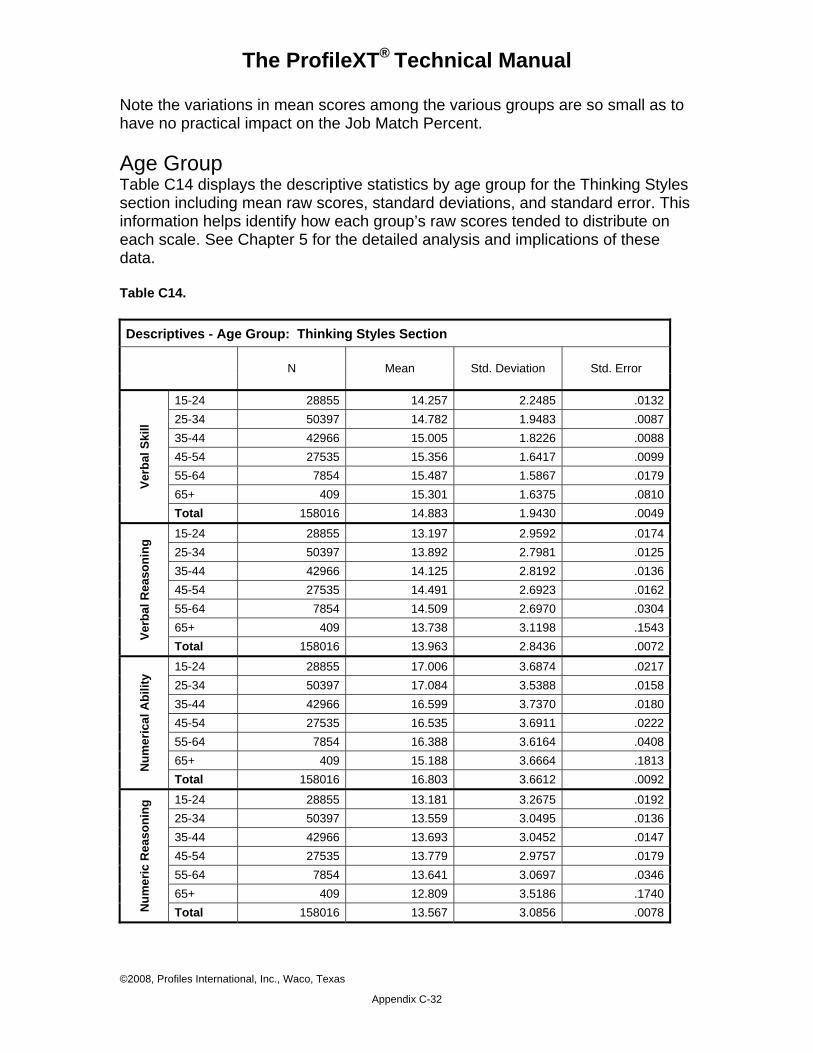
The ProfileXT® Technical Manual
Note the variations in mean scores among the various groups are so small as to have no practical impact on the Job Match Percent. Age Group Table C14 displays the descriptive statistics by age group for the Thinking Styles section including mean raw scores, standard deviations, and standard error. This information helps identify how each group’s raw scores tended to distribute on each scale. See Chapter 5 for the detailed analysis and implications of these data. Table C14. Descriptives - Age Group: Thinking Styles Section
N Mean Std. Deviation Std. Error
Verb
al S
kill
15-24 28855 14.257 2.2485 .013225-34 50397 14.782 1.9483 .008735-44 42966 15.005 1.8226 .008845-54 27535 15.356 1.6417 .009955-64 7854 15.487 1.5867 .017965+ 409 15.301 1.6375 .0810Total 158016 14.883 1.9430 .0049
Verb
al R
easo
ning
15-24 28855 13.197 2.9592 .017425-34 50397 13.892 2.7981 .012535-44 42966 14.125 2.8192 .013645-54 27535 14.491 2.6923 .016255-64 7854 14.509 2.6970 .030465+ 409 13.738 3.1198 .1543Total 158016 13.963 2.8436 .0072
Num
eric
al A
bilit
y
15-24 28855 17.006 3.6874 .021725-34 50397 17.084 3.5388 .015835-44 42966 16.599 3.7370 .018045-54 27535 16.535 3.6911 .022255-64 7854 16.388 3.6164 .040865+ 409 15.188 3.6664 .1813Total 158016 16.803 3.6612 .0092
Num
eric
Rea
soni
ng 15-24 28855 13.181 3.2675 .0192
25-34 50397 13.559 3.0495 .013635-44 42966 13.693 3.0452 .014745-54 27535 13.779 2.9757 .017955-64 7854 13.641 3.0697 .034665+ 409 12.809 3.5186 .1740Total 158016 13.567 3.0856 .0078
©2008, Profiles International, Inc., Waco, Texas
Appendix C-32
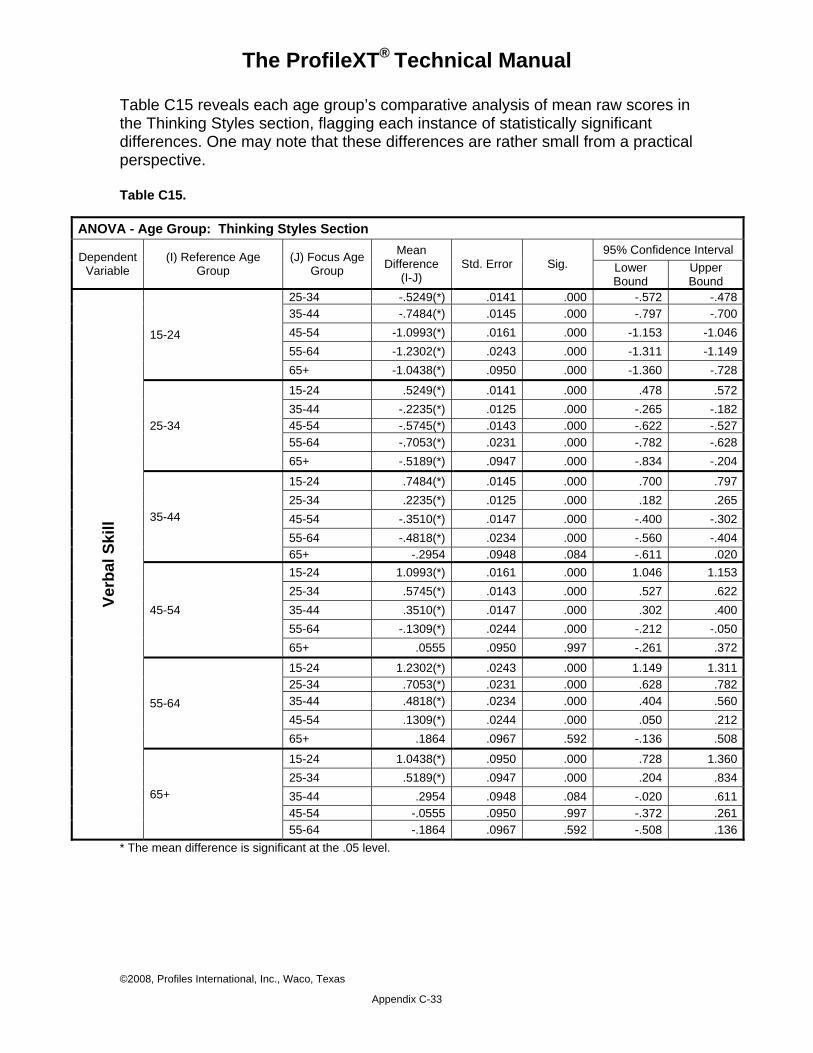
The ProfileXT® Technical Manual
Table C15 reveals each age group’s comparative analysis of mean raw scores in the Thinking Styles section, flagging each instance of statistically significant differences. One may note that these differences are rather small from a practical perspective. Table C15.
ANOVA - Age Group: Thinking Styles Section
Dependent Variable
(I) Reference Age Group
(J) Focus Age Group
Mean Difference
(I-J) Std. Error Sig.
95% Confidence Interval Lower Bound
Upper Bound
Verb
al S
kill
15-24
25-34 -.5249(*) .0141 .000 -.572 -.47835-44 -.7484(*) .0145 .000 -.797 -.70045-54 -1.0993(*) .0161 .000 -1.153 -1.04655-64 -1.2302(*) .0243 .000 -1.311 -1.14965+ -1.0438(*) .0950 .000 -1.360 -.728
25-34
15-24 .5249(*) .0141 .000 .478 .57235-44 -.2235(*) .0125 .000 -.265 -.18245-54 -.5745(*) .0143 .000 -.622 -.52755-64 -.7053(*) .0231 .000 -.782 -.62865+ -.5189(*) .0947 .000 -.834 -.204
35-44
15-24 .7484(*) .0145 .000 .700 .79725-34 .2235(*) .0125 .000 .182 .26545-54 -.3510(*) .0147 .000 -.400 -.30255-64 -.4818(*) .0234 .000 -.560 -.40465+ -.2954 .0948 .084 -.611 .020
45-54
15-24 1.0993(*) .0161 .000 1.046 1.15325-34 .5745(*) .0143 .000 .527 .62235-44 .3510(*) .0147 .000 .302 .40055-64 -.1309(*) .0244 .000 -.212 -.05065+ .0555 .0950 .997 -.261 .372
55-64
15-24 1.2302(*) .0243 .000 1.149 1.31125-34 .7053(*) .0231 .000 .628 .78235-44 .4818(*) .0234 .000 .404 .56045-54 .1309(*) .0244 .000 .050 .21265+ .1864 .0967 .592 -.136 .508
65+
15-24 1.0438(*) .0950 .000 .728 1.36025-34 .5189(*) .0947 .000 .204 .83435-44 .2954 .0948 .084 -.020 .61145-54 -.0555 .0950 .997 -.372 .26155-64 -.1864 .0967 .592 -.508 .136
* The mean difference is significant at the .05 level.
©2008, Profiles International, Inc., Waco, Texas
Appendix C-33
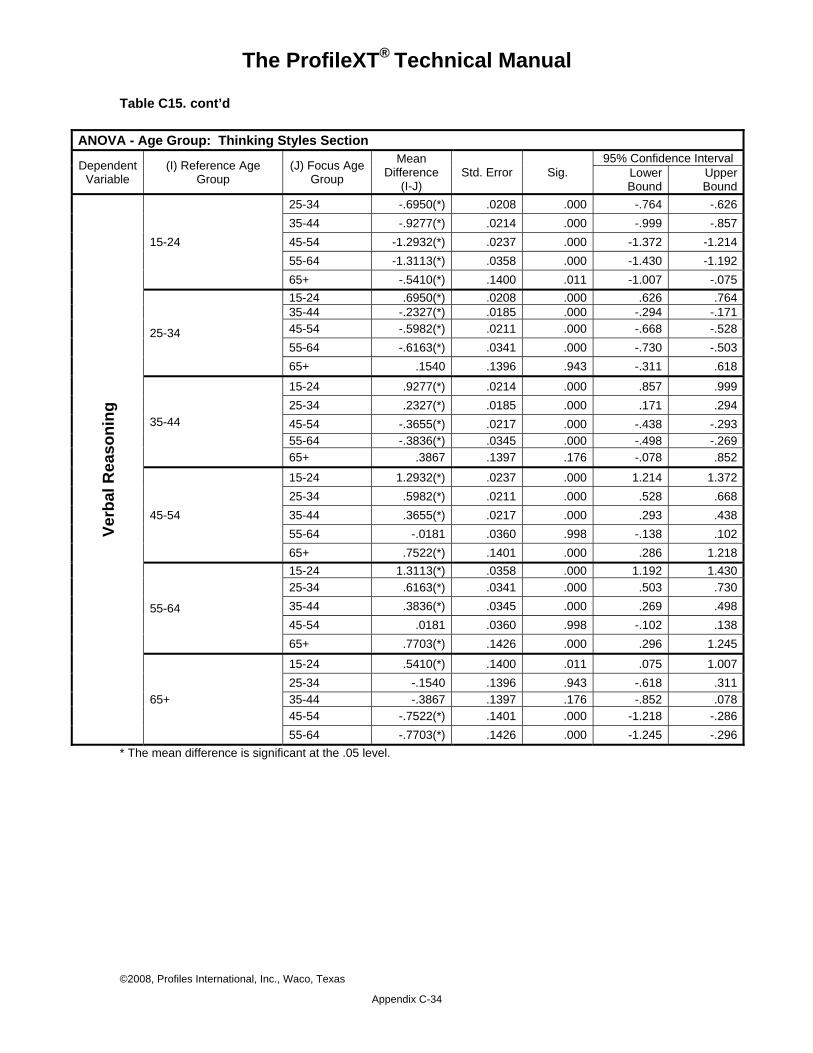
The ProfileXT® Technical Manual
Table C15. cont’d
ANOVA - Age Group: Thinking Styles Section
Dependent Variable
(I) Reference Age Group
(J) Focus Age Group
Mean Difference
(I-J) Std. Error Sig.
95% Confidence Interval Lower Bound
Upper Bound
Verb
al R
easo
ning
15-24
25-34 -.6950(*) .0208 .000 -.764 -.62635-44 -.9277(*) .0214 .000 -.999 -.85745-54 -1.2932(*) .0237 .000 -1.372 -1.21455-64 -1.3113(*) .0358 .000 -1.430 -1.19265+ -.5410(*) .1400 .011 -1.007 -.075
25-34
15-24 .6950(*) .0208 .000 .626 .76435-44 -.2327(*) .0185 .000 -.294 -.17145-54 -.5982(*) .0211 .000 -.668 -.52855-64 -.6163(*) .0341 .000 -.730 -.50365+ .1540 .1396 .943 -.311 .618
35-44
15-24 .9277(*) .0214 .000 .857 .99925-34 .2327(*) .0185 .000 .171 .29445-54 -.3655(*) .0217 .000 -.438 -.29355-64 -.3836(*) .0345 .000 -.498 -.26965+ .3867 .1397 .176 -.078 .852
45-54
15-24 1.2932(*) .0237 .000 1.214 1.37225-34 .5982(*) .0211 .000 .528 .66835-44 .3655(*) .0217 .000 .293 .43855-64 -.0181 .0360 .998 -.138 .10265+ .7522(*) .1401 .000 .286 1.218
55-64
15-24 1.3113(*) .0358 .000 1.192 1.43025-34 .6163(*) .0341 .000 .503 .73035-44 .3836(*) .0345 .000 .269 .49845-54 .0181 .0360 .998 -.102 .13865+ .7703(*) .1426 .000 .296 1.245
65+
15-24 .5410(*) .1400 .011 .075 1.00725-34 -.1540 .1396 .943 -.618 .31135-44 -.3867 .1397 .176 -.852 .07845-54 -.7522(*) .1401 .000 -1.218 -.28655-64 -.7703(*) .1426 .000 -1.245 -.296
* The mean difference is significant at the .05 level.
©2008, Profiles International, Inc., Waco, Texas
Appendix C-34

The ProfileXT® Technical Manual
Table C15. cont’d
ANOVA - Age Group: Thinking Styles Section
Dependent Variable
(I) Reference Age Group
(J) Focus Age Group
Mean Difference
(I-J) Std. Error Sig.
95% Confidence Interval Lower Bound
Upper Bound
Num
eric
al A
bilit
y
15-24
25-34 -.0774 .0270 .143 -.167 .01235-44 .4076(*) .0278 .000 .315 .50045-54 .4712(*) .0308 .000 .369 .57455-64 .6184(*) .0465 .000 .464 .77365+ 1.8182(*) .1818 .000 1.213 2.423
25-34
15-24 .0774 .0270 .143 -.012 .16735-44 .4851(*) .0240 .000 .405 .56545-54 .5486(*) .0274 .000 .458 .64055-64 .6958(*) .0443 .000 .548 .84365+ 1.8956(*) .1813 .000 1.292 2.499
35-44
15-24 -.4076(*) .0278 .000 -.500 -.31525-34 -.4851(*) .0240 .000 -.565 -.40545-54 .0636 .0282 .406 -.030 .15755-64 .2108(*) .0448 .000 .062 .36065+ 1.4106(*) .1814 .000 .807 2.014
45-54
15-24 -.4712(*) .0308 .000 -.574 -.36925-34 -.5486(*) .0274 .000 -.640 -.45835-44 -.0636 .0282 .406 -.157 .03055-64 .1472 .0467 .077 -.008 .30365+ 1.3470(*) .1819 .000 .742 1.952
55-64
15-24 -.6184(*) .0465 .000 -.773 -.46425-34 -.6958(*) .0443 .000 -.843 -.54835-44 -.2108(*) .0448 .000 -.360 -.06245-54 -.1472 .0467 .077 -.303 .00865+ 1.1998(*) .1852 .000 .584 1.816
65+
15-24 -1.8182(*) .1818 .000 -2.423 -1.21325-34 -1.8956(*) .1813 .000 -2.499 -1.29235-44 -1.4106(*) .1814 .000 -2.014 -.80745-54 -1.3470(*) .1819 .000 -1.952 -.74255-64 -1.1998(*) .1852 .000 -1.816 -.584
* The mean difference is significant at the .05 level.
©2008, Profiles International, Inc., Waco, Texas
Appendix C-35
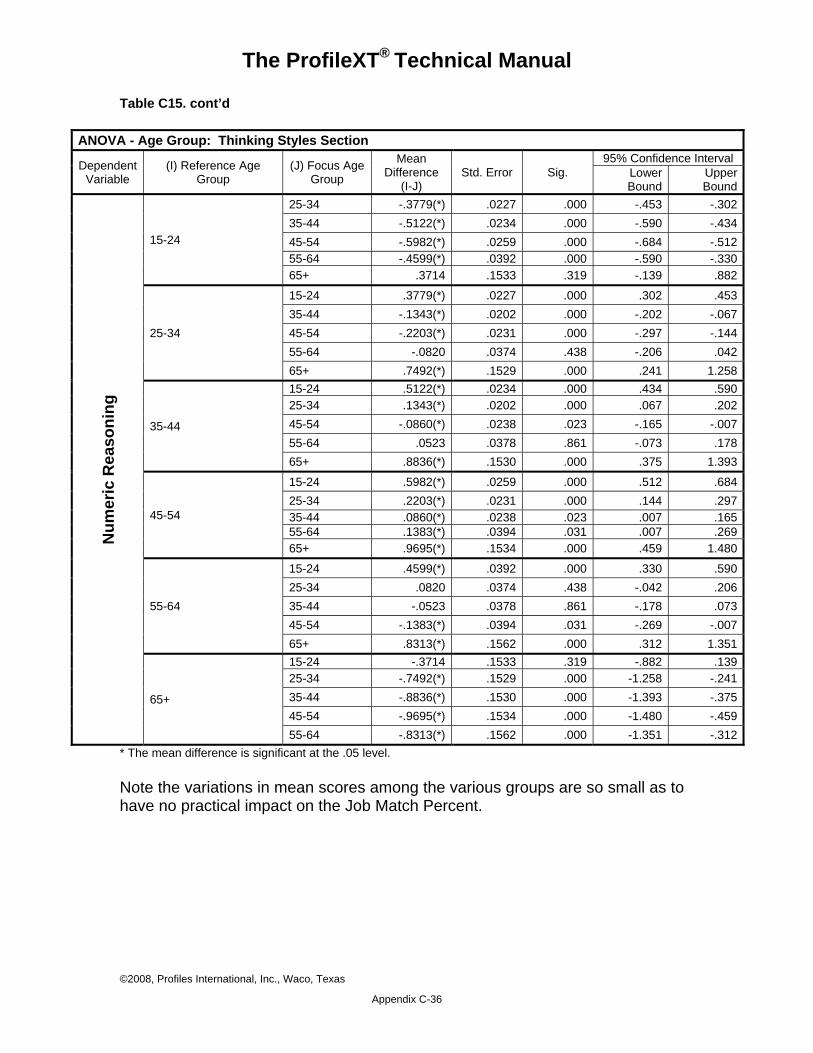
The ProfileXT® Technical Manual
©2008, Profiles International, Inc., Waco, Texas
Appendix C-36
Table C15. cont’d
ANOVA - Age Group: Thinking Styles Section
Dependent Variable
(I) Reference Age Group
(J) Focus Age Group
Mean Difference
(I-J) Std. Error Sig.
95% Confidence Interval Lower Bound
Upper Bound
Num
eric
Rea
soni
ng
15-24
25-34 -.3779(*) .0227 .000 -.453 -.30235-44 -.5122(*) .0234 .000 -.590 -.43445-54 -.5982(*) .0259 .000 -.684 -.51255-64 -.4599(*) .0392 .000 -.590 -.33065+ .3714 .1533 .319 -.139 .882
25-34
15-24 .3779(*) .0227 .000 .302 .45335-44 -.1343(*) .0202 .000 -.202 -.06745-54 -.2203(*) .0231 .000 -.297 -.14455-64 -.0820 .0374 .438 -.206 .04265+ .7492(*) .1529 .000 .241 1.258
35-44
15-24 .5122(*) .0234 .000 .434 .59025-34 .1343(*) .0202 .000 .067 .20245-54 -.0860(*) .0238 .023 -.165 -.00755-64 .0523 .0378 .861 -.073 .17865+ .8836(*) .1530 .000 .375 1.393
45-54
15-24 .5982(*) .0259 .000 .512 .68425-34 .2203(*) .0231 .000 .144 .29735-44 .0860(*) .0238 .023 .007 .16555-64 .1383(*) .0394 .031 .007 .26965+ .9695(*) .1534 .000 .459 1.480
55-64
15-24 .4599(*) .0392 .000 .330 .59025-34 .0820 .0374 .438 -.042 .20635-44 -.0523 .0378 .861 -.178 .07345-54 -.1383(*) .0394 .031 -.269 -.00765+ .8313(*) .1562 .000 .312 1.351
65+
15-24 -.3714 .1533 .319 -.882 .13925-34 -.7492(*) .1529 .000 -1.258 -.24135-44 -.8836(*) .1530 .000 -1.393 -.37545-54 -.9695(*) .1534 .000 -1.480 -.45955-64 -.8313(*) .1562 .000 -1.351 -.312
* The mean difference is significant at the .05 level. Note the variations in mean scores among the various groups are so small as to have no practical impact on the Job Match Percent.
The ProfileXT® Technical Manual
Appendix D: Adverse Impact and Job Match Percent
As demonstrated in Appendix B, we take issues concerning adverse impact seriously. In maintaining this priority, it is important we constantly review the most current data in order to demonstrate the PXT’s level of fairness and lack of bias. As discussed earlier, the Job Match Percent is derived by matching the test taker’s score on each scale to a Job Match Pattern of scores for a specific position. If the test taker’s scores fall outside of the benchmark or pattern for a scale, the impact is to lower their Job Match Percent. The further the score falls outside of the pattern, the greater the negative impact on the Job Match Percent. This applies equally if they score above the pattern or below the pattern. Thus, those test takers having scores which closely match the pattern of scores defined for the position will have a higher percent match than those whose scores fall outside of the pattern. A study was conducted in 2005 to review the possibility of adverse impact among cases in which ProfileXT scores were matched to Job Match Patterns. The issue was to explore the impact, if any, caused by the Job Match Percents in light of ethnicity, gender, and age. The subjects in this study represent individuals who have been matched to Job Match Patterns during actual use of the PXT in the world of work in the USA. We have made some assumptions about these job match situations:
1. The applicants have applied for real-life positions where they felt they would have a reasonable fit to the job.
2. The Job Match Patterns for the jobs in question are valid patterns for each position in the study.
3. Some applicants have misjudged their fit to the position. 4. Not all applicants were placed into the position for which they applied.
Chapters 3 (Behavioral Traits Section), 4 (Occupational Interests Section), and 5 (Thinking Styles Section) summarize the results of this study. The statistical details are provided in this appendix. Overall, Behavioral Traits, Occupational Interests, and Thinking Styles Job Match Percents are displayed including descriptive statistics and the analyses of variance. Table D1 displays the descriptive statistics, including mean scores, standard deviations, and standard error by ethnic group for the four Job Match Percent scores. This information helps identify how each group’s Job Match Percents tended to distribute on each scale.
©2008, Profiles International, Inc., Waco, Texas
Appendix D-1
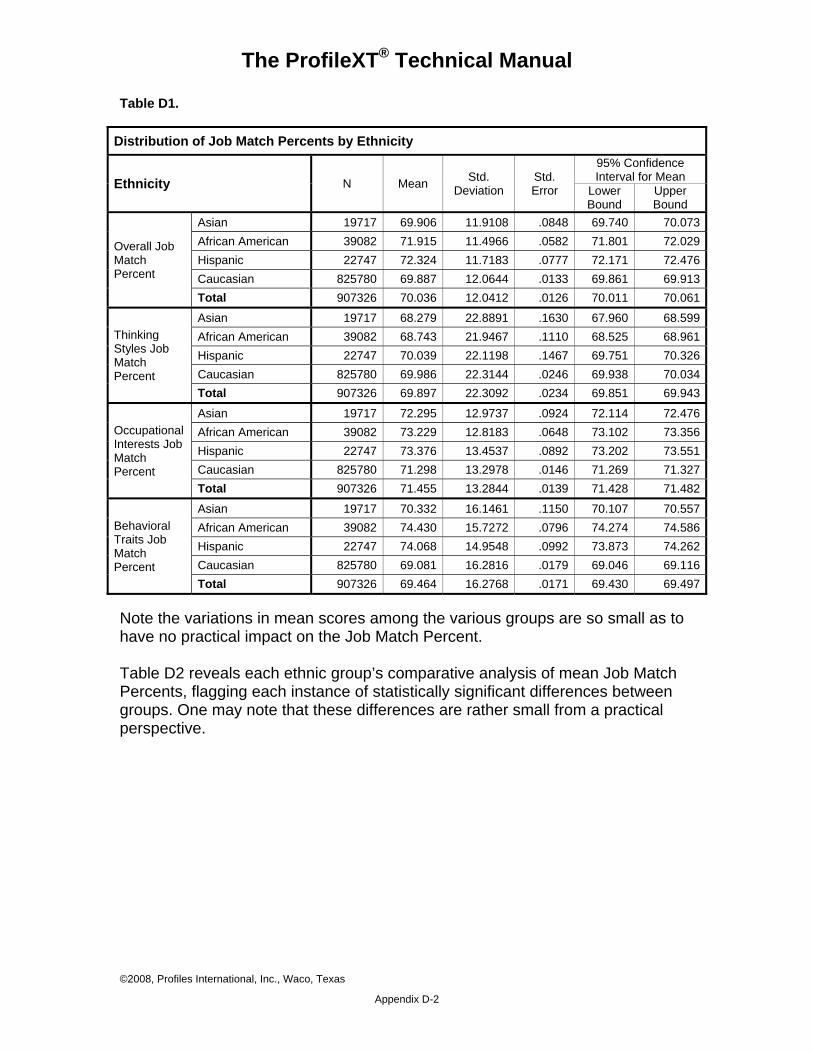
The ProfileXT® Technical Manual
Table D1.
Distribution of Job Match Percents by Ethnicity
Ethnicity N Mean Std. Deviation
Std. Error
95% Confidence Interval for Mean
Lower Bound
Upper Bound
Overall Job Match Percent
Asian 19717 69.906 11.9108 .0848 69.740 70.073African American 39082 71.915 11.4966 .0582 71.801 72.029Hispanic 22747 72.324 11.7183 .0777 72.171 72.476Caucasian 825780 69.887 12.0644 .0133 69.861 69.913Total 907326 70.036 12.0412 .0126 70.011 70.061
Thinking Styles Job Match Percent
Asian 19717 68.279 22.8891 .1630 67.960 68.599African American 39082 68.743 21.9467 .1110 68.525 68.961Hispanic 22747 70.039 22.1198 .1467 69.751 70.326Caucasian 825780 69.986 22.3144 .0246 69.938 70.034Total 907326 69.897 22.3092 .0234 69.851 69.943
OccupationalInterests Job Match Percent
Asian 19717 72.295 12.9737 .0924 72.114 72.476African American 39082 73.229 12.8183 .0648 73.102 73.356Hispanic 22747 73.376 13.4537 .0892 73.202 73.551Caucasian 825780 71.298 13.2978 .0146 71.269 71.327Total 907326 71.455 13.2844 .0139 71.428 71.482
Behavioral Traits Job Match Percent
Asian 19717 70.332 16.1461 .1150 70.107 70.557African American 39082 74.430 15.7272 .0796 74.274 74.586Hispanic 22747 74.068 14.9548 .0992 73.873 74.262Caucasian 825780 69.081 16.2816 .0179 69.046 69.116Total 907326 69.464 16.2768 .0171 69.430 69.497
Note the variations in mean scores among the various groups are so small as to have no practical impact on the Job Match Percent. Table D2 reveals each ethnic group’s comparative analysis of mean Job Match Percents, flagging each instance of statistically significant differences between groups. One may note that these differences are rather small from a practical perspective.
©2008, Profiles International, Inc., Waco, Texas
Appendix D-2
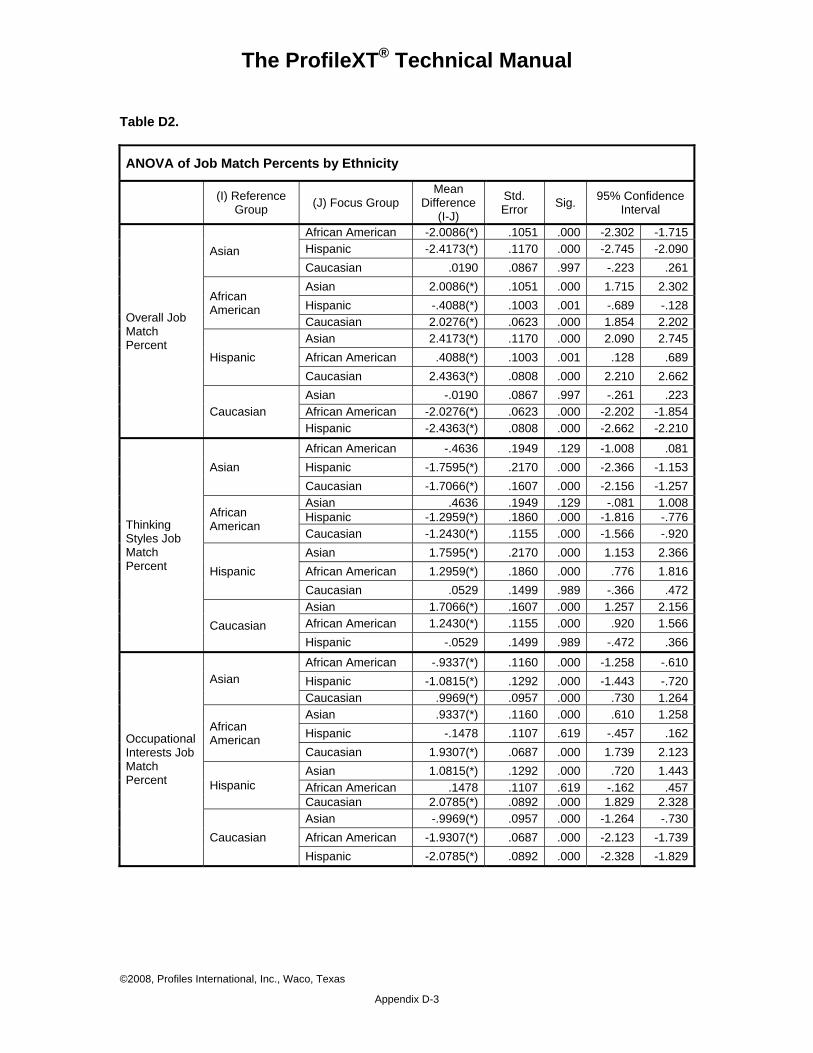
The ProfileXT® Technical Manual
Table D2.
ANOVA of Job Match Percents by Ethnicity
(I) Reference Group (J) Focus Group
Mean Difference
(I-J)
Std. Error Sig. 95% Confidence
Interval
Overall Job Match Percent
Asian African American -2.0086(*) .1051 .000 -2.302 -1.715Hispanic -2.4173(*) .1170 .000 -2.745 -2.090Caucasian .0190 .0867 .997 -.223 .261
African American
Asian 2.0086(*) .1051 .000 1.715 2.302Hispanic -.4088(*) .1003 .001 -.689 -.128Caucasian 2.0276(*) .0623 .000 1.854 2.202
Hispanic Asian 2.4173(*) .1170 .000 2.090 2.745African American .4088(*) .1003 .001 .128 .689Caucasian 2.4363(*) .0808 .000 2.210 2.662
Caucasian Asian -.0190 .0867 .997 -.261 .223African American -2.0276(*) .0623 .000 -2.202 -1.854Hispanic -2.4363(*) .0808 .000 -2.662 -2.210
Thinking Styles Job Match Percent
Asian African American -.4636 .1949 .129 -1.008 .081Hispanic -1.7595(*) .2170 .000 -2.366 -1.153Caucasian -1.7066(*) .1607 .000 -2.156 -1.257
African American
Asian .4636 .1949 .129 -.081 1.008Hispanic -1.2959(*) .1860 .000 -1.816 -.776Caucasian -1.2430(*) .1155 .000 -1.566 -.920
Hispanic Asian 1.7595(*) .2170 .000 1.153 2.366African American 1.2959(*) .1860 .000 .776 1.816Caucasian .0529 .1499 .989 -.366 .472
Caucasian Asian 1.7066(*) .1607 .000 1.257 2.156African American 1.2430(*) .1155 .000 .920 1.566Hispanic -.0529 .1499 .989 -.472 .366
Occupational Interests Job Match Percent
Asian African American -.9337(*) .1160 .000 -1.258 -.610Hispanic -1.0815(*) .1292 .000 -1.443 -.720Caucasian .9969(*) .0957 .000 .730 1.264
African American
Asian .9337(*) .1160 .000 .610 1.258Hispanic -.1478 .1107 .619 -.457 .162Caucasian 1.9307(*) .0687 .000 1.739 2.123
Hispanic Asian 1.0815(*) .1292 .000 .720 1.443African American .1478 .1107 .619 -.162 .457Caucasian 2.0785(*) .0892 .000 1.829 2.328
Caucasian Asian -.9969(*) .0957 .000 -1.264 -.730African American -1.9307(*) .0687 .000 -2.123 -1.739Hispanic -2.0785(*) .0892 .000 -2.328 -1.829
©2008, Profiles International, Inc., Waco, Texas
Appendix D-3
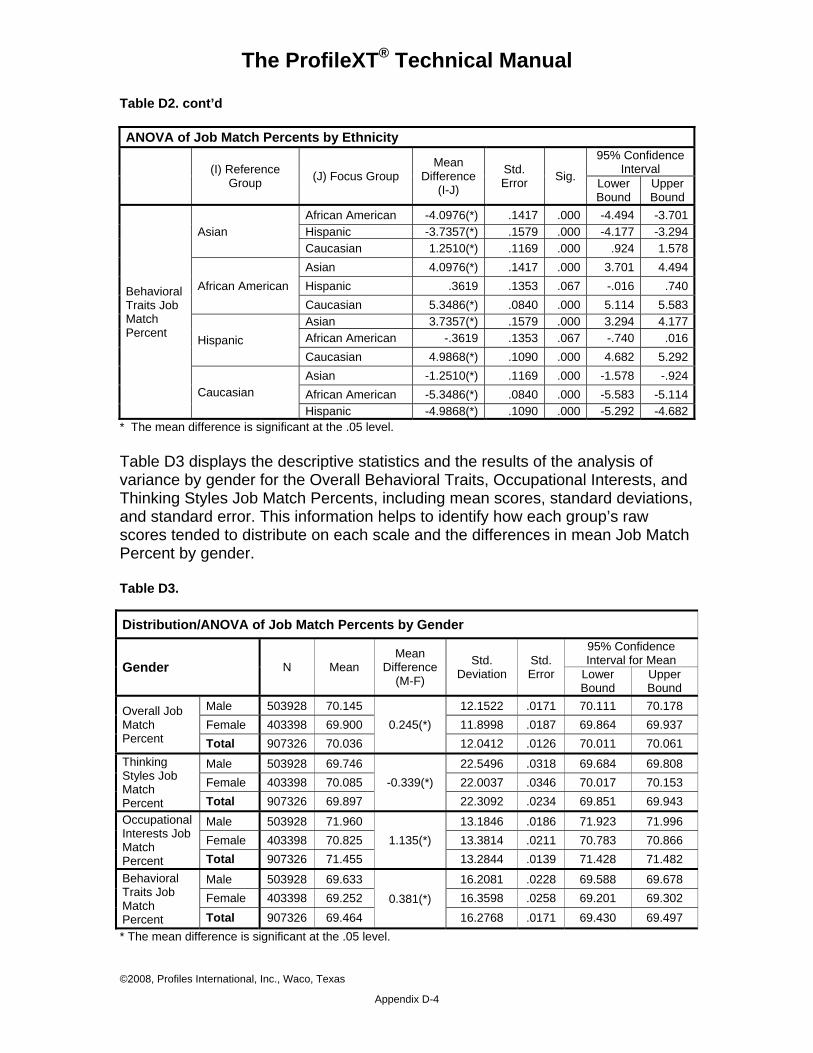
The ProfileXT® Technical Manual
Table D2. cont’d ANOVA of Job Match Percents by Ethnicity
(I) Reference Group (J) Focus Group
Mean Difference
(I-J)
Std. Error Sig.
95% Confidence Interval
Lower Bound
Upper Bound
Behavioral Traits Job Match Percent
Asian African American -4.0976(*) .1417 .000 -4.494 -3.701Hispanic -3.7357(*) .1579 .000 -4.177 -3.294Caucasian 1.2510(*) .1169 .000 .924 1.578
African American Asian 4.0976(*) .1417 .000 3.701 4.494Hispanic .3619 .1353 .067 -.016 .740Caucasian 5.3486(*) .0840 .000 5.114 5.583
Hispanic Asian 3.7357(*) .1579 .000 3.294 4.177African American -.3619 .1353 .067 -.740 .016Caucasian 4.9868(*) .1090 .000 4.682 5.292
Caucasian Asian -1.2510(*) .1169 .000 -1.578 -.924African American -5.3486(*) .0840 .000 -5.583 -5.114Hispanic -4.9868(*) .1090 .000 -5.292 -4.682
* The mean difference is significant at the .05 level. Table D3 displays the descriptive statistics and the results of the analysis of variance by gender for the Overall Behavioral Traits, Occupational Interests, and Thinking Styles Job Match Percents, including mean scores, standard deviations, and standard error. This information helps to identify how each group’s raw scores tended to distribute on each scale and the differences in mean Job Match Percent by gender. Table D3.
Distribution/ANOVA of Job Match Percents by Gender
Gender
N Mean Mean
Difference (M-F)
Std. Deviation
Std. Error
95% Confidence Interval for Mean
Lower Bound
Upper Bound
Overall Job Match Percent
Male 503928 70.145 0.245(*)
12.1522 .0171 70.111 70.178 Female 403398 69.900 11.8998 .0187 69.864 69.937 Total 907326 70.036 12.0412 .0126 70.011 70.061
Thinking Styles Job Match Percent
Male 503928 69.746 -0.339(*)
22.5496 .0318 69.684 69.808 Female 403398 70.085 22.0037 .0346 70.017 70.153 Total 907326 69.897 22.3092 .0234 69.851 69.943
Occupational Interests Job Match Percent
Male 503928 71.960 1.135(*)
13.1846 .0186 71.923 71.996 Female 403398 70.825 13.3814 .0211 70.783 70.866 Total 907326 71.455 13.2844 .0139 71.428 71.482
Behavioral Traits Job Match Percent
Male 503928 69.633 0.381(*)
16.2081 .0228 69.588 69.678 Female 403398 69.252 16.3598 .0258 69.201 69.302 Total 907326 69.464 16.2768 .0171 69.430 69.497
* The mean difference is significant at the .05 level.
©2008, Profiles International, Inc., Waco, Texas
Appendix D-4
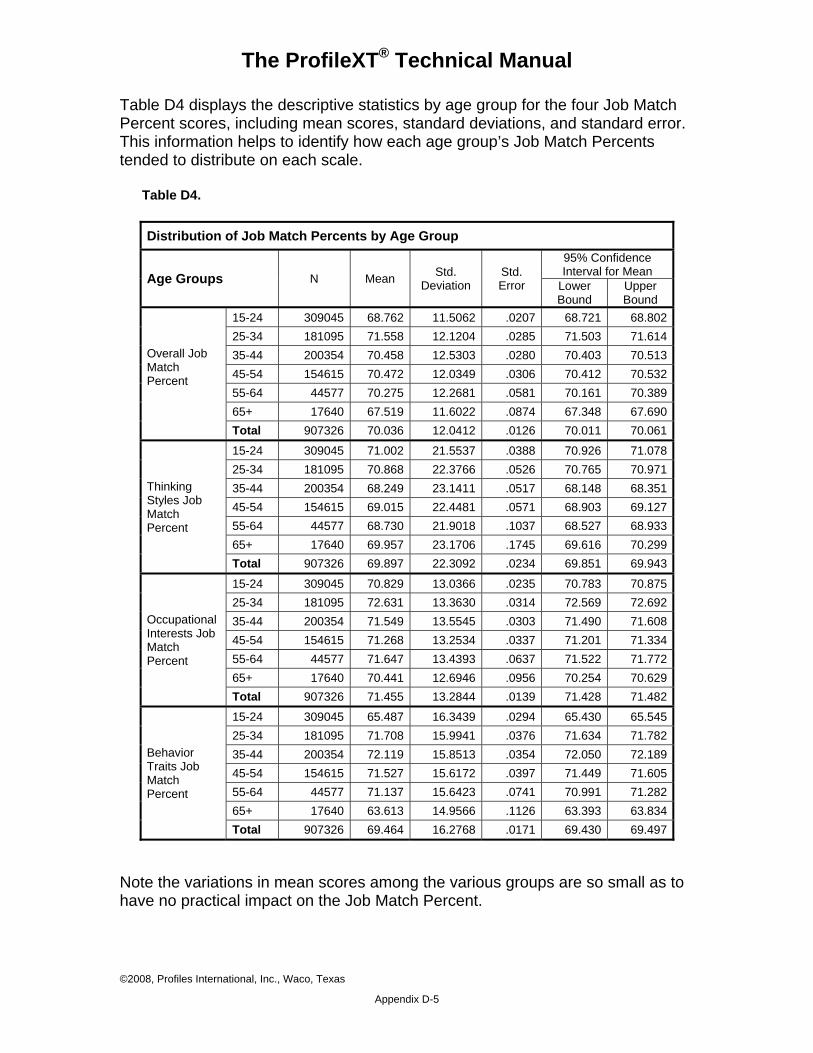
The ProfileXT® Technical Manual
Table D4 displays the descriptive statistics by age group for the four Job Match Percent scores, including mean scores, standard deviations, and standard error. This information helps to identify how each age group’s Job Match Percents tended to distribute on each scale. Table D4.
Distribution of Job Match Percents by Age Group
Age Groups N Mean Std. Deviation
Std. Error
95% Confidence Interval for Mean
Lower Bound
Upper Bound
Overall Job Match Percent
15-24 309045 68.762 11.5062 .0207 68.721 68.80225-34 181095 71.558 12.1204 .0285 71.503 71.61435-44 200354 70.458 12.5303 .0280 70.403 70.51345-54 154615 70.472 12.0349 .0306 70.412 70.53255-64 44577 70.275 12.2681 .0581 70.161 70.38965+ 17640 67.519 11.6022 .0874 67.348 67.690Total 907326 70.036 12.0412 .0126 70.011 70.061
Thinking Styles Job Match Percent
15-24 309045 71.002 21.5537 .0388 70.926 71.07825-34 181095 70.868 22.3766 .0526 70.765 70.97135-44 200354 68.249 23.1411 .0517 68.148 68.35145-54 154615 69.015 22.4481 .0571 68.903 69.12755-64 44577 68.730 21.9018 .1037 68.527 68.93365+ 17640 69.957 23.1706 .1745 69.616 70.299Total 907326 69.897 22.3092 .0234 69.851 69.943
Occupational Interests Job Match Percent
15-24 309045 70.829 13.0366 .0235 70.783 70.87525-34 181095 72.631 13.3630 .0314 72.569 72.69235-44 200354 71.549 13.5545 .0303 71.490 71.60845-54 154615 71.268 13.2534 .0337 71.201 71.33455-64 44577 71.647 13.4393 .0637 71.522 71.77265+ 17640 70.441 12.6946 .0956 70.254 70.629Total 907326 71.455 13.2844 .0139 71.428 71.482
Behavior Traits Job Match Percent
15-24 309045 65.487 16.3439 .0294 65.430 65.54525-34 181095 71.708 15.9941 .0376 71.634 71.78235-44 200354 72.119 15.8513 .0354 72.050 72.18945-54 154615 71.527 15.6172 .0397 71.449 71.60555-64 44577 71.137 15.6423 .0741 70.991 71.28265+ 17640 63.613 14.9566 .1126 63.393 63.834Total 907326 69.464 16.2768 .0171 69.430 69.497
Note the variations in mean scores among the various groups are so small as to have no practical impact on the Job Match Percent.
©2008, Profiles International, Inc., Waco, Texas
Appendix D-5
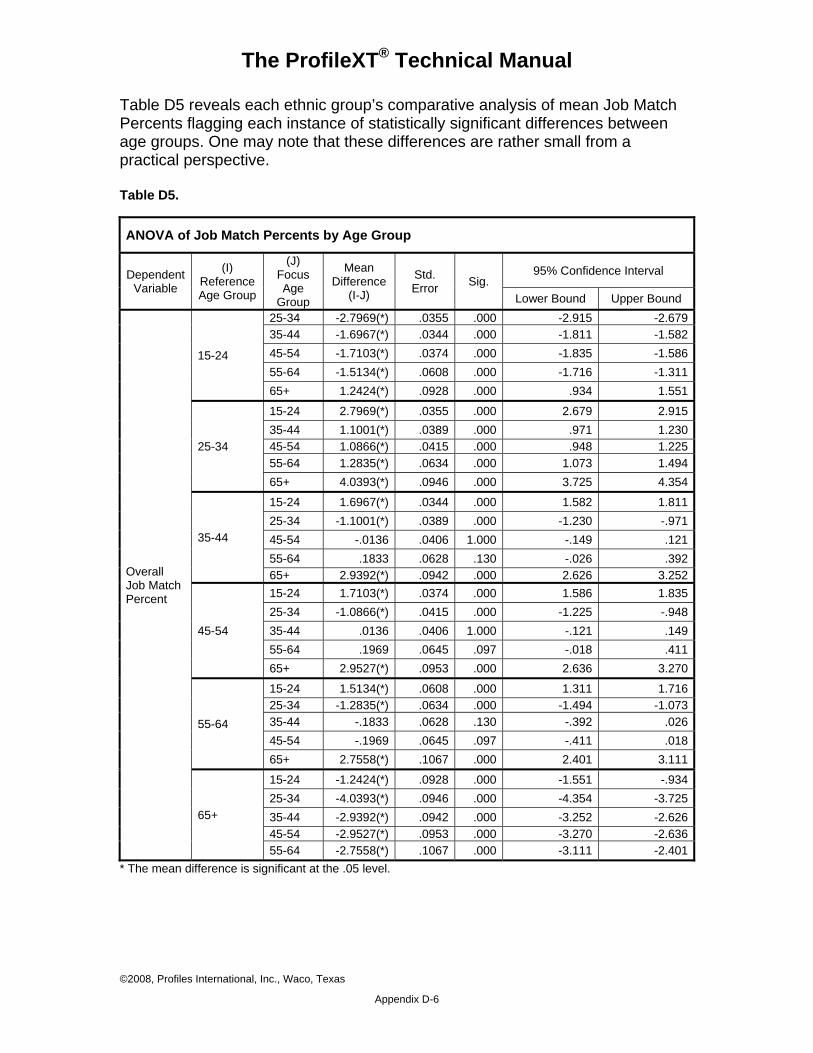
The ProfileXT® Technical Manual
Table D5 reveals each ethnic group’s comparative analysis of mean Job Match Percents flagging each instance of statistically significant differences between age groups. One may note that these differences are rather small from a practical perspective. Table D5.
ANOVA of Job Match Percents by Age Group
Dependent Variable
(I) Reference Age Group
(J) Focus Age
Group
Mean Difference
(I-J)
Std. Error Sig.
95% Confidence Interval
Lower Bound Upper Bound
Overall Job Match Percent
15-24
25-34 -2.7969(*) .0355 .000 -2.915 -2.67935-44 -1.6967(*) .0344 .000 -1.811 -1.58245-54 -1.7103(*) .0374 .000 -1.835 -1.58655-64 -1.5134(*) .0608 .000 -1.716 -1.31165+ 1.2424(*) .0928 .000 .934 1.551
25-34
15-24 2.7969(*) .0355 .000 2.679 2.91535-44 1.1001(*) .0389 .000 .971 1.23045-54 1.0866(*) .0415 .000 .948 1.22555-64 1.2835(*) .0634 .000 1.073 1.49465+ 4.0393(*) .0946 .000 3.725 4.354
35-44
15-24 1.6967(*) .0344 .000 1.582 1.81125-34 -1.1001(*) .0389 .000 -1.230 -.97145-54 -.0136 .0406 1.000 -.149 .12155-64 .1833 .0628 .130 -.026 .39265+ 2.9392(*) .0942 .000 2.626 3.252
45-54
15-24 1.7103(*) .0374 .000 1.586 1.83525-34 -1.0866(*) .0415 .000 -1.225 -.94835-44 .0136 .0406 1.000 -.121 .14955-64 .1969 .0645 .097 -.018 .41165+ 2.9527(*) .0953 .000 2.636 3.270
55-64
15-24 1.5134(*) .0608 .000 1.311 1.71625-34 -1.2835(*) .0634 .000 -1.494 -1.07335-44 -.1833 .0628 .130 -.392 .02645-54 -.1969 .0645 .097 -.411 .01865+ 2.7558(*) .1067 .000 2.401 3.111
65+
15-24 -1.2424(*) .0928 .000 -1.551 -.93425-34 -4.0393(*) .0946 .000 -4.354 -3.72535-44 -2.9392(*) .0942 .000 -3.252 -2.62645-54 -2.9527(*) .0953 .000 -3.270 -2.63655-64 -2.7558(*) .1067 .000 -3.111 -2.401
* The mean difference is significant at the .05 level.
©2008, Profiles International, Inc., Waco, Texas
Appendix D-6
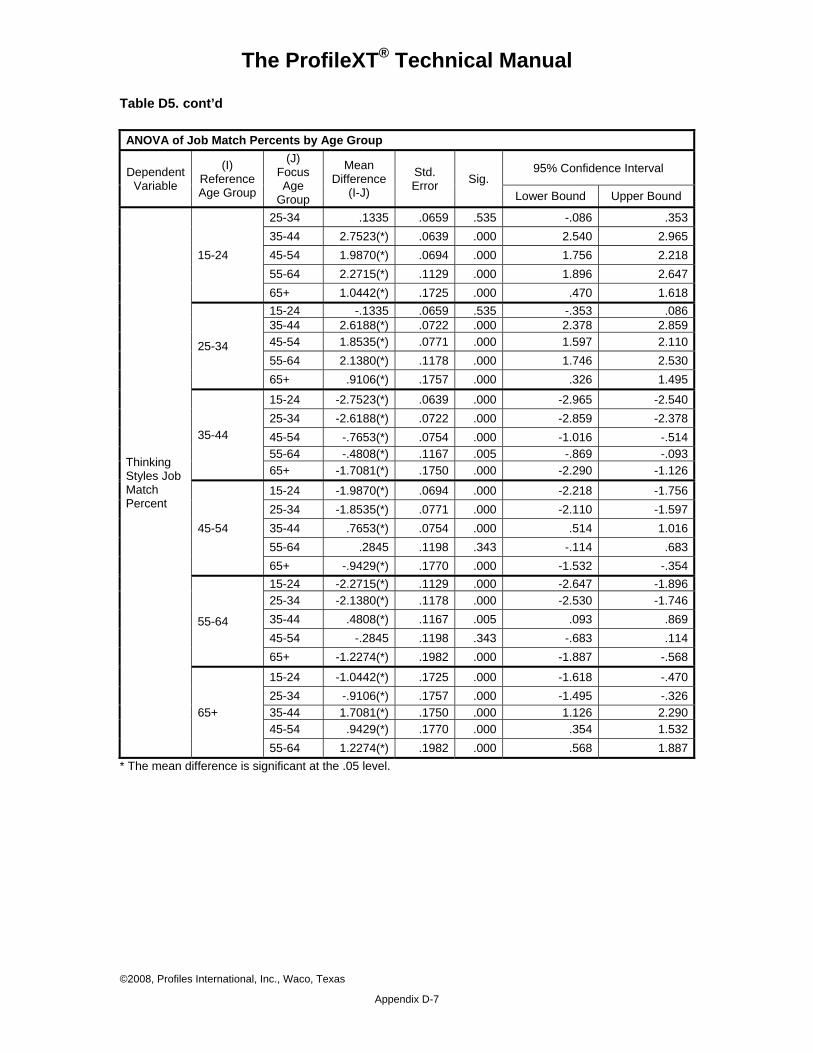
The ProfileXT® Technical Manual
Table D5. cont’d ANOVA of Job Match Percents by Age Group
Dependent Variable
(I) ReferenceAge Group
(J) Focus Age
Group
Mean Difference
(I-J)
Std. Error Sig.
95% Confidence Interval
Lower Bound Upper Bound
Thinking Styles Job Match Percent
15-24
25-34 .1335 .0659 .535 -.086 .35335-44 2.7523(*) .0639 .000 2.540 2.96545-54 1.9870(*) .0694 .000 1.756 2.21855-64 2.2715(*) .1129 .000 1.896 2.64765+ 1.0442(*) .1725 .000 .470 1.618
25-34
15-24 -.1335 .0659 .535 -.353 .08635-44 2.6188(*) .0722 .000 2.378 2.85945-54 1.8535(*) .0771 .000 1.597 2.11055-64 2.1380(*) .1178 .000 1.746 2.53065+ .9106(*) .1757 .000 .326 1.495
35-44
15-24 -2.7523(*) .0639 .000 -2.965 -2.54025-34 -2.6188(*) .0722 .000 -2.859 -2.37845-54 -.7653(*) .0754 .000 -1.016 -.51455-64 -.4808(*) .1167 .005 -.869 -.09365+ -1.7081(*) .1750 .000 -2.290 -1.126
45-54
15-24 -1.9870(*) .0694 .000 -2.218 -1.75625-34 -1.8535(*) .0771 .000 -2.110 -1.59735-44 .7653(*) .0754 .000 .514 1.01655-64 .2845 .1198 .343 -.114 .68365+ -.9429(*) .1770 .000 -1.532 -.354
55-64
15-24 -2.2715(*) .1129 .000 -2.647 -1.89625-34 -2.1380(*) .1178 .000 -2.530 -1.74635-44 .4808(*) .1167 .005 .093 .86945-54 -.2845 .1198 .343 -.683 .11465+ -1.2274(*) .1982 .000 -1.887 -.568
65+
15-24 -1.0442(*) .1725 .000 -1.618 -.47025-34 -.9106(*) .1757 .000 -1.495 -.32635-44 1.7081(*) .1750 .000 1.126 2.29045-54 .9429(*) .1770 .000 .354 1.53255-64 1.2274(*) .1982 .000 .568 1.887
* The mean difference is significant at the .05 level.
©2008, Profiles International, Inc., Waco, Texas
Appendix D-7
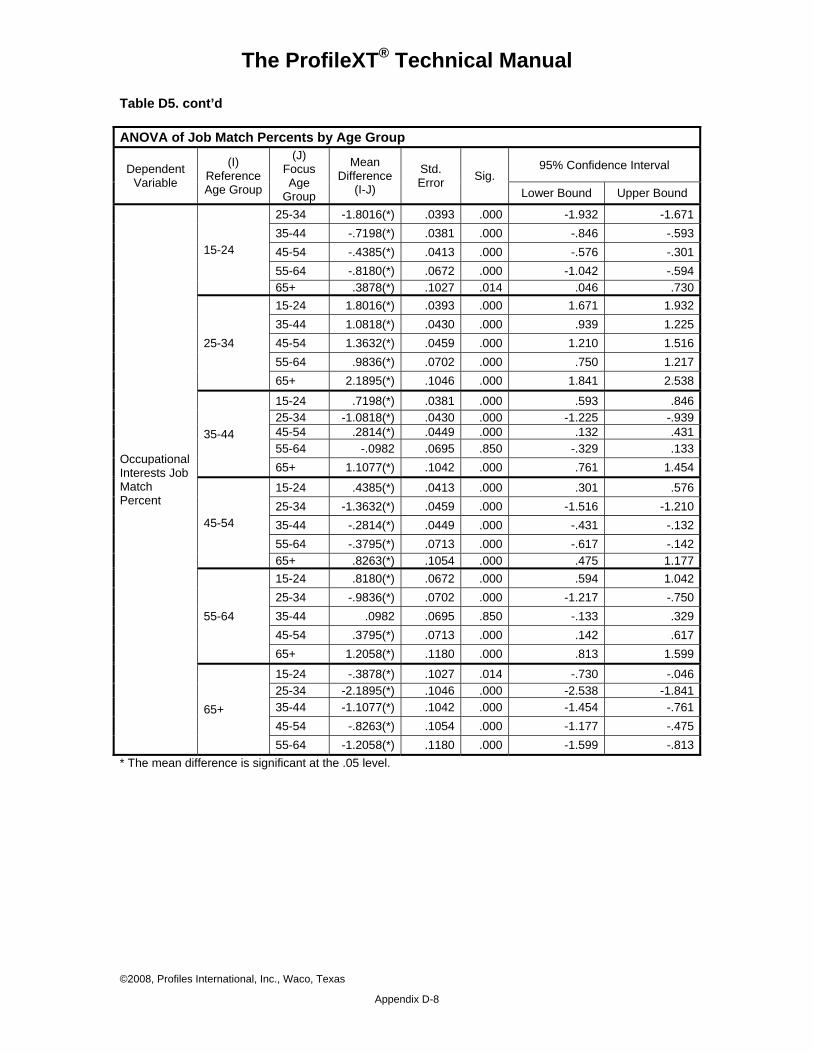
The ProfileXT® Technical Manual
Table D5. cont’d ANOVA of Job Match Percents by Age Group
Dependent Variable
(I) ReferenceAge Group
(J) Focus Age
Group
Mean Difference
(I-J)
Std. Error Sig.
95% Confidence Interval
Lower Bound Upper Bound
Occupational Interests Job Match Percent
15-24
25-34 -1.8016(*) .0393 .000 -1.932 -1.67135-44 -.7198(*) .0381 .000 -.846 -.59345-54 -.4385(*) .0413 .000 -.576 -.30155-64 -.8180(*) .0672 .000 -1.042 -.59465+ .3878(*) .1027 .014 .046 .730
25-34
15-24 1.8016(*) .0393 .000 1.671 1.93235-44 1.0818(*) .0430 .000 .939 1.22545-54 1.3632(*) .0459 .000 1.210 1.51655-64 .9836(*) .0702 .000 .750 1.21765+ 2.1895(*) .1046 .000 1.841 2.538
35-44
15-24 .7198(*) .0381 .000 .593 .84625-34 -1.0818(*) .0430 .000 -1.225 -.93945-54 .2814(*) .0449 .000 .132 .43155-64 -.0982 .0695 .850 -.329 .13365+ 1.1077(*) .1042 .000 .761 1.454
45-54
15-24 .4385(*) .0413 .000 .301 .57625-34 -1.3632(*) .0459 .000 -1.516 -1.21035-44 -.2814(*) .0449 .000 -.431 -.13255-64 -.3795(*) .0713 .000 -.617 -.14265+ .8263(*) .1054 .000 .475 1.177
55-64
15-24 .8180(*) .0672 .000 .594 1.04225-34 -.9836(*) .0702 .000 -1.217 -.75035-44 .0982 .0695 .850 -.133 .32945-54 .3795(*) .0713 .000 .142 .61765+ 1.2058(*) .1180 .000 .813 1.599
65+
15-24 -.3878(*) .1027 .014 -.730 -.04625-34 -2.1895(*) .1046 .000 -2.538 -1.84135-44 -1.1077(*) .1042 .000 -1.454 -.76145-54 -.8263(*) .1054 .000 -1.177 -.47555-64 -1.2058(*) .1180 .000 -1.599 -.813
* The mean difference is significant at the .05 level.
©2008, Profiles International, Inc., Waco, Texas
Appendix D-8
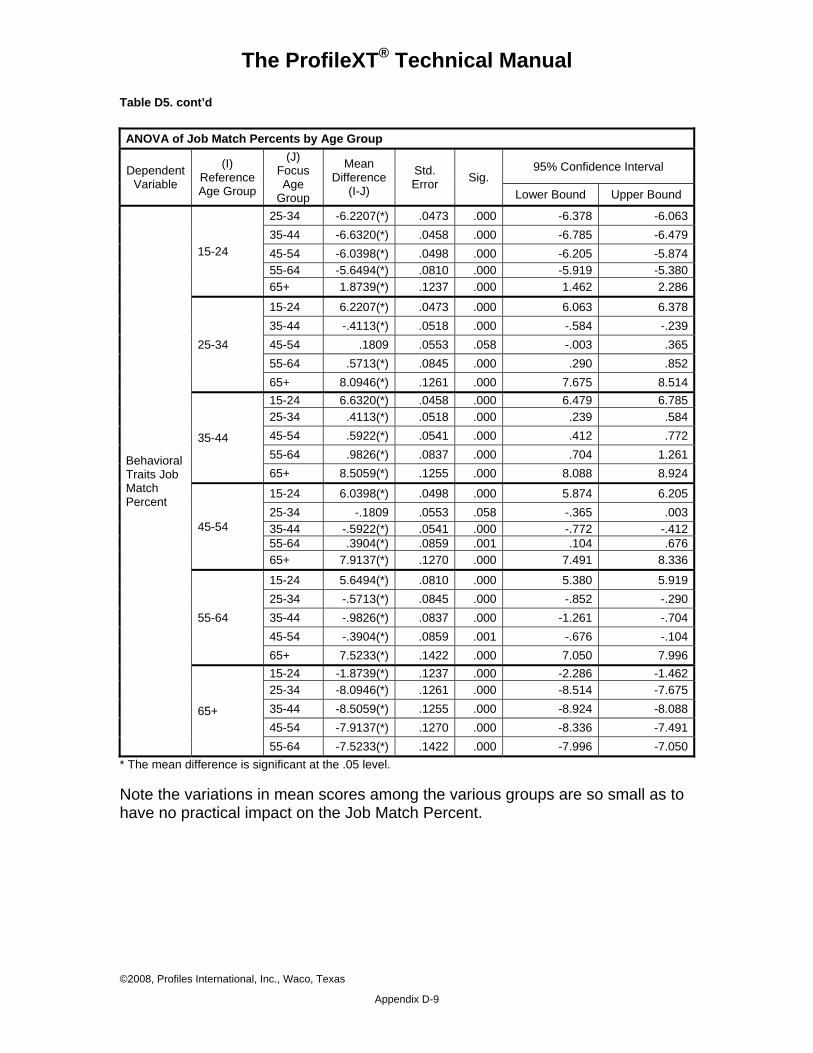
The ProfileXT® Technical Manual
©2008, Profiles International, Inc., Waco, Texas
Appendix D-9
Table D5. cont’d ANOVA of Job Match Percents by Age Group
Dependent Variable
(I) Reference Age Group
(J) Focus Age
Group
Mean Difference
(I-J)
Std. Error Sig.
95% Confidence Interval
Lower Bound Upper Bound
Behavioral Traits Job Match Percent
15-24
25-34 -6.2207(*) .0473 .000 -6.378 -6.06335-44 -6.6320(*) .0458 .000 -6.785 -6.47945-54 -6.0398(*) .0498 .000 -6.205 -5.87455-64 -5.6494(*) .0810 .000 -5.919 -5.38065+ 1.8739(*) .1237 .000 1.462 2.286
25-34
15-24 6.2207(*) .0473 .000 6.063 6.37835-44 -.4113(*) .0518 .000 -.584 -.23945-54 .1809 .0553 .058 -.003 .36555-64 .5713(*) .0845 .000 .290 .85265+ 8.0946(*) .1261 .000 7.675 8.514
35-44
15-24 6.6320(*) .0458 .000 6.479 6.78525-34 .4113(*) .0518 .000 .239 .58445-54 .5922(*) .0541 .000 .412 .77255-64 .9826(*) .0837 .000 .704 1.26165+ 8.5059(*) .1255 .000 8.088 8.924
45-54
15-24 6.0398(*) .0498 .000 5.874 6.20525-34 -.1809 .0553 .058 -.365 .00335-44 -.5922(*) .0541 .000 -.772 -.41255-64 .3904(*) .0859 .001 .104 .67665+ 7.9137(*) .1270 .000 7.491 8.336
55-64
15-24 5.6494(*) .0810 .000 5.380 5.91925-34 -.5713(*) .0845 .000 -.852 -.29035-44 -.9826(*) .0837 .000 -1.261 -.70445-54 -.3904(*) .0859 .001 -.676 -.10465+ 7.5233(*) .1422 .000 7.050 7.996
65+
15-24 -1.8739(*) .1237 .000 -2.286 -1.46225-34 -8.0946(*) .1261 .000 -8.514 -7.67535-44 -8.5059(*) .1255 .000 -8.924 -8.08845-54 -7.9137(*) .1270 .000 -8.336 -7.49155-64 -7.5233(*) .1422 .000 -7.996 -7.050
* The mean difference is significant at the .05 level. Note the variations in mean scores among the various groups are so small as to have no practical impact on the Job Match Percent.
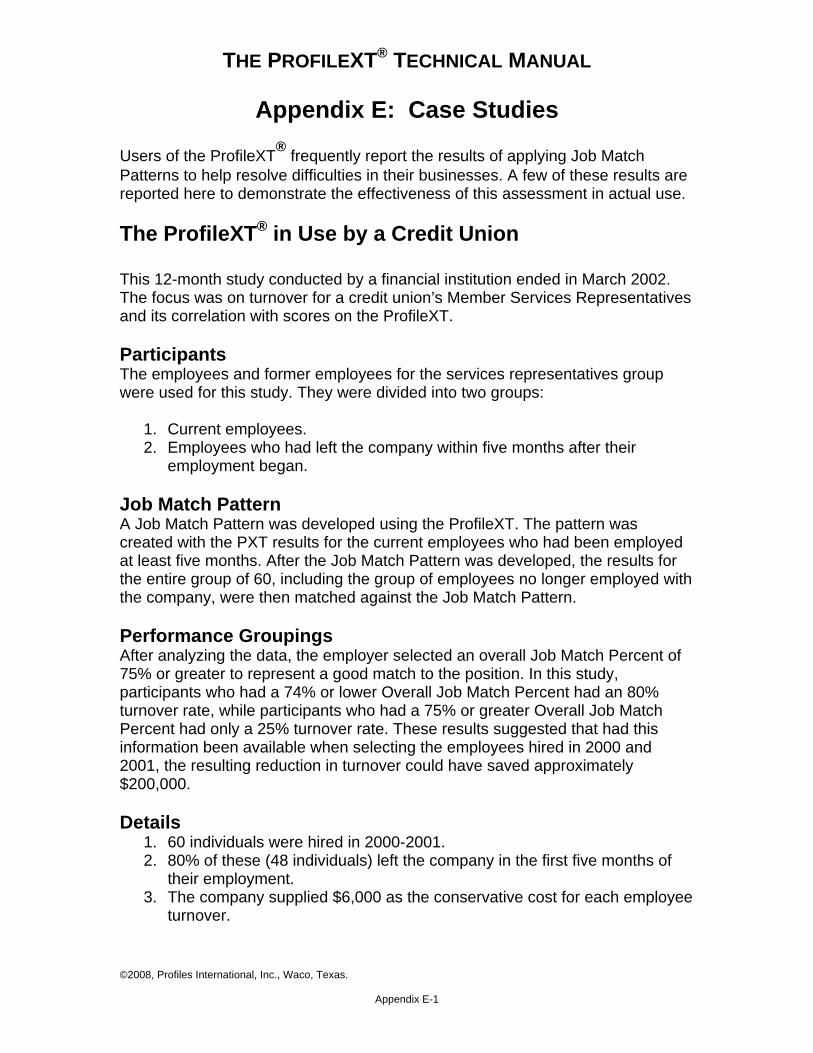
THE PROFILEXT® TECHNICAL MANUAL
Appendix E: Case Studies Users of the ProfileXT® frequently report the results of applying Job Match Patterns to help resolve difficulties in their businesses. A few of these results are reported here to demonstrate the effectiveness of this assessment in actual use. The ProfileXT® in Use by a Credit Union This 12-month study conducted by a financial institution ended in March 2002. The focus was on turnover for a credit union’s Member Services Representatives and its correlation with scores on the ProfileXT. Participants The employees and former employees for the services representatives group were used for this study. They were divided into two groups:
1. Current employees. 2. Employees who had left the company within five months after their
employment began. Job Match Pattern A Job Match Pattern was developed using the ProfileXT. The pattern was created with the PXT results for the current employees who had been employed at least five months. After the Job Match Pattern was developed, the results for the entire group of 60, including the group of employees no longer employed with the company, were then matched against the Job Match Pattern. Performance Groupings After analyzing the data, the employer selected an overall Job Match Percent of 75% or greater to represent a good match to the position. In this study, participants who had a 74% or lower Overall Job Match Percent had an 80% turnover rate, while participants who had a 75% or greater Overall Job Match Percent had only a 25% turnover rate. These results suggested that had this information been available when selecting the employees hired in 2000 and 2001, the resulting reduction in turnover could have saved approximately $200,000. Details
1. 60 individuals were hired in 2000-2001. 2. 80% of these (48 individuals) left the company in the first five months of
their employment. 3. The company supplied $6,000 as the conservative cost for each employee
turnover.
©2008, Profiles International, Inc., Waco, Texas. Appendix E-1
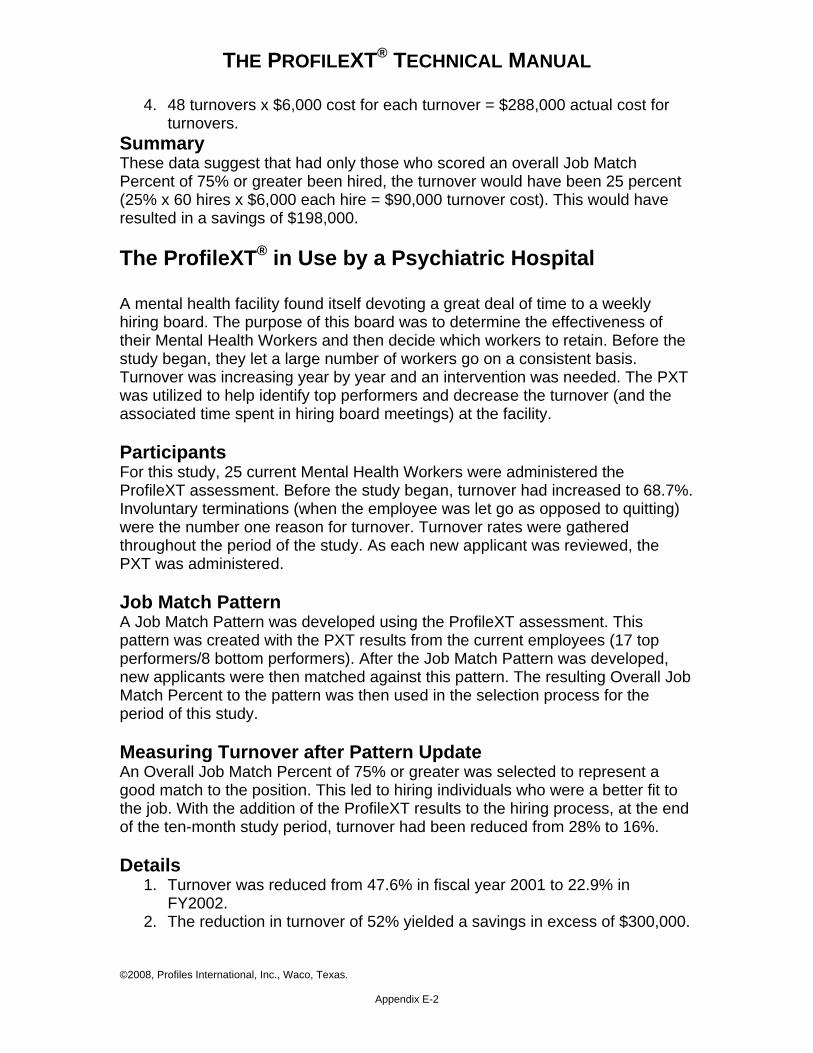
THE PROFILEXT® TECHNICAL MANUAL
4. 48 turnovers x $6,000 cost for each turnover = $288,000 actual cost for turnovers.
Summary These data suggest that had only those who scored an overall Job Match Percent of 75% or greater been hired, the turnover would have been 25 percent (25% x 60 hires x $6,000 each hire = $90,000 turnover cost). This would have resulted in a savings of $198,000. The ProfileXT® in Use by a Psychiatric Hospital
A mental health facility found itself devoting a great deal of time to a weekly hiring board. The purpose of this board was to determine the effectiveness of their Mental Health Workers and then decide which workers to retain. Before the study began, they let a large number of workers go on a consistent basis. Turnover was increasing year by year and an intervention was needed. The PXT was utilized to help identify top performers and decrease the turnover (and the associated time spent in hiring board meetings) at the facility. Participants For this study, 25 current Mental Health Workers were administered the ProfileXT assessment. Before the study began, turnover had increased to 68.7%. Involuntary terminations (when the employee was let go as opposed to quitting) were the number one reason for turnover. Turnover rates were gathered throughout the period of the study. As each new applicant was reviewed, the PXT was administered. Job Match Pattern A Job Match Pattern was developed using the ProfileXT assessment. This pattern was created with the PXT results from the current employees (17 top performers/8 bottom performers). After the Job Match Pattern was developed, new applicants were then matched against this pattern. The resulting Overall Job Match Percent to the pattern was then used in the selection process for the period of this study. Measuring Turnover after Pattern Update An Overall Job Match Percent of 75% or greater was selected to represent a good match to the position. This led to hiring individuals who were a better fit to the job. With the addition of the ProfileXT results to the hiring process, at the end of the ten-month study period, turnover had been reduced from 28% to 16%. Details
1. Turnover was reduced from 47.6% in fiscal year 2001 to 22.9% in FY2002.
2. The reduction in turnover of 52% yielded a savings in excess of $300,000.
©2008, Profiles International, Inc., Waco, Texas. Appendix E-2
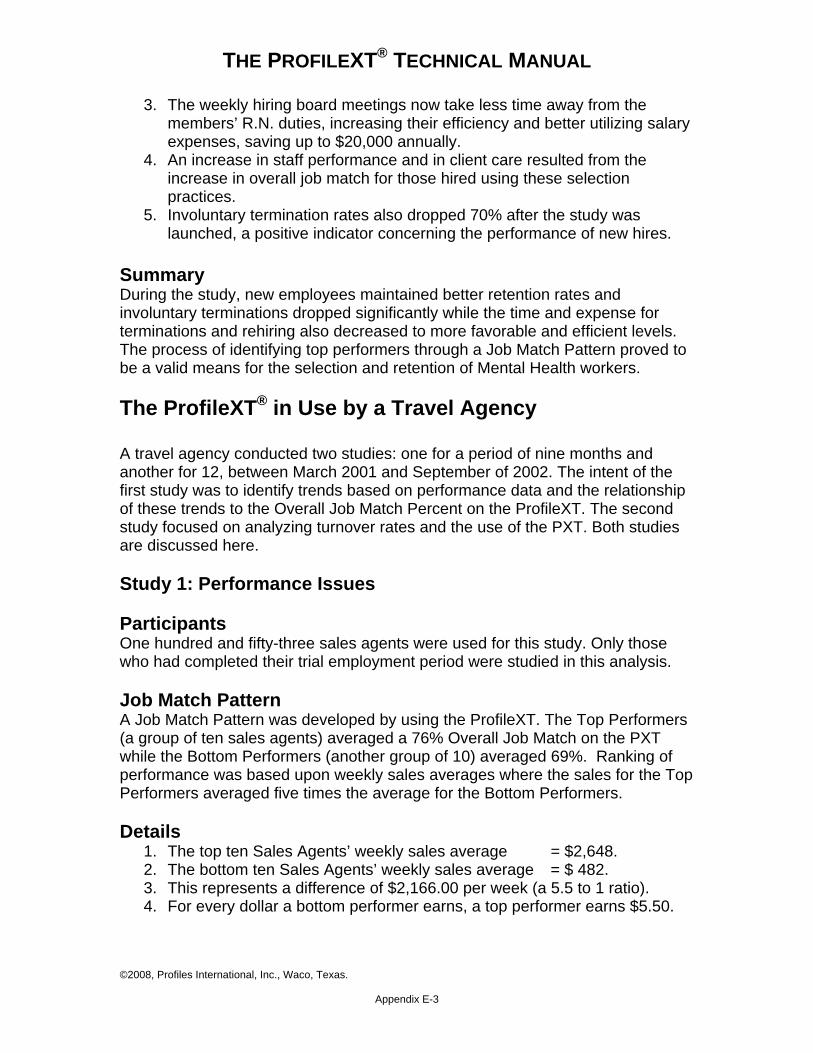
THE PROFILEXT® TECHNICAL MANUAL
3. The weekly hiring board meetings now take less time away from the members’ R.N. duties, increasing their efficiency and better utilizing salary expenses, saving up to $20,000 annually.
4. An increase in staff performance and in client care resulted from the increase in overall job match for those hired using these selection practices.
5. Involuntary termination rates also dropped 70% after the study was launched, a positive indicator concerning the performance of new hires.
Summary During the study, new employees maintained better retention rates and involuntary terminations dropped significantly while the time and expense for terminations and rehiring also decreased to more favorable and efficient levels. The process of identifying top performers through a Job Match Pattern proved to be a valid means for the selection and retention of Mental Health workers. The ProfileXT® in Use by a Travel Agency A travel agency conducted two studies: one for a period of nine months and another for 12, between March 2001 and September of 2002. The intent of the first study was to identify trends based on performance data and the relationship of these trends to the Overall Job Match Percent on the ProfileXT. The second study focused on analyzing turnover rates and the use of the PXT. Both studies are discussed here.
Study 1: Performance Issues Participants One hundred and fifty-three sales agents were used for this study. Only those who had completed their trial employment period were studied in this analysis. Job Match Pattern A Job Match Pattern was developed by using the ProfileXT. The Top Performers (a group of ten sales agents) averaged a 76% Overall Job Match on the PXT while the Bottom Performers (another group of 10) averaged 69%. Ranking of performance was based upon weekly sales averages where the sales for the Top Performers averaged five times the average for the Bottom Performers. Details
1. The top ten Sales Agents’ weekly sales average = $2,648. 2. The bottom ten Sales Agents’ weekly sales average = $ 482. 3. This represents a difference of $2,166.00 per week (a 5.5 to 1 ratio). 4. For every dollar a bottom performer earns, a top performer earns $5.50.
©2008, Profiles International, Inc., Waco, Texas. Appendix E-3
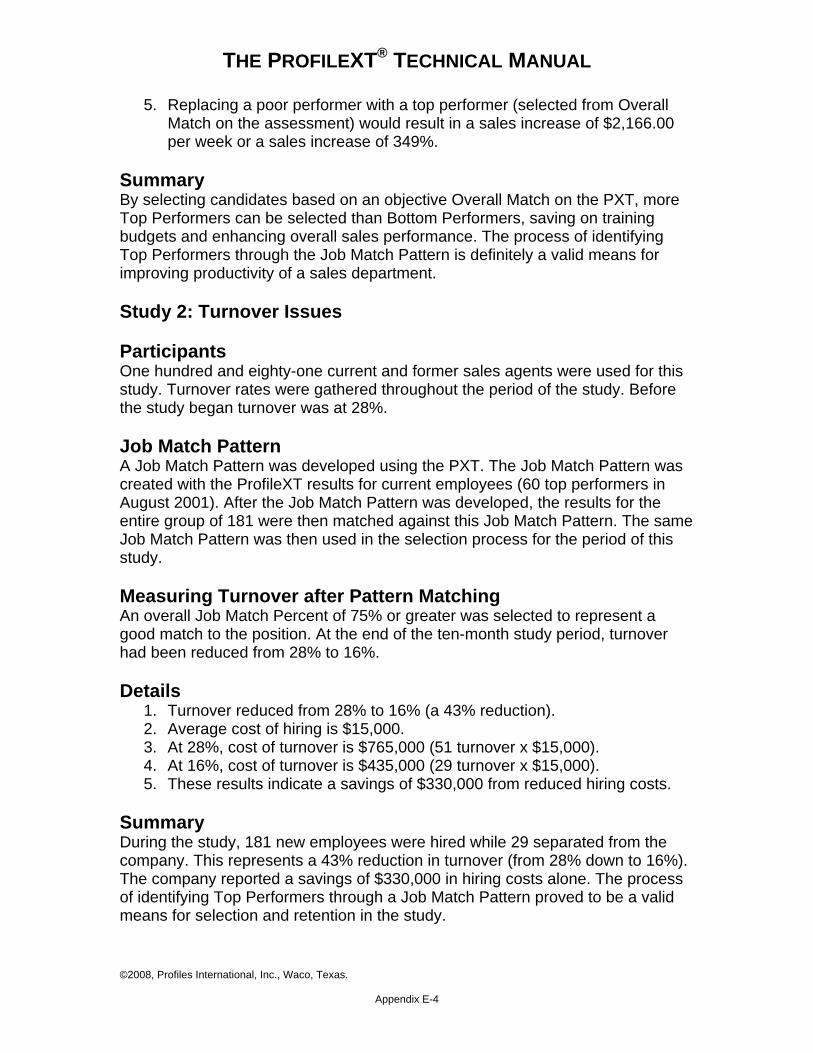
THE PROFILEXT® TECHNICAL MANUAL
5. Replacing a poor performer with a top performer (selected from Overall Match on the assessment) would result in a sales increase of $2,166.00 per week or a sales increase of 349%.
Summary By selecting candidates based on an objective Overall Match on the PXT, more Top Performers can be selected than Bottom Performers, saving on training budgets and enhancing overall sales performance. The process of identifying Top Performers through the Job Match Pattern is definitely a valid means for improving productivity of a sales department. Study 2: Turnover Issues Participants One hundred and eighty-one current and former sales agents were used for this study. Turnover rates were gathered throughout the period of the study. Before the study began turnover was at 28%. Job Match Pattern A Job Match Pattern was developed using the PXT. The Job Match Pattern was created with the ProfileXT results for current employees (60 top performers in August 2001). After the Job Match Pattern was developed, the results for the entire group of 181 were then matched against this Job Match Pattern. The same Job Match Pattern was then used in the selection process for the period of this study. Measuring Turnover after Pattern Matching An overall Job Match Percent of 75% or greater was selected to represent a good match to the position. At the end of the ten-month study period, turnover had been reduced from 28% to 16%. Details
1. Turnover reduced from 28% to 16% (a 43% reduction). 2. Average cost of hiring is $15,000. 3. At 28%, cost of turnover is $765,000 (51 turnover x $15,000). 4. At 16%, cost of turnover is $435,000 (29 turnover x $15,000). 5. These results indicate a savings of $330,000 from reduced hiring costs.
Summary During the study, 181 new employees were hired while 29 separated from the company. This represents a 43% reduction in turnover (from 28% down to 16%). The company reported a savings of $330,000 in hiring costs alone. The process of identifying Top Performers through a Job Match Pattern proved to be a valid means for selection and retention in the study.
©2008, Profiles International, Inc., Waco, Texas. Appendix E-4
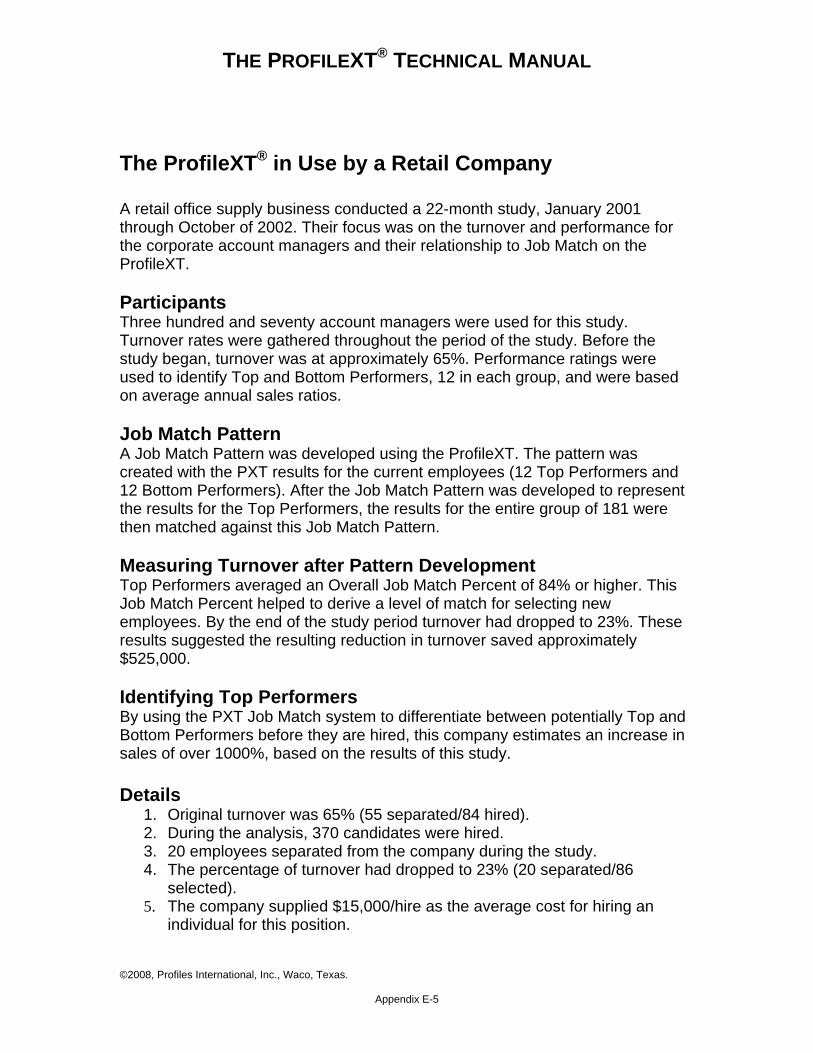
THE PROFILEXT® TECHNICAL MANUAL
The ProfileXT® in Use by a Retail Company A retail office supply business conducted a 22-month study, January 2001 through October of 2002. Their focus was on the turnover and performance for the corporate account managers and their relationship to Job Match on the ProfileXT. Participants Three hundred and seventy account managers were used for this study. Turnover rates were gathered throughout the period of the study. Before the study began, turnover was at approximately 65%. Performance ratings were used to identify Top and Bottom Performers, 12 in each group, and were based on average annual sales ratios. Job Match Pattern A Job Match Pattern was developed using the ProfileXT. The pattern was created with the PXT results for the current employees (12 Top Performers and 12 Bottom Performers). After the Job Match Pattern was developed to represent the results for the Top Performers, the results for the entire group of 181 were then matched against this Job Match Pattern. Measuring Turnover after Pattern Development Top Performers averaged an Overall Job Match Percent of 84% or higher. This Job Match Percent helped to derive a level of match for selecting new employees. By the end of the study period turnover had dropped to 23%. These results suggested the resulting reduction in turnover saved approximately $525,000. Identifying Top Performers By using the PXT Job Match system to differentiate between potentially Top and Bottom Performers before they are hired, this company estimates an increase in sales of over 1000%, based on the results of this study. Details
1. Original turnover was 65% (55 separated/84 hired). 2. During the analysis, 370 candidates were hired. 3. 20 employees separated from the company during the study. 4. The percentage of turnover had dropped to 23% (20 separated/86
selected). 5. The company supplied $15,000/hire as the average cost for hiring an
individual for this position.
©2008, Profiles International, Inc., Waco, Texas. Appendix E-5
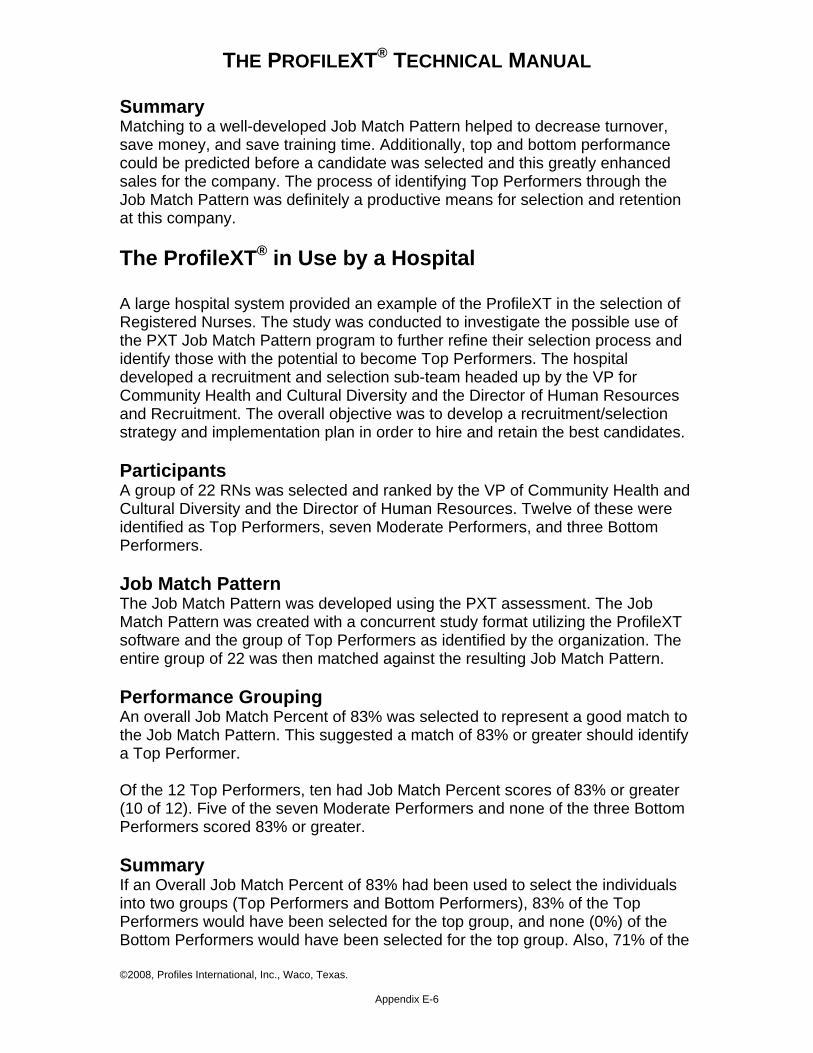
THE PROFILEXT® TECHNICAL MANUAL
Summary Matching to a well-developed Job Match Pattern helped to decrease turnover, save money, and save training time. Additionally, top and bottom performance could be predicted before a candidate was selected and this greatly enhanced sales for the company. The process of identifying Top Performers through the Job Match Pattern was definitely a productive means for selection and retention at this company. The ProfileXT® in Use by a Hospital
A large hospital system provided an example of the ProfileXT in the selection of Registered Nurses. The study was conducted to investigate the possible use of the PXT Job Match Pattern program to further refine their selection process and identify those with the potential to become Top Performers. The hospital developed a recruitment and selection sub-team headed up by the VP for Community Health and Cultural Diversity and the Director of Human Resources and Recruitment. The overall objective was to develop a recruitment/selection strategy and implementation plan in order to hire and retain the best candidates. Participants A group of 22 RNs was selected and ranked by the VP of Community Health and Cultural Diversity and the Director of Human Resources. Twelve of these were identified as Top Performers, seven Moderate Performers, and three Bottom Performers. Job Match Pattern The Job Match Pattern was developed using the PXT assessment. The Job Match Pattern was created with a concurrent study format utilizing the ProfileXT software and the group of Top Performers as identified by the organization. The entire group of 22 was then matched against the resulting Job Match Pattern. Performance Grouping An overall Job Match Percent of 83% was selected to represent a good match to the Job Match Pattern. This suggested a match of 83% or greater should identify a Top Performer. Of the 12 Top Performers, ten had Job Match Percent scores of 83% or greater (10 of 12). Five of the seven Moderate Performers and none of the three Bottom Performers scored 83% or greater. Summary If an Overall Job Match Percent of 83% had been used to select the individuals into two groups (Top Performers and Bottom Performers), 83% of the Top Performers would have been selected for the top group, and none (0%) of the Bottom Performers would have been selected for the top group. Also, 71% of the
©2008, Profiles International, Inc., Waco, Texas. Appendix E-6
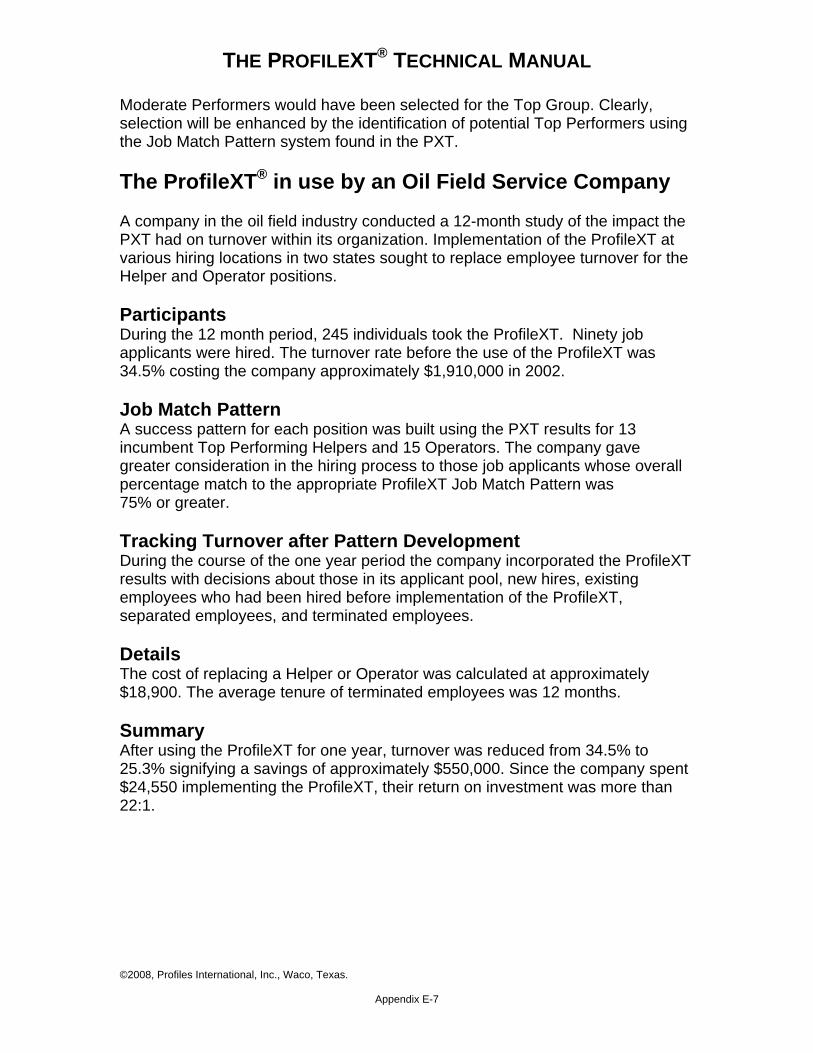
THE PROFILEXT® TECHNICAL MANUAL
Moderate Performers would have been selected for the Top Group. Clearly, selection will be enhanced by the identification of potential Top Performers using the Job Match Pattern system found in the PXT. The ProfileXT® in use by an Oil Field Service Company A company in the oil field industry conducted a 12-month study of the impact the PXT had on turnover within its organization. Implementation of the ProfileXT at various hiring locations in two states sought to replace employee turnover for the Helper and Operator positions. Participants During the 12 month period, 245 individuals took the ProfileXT. Ninety job applicants were hired. The turnover rate before the use of the ProfileXT was 34.5% costing the company approximately $1,910,000 in 2002. Job Match Pattern A success pattern for each position was built using the PXT results for 13 incumbent Top Performing Helpers and 15 Operators. The company gave greater consideration in the hiring process to those job applicants whose overall percentage match to the appropriate ProfileXT Job Match Pattern was 75% or greater. Tracking Turnover after Pattern Development During the course of the one year period the company incorporated the ProfileXT results with decisions about those in its applicant pool, new hires, existing employees who had been hired before implementation of the ProfileXT, separated employees, and terminated employees. Details The cost of replacing a Helper or Operator was calculated at approximately $18,900. The average tenure of terminated employees was 12 months. Summary After using the ProfileXT for one year, turnover was reduced from 34.5% to 25.3% signifying a savings of approximately $550,000. Since the company spent $24,550 implementing the ProfileXT, their return on investment was more than 22:1.
©2008, Profiles International, Inc., Waco, Texas. Appendix E-7
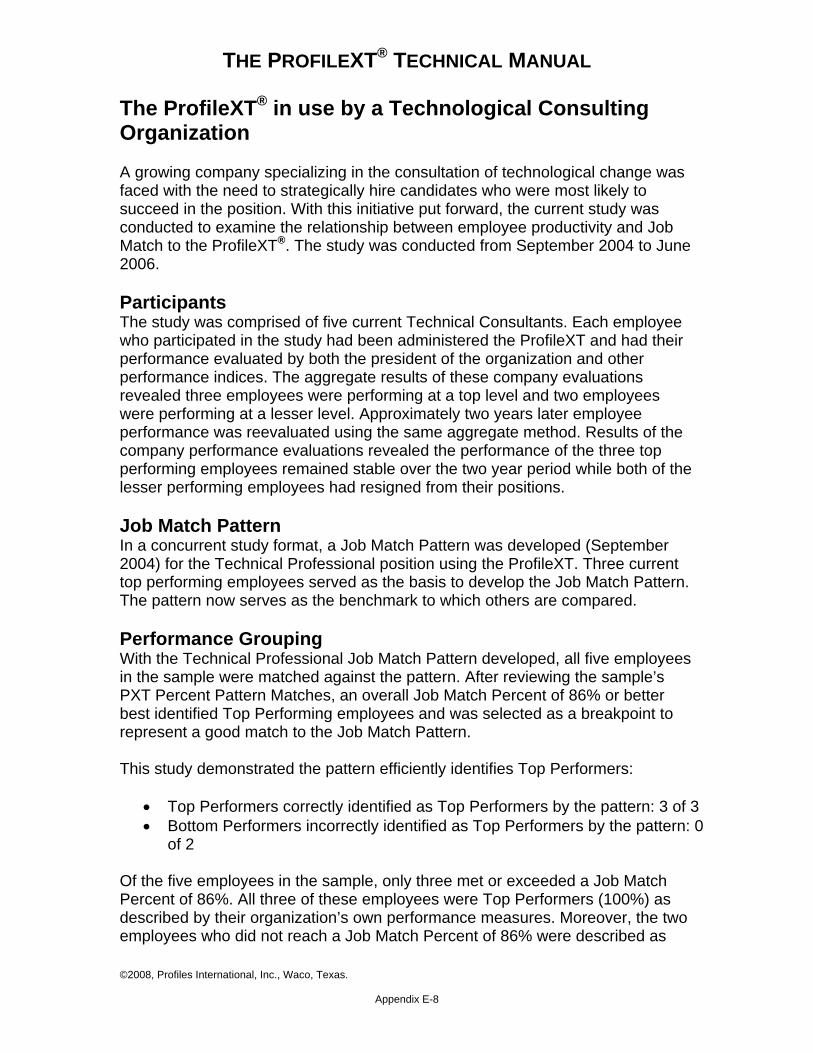
THE PROFILEXT® TECHNICAL MANUAL
The ProfileXT® in use by a Technological Consulting Organization A growing company specializing in the consultation of technological change was faced with the need to strategically hire candidates who were most likely to succeed in the position. With this initiative put forward, the current study was conducted to examine the relationship between employee productivity and Job Match to the ProfileXT®. The study was conducted from September 2004 to June 2006. Participants The study was comprised of five current Technical Consultants. Each employee who participated in the study had been administered the ProfileXT and had their performance evaluated by both the president of the organization and other performance indices. The aggregate results of these company evaluations revealed three employees were performing at a top level and two employees were performing at a lesser level. Approximately two years later employee performance was reevaluated using the same aggregate method. Results of the company performance evaluations revealed the performance of the three top performing employees remained stable over the two year period while both of the lesser performing employees had resigned from their positions. Job Match Pattern In a concurrent study format, a Job Match Pattern was developed (September 2004) for the Technical Professional position using the ProfileXT. Three current top performing employees served as the basis to develop the Job Match Pattern. The pattern now serves as the benchmark to which others are compared. Performance Grouping With the Technical Professional Job Match Pattern developed, all five employees in the sample were matched against the pattern. After reviewing the sample’s PXT Percent Pattern Matches, an overall Job Match Percent of 86% or better best identified Top Performing employees and was selected as a breakpoint to represent a good match to the Job Match Pattern. This study demonstrated the pattern efficiently identifies Top Performers:
• Top Performers correctly identified as Top Performers by the pattern: 3 of 3 • Bottom Performers incorrectly identified as Top Performers by the pattern: 0
of 2 Of the five employees in the sample, only three met or exceeded a Job Match Percent of 86%. All three of these employees were Top Performers (100%) as described by their organization’s own performance measures. Moreover, the two employees who did not reach a Job Match Percent of 86% were described as
©2008, Profiles International, Inc., Waco, Texas. Appendix E-8
THE PROFILEXT® TECHNICAL MANUAL
Bottom Performers by the organization’s performance measures. These Bottom Performing employees resigned before a second round of performance evaluations could be conducted indicating the efficacy of the pattern created. Details The president of the organization found this assessment “invaluable for managing in a fast paced consulting environment.” Additionally, the implementation of the ProfileXT has accelerated management’s discussions with candidates saving valuable time and energy in the hiring process. Summary Using the ProfileXT to benchmark employees, the organization was able to demonstrate the effectiveness of the Job Match Pattern. Over a two year period, the three employees who best matched the Job Match Pattern were all Top Performing employees as defined by the organization. Conversely, the two employees who did not match the pattern created were the organization’s less productive employees and both subsequently resigned before the two year study had been completed. This organization provides a good example of the effectiveness of a well built pattern and the impact it can have on predicting success in the workplace. The ProfileXT® in use by a Data Service Organization Background An organization specializing in corporate policies and data services wanted a better way to identify potentially successful Account Executives. Presented with this task, a study was conducted to examine the relationship between employee productivity and the ProfileXT®. Participants Fourteen Account Executives within the organization served as the sample for the current study. Each employee in the sample was administered the ProfileXT and had their performance at meeting sales goals evaluated by the organization. Based on the organization’s performance evaluations, three members of the sample were identified as Top Performers, three were identified as Bottom Performers, and the remaining eight members of the sample were identified as Average Performers. Job Match Pattern A Job Match Pattern for the Account Executive position in this study was developed using a concurrent study format. The sample’s Top Performing and Bottom Performing Account Executives served as the basis for the Job Match Pattern which identifies the unique scoring pattern of Top Performers. This pattern now serves as the benchmark to which other employees can be matched.
©2008, Profiles International, Inc., Waco, Texas. Appendix E-9
THE PROFILEXT® TECHNICAL MANUAL
Performance Grouping Based on the performance information gathered from the employer and the participants’ ProfileXT scores, a pattern was constructed which described the qualities of the existing Top Performers. All 14 Account Executives were then matched to the pattern. After a review of the participants’ Overall Job Match Percent, a breakpoint of 87% or greater best identified Top Performing Account Executives. This 87% Job Match benchmark now serves as a standard to which a candidate is likely to be a good match to the job. This study has demonstrated the pattern efficiently identifies Top Performers: • Top Performers correctly identified as Top Performers by the pattern: 3 of 3 • Bottom Performers incorrectly identified as Top Performers by this pattern: 0 of 3. Of the 14 participants in this study four obtained a Job Match Percent of 91% or greater. All three of the Top Performing Account Executives were selected by the pattern developed. Only two of the Average Performing and none of the Bottom Performing Account Executives met this same benchmark. Details
1. According to the information provided to Profiles International by the organization, the average sales dollars generated by Top Performers in the Account Executive sample was $1,250,000, while the average Bottom Performer in this sample generated $850,000 of their performance goals.
2. The average dollars generated by those who did meet or exceed the Job Match benchmark was $1,310,000. The average dollars generated by those who did not meet the Job Match benchmark was $840,000. This is an average difference of $470,000 between those selected and those not selected by the Job Match Pattern.
Summary Using the ProfileXT to benchmark employees, the organization has shown the ability to successfully screen Account Executive candidates. Of the five individuals who either met or exceeded the Job Match Percentage benchmark, none were Bottom Performers. Additionally, 100% of the Top Performers were included in this group. Clearly, selection practices at this organization have been improved by using the ProfileXT.
©2008, Profiles International, Inc., Waco, Texas. Appendix E-10
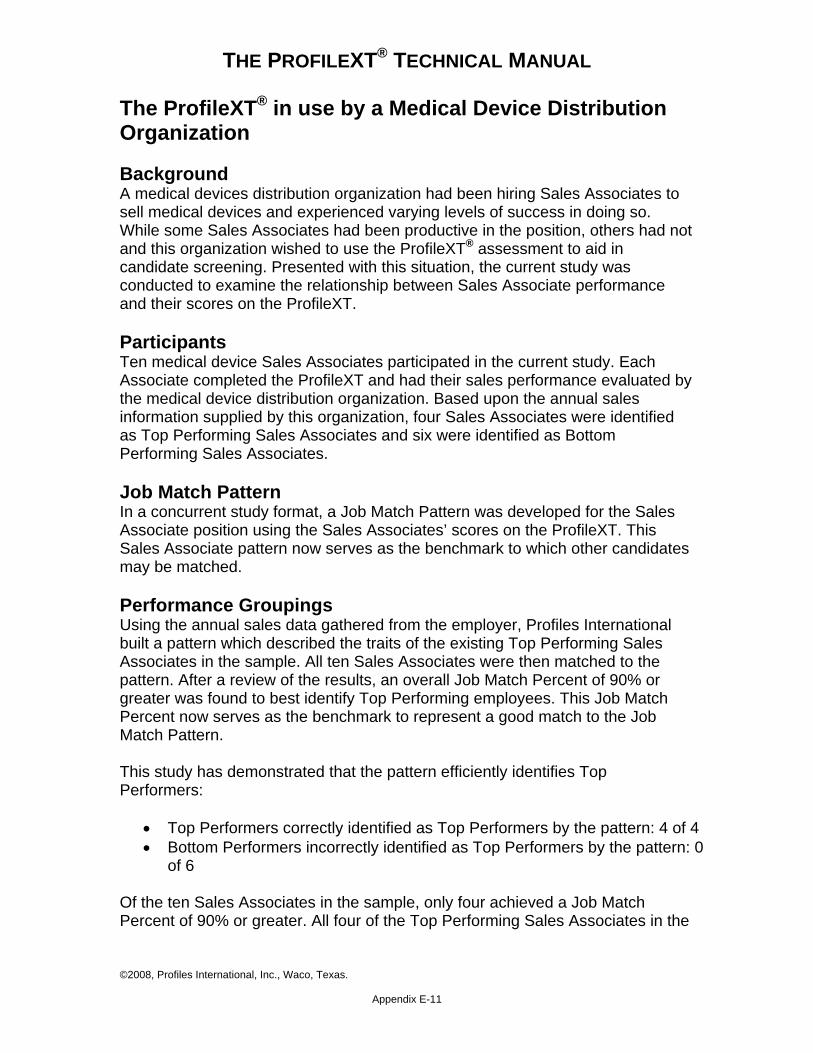
THE PROFILEXT® TECHNICAL MANUAL
The ProfileXT® in use by a Medical Device Distribution Organization Background A medical devices distribution organization had been hiring Sales Associates to sell medical devices and experienced varying levels of success in doing so. While some Sales Associates had been productive in the position, others had not and this organization wished to use the ProfileXT® assessment to aid in candidate screening. Presented with this situation, the current study was conducted to examine the relationship between Sales Associate performance and their scores on the ProfileXT. Participants Ten medical device Sales Associates participated in the current study. Each Associate completed the ProfileXT and had their sales performance evaluated by the medical device distribution organization. Based upon the annual sales information supplied by this organization, four Sales Associates were identified as Top Performing Sales Associates and six were identified as Bottom Performing Sales Associates. Job Match Pattern In a concurrent study format, a Job Match Pattern was developed for the Sales Associate position using the Sales Associates’ scores on the ProfileXT. This Sales Associate pattern now serves as the benchmark to which other candidates may be matched. Performance Groupings Using the annual sales data gathered from the employer, Profiles International built a pattern which described the traits of the existing Top Performing Sales Associates in the sample. All ten Sales Associates were then matched to the pattern. After a review of the results, an overall Job Match Percent of 90% or greater was found to best identify Top Performing employees. This Job Match Percent now serves as the benchmark to represent a good match to the Job Match Pattern. This study has demonstrated that the pattern efficiently identifies Top Performers:
• Top Performers correctly identified as Top Performers by the pattern: 4 of 4 • Bottom Performers incorrectly identified as Top Performers by the pattern: 0
of 6 Of the ten Sales Associates in the sample, only four achieved a Job Match Percent of 90% or greater. All four of the Top Performing Sales Associates in the
©2008, Profiles International, Inc., Waco, Texas. Appendix E-11
THE PROFILEXT® TECHNICAL MANUAL
sample met or exceeded the 90% Job Match Pattern breakpoint while none of the Bottom Performers achieved the same 90% breakpoint. Details The annual sales dollars generated by the four Top Performers in the sample averaged $668,762. During the same sales period the Bottom Performing employees in this sample averaged $315,935 in sales. The Top Performing Sales Associates in this study averaged $352,828 more in sales than the Bottom Performing employees, more than double the average total sales earnings of the Bottom Performers. Additionally, this pattern is shown to do an excellent job of distinguishing the Top Performing Sales Associates from those who are Bottom Performers. In this sample, all Top Performers met or exceeded the Job Match Pattern benchmark while none of the Bottom Performers were able to achieve the same breakpoint. Summary The efficacy of the Job Match Pattern is evident; all four of the individuals who met or exceeded the 90% Job Match Pattern bench mark were Top Performers, while all six individuals who did not meet the same mark were Bottom Performers. Moreover, by being able to better screen Sales Associate candidates, the medical devices distribution organization could more than double its sales revenue simply by selecting those candidates who possess a similar pattern of traits to those who are already successful in the position. Thus, the well-matched Sales Associate candidates are also more likely to enjoy success by being a good fit to the position. The ProfileXT® in use by an International Pharmaceuticals Sales Organization Background A pharmaceutical sales organization had noticed a disparity in the abilities of its Sales Representatives and wished to find a better way to screen candidates to identify those who were most likely to succeed. Faced with this situation, the current study was conducted by the Profiles International staff to examine the relationship between ProfileXT® scores and the performance of the pharmaceuticals Sales Representatives. Participants Eight pharmaceutical Sales Representatives participated in the current study. Each participant was administered the ProfileXT and had their performance evaluated by the organization. Sales Representative performance was evaluated using two performance measures. First, the sales organization evaluated employee competencies in a variety of areas determined to be important to organizational success. Second, each employee’s performance was evaluated in the form of a sales goal ratio over the first three quarters of the year. When
©2008, Profiles International, Inc., Waco, Texas. Appendix E-12
THE PROFILEXT® TECHNICAL MANUAL
combined, these two performance measures revealed three Top Performing Sales Representatives and five Bottom Performing Sales Representatives. Job Match Pattern In a concurrent study format, a Job Match Pattern was developed for the Sales Representative position using the Sales Representatives’ scores on the ProfileXT. This Sales Representative pattern now serves as the benchmark to which other employees may be matched. Performance Groupings Using the performance information gathered from the employer, Profiles International built a pattern which described the qualities of the existing Top Performers in the sample. All eight Sales Representatives were then matched to the pattern. After a review of the results, an overall Job Match Percent of 90% or greater was found to best identify Top Performing employees. This Job Match Percent now serves as the benchmark to represent a good match to the Job Match Pattern. This study has demonstrated that the pattern efficiently identifies Top Performers:
• Top Performers correctly identified as Top Performers by the pattern: 3 of 3 • Bottom Performers incorrectly identified as Top Performers by the pattern: 0
of 5 Of the eight Sales Representatives in the sample, three achieved a Job Match Percent of 90% or greater. All three of the Top Performing Sales Representatives in the sample exceeded the 90% Job Match Pattern breakpoint while none of the five Bottom Performers achieved the same 90% breakpoint. Details
1. The sales dollars generated by the Top Performing Sales Representatives over the first three quarters of the year averaged $802,348. During the same sales period, the Bottom Performing employees averaged $617,786 in sales. The Top Performing Sales Representatives in this study averaged nearly $185,000 more in sales than the Bottom Performing Sales Representatives during the sales period.
2. In addition to the gains seen in sales performance by those that were selected by the Job Match Pattern, those who scored at or above the 90% benchmark averaged an organizational competency score of nearly 20. Those Sales Representatives who did not achieve the Job Match Pattern breakpoint averaged a substantially lower organizational competency score of 15.4. Thus, the competencies of the Sales Representatives selected by this pattern are more aligned with organizational goals than those of the Sales Representatives not selected.
©2008, Profiles International, Inc., Waco, Texas. Appendix E-13
THE PROFILEXT® TECHNICAL MANUAL
Summary Using the ProfileXT to benchmark employees, the pharmaceutical sales organization has shown the ability to better screen Sales Representative candidates. Using performance information provided by this client, the Profiles International team was able to build a Job Match Pattern which distinguished the key success related attributes of the Top Performing Sales Representatives and those of the less productive members of the organization. Of the eight Sales Representatives in the sample, only three achieved the Job Match Percent breakpoint of 90%; all three of these Sales Representatives were Top Performers in the position. Clearly, this study has shown that by using the ProfileXT this organization has improved its selection practices. The ProfileXT® in use by an Insurance Company An insurance company wanted to try to establish which factors influenced the productivity of its Sales Representatives. To this end, a study was conducted to investigate the relationship between employee performance and Job Match to the ProfileXT®. The information from this study was used to create a ProfileXT Job Match Pattern which could be used to help select more potentially productive sales people. Participants Seven currently employed insurance Sales Representatives participated in the study. Performance was measured by reviewing each subject’s number of sales and number of accounts managed. The company was able to identify four Top Performers and three Bottom Performers based upon these criteria. Job Match Pattern Using the ProfileXT, a pattern was developed for the insurance Sales Representative position utilizing a concurrent study format. The pattern was developed with the ProfileXT scores of the four current Top Performing employees in March 2007. This pattern is now used as the benchmark to predict insurance Sales Representative performance based on ProfileXT pattern match. Performance Grouping Based on the information gathered, a pattern was built which described the attributes of the existing Top Performers. The seven insurance Sales Representatives were then matched to this pattern. After a review of employee ProfileXT Job Match Percents, an overall Job Match Percent of 79% best identified Top Performing employees and was selected as a breakpoint to represent a good match to the Job Match Pattern.
©2008, Profiles International, Inc., Waco, Texas. Appendix E-14
THE PROFILEXT® TECHNICAL MANUAL
This study has demonstrated that the pattern efficiently identifies Top Performers:
• Top Performers correctly identified as Top Performers by the pattern: 3 of 4 • Bottom Performers incorrectly identified as Top Performers by the pattern: 0
of 3 Of the four Top Performers, three met or exceeded the 79% Job Match breakpoint. Of the three Bottom Performers none met or exceeded the 79% overall Job Match Percent. Summary The ProfileXT Job Match Pattern for the insurance company Sales Representative position correctly identified 75% (3 of 4) of the Top Performers based on a 79% Job Match Percent. This Job Match Percent also screened out 100% (3 of 3) of the Bottom Performers. A larger sample would increase the percentage of Top Performers correctly identified by the ProfileXT Job Match Percent. The PXT in use by an Advertising Sales Organization An advertising sales organization faced with low sales productivity wished to find a way to increase the frequency of hiring highly productive employees. Presented with this problem, the current study was conducted to examine the relationship between employee productivity and Job Match to ProfileXT®. Participants Twenty-six advertising Sales Representatives participated in this study. Each employee in the study had been administered the ProfileXT and had their number of new customers, ads sold, and overall dollar volume recorded. Records indicated four sales people were highest in each of these areas while seven could be categorized as lowest with the remaining fifteen somewhere in the middle. Job Match Pattern In a concurrent study format, a Job Match Pattern was developed for the advertising Sales Representative position using the ProfileXT. The four current Top Performing employees served as the basis to formulate the Job Match Pattern. This pattern now serves as a benchmark to which other employees can be matched. Performance Grouping With the advertising Sales Representative Job Match Pattern created, all 26 employees were matched against the pattern. After a review of the sample’s ProfileXT percent matches, an overall Job Match Percent of 86% or better best
©2008, Profiles International, Inc., Waco, Texas. Appendix E-15
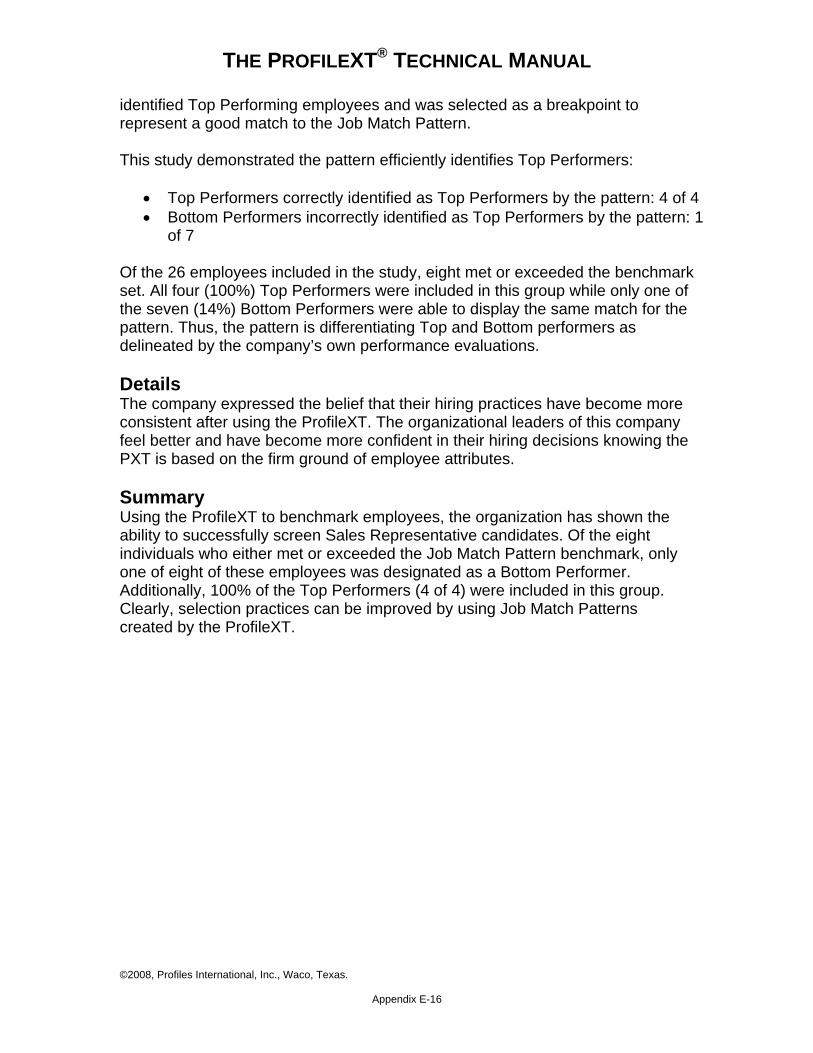
THE PROFILEXT® TECHNICAL MANUAL
©2008, Profiles International, Inc., Waco, Texas. Appendix E-16
identified Top Performing employees and was selected as a breakpoint to represent a good match to the Job Match Pattern. This study demonstrated the pattern efficiently identifies Top Performers:
• Top Performers correctly identified as Top Performers by the pattern: 4 of 4 • Bottom Performers incorrectly identified as Top Performers by the pattern: 1
of 7 Of the 26 employees included in the study, eight met or exceeded the benchmark set. All four (100%) Top Performers were included in this group while only one of the seven (14%) Bottom Performers were able to display the same match for the pattern. Thus, the pattern is differentiating Top and Bottom performers as delineated by the company’s own performance evaluations. Details The company expressed the belief that their hiring practices have become more consistent after using the ProfileXT. The organizational leaders of this company feel better and have become more confident in their hiring decisions knowing the PXT is based on the firm ground of employee attributes. Summary Using the ProfileXT to benchmark employees, the organization has shown the ability to successfully screen Sales Representative candidates. Of the eight individuals who either met or exceeded the Job Match Pattern benchmark, only one of eight of these employees was designated as a Bottom Performer. Additionally, 100% of the Top Performers (4 of 4) were included in this group. Clearly, selection practices can be improved by using Job Match Patterns created by the ProfileXT.
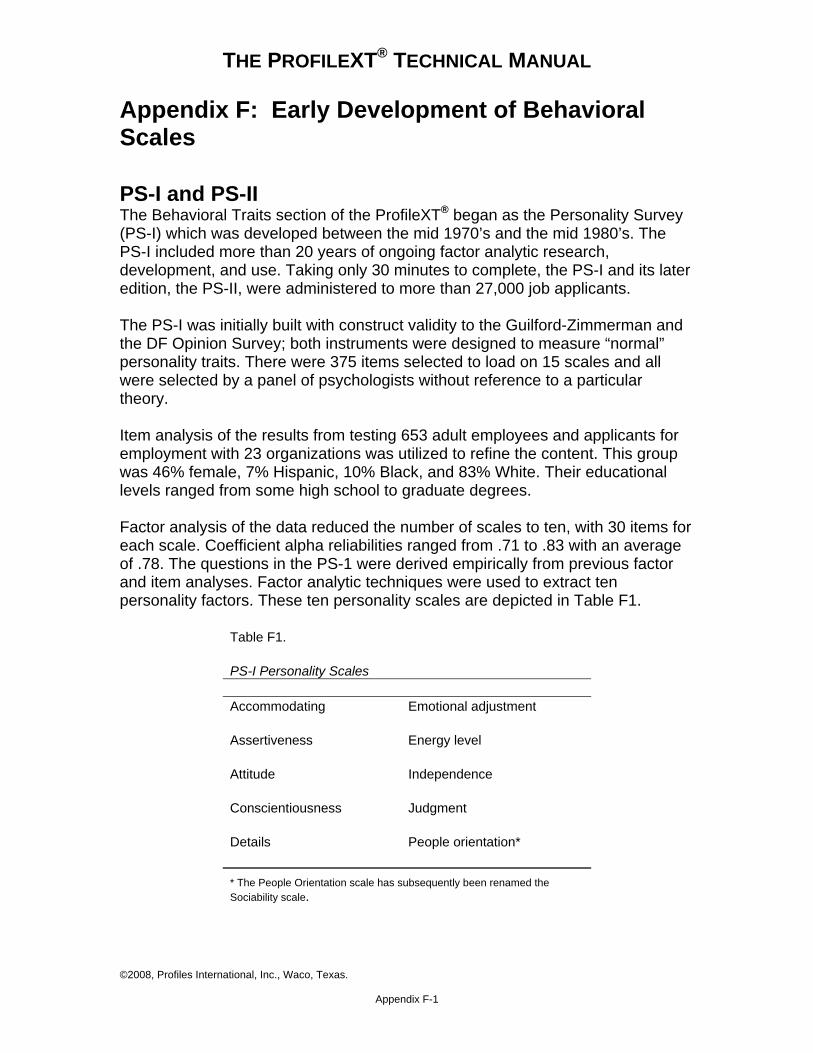
THE PROFILEXT® TECHNICAL MANUAL
Appendix F: Early Development of Behavioral Scales
PS-I and PS-II The Behavioral Traits section of the ProfileXT® began as the Personality Survey (PS-I) which was developed between the mid 1970’s and the mid 1980’s. The PS-I included more than 20 years of ongoing factor analytic research, development, and use. Taking only 30 minutes to complete, the PS-I and its later edition, the PS-II, were administered to more than 27,000 job applicants. The PS-I was initially built with construct validity to the Guilford-Zimmerman and the DF Opinion Survey; both instruments were designed to measure “normal” personality traits. There were 375 items selected to load on 15 scales and all were selected by a panel of psychologists without reference to a particular theory. Item analysis of the results from testing 653 adult employees and applicants for employment with 23 organizations was utilized to refine the content. This group was 46% female, 7% Hispanic, 10% Black, and 83% White. Their educational levels ranged from some high school to graduate degrees. Factor analysis of the data reduced the number of scales to ten, with 30 items for each scale. Coefficient alpha reliabilities ranged from .71 to .83 with an average of .78. The questions in the PS-1 were derived empirically from previous factor and item analyses. Factor analytic techniques were used to extract ten personality factors. These ten personality scales are depicted in Table F1.
Table F1. PS-I Personality Scales Accommodating Emotional adjustment Assertiveness Energy level Attitude Independence Conscientiousness Judgment Details People orientation*
* The People Orientation scale has subsequently been renamed the Sociability scale.
©2008, Profiles International, Inc., Waco, Texas. Appendix F-1
THE PROFILEXT® TECHNICAL MANUAL
Revision of PS-I Between the mid 1980’s and the early 1990’s more than 15,000 job applicants and incumbents were administered the PS-I. During this period, ongoing factor, item, validity, and reliability analyses, combined with practical considerations, indicated the PS-I needed revision. Beginning in the early 1990’s, a comprehensive research project was specifically designed to make PS-I not only more valid and reliable but also more practical and time efficient. The procedures for accomplishing these objectives included:
♦ Reducing scale overlap and redundancies
♦ Combining questions from overlapping scales into a single scale
♦ Eliminating scales which had proven to have very limited practical utility
♦ Rewriting existing questions and writing new questions to update the scales and to reduce ambiguity
The revised edition of PS-I was entitled PS-II. PS-I was reduced from ten scales to seven scales with 30 questions each. Studies have shown these seven dimensions were significantly related to:
♦ Job performance - especially sales, management, and customer service
♦ Employee turnover
♦ Promotion potential
♦ Training success
♦ Conscientious behavior, which is related to employee reliability, attendance, punctuality, and follow-through
The PS-II also included a Positive Impression Management scale. Although intended for use in personnel selection it was also used successfully for individual assessment, job placement, management development, career counseling, and team building. Samples from various corporate settings were gathered for research efforts to maintain accurate and timely statistics regarding the validity and impact of the PS-II test form. Validation studies were conducted at Profiles International, Inc. Research and Development Division to support the strength of the scales and the norming data.
©2008, Profiles International, Inc., Waco, Texas. Appendix F-2
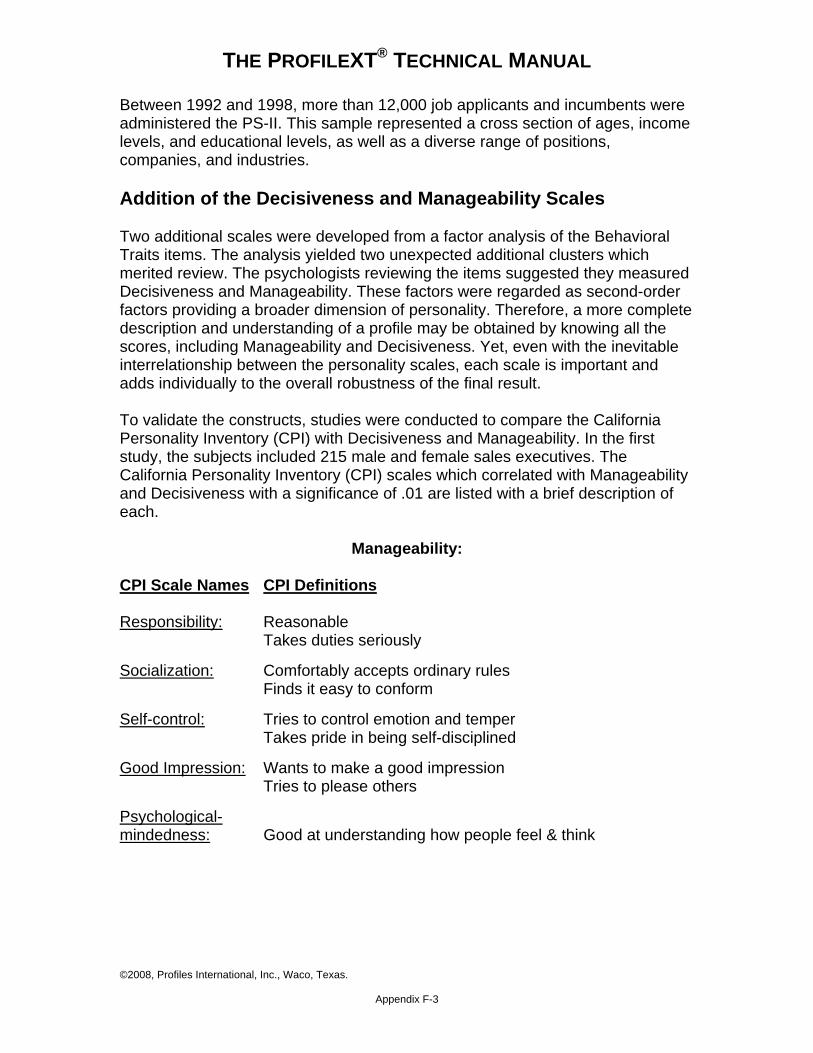
THE PROFILEXT® TECHNICAL MANUAL
Between 1992 and 1998, more than 12,000 job applicants and incumbents were administered the PS-II. This sample represented a cross section of ages, income levels, and educational levels, as well as a diverse range of positions, companies, and industries. Addition of the Decisiveness and Manageability Scales Two additional scales were developed from a factor analysis of the Behavioral Traits items. The analysis yielded two unexpected additional clusters which merited review. The psychologists reviewing the items suggested they measured Decisiveness and Manageability. These factors were regarded as second-order factors providing a broader dimension of personality. Therefore, a more complete description and understanding of a profile may be obtained by knowing all the scores, including Manageability and Decisiveness. Yet, even with the inevitable interrelationship between the personality scales, each scale is important and adds individually to the overall robustness of the final result. To validate the constructs, studies were conducted to compare the California Personality Inventory (CPI) with Decisiveness and Manageability. In the first study, the subjects included 215 male and female sales executives. The California Personality Inventory (CPI) scales which correlated with Manageability and Decisiveness with a significance of .01 are listed with a brief description of each.
Manageability: CPI Scale Names CPI Definitions Responsibility: Reasonable
Takes duties seriously
Socialization: Comfortably accepts ordinary rules Finds it easy to conform
Self-control: Tries to control emotion and temper Takes pride in being self-disciplined
Good Impression: Wants to make a good impression Tries to please others
Psychological- mindedness: Good at understanding how people feel & think
©2008, Profiles International, Inc., Waco, Texas. Appendix F-3
THE PROFILEXT® TECHNICAL MANUAL
Decisiveness: CPI Scale Names CPI Definitions
Dominance: Confident Assertive Task-oriented
Capacity for Status: Ambitious and independent
Sociability: Sociable – likes to be with people
Self-acceptance: Has a good opinion of self
Independence: Self-sufficient Resourceful
Self-control: Tries to control emotion and temper Takes pride in being self-disciplined
It was felt these relationships were a good reflection of the Manageability and Decisiveness traits, so the scales were added to the Behavioral Traits section of the assessment. Continuing studies have supported these findings (see Chapter 3). These results demonstrated how the Manageability Scale continued to be associated with the various CPI scales relating to conscientiousness and self-monitoring traits. The Decisiveness Scale has been noted to relate well with CPI scales associated with self-acceptance, control, and an external frame of reference or, in other words, a focus on social poise, while the Manageability Scale remained consistent in its comparison with the CPI. Development of the Distortion Scale In addition to the personality scales, PS-II included a Positive Impression Management Scale. This scale is represented in the ProfileXT as the Distortion Scale. The Positive Impression Management Scale was designed to measure a person’s tendency to create an exaggerated or potentially false-positive impression. The scale was developed rationally by using questions endorsed consistently “Yes” or “No” by a sample of 2,322 job applicants. For example, 98% of this sample responded “Yes” to the following question, “Have you ever been angry at anyone?” It can be inferred that an applicant who responds, “No, I have never been angry at anyone” could be attempting to create a false-positive impression (Edens, 2004). Therefore, an “incorrect” response to any one of these eight questions is an infrequent occurrence. The greater the number of questions answered in the “infrequent” direction, the greater the concern about how candid the individual might have been. When this
©2008, Profiles International, Inc., Waco, Texas. Appendix F-4
THE PROFILEXT® TECHNICAL MANUAL
©2008, Profiles International, Inc., Waco, Texas. Appendix F-5
number represents the large majority, it is suggested the results may be somewhat distorted indicating potential inflation of a positive self-impression. Further details are noted in the User’s Guide for the ProfileXT and current analyses summarized in Chapter 3 of this manual. Next, the development of the PS-I and PS-II lead to The ProfileTM and, after a few years of continuing development, Profiles International presented the most current form of the test, the ProfileXT® (PXT). The ProfileXT demonstrates greater ease of use and even stronger statistical support with various changes, including a more efficient number of items (from 218 items to the current 182) and an easier to use report layout.

THE PROFILEXT® TECHNICAL MANUAL
Appendix G: Examples of the ProfileXT® Reports
Example of Placement Report………………………………………. ....................... Example of Coaching Report ............................................................................... Example of Succession Planning Report ............................................................. Example of Job Profile Summary Report ............................................................. Example of Individual Report ............................................................................... Example of Job Summary Graph .........................................................................
©2008, Profiles International, Inc., Waco, Texas. Appendix G
CONFIDENTIAL
PLACEMENT REPORT Thursday, May 8, 2008 Susie Sample Any Department Profiles International 5207 Lake Shore Drive Waco, TX 76710 254-751-1644
Profiles Office Park • 5205 Lake Shore Drive • Waco, Texas 76710-1732 USA • 254.751.1644 • www.profilesinternational.com
Copyright ©2001-2008 Profiles International, Inc.
Building and Retaining the High-Performance Company
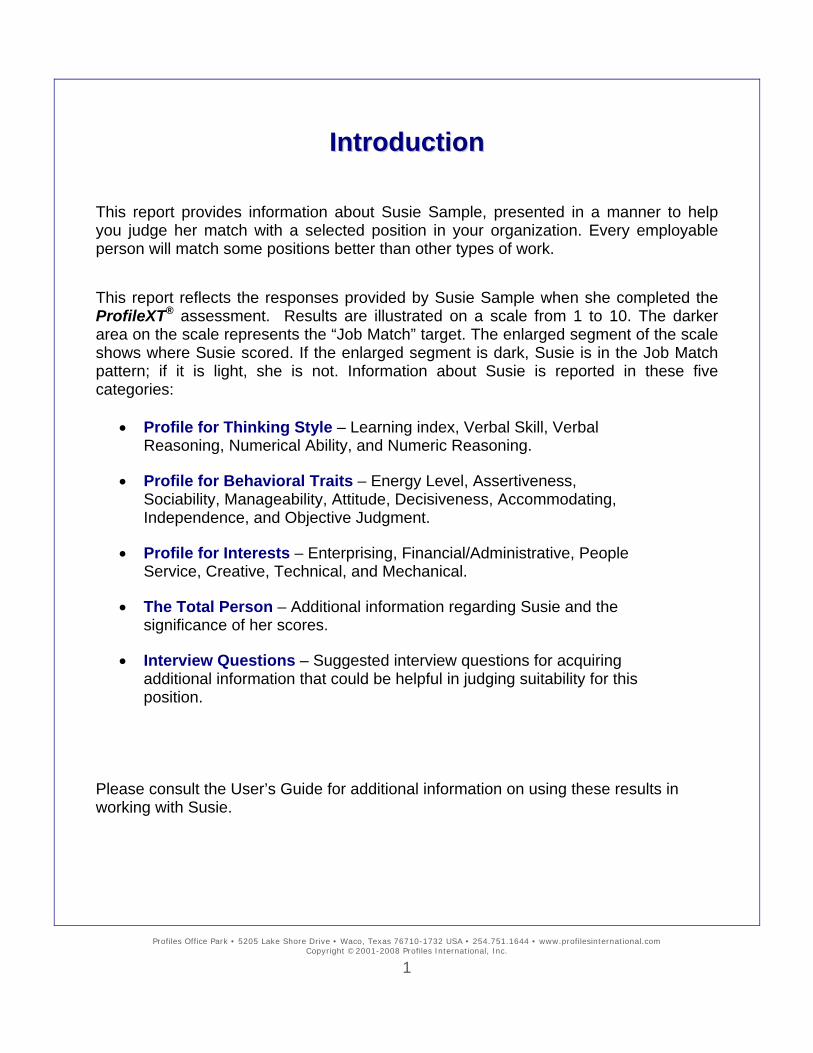
IInnttrroodduuccttiioonn This report provides information about Susie Sample, presented in a manner to help you judge her match with a selected position in your organization. Every employable person will match some positions better than other types of work. This report reflects the responses provided by Susie Sample when she completed the ProfileXT® assessment. Results are illustrated on a scale from 1 to 10. The darker area on the scale represents the “Job Match” target. The enlarged segment of the scale shows where Susie scored. If the enlarged segment is dark, Susie is in the Job Match pattern; if it is light, she is not. Information about Susie is reported in these five categories:
• Profile for Thinking Style – Learning index, Verbal Skill, Verbal Reasoning, Numerical Ability, and Numeric Reasoning.
• Profile for Behavioral Traits – Energy Level, Assertiveness, Sociability, Manageability, Attitude, Decisiveness, Accommodating, Independence, and Objective Judgment.
• Profile for Interests – Enterprising, Financial/Administrative, People Service, Creative, Technical, and Mechanical.
• The Total Person – Additional information regarding Susie and the significance of her scores.
• Interview Questions – Suggested interview questions for acquiring additional information that could be helpful in judging suitability for this position.
Please consult the User’s Guide for additional information on using these results in working with Susie.
Profiles Office Park • 5205 Lake Shore Drive • Waco, Texas 76710-1732 USA • 254.751.1644 • www.profilesinternational.com Copyright ©2001-2008 Profiles International, Inc.
1
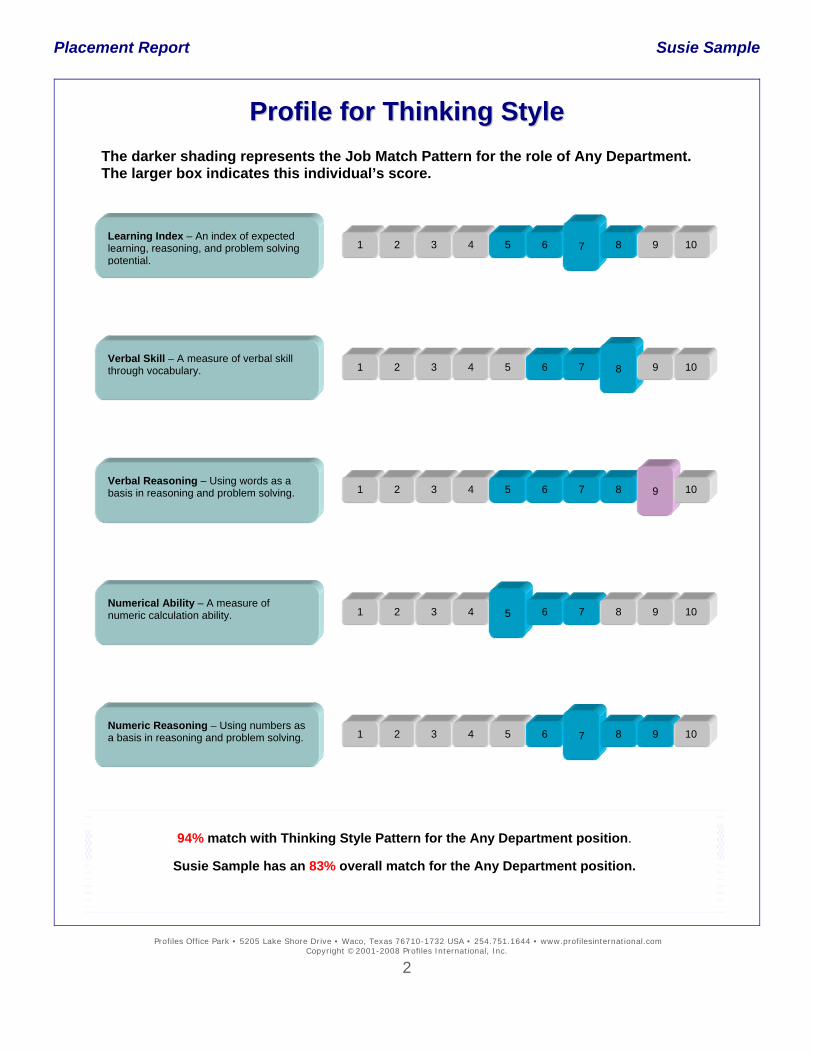
Placement Report Susie Sample
PPrrooffiillee ffoorr TThhiinnkkiinngg SSttyyllee
The darker shading represents the Job Match Pattern for the role of Any Department. The larger box indicates this individual’s score.
Learning Index – An index of expected learning, reasoning, and problem solving potential.
1 2 3 4 8 5 6 9 10 7
Verbal Skill – A measure of verbal skill through vocabulary.
1 2 3 4 5 6 7 9 10 8
Verbal Reasoning – Using words as a basis in reasoning and problem solving.
1 2 3 4 5 6 7 8 10 9
Numerical Ability – A measure of numeric calculation ability.
1 2 3 4 6 7 8 9 10 5
Numeric Reasoning – Using numbers as a basis in reasoning and problem solving.
1 2 3 4 8 5 6 9 10 7
94% match with Thinking Style Pattern for the Any Department position.
Susie Sample has an 83% overall match for the Any Department position.
Profiles Office Park • 5205 Lake Shore Drive • Waco, Texas 76710-1732 USA • 254.751.1644 • www.profilesinternational.com Copyright ©2001-2008 Profiles International, Inc.
2
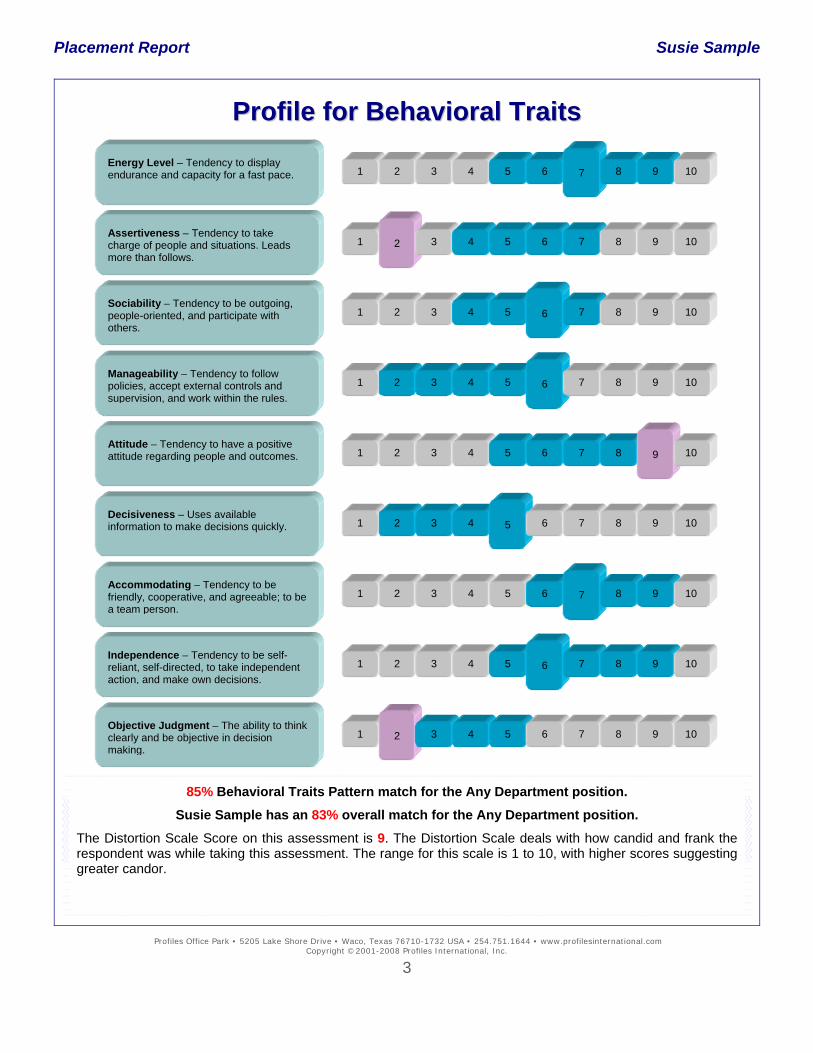
Placement Report Susie Sample
Profiles Office Park • 5205 Lake Shore Drive • Waco, Texas 76710-1732 USA • 254.751.1644 • www.profilesinternational.com Copyright ©2001-2008 Profiles International, Inc.
3
PPrrooffiillee ffoorr BBeehhaavviioorraall TTrraaiittss
Energy Level – Tendency to display endurance and capacity for a fast pace.
1 2 3 4 5 6 7 8 9 10
Assertiveness – Tendency to take charge of people and situations. Leads more than follows.
1 2 3 4 5 6 7 8 9 10
Sociability – Tendency to be outgoing, people-oriented, and participate with others.
1 2 3 4 5 6 7 8 9 10
Manageability – Tendency to follow policies, accept external controls and supervision, and work within the rules.
1 2 3 4 5 6 7 8 9 10
Attitude – Tendency to have a positive attitude regarding people and outcomes.
1 2 3 4 5 6 7 8 9 10
Decisiveness – Uses available information to make decisions quickly.
1 2 3 4 5 6 7 8 9 10
Accommodating – Tendency to be friendly, cooperative, and agreeable; to be a team person.
1 2 3 4 5 6 7 8 9 10
Independence – Tendency to be self-reliant, self-directed, to take independent action, and make own decisions.
1 2 3 4 5 6 7 8 9 10
Objective Judgment – The ability to think clearly and be objective in decision making.
1 2 3 4 5 6 7 8 9 10
85% Behavioral Traits Pattern match for the Any Department position.
Susie Sample has an 83% overall match for the Any Department position.
The Distortion Scale Score on this assessment is 9. The Distortion Scale deals with how candid and frank the respondent was while taking this assessment. The range for this scale is 1 to 10, with higher scores suggesting greater candor.
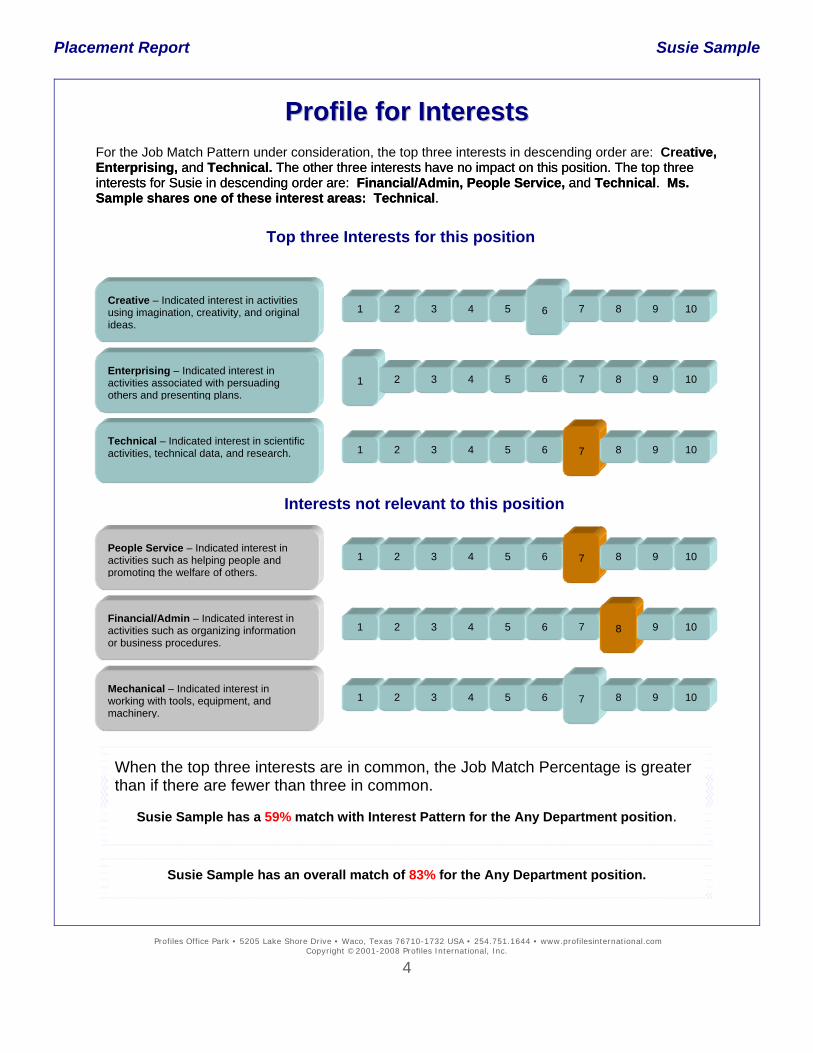
Placement Report Susie Sample
Profiles Office Park • 5205 Lake Shore Drive • Waco, Texas 76710-1732 USA • 254.751.1644 • www.profilesinternational.com Copyright ©2001-2008 Profiles International, Inc.
4
PPrrooffiillee ffoorr IInntteerreessttss
For the Job Match Pattern under consideration, the top three interests in descending order are: Creative, Enterprising, and Technical. The other three interests have no impact on this position. The top three interests for Susie in descending order are: Financial/Admin, People Service, and Technical. Ms. Sample shares one of these interest areas: Technical.
tive, Enterprising, and Technical. The other three interests have no impact on this position. The top three interests for Susie in descending order are: Financial/Admin, People Service, and Technical. Ms. Sample shares one of these interest areas: Technical.
Top three Interests for this position
Creative – Indicated interest in activities using imagination, creativity, and original ideas.
1 2 3 7 8 4 5 9 10 6
Enterprising – Indicated interest in activities associated with persuading others and presenting plans.
7 8 2 3 4 5 6 9 10 1
Technical – Indicated interest in scientific activities, technical data, and research.
1 2 3 4 5 6 8 9 10 7
Interests not relevant to this position
People Service – Indicated interest in activities such as helping people and promoting the welfare of others.
1 2 3 4 8 5 6 9 10 7
Financial/Admin – Indicated interest in activities such as organizing information or business procedures.
1 2 3 4 5 7 6 9 10 8
Mechanical – Indicated interest in working with tools, equipment, and machinery.
1 2 3 4 8 5 6 9 10 7
When the top three interests are in common, the Job Match Percentage is greater than if there are fewer than three in common.
Susie Sample has a 59% match with Interest Pattern for the Any Department position.
Susie Sample has an overall match of for the Any Department position. 83%
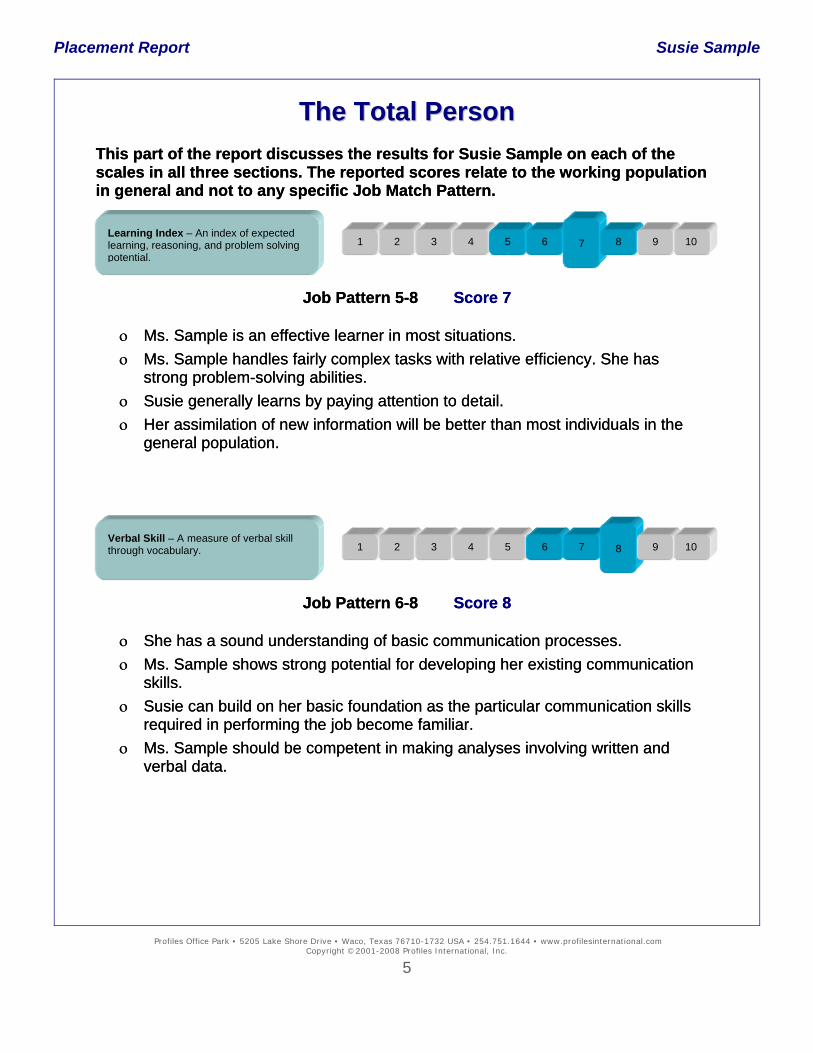
Placement Report Susie Sample
TThhee TToottaall PPeerrssoonn This part of the report discusses the results for Susie Sample on each of the scales in all three sections. The reported scores relate to the working population in general and not to any specific Job Match Pattern.
This part of the report discusses the results for Susie Sample on each of the scales in all three sections. The reported scores relate to the working population in general and not to any specific Job Match Pattern.
Job Pattern 5-8 Score 7 Job Pattern 5-8 Score 7
ο Ms. Sample is an effective learner in most situations. ο Ms. Sample is an effective learner in most situations. ο Ms. Sample handles fairly complex tasks with relative efficiency. She has
strong problem-solving abilities. ο Ms. Sample handles fairly complex tasks with relative efficiency. She has
strong problem-solving abilities. ο Susie generally learns by paying attention to detail. ο Susie generally learns by paying attention to detail. ο Her assimilation of new information will be better than most individuals in the
general population. ο Her assimilation of new information will be better than most individuals in the
general population.
Job Pattern 6-8 Score 8 Job Pattern 6-8 Score 8
ο She has a sound understanding of basic communication processes. ο She has a sound understanding of basic communication processes. ο Ms. Sample shows strong potential for developing her existing communication
skills. ο Ms. Sample shows strong potential for developing her existing communication
skills. ο Susie can build on her basic foundation as the particular communication skills
required in performing the job become familiar. ο Susie can build on her basic foundation as the particular communication skills
required in performing the job become familiar. ο Ms. Sample should be competent in making analyses involving written and
verbal data. ο Ms. Sample should be competent in making analyses involving written and
verbal data.
Learning Index – An index of expected learning, reasoning, and problem solving potential.
1 2 3 4 8 5 6 9 10 7
Verbal Skill – A measure of verbal skill through vocabulary.
1 2 3 4 5 7 6 9 10 8
Profiles Office Park • 5205 Lake Shore Drive • Waco, Texas 76710-1732 USA • 254.751.1644 • www.profilesinternational.com Copyright ©2001-2008 Profiles International, Inc.
5
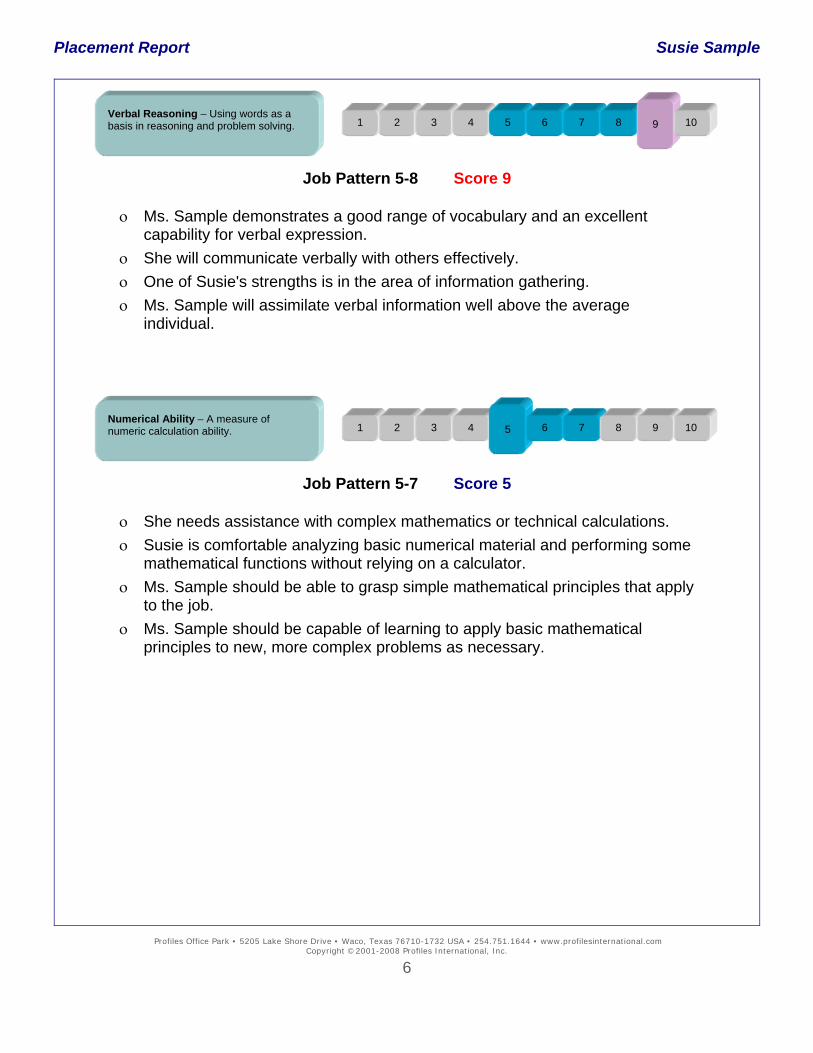
Placement Report Susie Sample
1 2 3 4 5 6 7 8 9 10 Verbal Reasoning – Using words as a basis in reasoning and problem solving.
Job Pattern 5-8 Score 9
ο Ms. Sample demonstrates a good range of vocabulary and an excellent capability for verbal expression.
ο She will communicate verbally with others effectively. ο One of Susie's strengths is in the area of information gathering. ο Ms. Sample will assimilate verbal information well above the average
individual.
Job Pattern 5-7 Score 5
ο She needs assistance with complex mathematics or technical calculations. ο Susie is comfortable analyzing basic numerical material and performing some
mathematical functions without relying on a calculator. ο Ms. Sample should be able to grasp simple mathematical principles that apply
to the job. ο Ms. Sample should be capable of learning to apply basic mathematical
principles to new, more complex problems as necessary.
Numerical Ability – A measure of numeric calculation ability.
1 2 7 8 3 4 6 9 10 5
Profiles Office Park • 5205 Lake Shore Drive • Waco, Texas 76710-1732 USA • 254.751.1644 • www.profilesinternational.com Copyright ©2001-2008 Profiles International, Inc.
6
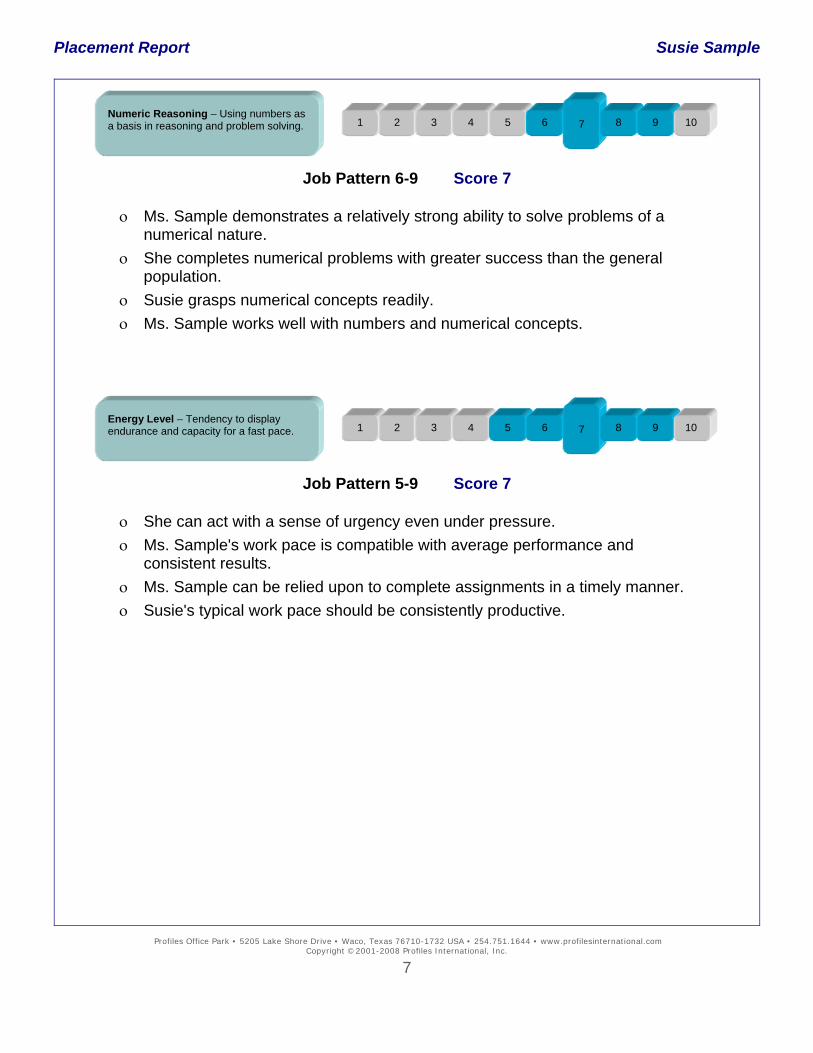
Placement Report Susie Sample
1 2 3 4 5 6 7 8 9 10 Numeric Reasoning – Using numbers as a basis in reasoning and problem solving.
Job Pattern 6-9 Score 7
ο Ms. Sample demonstrates a relatively strong ability to solve problems of a numerical nature.
ο She completes numerical problems with greater success than the general population.
ο Susie grasps numerical concepts readily. ο Ms. Sample works well with numbers and numerical concepts.
Job Pattern 5-9 Score 7
ο She can act with a sense of urgency even under pressure. ο Ms. Sample's work pace is compatible with average performance and
consistent results. ο Ms. Sample can be relied upon to complete assignments in a timely manner. ο Susie's typical work pace should be consistently productive.
Energy Level – Tendency to display endurance and capacity for a fast pace.
1 2 3 4 8 5 6 9 10 7
Profiles Office Park • 5205 Lake Shore Drive • Waco, Texas 76710-1732 USA • 254.751.1644 • www.profilesinternational.com Copyright ©2001-2008 Profiles International, Inc.
7
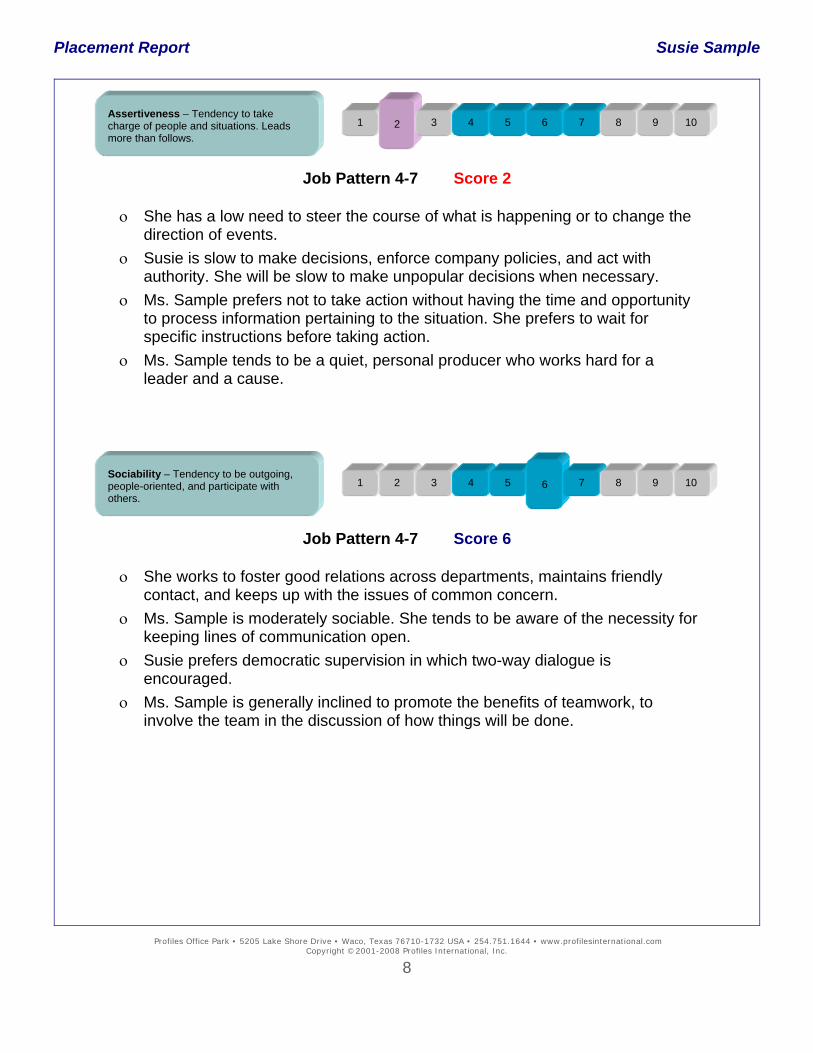
Placement Report Susie Sample
1 2 3 4 5 6 7 8 9 10 Assertiveness – Tendency to take charge of people and situations. Leads more than follows.
Job Pattern 4-7 Score 2
ο She has a low need to steer the course of what is happening or to change the direction of events.
ο Susie is slow to make decisions, enforce company policies, and act with authority. She will be slow to make unpopular decisions when necessary.
ο Ms. Sample prefers not to take action without having the time and opportunity to process information pertaining to the situation. She prefers to wait for specific instructions before taking action.
ο Ms. Sample tends to be a quiet, personal producer who works hard for a leader and a cause.
Job Pattern 4-7 Score 6
ο She works to foster good relations across departments, maintains friendly contact, and keeps up with the issues of common concern.
ο Ms. Sample is moderately sociable. She tends to be aware of the necessity for keeping lines of communication open.
ο Susie prefers democratic supervision in which two-way dialogue is encouraged.
ο Ms. Sample is generally inclined to promote the benefits of teamwork, to involve the team in the discussion of how things will be done.
Sociability – Tendency to be outgoing, people-oriented, and participate with others.
1 2 3 7 8 4 5 9 10 6
Profiles Office Park • 5205 Lake Shore Drive • Waco, Texas 76710-1732 USA • 254.751.1644 • www.profilesinternational.com Copyright ©2001-2008 Profiles International, Inc.
8
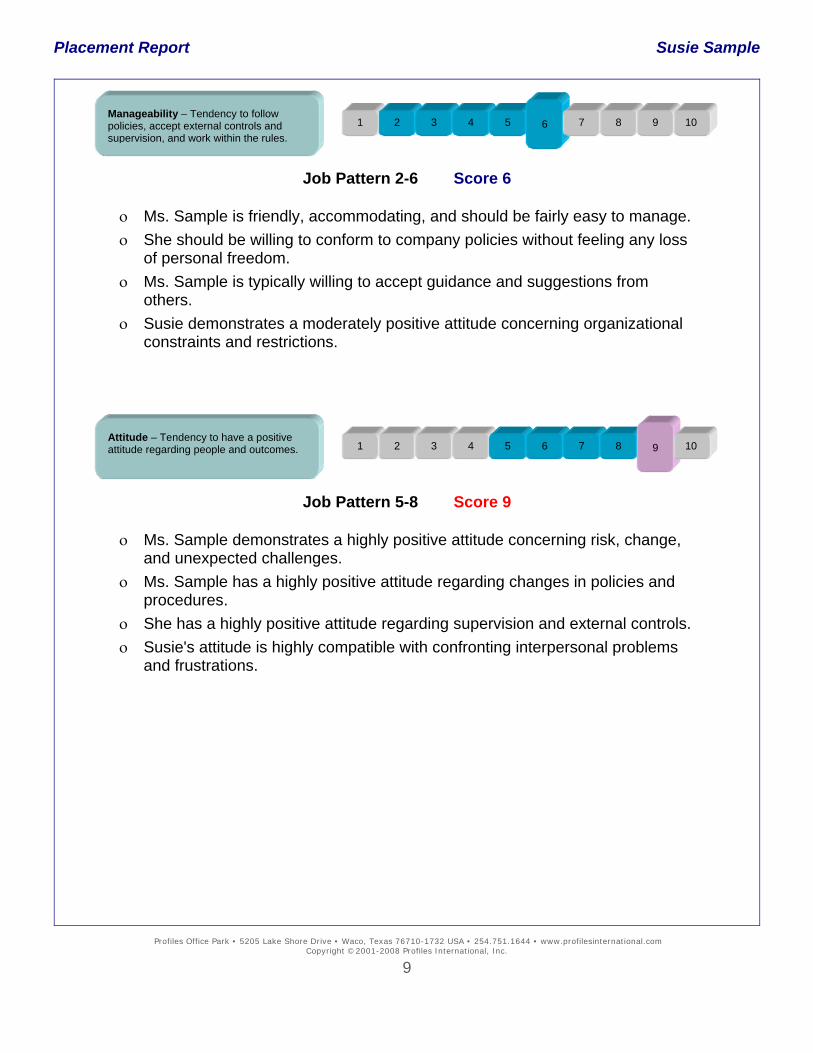
Placement Report Susie Sample
1 2 3 4 5 6 7 8 9 10 Manageability – Tendency to follow policies, accept external controls and supervision, and work within the rules.
Job Pattern 2-6 Score 6
ο Ms. Sample is friendly, accommodating, and should be fairly easy to manage. ο She should be willing to conform to company policies without feeling any loss
of personal freedom. ο Ms. Sample is typically willing to accept guidance and suggestions from
others. ο Susie demonstrates a moderately positive attitude concerning organizational
constraints and restrictions.
Job Pattern 5-8 Score 9
ο Ms. Sample demonstrates a highly positive attitude concerning risk, change, and unexpected challenges.
ο Ms. Sample has a highly positive attitude regarding changes in policies and procedures.
ο She has a highly positive attitude regarding supervision and external controls. ο Susie's attitude is highly compatible with confronting interpersonal problems
and frustrations.
Attitude – Tendency to have a positive attitude regarding people and outcomes.
1 2 3 4 5 6 7 8 10 9
Profiles Office Park • 5205 Lake Shore Drive • Waco, Texas 76710-1732 USA • 254.751.1644 • www.profilesinternational.com Copyright ©2001-2008 Profiles International, Inc.
9
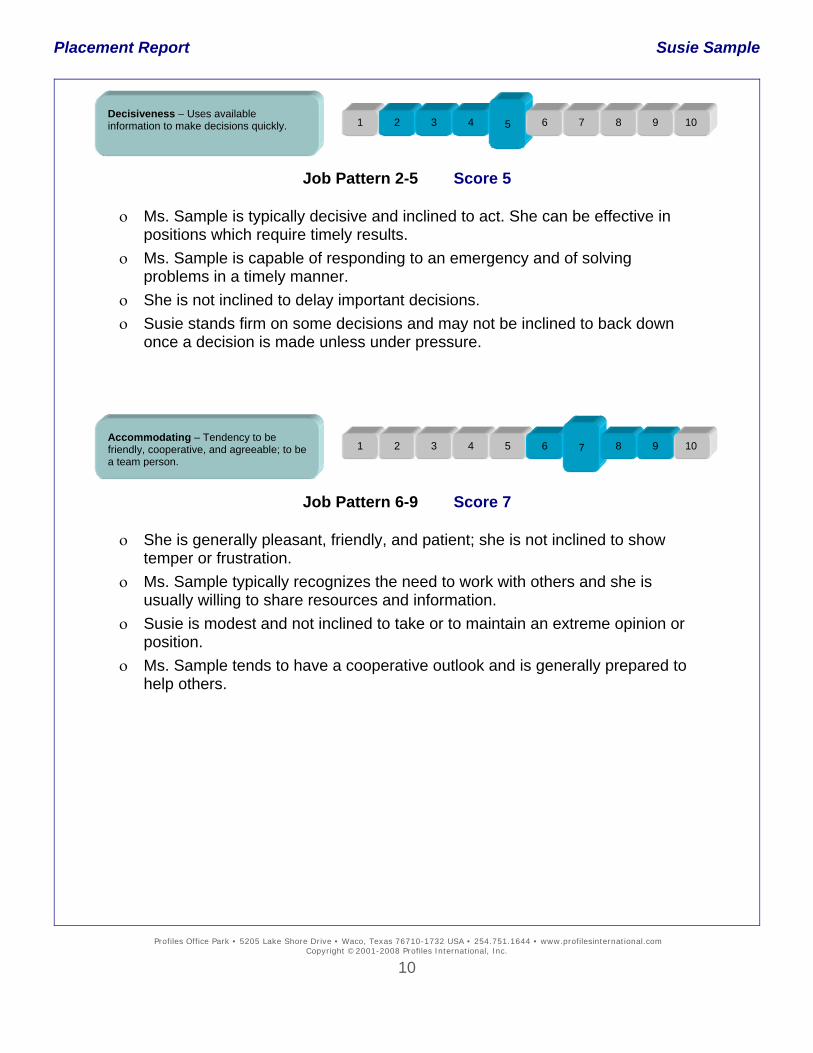
Placement Report Susie Sample
1 2 3 4 5 6 7 8 9 10 Decisiveness – Uses available information to make decisions quickly.
Job Pattern 2-5 Score 5
ο Ms. Sample is typically decisive and inclined to act. She can be effective in positions which require timely results.
ο Ms. Sample is capable of responding to an emergency and of solving problems in a timely manner.
ο She is not inclined to delay important decisions. ο Susie stands firm on some decisions and may not be inclined to back down
once a decision is made unless under pressure.
Job Pattern 6-9 Score 7
ο She is generally pleasant, friendly, and patient; she is not inclined to show temper or frustration.
ο Ms. Sample typically recognizes the need to work with others and she is usually willing to share resources and information.
ο Susie is modest and not inclined to take or to maintain an extreme opinion or position.
ο Ms. Sample tends to have a cooperative outlook and is generally prepared to help others.
Accommodating – Tendency to be friendly, cooperative, and agreeable; to be a team person.
1 2 3 4 8 5 6 9 10 7
Profiles Office Park • 5205 Lake Shore Drive • Waco, Texas 76710-1732 USA • 254.751.1644 • www.profilesinternational.com Copyright ©2001-2008 Profiles International, Inc.
10

Placement Report Susie Sample
Profiles Office Park • 5205 Lake Shore Drive • Waco, Texas 76710-1732 USA • 254.751.1644 • www.profilesinternational.com Copyright ©2001-2008 Profiles International, Inc.
11
1 2 3 4 5 6 7 8 9 10 Independence – Tendency to be self-reliant, self-directed, to take independent action, and make own decisions.
Job Pattern 5-9 Score 6
ο Ms. Sample has a moderate need for freedom from controls, close supervision, and organizational constraints.
ο She is usually comfortable handling new problems independently. ο Susie appreciates some opportunity to challenge the status quo and to cause
a change in something. ο Ms. Sample prefers to carry out important tasks with minimal supervision. She
can be counted on to meet her commitments without close supervision.
Objective Judgment – The ability to think clearly and be objective in decision making.
7 8 1 3 4 5 6 9 10 2
Job Pattern 3-5 Score 2
ο Ms. Sample uses judgment that often tends to be more subjective when she feels pressured.
ο Ms. Sample's judgment will be much more intuitive when addressing critical, independent decision making responsibilities.
ο Ms. Sample has thinking abilities which can be less effective if she allows personal biases and opinions to replace sound judgment.
ο Ms. Sample tends to be a subjective thinker and emphasizes personal opinions more than factual data.
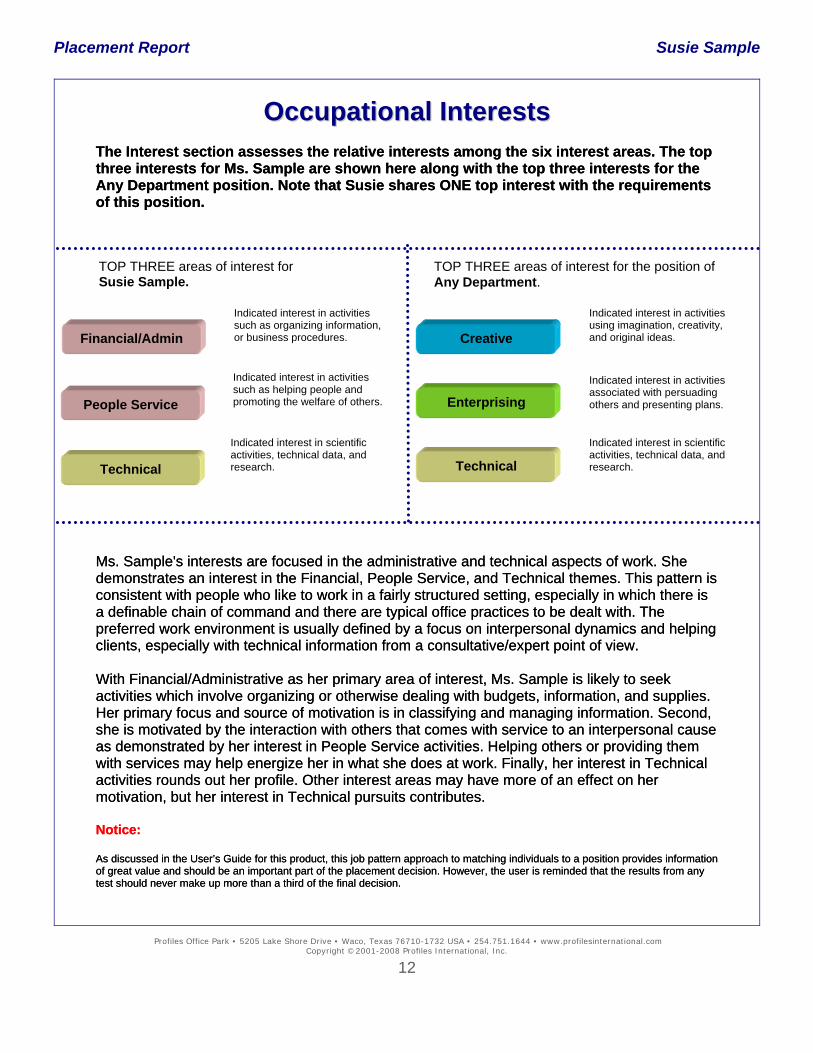
Placement Report Susie Sample
OOccccuuppaattiioonnaall IInntteerreessttss The Interest section assesses the relative interests among the six interest areas. The top three interests for Ms. Sample are shown here along with the top three interests for the Any Department position. Note that Susie shares ONE top interest with the requirements of this position.
The Interest section assesses the relative interests among the six interest areas. The top three interests for Ms. Sample are shown here along with the top three interests for the Any Department position. Note that Susie shares ONE top interest with the requirements of this position. TOP THREE areas of interest for TOP THREE areas of interest for the position of
Any Department. Susie Sample.
Ms. Sample's interests are focused in the administrative and technical aspects of work. She demonstrates an interest in the Financial, People Service, and Technical themes. This pattern is consistent with people who like to work in a fairly structured setting, especially in which there is a definable chain of command and there are typical office practices to be dealt with. The preferred work environment is usually defined by a focus on interpersonal dynamics and helping clients, especially with technical information from a consultative/expert point of view.
Ms. Sample's interests are focused in the administrative and technical aspects of work. She demonstrates an interest in the Financial, People Service, and Technical themes. This pattern is consistent with people who like to work in a fairly structured setting, especially in which there is a definable chain of command and there are typical office practices to be dealt with. The preferred work environment is usually defined by a focus on interpersonal dynamics and helping clients, especially with technical information from a consultative/expert point of view. With Financial/Administrative as her primary area of interest, Ms. Sample is likely to seek activities which involve organizing or otherwise dealing with budgets, information, and supplies. Her primary focus and source of motivation is in classifying and managing information. Second, she is motivated by the interaction with others that comes with service to an interpersonal cause as demonstrated by her interest in People Service activities. Helping others or providing them with services may help energize her in what she does at work. Finally, her interest in Technical activities rounds out her profile. Other interest areas may have more of an effect on her motivation, but her interest in Technical pursuits contributes.
With Financial/Administrative as her primary area of interest, Ms. Sample is likely to seek activities which involve organizing or otherwise dealing with budgets, information, and supplies. Her primary focus and source of motivation is in classifying and managing information. Second, she is motivated by the interaction with others that comes with service to an interpersonal cause as demonstrated by her interest in People Service activities. Helping others or providing them with services may help energize her in what she does at work. Finally, her interest in Technical activities rounds out her profile. Other interest areas may have more of an effect on her motivation, but her interest in Technical pursuits contributes. N N
otice: otice:
As discussed in the User’s Guide for this product, this job pattern approach to matching individuals to a position provides information of great value and should be an important part of the placement decision. However, the user is reminded that the results from any test should never make up more than a third of the final decision.
As discussed in the User’s Guide for this product, this job pattern approach to matching individuals to a position provides information of great value and should be an important part of the placement decision. However, the user is reminded that the results from any test should never make up more than a third of the final decision.
Indicated interest in activities using imagination, creativity, and original ideas.
Indicated interest in activities such as organizing information, or business procedures. Financial/Admin Creative
Indicated interest in activities such as helping people and promoting the welfare of others.
Indicated interest in activities associated with persuading others and presenting plans. Enterprising People Service
Indicated interest in scientific activities, technical data, and research.
Indicated interest in scientific activities, technical data, and research. Technical Technical
Profiles Office Park • 5205 Lake Shore Drive • Waco, Texas 76710-1732 USA • 254.751.1644 • www.profilesinternational.com Copyright ©2001-2008 Profiles International, Inc.
12
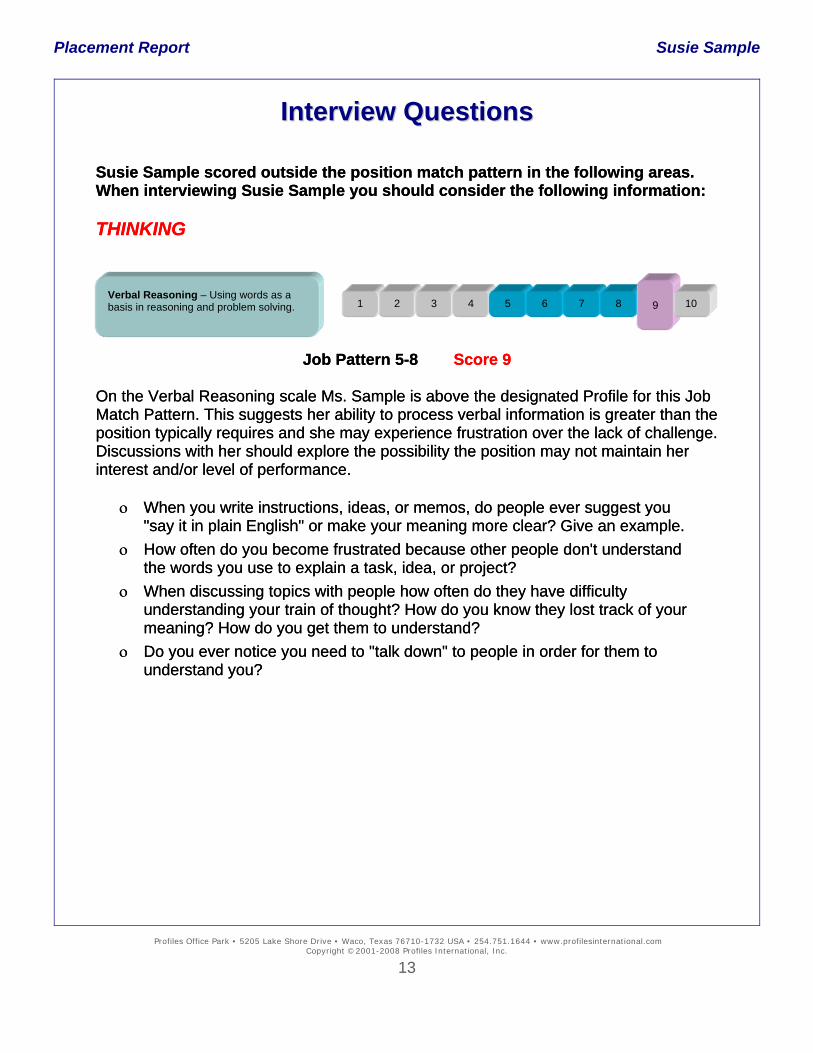
Placement Report Susie Sample
IInntteerrvviieeww QQuueessttiioonnss Susie Sample scored outside the position match pattern in the following areas. When interviewing Susie Sample you should consider the following information: Susie Sample scored outside the position match pattern in the following areas. When interviewing Susie Sample you should consider the following information: THINKING THINKING
Job Pattern 5-8 Score 9 Job Pattern 5-8 Score 9
On the Verbal Reasoning scale Ms. Sample is above the designated Profile for this Job Match Pattern. This suggests her ability to process verbal information is greater than the position typically requires and she may experience frustration over the lack of challenge. Discussions with her should explore the possibility the position may not maintain her interest and/or level of performance.
On the Verbal Reasoning scale Ms. Sample is above the designated Profile for this Job Match Pattern. This suggests her ability to process verbal information is greater than the position typically requires and she may experience frustration over the lack of challenge. Discussions with her should explore the possibility the position may not maintain her interest and/or level of performance. ο When you write instructions, ideas, or memos, do people ever suggest you
"say it in plain English" or make your meaning more clear? Give an example. ο When you write instructions, ideas, or memos, do people ever suggest you
"say it in plain English" or make your meaning more clear? Give an example. ο How often do you become frustrated because other people don't understand
the words you use to explain a task, idea, or project? ο How often do you become frustrated because other people don't understand
the words you use to explain a task, idea, or project? ο When discussing topics with people how often do they have difficulty
understanding your train of thought? How do you know they lost track of your meaning? How do you get them to understand?
ο When discussing topics with people how often do they have difficulty understanding your train of thought? How do you know they lost track of your meaning? How do you get them to understand?
ο Do you ever notice you need to "talk down" to people in order for them to understand you?
ο Do you ever notice you need to "talk down" to people in order for them to understand you?
Verbal Reasoning – Using words as a basis in reasoning and problem solving.
1 2 3 4 5 6 7 8 10 9
Profiles Office Park • 5205 Lake Shore Drive • Waco, Texas 76710-1732 USA • 254.751.1644 • www.profilesinternational.com Copyright ©2001-2008 Profiles International, Inc.
13
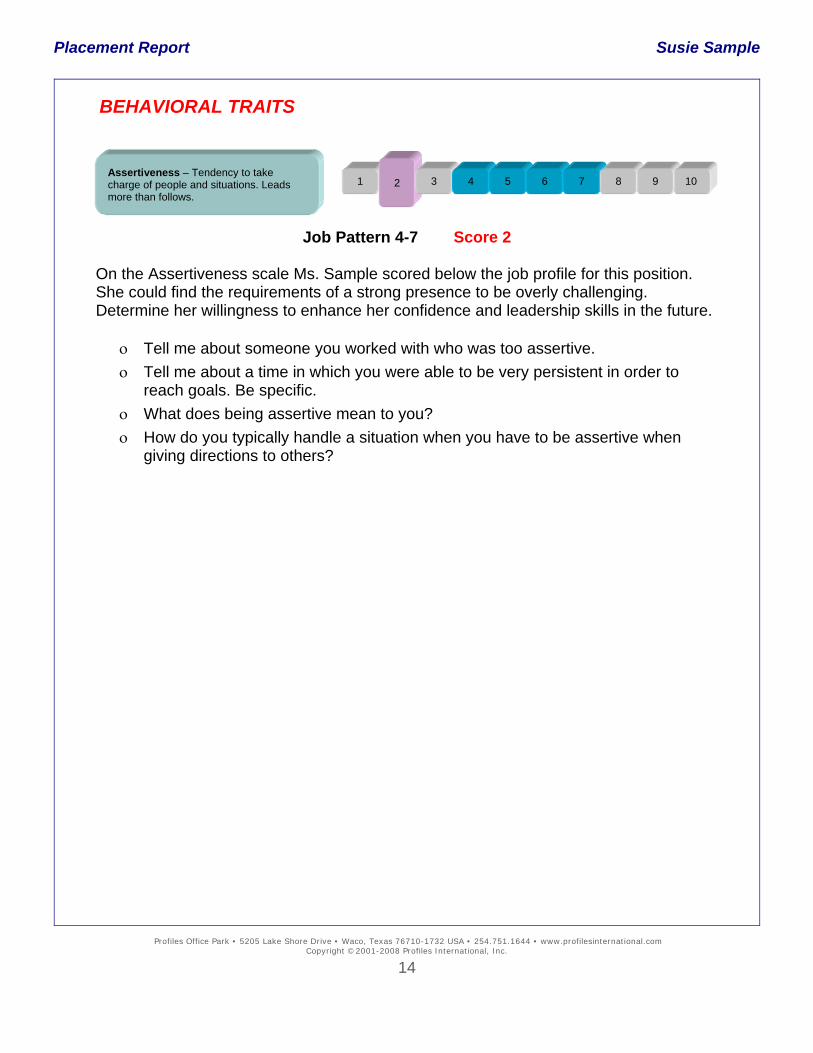
Placement Report Susie Sample
BEHAVIORAL TRAITS
Job Pattern 4-7 Score 2
On the Assertiveness scale Ms. Sample scored below the job profile for this position. She could find the requirements of a strong presence to be overly challenging. Determine her willingness to enhance her confidence and leadership skills in the future. ο Tell me about someone you worked with who was too assertive. ο Tell me about a time in which you were able to be very persistent in order to
reach goals. Be specific. ο What does being assertive mean to you? ο How do you typically handle a situation when you have to be assertive when
giving directions to others?
Assertiveness – Tendency to take charge of people and situations. Leads more than follows.
1 3 4 5 6 7 8 9 10 2
Profiles Office Park • 5205 Lake Shore Drive • Waco, Texas 76710-1732 USA • 254.751.1644 • www.profilesinternational.com Copyright ©2001-2008 Profiles International, Inc.
14
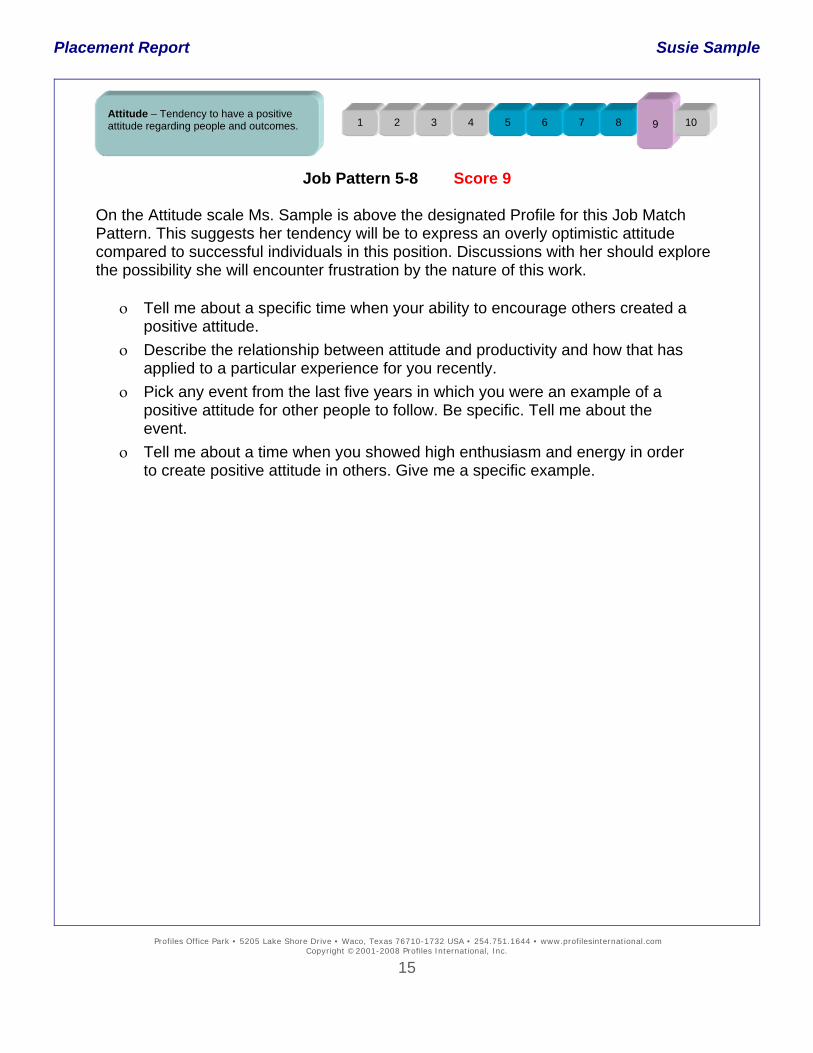
Placement Report Susie Sample
Job Pattern 5-8 Score 9
On the Attitude scale Ms. Sample is above the designated Profile for this Job Match Pattern. This suggests her tendency will be to express an overly optimistic attitude compared to successful individuals in this position. Discussions with her should explore the possibility she will encounter frustration by the nature of this work. ο Tell me about a specific time when your ability to encourage others created a
positive attitude. ο Describe the relationship between attitude and productivity and how that has
applied to a particular experience for you recently. ο Pick any event from the last five years in which you were an example of a
positive attitude for other people to follow. Be specific. Tell me about the event.
ο Tell me about a time when you showed high enthusiasm and energy in order to create positive attitude in others. Give me a specific example.
Attitude – Tendency to have a positive attitude regarding people and outcomes.
1 2 3 4 5 6 7 8 10 9
Profiles Office Park • 5205 Lake Shore Drive • Waco, Texas 76710-1732 USA • 254.751.1644 • www.profilesinternational.com Copyright ©2001-2008 Profiles International, Inc.
15
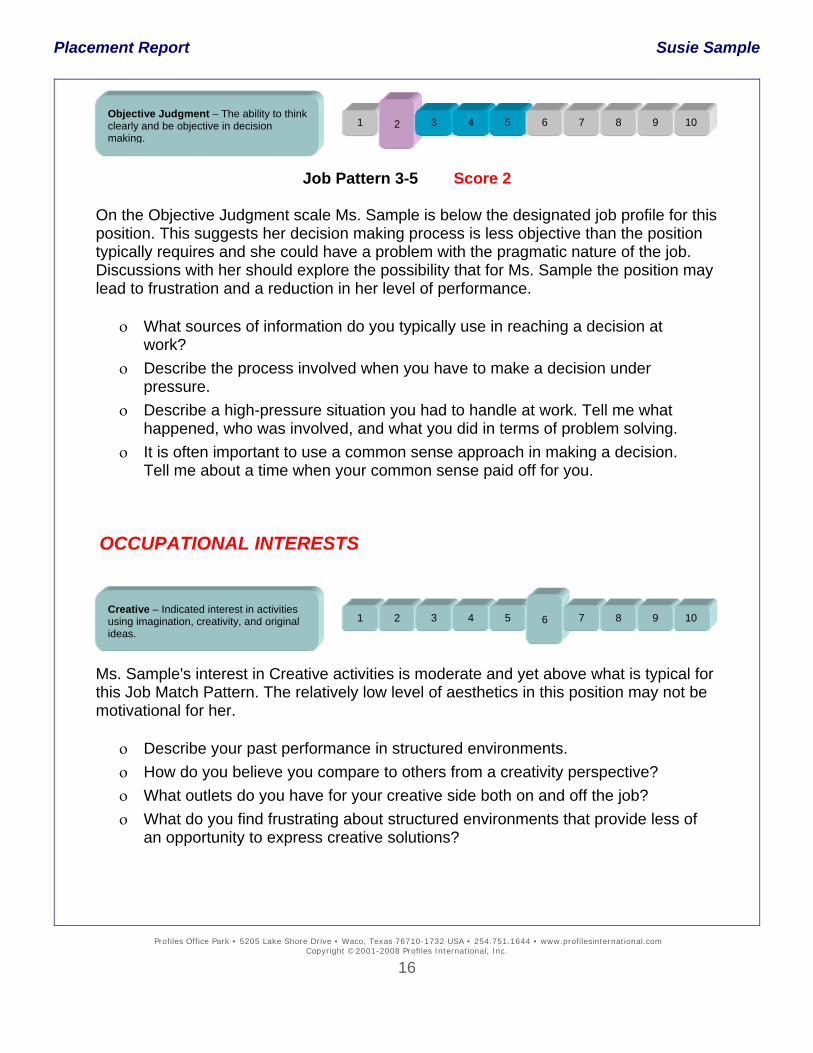
Placement Report Susie Sample
1 2 3 4 5 6 7 8 9 10 Objective Judgment – The ability to think clearly and be objective in decision making.
Job Pattern 3-5 Score 2
On the Objective Judgment scale Ms. Sample is below the designated job profile for this position. This suggests her decision making process is less objective than the position typically requires and she could have a problem with the pragmatic nature of the job. Discussions with her should explore the possibility that for Ms. Sample the position may lead to frustration and a reduction in her level of performance. ο What sources of information do you typically use in reaching a decision at
work? ο Describe the process involved when you have to make a decision under
pressure. ο Describe a high-pressure situation you had to handle at work. Tell me what
happened, who was involved, and what you did in terms of problem solving. ο It is often important to use a common sense approach in making a decision.
Tell me about a time when your common sense paid off for you. OCCUPATIONAL INTERESTS Ms. Sample's interest in Creative activities is moderate and yet above what is typical for this Job Match Pattern. The relatively low level of aesthetics in this position may not be motivational for her. ο Describe your past performance in structured environments. ο How do you believe you compare to others from a creativity perspective? ο What outlets do you have for your creative side both on and off the job? ο What do you find frustrating about structured environments that provide less of
an opportunity to express creative solutions?
Creative – Indicated interest in activities using imagination, creativity, and original ideas.
1 2 3 7 8 4 5 9 10 6
Profiles Office Park • 5205 Lake Shore Drive • Waco, Texas 76710-1732 USA • 254.751.1644 • www.profilesinternational.com Copyright ©2001-2008 Profiles International, Inc.
16
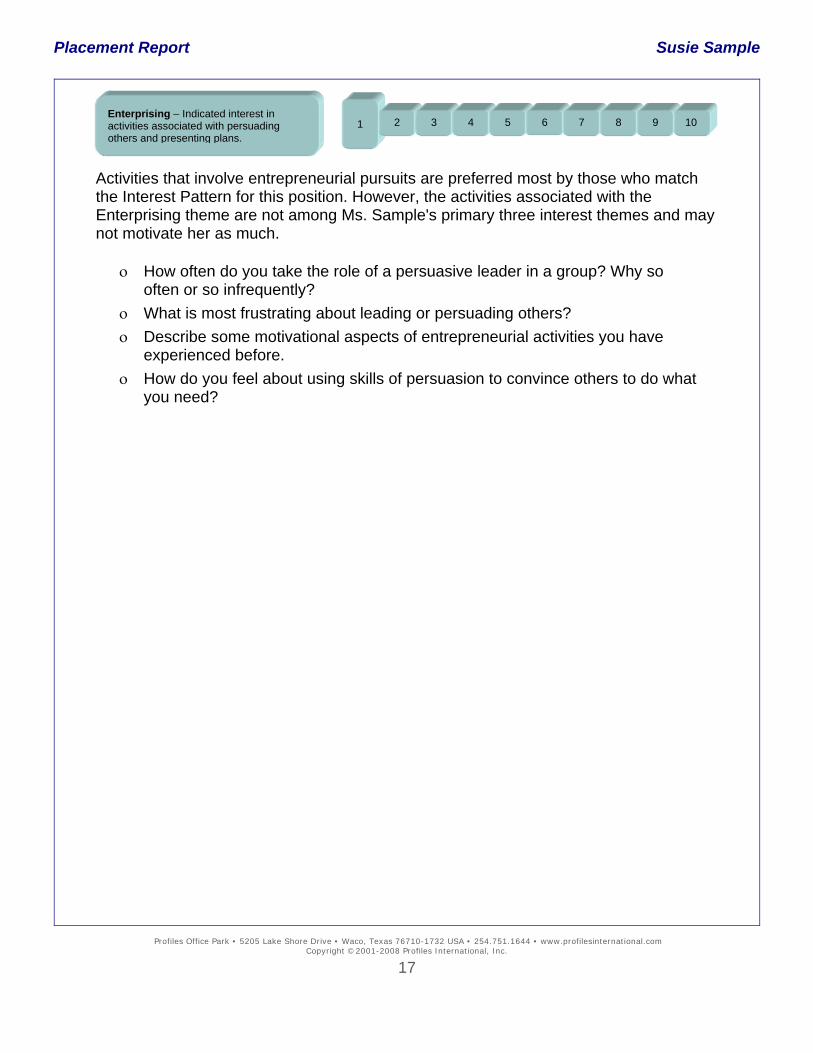
Placement Report Susie Sample
Profiles Office Park • 5205 Lake Shore Drive • Waco, Texas 76710-1732 USA • 254.751.1644 • www.profilesinternational.com Copyright ©2001-2008 Profiles International, Inc.
17
Enterprising – Indicated interest in activities associated with persuading others and presenting plans.
7 8 2 3 4 5 6 9 10 1
Activities that involve entrepreneurial pursuits are preferred most by those who match the Interest Pattern for this position. However, the activities associated with the Enterprising theme are not among Ms. Sample's primary three interest themes and may not motivate her as much. ο How often do you take the role of a persuasive leader in a group? Why so
often or so infrequently? ο What is most frustrating about leading or persuading others? ο Describe some motivational aspects of entrepreneurial activities you have
experienced before. ο How do you feel about using skills of persuasion to convince others to do what
you need?
CONFIDENTIAL
COACHING REPORT Thursday, May 8, 2008
Susie Sample Any Department
Profiles International 5207 Lake Shore Drive Waco, TX 76710 254-751-1644
Profiles Office Park • 5205 Lake Shore Drive • Waco, Texas 76710-1732 USA • 254.751.1644 • www.profilesinternational.com
Copyright ©2001-2008 Profiles International, Inc.
Building and Retaining the High-Performance Company
IInnttrroodduuccttiioonn The Coaching Report for Susie Sample provides information that can be helpful in managing, motivating, and coaching Susie for increased productivity. This report reflects the responses provided by Susie Sample when she completed the ProfileXT® assessment. Results are illustrated on a scale from 1 to 10. The darker area on the scale represents the “Job Match” pattern for the position. The enlarged segment of the scale shows where Susie scored. If the enlarged segment is dark, Susie is in the Job Match pattern, if it is light she is not. Information about Susie is reported in these five categories:
• Profile for Thinking Style – Learning index, Verbal Skill, Verbal Reasoning, Numerical Ability, and Numeric Reasoning.
• Profile for Behavioral Traits – Energy Level, Assertiveness, Sociability, Manageability, Attitude, Decisiveness, Accommodating, Independence, and Objective Judgment.
• Profile for Interests – Enterprising, Financial/Administrative, People Service, Creative, Technical, and Mechanical.
• The Total Person – Additional information regarding Susie and the significance of her scores.
• Coaching Comments – Ideas for your consideration when coaching Susie.
Please consult the User’s Guide for additional information on using these results in working with Susie.
Profiles Office Park • 5205 Lake Shore Drive • Waco, Texas 76710-1732 USA • 254.751.1644 • www.profilesinternational.com Copyright ©2001-2008 Profiles International, Inc.
1
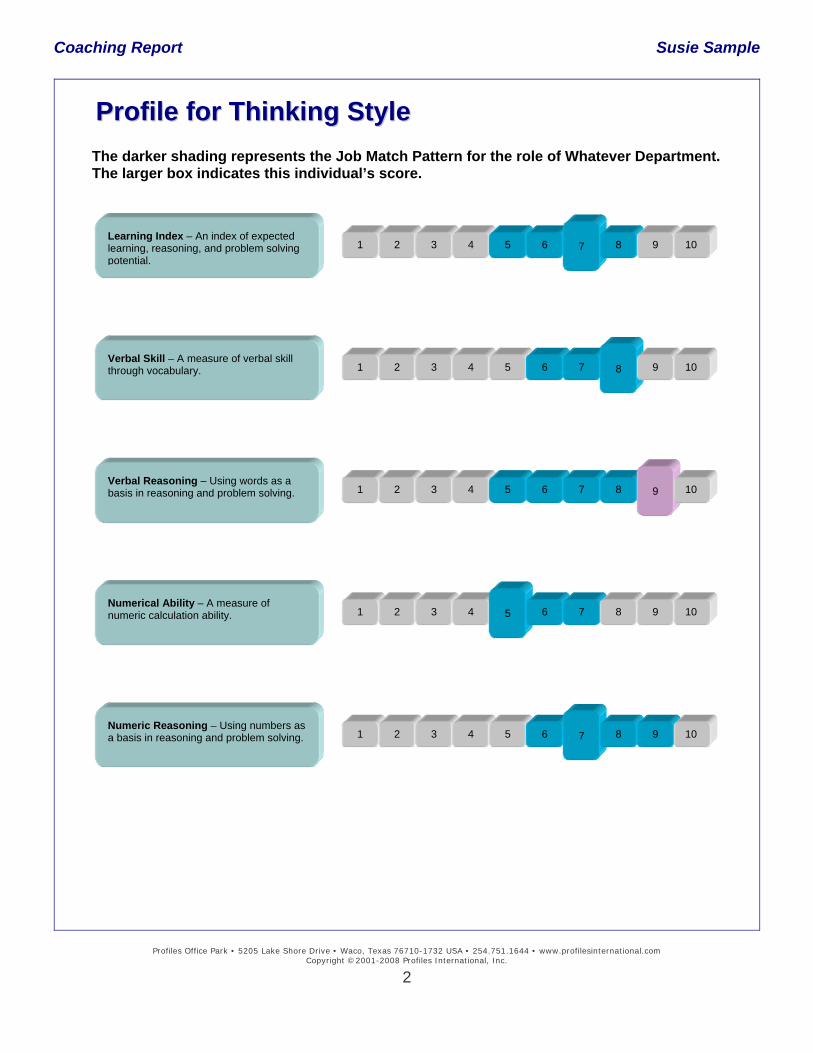
Coaching Report Susie Sample
PPrrooffiillee ffoorr TThhiinnkkiinngg SSttyyllee
The darker shading represents the Job Match Pattern for the role of Whatever Department. The larger box indicates this individual’s score.
Learning Index – An index of expected learning, reasoning, and problem solving potential.
1 2 3 4 5 6 7 8 9 10
Verbal Skill – A measure of verbal skill through vocabulary.
1 2 3 4 5 6 7 8 9 10
Verbal Reasoning – Using words as a basis in reasoning and problem solving.
1 2 3 4 5 6 7 8 9 10
Numerical Ability – A measure of numeric calculation ability.
1 2 3 4 5 6 7 8 9 10
Numeric Reasoning – Using numbers as a basis in reasoning and problem solving.
1 2 3 4 5 6 7 8 9 10
Profiles Office Park • 5205 Lake Shore Drive • Waco, Texas 76710-1732 USA • 254.751.1644 • www.profilesinternational.com Copyright ©2001-2008 Profiles International, Inc.
2
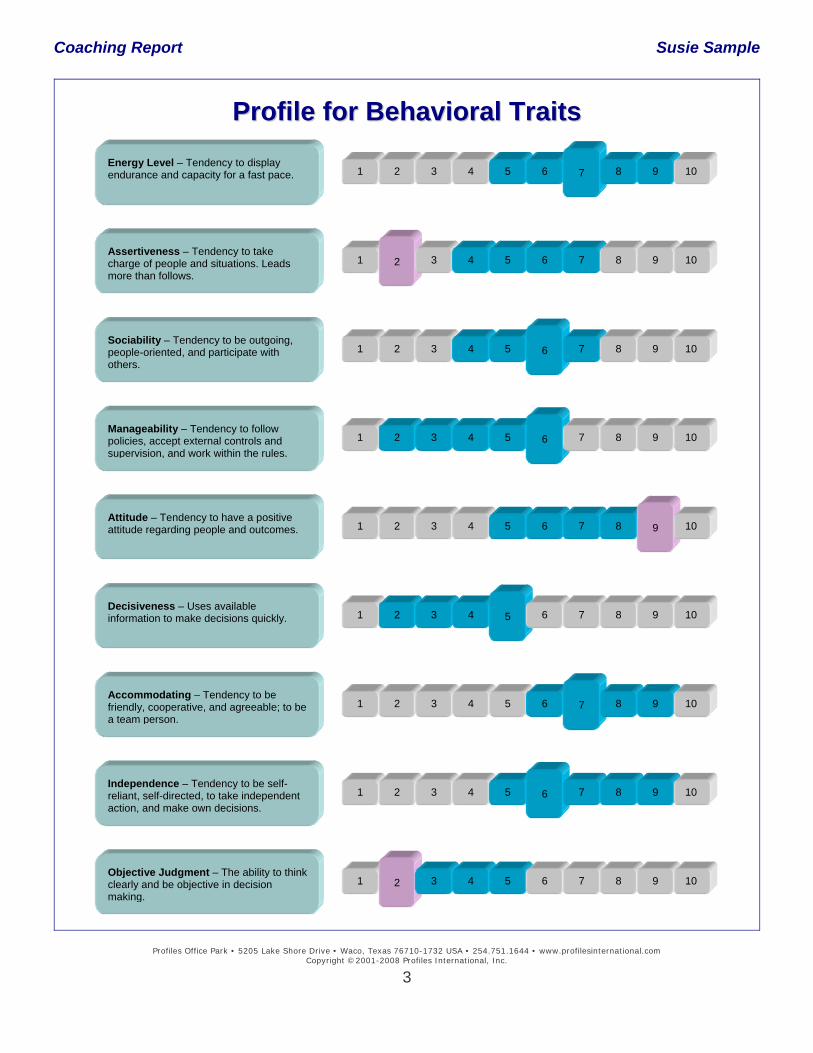
Coaching Report Susie Sample
Profiles Office Park • 5205 Lake Shore Drive • Waco, Texas 76710-1732 USA • 254.751.1644 • www.profilesinternational.com Copyright ©2001-2008 Profiles International, Inc.
3
PPrrooffiillee ffoorr BBeehhaavviioorraall TTrraaiittss
Energy Level – Tendency to display endurance and capacity for a fast pace.
1 2 3 4 5 6 7 8 9 10
Assertiveness – Tendency to take charge of people and situations. Leads more than follows.
1 2 3 4 5 6 7 8 9 10
Sociability – Tendency to be outgoing, people-oriented, and participate with others.
1 2 3 4 5 6 7 8 9 10
Manageability – Tendency to follow policies, accept external controls and supervision, and work within the rules.
1 2 3 4 5 6 7 8 9 10
Attitude – Tendency to have a positive attitude regarding people and outcomes.
1 2 3 4 5 6 7 8 9 10
Decisiveness – Uses available information to make decisions quickly.
1 2 3 4 5 6 7 8 9 10
Accommodating – Tendency to be friendly, cooperative, and agreeable; to be a team person.
1 2 3 4 5 6 7 8 9 10
Independence – Tendency to be self-reliant, self-directed, to take independent action, and make own decisions.
1 2 3 4 5 6 7 8 9 10
Objective Judgment – The ability to think clearly and be objective in decision making.
1 2 3 4 5 6 7 8 9 10
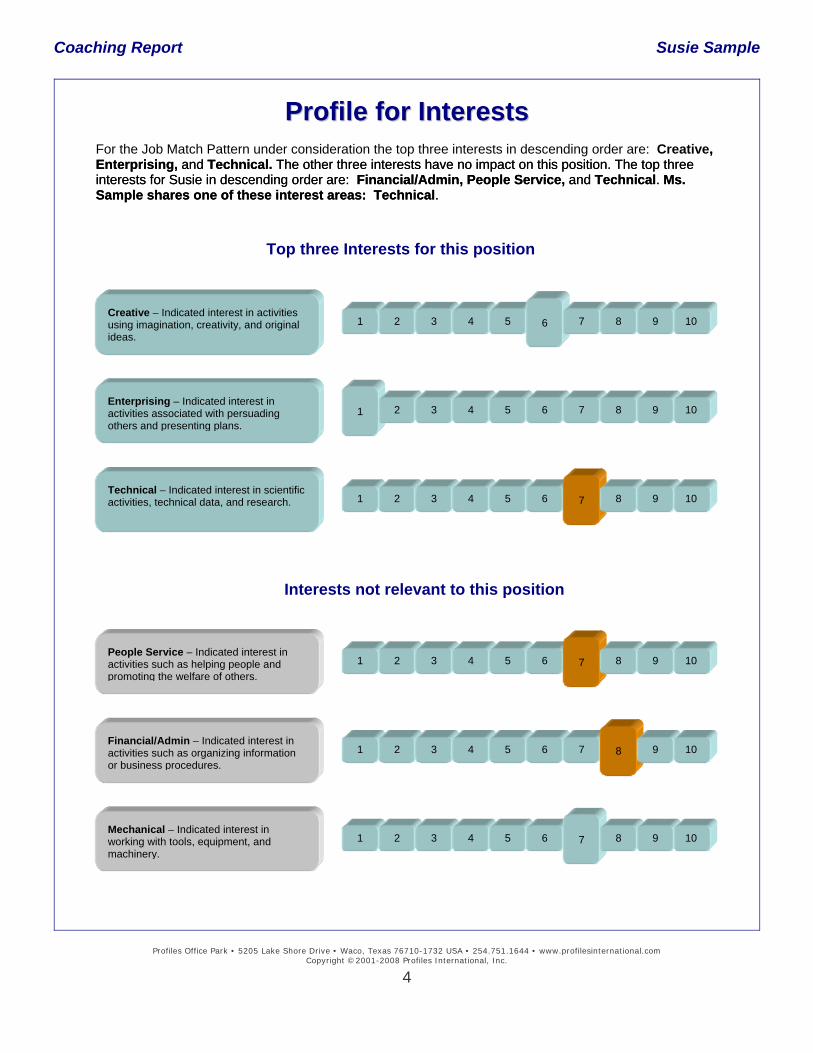
Coaching Report Susie Sample
PPrrooffiillee ffoorr IInntteerreessttss
For the Job Match Pattern under consideration the top three interests in descending order are: Creative, Enterprising, and Technical. The other three interests have no impact on this position. The top three interests for Susie in descending order are: Financial/Admin, People Service, and Technical. Ms. Sample shares one of these interest areas: Technical.
, Enterprising, and Technical. The other three interests have no impact on this position. The top three interests for Susie in descending order are: Financial/Admin, People Service, and Technical. Ms. Sample shares one of these interest areas: Technical.
Top three Interests for this position
Creative – Indicated interest in activities using imagination, creativity, and original ideas.
1 2 3 4 5 7 8 9 10 6
Enterprising – Indicated interest in activities associated with persuading othe
7 8 2 3 4 5 6 9 10 1rs and presenting plans.
Technical – Indicated interest in scientific activities, technical data, and research.
1 2 3 4 8 5 6 9 10 7
Interests not relevant to this position
People Service – Indicated interest in activities such as helping people and promoting the welfare of others.
1 2 3 4 8 5 6 9 10 7
Financial/Admin – Indicated interest in activities such as organizing information or business procedures.
1 2 3 4 5 6 7 9 10 8
Mechanical – Indicated interest in working with tools, equipment, and machinery.
1 2 3 4 8 5 6 9 10 7
Profiles Office Park • 5205 Lake Shore Drive • Waco, Texas 76710-1732 USA • 254.751.1644 • www.profilesinternational.com Copyright ©2001-2008 Profiles International, Inc.
4
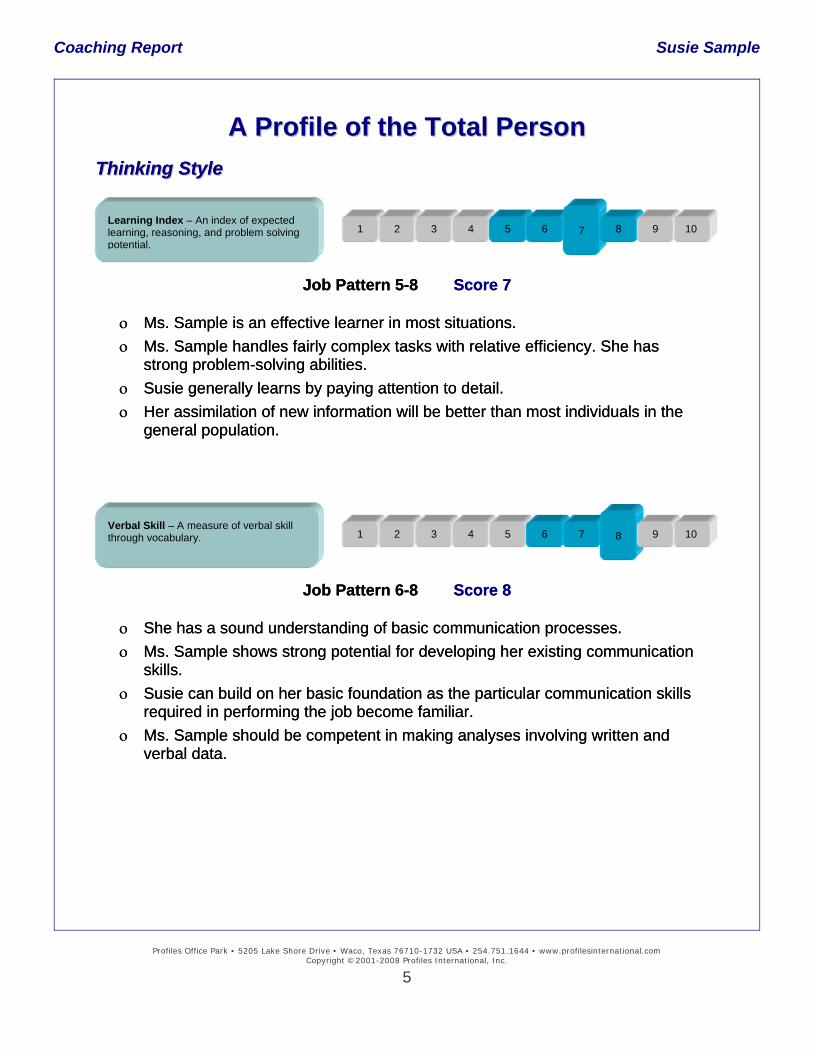
Coaching Report Susie Sample
AA PPrrooffiillee ooff tthhee TToottaall PPeerrssoonnTTh
hiinnkkiinngg SSttyyllee TT
Job Pattern 5-8 Score 7 Job Pattern 5-8 Score 7
ο Ms. Sample is an effective learner in most situations. ο Ms. Sample is an effective learner in most situations. ο Ms. Sample handles fairly complex tasks with relative efficiency. She has
strong problem-solving abilities. ο Ms. Sample handles fairly complex tasks with relative efficiency. She has
strong problem-solving abilities. ο Susie generally learns by paying attention to detail. ο Susie generally learns by paying attention to detail. ο Her assimilation of new information will be better than most individuals in the
general population. ο Her assimilation of new information will be better than most individuals in the
general population.
Job Pattern 6-8 Score 8 Job Pattern 6-8 Score 8
ο She has a sound understanding of basic communication processes. ο She has a sound understanding of basic communication processes. ο Ms. Sample shows strong potential for developing her existing communication
skills. ο Ms. Sample shows strong potential for developing her existing communication
skills. ο Susie can build on her basic foundation as the particular communication skills
required in performing the job become familiar. ο Susie can build on her basic foundation as the particular communication skills
required in performing the job become familiar. ο Ms. Sample should be competent in making analyses involving written and
verbal data. ο Ms. Sample should be competent in making analyses involving written and
verbal data.
hhiinnkkiinngg SSttyyllee
Learning Index – An index of expected learning, reasoning, and problem solving potential.
1 2 3 4 8 5 6 9 10 7
Verbal Skill – A measure of verbal skill through vocabulary.
1 2 3 4 5 7 6 9 10 8
Profiles Office Park • 5205 Lake Shore Drive • Waco, Texas 76710-1732 USA • 254.751.1644 • www.profilesinternational.com Copyright ©2001-2008 Profiles International, Inc.
5

Coaching Report Susie Sample
Verbal Reasoning – Using words as a basis in reasoning and problem solving.
1 2 3 4 5 6 7 8 9 10
Job Pattern 5-8 Score 9
ο Ms. Sample demonstrates a good range of vocabulary and an excellent capability for verbal expression.
ο She will communicate verbally with others effectively. ο One of Susie's strengths is in the area of information gathering. ο Ms. Sample will assimilate verbal information well above the average
individual.
Job Pattern 5-7 Score 5
ο She needs assistance with complex mathematics or technical calculations. ο Susie is comfortable analyzing basic numerical material and performing some
mathematical functions without relying on a calculator. ο Ms. Sample should be able to grasp simple mathematical principles that apply
to the job. ο Ms. Sample should be capable of learning to apply basic mathematical
principles to new, more complex problems as necessary.
Numerical Ability – A measure of numeric calculation ability.
1 2 7 8 3 4 6 9 10 5
Profiles Office Park • 5205 Lake Shore Drive • Waco, Texas 76710-1732 USA • 254.751.1644 • www.profilesinternational.com Copyright ©2001-2008 Profiles International, Inc.
6
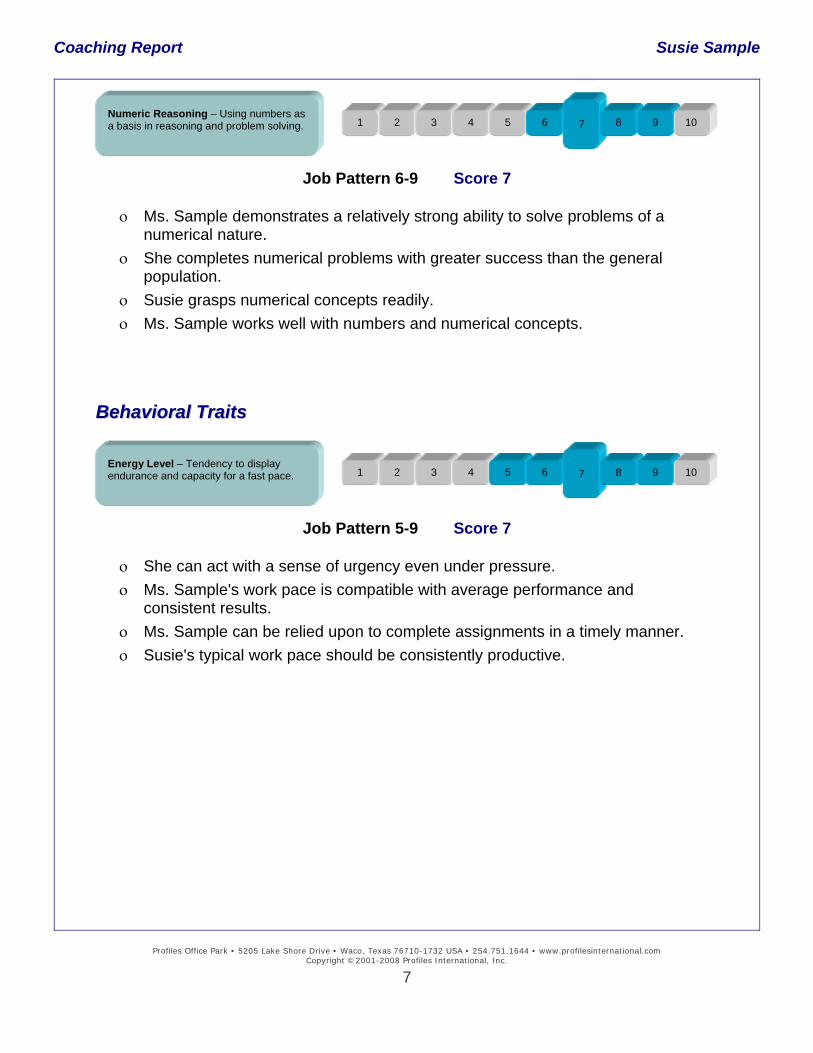
Coaching Report Susie Sample
Numeric Reasoning – Using numbers as a basis in reasoning and problem solving.
1 2 3 4 5 6 7 8 9 10
Job Pattern 6-9 Score 7
ο Ms. Sample demonstrates a relatively strong ability to solve problems of a numerical nature.
ο She completes numerical problems with greater success than the general population.
ο Susie grasps numerical concepts readily. ο Ms. Sample works well with numbers and numerical concepts. BBeehhaavviioorraall TTrraaiittss
Job Pattern 5-9 Score 7
ο She can act with a sense of urgency even under pressure. ο Ms. Sample's work pace is compatible with average performance and
consistent results. ο Ms. Sample can be relied upon to complete assignments in a timely manner. ο Susie's typical work pace should be consistently productive.
Energy Level – Tendency to display endurance and capacity for a fast pace.
1 2 3 4 8 5 6 9 10 7
Profiles Office Park • 5205 Lake Shore Drive • Waco, Texas 76710-1732 USA • 254.751.1644 • www.profilesinternational.com Copyright ©2001-2008 Profiles International, Inc.
7
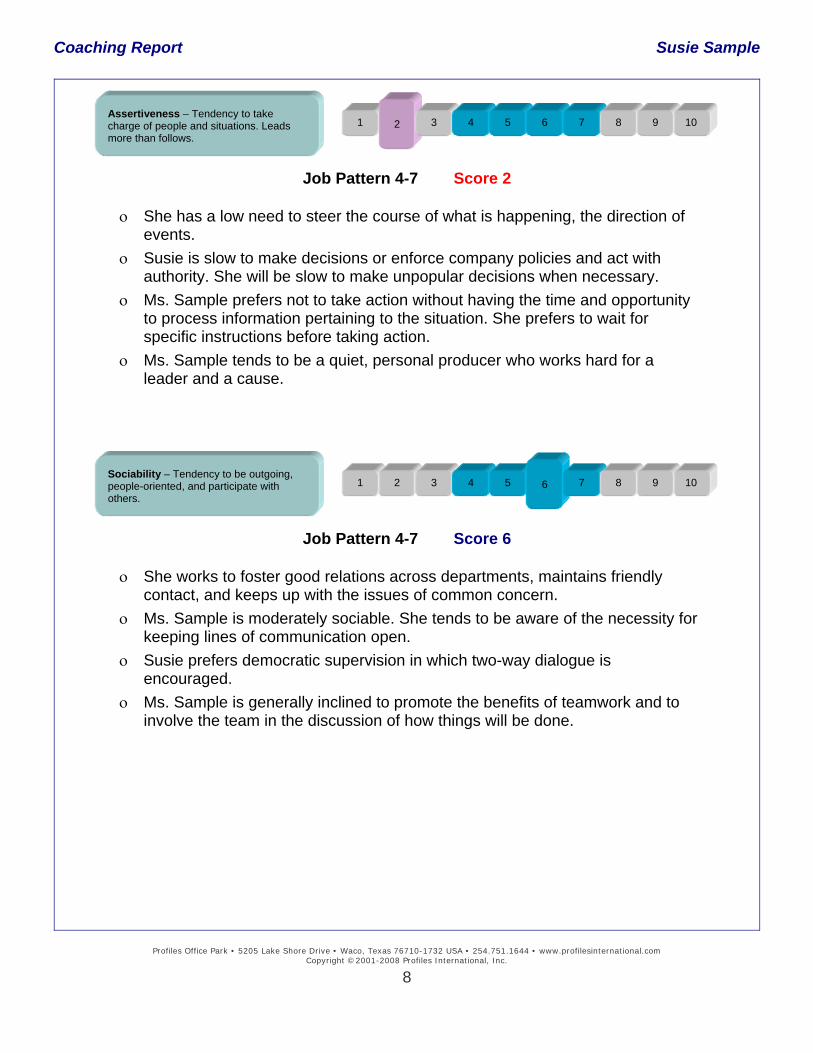
Coaching Report Susie Sample
Assertiveness – Tendency to take charge of people and situations. Leads more than follows.
1 2 3 4 5 6 7 8 9 10
Job Pattern 4-7 Score 2
ο She has a low need to steer the course of what is happening, the direction of events.
ο Susie is slow to make decisions or enforce company policies and act with authority. She will be slow to make unpopular decisions when necessary.
ο Ms. Sample prefers not to take action without having the time and opportunity to process information pertaining to the situation. She prefers to wait for specific instructions before taking action.
ο Ms. Sample tends to be a quiet, personal producer who works hard for a leader and a cause.
Job Pattern 4-7 Score 6
ο She works to foster good relations across departments, maintains friendly contact, and keeps up with the issues of common concern.
ο Ms. Sample is moderately sociable. She tends to be aware of the necessity for keeping lines of communication open.
ο Susie prefers democratic supervision in which two-way dialogue is encouraged.
ο Ms. Sample is generally inclined to promote the benefits of teamwork and to involve the team in the discussion of how things will be done.
Sociability – Tendency to be outgoing, people-oriented, and participate with others.
1 2 3 7 8 4 5 9 10 6
Profiles Office Park • 5205 Lake Shore Drive • Waco, Texas 76710-1732 USA • 254.751.1644 • www.profilesinternational.com Copyright ©2001-2008 Profiles International, Inc.
8

Coaching Report Susie Sample
Manageability – Tendency to follow policies, accept external controls and supervision, and work within the rules.
1 2 3 4 5 6 7 8 9 10
Job Pattern 2-6 Score 6
ο Ms. Sample is friendly, accommodating, and should be fairly easy to manage. ο She should be willing to conform to company policies without feeling any loss
of personal freedom. ο Ms. Sample is typically willing to accept guidance and suggestions from
others. ο Susie demonstrates a moderately positive attitude concerning organizational
constraints and restrictions.
Job Pattern 5-8 Score 9
ο Ms. Sample demonstrates a highly positive attitude concerning risk, change, and unexpected challenges.
ο Ms. Sample has a highly positive attitude regarding changes in policies and procedures.
ο She has a highly positive attitude regarding supervision and external controls. ο Susie's attitude is highly compatible with confronting interpersonal problems
and frustrations.
Attitude – Tendency to have a positive attitude regarding people and outcomes.
1 2 3 4 5 6 7 8 10 9
Profiles Office Park • 5205 Lake Shore Drive • Waco, Texas 76710-1732 USA • 254.751.1644 • www.profilesinternational.com Copyright ©2001-2008 Profiles International, Inc.
9
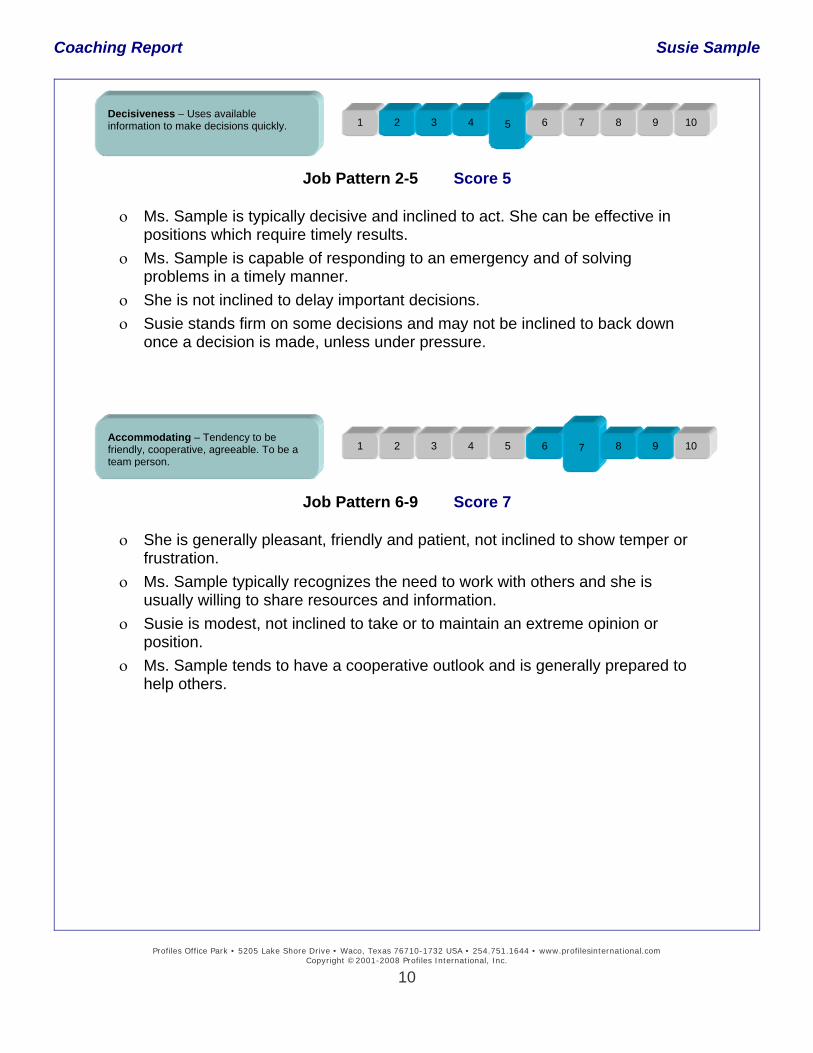
Coaching Report Susie Sample
Decisiveness – Uses available information to make decisions quickly.
1 2 3 4 5 6 7 8 9 10
Job Pattern 2-5 Score 5
ο Ms. Sample is typically decisive and inclined to act. She can be effective in positions which require timely results.
ο Ms. Sample is capable of responding to an emergency and of solving problems in a timely manner.
ο She is not inclined to delay important decisions. ο Susie stands firm on some decisions and may not be inclined to back down
once a decision is made, unless under pressure.
Job Pattern 6-9 Score 7
ο She is generally pleasant, friendly and patient, not inclined to show temper or frustration.
ο Ms. Sample typically recognizes the need to work with others and she is usually willing to share resources and information.
ο Susie is modest, not inclined to take or to maintain an extreme opinion or position.
ο Ms. Sample tends to have a cooperative outlook and is generally prepared to help others.
Accommodating – Tendency to be friendly, cooperative, agreeable. To be a team person.
1 2 3 4 8 5 6 9 10 7
Profiles Office Park • 5205 Lake Shore Drive • Waco, Texas 76710-1732 USA • 254.751.1644 • www.profilesinternational.com Copyright ©2001-2008 Profiles International, Inc.
10
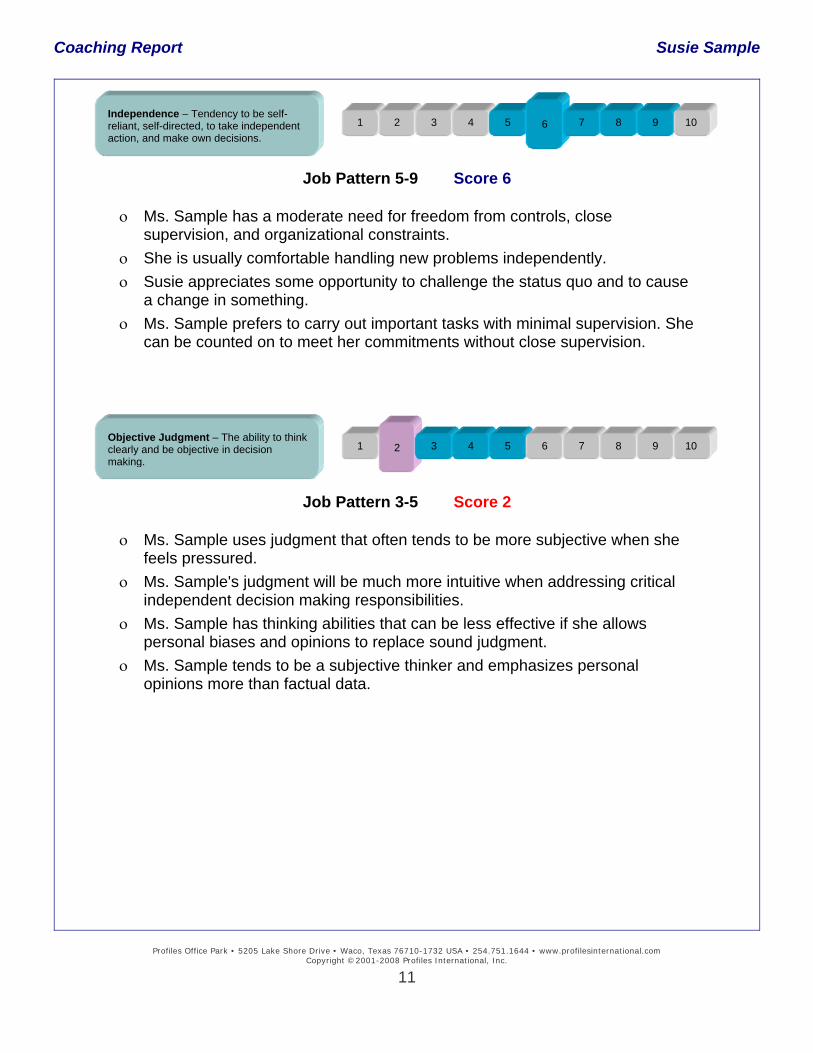
Coaching Report Susie Sample
Independence – Tendency to be self-reliant, self-directed, to take independent action, and make own decisions.
1 2 3 4 5 6 7 8 9 10
Job Pattern 5-9 Score 6
ο Ms. Sample has a moderate need for freedom from controls, close supervision, and organizational constraints.
ο She is usually comfortable handling new problems independently. ο Susie appreciates some opportunity to challenge the status quo and to cause
a change in something. ο Ms. Sample prefers to carry out important tasks with minimal supervision. She
can be counted on to meet her commitments without close supervision.
Objective Judgment – The ability to think clearly and be objective in decision makin
7 8 1 3 4 5 6 9 10 2 g.
Job Pattern 3-5 Score 2
ο Ms. Sample uses judgment that often tends to be more subjective when she feels pressured.
ο Ms. Sample's judgment will be much more intuitive when addressing critical independent decision making responsibilities.
ο Ms. Sample has thinking abilities that can be less effective if she allows personal biases and opinions to replace sound judgment.
ο Ms. Sample tends to be a subjective thinker and emphasizes personal opinions more than factual data.
Profiles Office Park • 5205 Lake Shore Drive • Waco, Texas 76710-1732 USA • 254.751.1644 • www.profilesinternational.com Copyright ©2001-2008 Profiles International, Inc.
11
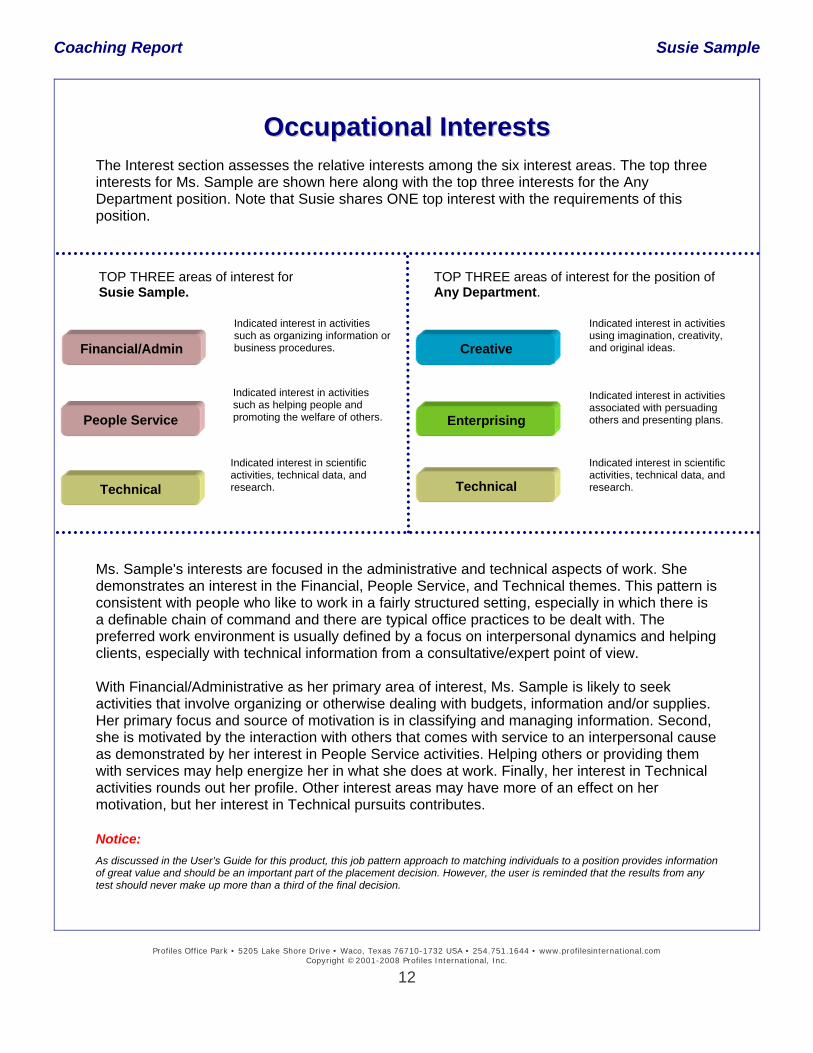
Coaching Report Susie Sample
OOccccuuppaattiioonnaall IInntteerreessttss The Interest section assesses the relative interests among the six interest areas. The top three interests for Ms. Sample are shown here along with the top three interests for the Any Department position. Note that Susie shares ONE top interest with the requirements of this position.
TOP THREE areas of interest for the position of Any Department.
Indicated interest in activities
such as organizing information or business procedures.
Indicated interest in activities using imagination, creativity, and original ideas.
Financial/Admin Creative
Indicated interest in activities such as helping people and promoting the welfare of others.
Indicated interest in activities associated with persuading others and presenting plans.
People Service Enterprising
Indicated interest in scientific activities, technical data, and research.
Indicated interest in scientific activities, technical data, and research.
Technical Technical
Ms. Sample's interests are focused in the administrative and technical aspects of work. She demonstrates an interest in the Financial, People Service, and Technical themes. This pattern is consistent with people who like to work in a fairly structured setting, especially in which there is a definable chain of command and there are typical office practices to be dealt with. The preferred work environment is usually defined by a focus on interpersonal dynamics and helping clients, especially with technical information from a consultative/expert point of view. With Financial/Administrative as her primary area of interest, Ms. Sample is likely to seek activities that involve organizing or otherwise dealing with budgets, information and/or supplies. Her primary focus and source of motivation is in classifying and managing information. Second, she is motivated by the interaction with others that comes with service to an interpersonal cause as demonstrated by her interest in People Service activities. Helping others or providing them with services may help energize her in what she does at work. Finally, her interest in Technical activities rounds out her profile. Other interest areas may have more of an effect on her motivation, but her interest in Technical pursuits contributes. Notice: As discussed in the User’s Guide for this product, this job pattern approach to matching individuals to a position provides information of great value and should be an important part of the placement decision. However, the user is reminded that the results from any test should never make up more than a third of the final decision.
TOP THREE areas of interest for Susie Sample.
Profiles Office Park • 5205 Lake Shore Drive • Waco, Texas 76710-1732 USA • 254.751.1644 • www.profilesinternational.com Copyright ©2001-2008 Profiles International, Inc.
12
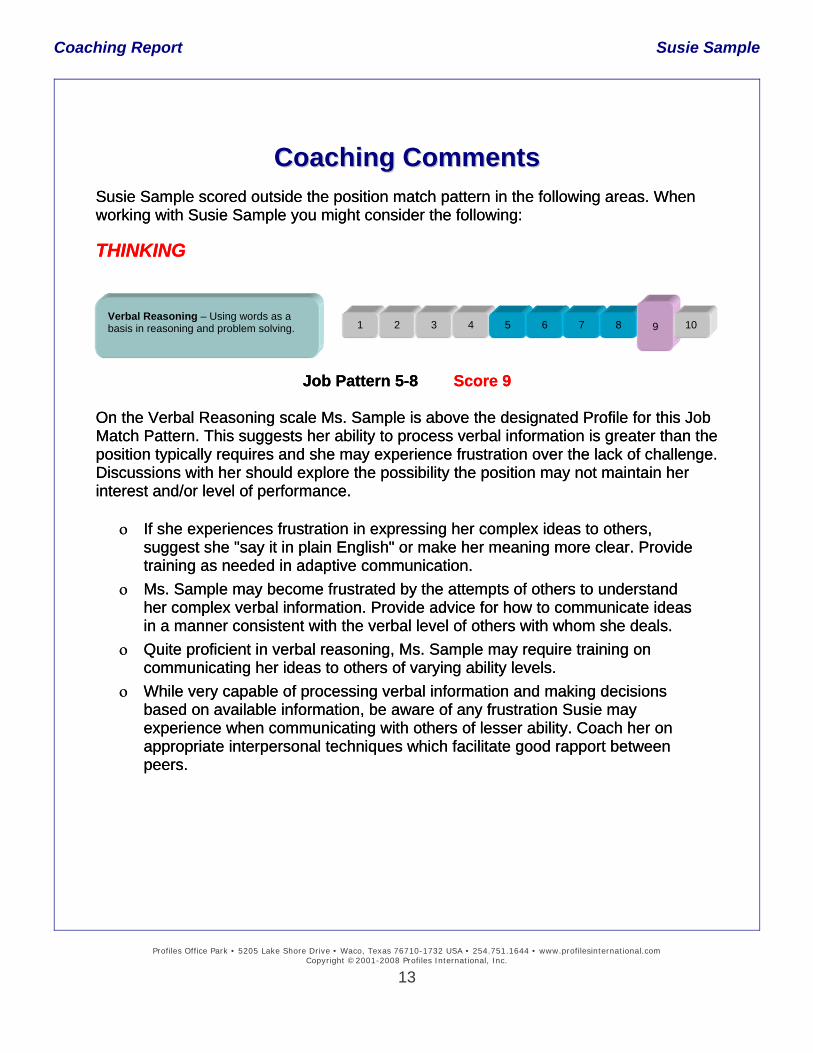
Coaching Report Susie Sample
CCooaacchhiinngg CCoommmmeennttss Susie Sample scored outside the position match pattern in the following areas. When working with Susie Sample you might consider the following: Susie Sample scored outside the position match pattern in the following areas. When working with Susie Sample you might consider the following: THINKING THINKING
Job Pattern 5-8 Score 9 Job Pattern 5-8 Score 9
On the Verbal Reasoning scale Ms. Sample is above the designated Profile for this Job Match Pattern. This suggests her ability to process verbal information is greater than the position typically requires and she may experience frustration over the lack of challenge. Discussions with her should explore the possibility the position may not maintain her interest and/or level of performance.
On the Verbal Reasoning scale Ms. Sample is above the designated Profile for this Job Match Pattern. This suggests her ability to process verbal information is greater than the position typically requires and she may experience frustration over the lack of challenge. Discussions with her should explore the possibility the position may not maintain her interest and/or level of performance. ο If she experiences frustration in expressing her complex ideas to others,
suggest she "say it in plain English" or make her meaning more clear. Provide training as needed in adaptive communication.
ο If she experiences frustration in expressing her complex ideas to others, suggest she "say it in plain English" or make her meaning more clear. Provide training as needed in adaptive communication.
ο Ms. Sample may become frustrated by the attempts of others to understand her complex verbal information. Provide advice for how to communicate ideas in a manner consistent with the verbal level of others with whom she deals.
ο Ms. Sample may become frustrated by the attempts of others to understand her complex verbal information. Provide advice for how to communicate ideas in a manner consistent with the verbal level of others with whom she deals.
ο Quite proficient in verbal reasoning, Ms. Sample may require training on communicating her ideas to others of varying ability levels.
ο Quite proficient in verbal reasoning, Ms. Sample may require training on communicating her ideas to others of varying ability levels.
ο While very capable of processing verbal information and making decisions based on available information, be aware of any frustration Susie may experience when communicating with others of lesser ability. Coach her on appropriate interpersonal techniques which facilitate good rapport between peers.
ο While very capable of processing verbal information and making decisions based on available information, be aware of any frustration Susie may experience when communicating with others of lesser ability. Coach her on appropriate interpersonal techniques which facilitate good rapport between peers.
Verbal Reasoning – Using words as a basis in reasoning and problem solving.
1 2 3 4 5 6 7 8 9 10
Profiles Office Park • 5205 Lake Shore Drive • Waco, Texas 76710-1732 USA • 254.751.1644 • www.profilesinternational.com Copyright ©2001-2008 Profiles International, Inc.
13
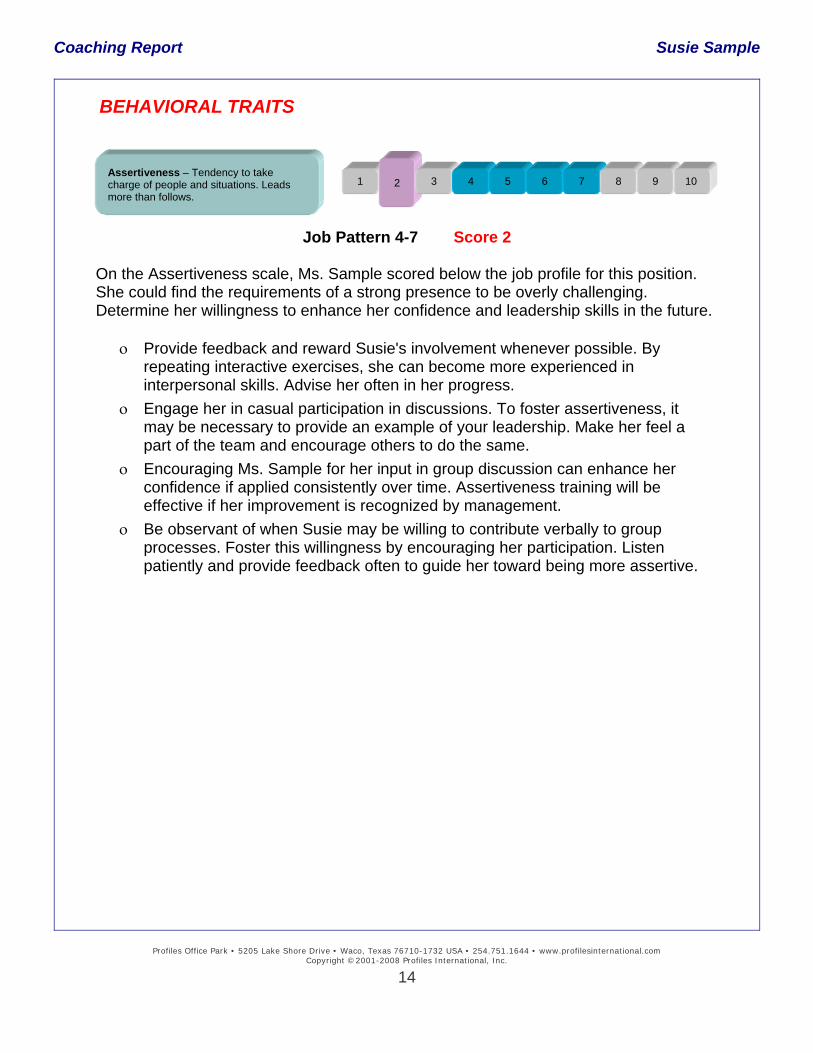
Coaching Report Susie Sample
BEHAVIORAL TRAITS
Job Pattern 4-7 Score 2
On the Assertiveness scale, Ms. Sample scored below the job profile for this position. She could find the requirements of a strong presence to be overly challenging. Determine her willingness to enhance her confidence and leadership skills in the future. ο Provide feedback and reward Susie's involvement whenever possible. By
repeating interactive exercises, she can become more experienced in interpersonal skills. Advise her often in her progress.
ο Engage her in casual participation in discussions. To foster assertiveness, it may be necessary to provide an example of your leadership. Make her feel a part of the team and encourage others to do the same.
ο Encouraging Ms. Sample for her input in group discussion can enhance her confidence if applied consistently over time. Assertiveness training will be effective if her improvement is recognized by management.
ο Be observant of when Susie may be willing to contribute verbally to group processes. Foster this willingness by encouraging her participation. Listen patiently and provide feedback often to guide her toward being more assertive.
Assertiveness – Tendency to take charge of people and situations. Leads more than follows.
1 2 3 4 5 6 7 8 9 10
Profiles Office Park • 5205 Lake Shore Drive • Waco, Texas 76710-1732 USA • 254.751.1644 • www.profilesinternational.com Copyright ©2001-2008 Profiles International, Inc.
14
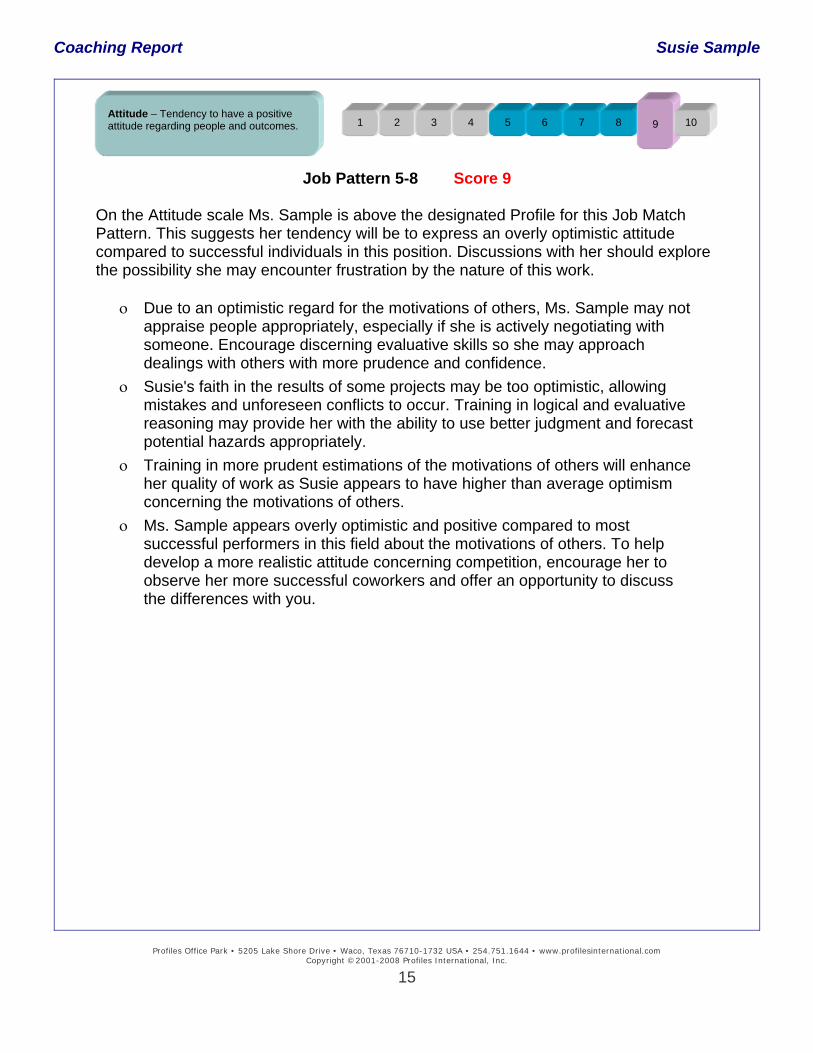
Coaching Report Susie Sample
Job Pattern 5-8 Score 9
On the Attitude scale Ms. Sample is above the designated Profile for this Job Match Pattern. This suggests her tendency will be to express an overly optimistic attitude compared to successful individuals in this position. Discussions with her should explore the possibility she may encounter frustration by the nature of this work. ο Due to an optimistic regard for the motivations of others, Ms. Sample may not
appraise people appropriately, especially if she is actively negotiating with someone. Encourage discerning evaluative skills so she may approach dealings with others with more prudence and confidence.
ο Susie's faith in the results of some projects may be too optimistic, allowing mistakes and unforeseen conflicts to occur. Training in logical and evaluative reasoning may provide her with the ability to use better judgment and forecast potential hazards appropriately.
ο Training in more prudent estimations of the motivations of others will enhance her quality of work as Susie appears to have higher than average optimism concerning the motivations of others.
ο Ms. Sample appears overly optimistic and positive compared to most successful performers in this field about the motivations of others. To help develop a more realistic attitude concerning competition, encourage her to observe her more successful coworkers and offer an opportunity to discuss the differences with you.
Attitude – Tendency to have a positive attitude regarding people and outcomes.
1 2 3 4 5 6 7 8 9 10
Profiles Office Park • 5205 Lake Shore Drive • Waco, Texas 76710-1732 USA • 254.751.1644 • www.profilesinternational.com Copyright ©2001-2008 Profiles International, Inc.
15
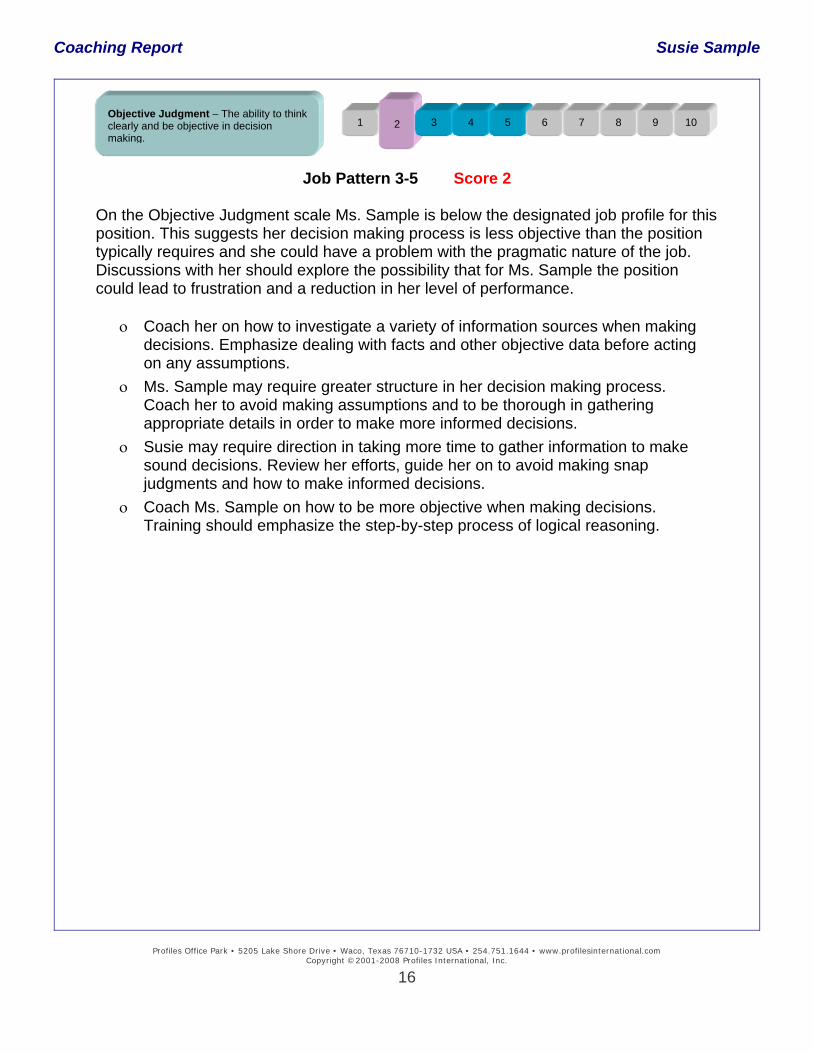
Coaching Report Susie Sample
Job Pattern 3-5 Score 2
On the Objective Judgment scale Ms. Sample is below the designated job profile for this position. This suggests her decision making process is less objective than the position typically requires and she could have a problem with the pragmatic nature of the job. Discussions with her should explore the possibility that for Ms. Sample the position could lead to frustration and a reduction in her level of performance. ο Coach her on how to investigate a variety of information sources when making
decisions. Emphasize dealing with facts and other objective data before acting on any assumptions.
ο Ms. Sample may require greater structure in her decision making process. Coach her to avoid making assumptions and to be thorough in gathering appropriate details in order to make more informed decisions.
ο Susie may require direction in taking more time to gather information to make sound decisions. Review her efforts, guide her on to avoid making snap judgments and how to make informed decisions.
ο Coach Ms. Sample on how to be more objective when making decisions. Training should emphasize the step-by-step process of logical reasoning.
Objective Judgment – The ability to think clearly and be objective in decision making.
1 2 3 4 5 6 7 8 9 10
Profiles Office Park • 5205 Lake Shore Drive • Waco, Texas 76710-1732 USA • 254.751.1644 • www.profilesinternational.com Copyright ©2001-2008 Profiles International, Inc.
16
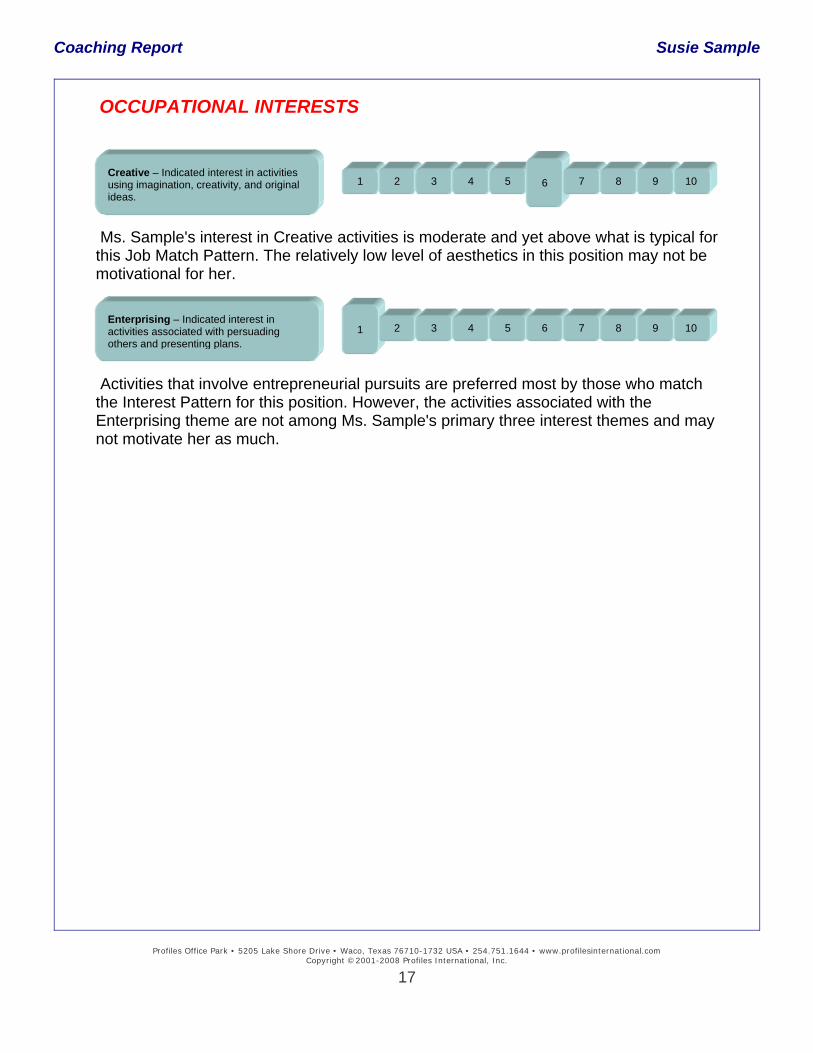
Coaching Report Susie Sample
Profiles Office Park • 5205 Lake Shore Drive • Waco, Texas 76710-1732 USA • 254.751.1644 • www.profilesinternational.com Copyright ©2001-2008 Profiles International, Inc.
17
OCCUPATIONAL INTERESTS Ms. Sample's interest in Creative activities is moderate and yet above what is typical for this Job Match Pattern. The relatively low level of aesthetics in this position may not be motivational for her. Activities that involve entrepreneurial pursuits are preferred most by those who match the Interest Pattern for this position. However, the activities associated with the Enterprising theme are not among Ms. Sample's primary three interest themes and may not motivate her as much.
Creative – Indicated interest in activities using imagination, creativity, and original ideas.
1 2 3 4 5 7 8 9 10 6
Enterprising – Indicated interest in activities associated with persuading others and presenting plans.
62 3 4 5 7 8 9 10 1
CONFIDENTIAL
SUCCESSION PLANNING REPORT Thursday, May 8, 2008
Susie Sample
Profiles International 5207 Lake Shore Drive Waco, TX 76710 254-751-1644
Profiles Office Park • 5205 Lake Shore Drive • Waco, Texas 76710-1732 USA • 254.751.1644 • www.profilesinternational.com
Copyright ©2001-2008 Profiles International, Inc.
Building and Retaining the High-Performance Company
Succession Planning Report Susie Sample
SSuucccceessssiioonn PPllaannnniinngg Career selection, or succession planning, is important to employee satisfaction as well as to positive organizational growth. Knowing where people may fit in the future can also help you design your training for them. Profiles International, Inc. has developed customized Job Match Patterns for several positions in the organization. This list shows how Susie Sample matches the Job Match Patterns for these different positions. The overall percent match reflects her Thinking Style, Occupational Interests, and Behavioral Traits combined. You should select appropriate positions from the Job Match Patterns listed here and generate reports for Susie specific to those positions. These reports will provide very detailed information about Susie to include coaching comments and interviewing ideas for succession planning. Please note, this report does not measure or consider the candidate’s education, training, or experience and does not indicate job skill requirements. Position Job Match Percent
Any Department 83%
NOTICE:
As discussed in the User’s Guide for this product, this job pattern approach to matching individuals to a position provides information of great value and should be an important part of the placement decision. However, the user is reminded that the results from any test should never make up more than a third of the final decision.
Profiles Office Park • 5205 Lake Shore Drive • Waco, Texas 76710-1732 USA • 254.751.1644 • www.profilesinternational.com Copyright ©2001-2008 Profiles International, Inc.
1
CONFIDENTIAL
JOB PROFILE SUMMARY REPORT Thursday, May 8, 2008
Susie Sample Any Department
Profiles International 5207 Lake Shore Drive Waco, TX 76710 254-751-1644
Profiles Office Park • 5205 Lake Shore Drive • Waco, Texas 76710-1732 USA • 254.751.1644 • www.profilesinternational.com
Copyright ©2001-2008 Profiles International, Inc.
Building and Retaining the High-Performance Company
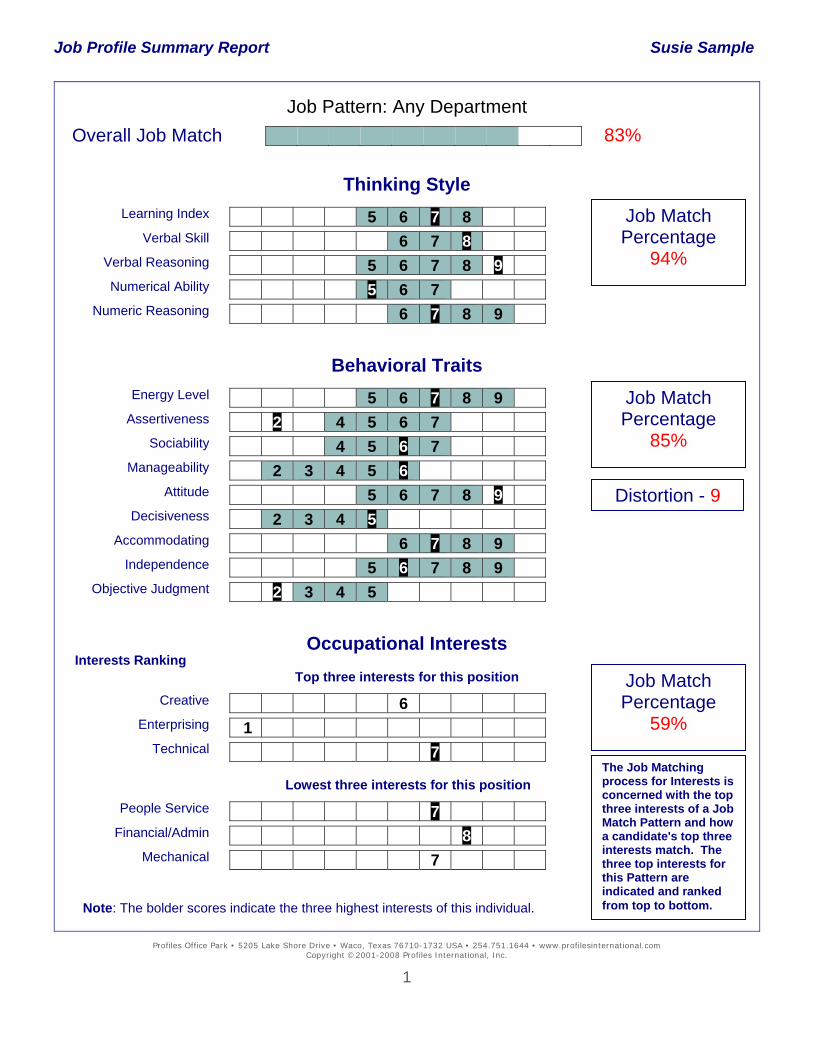
Job Profile Summary Report Susie Sample
Job Pattern: Any Department
Profiles Office Park • 5205 Lake Shore Drive • Waco, Texas 76710-1732 USA • 254.751.1644 • www.profilesinternational.com Copyright ©2001-2008 Profiles International, Inc.
83%Overall Job Match
Thinking Style
Job Match Percentage
94%
Learning Index 5 6 7 8
Verbal Skill 6 7 8
5 6 7 8 9
5 6 7
6 7 8 9
Verbal Reasoning
Numerical Ability
Numeric Reasoning
Behavioral Traits
Job Match Percentage
85%
Energy Level 5 6 7 8 9
Assertiveness 2 4 5 6 7
Sociability 4 5 6 7
Manageability 2 3 4 5 6
Attitude Distortion - 9 5 6 7 8 9
Decisiveness 2 3 4 5
Accommodating 6 7 8 9
Independence 5 6 7 8 9
2 3 4 5
Objective Judgment
Occupational Interests
Interests Ranking Top three interests for this position Job Match
Percentage
Creative 6 59%
Enterprising 1
7
Technical The Job Matching process for Interests is concerned with the top three interests of a Job Match Pattern and how a candidate's top three interests match. The three top interests for this Pattern are indicated and ranked from top to bottom.
Lowest three interests for this position
People Service 7
Financial/Admin 8
7
Mechanical
Note: The bolder scores indicate the three highest interests of this individual.
1
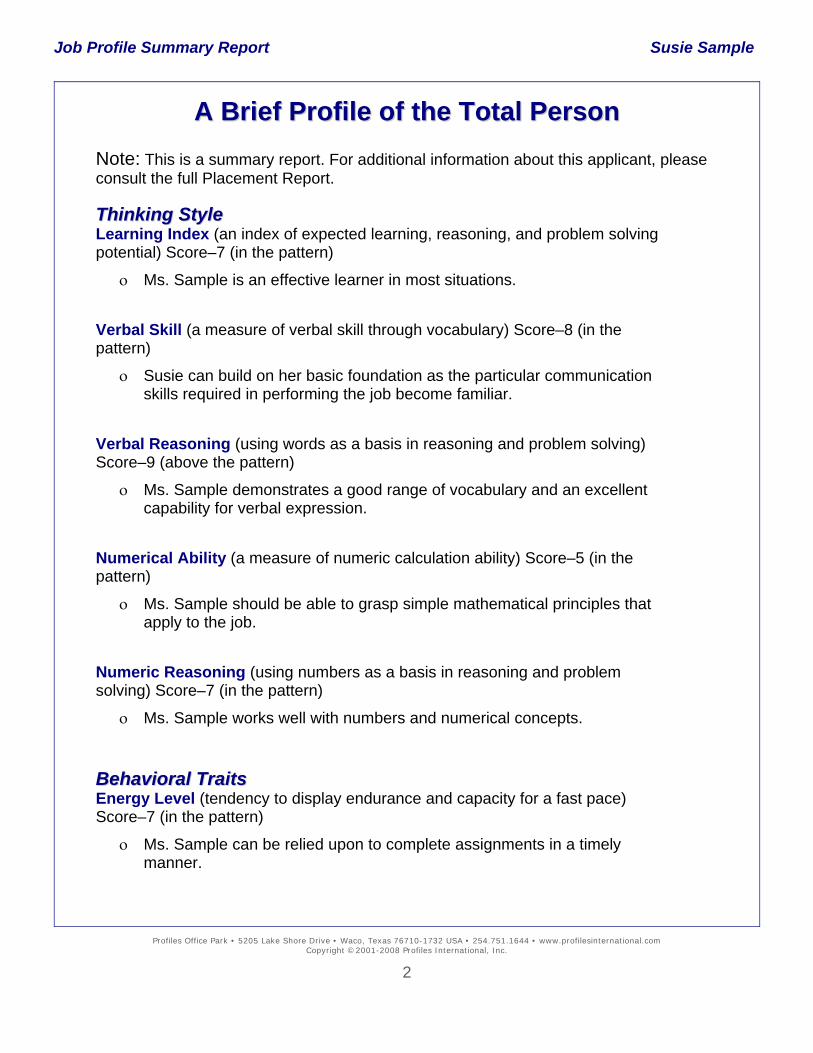
Job Profile Summary Report Susie Sample
Profiles Office Park • 5205 Lake Shore Drive • Waco, Texas 76710-1732 USA • 254.751.1644 • www.profilesinternational.com Copyright ©2001-2008 Profiles International, Inc.
AA BBrriieeff PPrrooffiillee ooff tthhee TToottaall PPeerrssoonn Note: This is a summary report. For additional information about this applicant, please consult the full Placement Report.
TThhiinnkkiinngg SSttyyllee Learning Index (an index of expected learning, reasoning, and problem solving potential) Score–7 (in the pattern) ο Ms. Sample is an effective learner in most situations.
Verbal Skill (a measure of verbal skill through vocabulary) Score–8 (in the pattern) ο Susie can build on her basic foundation as the particular communication
skills required in performing the job become familiar.
Verbal Reasoning (using words as a basis in reasoning and problem solving) Score–9 (above the pattern) ο Ms. Sample demonstrates a good range of vocabulary and an excellent
capability for verbal expression.
Numerical Ability (a measure of numeric calculation ability) Score–5 (in the pattern) ο Ms. Sample should be able to grasp simple mathematical principles that
apply to the job.
Numeric Reasoning (using numbers as a basis in reasoning and problem solving) Score–7 (in the pattern) ο Ms. Sample works well with numbers and numerical concepts. BBeehhaavviioorraall TTrraaiittss Energy Level (tendency to display endurance and capacity for a fast pace) Score–7 (in the pattern) ο Ms. Sample can be relied upon to complete assignments in a timely
manner.
2
Job Profile Summary Report Susie Sample
Assertiveness (tendency to take charge of people and situations. Leads more than follows) Score–2 (below the pattern) ο Susie is slow to make decisions, enforce company policies, and act with
authority. She will be slow to make unpopular decisions when necessary.
Sociability (tendency to be outgoing, people-oriented and participate with others) Score–6 (in the pattern) ο She works to foster good relations across departments, maintain friendly
contact, and keep up with the issues of common concern.
Manageability (tendency to follow policies, accept external controls and supervision, and work within the rules) Score–6 (in the pattern) ο Susie demonstrates a moderately positive attitude concerning
organizational constraints and restrictions.
Attitude (tendency to have a positive attitude regarding people and outcomes) Score–9 (above the pattern) ο Ms. Sample demonstrates a highly positive attitude concerning risk,
change and unexpected challenges.
Decisiveness (uses available information to make decisions quickly) Score–5 (in the pattern) ο Ms. Sample is typically decisive and inclined to act. She can be effective
in positions which require timely results.
Accommodating (tendency to be friendly, cooperative, and agreeable; to be a team person) Score–7 (in the pattern) ο Ms. Sample tends to have a cooperative outlook, generally prepared to
help others.
Independence (tendency to be self-reliant, self-directed, to take independent action, and make own decisions) Score–6 (in the pattern) ο Susie appreciates some opportunity to challenge the status quo and to
cause a change in something.
Profiles Office Park • 5205 Lake Shore Drive • Waco, Texas 76710-1732 USA • 254.751.1644 • www.profilesinternational.com Copyright ©2001-2008 Profiles International, Inc.
3
Job Profile Summary Report Susie Sample
Profiles Office Park • 5205 Lake Shore Drive • Waco, Texas 76710-1732 USA • 254.751.1644 • www.profilesinternational.com Copyright ©2001-2008 Profiles International, Inc.
4
Objective Judgment (the ability to think clearly and be objective in decision-making) Score–2 (below the pattern) ο Ms. Sample tends to be a subjective thinker and emphasizes personal
opinions more than factual data. OOccccuuppaattiioonnaall IInntteerreessttss Ms. Sample's interests are focused in the administrative and technical aspects of work. She demonstrates an interest in the Financial, People Service, and Technical themes. This pattern is consistent with people who like to work in a fairly structured setting, especially in which there is a definable chain of command and there are typical office practices to be dealt with. The preferred work environment is usually defined by a focus on interpersonal dynamics and helping clients, especially with technical information from a consultative/expert point of view.
CONFIDENTIAL
INDIVIDUAL REPORT Thursday, May 8, 2008
Susie Sample
Profiles International 5207 Lake Shore Drive Waco, TX 76710 254-751-1644
Profiles Office Park • 5205 Lake Shore Drive • Waco, Texas 76710-1732 USA • 254.751.1644 • www.profilesinternational.com
Copyright ©2001-2008 Profiles International, Inc.
Building and Retaining the High-Performance Company

Profiles Office Park • 5205 Lake Shore Drive • Waco, Texas 76710-1732 USA • 254.751.1644 • www.profilesinternational.com Copyright ©2001-2008 Profiles International, Inc.
AA MMeessssaaggee ttoo SSuussiiee SSaammppllee
Behavioral science has proven that the most successful people are those who know themselves, both their strengths and weaknesses. This knowledge is important to them as they develop the strategies necessary to meet the demands and challenges of achieving success.
The purpose of this report is to help you identify and make full use of your strengths and to help you develop an awareness of any areas that could be limiting your effectiveness. The goal of this report is to help you achieve greater success for yourself.
The report gives you a Profile of the Total Person
• Thinking Style – Learning Index, Verbal Skill, Verbal Reasoning, Numerical Ability, and Numeric Reasoning.
• Behavioral Traits – Energy Level, Assertiveness, Sociability, Manageability, Attitude, Decisiveness, Accommodating, Independence, and Objective Judgment.
• Interests – Enterprising, Financial/Administrative, People Service, Creative, Technical, and Mechanical.
The information in your report can be useful in planning a self-improvement program for your professional development and personal growth.
1
Profiles Office Park • 5205 Lake Shore Drive • Waco, Texas 76710-1732 USA • 254.751.1644 • www.profilesinternational.com Copyright ©2001-2008 Profiles International, Inc.
AA PPrrooffiillee ooff tthhee TToottaall PPeerrssoonn TThhiinnkkiinngg SSttyyllee Learning Index (an index of expected learning, reasoning, and problem solving potential)
ο You handle fairly complex tasks with relative efficiency, demonstrating strong problem solving abilities.
ο You are an effective learner in most situations. ο You generally learn by paying attention to detail and determining how the
information applies to various relevant areas of your work. ο Your understanding and utilization of new information will be better than most
individuals in the general population. Verbal Skill (a measure of verbal skill through vocabulary)
ο You have a sound understanding of everyday communication processes. ο You show strong potential for developing existing skills with communication. ο You can build on your foundation as the particular communication skills required
in performing the job become familiar. ο You should be competent in making analyses involving written and verbal data. Verbal Reasoning (using words as a basis in reasoning and problem solving)
ο You demonstrate a good range of vocabulary and an excellent capability for verbal expression.
ο You communicate with others effectively. ο Information gathering is one of your strengths. ο You learn verbal information more easily than average.
2
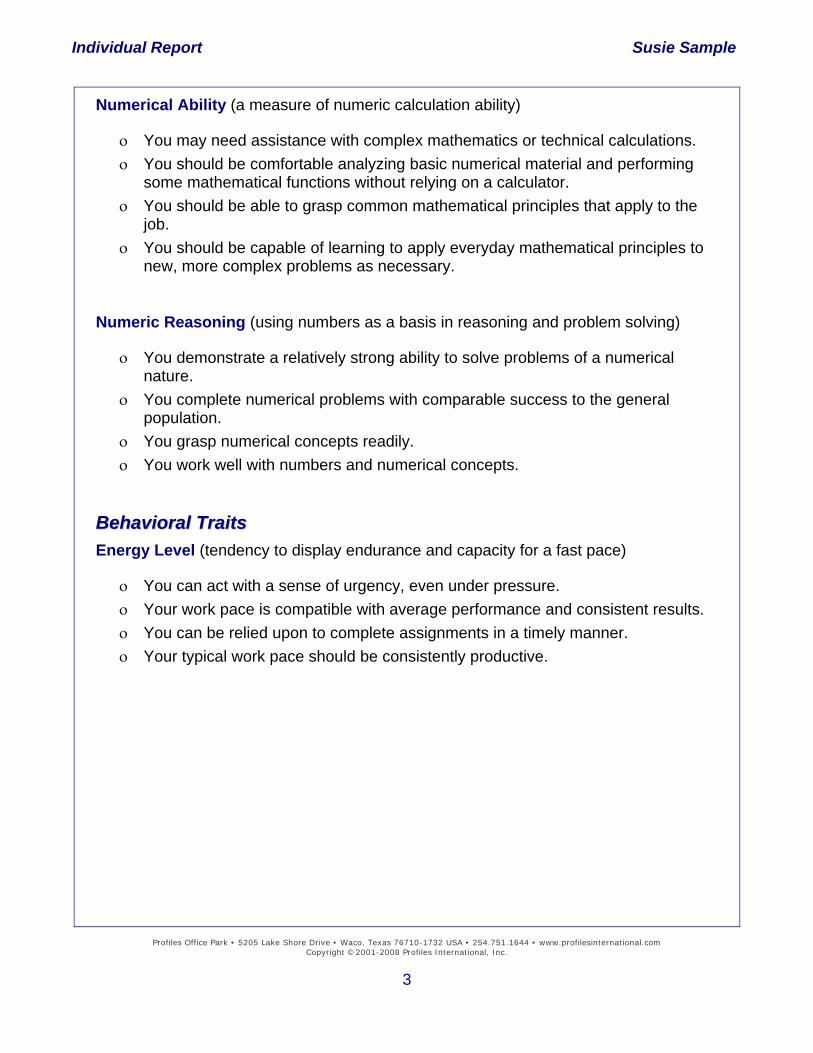
Individual Report Susie Sample
Profiles Office Park • 5205 Lake Shore Drive • Waco, Texas 76710-1732 USA • 254.751.1644 • www.profilesinternational.com
Copyright ©2001-2008 Profiles International, Inc.
Building and Retainin
Numerical Ability (a measure of numeric calculation ability)
ο You may need assistance with complex mathematics or technical calculations. ο You should be comfortable analyzing basic numerical material and performing
some mathematical functions without relying on a calculator. ο You should be able to grasp common mathematical principles that apply to the
job. ο You should be capable of learning to apply everyday mathematical principles to
new, more complex problems as necessary. Numeric Reasoning (using numbers as a basis in reasoning and problem solving)
ο You demonstrate a relatively strong ability to solve problems of a numerical nature.
ο You complete numerical problems with comparable success to the general population.
ο You grasp numerical concepts readily. ο You work well with numbers and numerical concepts.
g the High-Performance Company
BBeehhaavviioorraall TTrraaiittss Energy Level (tendency to display endurance and capacity for a fast pace)
ο You can act with a sense of urgency, even under pressure. ο Your work pace is compatible with average performance and consistent results. ο You can be relied upon to complete assignments in a timely manner. ο Your typical work pace should be consistently productive.
3
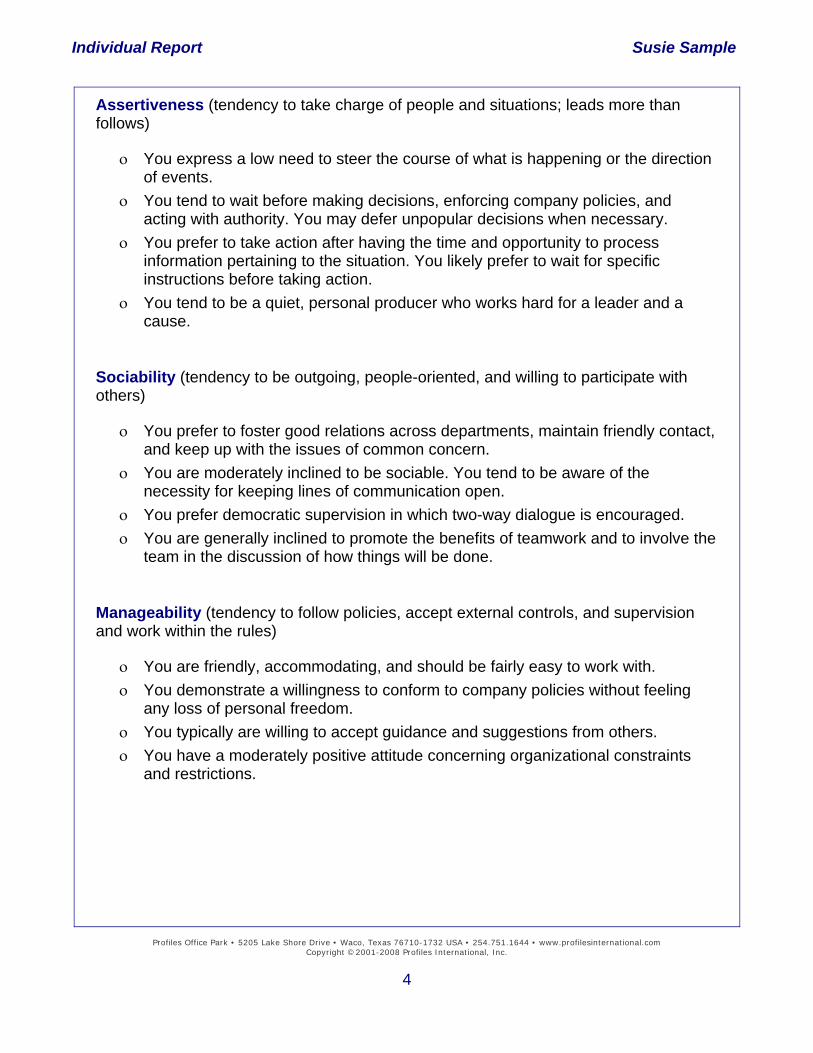
Individual Report Susie Sample
Profiles Office Park • 5205 Lake Shore Drive • Waco, Texas 76710-1732 USA • 254.751.1644 • www.profilesinternational.com
Copyright ©2001-2008 Profiles International, Inc.
Building and Retainin
Assertiveness (tendency to take charge of people and situations; leads more than follows)
ο You express a low need to steer the course of what is happening or the direction of events.
ο You tend to wait before making decisions, enforcing company policies, and acting with authority. You may defer unpopular decisions when necessary.
ο You prefer to take action after having the time and opportunity to process information pertaining to the situation. You likely prefer to wait for specific instructions before taking action.
ο You tend to be a quiet, personal producer who works hard for a leader and a cause.
Sociability (tendency to be outgoing, people-oriented, and willing to participate with others)
ο You prefer to foster good relations across departments, maintain friendly contact,and keep up with the issues of common concern.
ο You are moderately inclined to be sociable. You tend to be aware of the necessity for keeping lines of communication open.
ο You prefer democratic supervision in which two-way dialogue is encouraged. ο You are generally inclined to promote the benefits of teamwork and to involve the
team in the discussion of how things will be done.
g High
the -Performance
ο You demonstrate a willingness to conform to company policies without feeling any loss of personal freedom.
Company ο You typically are willing to accept guidance and suggestions from others.
Manageability (tendency to follow policies, accept external controls, and supervision and work within the rules)
ο You are friendly, accommodating, and should be fairly easy to work with.
ο You have a moderately positive attitude concerning organizational constraints and restrictions.
4
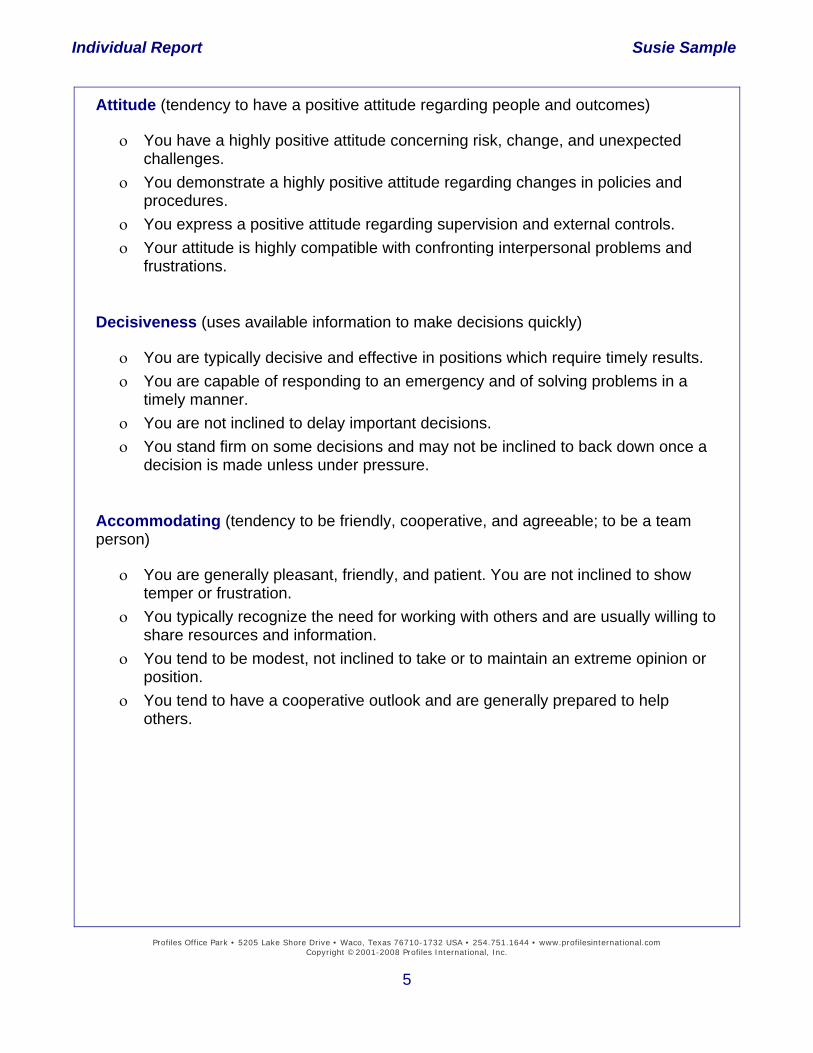
Individual Report Susie Sample
Profiles Office Park • 5205 Lake Shore Drive • Waco, Texas 76710-1732 USA • 254.751.1644 • www.profilesinternational.com
Copyright ©2001-2008 Profiles International, Inc.
Build etainin
Attitude (tendency to have a positive attitude regarding people and outcomes)
ο You have a highly positive attitude concerning risk, change, and unexpected challenges.
ο You demonstrate a highly positive attitude regarding changes in policies and procedures.
ο You express a positive attitude regarding supervision and external controls. ο Your attitude is highly compatible with confronting interpersonal problems and
frustrations. Decisiveness (uses available information to make decisions quickly)
ο You are typically decisive and effective in positions which require timely results. ο You are capable of responding to an emergency and of solving problems in a
timely manner. ο You are not inclined to delay important decisions. ο You stand firm on some decisions and may not be inclined to back down once a
decision is made unless under pressure.
ging and R High-Performance Company
the ο You tend to have a cooperative outlook and are generally prepared to help others.
Accommodating (tendency to be friendly, cooperative, and agreeable; to be a team person)
ο You are generally pleasant, friendly, and patient. You are not inclined to show temper or frustration.
ο You typically recognize the need for working with others and are usually willing to share resources and information.
ο You tend to be modest, not inclined to take or to maintain an extreme opinion or position.
5
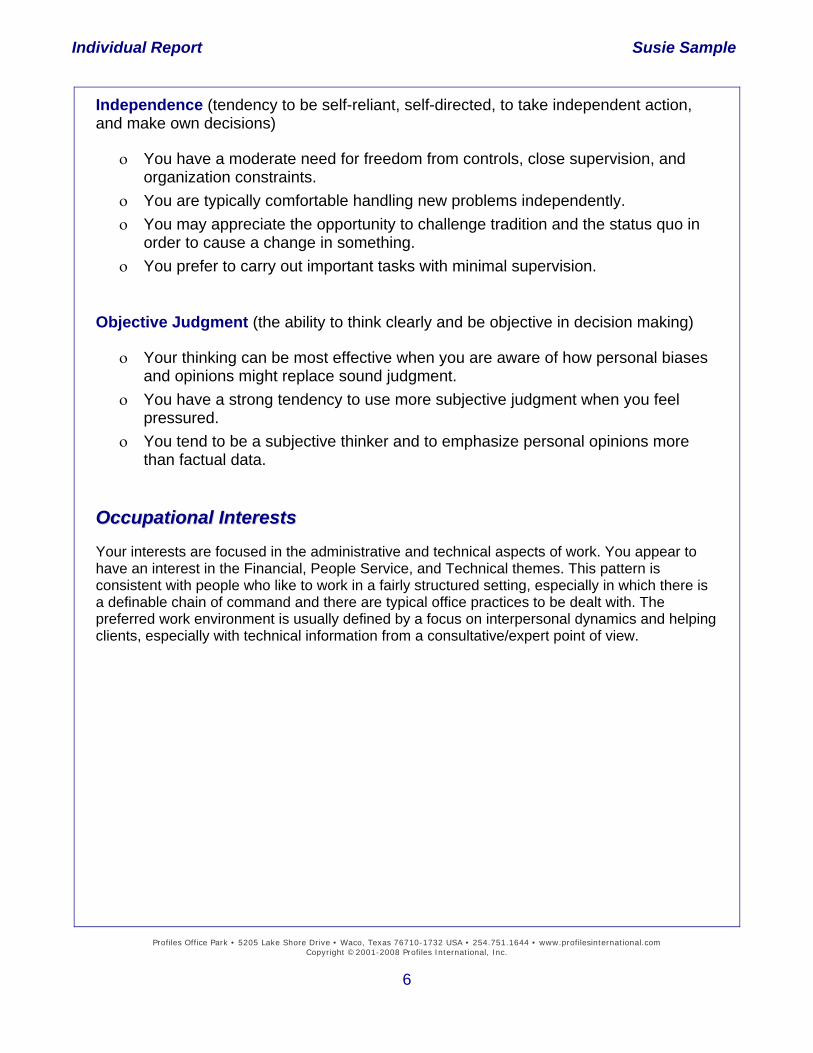
Individual Report Susie Sample
Profiles Office Park • 5205 Lake Shore Drive • Waco, Texas 76710-1732 USA • 254.751.1644 • www.profilesinternational.com
Copyright ©2001-2008 Profiles International, Inc.
6
Building and Retaining the High-Performance Company
Independence (tendency to be self-reliant, self-directed, to take independent action, and make own decisions)
ο You have a moderate need for freedom from controls, close supervision, and organization constraints.
ο You are typically comfortable handling new problems independently. ο You may appreciate the opportunity to challenge tradition and the status quo in
order to cause a change in something. ο You prefer to carry out important tasks with minimal supervision. Objective Judgment (the ability to think clearly and be objective in decision making)
ο Your thinking can be most effective when you are aware of how personal biases and opinions might replace sound judgment.
ο You have a strong tendency to use more subjective judgment when you feel pressured.
ο You tend to be a subjective thinker and to emphasize personal opinions more than factual data.
OOccccuuppaattiioonnaall IInntteerreessttss Your interests are focused in the administrative and technical aspects of work. You appear to have an interest in the Financial, People Service, and Technical themes. This pattern is consistent with people who like to work in a fairly structured setting, especially in which there is a definable chain of command and there are typical office practices to be dealt with. The preferred work environment is usually defined by a focus on interpersonal dynamics and helping clients, especially with technical information from a consultative/expert point of view.
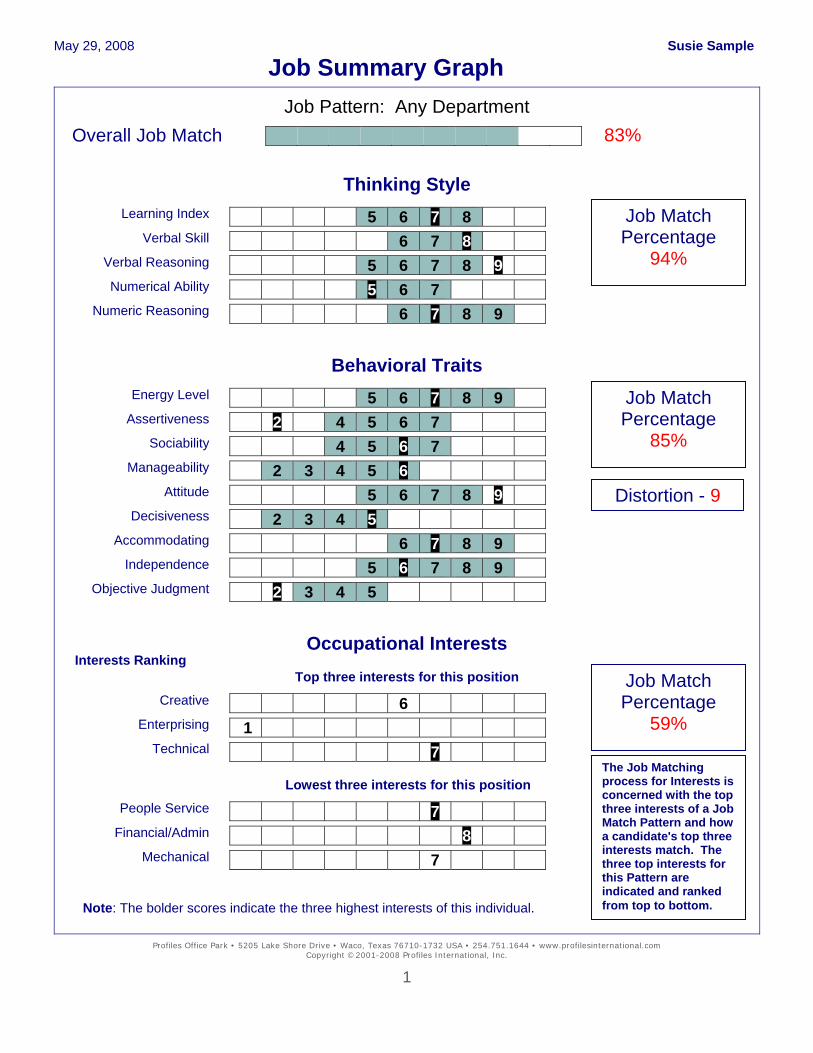
May 29, 2008 Susie Sample
Job Summary Graph Job Pattern: Any Department
Profiles Office Park • 5205 Lake Shore Drive • Waco, Texas 76710-1732 USA • 254.751.1644 • www.profilesinternational.com Copyright ©2001-2008 Profiles International, Inc.
83% Overall Job Match
Thinking Style
Job Match Percentage
94%
Learning Index 5 6 7 8
Verbal Skill 6 7 8
5 6 7 8 9
5 6 7
6 7 8 9
Verbal Reasoning
Numerical Ability
Numeric Reasoning
Behavioral Traits
Job Match Percentage
85%
Energy Level 5 6 7 8 9
Assertiveness 2 4 5 6 7
Sociability 4 5 6 7
Manageability 2 3 4 5 6
Attitude Distortion - 9 5 6 7 8 9
Decisiveness 2 3 4 5
Accommodating 6 7 8 9
Independence 5 6 7 8 9
2 3 4 5
Objective Judgment
Occupational Interests
Interests Ranking Top three interests for this position Job Match
Percentage
Creative 6 59%
Enterprising 1
7
Technical The Job Matching process for Interests is concerned with the top three interests of a Job Match Pattern and how a candidate's top three interests match. The three top interests for this Pattern are indicated and ranked from top to bottom.
Lowest three interests for this position
People Service 7
Financial/Admin 8
7
Mechanical
Note: The bolder scores indicate the three highest interests of this individual.
1
The ProfileXT® Technical Manual
References
Alexander, E.R. & Wilkins, R.D. (1982). Performance rating validity: The relationship of objective and subjective measure of performance. Group and Organization Studies, 7, 485-498.
Arvey, R.D. (1979). Fairness in selecting employees. Reading, MA: Addison-Wesley. Barrick, M.R. & Mount, M.K. (1991). The big five personality dimensions and job performance. Personnel Psychology, 44,1-26. Bourdeau, J. (1998). Employment testing manual. Boston, MA: Warren, Gorham & Lamont. Cohen, J. (1988). Statistical power analysis for the behavioral sciences. Hillsdale, NJ: Lawrence Erlbaum. Crocker, L. & Algina, J. (1986). Introduction to classical & modern test theory. Orlando, FL: Holt, Rinehart, and Winston, Inc. Cronbach, L.J. (1984). Essentials of psychological testing (4th edition). San Francisco: Harper & Row. Day, D.V. & Silverman, S.B. (1989). Personality and job performance: Evidence of incremental validity. Personnel Psychology, 42, 25-35. Edens, J.F. (2004). Effects of response distortion on the assessment of divergent facets of psychopathy. Assessment, Vol. 11, No. 1 (109-112). Sage Publications. Field, A.P. (1999). A bluffer’s guide to meta-analysis I: Correlations. Newsletter of the Mathematical, Statistical, and Computing Section of the British Psychological Society, Vol. 7, No. 1. (19991), pp. 16-25. Ghiselli, E.E., (1973). The validity of aptitude tests in personnel selection. Personnel Psychology, 26, 461-477. Goldenberg, S. (1992). Thinking Methodologically. New York: Harper Collins. Gordon, L.V. (1978). Gordon personal profile – Inventory manual. New York: Harcourt Brace Jovanovich. Gottfredson, G.D. & Holland, J.L. (1989). Dictionary of Holland occupational codes (2nd edition). Odessa, FL: Psychological Assessment Resources. Guilford, J.P. & Zimmerman, W.S. (1978). The Guilford-Zimmerman temperament survey: Manual of instructions and interpretations. Beverly Hills, CA: Sheridan Psychological Services, Inc. Guilford, J.P. & Zimmerman, W.S. (1976). The Guilford-Zimmerman temperament survey handbook. San Diego, CA: EDITS. Heneman, R.L. (1986). The relationship between supervisory ratings and results-oriented Measures of performance: A meta-analysis. Personnel Psychology, 39, 811-826. Hogan, R. (1991). Personality and Personality Measurement. M. Dunnette and L. Hough (Eds.) Handbook of Industrial and Organizational Psychology (2nd edition). Palo Alto, CA: Consulting Psychologists Press.
©2008, Profiles International, Inc., Waco, Texas

The ProfileXT® Technical Manual
©2008, Profiles International, Inc., Waco, Texas
Holland, J.L. (1970). Vocational preference inventory manual. Palo Alto, CA: Consulting Psychologists Press. Holland, J.L. (1985a). Making vocational choices: A theory of vocational personalities and work environments. Odess, FL: Psychological Assessment Resources. Holland, J.L. (1985b). The vocational preference inventory. Odessa, FL: Psychological Assessment Resources. Holland, J.L. (1994). The self-directed search. Odessa, FL: Psychological Assessment Resources. Hunter, J.E. & Schmidt, F.L. (2004). Methods of meta-analysis: Correcting error and bias in Research findings (2nd edition). Newbury Park, CA: Sage. Hunter, J.E. & Hunter, R.F. (1984). Validity and utility of alternative predictors of job performance. Psychological Bulletin, 96, 72098. Terman, L.M. & Merrill, M.A. (1960). Stanford-Binet intelligence scale: Manual for the third Revision, Form L-M. Boston, MA: Houghton Mifflin. Thurstone, L.L. (1938). Primary mental abilities: Psychometric monographs, No. 1. Chicago, IL: U. of Chicago Press. U.S. Department of Labor (1977). Dictionary of occupational titles (4th edition). Washington, DC: U.S. Government Printing Office. U.S. Department of Labor (1982). Dictionary of occupational titles (4th edition supplement, 1982). Washington, DC: U.S. Government Printing Office. U.S. Department of Labor (1986). Dictionary of occupational titles (4th edtion supplement, 1986). Washington, DC: U.S. Government Printing Office. U.S. Department of Labor (2000). The nation’s new resource of occupational information. Retrieved July 20, 2000 from: http://www.doleta.gov/programs/onet. U.S. Department of Labor, Employment and Training Administration (1999). Testing and Assessment: An employer’s guide to good practices. Washington, DC: U.S. Printing Press. Vineberg, R. & Joyner, J.H. (1982). Prediction of job performance: Review of military studies. Alexandria, VA: Human Resources Research Organization. Wechsler, David. (1944). Measurement of adult intelligence (3rd edition). Baltimore, MD: Williams & Wilkins. Wechsler, D. (1958). The measure of adult intelligence (4th edition). Baltimore, MD: Williams & Wilkins.