Embed Size (px)
Citation preview
2009
FOR THE YEAR ENDING DECEMBER 31, 2009
I N N E W J E R S E Y
New Jersey State Police
Uniform Crime Reporting Unit
BIASINCIDENTSBIASINCIDENTS
TWENTY-SECOND ANNUALBIAS INCIDENT OFFENSE REPORT
2009
Honorable Paula T. DowAttorney GeneralState of New Jersey
Colonel Joseph R. FuentesSuperintendentNew Jersey State Police
Major James S. BeshadaCommanding OfficerIdentification and Information Technology SectionNew Jersey State Police
Chief Eric MasonCranford Township Police DepartmentPresidentNew Jersey Association of Chiefs of Police
Prepared by:
State of New JerseyDepartment of Law and Public SafetyDivision of State PoliceUniform Crime Reporting Unit
— Bias Incident Sumary — — Bias Incident Sumary —10
INTRODUCTION
Crimes motivated by hate and bias tend to erode the basic fabric of society. Bias incidents having a racial, religious,ethnic, sexual or gender component as well as crimes against individuals with a handicap, manifest themselves in a widespectrum of criminal activities. These bias incidents jeopardize the active and open pursuit of freedom and opportunity.They attack our citizens based on their race, religion, ethnic heritage, sexual orientation, handicap, or gender. Closelylinked to such heritage are individual values, beliefs, and identities.
Realizing that no agency within the state was collecting complete data on bias incidents, a broad-based Ad Hoccommittee was created to develop a comprehensive statewide reporting system. As a result of the committee’srecommendation, Attorney General Executive Directive No. 1987-3 was issued mandating all New Jersey law enforcementagencies begin reporting bias incident offenses to the Division of State Police, Uniform Crime Reporting Unit on a monthlybasis effective January 1, 1988. On August 15, 1996, legislation was enacted which enhanced the state’s definition ofa bias incident to include crimes that are gender or handicap-motivated.
The directive was instituted to capture vital data in an effort to identify the problem. This information permits properevaluation of progress in preventing bias crime and assist with necessary planning for the future.
This twenty-second annual publication concerning bias crimes contains comparisons to the previous year’s statistics.The published statistics and graphs are the result of data submitted by the police community of New Jersey.
Hopefully, the information contained in this publication will be of value to various segments of society and serve itsintended purpose.
BIAS INCIDENT BY MONTH2008/2009
— Bias Incident Sumary — — Bias Incident Sumary —8
State of New JerseyOFFICE OF THE ATTORNEY GENERAL
CHRIS CHRISTIE DEPARTMENT OF LAW AND PUBLIC SAFETY PAULA T. DOWGovernor P.O. BOX 080 Attorney General
TRENTON, NJ 08625-0080KIM GUADAGNO
Lt. Governor
HUGHES JUSTICE COMPLEX • TELEPHONE: (609) 292-4925 • FAX: (609) 292-3508
New Jersey Is An Equal Opportunity Employer • Printed on Recycled Paper and Recyclable
The Honorable Chris ChristieGovernor of the State of New Jersey
Honorable Members of the Senate andAssembly of the State of New Jersey
Dear Governor and Members of the Legislature:
Pursuant to the Attorney General's Executive Directive 1987-3, I herewith submit for yourinformation and review the twenty-second annual report on bias incidents in New Jersey. Theannual report is based on the bias incident reports submitted to the New Jersey Uniform CrimeReporting System by every New Jersey law enforcement agency for the year 2009.
It would have been impossible to complete this report without the cooperation of New Jersey lawenforcement agencies. It is with appreciation to these dedicated public servants, and in the interestof developing strategies for identifying and addressing bias-motivated crimes, that this report issubmitted.
Respectfully,
Paula T. DowAttorney General of New Jersey
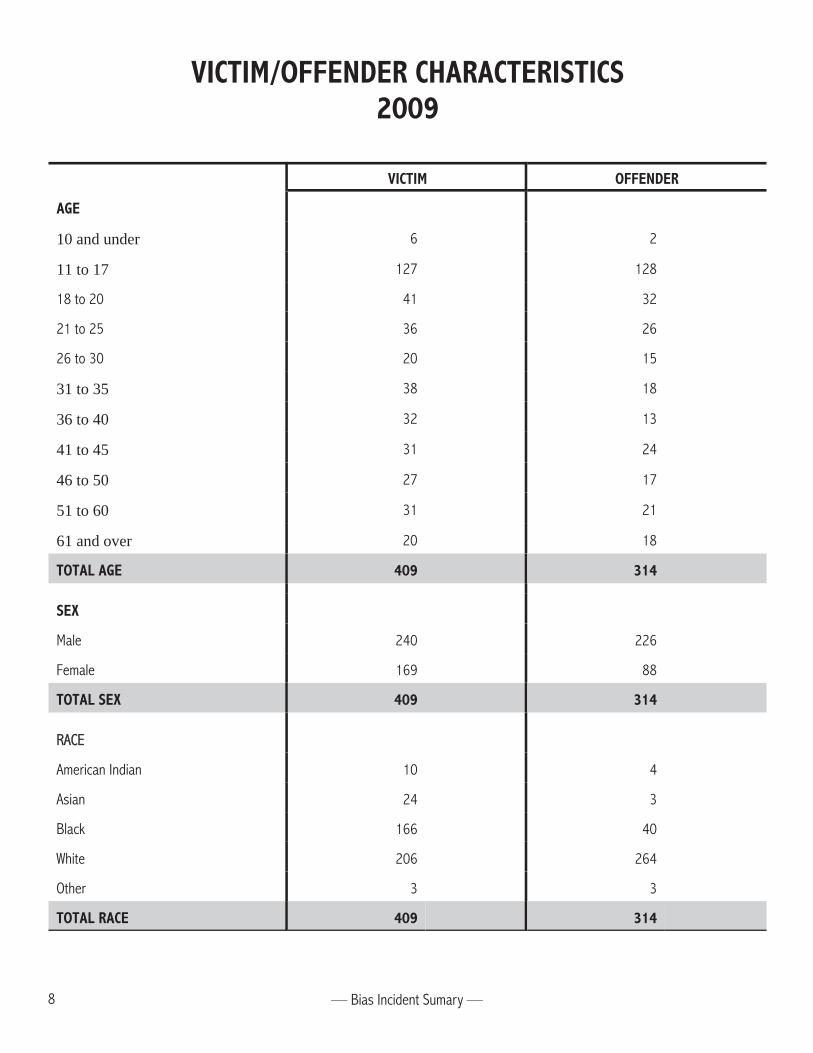
VICTIM/OFFENDER CHARACTERISTICS2009
VICTIM OFFENDER
AGE
10 and under 6 2
11 to 17 127 128
18 to 20 41 32
21 to 25 36 26
26 to 30 20 15
31 to 35 38 18
36 to 40 32 13
41 to 45 31 24
46 to 50 27 17
51 to 60 31 21
61 and over 20 18
TOTAL AGE 409 314
SEX
Male 240 226
Female 169 88
TOTAL SEX 409 314
RRACE
American Indian 10 4
Asian 24 3
Black 166 40
White 206 264
Other 3 3
TOTAL RACE 409 314
— Bias Incident Sumary — — Bias Incident Sumary —6
OFFICE OF THE ATTORNEY GENERALCHRIS CHRISTIE DEPARTMENT OF LAW AND PUBLIC SAFETY PAULA T. DOW
Governor DIVISION OF STATE POLICE Attorney GeneralPOST OFFICE BOX 7068
KIM GUADAGNO WEST TRENTON NJ 08628-0068 COLONEL JOSEPH R. FUENTESLt. Governor (609) 882-2000 Superintendent
"An Internationally Accredited Agency"
New Jersey Is An Equal Opportunity EmployerPrinted on Recycled Paper and Recyclable
The Honorable Paula T. DowAttorney GeneralState of New JerseyHughes Justice ComplexTrenton, New Jersey
Dear Attorney General Dow:
Pursuant to the Attorney General's Executive Directive 1987-3, the twenty-second annual report onbias incidents in New Jersey is submitted. This report contains statistics related to bias incidents.All information is based on bias incident reports submitted to the New Jersey Uniform CrimeReporting System by every New Jersey law enforcement agency for the year 2009. The reportcontains comparisons and analyses between 2008 and 2009 data.
This report could not have been realized without the cooperation of all New Jersey law enforcementagencies. It is being forwarded for your information and presentation to the Governor and membersof the Legislature.
Respectfully,
Joseph R. FuentesColonelSuperintendent
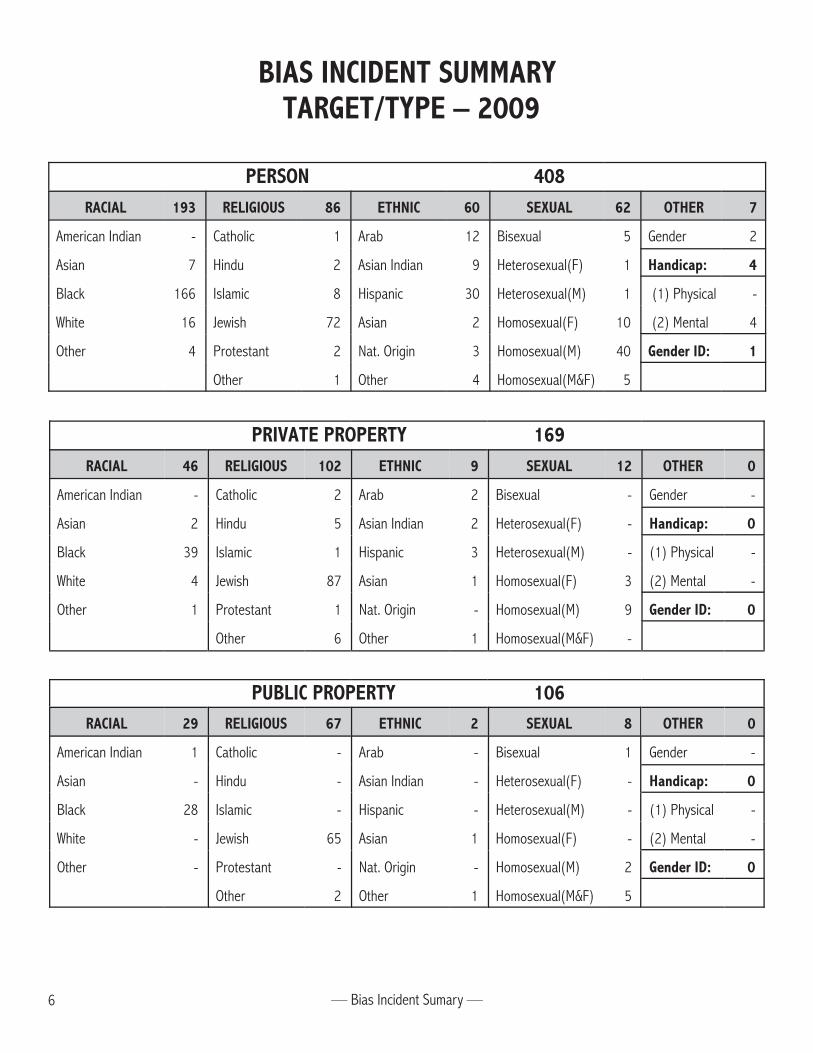
BIAS INCIDENT SUMMARY TARGET/TYPE – 2009
PERSON 408RACIAL 193 RELIGIOUS 86 ETHNIC 60 SEXUAL 62 OTHER 7
American Indian - Catholic 1 Arab 12 Bisexual 5 Gender 2
Asian 7 Hindu 2 Asian Indian 9 Heterosexual(F) 1 Handicap: 4
Black 166 Islamic 8 Hispanic 30 Heterosexual(M) 1 (1) Physical -
White 16 Jewish 72 Asian 2 Homosexual(F) 10 (2) Mental 4
Other 4 Protestant 2 Nat. Origin 3 Homosexual(M) 40 Gender ID: 1
Other 1 Other 4 Homosexual(M&F) 5
PRIVATE PROPERTY 169RACIAL 46 RELIGIOUS 102 ETHNIC 9 SEXUAL 12 OTHER 0
American Indian - Catholic 2 Arab 2 Bisexual - Gender -
Asian 2 Hindu 5 Asian Indian 2 Heterosexual(F) - Handicap: 0
Black 39 Islamic 1 Hispanic 3 Heterosexual(M) - (1) Physical -
White 4 Jewish 87 Asian 1 Homosexual(F) 3 (2) Mental -
Other 1 Protestant 1 Nat. Origin - Homosexual(M) 9 Gender ID: 0
Other 6 Other 1 Homosexual(M&F) -
PUBLIC PROPERTY 106RACIAL 29 RELIGIOUS 67 ETHNIC 2 SEXUAL 8 OTHER 0
American Indian 1 Catholic - Arab - Bisexual 1 Gender -
Asian - Hindu - Asian Indian - Heterosexual(F) - Handicap: 0
Black 28 Islamic - Hispanic - Heterosexual(M) - (1) Physical -
White - Jewish 65 Asian 1 Homosexual(F) - (2) Mental -
Other - Protestant - Nat. Origin - Homosexual(M) 2 Gender ID: 0
Other 2 Other 1 Homosexual(M&F) 5
— Bias Incident Sumary — — Bias Incident Sumary —4 1
BIAS INCIDENT STATISTICAL SUMMARY
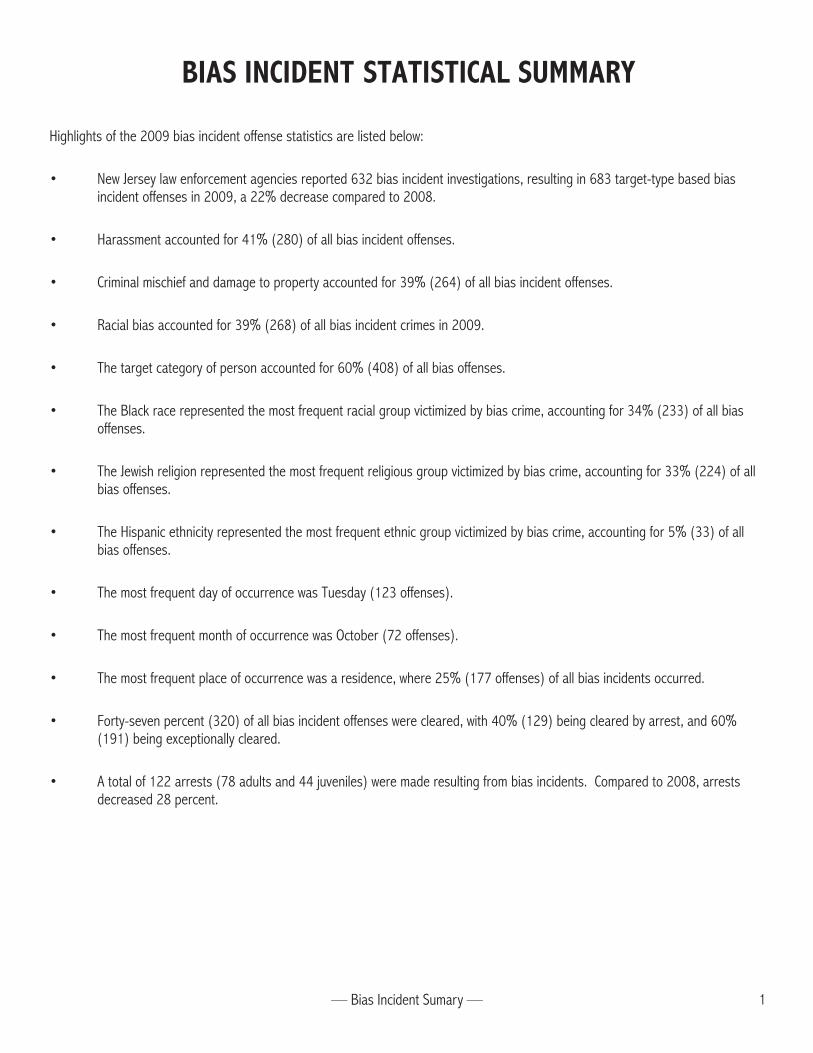
Highlights of the 2009 bias incident offense statistics are listed below:
• New Jersey law enforcement agencies reported 632 bias incident investigations, resulting in 683 target-type based biasincident offenses in 2009, a 22% decrease compared to 2008.
• Harassment accounted for 41% (280) of all bias incident offenses.
• Criminal mischief and damage to property accounted for 39% (264) of all bias incident offenses.
• Racial bias accounted for 39% (268) of all bias incident crimes in 2009.
• The target category of person accounted for 60% (408) of all bias offenses.
• The Black race represented the most frequent racial group victimized by bias crime, accounting for 34% (233) of all biasoffenses.
• The Jewish religion represented the most frequent religious group victimized by bias crime, accounting for 33% (224) of allbias offenses.
• The Hispanic ethnicity represented the most frequent ethnic group victimized by bias crime, accounting for 5% (33) of allbias offenses.
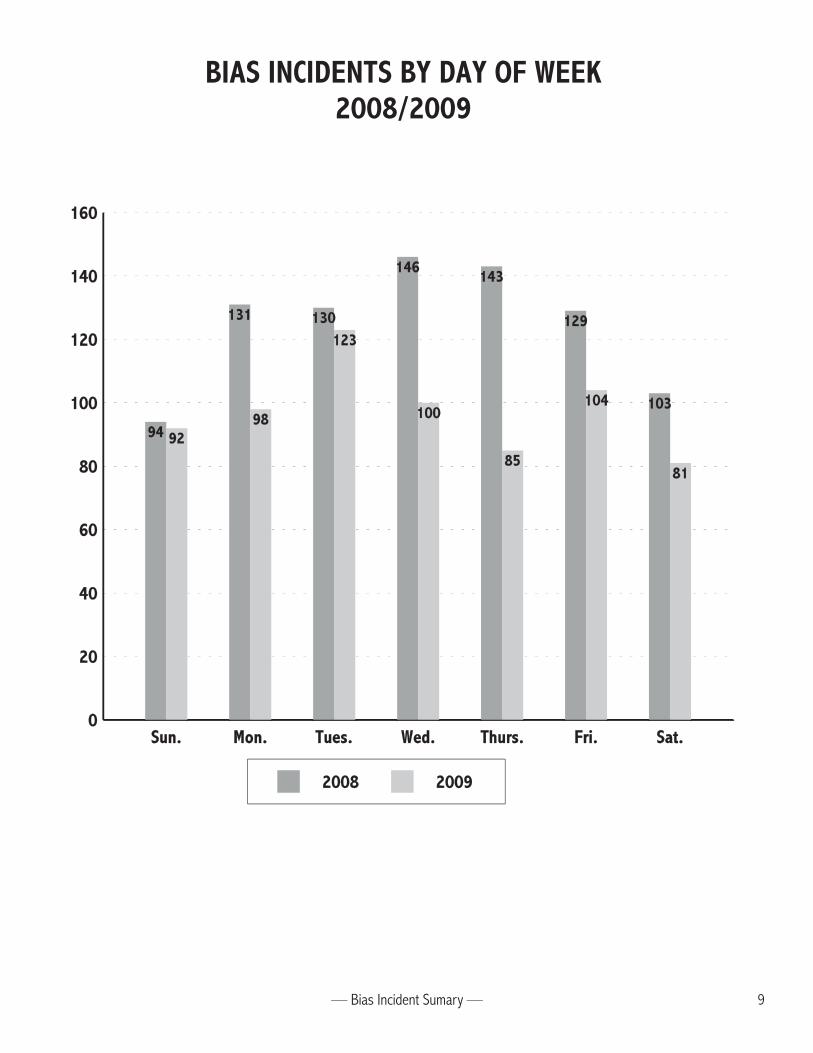
• The most frequent day of occurrence was Tuesday (123 offenses).
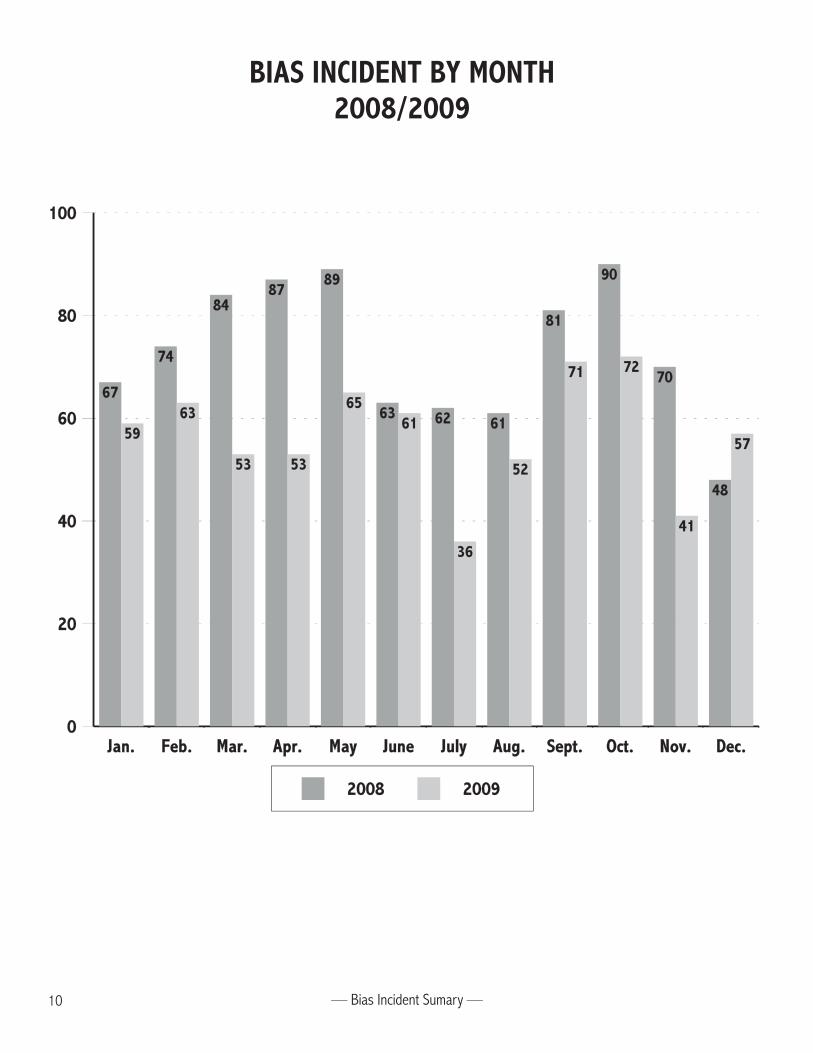
• The most frequent month of occurrence was October (72 offenses).
• The most frequent place of occurrence was a residence, where 25% (177 offenses) of all bias incidents occurred.
• Forty-seven percent (320) of all bias incident offenses were cleared, with 40% (129) being cleared by arrest, and 60%(191) being exceptionally cleared.
• A total of 122 arrests (78 adults and 44 juveniles) were made resulting from bias incidents. Compared to 2008, arrestsdecreased 28 percent.
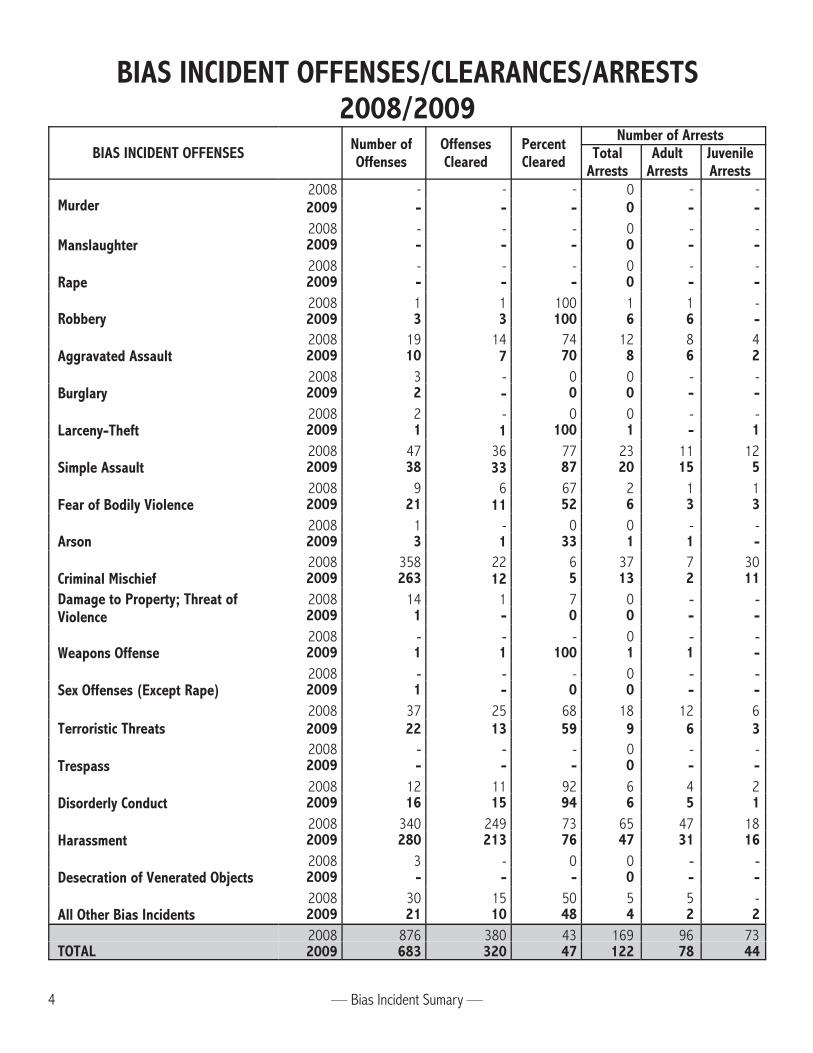
BIAS INCIDENT OFFENSES/CLEARANCES/ARRESTS2008/2009
BIAS INCIDENT OFFENSES Number ofOffenses
OffensesCleared
PercentCleared
Number of ArrestsTotal
ArrestsAdult
ArrestsJuvenileArrests
Murder2008 - - - 0 - -2009 - - - 0 - -
Manslaughter2008 - - - 0 - -2009 - - - 0 - -
Rape2008 - - - 0 - -2009 - - - 0 - -
Robbery2008 1 1 100 1 1 -2009 3 3 100 6 6 -
Aggravated Assault2008 19 14 74 12 8 42009 10 7 70 8 6 2
Burglary2008 3 - 0 0 - -2009 2 - 0 0 - -
Larceny-Theft2008 2 - 0 0 - -2009 1 1 100 1 - 1
Simple Assault2008 47 36 77 23 11 122009 38 33 87 20 15 5
Fear of Bodily Violence2008 9 6 67 2 1 12009 21 11 52 6 3 3
Arson2008 1 - 0 0 - -2009 3 1 33 1 1 -
Criminal Mischief2008 358 22 6 37 7 302009 263 12 5 13 2 11
Damage to Property; Threat ofViolence
2008 14 1 7 0 -- -2009 1 - 0 0 - -
Weapons Offense2008 -- - - 0 -- -2009 1 1 100 1 1 -
Sex Offenses (Except Rape)2008 - - - 0 -- -2009 1 - 0 0 - -
Terroristic Threats2008 37 25 68 18 12 62009 22 13 59 9 6 3
Trespass2008 -- - - 0 - -2009 - - - 0 - -
Disorderly Conduct2008 12 11 92 6 4 22009 16 15 94 6 5 1
Harassment2008 340 249 73 65 47 182009 280 213 76 47 31 16
Desecration of Venerated Objects2008 3 - 0 0 -- -2009 - - - 0 - -
All Other Bias Incidents2008 30 15 50 5 5 -2009 21 10 48 4 2 2
TOTAL2008 876 380 43 169 96 732009 683 320 47 122 78 44
— Bias Incident Sumary — — Bias Incident Sumary —2 3
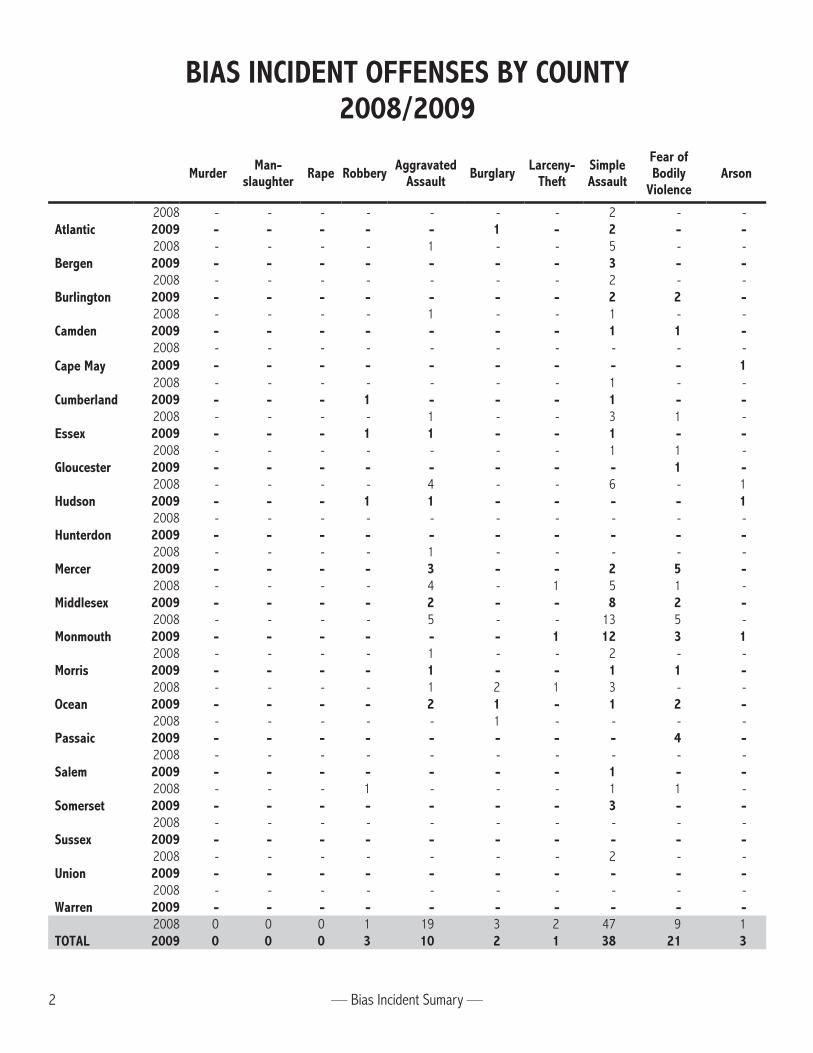
BIAS INCIDENT OFFENSES BY COUNTY2008/2009
Murder Man-slaughter Rape Robbery Aggravated
Assault Burglary Larceny-Theft
SimpleAssault
Fear ofBodily
ViolenceArson
Atlantic2008 - - - - - - - 2 - -2009 - - - - - 1 - 2 - -
Bergen2008 - - - - 1 - - 5 - -2009 - - - - - - - 3 - -
Burlington2008 - - - - - - - 2 - -2009 - - - - - - - 2 2 -
Camden2008 - - - - 1 - - 1 - -2009 - - - - - - - 1 1 -
Cape May2008 - - - - - - - - - -2009 - - - - - - - - - 1
Cumberland2008 - - - - - - - 1 - -2009 - - - 1 - - - 1 - -
Essex2008 - - - - 1 - - 3 1 -2009 - - - 1 1 - - 1 - -
Gloucester2008 - - - - - - - 1 1 -2009 - - - - - - - - 1 -
Hudson2008 - - - - 4 - - 6 - 12009 - - - 1 1 - - - - 1
Hunterdon2008 - - - - - - - - - -2009 - - - - - - - - - -
Mercer2008 - - - - 1 - - - - -2009 - - - - 3 - - 2 5 -
Middlesex2008 - - - - 4 - 1 5 1 -2009 - - - - 2 - - 8 2 -
Monmouth2008 - - - - 5 - - 13 5 -2009 - - - - - - 1 12 3 1
Morris2008 - - - - 1 - - 2 - -2009 - - - - 1 - - 1 1 -
Ocean2008 - - - - 1 2 1 3 - -2009 - - - - 2 1 - 1 2 -
Passaic2008 - - - - - 1 - - - -2009 - - - - - - - - 4 -
Salem2008 - - - - - - - - - -2009 - - - - - - - 1 - -
Somerset2008 - - - 1 - - - 1 1 -2009 - - - - - - - 3 - -
Sussex2008 - - - - - - - - - -2009 - - - - - - - - - -
Union2008 - - - - - - - 2 - -2009 - - - - - - - - - -
Warren2008 - - - - - - - - - -2009 - - - - - - - - - -
TOTAL2008 0 0 0 1 19 3 2 47 9 12009 0 0 0 3 10 2 1 38 21 3
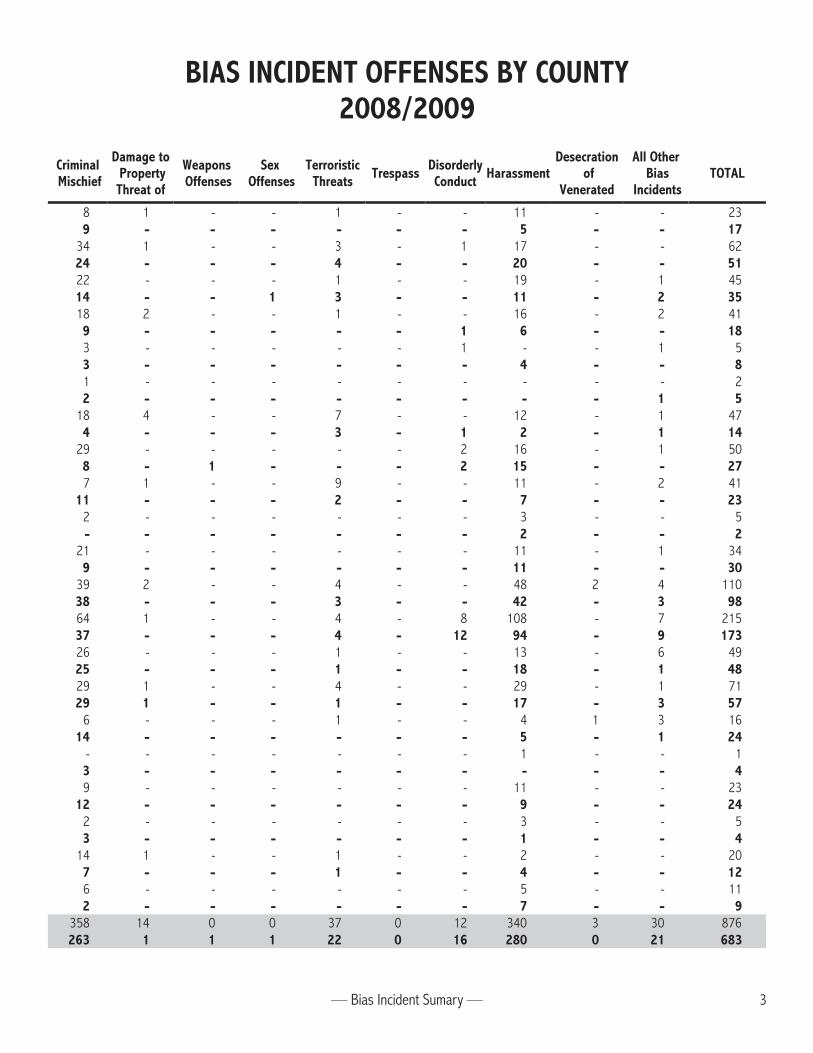
BIAS INCIDENT OFFENSES BY COUNTY2008/2009
Criminal Mischief
Damage to PropertyThreat of
Weapons Offenses
Sex Offenses
TerroristicThreats Trespass Disorderly
Conduct HarassmentDesecration
ofVenerated
All Other Bias
IncidentsTOTAL
8 1 - - 1 - - 11 - - 239 - - - - - - 5 - - 17
34 1 - - 3 - 1 17 - - 6224 - - - 4 - - 20 - - 5122 - - - 1 - - 19 - 1 4514 - - 1 3 - - 11 - 2 3518 2 - - 1 - - 16 - 2 419 - - - - - 1 6 - - 183 - - - - - 1 - - 1 53 - - - - - - 4 - - 81 - - - - - - - - - 22 - - - - - - - - 1 5
18 4 - - 7 - - 12 - 1 474 - - - 3 - 1 2 - 1 14
29 - - - - - 2 16 - 1 508 - 1 - - - 2 15 - - 277 1 - - 9 - - 11 - 2 41
11 - - - 2 - - 7 - - 232 - - - - - - 3 - - 5- - - - - - - 2 - - 2
21 - - - - - - 11 - 1 349 - - - - - - 11 - - 30
39 2 - - 4 - - 48 2 4 11038 - - - 3 - - 42 - 3 9864 1 - - 4 - 8 108 - 7 21537 - - - 4 - 12 94 - 9 17326 - - - 1 - - 13 - 6 4925 - - - 1 - - 18 - 1 4829 1 - - 4 - - 29 - 1 7129 1 - - 1 - - 17 - 3 57
6 - - - 1 - - 4 1 3 1614 - - - - - - 5 - 1 24
- - - - - - - 1 - - 13 - - - - - - - - - 49 - - - - - - 11 - - 23
12 - - - - - - 9 - - 242 - - - - - - 3 - - 53 - - - - - - 1 - - 4
14 1 - - 1 - - 2 - - 207 - - - 1 - - 4 - - 126 - - - - - - 5 - - 112 - - - - - - 7 - - 9
358 14 0 0 37 0 12 340 3 30 876263 1 1 1 22 0 16 280 0 21 683
— Bias Incident Sumary — — Bias Incident Sumary —2 3
BIAS INCIDENT OFFENSES BY COUNTY2008/2009
Murder Man-slaughter Rape Robbery Aggravated
Assault Burglary Larceny-Theft
SimpleAssault
Fear ofBodily
ViolenceArson
Atlantic2008 - - - - - - - 2 - -2009 - - - - - 1 - 2 - -
Bergen2008 - - - - 1 - - 5 - -2009 - - - - - - - 3 - -
Burlington2008 - - - - - - - 2 - -2009 - - - - - - - 2 2 -
Camden2008 - - - - 1 - - 1 - -2009 - - - - - - - 1 1 -
Cape May2008 - - - - - - - - - -2009 - - - - - - - - - 1
Cumberland2008 - - - - - - - 1 - -2009 - - - 1 - - - 1 - -
Essex2008 - - - - 1 - - 3 1 -2009 - - - 1 1 - - 1 - -
Gloucester2008 - - - - - - - 1 1 -2009 - - - - - - - - 1 -
Hudson2008 - - - - 4 - - 6 - 12009 - - - 1 1 - - - - 1
Hunterdon2008 - - - - - - - - - -2009 - - - - - - - - - -
Mercer2008 - - - - 1 - - - - -2009 - - - - 3 - - 2 5 -
Middlesex2008 - - - - 4 - 1 5 1 -2009 - - - - 2 - - 8 2 -
Monmouth2008 - - - - 5 - - 13 5 -2009 - - - - - - 1 12 3 1
Morris2008 - - - - 1 - - 2 - -2009 - - - - 1 - - 1 1 -
Ocean2008 - - - - 1 2 1 3 - -2009 - - - - 2 1 - 1 2 -
Passaic2008 - - - - - 1 - - - -2009 - - - - - - - - 4 -
Salem2008 - - - - - - - - - -2009 - - - - - - - 1 - -
Somerset2008 - - - 1 - - - 1 1 -2009 - - - - - - - 3 - -
Sussex2008 - - - - - - - - - -2009 - - - - - - - - - -
Union2008 - - - - - - - 2 - -2009 - - - - - - - - - -
Warren2008 - - - - - - - - - -2009 - - - - - - - - - -
TOTAL2008 0 0 0 1 19 3 2 47 9 12009 0 0 0 3 10 2 1 38 21 3
BIAS INCIDENT OFFENSES BY COUNTY2008/2009
Criminal Mischief
Damage to PropertyThreat of
Weapons Offenses
Sex Offenses
TerroristicThreats Trespass Disorderly
Conduct HarassmentDesecration
ofVenerated
All Other Bias
IncidentsTOTAL
8 1 - - 1 - - 11 - - 239 - - - - - - 5 - - 17
34 1 - - 3 - 1 17 - - 6224 - - - 4 - - 20 - - 5122 - - - 1 - - 19 - 1 4514 - - 1 3 - - 11 - 2 3518 2 - - 1 - - 16 - 2 419 - - - - - 1 6 - - 183 - - - - - 1 - - 1 53 - - - - - - 4 - - 81 - - - - - - - - - 22 - - - - - - - - 1 5
18 4 - - 7 - - 12 - 1 474 - - - 3 - 1 2 - 1 14
29 - - - - - 2 16 - 1 508 - 1 - - - 2 15 - - 277 1 - - 9 - - 11 - 2 41
11 - - - 2 - - 7 - - 232 - - - - - - 3 - - 5- - - - - - - 2 - - 2
21 - - - - - - 11 - 1 349 - - - - - - 11 - - 30
39 2 - - 4 - - 48 2 4 11038 - - - 3 - - 42 - 3 9864 1 - - 4 - 8 108 - 7 21537 - - - 4 - 12 94 - 9 17326 - - - 1 - - 13 - 6 4925 - - - 1 - - 18 - 1 4829 1 - - 4 - - 29 - 1 7129 1 - - 1 - - 17 - 3 57
6 - - - 1 - - 4 1 3 1614 - - - - - - 5 - 1 24
- - - - - - - 1 - - 13 - - - - - - - - - 49 - - - - - - 11 - - 23
12 - - - - - - 9 - - 242 - - - - - - 3 - - 53 - - - - - - 1 - - 4
14 1 - - 1 - - 2 - - 207 - - - 1 - - 4 - - 126 - - - - - - 5 - - 112 - - - - - - 7 - - 9
358 14 0 0 37 0 12 340 3 30 876263 1 1 1 22 0 16 280 0 21 683
— Bias Incident Sumary — — Bias Incident Sumary —4 1
BIAS INCIDENT STATISTICAL SUMMARY
Highlights of the 2009 bias incident offense statistics are listed below:
• New Jersey law enforcement agencies reported 632 bias incident investigations, resulting in 683 target-type based biasincident offenses in 2009, a 22% decrease compared to 2008.
• Harassment accounted for 41% (280) of all bias incident offenses.
• Criminal mischief and damage to property accounted for 39% (264) of all bias incident offenses.
• Racial bias accounted for 39% (268) of all bias incident crimes in 2009.
• The target category of person accounted for 60% (408) of all bias offenses.
• The Black race represented the most frequent racial group victimized by bias crime, accounting for 34% (233) of all biasoffenses.
• The Jewish religion represented the most frequent religious group victimized by bias crime, accounting for 33% (224) of allbias offenses.
• The Hispanic ethnicity represented the most frequent ethnic group victimized by bias crime, accounting for 5% (33) of allbias offenses.
• The most frequent day of occurrence was Tuesday (123 offenses).
• The most frequent month of occurrence was October (72 offenses).
• The most frequent place of occurrence was a residence, where 25% (177 offenses) of all bias incidents occurred.
• Forty-seven percent (320) of all bias incident offenses were cleared, with 40% (129) being cleared by arrest, and 60%(191) being exceptionally cleared.
• A total of 122 arrests (78 adults and 44 juveniles) were made resulting from bias incidents. Compared to 2008, arrestsdecreased 28 percent.
BIAS INCIDENT OFFENSES/CLEARANCES/ARRESTS2008/2009
BIAS INCIDENT OFFENSES Number ofOffenses
OffensesCleared
PercentCleared
Number of ArrestsTotal
ArrestsAdult
ArrestsJuvenileArrests
Murder2008 - - - 0 - -2009 - - - 0 - -
Manslaughter2008 - - - 0 - -2009 - - - 0 - -
Rape2008 - - - 0 - -2009 - - - 0 - -
Robbery2008 1 1 100 1 1 -2009 3 3 100 6 6 -
Aggravated Assault2008 19 14 74 12 8 42009 10 7 70 8 6 2
Burglary2008 3 - 0 0 - -2009 2 - 0 0 - -
Larceny-Theft2008 2 - 0 0 - -2009 1 1 100 1 - 1
Simple Assault2008 47 36 77 23 11 122009 38 33 87 20 15 5
Fear of Bodily Violence2008 9 6 67 2 1 12009 21 11 52 6 3 3
Arson2008 1 - 0 0 - -2009 3 1 33 1 1 -
Criminal Mischief2008 358 22 6 37 7 302009 263 12 5 13 2 11
Damage to Property; Threat ofViolence
2008 14 1 7 0 -- -2009 1 - 0 0 - -
Weapons Offense2008 -- - - 0 -- -2009 1 1 100 1 1 -
Sex Offenses (Except Rape)2008 - - - 0 -- -2009 1 - 0 0 - -
Terroristic Threats2008 37 25 68 18 12 62009 22 13 59 9 6 3
Trespass2008 -- - - 0 - -2009 - - - 0 - -
Disorderly Conduct2008 12 11 92 6 4 22009 16 15 94 6 5 1
Harassment2008 340 249 73 65 47 182009 280 213 76 47 31 16
Desecration of Venerated Objects2008 3 - 0 0 -- -2009 - - - 0 - -
All Other Bias Incidents2008 30 15 50 5 5 -2009 21 10 48 4 2 2
TOTAL2008 876 380 43 169 96 732009 683 320 47 122 78 44
— Bias Incident Sumary — — Bias Incident Sumary — 5
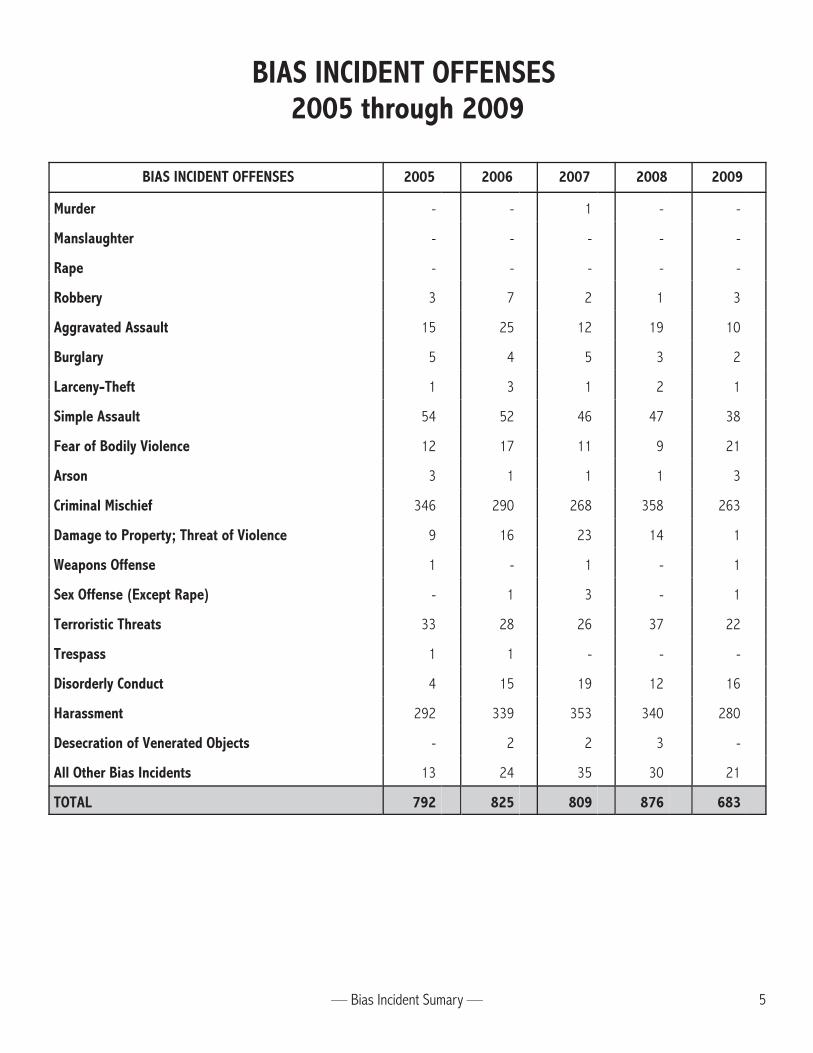
BIAS INCIDENT OFFENSES 2005 through 2009
BIAS INCIDENT OFFENSES 2005 2006 2007 2008 2009
Murder - - 1 - -
Manslaughter - - - - -
Rape - - - - -
Robbery 3 7 2 1 3
Aggravated Assault 15 25 12 19 10
Burglary 5 4 5 3 2
Larceny-Theft 1 3 1 2 1
Simple Assault 54 52 46 47 38
Fear of Bodily Violence 12 17 11 9 21
Arson 3 1 1 1 3
Criminal Mischief 346 290 268 358 263
Damage to Property; Threat of Violence 9 16 23 14 1
Weapons Offense 1 - 1 - 1
Sex Offense (Except Rape) - 1 3 - 1
Terroristic Threats 33 28 26 37 22
Trespass 1 1 - - -
Disorderly Conduct 4 15 19 12 16
Harassment 292 339 353 340 280
Desecration of Venerated Objects - 2 2 3 -
All Other Bias Incidents 13 24 35 30 21
TOTAL 792 825 809 876 683
— Bias Incident Sumary — — Bias Incident Sumary —6
OFFICE OF THE ATTORNEY GENERALCHRIS CHRISTIE DEPARTMENT OF LAW AND PUBLIC SAFETY PAULA T. DOW
Governor DIVISION OF STATE POLICE Attorney GeneralPOST OFFICE BOX 7068
KIM GUADAGNO WEST TRENTON NJ 08628-0068 COLONEL JOSEPH R. FUENTESLt. Governor (609) 882-2000 Superintendent
"An Internationally Accredited Agency"
New Jersey Is An Equal Opportunity EmployerPrinted on Recycled Paper and Recyclable
The Honorable Paula T. DowAttorney GeneralState of New JerseyHughes Justice ComplexTrenton, New Jersey
Dear Attorney General Dow:
Pursuant to the Attorney General's Executive Directive 1987-3, the twenty-second annual report onbias incidents in New Jersey is submitted. This report contains statistics related to bias incidents.All information is based on bias incident reports submitted to the New Jersey Uniform CrimeReporting System by every New Jersey law enforcement agency for the year 2009. The reportcontains comparisons and analyses between 2008 and 2009 data.
This report could not have been realized without the cooperation of all New Jersey law enforcementagencies. It is being forwarded for your information and presentation to the Governor and membersof the Legislature.
Respectfully,
Joseph R. FuentesColonelSuperintendent
BIAS INCIDENT SUMMARY TARGET/TYPE – 2009
PERSON 408RACIAL 193 RELIGIOUS 86 ETHNIC 60 SEXUAL 62 OTHER 7
American Indian - Catholic 1 Arab 12 Bisexual 5 Gender 2
Asian 7 Hindu 2 Asian Indian 9 Heterosexual(F) 1 Handicap: 4
Black 166 Islamic 8 Hispanic 30 Heterosexual(M) 1 (1) Physical -
White 16 Jewish 72 Asian 2 Homosexual(F) 10 (2) Mental 4
Other 4 Protestant 2 Nat. Origin 3 Homosexual(M) 40 Gender ID: 1
Other 1 Other 4 Homosexual(M&F) 5
PRIVATE PROPERTY 169RACIAL 46 RELIGIOUS 102 ETHNIC 9 SEXUAL 12 OTHER 0
American Indian - Catholic 2 Arab 2 Bisexual - Gender -
Asian 2 Hindu 5 Asian Indian 2 Heterosexual(F) - Handicap: 0
Black 39 Islamic 1 Hispanic 3 Heterosexual(M) - (1) Physical -
White 4 Jewish 87 Asian 1 Homosexual(F) 3 (2) Mental -
Other 1 Protestant 1 Nat. Origin - Homosexual(M) 9 Gender ID: 0
Other 6 Other 1 Homosexual(M&F) -
PUBLIC PROPERTY 106RACIAL 29 RELIGIOUS 67 ETHNIC 2 SEXUAL 8 OTHER 0
American Indian 1 Catholic - Arab - Bisexual 1 Gender -
Asian - Hindu - Asian Indian - Heterosexual(F) - Handicap: 0
Black 28 Islamic - Hispanic - Heterosexual(M) - (1) Physical -
White - Jewish 65 Asian 1 Homosexual(F) - (2) Mental -
Other - Protestant - Nat. Origin - Homosexual(M) 2 Gender ID: 0
Other 2 Other 1 Homosexual(M&F) 5
— Bias Incident Sumary — — Bias Incident Sumary — 7
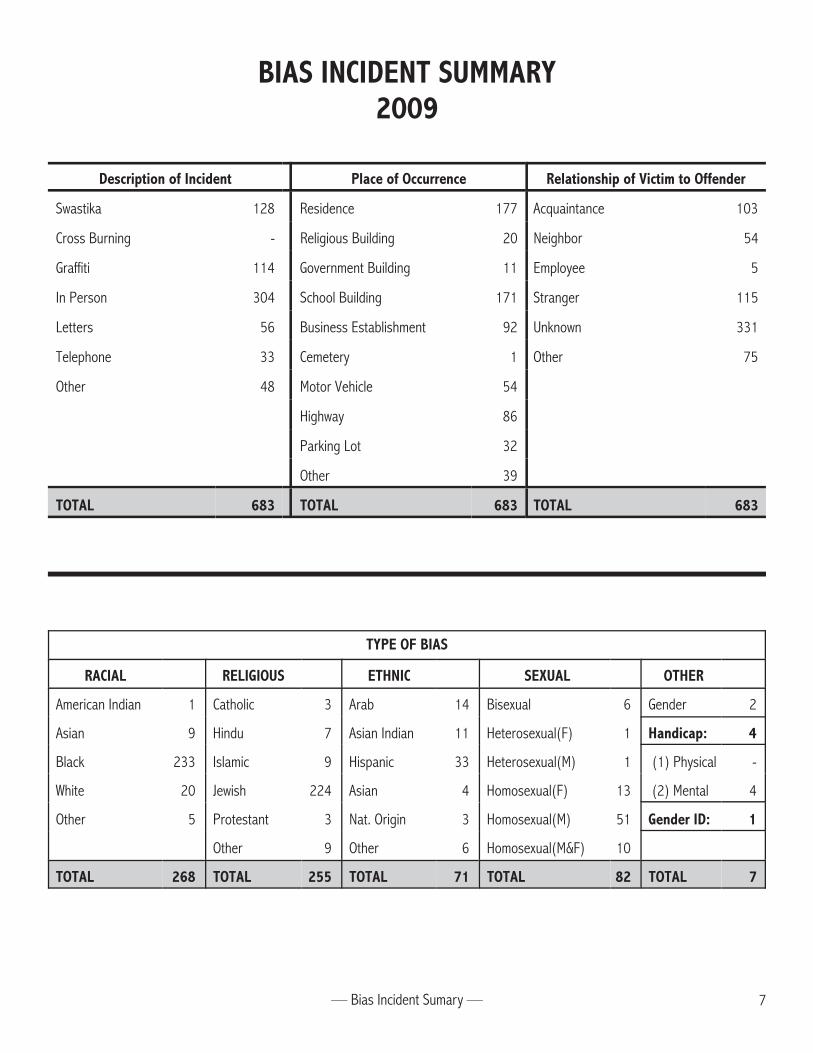
BIAS INCIDENT SUMMARY2009
Description of Incident Place of Occurrence Relationship of Victim to Offender
Swastika 128 Residence 177 Acquaintance 103
Cross Burning - Religious Building 20 Neighbor 54
Graffiti 114 Government Building 11 Employee 5
In Person 304 School Building 171 Stranger 115
Letters 56 Business Establishment 92 Unknown 331
Telephone 33 Cemetery 1 Other 75
Other 48 Motor Vehicle 54
Highway 86
Parking Lot 32
Other 39
TOTAL 683 TOTAL 683 TOTAL 683
TYPE OF BIAS
RACIAL RELIGIOUS ETHNIC SEXUAL OTHER
American Indian 1 Catholic 3 Arab 14 Bisexual 6 Gender 2
Asian 9 Hindu 7 Asian Indian 11 Heterosexual(F) 1 Handicap: 4
Black 233 Islamic 9 Hispanic 33 Heterosexual(M) 1 (1) Physical -
White 20 Jewish 224 Asian 4 Homosexual(F) 13 (2) Mental 4
Other 5 Protestant 3 Nat. Origin 3 Homosexual(M) 51 Gender ID: 1
Other 9 Other 6 Homosexual(M&F) 10
TOTAL 268 TOTAL 255 TOTAL 71 TOTAL 82 TOTAL 7
— Bias Incident Sumary — — Bias Incident Sumary —8
State of New JerseyOFFICE OF THE ATTORNEY GENERAL
CHRIS CHRISTIE DEPARTMENT OF LAW AND PUBLIC SAFETY PAULA T. DOWGovernor P.O. BOX 080 Attorney General
TRENTON, NJ 08625-0080KIM GUADAGNO
Lt. Governor
HUGHES JUSTICE COMPLEX • TELEPHONE: (609) 292-4925 • FAX: (609) 292-3508
New Jersey Is An Equal Opportunity Employer • Printed on Recycled Paper and Recyclable
The Honorable Chris ChristieGovernor of the State of New Jersey
Honorable Members of the Senate andAssembly of the State of New Jersey
Dear Governor and Members of the Legislature:
Pursuant to the Attorney General's Executive Directive 1987-3, I herewith submit for yourinformation and review the twenty-second annual report on bias incidents in New Jersey. Theannual report is based on the bias incident reports submitted to the New Jersey Uniform CrimeReporting System by every New Jersey law enforcement agency for the year 2009.
It would have been impossible to complete this report without the cooperation of New Jersey lawenforcement agencies. It is with appreciation to these dedicated public servants, and in the interestof developing strategies for identifying and addressing bias-motivated crimes, that this report issubmitted.
Respectfully,
Paula T. DowAttorney General of New Jersey
VICTIM/OFFENDER CHARACTERISTICS2009
VICTIM OFFENDER
AGE
10 and under 6 2
11 to 17 127 128
18 to 20 41 32
21 to 25 36 26
26 to 30 20 15
31 to 35 38 18
36 to 40 32 13
41 to 45 31 24
46 to 50 27 17
51 to 60 31 21
61 and over 20 18
TOTAL AGE 409 314
SEX
Male 240 226
Female 169 88
TOTAL SEX 409 314
RRACE
American Indian 10 4
Asian 24 3
Black 166 40
White 206 264
Other 3 3
TOTAL RACE 409 314
— Bias Incident Sumary — — Bias Incident Sumary — 9
BIAS INCIDENTS BY DAY OF WEEK2008/2009
— Bias Incident Sumary — — Bias Incident Sumary —10
INTRODUCTION
Crimes motivated by hate and bias tend to erode the basic fabric of society. Bias incidents having a racial, religious,ethnic, sexual or gender component as well as crimes against individuals with a handicap, manifest themselves in a widespectrum of criminal activities. These bias incidents jeopardize the active and open pursuit of freedom and opportunity.They attack our citizens based on their race, religion, ethnic heritage, sexual orientation, handicap, or gender. Closelylinked to such heritage are individual values, beliefs, and identities.
Realizing that no agency within the state was collecting complete data on bias incidents, a broad-based Ad Hoccommittee was created to develop a comprehensive statewide reporting system. As a result of the committee’srecommendation, Attorney General Executive Directive No. 1987-3 was issued mandating all New Jersey law enforcementagencies begin reporting bias incident offenses to the Division of State Police, Uniform Crime Reporting Unit on a monthlybasis effective January 1, 1988. On August 15, 1996, legislation was enacted which enhanced the state’s definition ofa bias incident to include crimes that are gender or handicap-motivated.
The directive was instituted to capture vital data in an effort to identify the problem. This information permits properevaluation of progress in preventing bias crime and assist with necessary planning for the future.
This twenty-second annual publication concerning bias crimes contains comparisons to the previous year’s statistics.The published statistics and graphs are the result of data submitted by the police community of New Jersey.
Hopefully, the information contained in this publication will be of value to various segments of society and serve itsintended purpose.
BIAS INCIDENT BY MONTH2008/2009