Embed Size (px)
DESCRIPTION
2009 KANSAS WHEAT QUALITY SURVEY. Wheat Grade Data. Wheat Non-Grade Data. Test Weight, lbs/ bu. Protein, %. Falling Number, sec. Hardness Index. Kernel Ash, % (14%mb). Kernel Diameter, mm. 1000 Kernel Weight, g. Flour Data. Alveograph Results. Mixograph Results. Farinograph Results. - PowerPoint PPT Presentation
Citation preview
2009 KANSAS WHEAT QUALITY SURVEY
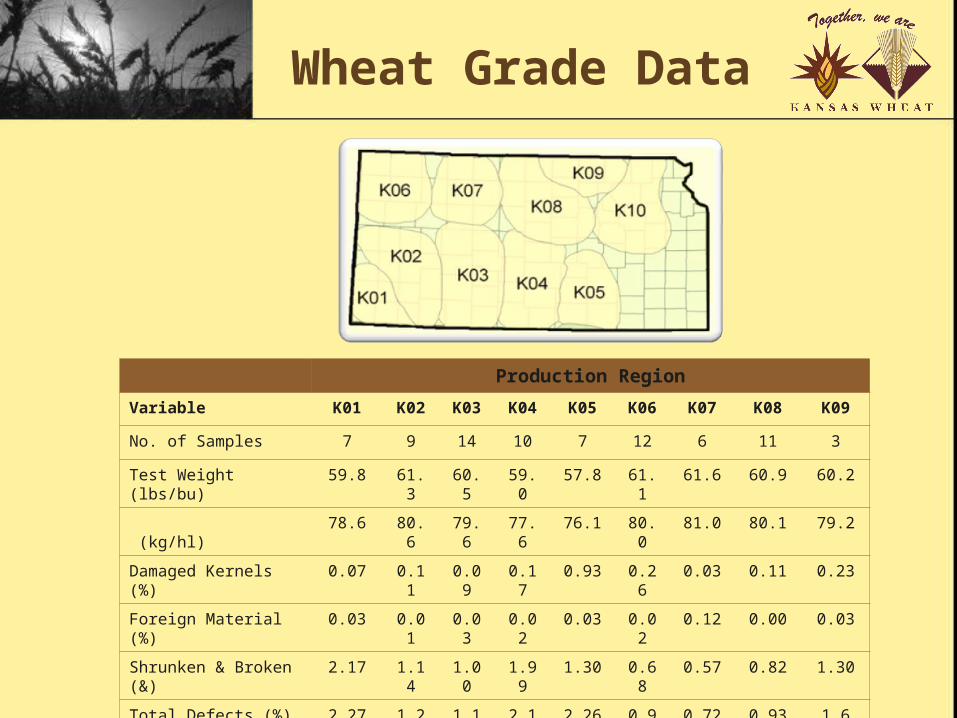
Production Region
Variable K01 K02 K03 K04 K05 K06 K07 K08 K09
No. of Samples 7 9 14 10 7 12 6 11 3
Test Weight (lbs/bu) 59.8 61.3 60.5 59.0 57.8 61.1 61.6 60.9 60.2
(kg/hl) 78.6 80.6 79.6 77.6 76.1 80.0 81.0 80.1 79.2
Damaged Kernels (%) 0.07 0.11 0.09 0.17 0.93 0.26 0.03 0.11 0.23
Foreign Material (%) 0.03 0.01 0.03 0.02 0.03 0.02 0.12 0.00 0.03
Shrunken & Broken (&) 2.17 1.14 1.00 1.99 1.30 0.68 0.57 0.82 1.30
Total Defects (%) 2.27 1.27 1.12 2.18 2.26 0.95 0.72 0.93 1.6
Grade 2 1 1 2 3 1 1 1 1
Wheat Grade Data
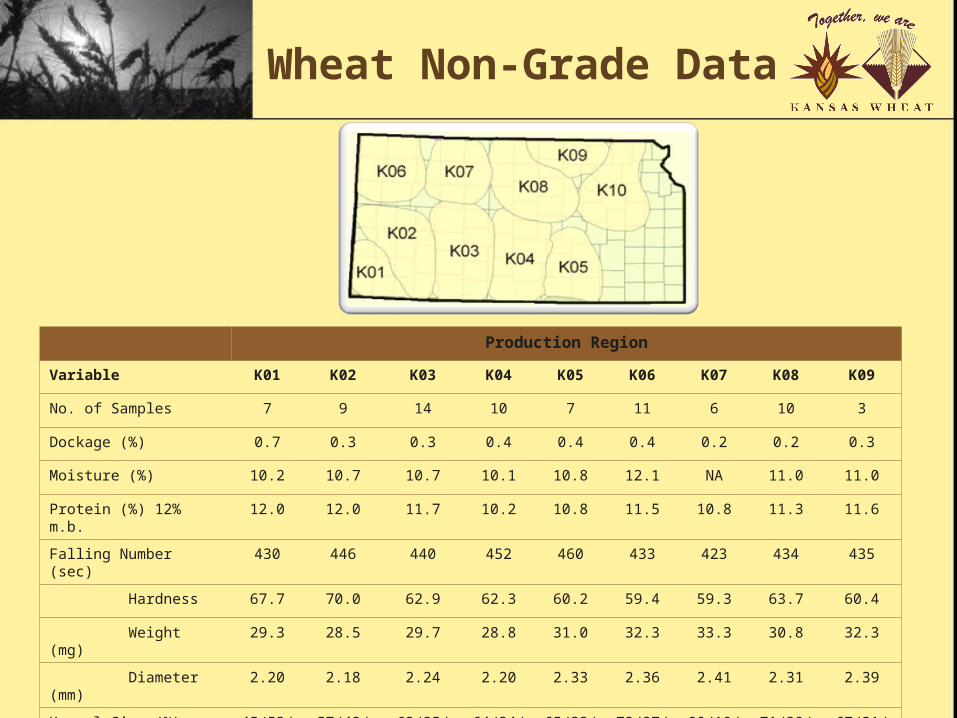
Production Region
Variable K01 K02 K03 K04 K05 K06 K07 K08 K09
No. of Samples 7 9 14 10 7 11 6 10 3
Dockage (%) 0.7 0.3 0.3 0.4 0.4 0.4 0.2 0.2 0.3
Moisture (%) 10.2 10.7 10.7 10.1 10.8 12.1 NA 11.0 11.0
Protein (%) 12% m.b. 12.0 12.0 11.7 10.2 10.8 11.5 10.8 11.3 11.6
Falling Number (sec) 430 446 440 452 460 433 423 434 435
Hardness 67.7 70.0 62.9 62.3 60.2 59.4 59.3 63.7 60.4
Weight (mg) 29.3 28.5 29.7 28.8 31.0 32.3 33.3 30.8 32.3
Diameter (mm) 2.20 2.18 2.24 2.20 2.33 2.36 2.41 2.31 2.39
Kernel Size (%) lg/md/sm 45/53/2 57/42/1 63/35/1 64/34/2 65/33/1 72/27/1 80/19/0 71/28/1 67/31/1
Wheat Non-Grade Data
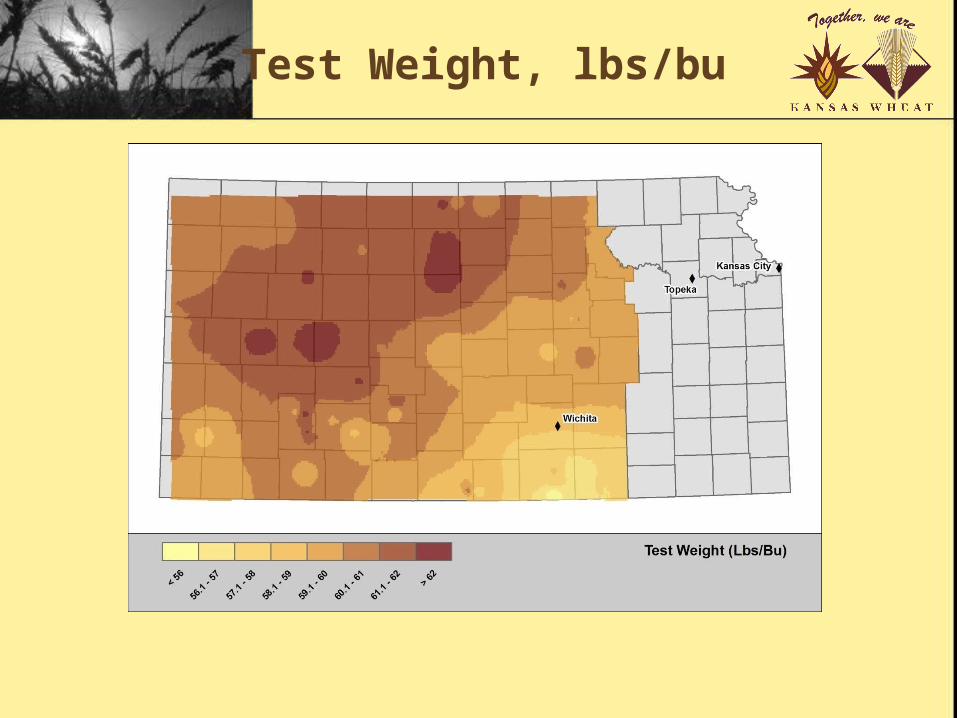
Test Weight, lbs/bu
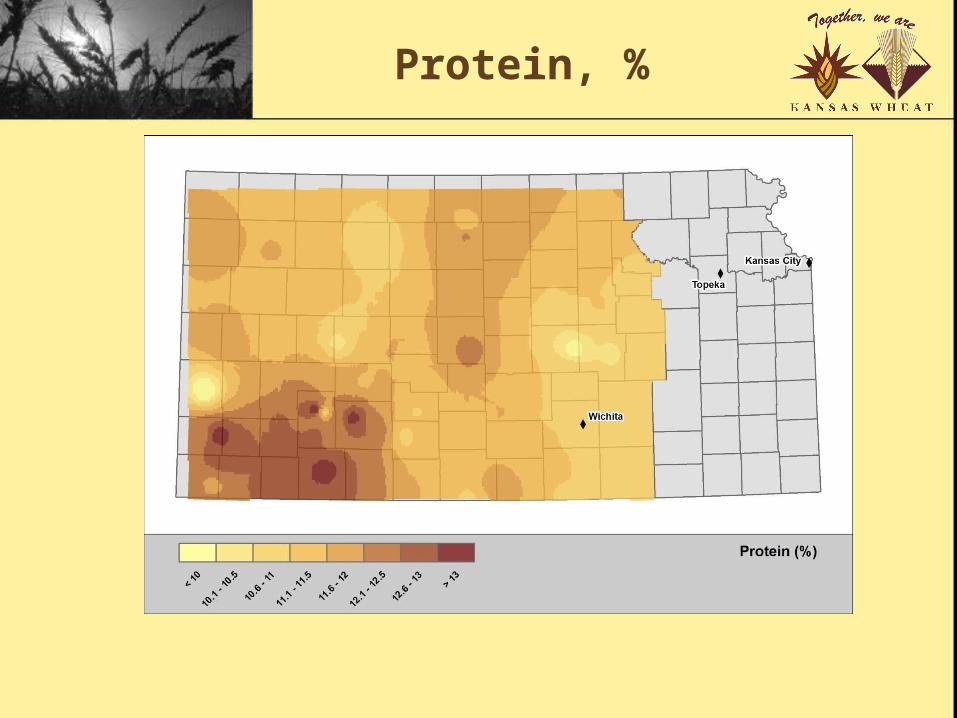
Protein, %
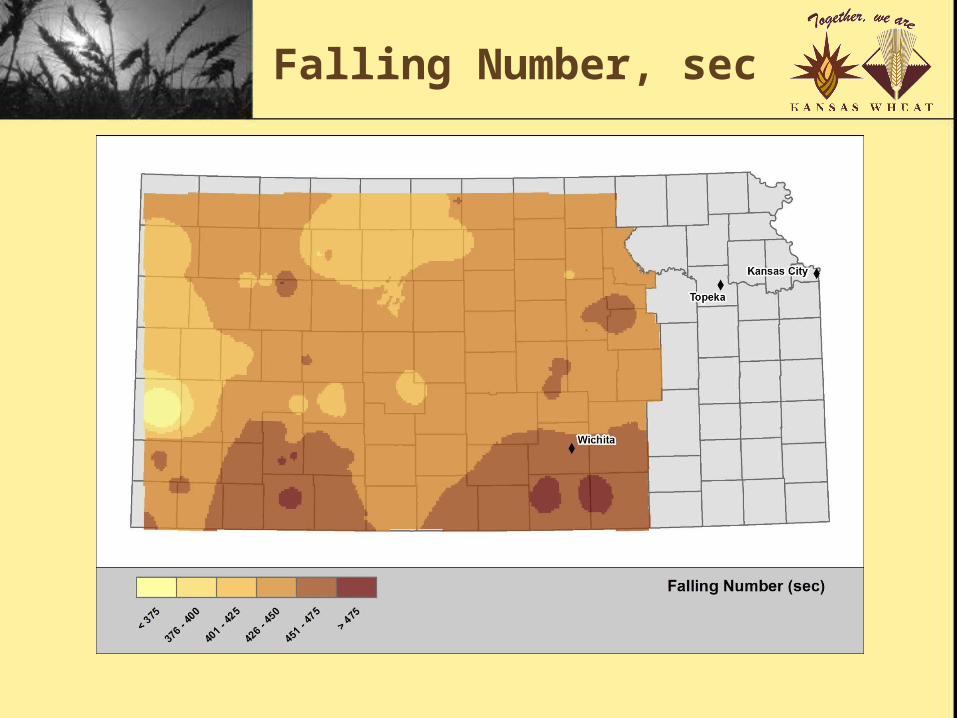
Falling Number, sec
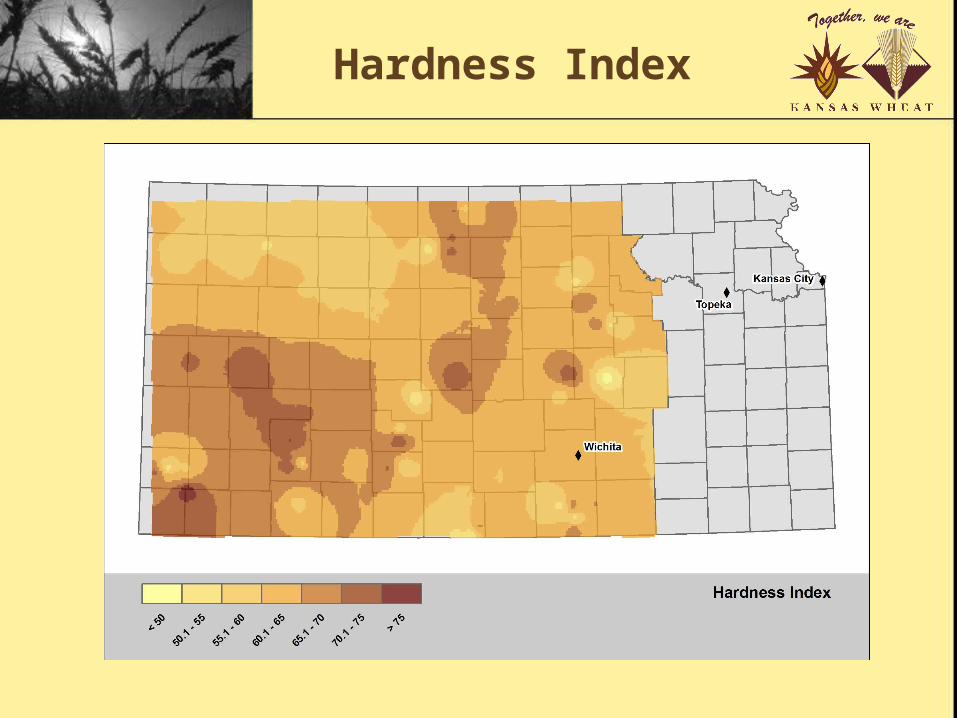
Hardness Index
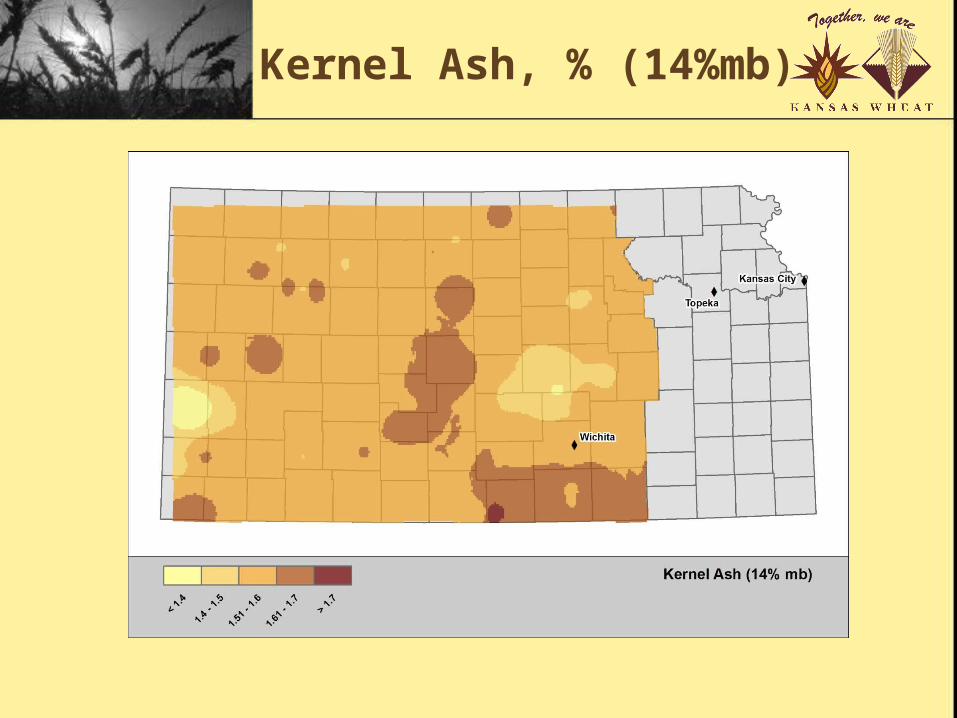
Kernel Ash, % (14%mb)
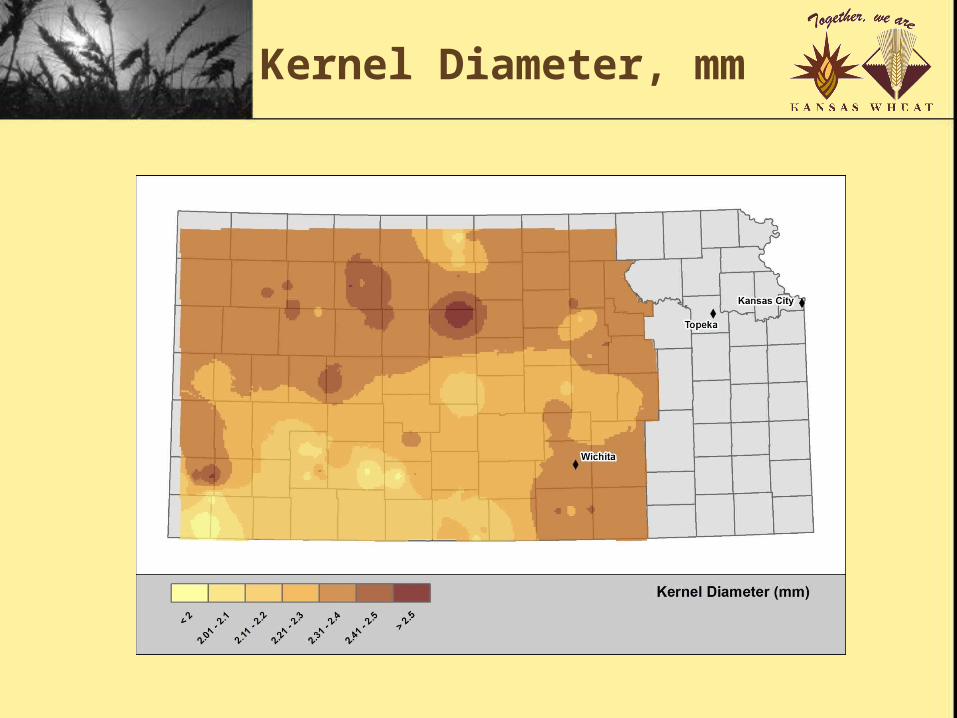
Kernel Diameter, mm
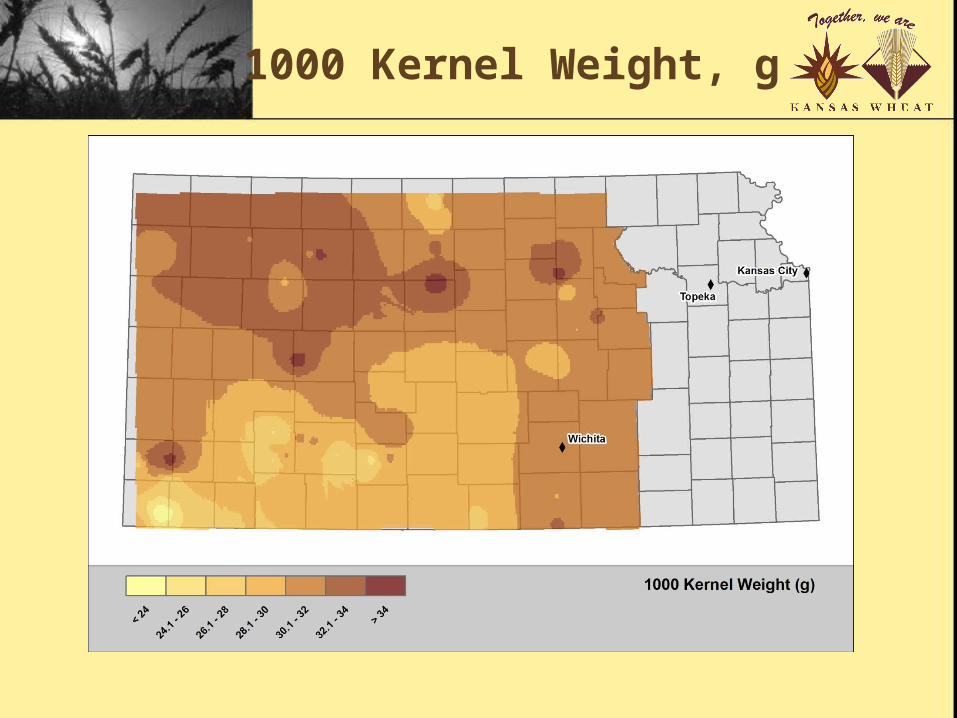
1000 Kernel Weight, g
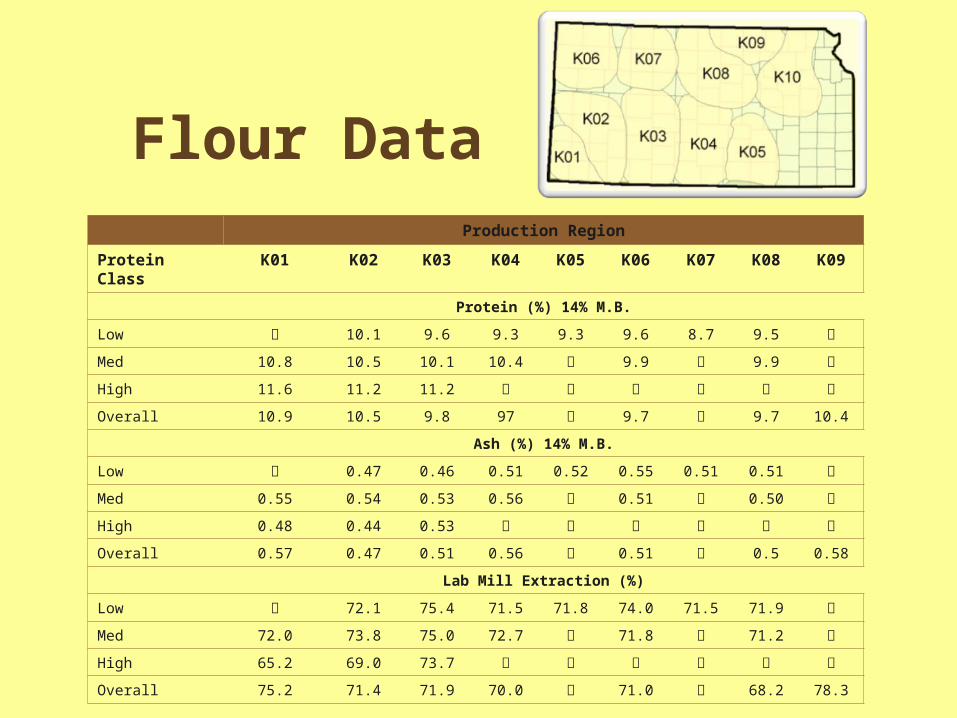
Production Region
Protein Class K01 K02 K03 K04 K05 K06 K07 K08 K09
Protein (%) 14% M.B.
Low 10.1 9.6 9.3 9.3 9.6 8.7 9.5
Med 10.8 10.5 10.1 10.4 9.9 9.9
High 11.6 11.2 11.2
Overall 10.9 10.5 9.8 97 9.7 9.7 10.4
Ash (%) 14% M.B.
Low 0.47 0.46 0.51 0.52 0.55 0.51 0.51
Med 0.55 0.54 0.53 0.56 0.51 0.50
High 0.48 0.44 0.53
Overall 0.57 0.47 0.51 0.56 0.51 0.5 0.58
Lab Mill Extraction (%)
Low 72.1 75.4 71.5 71.8 74.0 71.5 71.9
Med 72.0 73.8 75.0 72.7 71.8 71.2
High 65.2 69.0 73.7
Overall 75.2 71.4 71.9 70.0 71.0 68.2 78.3
Flour Data
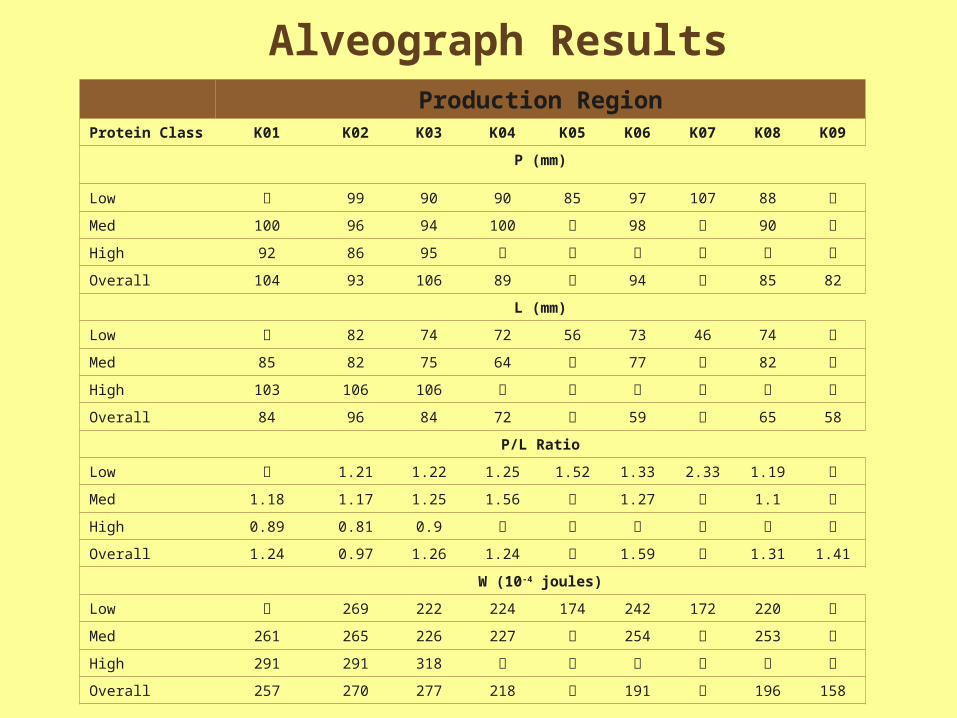
Production RegionProtein Class K01 K02 K03 K04 K05 K06 K07 K08 K09
P (mm)
Low 99 90 90 85 97 107 88
Med 100 96 94 100 98 90
High 92 86 95
Overall 104 93 106 89 94 85 82
L (mm)
Low 82 74 72 56 73 46 74
Med 85 82 75 64 77 82
High 103 106 106
Overall 84 96 84 72 59 65 58
P/L Ratio
Low 1.21 1.22 1.25 1.52 1.33 2.33 1.19
Med 1.18 1.17 1.25 1.56 1.27 1.1
High 0.89 0.81 0.9
Overall 1.24 0.97 1.26 1.24 1.59 1.31 1.41
W (10-4 joules)
Low 269 222 224 174 242 172 220
Med 261 265 226 227 254 253
High 291 291 318
Overall 257 270 277 218 191 196 158
Alveograph Results
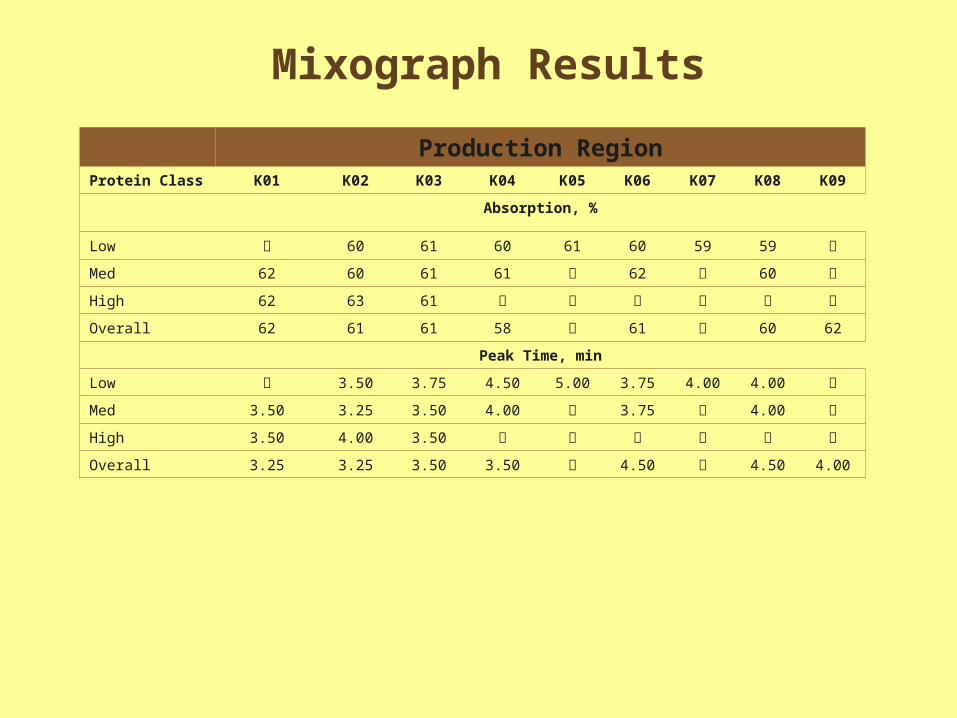
Production RegionProtein Class K01 K02 K03 K04 K05 K06 K07 K08 K09
Absorption, %
Low 60 61 60 61 60 59 59
Med 62 60 61 61 62 60
High 62 63 61
Overall 62 61 61 58 61 60 62
Peak Time, min
Low 3.50 3.75 4.50 5.00 3.75 4.00 4.00
Med 3.50 3.25 3.50 4.00 3.75 4.00
High 3.50 4.00 3.50
Overall 3.25 3.25 3.50 3.50 4.50 4.50 4.00
Mixograph Results
Production RegionProtein Class K01 K02 K03 K04 K05 K06 K07 K08 K09
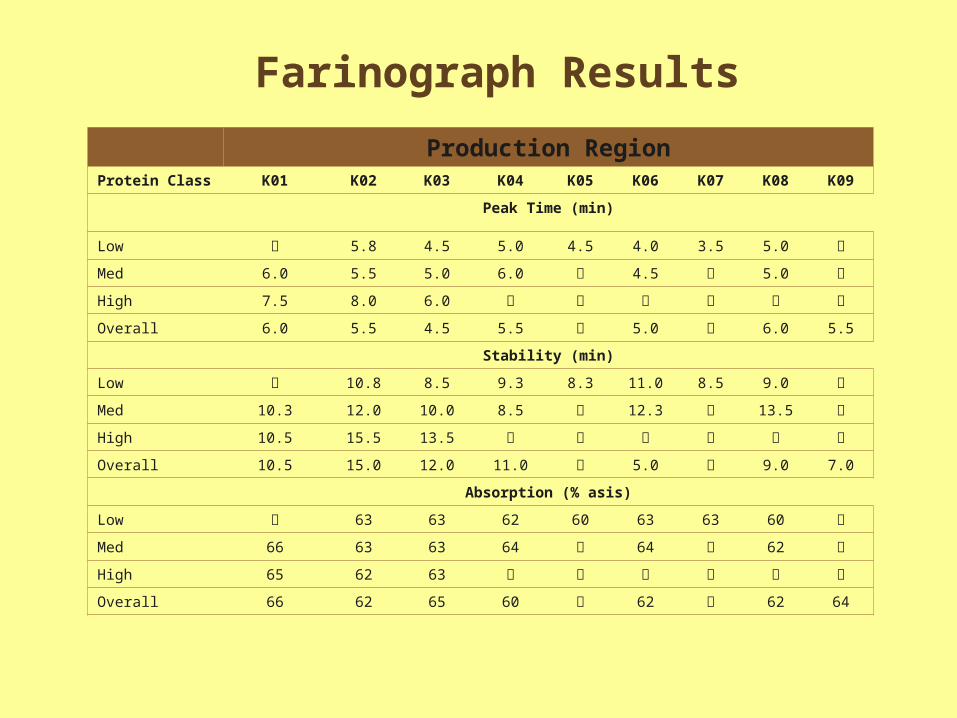
Peak Time (min)
Low 5.8 4.5 5.0 4.5 4.0 3.5 5.0
Med 6.0 5.5 5.0 6.0 4.5 5.0
High 7.5 8.0 6.0
Overall 6.0 5.5 4.5 5.5 5.0 6.0 5.5
Stability (min)
Low 10.8 8.5 9.3 8.3 11.0 8.5 9.0
Med 10.3 12.0 10.0 8.5 12.3 13.5
High 10.5 15.5 13.5
Overall 10.5 15.0 12.0 11.0 5.0 9.0 7.0
Absorption (% asis)
Low 63 63 62 60 63 63 60
Med 66 63 63 64 64 62
High 65 62 63
Overall 66 62 65 60 62 62 64
Farinograph Results
Production RegionProtein Class K01 K02 K03 K04 K05 K06 K07 K08 K09
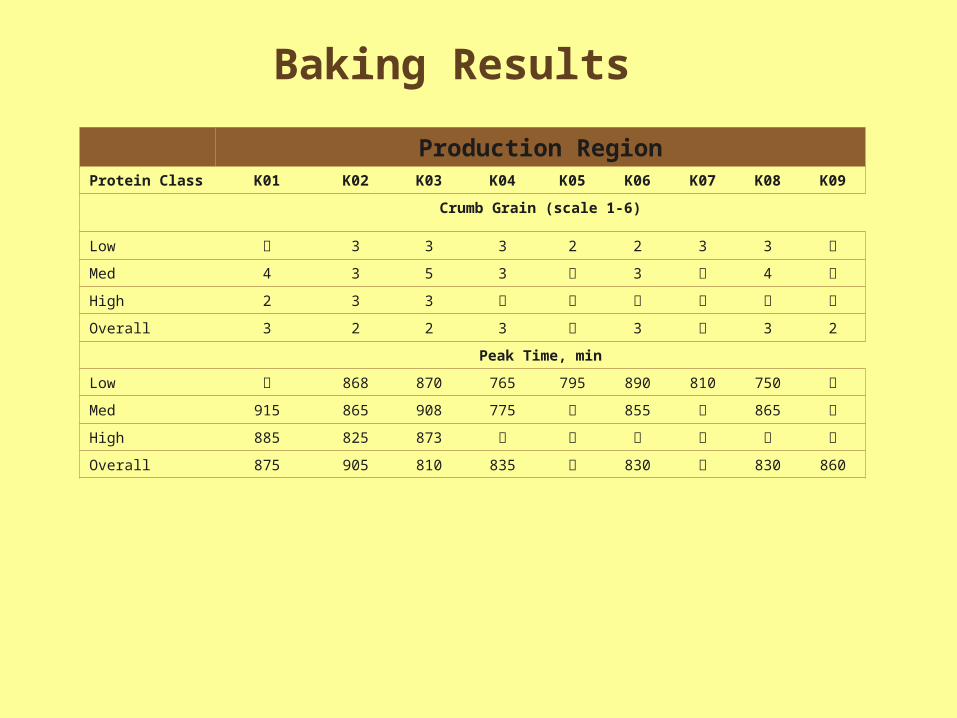
Crumb Grain (scale 1-6)
Low 3 3 3 2 2 3 3
Med 4 3 5 3 3 4
High 2 3 3
Overall 3 2 2 3 3 3 2
Peak Time, min
Low 868 870 765 795 890 810 750
Med 915 865 908 775 855 865
High 885 825 873
Overall 875 905 810 835 830 830 860
Baking Results