Embed Size (px)
Citation preview

ºö¤¡¾ -êȺ¤-êȼ -Á¹È¤ -§¾© Lao National Tourism Administration
Planning and Cooperation Department Statistics Unit
2009 Statistical Report on Tourism in Laos
Visit Laos Year 2012
Source of data: Lao National Tourism Administration
ACKNOWLEDGEMENT
The Lao National Tourism Administration (LNTA) publishes annually, statistics relating to tourist arrivals, foreign exchange earnings from tourism, tourist expenditures, the average length of stay of tourists in Laos as well as an accommodations profile. The purpose of this Statistical Report on Tourism is to provide the public with clear information on a rapidly expanding sector of the Lao economy. The LNTA would like to take this opportunity to express its gratitude to the following agencies: Provincial Tourism Departments / Offices, The Lao Immigration Department, Wattay International Airport Authority, Lao travel agents and hotels for their cooperation as well as their valuable assistance in the processing of statistical data and conducting statistical surveys. On behalf of the LNTA, I hope that the 2009 Statistical Report on Tourism in Lao PDR will be useful and beneficial to all of you. Somphong Mongkhonvilay
Minister, Chairman of the Lao National Tourism Administration
Source of data: Lao National Tourism Administration
Table of Contents Page
Background Information 1 Statistical Data
Part I : Visitor Arrival Statistics 2009 5
Table 1: Number of Tourist Arrivals, Revenue from Tourism, and Average Length of Stay, 1990-2009. 5 Table 2: Number of Tourist Arrivals by Region, 1992-2009. 6 Table 3: Number of Tourist Arrivals to Laos by Category 2008-2009. 7 Table 4: Revenue from Tourism by Category, 2009. 7 Table 5: Tourist Arrivals to Laos by Nationality (Percent Increase) 2003-2009. 8 Table 6: Tourist Arrivals to Laos by Nationality (Market Share) 2003-2009. 9 Table 7: Tourist Arrivals to Laos by Month in 2009. 11
Graph 1: Total Number of Tourist Arrivals from 1994-2009. 11 Table 8: Tourist Arrivals by Month, 2005-2009. 12
Graph 2: Tourist Arrivals to Laos by Month from 2007-2009. 12 Table 9: Tourist Arrivals to Laos by Port of Entry in 2009. 13 Table 10: Top Ten Generating Markets, 2006-2009. 14 Table 11: Tourist Arrivals by Port of Entry, 2005-2009. 15
Graph 3: Percentage of Tourist Arrivals. 15 Table 12: Visitors by Province, 2002-2009. 15 Table 13: Visitor Arrivals to Luang Prabang Province by Nationality, 2006-2009. 16 Table 14: Out-going Lao Travellers, 2007 - 2009. 17 Table 15: Room Occupancy Rates by Province, 2003 - 2009. 17 Table 16: Revenue from Tourism and Major Export, 2005 - 2009. 18 Table 17: Number of Hotels, Guesthouses, Resorts, Restaurants and
Entertainment Establishments, 2008-2009. 18 Table 18: Number of Accommodation Establishments, and Rooms 2003-2009. 19 Table 19: Number of Hotels, Guesthouses, Rooms, and Beds, in 2009. 19
Part II: International Visitor Survey 20
Table 20: Profile of International Tourist Arrivals to Laos,2005-2009. 20
Part III: Tourism Projections 22 Table 21: Tourist Arrivals to Laos, Revenue from Tourism, Average
Length of Stay by Time Trend from 1993-2020. 22 Table 22: Tourist Arrivals Forecast by Season from 2010 to 2020. 23 Table 23: Number of Laos Travel Agents 2003-2009. 24 Table 24: Number of Tourist Sites in Laos in 2009. 24
Part IV: Tourist Satisfaction 25
Table 25: Important factors that tourists took into account when they planned to visit Lao PDR. 25 Table 26: Level of tourist satisfaction with tourism products and services of Lao PDR. 25 Table 27: Overall satisfaction of tourists who visit Lao PDR. 25 Organization Chart of the LNTA 26
Source of data: Lao National Tourism Administration
1
Background Information This section includes background information on the statistical data contained in this report and on how they were obtained.
Categories of Foreign Visitors Foreign visitors to Laos are grouped into two categories: international tourists and regional tourists (day trippers). � International tourists are those tourists who enter Laos with a valid passport and visa obtained from a Lao embassy or consulate abroad, or a visa obtained on arrival at an international border checkpoint. � Regional tourists are tourists from neighboring countries such as: Thailand, China, Myanmar, Vietnam and Cambodia, which share borders with Laos. They enter Laos with valid border passes or passports. Although some of them are called “day trippers,” they may make overnight stays. From 1991 to 2002, there was a type of tourists called Tourists for visa extension. They are temporary workers in Thailand who cross over the border into Laos in order to extend their three-month visas before reentering Thailand. These tourists are mainly from India, Pakistan, Sri Lanka, Nepal and Bangladesh. However, from 2003 this type of tourist has been reclassified as "international tourists".
Data Collection � From 1990 to 1994, statistical data on international tourists were collected from embarkation/disembarkation cards of the immigration department and from documents received by the LNTA from local travel companies. These documents contain the following information: Name of travel company
Name of tourist
Sex
Passport number
Nationality
Carrier
Duration of stay
Port of entry
Place of stay

Source of data: Lao National Tourism Administration
2
Since 1995, data on international tourists have been collected only from embarkation / disembarkation cards of the immigration department. � Data on regional tourists were collected from tabulations sent to the LNTA by immigration officers at each border checkpoint. � Data on tourists for visa extension were obtained from information received by the LNTA from local travel companies responsible for processing the documents of tourists for visa extension. � Data on tourist profiles, length of stay, and average expenditure per person per day were all calculated using statistical surveys conducted periodically through sampling survey methods.
Entry Ports
By air: � Wattay International Airport is the main entry point by air for international tourists; flights are available through Thai Airways, Lao Airlines, Vietnam Airways, Air Asia and China Southern Airlines from Vientiane to Bangkok, Chiang Mai, Hanoi, Ho Chi Minh, kuala Lumpur, Kunming, Phnom Penh, and Siem Reap. � Luang Prabang Airport is now an international entry point, and regular flights are available from Luang Prabang to Chiang Mai, Bangkok and Hanoi on Lao Airlines, Bangkok Airways and Vietnam Airlines. � Savannakhet Airport, the only international flight on this route is from Savannakhet to Bangkok and vice-versa operated by Lao Airlines. � Pakse Airport is stopover point from Vientiane to Phnom Penh/Siem Reap. Lao Airlines flies three times a week from Pakse to Bangkok via Savannakhet. � In addition, there are several provincial airports, used only for domestic flights within the Lao PDR.
By land:
From Thailand: � Mittaphab (Friendship) Bridge, Vientiane Capital City, the major point of entry for regional and international tourists. � Houei Xay, Bokeo Province. � Thakhek, Khammouane Province. � Dan Savanh, Savannakhet Province. � Mittaphab (Friendship) Bridge II, Savannakhet Province. � Vang Tao, Champassack Province. � Nam Heuang Friendship Bridge Lao-Thai, Sayabouli Province. � Kenthao, Mouang Ngeun, Sayabouli Province (regional border checkpoint only).
Source of data: Lao National Tourism Administration
3
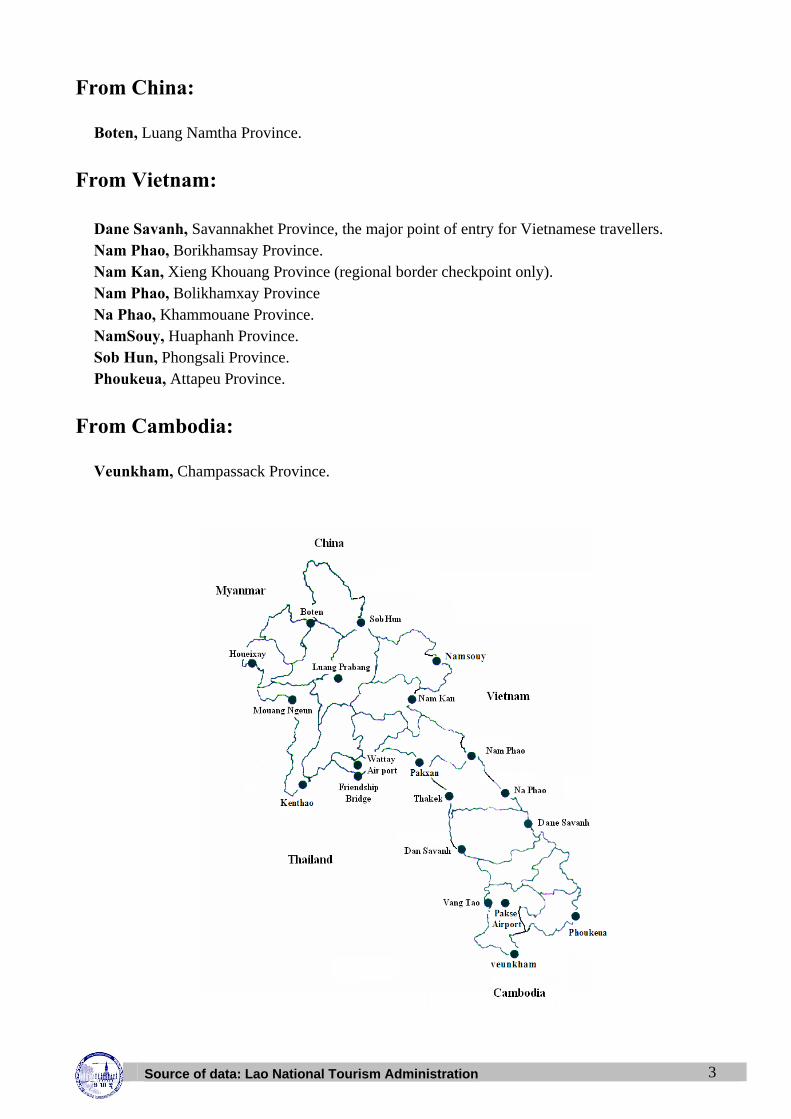
From China: � Boten, Luang Namtha Province.
From Vietnam: � Dane Savanh, Savannakhet Province, the major point of entry for Vietnamese travellers. � Nam Phao, Borikhamsay Province. � Nam Kan, Xieng Khouang Province (regional border checkpoint only). � Nam Phao, Bolikhamxay Province � Na Phao, Khammouane Province. � NamSouy, Huaphanh Province. � Sob Hun, Phongsali Province. � Phoukeua, Attapeu Province.
From Cambodia: � Veunkham, Champassack Province.

Source of data: Lao National Tourism Administration
4
Lao National Tourism Administration Offices
Head Office:
P.O. Box: 3556 Lane Xang Avenue Vientiane, Lao PDR Tel: (856 21) , 212 251, 212 769, 217910, 252961. Fax: (856 21) 212 769, 217910, 252976.
Website: http://www.tourismlaos.gov.la http://www.ecotourismlaos.com http://www.trekkingcentrallaos.com
Provincial Offices: Country code: 856.
Attapeu Tel: (036) 211 056 Fax: (036) 211 014 Bokeo Tel: (084) 211 162 Fax: (084) 211 162 Bolikhamxay Tel: (054) 212 667 Fax: (054) 212 667 Champassak Tel: (031) 212 021 Fax: (031) 212 021 Huaphanh Tel: (064) 312 567 Fax: (064) 312 567 Khammouane Tel: (051) 212 512 Fax: (051) 212 512 Luang Prabang Tel: (071) 212 487 Fax: (071) 252 904 Luang Namtha Tel: (086) 312 047 Fax: (086) 312 047 Oudomxay Tel: (081) 211 797 Fax: (081) 212 482 Phong Saly Tel: (088) 210 098 Fax: (088) 210 098 Saravanh Tel: (034) 211 528 Fax: (034) 211 528 Savannakhet Tel: (041) 212 755 Fax: (041) 212 755 Sekong Tel: (038) 211 361 Fax: (038) 211 013 Xayabouli Tel: (030) 5180095 Fax: (074) 211 183 Xieng Khouang Tel: (061) 312 217 Fax: (061) 312 217 Vientiane Capital Tel: (021) 222 971 Fax: (021) 212 926 Vientiane Province Tel: (023) 211 629 Fax: (023) 211 629
Source of data: Lao National Tourism Administration
5
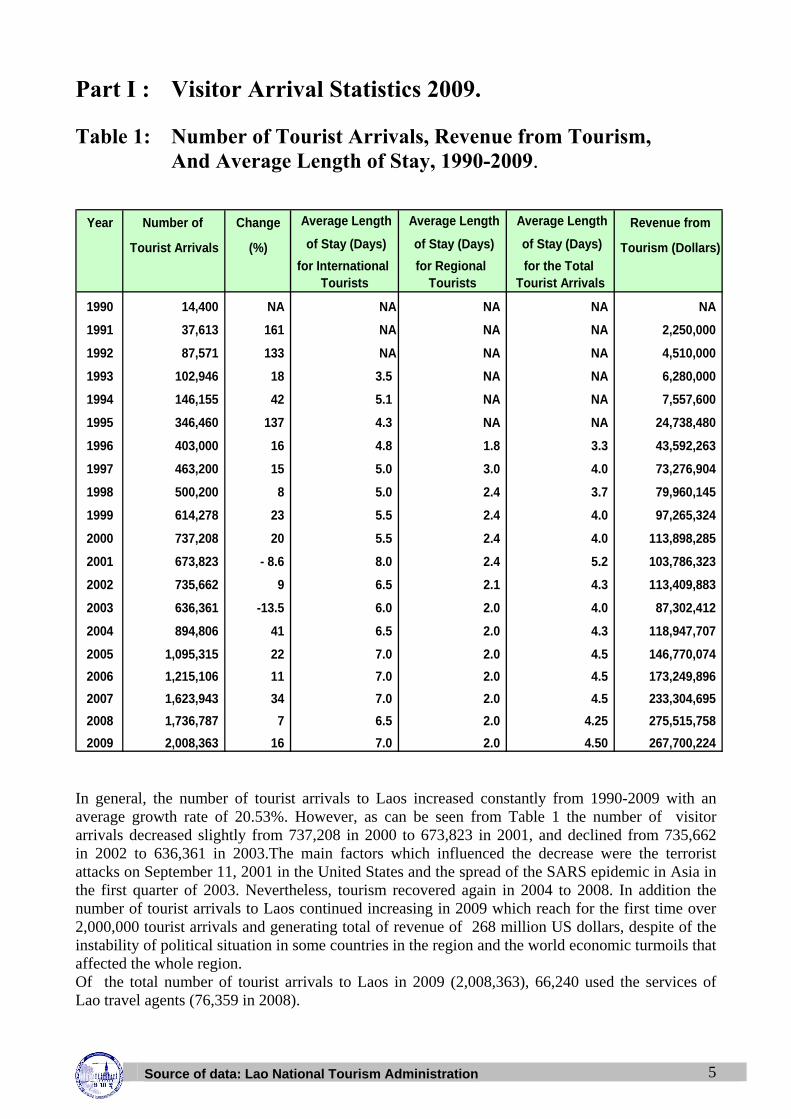
Part I : Visitor Arrival Statistics 2009. Table 1: Number of Tourist Arrivals, Revenue from Tourism,
And Average Length of Stay, 1990-2009.
Year Number of Change Average Length Average Length Average Length Revenue from
Tourist Arrivals (%) of Stay (Days) of Stay (Days) of Stay (Days) Tourism (Dollars)for International
Touristsfor Regional
Touristsfor the Total
Tourist Arrivals
1990 14,400 NA NA NA NA NA
1991 37,613 161 NA NA NA 2,250,000
1992 87,571 133 NA NA NA 4,510,000
1993 102,946 18 3.5 NA NA 6,280,000
1994 146,155 42 5.1 NA NA 7,557,600
1995 346,460 137 4.3 NA NA 24,738,480
1996 403,000 16 4.8 1.8 3.3 43,592,263
1997 463,200 15 5.0 3.0 4.0 73,276,904
1998 500,200 8 5.0 2.4 3.7 79,960,145
1999 614,278 23 5.5 2.4 4.0 97,265,324
2000 737,208 20 5.5 2.4 4.0 113,898,285
2001 673,823 - 8.6 8.0 2.4 5.2 103,786,323
2002 735,662 9 6.5 2.1 4.3 113,409,883
2003 636,361 -13.5 6.0 2.0 4.0 87,302,412
2004 894,806 41 6.5 2.0 4.3 118,947,707
2005 1,095,315 22 7.0 2.0 4.5 146,770,074
2006 1,215,106 11 7.0 2.0 4.5 173,249,896
2007 1,623,943 34 7.0 2.0 4.5 233,304,695
2008 1,736,787 7 6.5 2.0 4.25 275,515,758
2009 2,008,363 16 7.0 2.0 4.50 267,700,224
In general, the number of tourist arrivals to Laos increased constantly from 1990-2009 with an average growth rate of 20.53%. However, as can be seen from Table 1 the number of visitor arrivals decreased slightly from 737,208 in 2000 to 673,823 in 2001, and declined from 735,662 in 2002 to 636,361 in 2003.The main factors which influenced the decrease were the terrorist attacks on September 11, 2001 in the United States and the spread of the SARS epidemic in Asia in the first quarter of 2003. Nevertheless, tourism recovered again in 2004 to 2008. In addition the number of tourist arrivals to Laos continued increasing in 2009 which reach for the first time over 2,000,000 tourist arrivals and generating total of revenue of 268 million US dollars, despite of the instability of political situation in some countries in the region and the world economic turmoils that affected the whole region. Of the total number of tourist arrivals to Laos in 2009 (2,008,363), 66,240 used the services of Lao travel agents (76,359 in 2008).

Source of data: Lao National Tourism Administration
6
Table 2: Number of Tourist Arrivals by Region, 1992-2009.
Year Asia and
199219931994199519961997199819992000200120022003200420052006200720082009
GrowthRate
1,820,571 130,176 53,348 4,268
899,273 131,326 60,061 4,655
1,406,456 147,667 61,463 8,357
498,185 93,960 39,453 4,763730,107 112,092 47,153 5,454
4,496
Africa and Middle East
TotalPacific
Europe The Americas
44
421,196
81,02294,836136,114
510,703
314,470357,692403,781
5,9868,019
20,63530,58238,583
68,56452,076
86,46280,736101,924
604,254553,249579,031 46,704
75,266168,7561,482,499
2,0092,0611,837
11,01914,10218,213
63185336
42,11134,370
25,32631,780
4,3815,4688,003
10,266
6242,6231,6023,231
403,000463,200500,200614,278
87,571102,946146,155346,460
737,208673,823735,662
1,736,787
636,361894,806
1,095,3151,215,1061,623,943
1,008,663 138,935 60,883 6,625
20,23%20.08 % 21,89% 21,27% 30,87%
2,008,363
Market share of tourist arrivals by region(%),1998-2009.
Year 1998 1999 2000 2001 2002 2003 2004 2005 2006 2007 2008 2009Region 100 100 100 100 100 100 100 100 100 100 100 100
Asia and Pacific 84.21 83.14 81.97 82.11 78.71 78.29 81.59 82.10 83.01 86.61 85.36 90.65Europe 10.41 11.16 11.73 11.98 13.85 14.75 12.53 11.99 11.43 9.09 9.72 6.48 Americas 5.06 5.17 5.71 5.10 6.35 6.21 5.27 5.48 5.01 3.78 4.33 2.66 Africa and Middle East 0.32 0.53 0.59 0.81 1.09 0.75 0.61 0.42 0.55 0.51 0.59 0.21
Change over previous year(%).
Year 98/97. 99/98. 00/99. 01/00. 02/01. 03/02. 04/03. 05/04. 06/05. 07/06. 08/07. 09/08.Region 7.98 22.81 20.01 -8.60 9.18 -13.5 41 22 11 34 7 16
Asia and Pacific 4.31 21.25 18.32 -8.44 5 -14 47 23 12 39 5 23Europe 34.97 31.66 26.10 -6.62 26 -8 19 17 6 6 14 -23Americas 39.05 25.48 32.51 -18.38 36 -16 20 27 1 1 22 -29Africa and Middle East -38.92 101.7 35.59 24.81 46 -40 15 -15 42 26 23 -58
Source of data: Lao National Tourism Administration
7
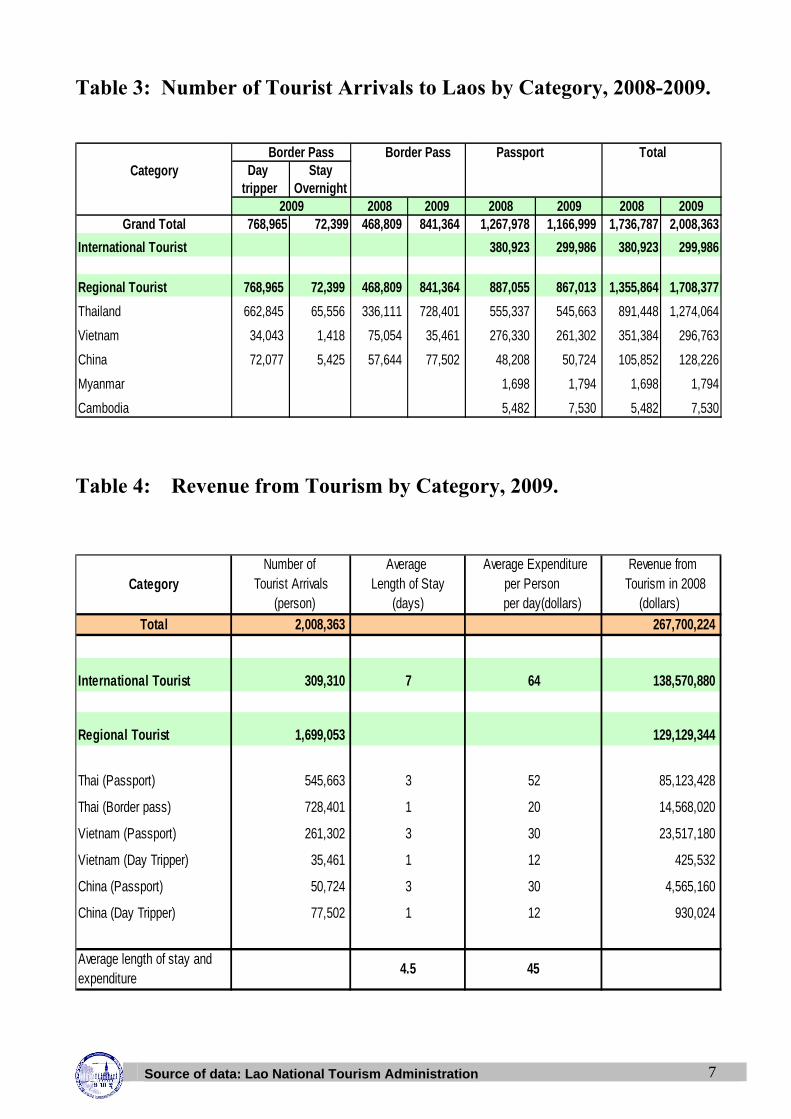
Table 3: Number of Tourist Arrivals to Laos by Category, 2008-2009.
Passport TotalCategory Day Stay
tripper Overnight2008 2009 2008 2009 2008 2009
Grand Total 768,965 72,399 468,809 841,364 1,267,978 1,166,999 1,736,787 2,008,363
International Tourist 380,923 299,986 380,923 299,986
Regional Tourist 768,965 72,399 468,809 841,364 887,055 867,013 1,355,864 1,708,377
Thailand 662,845 65,556 336,111 728,401 555,337 545,663 891,448 1,274,064
Vietnam 34,043 1,418 75,054 35,461 276,330 261,302 351,384 296,763
China 72,077 5,425 57,644 77,502 48,208 50,724 105,852 128,226
Myanmar 1,698 1,794 1,698 1,794
Cambodia 5,482 7,530 5,482 7,530
2009
Border Pass Border Pass
Table 4: Revenue from Tourism by Category, 2009.
Revenue fromCategory Tourism in 2008
(dollars)
Total
International Tourist
Regional Tourist
Thai (Passport)
Thai (Border pass)
Vietnam (Passport)
Vietnam (Day Tripper)
China (Passport)
China (Day Tripper)
Average length of stay and expenditure
4.5 45
77,502 1 12 930,024
50,724 3 30 4,565,160
425,532
14,568,020
261,302 3 30 23,517,180
728,401 1 20
35,461 1 12
545,663 3 52
1,699,053
Tourist Arrivals Length of Stay
309,310 7 64
85,123,428
267,700,224
129,129,344
Number of Average Average Expenditure
138,570,880
(person) (days) per day(dollars)per Person
2,008,363

Source of data: Lao National Tourism Administration
8
Table 5: Tourist Arrivals to Laos by Nationality (Percent Increase) 2003-2009.
Country of Origin 2003 2004 2005 2006 2007 2008 Change 2009 Change
Number Number Number Number Number Number 08/07(%) Number 09/08(%) Grand Total 636,361 894,806 1,095,315 1,215,106 1,623,943 1,736,787 7 2,008,363 16Asia and Pacific 498,185 730,107 899,273 1,008,663 1,406,456 1,482,499 5 1,820,571 23ASEAN 432,720 638,747 794,044 891,807 1,272,724 1,285,531 1 1,611,009 25Brunei 357 385 385 302 234 338 44 267 -21Cambodia 2,702 3,871 5,179 3,888 4,351 5,482 26 7,530 37Indonesia 1,443 1,770 2,784 2,415 2,032 2,043 1 3,158 55Malaysia 3,072 4,563 6,609 6,846 7,937 15,625 97 13,816 -12Myanmar 744 939 1,632 1,126 1,247 1,698 36 1,794 6Philippines 2,618 3,317 5,247 6,433 11,401 12,647 11 8,331 -34Singapore 2,442 3,409 3,868 4,511 5,486 4,866 -11 5,286 9Thailand 377,748 489,677 603,189 675,845 949,452 891,448 -6 1,274,064 43Vietnam 41,594 130,816 165,151 190,442 290,584 351,384 21 296,763 -16Non-ASEAN 65,465 91,360 105,229 116,856 133,732 196,968 47 209,562 6Australia 11,697 15,149 20,323 22,021 24,492 28,180 15 24,209 -14China 21,232 33,019 39,210 50,317 54,920 105,852 93 128,226 21India 1,590 1,845 2,096 2,100 2,361 2,652 12 2,280 -14Japan 17,766 20,319 22,601 23,147 29,770 31,569 6 28,081 -11Korea 5,442 7,098 9,189 10,963 13,060 18,065 38 17,876 -1New Zealand 1,977 3,021 3,778 3,567 3,759 4,364 16 3,479 -20Taiwan 3,316 2,160 4,739 2,168 2,731 2,665 -2 2,519 -5Others 2,445 8,749 3,293 2,573 2,639 3,621 37 2,892 -20Europe 93,960 112,092 131,326 138,935 147,667 168,756 14 130,176 -23Austria 938 1,394 1,687 2,041 2,231 2,843 27 2,450 -14Belgium 3,762 3,921 4,256 4,345 4,553 4,908 8 3,868 -21Denmark 2,414 2,563 2,852 3,658 3,648 3,657 0 2,977 -19Finland 982 1,293 1,494 2,110 2,335 2,729 17 1,985 -27France 23,958 27,806 35,371 32,453 34,584 39,077 13 31,775 -19Germany 12,146 14,009 16,752 18,004 19,299 25,191 31 17,710 -30Greece 179 324 271 538 510 569 12 537 -6Italy 3,241 4,103 5,032 5,884 6,605 6,467 -2 5,481 -15Netherlands 6,638 6,957 7,796 9,294 10,017 11,315 13 8,504 -25Norway 1,652 1,823 2,176 2,721 2,748 2,909 6 2,221 -24Russia 1,031 1,315 1,672 1,799 2,270 3,206 41 2,861 -11Spain 893 2,017 2,560 3,128 3,392 3,117 -8 2,962 -5Sweden 4,244 4,994 6,460 6,642 7,035 6,827 -3 4,150 -39Switzerland 3,844 4,310 5,190 5,957 5,782 6,526 13 5,827 -11United Kingdom 22,541 27,402 29,977 31,684 31,352 36,038 15 27,044 -25Others 5,497 7,861 7,780 8,677 11,306 13,377 18 9,824 -27The Americas 39,453 47,153 60,061 60,883 61,463 75,266 22 53,348 -29Canada 8,006 9,048 11,447 12,419 13,050 14,695 13 10,955 -25USA 30,133 37,181 47,427 46,829 45,691 54,717 20 39,339 -28Others 1,314 924 1,187 1,635 2,722 5,854 115 3,054 -48Africa and Middle East 4,763 5,454 4,655 6,625 8,357 10,266 23 4,268 -58Israel 3,354 4,088 3,146 4,781 4,356 4,090 -6 2,236 -45Others 1,409 1,366 1,509 1,844 4,001 6,176 54 2,032 -67

Source of data: Lao National Tourism Administration
9
Table 6: Tourist Arrivals to Laos by Nationality (Market Share) 2003-2009.
2003 2004 2005 2006 2007Number Number Number Number Number Number Share% Number Share%
Grand Total 636,361 894,806 1,095,315 1,215,106 1,623,943 1,736,787 100% 2,008,363 100%Asia and Pacific 498,185 730,107 899,273 1,008,663 1,406,456 1,482,499 85.36 1,820,571 90.65ASEAN 432,720 638,747 794,044 891,807 1,272,724 1,285,531 74.02 1,611,009 80.22Brunei 357 385 385 302 234 338 0.02 267 0.01 Cambodia 2,702 3,871 5,179 3,888 4,351 5,482 0.32 7,530 0.37 Indonesia 1,443 1,770 2,784 2,415 2,032 2,043 0.12 3,158 0.16 Malaysia 3,072 4,563 6,609 6,846 7,937 15,625 0.90 13,816 0.69 Myanmar 744 939 1,632 1,126 1,247 1,698 0.10 1,794 0.09 Philippines 2,618 3,317 5,247 6,433 11,401 12,647 0.73 8,331 0.41 Singapore 2,442 3,409 3,868 4,511 5,486 4,866 0.28 5,286 0.26 Thailand 377,748 489,677 603,189 675,845 949,452 891,448 51.33 1,274,064 63.44 Vietnam 41,594 130,816 165,151 190,442 290,584 351,384 20.23 296,763 14.78 Non-ASEAN 65,465 91,360 105,229 116,856 133,732 196,968 11.34 209,562 10.43Australia 11,697 15,149 20,323 22,021 24,492 28,180 1.62 24,209 1.21 China 21,232 33,019 39,210 50,317 54,920 105,852 6.09 128,226 6.38 India 1,590 1,845 2,096 2,100 2,361 2,652 0.15 2,280 0.11 Japan 17,766 20,319 22,601 23,147 29,770 31,569 1.82 28,081 1.40 Korea 5,442 7,098 9,189 10,963 13,060 18,065 1.04 17,876 0.89 New Zealand 1,977 3,021 3,778 3,567 3,759 4,364 0.25 3,479 0.17 Taiwan 3,316 2,160 4,739 2,168 2,731 2,665 0.15 2,519 0.13 Others 2,445 8,749 3,293 2,573 2,639 3,621 0.21 2,892 0.14 Europe 93,960 112,092 131,326 138,935 147,667 168,756 9.72 130,176 6.48 Austria 938 1,394 1,687 2,041 2,231 2,843 0.16 2,450 0.12 Belgium 3,762 3,921 4,256 4,345 4,553 4,908 0.28 3,868 0.19 Denmark 2,414 2,563 2,852 3,658 3,648 3,657 0.21 2,977 0.15 Finland 982 1,293 1,494 2,110 2,335 2,729 0.16 1,985 0.10 France 23,958 27,806 35,371 32,453 34,584 39,077 2.25 31,775 1.58 Germany 12,146 14,009 16,752 18,004 19,299 25,191 1.45 17,710 0.88 Greece 179 324 271 538 510 569 0.03 537 0.03 Italy 3,241 4,103 5,032 5,884 6,605 6,467 0.37 5,481 0.27 Netherlands 6,638 6,957 7,796 9,294 10,017 11,315 0.65 8,504 0.42 Norway 1,652 1,823 2,176 2,721 2,748 2,909 0.17 2,221 0.11 Russia 1,031 1,315 1,672 1,799 2,270 3,206 0.18 2,861 0.14 Spain 893 2,017 2,560 3,128 3,392 3,117 0.18 2,962 0.15 Sweden 4,244 4,994 6,460 6,642 7,035 6,827 0.39 4,150 0.21 Switzerland 3,844 4,310 5,190 5,957 5,782 6,526 0.38 5,827 0.29 United Kingdom 22,541 27,402 29,977 31,684 31,352 36,038 2.07 27,044 1.35 Others 5,497 7,861 7,780 8,677 11,306 13,377 0.77 9,824 0.49 The Americas 39,453 47,153 60,061 60,883 61,463 75,266 4.33 53,348 2.66 Canada 8,006 9,048 11,447 12,419 13,050 14,695 0.85 10,955 0.55 USA 30,133 37,181 47,427 46,829 45,691 54,717 3.15 39,339 1.96 Others 1,314 924 1,187 1,635 2,722 5,854 0.34 3,054 0.15 Africa and Middle East 4,763 5,454 4,655 6,625 8,357 10,266 0.59 4,268 0.21 Israel 3,354 4,088 3,146 4,781 4,356 4,090 0.24 2,236 0.11 Others 1,409 1,366 1,509 1,844 4,001 6,176 0.36 2,032 0.10
Country of Origin 2008 2009
Source of data: Lao National Tourism Administration
10
Market Situation The financial crisis has affected the growth of tourist arrivals to Lao PDR in 2009, the Asia and Pacific was the only region that showed the increase in tourist arrivals while international tourists, considered the most important market for Lao tourism, decreased from 380,923 in 2008 to 299,986 in 2009, or about 21% of decrease.
1. Asia and Pacific Tourists from Asia and Pacific which represented the largest portion of visitors in 2009 with 91% of the total tourist arrivals, increased 23% over 2008. The most remarkable change was the increase in number of visitors from Thailand (more than 60%). The main factor that influenced this considerable growth was maybe Thai visitors would like to go away from the difficulties in political situations. In 2009, although the number of visitors from China and Vietnam were among the largest, tourists from Thailand (1,274,064), Japan (28,081) and Australia (24,209) still brought the largest amount of revenue into Laos. As a result, the priority markets for tourism in Laos from Asia and Pacific are Thailand, Japan , Australia and Vietnam.
2. Europe In 2009,the number of tourist arrivals from Europe slumped considerably (-23%), the market share for Europe also dropped from 10% in 2008 to about only 6% in 2009. It is interesting to notice that all nationalities from European market showed the decrease with Sweden being the most (-39%) followed by Germany (-30%) while Spain was the least with -5%. 3. The Americas The situations of American market were similar to those of European, even worse with the decrease of 29%. The market share also dropped from 4% in 2008 to a little bit over 2% in 2009. The most important markets from this region were the United States which went down 28% and Canada (-25%).

Source of data: Lao National Tourism Administration
11
Table 7: Tourist Arrivals to Laos by Month in 2009. Country Jan Feb Mar Apr May Jun Jul Aug Sep Oct Nov Dec Total
Number Number Number Number Number Number Number Number Number Number Number Number Number Grand Total 186,668 176,596 154,059 101,288 117,754 140,929 161,055 156,239 178,194 191,697 190,132 253,752 2,008,363Asia and Pacific 164,301 155,506 137,827 90,756 107,627 131,380 147,331 141,613 167,971 176,314 170,704 229,196 1,820,571ASEAN 146,530 142,341 128,365 74,404 90,711 123,339 127,726 119,108 148,088 155,537 150,253 204,607 1,611,009Brunei 25 13 17 8 11 5 11 5 18 27 29 98 267 Cambodia 179 600 347 1,001 1,601 611 461 374 314 827 473 742 7,530 Indonesia 121 101 109 131 111 105 131 99 646 193 204 1,270 3,158 Malaysia 1,093 1,108 1,000 674 947 1,191 1,080 852 1,024 1,331 1,325 2,191 13,816 Myanmar 115 108 154 79 102 88 39 72 79 96 130 732 1,794 Philippines 596 695 795 545 679 411 303 374 789 794 1,156 1,194 8,331 Singapore 406 320 372 251 304 357 298 253 336 409 495 1,485 5,286 Thailand 125,185 116,132 103,209 51,537 69,099 94,119 98,640 95,281 115,498 124311 115,738 165,315 1,274,064Vietnam 118,810 23,264 22,362 20,178 17,857 26,452 26,763 21,797 29,384 27549 30,703 31,643 296,763 Non-ASEAN 17,771 13,156 9,507 16,352 16,916 8,041 19,605 22,505 19,883 20,777 20,451 24,589 209,562 Australia 3,445 2,069 1,573 1,431 1,147 1,544 1,723 1,464 1,530 2286 2,041 3,956 24,209 China 8,237 5,737 2,608 11,701 12,007 3,423 13,308 16,190 13,354 13,858 13,598 14,205 128,226 India 196 164 180 179 213 175 166 164 193 134 205 311 2,280 Japan 2,738 3,081 3,115 1,571 1,888 1,339 1,410 2,256 2,893 2,342 2,449 2,999 28,081 Korea 2,222 1,433 1,394 974 1,036 941 2,340 1,574 1,096 1,315 1,513 2,038 17,876 New Zealand 484 283 225 157 218 287 283 281 232 328 222 479 3,479 Taiwan 177 179 159 153 164 172 174 283 261 266 234 297 2,519 Others 272 219 253 186 243 160 201 293 324 248 189 304 2,892 Europe 15,350 15,039 11,239 6,766 6,669 6,174 9,927 11,407 7,329 10,322 13,175 16,779 130,176 Austria 383 289 306 118 150 54 160 152 110 186 274 268 2,450 Belgium 412 439 265 165 157 150 411 276 218 320 452 603 3,868 Denmark 370 488 352 150 138 108 172 146 193 216 295 349 2,977 Finland 321 283 183 93 109 104 84 56 110 144 164 334 1,985 France 3,690 3,510 2,851 1,837 1,614 1,360 2,598 3,037 1,602 2,483 3,101 4,092 31,775 Germany 2,327 2,339 1,801 938 774 640 775 1,058 891 1,487 2,099 2,581 17,710 Greece 70 62 39 14 21 9 26 76 16 28 77 99 537 Italy 810 647 455 151 154 147 263 903 247 319 690 695 5,481 Netherlands 1,063 982 580 281 411 374 1,052 888 518 647 714 994 8,504 Norway 304 301 261 127 146 90 132 90 110 140 254 266 2,221 Russia 388 225 281 181 173 113 109 144 213 271 364 399 2,861 Spain 175 219 140 92 122 87 311 657 247 275 323 314 2,962 Sweden 637 664 383 272 241 180 144 128 162 302 417 620 4,150 Switzerland 826 676 422 286 268 209 373 291 262 439 821 954 5,827 United Ki 2,649 2,816 2,137 1,528 1,631 1,983 2,375 2,690 1,734 2,343 2,095 3,063 27,044 Others 925 1,099 783 533 560 566 942 815 696 722 1,035 1,148 9,824 The Americas 6,558 5,661 4,606 3,503 3,208 3,065 3,431 2,898 2,473 4,693 6,026 7,226 53,348 Canada 1,649 1,351 1,107 661 757 508 808 572 427 847 899 1,369 10,955 USA 4,448 4,047 3,330 2,669 2,165 2,362 2,399 2,153 1,824 3,520 4,898 5,524 39,339 Others 461 263 169 173 286 195 224 173 222 326 229 333 3,054 Africa and Middle East 459 390 342 263 250 310 366 321 421 368 227 551 4,268 Israel 269 193 187 105 109 112 174 207 233 207 106 334 2,236 Others 190 197 155 158 141 198 192 114 188 161 121 217 2,032
Graph 1 : Total number of Tourist arrivals from 1994 to 2009.
Source of data: Lao National Tourism Administration
12
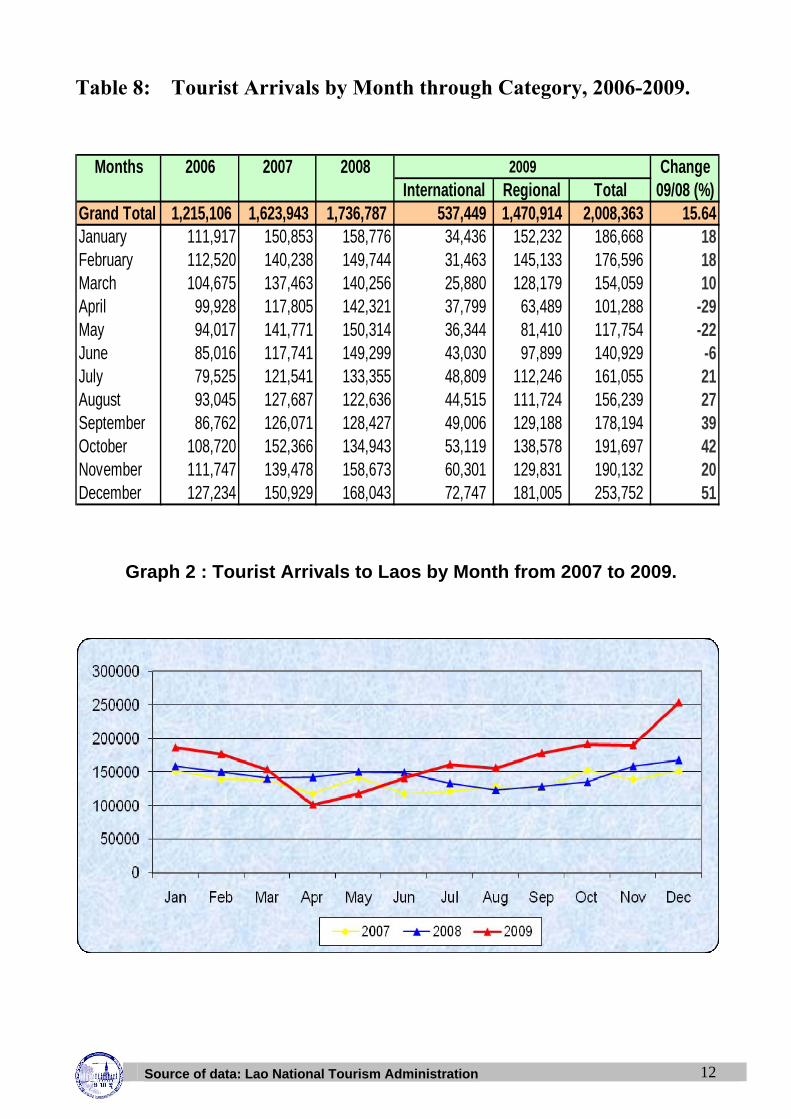
Table 8: Tourist Arrivals by Month through Category, 2006-2009.
Months 2006 2007 2008 ChangeInternational Regional Total 09/08 (%)
Grand Total 1,215,106 1,623,943 1,736,787 537,449 1,470,914 2,008,363 15.64January 111,917 150,853 158,776 34,436 152,232 186,668 18February 112,520 140,238 149,744 31,463 145,133 176,596 18March 104,675 137,463 140,256 25,880 128,179 154,059 10April 99,928 117,805 142,321 37,799 63,489 101,288 -29May 94,017 141,771 150,314 36,344 81,410 117,754 -22June 85,016 117,741 149,299 43,030 97,899 140,929 -6July 79,525 121,541 133,355 48,809 112,246 161,055 21August 93,045 127,687 122,636 44,515 111,724 156,239 27September 86,762 126,071 128,427 49,006 129,188 178,194 39October 108,720 152,366 134,943 53,119 138,578 191,697 42November 111,747 139,478 158,673 60,301 129,831 190,132 20December 127,234 150,929 168,043 72,747 181,005 253,752 51
2009
Graph 2 : Tourist Arrivals to Laos by Month from 2007 to 2009.

Source of data: Lao National Tourism Administration
13

Source of data: Lao National Tourism Administration
14
Table 10: Top Ten Generating Markets, 2006-2009. Note: Table ranks country by tourist expenditures, not total arrivals. Rank 2006 Number Share(%) 2007 Number Share(%)
1 Thailand 675,845 56 Thailand 949,452 58
2 USA 46,829 4 USA 45,691 3
3 France 32,453 3 France 34,584 2
4 UK 31,684 3 UK 31,352 2
5 Japan 23,147 2 Japan 29,770 2
6 Vietnam 190,442 16 Vietnam 290,584 18
7 Australia 22,021 2 Australia 24,492 2
8 Germany 18,004 1 Germany 19,299 1
9 Canada 12,419 1 Canada 13,050 1
10 China 50,317 4 China 54,920 3
Other 111,945 9 Other 130,749 8
Rank 2008 Number Share(%) 2009 Number Share(%)1 Thailand 891,448 51 Thailand 1,274,064 63
2 USA 54,717 3 USA 39,339 2
3 Vietnam 351,384 20 Vietnam 296,763 15
4 France 39,077 2 France 31,775 2
5 UK 36,038 2 Japan 28,081 1
6 Japan 31,569 2 UK 27,044 1
7 Australia 28,180 2 Australia 24,209 1
8 Germany 25,191 1 Korea 17,876 1
9 Canada 14,695 1 Germany 17,710 1
10 China 105,852 6 China 128,226 6
Other 158,636 9 Other 123,276 6
Priority Markets for Tourism in Laos
Priority Markets 1: EUROPEAN MARKET
France
United Kingdom
Germany
Priority Markets 2: ASIAN AND PACIFIC MARKET
Thailand
Japan
Australia Vietnam
Priority Markets 3: AMERICAS MARKET
USA
Canada

Source of data: Lao National Tourism Administration
15
Table 11: Tourist Arrivals by Port of Entry through Category, 2005-2009.
Port of Entry 2005 2006 2007 2008 2009 Regional Percent Percent
Visitors Share Change Grand Total 1,095,315 1,215,106 1,623,943 1,736,787 2,008,363 1,699,053 2009 (%) 09/08 (%)Wattay Airport 105,533 106,232 105,673 151,941 144,632 40,114 7.20 -4.81Friendship Bridge I 541,016 582,176 656,470 547,586 517,063 483,452 25.75 -5.57Boten 29,373 37,660 44,844 91,489 134,576 129,124 6.70 47.10Houei Xay 59,613 73,292 73,814 100,966 110,659 63,501 5.51 9.60Friendship Bridge II & 135,686 165,360 399,667 408,803 668,980 649,959 33.31 63.64Vang Tao+Veunkham 95,325 93,722 103,288 111,361 114,636 89,809 5.71 2.94Nam Phao 42,456 40,744 80,288 84,401 91,861 83,719 4.57 8.84Thakhek + Naphao 25,021 49,587 71,037 94,313 100,496 94,484 5.00 6.56Kenthao 14,384 11,849 18,526 19,782 20,153 18,847 1.00 1.88LuangPrabang 33,064 35,257 54,222 66,233 68,669 12,979 3.42 3.68NamKan 11,700 15,438 11,649 12,695 12,097 11,687 0.60 -4.71NamSouy 2,144 3,789 4,465 6,611 7,868 7,351 0.39 19.01Sobhum NA NA NA 26,094 8,324 6,121 0.41 -68.10Phoukeua NA NA NA 14,512 8,349 7,906 0.42 -42.47
Graph 3: Percentage of Tourist Arrivals
Wattay Airport7%
Friendship bridge I26%
Savannakhet33%
Others34%
Table 12: Visitors by Province, 2002-2009. Province 2002 2003 2004 2005 2006 2007 2008 2009 Vientiane Capital 506,677 437,059 544,253 653,212 729,272 869,642 878,507 807,445 Champassak 45,635 65,827 63,963 99,044 113,684 165,750 220,214 278,054 Khammoune 19,596 18,782 12,260 28,000 98,906 154,525 177,097 170,579 Bokeo 65,045 45,469 79,006 89,027 82,512 112,157 145,567 140,414 Luang Namtha 19,319 29,720 41,658 49,258 47,788 88,427 197,202 244,614 Savannakhet 98,962 64,050 118,821 192,560 192,385 430,604 474,826 791,924 Luang Prabang 65,872 99,150 105,513 133,569 151,703 186,819 231,575 237,683 Bolikhamxay 30,758 34,418 55,087 63,579 71,394 69,773 84,401 140,736 Xieng Khouang 16,223 5,062 15,015 24,174 19,586 25,531 22,729 21,346 Saravanh 4,823 5,800 6,400 8,000 10,000 10,500 26,802 28,142 Oudomxay 36,000 23,911 54,695 54,721 43,400 76,970 101,761 107,419 Huaphanh 2,819 2,204 588 3,175 3,760 7,247 8,848 15,098 Xayabouli 10,840 6,728 16,005 15,914 14,266 19,751 23,043 23,061 Vientiane Province 30,480 47,899 82,521 92,657 142,442 230,548 268,891 290,015 Phongsali 8,500 5,732 6,543 9,452 10,240 22,850 41,378 36,752 Attapeu 6,831 9,149 9,668 13,740 14,841 16,176 27,728 32,718 Sekong 574 2,242 4,232 6,526 7,111 12,962 13,125 19,000

Source of data: Lao National Tourism Administration
16
Table13: Visitor Arrivals to Luang Prabang Province by Nationality, 2006-2009. Country of Origin Change(%)
Number Share% Number Share% Number Share% Number Share% 2009/2008Total 275,154 311,645 344,029 375,669 9Laos 123,451 124,826 112,454 137,986 23Foreigner 151,703 100% 186,819 100% 231,575 100% 237,683 3Asia and Pacific 52,796 34.80 76,491 40.94 96,201 41.54 93,785 39.46 -3
ASEAN 23,073 15.21 39,518 21.15 50,502 21.81 46,714 19.65 -8
Brunei 61 0.04 190 0.10 163 0.07 50 0.02 -69
Cambodia 339 0.22 301 0.16 323 0.14 144 0.06 -55
Indonesia 207 0.14 201 0.11 171 0.07 296 0.12 73
Malaysia 705 0.46 606 0.32 520 0.22 866 0.36 67
Myanmar 88 0.06 172 0.09 222 0.10 201 0.08 -9
Philippines 247 0.16 658 0.35 514 0.22 404 0.17 -21
Singapore 617 0.41 923 0.49 1,948 0.84 1,473 0.62 -24
Thailand 19,822 13.07 31,911 17.08 32,482 14.03 39,154 16.47 21
Vietnam 987 0.65 4,556 2.44 14,159 6.11 4,126 1.74 -71
Non-ASEAN 29,723 19.59 36,973 19.79 45,699 19.73 47,071 19.80 3
Australia 10,560 6.96 14,978 8.02 13,176 5.69 16,196 6.81 23
China 3,258 2.15 4,161 2.23 9,990 4.31 9,487 3.99 -5
India 366 0.24 338 0.18 523 0.23 332 0.14 -37
Japan 9,730 6.41 10,029 5.37 9,555 4.13 11,165 4.70 17
Korea 2,302 1.52 4,649 2.49 6,194 2.67 4,891 2.06 -21
New Zealand 2,180 1.44 1,941 1.04 5,071 2.19 3,810 1.60 -25
Taiwan 75 0.05 380 0.20 234 0.10 399 0.17 71
Others 1,252 0.83 497 0.27 956 0.41 791 0.33 -17
67,276 44.35 78,879 42.22 83,697 36.14 92,617 38.97 11
Austria 1,834 1.21 1,664 0.89 1,267 0.55 3,914 1.65 209
Belgium 1,871 1.23 2,206 1.18 3,068 1.32 4,399 1.85 43
Denmark 1,858 1.22 2,563 1.37 1,804 0.78 970 0.41 -46
Finland 844 0.56 494 0.26 1,149 0.50 978 0.41 -15
France 13,503 8.90 14,902 7.98 20,602 8.90 19,284 8.11 -6
Germany 9,198 6.06 14,214 7.61 16,763 7.24 14,206 5.98 -15
Greece 254 0.17 373 0.20 160 0.07 255 0.11 59
Italy 3,441 2.27 3,627 1.94 7,134 3.08 6,041 2.54 -15
Netherlands 5,285 3.48 4,297 2.30 1,181 0.51 3,506 1.48 197
Norway 854 0.56 1,847 0.99 588 0.25 598 0.25 2
Russia 427 0.28 726 0.39 1,130 0.49 790 0.33 -30
Spain 2,732 1.80 1,697 0.91 682 0.29 1,880 0.79 176
Sweden 2,217 1.46 1,586 0.85 876 0.38 2,010 0.85 129
Switzerland 2,431 1.60 2,632 1.41 1,147 0.50 2,286 0.96 99
United Kingdom 17,120 11.29 21,255 11.38 22,237 9.60 27,145 11.42 22
Others 3,407 2.25 4,796 2.57 3,909 1.69 4,355 1.83 11
The Americas 24,446 16.11 29,849 15.98 43,865 18.94 46,703 19.65 6
Canada 7,770 5.12 8,935 4.78 17,928 7.74 16,053 6.75 -10
USA 14,303 9.43 18,096 9.69 21,859 9.44 25,899 10.90 18
Others 2,373 1.56 2,818 1.51 4,078 1.76 4,751 2.00 17
Africa and Middle East 7,185 4.74 1,600 0.86 7,812 3.37 4,578 1.93 -41
Israel 5,180 3.41 1,049 0.56 5,672 2.45 3,432 1.44 -39
Others 2,005 1.32 551 0.29 2,140 0.92 1,146 0.48 -46
2008 2009
Europe
2006 2007

Source of data: Lao National Tourism Administration
17
Table 14 : Out-going Lao Travellers, 2007-2009.
Border Check Total Total TotalPoint 2007 2008 Official Visit Travel Business Other 2009Total 589,018 766,386 7,953 103,961 263,939 75,731 327,144 778,728
Mitthapab bridge 229,495 266,522 398 37,393 511 15 235,544 273,861 Border Pass 22,661 7,779 194,919 194,919 Passport 206,834 258,743 398 37,393 511 15 40,625 78,942 Luangnamtha 17,619 42,127 481 1,289 13,075 18,354 4,527 37,726 Border Pass 17,091 41,357 420 1,220 12,802 18,249 4,438 37,129 Passport 528 770 61 69 273 105 89 597 Bolikhamsay 27,804 43,084 2,890 3,113 24,706 5,237 1,607 37,553 Border Pass 17,301 30,366 759 2,513 14,888 4,950 13 23,123 Passport 10,503 12,718 2,131 600 9,818 287 1,594 14,430 Khammouane 16,579 62,564 106 19,050 6,702 135 1,833 27,826 Border Pass 11,107 43,413 3,087 5,988 104 1,789 10,968 Passport 5,472 19,151 106 15,963 714 31 44 16,858 Savannakhet 126,274 126,757 2,908 13,007 178,229 26,502 20,936 241,582 Border Pass 80,049 34,474 593 5,871 96,716 22,145 3,076 128,401 Passport 46,225 92,283 2,315 7,136 81,513 4,357 17,860 113,181 Wattay Airport 27,668 24,271 - - - - 7,001 7,001 Border Pass - - - Passport 27,668 24,271 7,001 7,001 Houaysai 24,391 34,295 - 1,049 21,306 - 3,529 25,884 Border Pass 19,611 24,216 1,049 10,601 3,483 15,133 Passport 4,780 10,079 10,705 46 10,751 Champasak 38,881 51,986 165 13,278 18,838 1,304 1,953 35,538 Border Pass 25,283 23,326 3,087 5,980 1,041 1,789 11,897 Passport 13,598 28,660 165 10,191 12,858 263 164 23,641 Xayabouli 74,443 75,723 29 12,693 - 22,590 44,892 80,204 Border Pass 70,402 66,780 3,238 22,590 44,046 69,874 Passport 4,041 8,943 29 9,455 846 10,330 Huaphanh 1,917 2,486 439 2 458 810 63 1,772 Border Pass 1,602 1,552 74 288 720 42 1,124 Passport 315 934 365 2 170 90 21 648 Luangprabang 1,008 1,402 202 842 2 1 - 1,047 Border Pass - - - Passport 1,008 1,402 202 842 2 1 1,047 Xiengkhouang 2,939 3,445 123 2,245 112 783 3,257 6,520 Border Pass 2,058 2,378 67 712 92 763 3,257 4,891 Passport 881 1,067 56 1,533 20 20 1,629 Attapeu 5,792 - - - - 2,002 2,002 Border Pass 2,166 949 949 Passport 3,626 1,053 1,053 PhongSaly 25,932 212 - - - - 212 Border Pass 181 25,932 121 121 Passport 133 - 91 91
2009
Table 15 : Room Occupancy Rates by Province, 2003 -2009.
Province2003 2004 2005 2006 2007 2008 2009
Bokeo 72% 65% 67% 58% 64% 63% 54%Champassak 45% 42% 58% 60% 61% 65% 62%Houaphanh 33% 28% 29% 30% 39% 40% 49%Luang Prabang 69% 57% 70% 72% 74% 73% 68%Luang Namtha 54% 52% 57% 55% 56% 60% 48%Savannakhet 49% 58% 60% 61% 68% 65% 67%Vientiane Capital 69% 55% 64% 66% 63% 60% 63%Khammouane 53% 21% 43% 45% 59% 58% 49%Oudomxay 43% 62% 52% 55% 58% 60% 55%Vientiane province 41% 43% 52% 63% 62% 64% 61%Xieng Khouang 27% 32% 40% 44% 51% 50% 51%Bolikhamxay 35% 58% 65% 67% 68% 69% 54%Saravanh 38% 21% 42% 38% 40% 42% 51%Xayabouli 36% 29% 37% 35% 39% 50% 48%Phongsaly 33% 21% 29% 30% 42% 52% 51%Attapeu 56% 63% 50% 48% 46% 48% 45%Sekong 29% 42% 37% 38% 40% 46% 40%Average 45% 44% 50% 51% 54% 57% 54%
Occupancy Rate

Source of data: Lao National Tourism Administration
18
Table 16: Revenue from Tourism and Major Exports, 2005-2009. Note: Revenue in Millions of US Dollars
ProductRevenue Rank Revenue Rank Revenue Rank Revenue Rank Revenue Rank
Tourism 267.7 3 275.5 2 233.3 2 173.2 2 146.7 1Garments 141.7 4 255.0 3 132.1 3 126.1 3 107.5 3Electricity 274.5 2 97.1 4 72.1 5 101.1 4 94.6 4Wood Products 46.0 6 59.3 5 72.5 4 96.6 5 74.0 5Coffee 13.8 8 15.6 8 32.3 7 9.7 8 9.5 8Agricultural Products 77.0 5 47.9 6 42.4 6 39.2 6 26.6 6Minerals 539.4 1 801.9 1 558.8 1 485.6 1 128.3 2Handicrafts 4.7 9 3.4 9 4.6 9 1.1 9 2.7 9Other Industrics 31.1 7 30.0 7 12.8 8 18.2 7 11.9 7
2009 2008 2007 2006 2005
Source : Ministry of Industry and Commerce, Lao National Tourism Administration.
Table 17: Number of Hotels, Guesthouses, Resorts, Restaurants and Entertainment Establishments, 2008-2009. Province
Total Total2008 2009 2008 2009 2008 2009 2008 2009 2008 2009
Attapeu 3 5 14 14 29 40 4 20 50 79Bokeo 5 5 28 35 19 43 1 4 53 87Bolikhamsay 12 14 25 29 100 111 2 6 139 160Champassak 35 41 119 135 18 18 15 12 187 206Houaphanh 5 5 39 45 24 93 8 3 76 146Khammouane 5 7 18 51 6 47 3 2 32 107Luang Namtha 4 5 70 72 67 107 6 7 147 191Luang Prabang 31 41 161 201 54 113 2 8 248 363Oudomxay 8 11 52 53 86 107 5 6 151 177Phongsaly 4 5 33 38 64 82 0 2 101 127Saravane 3 3 20 20 9 9 2 11 34 43Savannakhet 15 17 68 98 19 95 4 69 106 279Sayabouli 3 3 60 84 22 30 6 6 91 123Sekong 3 3 15 15 20 9 0 8 38 35Vientiane Capital 114 175 185 187 69 86 92 116 460 564Vientiane Province 4 5 179 217 122 126 12 26 317 374Xieng Khouang 11 12 34 50 14 32 2 4 61 98Total 265 357 1,120 1,344 742 1,148 164 310 2,291 3,159
TypeEntertainmentHotel RestaurantGH,Resort

Source of data: Lao National Tourism Administration
19
Table 18: Number of Accommodation Establishments, and Rooms 2003-2009.
2003 2004 2005 2006 2007 2008 2009 2003 2004 2005 2006 2007 2008 2009Attapeu 5 5 12 14 16 17 19 107 107 190 322 240 262 319Bokeo 22 25 24 26 32 33 40 262 303 309 316 378 379 483Bolikhamxay 25 25 26 29 37 37 43 366 379 435 523 571 636 720Champassak 106 110 126 127 142 154 176 1298 1364 1616 1679 1879 2072 2669Houaphanh 34 40 39 41 45 44 50 240 317 338 350 421 432 473Khammouane 13 17 18 26 44 23 58 206 356 394 412 624 523 992Luang Namtha 65 70 50 64 56 74 77 534 588 536 671 615 814 939Luang Prabang 137 120 163 173 224 192 242 1414 1410 1722 1808 2162 2243 2703Oudomxay 50 55 63 64 66 60 64 515 731 703 821 787 848 817Phongsaly 29 26 36 38 38 37 43 246 193 273 308 298 294 365Saravane 22 21 22 23 23 23 23 174 221 230 254 362 273 299Savannakhet 53 60 67 72 81 83 115 979 995 1257 1236 1627 1758 2302Sayabouli 35 43 47 57 51 63 87 377 395 431 510 561 751 974Sekong 8 8 17 16 17 18 18 69 69 172 160 164 188 225Vientiane Capital 163 194 224 242 248 299 362 3412 4004 4891 5342 5476 7237 7972Vientiane Province 90 105 122 138 161 183 222 1772 1734 1890 2077 2284 2773 3314Xieng Khouang 30 33 32 43 50 45 62 318 500 441 844 693 690 992
Total 887 957 1088 1193 1331 1385 1701 12289 13666 15828 17633 19142 22173 26558
ProvinceNumber of Establishments Number of Rooms
Table 19: Number of Hotels, Guest Houses, Rooms, and Beds, in 2009.
HotelsNo Room Bed No Room Bed No Room Beds
Attapeu 5 146 220 14 173 224 19 319 444Bokeo 5 126 208 35 357 514 40 483 722Bolikhamxay 14 423 577 29 297 391 43 720 968Champassak 41 1302 1778 135 1367 1664 176 2669 3442Houaphanh 5 90 119 45 383 574 50 473 693Khammouane 7 281 427 51 711 961 58 992 1388Luang Namtha 5 182 232 72 757 1086 77 939 1318Luang Prabang 41 993 1557 201 1710 2574 242 2703 4131Oudomxay 11 261 450 53 556 782 64 817 1232Phongsaly 5 106 158 38 259 397 43 365 555Saravanh 3 83 131 20 216 309 23 299 440Savannakhet 17 799 1171 98 1503 1948 115 2302 3119Sayabouli 3 116 183 84 858 989 87 974 1172Sekong 3 58 79 15 167 187 18 225 266Vientiane Capital 175 5471 8103 187 2501 3749 362 7972 11852Vientiane Province 5 265 420 217 3049 3932 222 3314 4352Xieng Khouang 12 341 486 50 651 912 62 992 1398
Total 357 11043 16299 1344 15515 21193 1701 26558 37492
Province Guest Houses Total
Source of data: Lao National Tourism Administration
20
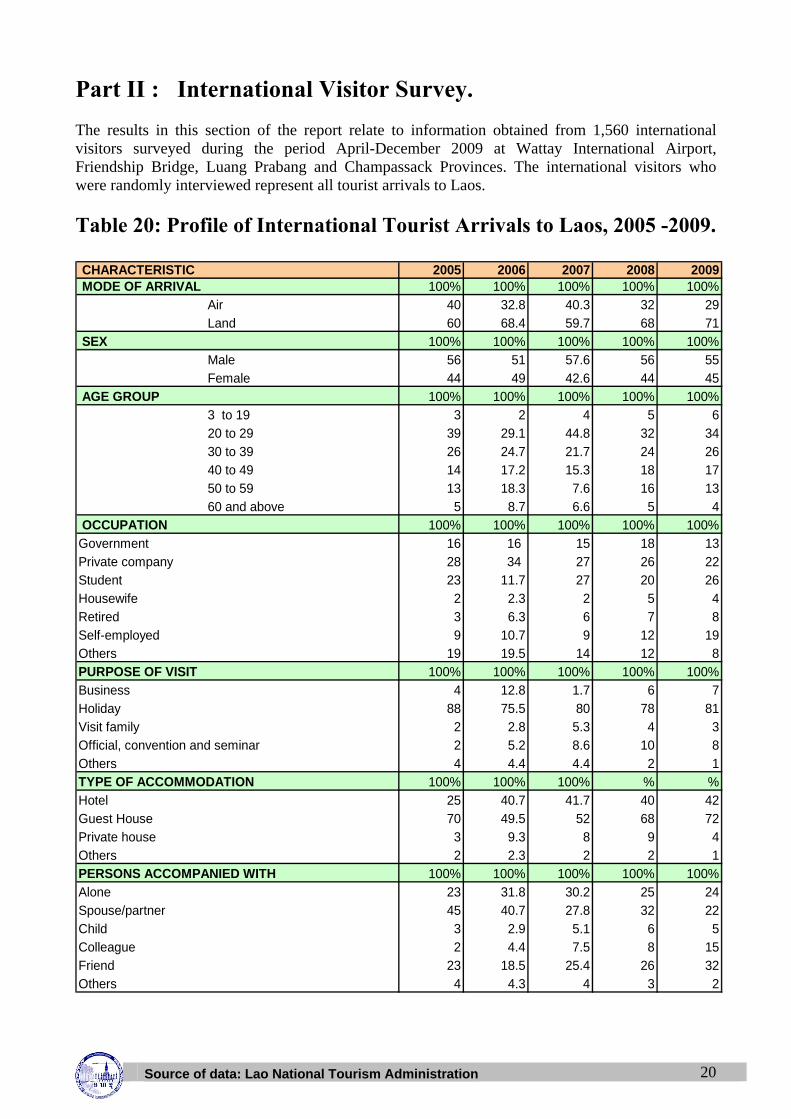
Part II : International Visitor Survey. The results in this section of the report relate to information obtained from 1,560 international visitors surveyed during the period April-December 2009 at Wattay International Airport, Friendship Bridge, Luang Prabang and Champassack Provinces. The international visitors who were randomly interviewed represent all tourist arrivals to Laos.
Table 20: Profile of International Tourist Arrivals to Laos, 2005 -2009. CHARACTERISTIC 2005 2006 2007 2008 2009 MODE OF ARRIVAL 100% 100% 100% 100% 100%
Air 40 32.8 40.3 32 29Land 60 68.4 59.7 68 71
SEX 100% 100% 100% 100% 100%Male 56 51 57.6 56 55Female 44 49 42.6 44 45
AGE GROUP 100% 100% 100% 100% 100%3 to 19 3 2 4 5 620 to 29 39 29.1 44.8 32 3430 to 39 26 24.7 21.7 24 2640 to 49 14 17.2 15.3 18 1750 to 59 13 18.3 7.6 16 1360 and above 5 8.7 6.6 5 4
OCCUPATION 100% 100% 100% 100% 100%Government 16 16 15 18 13Private company 28 34 27 26 22Student 23 11.7 27 20 26Housewife 2 2.3 2 5 4Retired 3 6.3 6 7 8Self-employed 9 10.7 9 12 19Others 19 19.5 14 12 8PURPOSE OF VISIT 100% 100% 100% 100% 100%Business 4 12.8 1.7 6 7Holiday 88 75.5 80 78 81Visit family 2 2.8 5.3 4 3Official, convention and seminar 2 5.2 8.6 10 8Others 4 4.4 4.4 2 1TYPE OF ACCOMMODATION 100% 100% 100% % %Hotel 25 40.7 41.7 40 42Guest House 70 49.5 52 68 72Private house 3 9.3 8 9 4Others 2 2.3 2 2 1PERSONS ACCOMPANIED WITH 100% 100% 100% 100% 100%Alone 23 31.8 30.2 25 24Spouse/partner 45 40.7 27.8 32 22Child 3 2.9 5.1 6 5Colleague 2 4.4 7.5 8 15Friend 23 18.5 25.4 26 32Others 4 4.3 4 3 2
Source of data: Lao National Tourism Administration
21
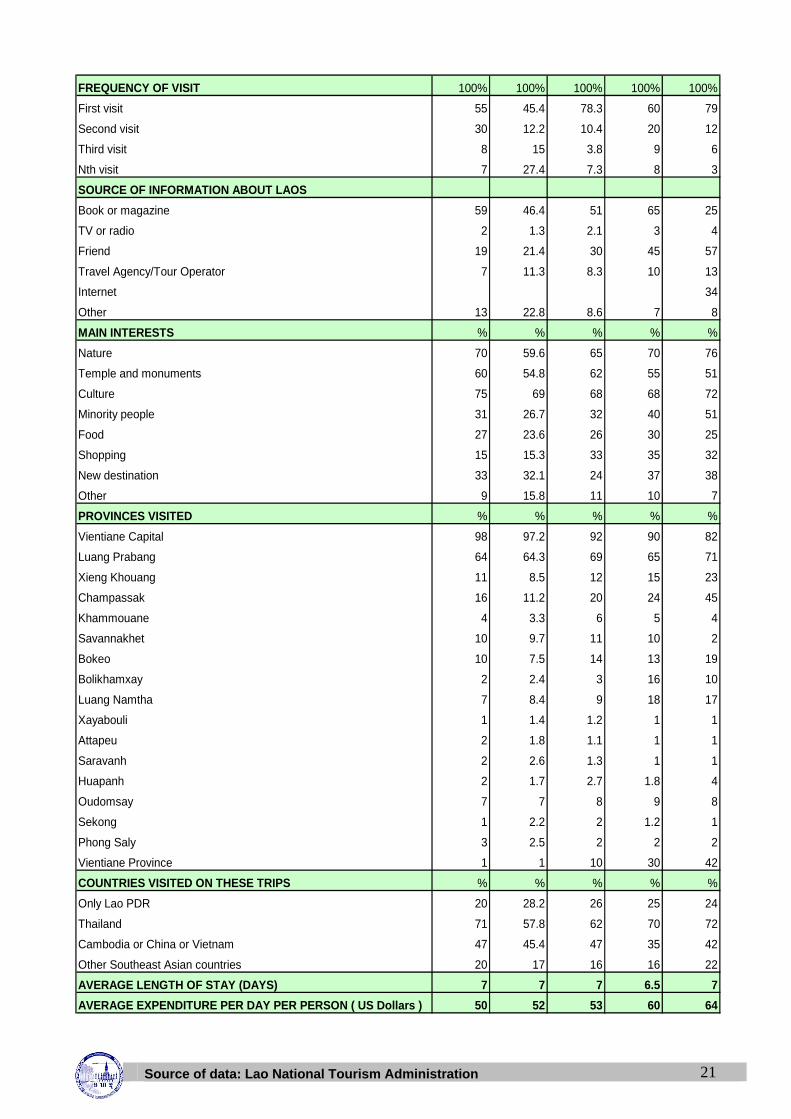
FREQUENCY OF VISIT 100% 100% 100% 100% 100%
First visit 55 45.4 78.3 60 79
Second visit 30 12.2 10.4 20 12
Third visit 8 15 3.8 9 6
Nth visit 7 27.4 7.3 8 3
SOURCE OF INFORMATION ABOUT LAOS
Book or magazine 59 46.4 51 65 25
TV or radio 2 1.3 2.1 3 4
Friend 19 21.4 30 45 57
Travel Agency/Tour Operator 7 11.3 8.3 10 13
Internet 34
Other 13 22.8 8.6 7 8
MAIN INTERESTS % % % % %
Nature 70 59.6 65 70 76
Temple and monuments 60 54.8 62 55 51
Culture 75 69 68 68 72
Minority people 31 26.7 32 40 51
Food 27 23.6 26 30 25
Shopping 15 15.3 33 35 32
New destination 33 32.1 24 37 38
Other 9 15.8 11 10 7
PROVINCES VISITED % % % % %
Vientiane Capital 98 97.2 92 90 82
Luang Prabang 64 64.3 69 65 71
Xieng Khouang 11 8.5 12 15 23
Champassak 16 11.2 20 24 45
Khammouane 4 3.3 6 5 4
Savannakhet 10 9.7 11 10 2
Bokeo 10 7.5 14 13 19
Bolikhamxay 2 2.4 3 16 10
Luang Namtha 7 8.4 9 18 17
Xayabouli 1 1.4 1.2 1 1
Attapeu 2 1.8 1.1 1 1
Saravanh 2 2.6 1.3 1 1
Huapanh 2 1.7 2.7 1.8 4
Oudomsay 7 7 8 9 8
Sekong 1 2.2 2 1.2 1
Phong Saly 3 2.5 2 2 2
Vientiane Province 1 1 10 30 42
COUNTRIES VISITED ON THESE TRIPS % % % % %
Only Lao PDR 20 28.2 26 25 24
Thailand 71 57.8 62 70 72
Cambodia or China or Vietnam 47 45.4 47 35 42
Other Southeast Asian countries 20 17 16 16 22
AVERAGE LENGTH OF STAY (DAYS) 7 7 7 6.5 7
AVERAGE EXPENDITURE PER DAY PER PERSON ( US Dollars ) 50 52 53 60 64
Source of data: Lao National Tourism Administration
22
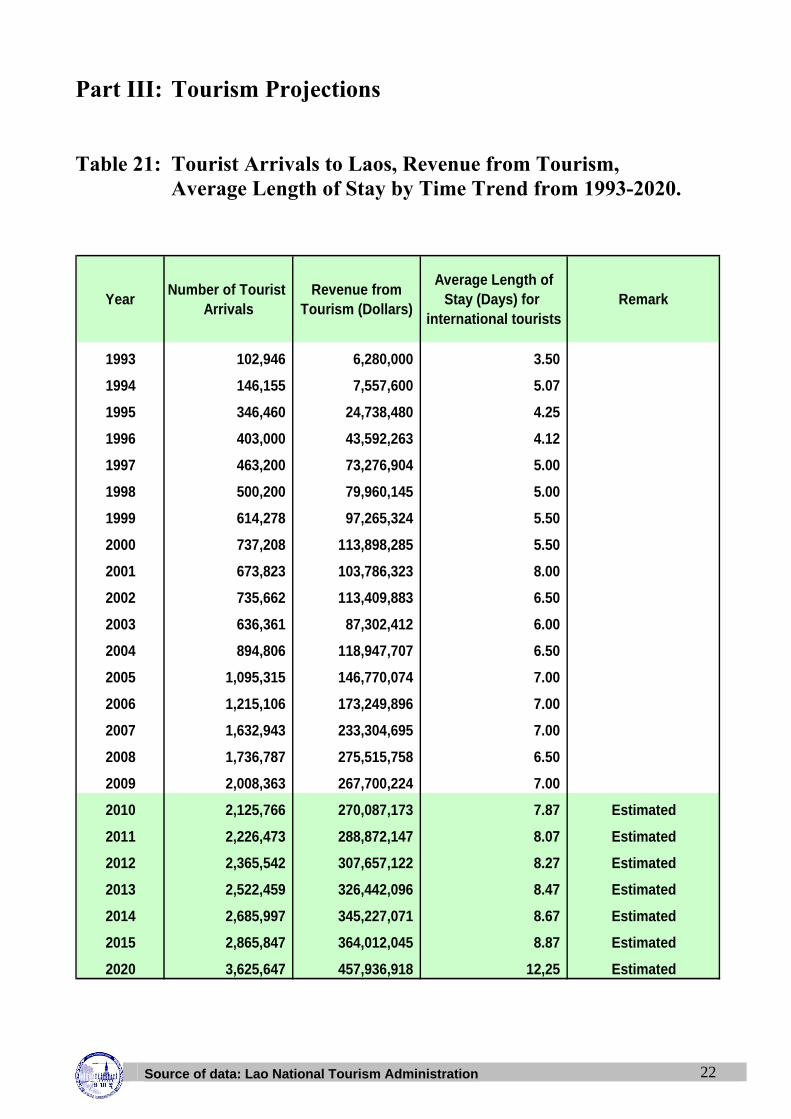
Part III: Tourism Projections Table 21: Tourist Arrivals to Laos, Revenue from Tourism,
Average Length of Stay by Time Trend from 1993-2020.
YearNumber of Tourist
Arrivals Revenue from
Tourism (Dollars)
Average Length of Stay (Days) for
international touristsRemark
1993 102,946 6,280,000 3.50
1994 146,155 7,557,600 5.07
1995 346,460 24,738,480 4.25
1996 403,000 43,592,263 4.12
1997 463,200 73,276,904 5.00
1998 500,200 79,960,145 5.00
1999 614,278 97,265,324 5.50
2000 737,208 113,898,285 5.50
2001 673,823 103,786,323 8.00
2002 735,662 113,409,883 6.50
2003 636,361 87,302,412 6.00
2004 894,806 118,947,707 6.50
2005 1,095,315 146,770,074 7.00
2006 1,215,106 173,249,896 7.00
2007 1,632,943 233,304,695 7.00
2008 1,736,787 275,515,758 6.50
2009 2,008,363 267,700,224 7.00
2010 2,125,766 270,087,173 7.87 Estimated
2011 2,226,473 288,872,147 8.07 Estimated
2012 2,365,542 307,657,122 8.27 Estimated
2013 2,522,459 326,442,096 8.47 Estimated
2014 2,685,997 345,227,071 8.67 Estimated
2015 2,865,847 364,012,045 8.87 Estimated
2020 3,625,647 457,936,918 12,25 Estimated

Source of data: Lao National Tourism Administration
23
Source of data: Lao National Tourism Administration
24
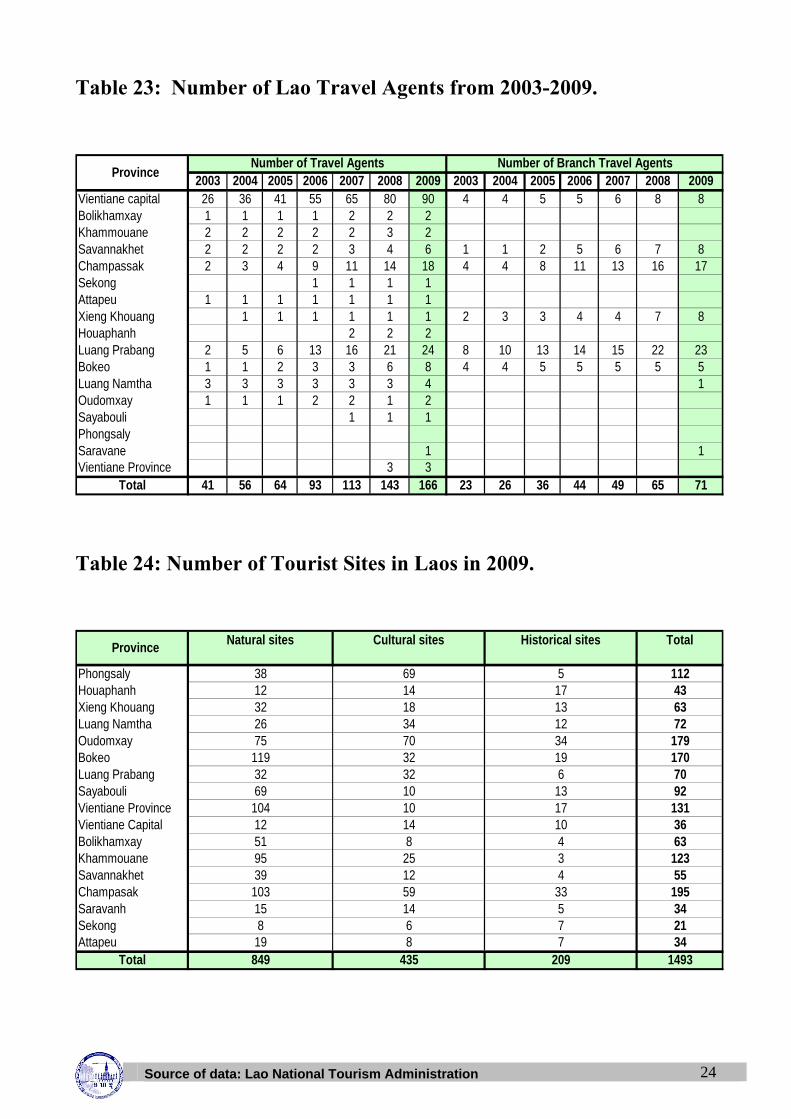
Table 23: Number of Lao Travel Agents from 2003-2009.
2003 2004 2005 2006 2007 2008 2009 2003 2004 2005 2006 2007 2008 2009Vientiane capital 26 36 41 55 65 80 90 4 4 5 5 6 8 8Bolikhamxay 1 1 1 1 2 2 2Khammouane 2 2 2 2 2 3 2Savannakhet 2 2 2 2 3 4 6 1 1 2 5 6 7 8Champassak 2 3 4 9 11 14 18 4 4 8 11 13 16 17Sekong 1 1 1 1Attapeu 1 1 1 1 1 1 1Xieng Khouang 1 1 1 1 1 1 2 3 3 4 4 7 8Houaphanh 2 2 2Luang Prabang 2 5 6 13 16 21 24 8 10 13 14 15 22 23Bokeo 1 1 2 3 3 6 8 4 4 5 5 5 5 5Luang Namtha 3 3 3 3 3 3 4 1Oudomxay 1 1 1 2 2 1 2Sayabouli 1 1 1PhongsalySaravane 1 1Vientiane Province 3 3
Total 41 56 64 93 113 143 166 23 26 36 44 49 65 71
ProvinceNumber of Travel Agents Number of Branch Travel Agents
Table 24: Number of Tourist Sites in Laos in 2009.
PhongsalyHouaphanhXieng KhouangLuang NamthaOudomxayBokeoLuang PrabangSayabouliVientiane ProvinceVientiane CapitalBolikhamxayKhammouaneSavannakhetChampasakSaravanhSekongAttapeu
Total
ProvinceNatural sites Cultural sites Historical sites Total
12 14 17 4338 69 5 112
26 34 12 7232 18 13 63
119 32 19 17075 70 34 179
69 10 13 9232 32 6 70
12 14 10 36104 10 17 131
95 25 3 12351 8 4 63
103 59 33 19539 12 4 55
8 6 7 2115 14 5 34
849 435 209 149319 8 7 34

Source of data: Lao National Tourism Administration
25
Part IV: Tourist Satisfaction
Table 25: Important factors that tourists took into account when they planned to visit Lao PDR.
N= 841
1. Cultural activities 3.102. Nature 3.713. Temple and monuments 3.194. Atmosphere 3.765. Ecotourism destination 2.586. Way of life 2.637. People 3.818. Handicraft and textile products 2.459. Safety 3.6410. Prices 3.4611. Visa application/ immigration services 3.4512. Hotel and restaurant 2.81Source: Survey conducted by LNTA in 2009Note : 0 : Not important 1 : Least important 2 : Slightly important 3 : Fairly important 4 : Very important 5 : Most important
Items Average Score
Table 26: Level of tourist satisfaction with tourism products and services of Lao PDR.
N= 841
1. Cultural activities 3.202. Nature 3.923. Temple and monuments 3.604. Atmosphere 3.605. Ecotourism destination 3.016. Way of life 3.877. People 4.088. Handicraft and textile products 3.289. Safety 3.9410. Prices 3.5411. Visa application/ immigration services 3.4612. Hotel and restaurant 3.60Source: Survey conducted by LNTA in 2009Note : 0 : Not applicable 1 : Very low 2 : Low 3 : Medium 4 : High 5 : Very high
Items Average Score
Table 27: Overall satisfaction of tourists who visit Lao PDR.
1. Overall, I enjoyed my trip to Lao PDR 4.412. Overall, my satistaction with this trip is greater than my expectation 3.883. I am satisfied with my decision to select Lao PDR as my travel destination 4.31Source: Survey conducted by LNTA in 2009Note :
1 : Strongly disagree 2 : Disagree 3 : Neutral 4 : Agree 5 : Strongly agree
Items Average Score
N= 841
Source of data: Lao National Tourism Administration
23
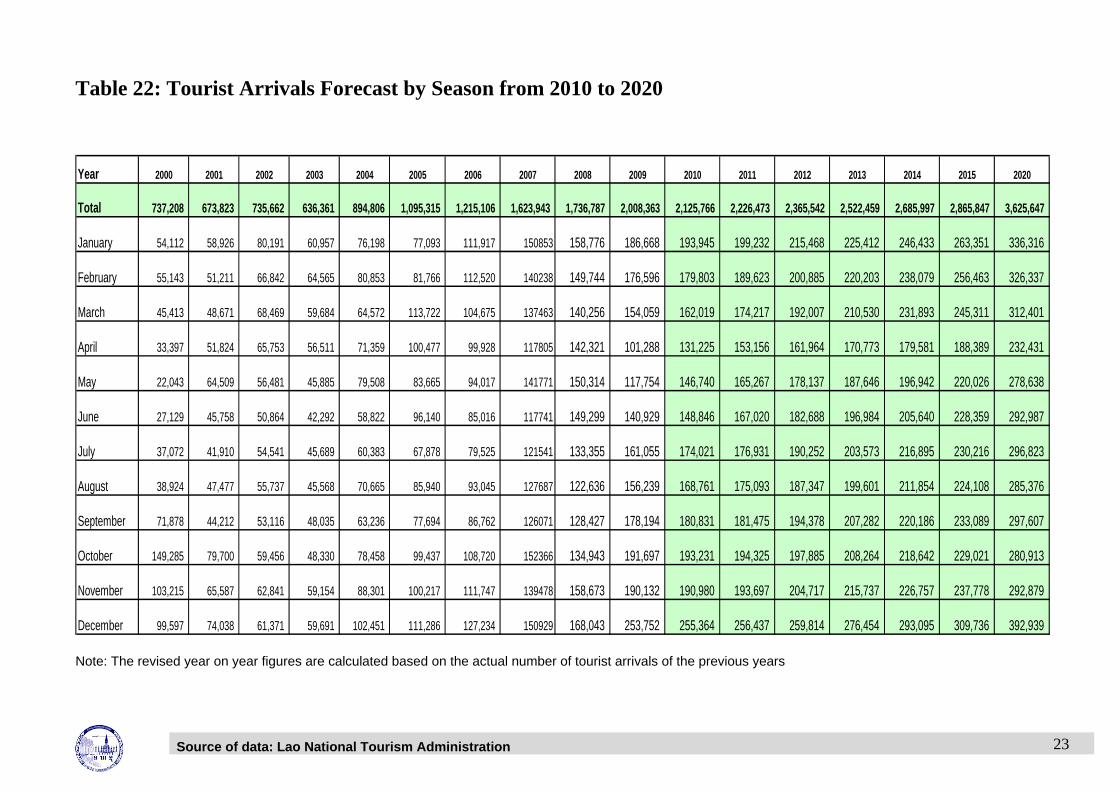
Table 22: Tourist Arrivals Forecast by Season from 2010 to 2020 Year 2000 2001 2002 2003 2004 2005 2006 2007 2008 2009 2010 2011 2012 2013 2014 2015 2020
Total 737,208 673,823 735,662 636,361 894,806 1,095,315 1,215,106 1,623,943 1,736,787 2,008,363 2,125,766 2,226,473 2,365,542 2,522,459 2,685,997 2,865,847 3,625,647
January 54,112 58,926 80,191 60,957 76,198 77,093 111,917 150853 158,776 186,668 193,945 199,232 215,468 225,412 246,433 263,351 336,316
February 55,143 51,211 66,842 64,565 80,853 81,766 112,520 140238 149,744 176,596 179,803 189,623 200,885 220,203 238,079 256,463 326,337
March 45,413 48,671 68,469 59,684 64,572 113,722 104,675 137463 140,256 154,059 162,019 174,217 192,007 210,530 231,893 245,311 312,401
April 33,397 51,824 65,753 56,511 71,359 100,477 99,928 117805 142,321 101,288 131,225 153,156 161,964 170,773 179,581 188,389 232,431
May 22,043 64,509 56,481 45,885 79,508 83,665 94,017 141771 150,314 117,754 146,740 165,267 178,137 187,646 196,942 220,026 278,638
June 27,129 45,758 50,864 42,292 58,822 96,140 85,016 117741 149,299 140,929 148,846 167,020 182,688 196,984 205,640 228,359 292,987
July 37,072 41,910 54,541 45,689 60,383 67,878 79,525 121541 133,355 161,055 174,021 176,931 190,252 203,573 216,895 230,216 296,823
August 38,924 47,477 55,737 45,568 70,665 85,940 93,045 127687 122,636 156,239 168,761 175,093 187,347 199,601 211,854 224,108 285,376
September 71,878 44,212 53,116 48,035 63,236 77,694 86,762 126071 128,427 178,194 180,831 181,475 194,378 207,282 220,186 233,089 297,607
October 149,285 79,700 59,456 48,330 78,458 99,437 108,720 152366 134,943 191,697 193,231 194,325 197,885 208,264 218,642 229,021 280,913
November 103,215 65,587 62,841 59,154 88,301 100,217 111,747 139478 158,673 190,132 190,980 193,697 204,717 215,737 226,757 237,778 292,879
December 99,597 74,038 61,371 59,691 102,451 111,286 127,234 150929 168,043 253,752 255,364 256,437 259,814 276,454 293,095 309,736 392,939 Note: The revised year on year figures are calculated based on the actual number of tourist arrivals of the previous years

Source of data: Lao National Tourism Administration
13
Table 9: Tourist Arrivals to Laos by Port of Entry in 2009 Country of Origin
Attapeu Bok Huaph LPB LNT Phongsa Xaya Xieng TotalPhou Keua
Houei Xay BakSanh Namphao Vang Tao Pakse Airport
Veun Kham
Nam Souy Thakhek Naphao Airport Boten Sobhum Mittha phab
Bridge II
Dane Savanh
Mittha phab
Bridge I
Wattay Airport
Ken Thao Nam Kan 2009
Grand Total 8,349 110,659 16,679 75,182 97,985 5,014 11,637 7,868 76,434 24,062 68,669 134,576 8,324 553,803 115,177 517,063 144,632 20,153 12,097 2,008,363 Asia and Pacific 8,032 72,117 16,299 70,891 91,265 1,451 7,633 7,558 72,426 24,050 26,004 131,195 6,600 545,144 112,463 505,075 91,080 19,470 11,818 1,820,571 ASEAN 7,852 61,160 16,155 67,771 88,379 333 6,348 7,323 71,227 23,960 13,554 23,305 6,157 541,607 110,944 491,146 43,238 18,871 11,679 1,611,009 Brunei - - - - 2 - 2 - - - 2 - - 16 - 51 194 - - 267 Cambodia - 26 2 255 18 96 4,968 - 7 - 117 15 - 245 26 183 1,562 7 3 7,530 Indonesia 1 14 4 84 12 6 4 1 72 - 127 17 1 616 2 275 1,918 3 1 3,158 Malaysia 17 590 53 135 242 23 62 1 375 - 166 377 39 897 101 1,970 8,714 45 9 13,816 Myanmar - 39 - 371 13 8 6 - 7 - 58 19 - 56 4 618 594 1 - 1,794 Philippines - 85 4 67 83 6 46 - 364 1 199 11 2 1,056 38 4,447 1,907 13 2 8,331 Singapore 8 264 23 125 58 27 62 - 62 - 467 97 16 236 26 938 2,859 16 2 5,286 Thailand 201 58,093 14,316 3,291 85,250 66 121 17 58,963 208 11,369 22,723 290 516,500 30,179 442,168 11,673 17,802 834 1,274,064 Vietnam 7,625 2,049 1,753 63,443 2,701 101 1,077 7,304 11,377 23,751 1,049 46 5,809 21,985 80,568 40,496 13,817 984 10,828 296,763 Non-ASEAN 180 10,957 144 3,120 2,886 1,118 1,285 235 1,199 90 12,450 107,890 443 3,537 1,519 13,929 47,842 599 139 209,562 Australia 27 3,214 - 514 657 616 294 55 286 - 5,185 287 178 1,135 247 1,527 9,929 41 17 24,209 China 80 3,359 59 857 170 107 216 30 106 79 561 106,355 22 375 352 788 14,624 61 25 128,226 India 27 45 - 43 26 38 23 20 63 - 176 5 2 285 30 261 1,228 4 4 2,280 Japan 17 1,737 29 640 699 223 326 60 505 11 4,408 635 137 982 441 6,298 10,705 195 33 28,081 Korea 20 1,484 13 400 1,167 43 232 14 95 - 1,313 401 39 389 257 4,074 7,650 244 41 17,876 New Zealand - 919 - 140 72 42 96 5 81 - 541 50 38 161 57 180 1,080 17 - 3,479 Taiwan 2 155 - 158 45 24 45 48 5 - 89 100 4 82 29 234 1,467 19 13 2,519 Others 7 44 43 368 50 25 53 3 58 - 177 57 23 128 106 567 1,159 18 6 2,892 Europe 169 31,177 285 3,548 4,950 2,554 3,246 255 3,035 8 28,910 2,240 1,365 5,830 2,028 8,414 31,475 471 216 130,176 Austria - 456 9 41 30 21 46 4 18 - 754 32 15 171 23 92 730 6 2 2,450 Belgium 4 953 2 54 184 59 120 8 42 - 887 42 47 238 78 285 854 9 2 3,868 Denmark 6 494 17 66 557 53 275 7 33 1 575 40 25 155 36 106 523 7 1 2,977 Finland 2 351 - - 149 26 116 - 16 - 284 50 4 219 64 149 532 20 3 1,985 France 47 5,467 16 269 1,580 742 636 47 1,903 3 5,893 382 347 1,621 450 2,218 10,026 104 24 31,775 Germany 31 3,628 38 208 814 336 804 16 153 3 5,067 291 241 666 205 959 4,099 75 76 17,710 Greece 1 159 - 5 8 33 1 - 3 - 119 11 20 7 7 20 126 6 11 537 Italy 15 1,485 15 53 150 118 66 5 70 - 1,615 70 42 155 41 199 1,371 5 6 5,481 Netherlands 16 3,434 13 160 383 103 287 28 60 - 1,694 205 86 299 103 244 1,344 34 11 8,504 Norway 2 306 7 153 103 58 99 19 73 - 358 14 10 313 45 82 551 22 6 2,221 Russia 4 163 - - 43 38 34 7 14 - 390 70 16 38 55 1,141 830 4 14 2,861 Spain - 916 19 52 69 22 53 2 31 - 914 86 47 63 27 51 599 2 9 2,962 Sweden - 779 13 268 163 77 117 10 158 1 445 95 29 240 136 457 1,137 21 4 4,150 Switzerland - 1,440 21 65 180 118 100 33 44 - 1,421 70 84 255 111 542 1,310 17 16 5,827 United Kingdom 25 8,601 62 1,867 187 543 171 57 390 - 6,049 553 245 1,162 461 1,151 5,364 134 22 27,044 Others 16 2,545 53 287 350 207 321 12 27 - 2,445 229 107 228 186 718 2,079 5 9 9,824 The Americas 145 6,398 88 722 1,665 963 603 55 921 4 12,860 996 284 2,676 638 3,060 20,998 212 60 53,348 Canada 31 2,213 31 270 481 389 201 17 332 3 2,286 219 118 408 184 443 3,282 30 17 10,955 USA 107 3,455 44 352 1,069 532 317 38 545 1 9,642 709 157 2,125 416 2,542 17,070 179 39 39,339 Others 7 730 13 100 115 42 85 - 44 - 932 68 9 143 38 75 646 3 4 3,054 Africa and Middle East 3 967 9 21 105 46 155 - 52 - 895 145 75 153 48 514 1,079 - 3 4,270 Israel 1 766 - 13 67 24 108 - 4 - 559 94 42 35 21 138 362 - 2 2,236 Others 2 201 7 8 38 22 47 - 48 - 336 51 33 118 27 376 717 - 1 2,032
Port of EntryBoli Cham Kham Savan Vientiane Capital

Source of data: Lao National Tourism Administration
26
£¤»È¾¤¡¾−¥ñ©ª˜¤ ¢º¤ºö¤¡¾−êȺ¤êȼ¸Á¹È¤§¾© ( ºê§ ) Organization chart of the Lao National Tourism Administration (LNTA)
¦¿−ñ¡¤¾−−¾¨ö¡ìñ©«½´ö−ªó The Prime Minister’s Office
ìñ©«½´ö−ªó, ¯½ê¾−ºö¤¡¾−êȺ¤êȼ¸Á¹È¤§¾© Minister, Chairman of the LNTA ꆯô¡¦¾ ºê§
Advisors
ª¿Í¸©êȺ¤êȼ¸ Tourist police
»º¤¯½ê¾−ºö¤¡¾−êȺ¤êȼ¸Á¹È¤§¾© Vice – Chairman of the LNTA
»º¤¯½ê¾−ºö¤¡¾−êȺ¤êȼ¸Á¹È¤§¾© Vice – Chairman of the LNTA
»º¤¯½ê¾−ºö¤¡¾−êȺ¤êȼ¸Á¹È¤§¾© Vice – Chairman of the LNTA
¡ö´Â£¦½−¾ Áì½ ¦‰¤À¦ó´¡¾−êȺ¤êȼ¸ Tourism Marketing and Promotion
Department
²½Á−¡Â£¦½−¾ Á콦‰¤À¦ó´¡¾−êȺ¤êȼ¸ Promotion Division
²½Á−¡¡¾−ª½¹ì¾© Tourism Marketing Division
¡ö´Á°−¡¾− Áì½ ¡¾−»È¸´ õ Planning and Cooperation
Department
²½Á−¡Á°−¡¾− Áì½ ¡¾−²ñ©ê½−¾ Planning and Development
Division
²½Á−¡»È¸´ õ Cooperation Division
¡ö´£÷É´£º¤ê÷콡ò©êȺ¤êȼ¸ Áì½ Â»¤Á»´ Tourism and Hotel Management
Department
²½Á−¡£÷É´£º¤ê÷콡ò©êȺ¤êȼ¸ Tourism Management
Division
²½Á−¡£÷É´£º¤ê÷콡ò©Â»¤Á»´ Hotel management Division
¹Éº¤¡¾−ºö¤¡¾−êȺ¤êȼ¸Á¹È¤§¾© General Administrative
Department
²½Á−¡®ðìò¹¾− Áì½ ²òêó¡¾− Administration and Protocol
Division
¦ø−±ô¡ºö®»ö´¸ò§¾¡¾−êȺ¤êȼ¸ Tourism and hospitality
Training Center
²½Á−¡¾−À¤ò− Finance Division
²½Á−¡¦ñ¤ì¸´ Summarizing Division
²½Á−¡¥ñ©ª¤ Œ ²½−ñ¡¤¾− Organization - Personnel Division
²½Á−¡êȺ¤êȼ¸Á®®º½−÷ìñ¡ Ecotourism Division