Embed Size (px)
Citation preview
2010-2011 Maine Injury Data Book
Maine CDC Injury Prevention Program
June 2014
Acknowledgment
Prepared by
Cindy Mervis
University of Southern Maine
and
Katharyn Zwicker
Maine Center for Disease Control and Prevention
Table of Contents Introduction .................................................................................................................................... 1
All injury .......................................................................................................................................... 3
Injury intent .................................................................................................................................... 5
Unintentional .............................................................................................................................. 7
Suicide and self-inflicted ............................................................................................................. 9
Homicide and assault ................................................................................................................ 11
Injury mechanism .......................................................................................................................... 14
Drowning and near-drowning ................................................................................................... 15
Fall ............................................................................................................................................. 17
Fire ............................................................................................................................................ 19
Firearm ...................................................................................................................................... 21
Motor vehicle traffic ................................................................................................................. 23
Poisoning ................................................................................................................................... 26
Injury type ..................................................................................................................................... 28
Hip fracture ............................................................................................................................... 29
Traumatic brain injury ............................................................................................................... 31
Technical notes ............................................................................................................................. 33
References .................................................................................................................................... 37
Appendix A. Percent of deaths, hospital discharges, and emergency department visits
that were injury related .......................................................................................... 39
Appendix B. International Classification of Disease codes used to define injury death
indicators ................................................................................................................. 40
Appendix C. International Classification of Disease codes used to define injury hospital
discharge and emergency department visit indicators ........................................... 43
1
Introduction
Injuries are an important, and preventable, public health problem. Reducing the burden of
injury and violence in Maine is one of the aims of Healthy Maine 2020.1 Effective injury
prevention and control efforts range from preventing the injury from happening in the first
place, to early diagnosis and management, to improving the final outcome by preventing
further complications such as more severe injury, disability or death.2 The 2010-2011 Maine
Injury Data Book uses surveillance data to describe the burden of injury in the state.
An injury can be described by its nature (e.g., fracture, concussion) and its cause. The cause of
an injury is classified in terms of both intent and mechanism. Intent refers to whether the
injury is deliberately inflicted and is categorized as unintentional, intentional self-injury/suicide,
assault/homicide, legal intervention, operations of war, other (adverse effects) or
undetermined. Mechanism refers to the external cause of the injury, such as a fall, firearm,
motor vehicle traffic incident or poisoning.
Unintentional injuries were the leading cause of death among 1-44 year old Maine residents in
2006-2010 and the fifth leading cause of death among all ages combined. Suicide was the
second leading cause of death among 15-34 year old Mainers and the tenth leading cause
among all ages combined. Homicides were less common, but were still one of the 10 leading
causes of death among certain age groups.3
This report provides 2010-2011 Maine resident data on more than 20 injury indicators defined
by the federal Centers for Disease Control and Prevention. Most of the indicators describe
deaths, hospital discharges or emergency department (ED) visits due to a particular intent
and/or mechanism. Data are presented for the following indicators:
• All injury deaths, hospital discharges and ED visits
• Injury deaths, hospital discharges and ED visits by intent
o Unintentional
o Suicide and suicide attempt / self-inflicted
o Homicide and assault
• Injury deaths, hospital discharges and ED visits by mechanism
o Unintentional drowning and nonfatal near-drowning
o Unintentional fall
o Unintentional fire
o Unintentional motor vehicle traffic
o Firearm (all intents)
o Poisoning (all intents)
• Injury deaths, hospital discharges and/or ED visits by type of injury
o Traumatic brain injury
o Hip fracture, among individuals aged 65 years and older
2
Data presented for each indicator include counts (overall and by age and sex), as well as crude,
age-adjusted, age-specific and sex-specific rates. It is important to note that crude rates and
age-adjusted rates serve different purposes. Crude rates (or the actual number of events) are
used to measure or compare the absolute magnitude of injury indicators. Age-adjusted rates
are used only for comparison purposes to control for age composition differences (e.g., to
compare Maine with another state that has a much younger population or to look at Maine
data for different years and control for the aging of the population over time). The calculated
numeric value of an age-adjusted rate depends on the standard population used and therefore
has no intrinsic meaning.4 The age-adjusted rates presented in this report can only be
compared with other age-adjusted rates that are adjusted to the same 2000 U.S. standard
population. For the purpose of this report, where the focus is on the absolute burden of injury,
comparisons between males and females or between various age groups are based on 95
percent confidence intervals placed around the crude rates.
All data presented in this report are from 2010-2011, unless otherwise noted. The data
primarily come from three surveillance data sources: (1) the 2010-2011 Maine death certificate
statistical datasets, maintained by the Data, Research and Vital Statistics Program at the Maine
Center for Disease Control and Prevention, (2) the 2010-2011 inpatient (hospital discharge)
datasets, maintained by the Maine Health Data Organization, and (3) the 2010-2011 hospital
outpatient datasets, also maintained by the Maine Health Data Organization. In keeping with
the indicator definitions provided by the federal Centers for Disease Control and Prevention,
the hospital discharge analysis was limited to discharges from general hospitals that had an
injury (including poisoning) principal diagnosis. The ED visit analysis was limited to ED visits at
general hospitals that had an injury (including poisoning) principal diagnosis or an external
cause of injury code and that did not end with the patient being admitted as an inpatient to
that hospital. Supplemental data for select indicators were obtained from the 2011 Maine
Integrated Youth Health Survey and the 2010 and 2011 Behavioral Risk Factor Surveillance
System surveys.
The report concludes with technical notes and appendices describing data sources, case
definitions for each injury indicator, methods used to calculate rates and report limitations.
3
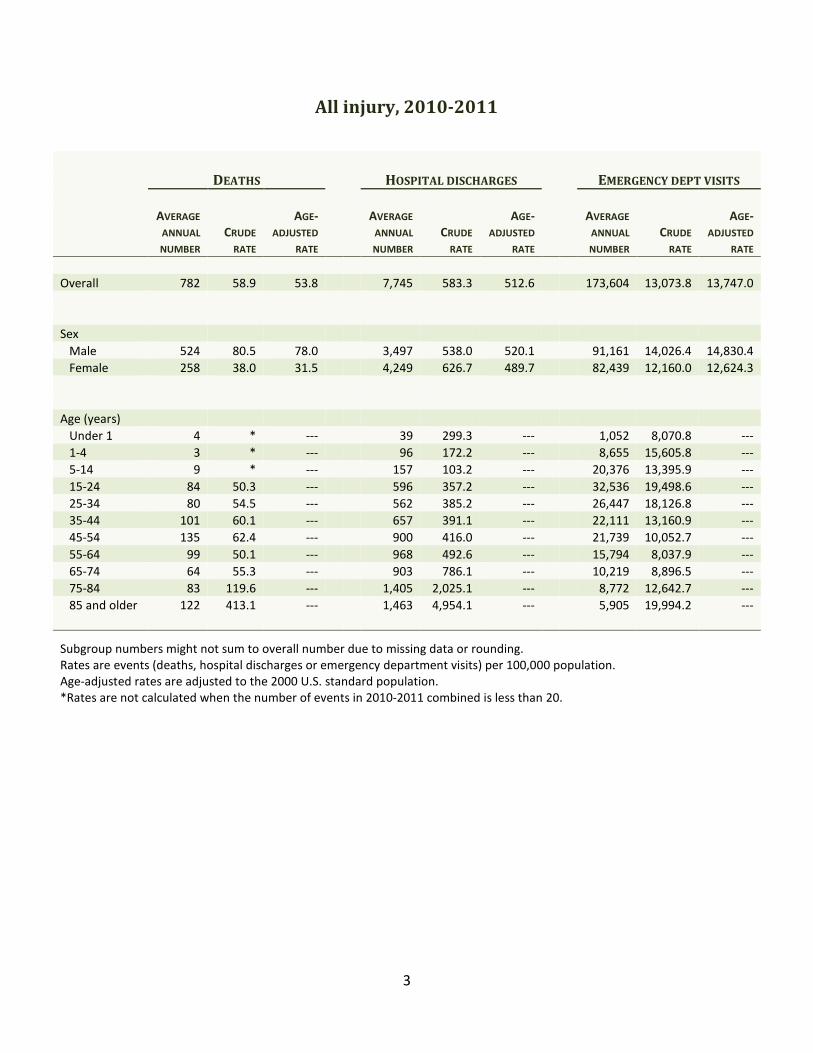
All injury, 2010-2011
DEATHS HOSPITAL DISCHARGES EMERGENCY DEPT VISITS
AVERAGE
ANNUAL
NUMBER
CRUDE
RATE
AGE-
ADJUSTED
RATE
AVERAGE
ANNUAL
NUMBER
CRUDE
RATE
AGE-
ADJUSTED
RATE
AVERAGE
ANNUAL
NUMBER
CRUDE
RATE
AGE-
ADJUSTED
RATE
Overall 782 58.9 53.8 7,745 583.3 512.6 173,604 13,073.8 13,747.0
Sex
Male 524 80.5 78.0 3,497 538.0 520.1 91,161 14,026.4 14,830.4
Female 258 38.0 31.5 4,249 626.7 489.7 82,439 12,160.0 12,624.3
Age (years)
Under 1 4 * --- 39 299.3 --- 1,052 8,070.8 ---
1-4 3 * --- 96 172.2 --- 8,655 15,605.8 ---
5-14 9 * --- 157 103.2 --- 20,376 13,395.9 ---
15-24 84 50.3 --- 596 357.2 --- 32,536 19,498.6 ---
25-34 80 54.5 --- 562 385.2 --- 26,447 18,126.8 ---
35-44 101 60.1 --- 657 391.1 --- 22,111 13,160.9 ---
45-54 135 62.4 --- 900 416.0 --- 21,739 10,052.7 ---
55-64 99 50.1 --- 968 492.6 --- 15,794 8,037.9 ---
65-74 64 55.3 --- 903 786.1 --- 10,219 8,896.5 ---
75-84 83 119.6 --- 1,405 2,025.1 --- 8,772 12,642.7 ---
85 and older 122 413.1 --- 1,463 4,954.1 --- 5,905 19,994.2 ---
Subgroup numbers might not sum to overall number due to missing data or rounding.
Rates are events (deaths, hospital discharges or emergency department visits) per 100,000 population.
Age-adjusted rates are adjusted to the 2000 U.S. standard population.
*Rates are not calculated when the number of events in 2010-2011 combined is less than 20.
4
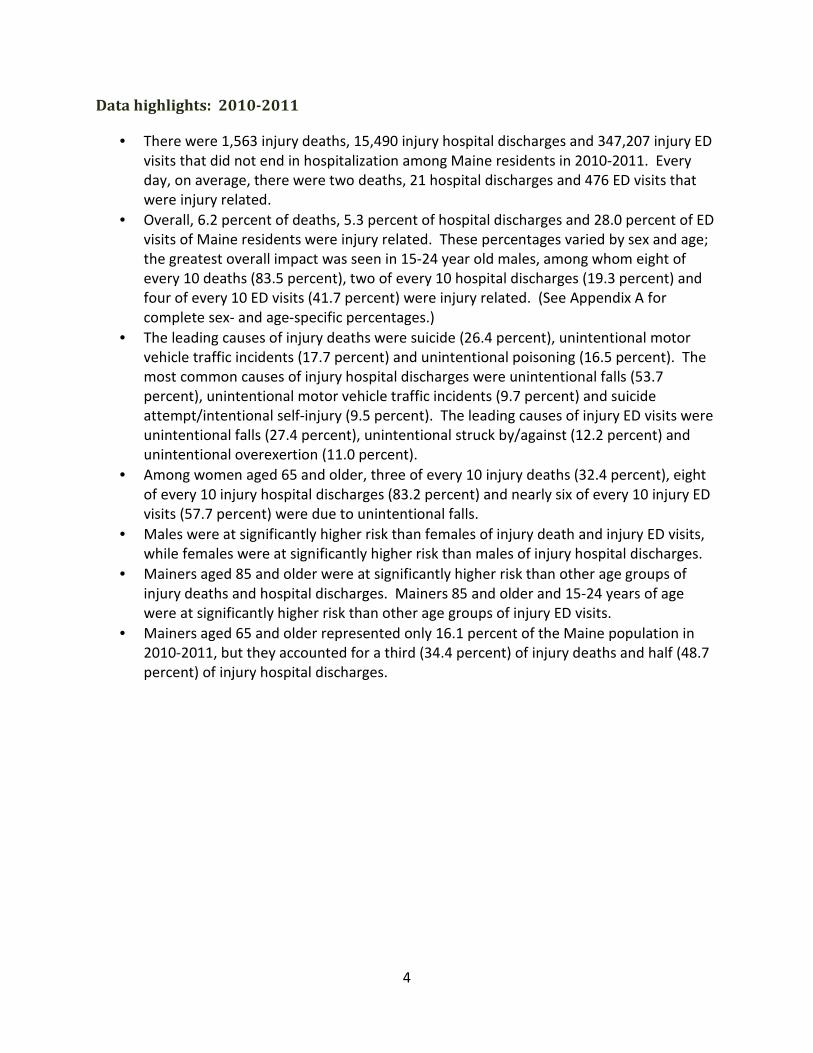
Data highlights: 2010-2011
• There were 1,563 injury deaths, 15,490 injury hospital discharges and 347,207 injury ED
visits that did not end in hospitalization among Maine residents in 2010-2011. Every
day, on average, there were two deaths, 21 hospital discharges and 476 ED visits that
were injury related.
• Overall, 6.2 percent of deaths, 5.3 percent of hospital discharges and 28.0 percent of ED
visits of Maine residents were injury related. These percentages varied by sex and age;
the greatest overall impact was seen in 15-24 year old males, among whom eight of
every 10 deaths (83.5 percent), two of every 10 hospital discharges (19.3 percent) and
four of every 10 ED visits (41.7 percent) were injury related. (See Appendix A for
complete sex- and age-specific percentages.)
• The leading causes of injury deaths were suicide (26.4 percent), unintentional motor
vehicle traffic incidents (17.7 percent) and unintentional poisoning (16.5 percent). The
most common causes of injury hospital discharges were unintentional falls (53.7
percent), unintentional motor vehicle traffic incidents (9.7 percent) and suicide
attempt/intentional self-injury (9.5 percent). The leading causes of injury ED visits were
unintentional falls (27.4 percent), unintentional struck by/against (12.2 percent) and
unintentional overexertion (11.0 percent).
• Among women aged 65 and older, three of every 10 injury deaths (32.4 percent), eight
of every 10 injury hospital discharges (83.2 percent) and nearly six of every 10 injury ED
visits (57.7 percent) were due to unintentional falls.
• Males were at significantly higher risk than females of injury death and injury ED visits,
while females were at significantly higher risk than males of injury hospital discharges.
• Mainers aged 85 and older were at significantly higher risk than other age groups of
injury deaths and hospital discharges. Mainers 85 and older and 15-24 years of age
were at significantly higher risk than other age groups of injury ED visits.
• Mainers aged 65 and older represented only 16.1 percent of the Maine population in
2010-2011, but they accounted for a third (34.4 percent) of injury deaths and half (48.7
percent) of injury hospital discharges.
5
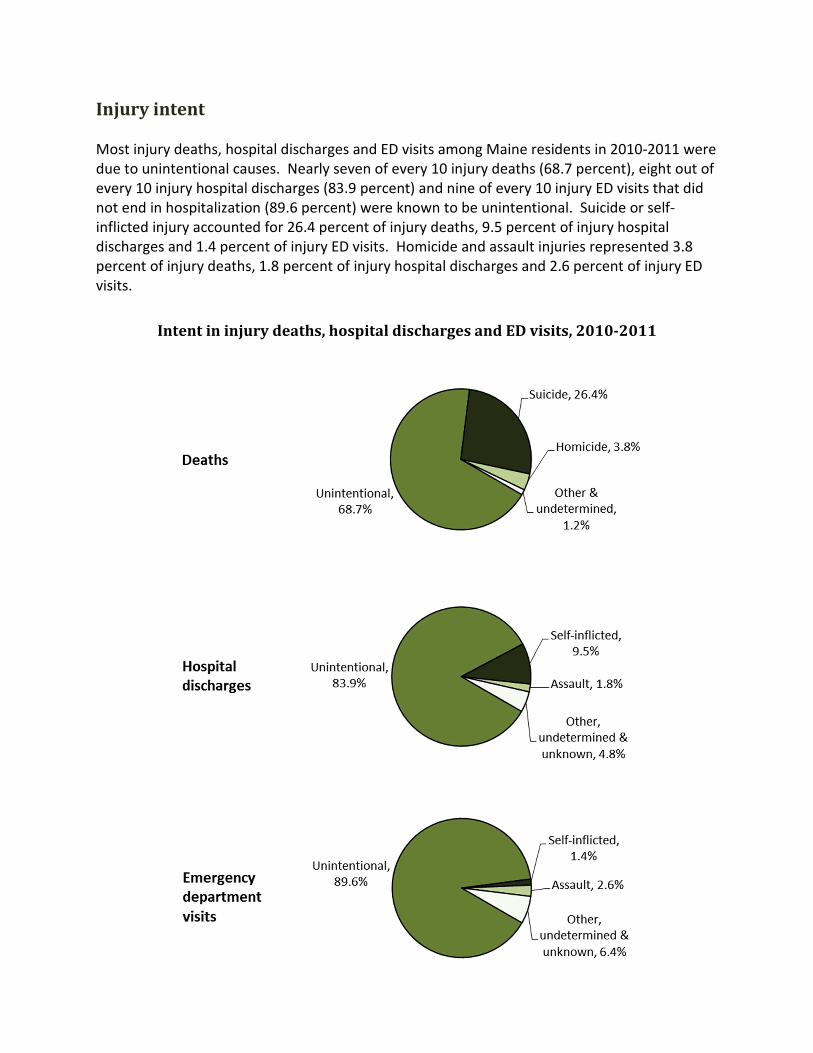
Injury intent
Most injury deaths, hospital discharges and ED visits among Maine residents in 2010-2011 were
due to unintentional causes. Nearly seven of every 10 injury deaths (68.7 percent), eight out of
every 10 injury hospital discharges (83.9 percent) and nine of every 10 injury ED visits that did
not end in hospitalization (89.6 percent) were known to be unintentional. Suicide or self-
inflicted injury accounted for 26.4 percent of injury deaths, 9.5 percent of injury hospital
discharges and 1.4 percent of injury ED visits. Homicide and assault injuries represented 3.8
percent of injury deaths, 1.8 percent of injury hospital discharges and 2.6 percent of injury ED
visits.
Intent in injury deaths, hospital discharges and ED visits, 2010-2011

6
The following sections present information for these intent-specific indicators:
• Unintentional
• Suicide and suicide attempt
• Homicide and assault
7
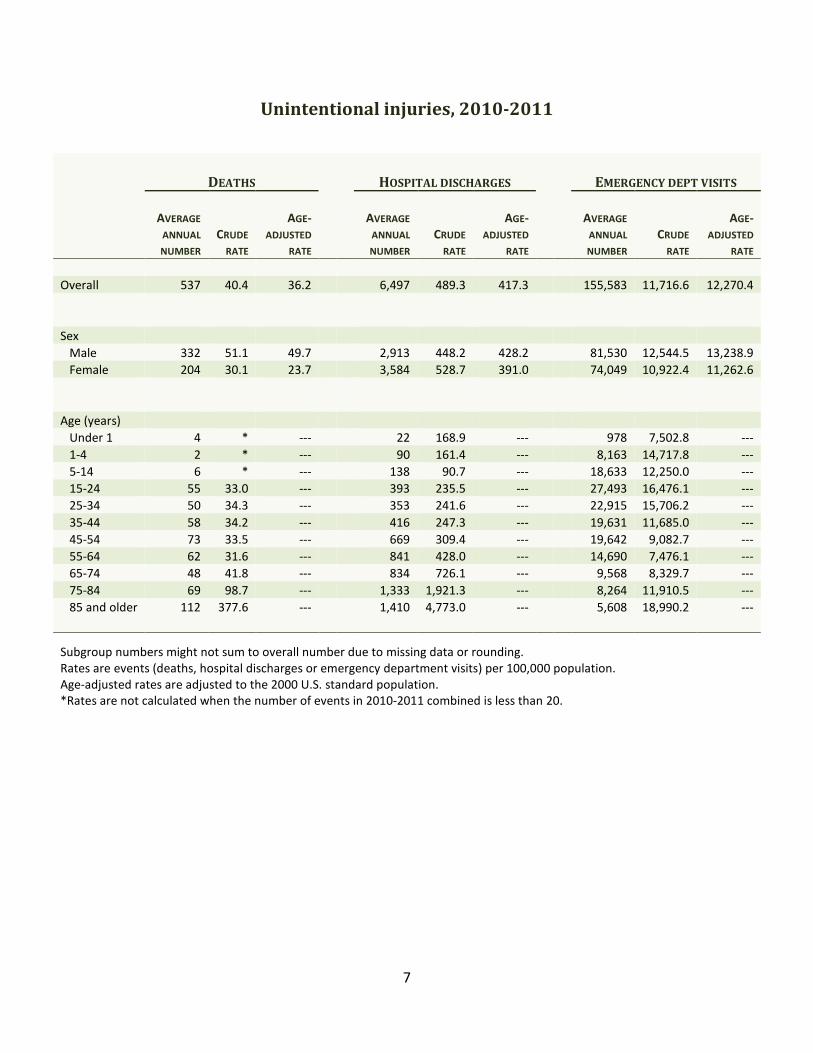
Unintentional injuries, 2010-2011
DEATHS HOSPITAL DISCHARGES EMERGENCY DEPT VISITS
AVERAGE
ANNUAL
NUMBER
CRUDE
RATE
AGE-
ADJUSTED
RATE
AVERAGE
ANNUAL
NUMBER
CRUDE
RATE
AGE-
ADJUSTED
RATE
AVERAGE
ANNUAL
NUMBER
CRUDE
RATE
AGE-
ADJUSTED
RATE
Overall 537 40.4 36.2 6,497 489.3 417.3 155,583 11,716.6 12,270.4
Sex
Male 332 51.1 49.7 2,913 448.2 428.2 81,530 12,544.5 13,238.9
Female 204 30.1 23.7 3,584 528.7 391.0 74,049 10,922.4 11,262.6
Age (years)
Under 1 4 * --- 22 168.9 --- 978 7,502.8 ---
1-4 2 * --- 90 161.4 --- 8,163 14,717.8 ---
5-14 6 * --- 138 90.7 --- 18,633 12,250.0 ---
15-24 55 33.0 --- 393 235.5 --- 27,493 16,476.1 ---
25-34 50 34.3 --- 353 241.6 --- 22,915 15,706.2 ---
35-44 58 34.2 --- 416 247.3 --- 19,631 11,685.0 ---
45-54 73 33.5 --- 669 309.4 --- 19,642 9,082.7 ---
55-64 62 31.6 --- 841 428.0 --- 14,690 7,476.1 ---
65-74 48 41.8 --- 834 726.1 --- 9,568 8,329.7 ---
75-84 69 98.7 --- 1,333 1,921.3 --- 8,264 11,910.5 ---
85 and older 112 377.6 --- 1,410 4,773.0 --- 5,608 18,990.2 ---
Subgroup numbers might not sum to overall number due to missing data or rounding.
Rates are events (deaths, hospital discharges or emergency department visits) per 100,000 population.
Age-adjusted rates are adjusted to the 2000 U.S. standard population.
*Rates are not calculated when the number of events in 2010-2011 combined is less than 20.
8
Unintentional injuries data highlights: 2010-2011
• Unintentional injury refers to an incident where there was no intent to injure or harm
oneself or another person.
• There were 1,073 unintentional injury deaths, 12,994 unintentional injury hospital
discharges and 311,165 unintentional injury ED visits that did not end in hospitalization
among Maine residents in 2010-2011. Every week, on average, there were 10 deaths,
125 hospital discharges and 2,992 ED visits due to unintentional injury.
• Males were at significantly higher risk than females for unintentional injury deaths and
ED visits. Females were at significantly higher risk than males for unintentional injury
hospital discharges.
• Mainers aged 85 and older were at significantly higher risk than other age groups for
unintentional injury deaths, hospital discharges and ED visits.
• Mainers aged 65 and older represented only 16.1 percent of the Maine population in
2010-2011, but they accounted for 42.5 percent of unintentional injury deaths and 55.0
percent of unintentional injury hospital discharges.
• There were both commonalities and differences among the known leading mechanisms
for unintentional injury deaths, hospital discharges and ED visits. Falls were one of the
three leading mechanisms of all three types of events. Motor vehicle traffic incidents
and poisoning were among the three leading mechanisms involved in unintentional
injury deaths and hospital discharges. Struck by or against and overexertion only
appeared as leading mechanisms for unintentional injury ED visits. Specifically, the
three leading mechanisms involved in unintentional injury deaths were motor vehicle
traffic incidents (25.8 percent), poisoning (24.0 percent) and falls (17.0 percent). The
three leading mechanisms involved in unintentional injury hospital discharges were falls
(64.0 percent), motor vehicle traffic incidents (11.6 percent) and poisoning (7.1
percent). The three leading mechanisms in unintentional injury ED visits were falls (30.6
percent), struck by or against (13.6 percent) and overexertion (12.3 percent).
Mechanism was not specified for 13.9 percent of unintentional injury deaths, 2.0
percent of unintentional injury hospital discharges and 7.1 percent of unintentional
injury ED visits, so it is likely that the true percentages of unintentional injury events due
to the leading mechanisms are higher than what is shown here.
• Maine met the Healthy Maine 2010 target to reduce the rate of nonfatal unintentional
injuries (as measured by nonfatal hospital discharges) to no more than 615.0 per
100,000 (age-adjusted), but did not meet the target of reducing deaths caused by
unintentional injury to no more than 27.0 per 100,000 (age-adjusted).5
9
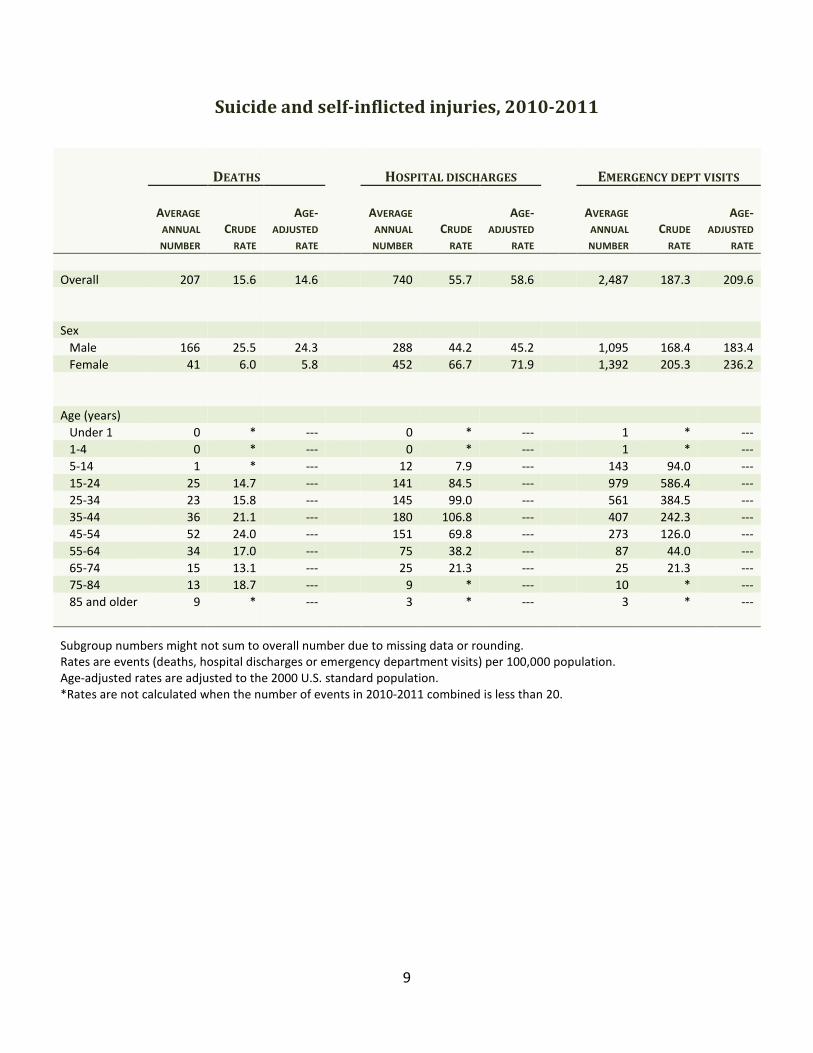
Suicide and self-inflicted injuries, 2010-2011
DEATHS HOSPITAL DISCHARGES EMERGENCY DEPT VISITS
AVERAGE
ANNUAL
NUMBER
CRUDE
RATE
AGE-
ADJUSTED
RATE
AVERAGE
ANNUAL
NUMBER
CRUDE
RATE
AGE-
ADJUSTED
RATE
AVERAGE
ANNUAL
NUMBER
CRUDE
RATE
AGE-
ADJUSTED
RATE
Overall 207 15.6 14.6 740 55.7 58.6 2,487 187.3 209.6
Sex
Male 166 25.5 24.3 288 44.2 45.2 1,095 168.4 183.4
Female 41 6.0 5.8 452 66.7 71.9 1,392 205.3 236.2
Age (years)
Under 1 0 * --- 0 * --- 1 * ---
1-4 0 * --- 0 * --- 1 * ---
5-14 1 * --- 12 7.9 --- 143 94.0 ---
15-24 25 14.7 --- 141 84.5 --- 979 586.4 ---
25-34 23 15.8 --- 145 99.0 --- 561 384.5 ---
35-44 36 21.1 --- 180 106.8 --- 407 242.3 ---
45-54 52 24.0 --- 151 69.8 --- 273 126.0 ---
55-64 34 17.0 --- 75 38.2 --- 87 44.0 ---
65-74 15 13.1 --- 25 21.3 --- 25 21.3 ---
75-84 13 18.7 --- 9 * --- 10 * ---
85 and older 9 * --- 3 * --- 3 * ---
Subgroup numbers might not sum to overall number due to missing data or rounding.
Rates are events (deaths, hospital discharges or emergency department visits) per 100,000 population.
Age-adjusted rates are adjusted to the 2000 U.S. standard population.
*Rates are not calculated when the number of events in 2010-2011 combined is less than 20.
10
Suicide data highlights: 2010-2011
• Suicide refers to completed suicides; self-inflicted injury hospital discharges and ED
visits include completed suicides in which the person lived long enough to be seen in the
hospital, suicide attempts and other intentional self-injurious behavior like cutting or
burning oneself.
• Suicide and self-inflicted injury case definitions can vary across reports; definitions
should be reviewed before comparing information from different sources. For example,
it is important to note that the data presented here are from acute care (general)
hospitals and do not include encounters at psychiatric or rehabilitation hospitals. Also,
hospital discharges were only counted if the principal diagnosis was an injury. Please
see the Technical Notes and Appendices for further details.
• There were 413 suicide deaths, 1,479 self-inflicted injury hospital discharges and 4,973
self-inflicted injury ED visits that did not end in hospitalization among Maine residents in
2010-2011. Every week, on average, there were four suicide deaths, 14 self-inflicted
injury hospital discharges and 48 self-inflicted injury ED visits.
• Males were at significantly higher risk than females for suicide deaths. The death rate
for males was four times higher than that for females. Conversely, females were at
significantly higher risk than males for self-inflicted injury hospital discharges and ED
visits.
• No one age group was at significantly higher risk of suicide death than all other age
groups. Mainers aged 35-44 years had a significantly higher risk of self-inflicted injury
hospital discharges than all other age groups except 25-34 year olds. Mainers aged 15-
24 years were at significantly higher risk of self-inflicted injury ED visits than all other
age groups.
• The most common known mechanisms used in suicide deaths were firearms (49.9
percent), hanging, strangulation and suffocation (24.2 percent) and poisoning (17.7
percent). In contrast, nine out of every 10 self-inflicted injury hospital discharges (92.2
percent) were due to poisoning. The most common mechanisms among self-inflicted
injury ED visits were poisoning (43.3 percent) and cutting and piercing instruments (33.4
percent).
• The 2011 Maine Integrated Youth Health Survey found that, during the past 12 months,
12.7 percent of Maine high school students had seriously considered attempting suicide
and 17.8 percent had done something to purposely hurt themselves without wanting to
die (e.g., cutting or burning themselves on purpose).6
• Results from the 2011 Maine Integrated Youth Health Survey also showed that 14.5
percent of Maine middle school (7th
and 8th
grade) students had ever seriously thought
about killing themselves and 12.3 percent had ever done something to purposely hurt
themselves without wanting to die (e.g., cutting or burning themselves on purpose).7
• Maine met the Healthy Maine 2010 target of reducing suicide attempts (as measured by
self-inflicted injury hospital discharges) to no more than 62.3 per 100,000 (age-
adjusted), but did not meet the target of reducing suicide deaths to no more than 12.7
per 100,000 (age-adjusted).5 Healthy Maine 2020 includes a goal to reduce the suicide
rate to no more than 12.6 per 100,000 (age-adjusted).1
11
Homicide and assault related injuries, 2010-2011
DEATHS HOSPITAL DISCHARGES EMERGENCY DEPT VISITS
AVERAGE
ANNUAL
NUMBER
CRUDE
RATE
AGE-
ADJUSTED
RATE
AVERAGE
ANNUAL
NUMBER
CRUDE
RATE
AGE-
ADJUSTED
RATE
AVERAGE
ANNUAL
NUMBER
CRUDE
RATE
AGE-
ADJUSTED
RATE
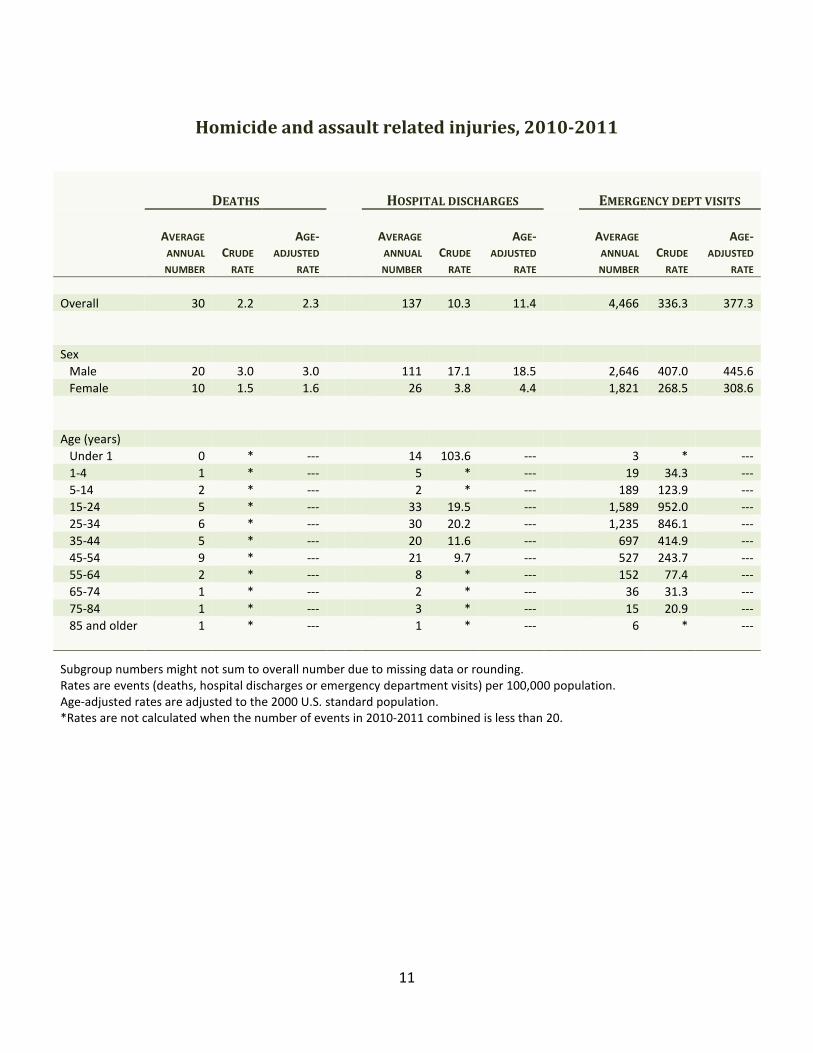
Overall 30 2.2 2.3 137 10.3 11.4 4,466 336.3 377.3
Sex
Male 20 3.0 3.0 111 17.1 18.5 2,646 407.0 445.6
Female 10 1.5 1.6 26 3.8 4.4 1,821 268.5 308.6
Age (years)
Under 1 0 * --- 14 103.6 --- 3 * ---
1-4 1 * --- 5 * --- 19 34.3 ---
5-14 2 * --- 2 * --- 189 123.9 ---
15-24 5 * --- 33 19.5 --- 1,589 952.0 ---
25-34 6 * --- 30 20.2 --- 1,235 846.1 ---
35-44 5 * --- 20 11.6 --- 697 414.9 ---
45-54 9 * --- 21 9.7 --- 527 243.7 ---
55-64 2 * --- 8 * --- 152 77.4 ---
65-74 1 * --- 2 * --- 36 31.3 ---
75-84 1 * --- 3 * --- 15 20.9 ---
85 and older 1 * --- 1 * --- 6 * ---
Subgroup numbers might not sum to overall number due to missing data or rounding.
Rates are events (deaths, hospital discharges or emergency department visits) per 100,000 population.
Age-adjusted rates are adjusted to the 2000 U.S. standard population.
*Rates are not calculated when the number of events in 2010-2011 combined is less than 20.
12
Homicide and assault data highlights: 2010-2011
• Homicide and assault injury refer to an injury purposefully inflicted by a person against
another person, excluding those that are the result of legal intervention or war.
• There were 59 homicide deaths, 273 assault related hospital discharges and 8,932
assault related ED visits that did not end in hospitalization among Maine residents in
2010-2011. Every month, on average, there were two homicide deaths, 11 assault
related hospital discharges and 372 assault related ED visits that did not result in
hospitalization.
• A report by the Maine Domestic Abuse Homicide Review Panel on 48 homicides that
occurred in Maine in 2010-2011 found 43.8 percent were domestic violence related.8
• Males were at significantly higher risk than females of having an assault related hospital
discharge or ED visit; 81.3 percent of assault related hospital discharges, 59.2 percent of
assault related ED visits and 66.1 percent of homicides occurred among males.
• Infants under 1 year of age were at significantly higher risk of assault related hospital
discharges than any other age group; however, three-fourths (75.1 percent) of assault
related discharges occurred among 15-54 year olds. Mainers 15-24 years of age were at
significantly higher risk of assault related ED visits than all other age groups; 90.6
percent of assault related ED visits were among 15-54 year olds. Similarly, 79.7 percent
of homicide deaths were among 15-54 year olds.
• The two most common known mechanisms used in homicides were firearms (54.2
percent) and cutting or piercing instruments (16.9 percent); mechanism was not
reported for 20.3 percent of homicides. The two most common known mechanisms
associated with assault related hospital discharges were “struck by or against” (39.2
percent; includes unarmed fight/brawl or being struck by a blunt or thrown object) and
cutting or piercing instruments (18.7 percent); mechanism was not reported for 17.6
percent of assault related hospital discharges. The most common known mechanism for
assault related ED visits was struck by or against (52.9 percent); mechanism was not
reported for 15.2 percent of assault related ED visits.
• The 2011 Maine Integrated Youth Health Survey found that, during the past 12 months,
19.5 percent of Maine high school students had been in a physical fight, 3.1 percent had
been in a physical fight in which they were injured and had to be treated by a doctor or
nurse and 11.3 percent reported that their boyfriend or girlfriend had hit, slapped or
physically hurt them on purpose. One out of four high school students (24.4 percent)
reported that violence in their home or the threat of violence had ever made them want
to leave their home, even just for a short while.6
• 2011 Maine Integrated Youth Health Survey results also showed that 7.9 percent of
Maine middle school (7th
and 8th
grade) students had ever been in a physical fight in
which they were injured and had to be treated by a doctor or nurse. One out of five
middle school students (20.8 percent) reported that violence in their home or the threat
of violence had ever made them want to leave their home, even just for a short while.7

13
• Maine did not meet the Healthy Maine 2010 target of reducing physical assaults (as
measured by nonfatal assault related hospital discharges) to no more than 9.9 per
100,000 population (age-adjusted).5
14
Injury mechanism
The following sections present information for these indicators:
• Unintentional drowning and near drowning
• Unintentional fall
• Unintentional fire
• Firearm (all intents)
• Unintentional motor vehicle traffic
• Poisoning (all intents)
15
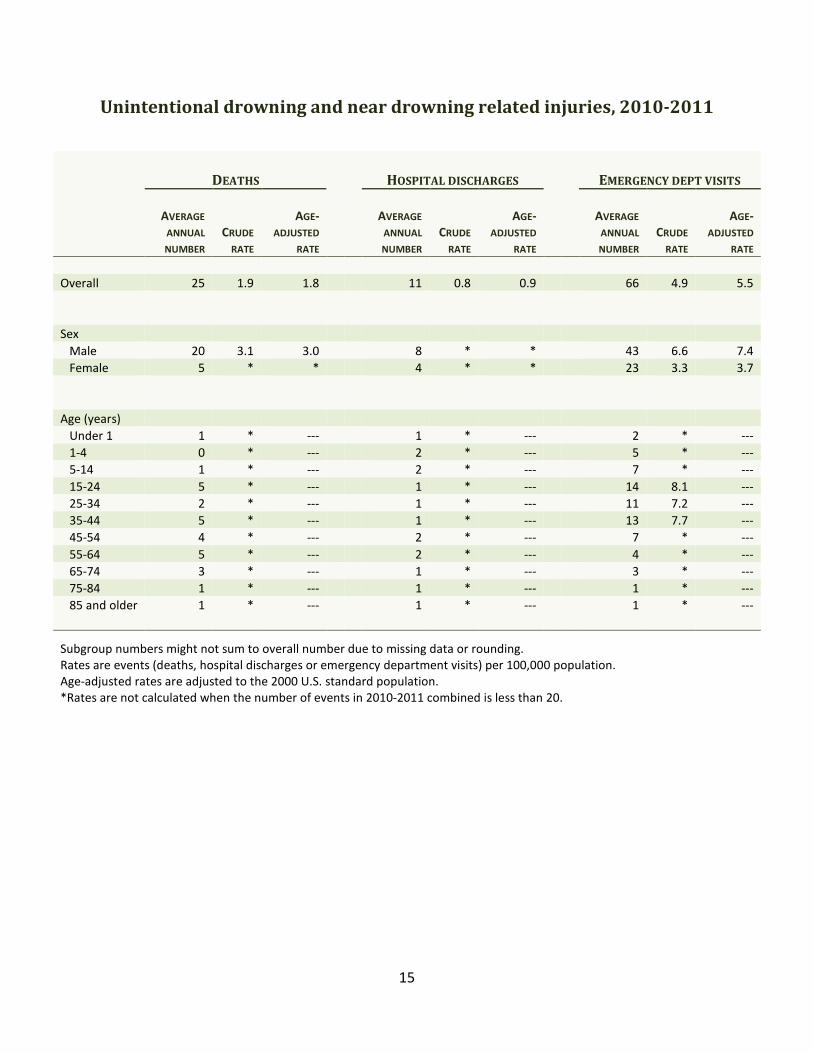
Unintentional drowning and near drowning related injuries, 2010-2011
DEATHS HOSPITAL DISCHARGES EMERGENCY DEPT VISITS
AVERAGE
ANNUAL
NUMBER
CRUDE
RATE
AGE-
ADJUSTED
RATE
AVERAGE
ANNUAL
NUMBER
CRUDE
RATE
AGE-
ADJUSTED
RATE
AVERAGE
ANNUAL
NUMBER
CRUDE
RATE
AGE-
ADJUSTED
RATE
Overall 25 1.9 1.8 11 0.8 0.9 66 4.9 5.5
Sex
Male 20 3.1 3.0 8 * * 43 6.6 7.4
Female 5 * * 4 * * 23 3.3 3.7
Age (years)
Under 1 1 * --- 1 * --- 2 * ---
1-4 0 * --- 2 * --- 5 * ---
5-14 1 * --- 2 * --- 7 * ---
15-24 5 * --- 1 * --- 14 8.1 ---
25-34 2 * --- 1 * --- 11 7.2 ---
35-44 5 * --- 1 * --- 13 7.7 ---
45-54 4 * --- 2 * --- 7 * ---
55-64 5 * --- 2 * --- 4 * ---
65-74 3 * --- 1 * --- 3 * ---
75-84 1 * --- 1 * --- 1 * ---
85 and older 1 * --- 1 * --- 1 * ---
Subgroup numbers might not sum to overall number due to missing data or rounding.
Rates are events (deaths, hospital discharges or emergency department visits) per 100,000 population.
Age-adjusted rates are adjusted to the 2000 U.S. standard population.
*Rates are not calculated when the number of events in 2010-2011 combined is less than 20.
16
Drowning and near drowning data highlights: 2010-2011
• There were 50 deaths, 22 hospital discharges and 131 ED visits that did not end in
hospitalization due to unintentional drowning or near drowning among Maine residents
in 2010-2011. Every month, on average, there were two unintentional drowning deaths
one unintentional drowning or near-drowning hospital discharge and five ED visits.
• Males were at significantly higher risk than females of unintentional drowning deaths
and unintentional drowning or near drowning related ED visits. Four out of every five
unintentional drowning deaths (80.0 percent) and two-thirds of unintentional drowning
or near drowning hospital discharges (68.2 percent) and ED visits (65.6 percent) were
among males.
17
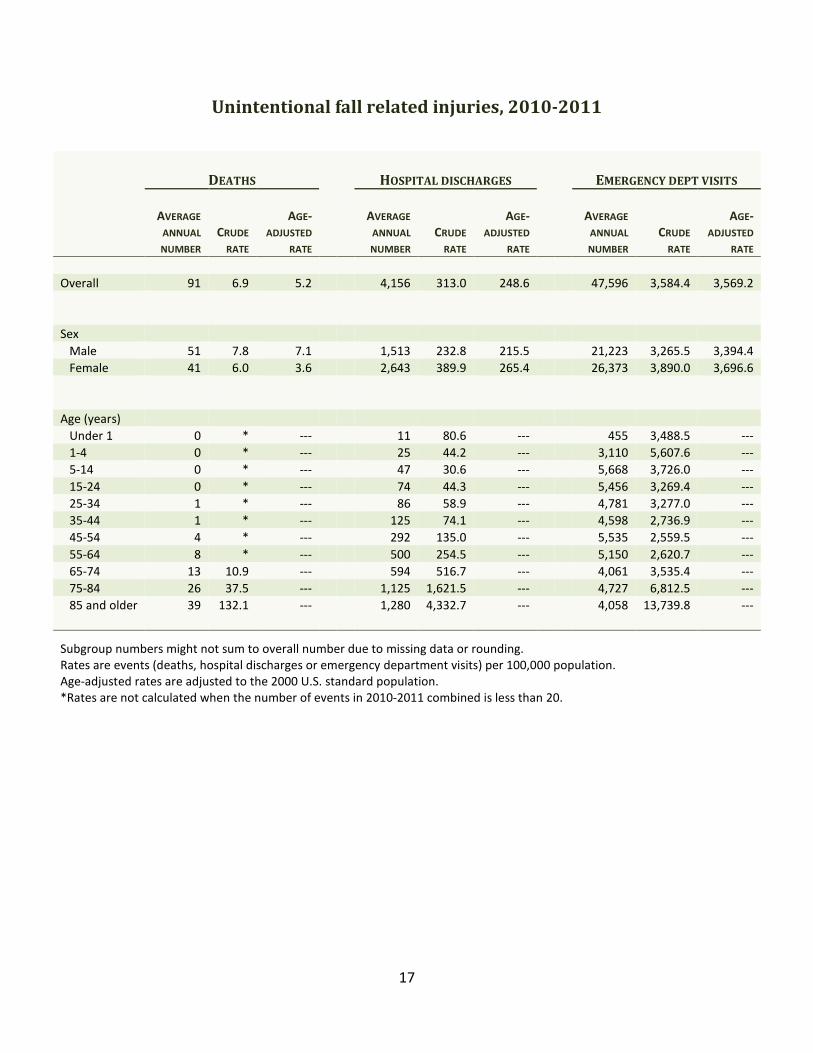
Unintentional fall related injuries, 2010-2011
DEATHS HOSPITAL DISCHARGES EMERGENCY DEPT VISITS
AVERAGE
ANNUAL
NUMBER
CRUDE
RATE
AGE-
ADJUSTED
RATE
AVERAGE
ANNUAL
NUMBER
CRUDE
RATE
AGE-
ADJUSTED
RATE
AVERAGE
ANNUAL
NUMBER
CRUDE
RATE
AGE-
ADJUSTED
RATE
Overall 91 6.9 5.2 4,156 313.0 248.6 47,596 3,584.4 3,569.2
Sex
Male 51 7.8 7.1 1,513 232.8 215.5 21,223 3,265.5 3,394.4
Female 41 6.0 3.6 2,643 389.9 265.4 26,373 3,890.0 3,696.6
Age (years)
Under 1 0 * --- 11 80.6 --- 455 3,488.5 ---
1-4 0 * --- 25 44.2 --- 3,110 5,607.6 ---
5-14 0 * --- 47 30.6 --- 5,668 3,726.0 ---
15-24 0 * --- 74 44.3 --- 5,456 3,269.4 ---
25-34 1 * --- 86 58.9 --- 4,781 3,277.0 ---
35-44 1 * --- 125 74.1 --- 4,598 2,736.9 ---
45-54 4 * --- 292 135.0 --- 5,535 2,559.5 ---
55-64 8 * --- 500 254.5 --- 5,150 2,620.7 ---
65-74 13 10.9 --- 594 516.7 --- 4,061 3,535.4 ---
75-84 26 37.5 --- 1,125 1,621.5 --- 4,727 6,812.5 ---
85 and older 39 132.1 --- 1,280 4,332.7 --- 4,058 13,739.8 ---
Subgroup numbers might not sum to overall number due to missing data or rounding.
Rates are events (deaths, hospital discharges or emergency department visits) per 100,000 population.
Age-adjusted rates are adjusted to the 2000 U.S. standard population.
*Rates are not calculated when the number of events in 2010-2011 combined is less than 20.
18
Unintentional fall data highlights: 2010-2011
• There were 182 deaths due to unintentional falls, 8,312 unintentional fall related
hospital discharges and 95,192 unintentional fall related ED visits that did not end in
hospitalization among Maine residents in 2010-2011. Every week, on average, there
were two deaths, 80 hospital discharges and 915 ED visits that were due to
unintentional falls.
• Females were at significantly higher risk than males of unintentional fall related hospital
discharges and ED visits; there were no statistically significant differences by sex for
deaths.
• Mainers aged 85 and older were at significantly higher risk than other age groups for
unintentional fall related deaths, hospital discharges and ED visits.
• Mainers 65 years and older represented only 16.1 percent of the Maine population in
2010-2011, but they accounted for 85.2 percent of unintentional fall related deaths,
72.1 percent of unintentional fall related hospital discharges and 27.0 percent of
unintentional fall related ED visits.
• Among women aged 65 and older, three of every 10 injury deaths (32.4 percent), eight
of every 10 injury hospital discharges (83.2 percent) and almost six of every 10 injury ED
visits (57.7 percent) were due to unintentional falls.
• Seven of every 10 deaths due to unintentional falls (72.0 percent) and one of every 10
unintentional fall related hospital discharges (12.7 percent) and ED visits (10.3 percent)
involved a traumatic brain injury.
• One of every three unintentional fall related hospital discharges (33.7 percent) involved
a hip fracture; this percentage increased to 42.2 percent among Mainers aged 65 and
older.
• The 2010 Behavioral Risk Factor Surveillance System survey found that almost one in
five Maine adults aged 45 and older (18.8 percent) had fallen at least once in the past 3
months. Nearly a third (31.6 percent) of those who fell said at least one fall had caused
an injury that caused them to limit their regular activities for at least 1 day or to go see a
doctor.9
• Maine met the Healthy Maine 2010 target of no more than 366 nonfatal unintentional
fall related hospital discharges per 100,000 (age-adjusted), but did not meet the target
of no more than 4.0 deaths due to falls per 100,000 residents (age-adjusted).5 Healthy
Maine 2020 includes a goal to reduce the unintentional fall-related ED visit rate among
adults age 65 and older to no more than 6,718.3 per 100,000.1
19
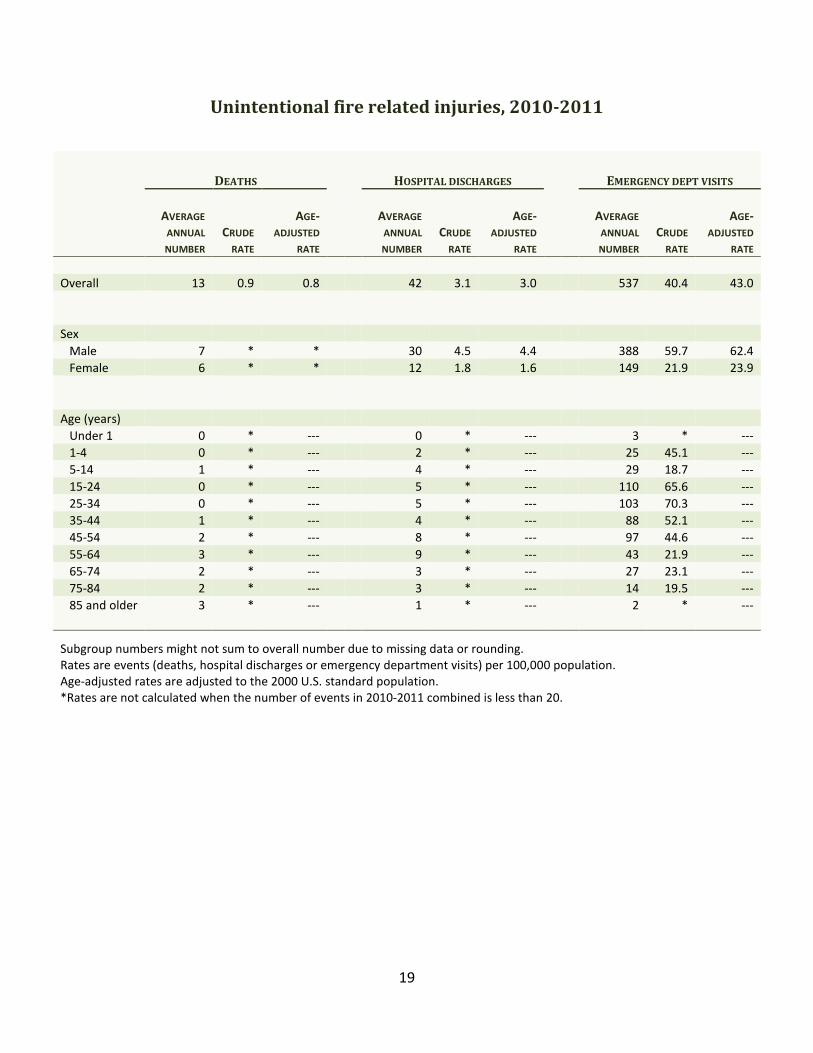
Unintentional fire related injuries, 2010-2011
DEATHS HOSPITAL DISCHARGES EMERGENCY DEPT VISITS
AVERAGE
ANNUAL
NUMBER
CRUDE
RATE
AGE-
ADJUSTED
RATE
AVERAGE
ANNUAL
NUMBER
CRUDE
RATE
AGE-
ADJUSTED
RATE
AVERAGE
ANNUAL
NUMBER
CRUDE
RATE
AGE-
ADJUSTED
RATE
Overall 13 0.9 0.8 42 3.1 3.0 537 40.4 43.0
Sex
Male 7 * * 30 4.5 4.4 388 59.7 62.4
Female 6 * * 12 1.8 1.6 149 21.9 23.9
Age (years)
Under 1 0 * --- 0 * --- 3 * ---
1-4 0 * --- 2 * --- 25 45.1 ---
5-14 1 * --- 4 * --- 29 18.7 ---
15-24 0 * --- 5 * --- 110 65.6 ---
25-34 0 * --- 5 * --- 103 70.3 ---
35-44 1 * --- 4 * --- 88 52.1 ---
45-54 2 * --- 8 * --- 97 44.6 ---
55-64 3 * --- 9 * --- 43 21.9 ---
65-74 2 * --- 3 * --- 27 23.1 ---
75-84 2 * --- 3 * --- 14 19.5 ---
85 and older 3 * --- 1 * --- 2 * ---
Subgroup numbers might not sum to overall number due to missing data or rounding.
Rates are events (deaths, hospital discharges or emergency department visits) per 100,000 population.
Age-adjusted rates are adjusted to the 2000 U.S. standard population.
*Rates are not calculated when the number of events in 2010-2011 combined is less than 20.
20
Unintentional fire data highlights: 2010-2011
• Unintentional fire related (exposure to fire, smoke and flames) injuries accounted for 25
deaths, 83 hospital discharges and 1,073 ED visits that did not end in hospitalization
among Maine residents in 2010-2011. On average, there was one unintentional fire
related death, three unintentional fire related hospital discharges and 45 unintentional
fire related ED visits every month.
• Males were at significantly higher risk of unintentional fire related hospital discharges
and ED visits than females. Almost six of every 10 unintentional fire related deaths (56.0
percent) and seven of every 10 hospital discharges (71.1 percent) and ED visits (72.3
percent) occurred among males.
• Mainers aged 25-34 years were at significantly higher risk of unintentional fire related
ED visits than all other age groups except 15-24 year olds.
• Mainers aged 65 and older represented only 16.1 percent of the Maine population in
2010-2011, but they accounted for over half of the unintentional fire related deaths
(56.0 percent).
21
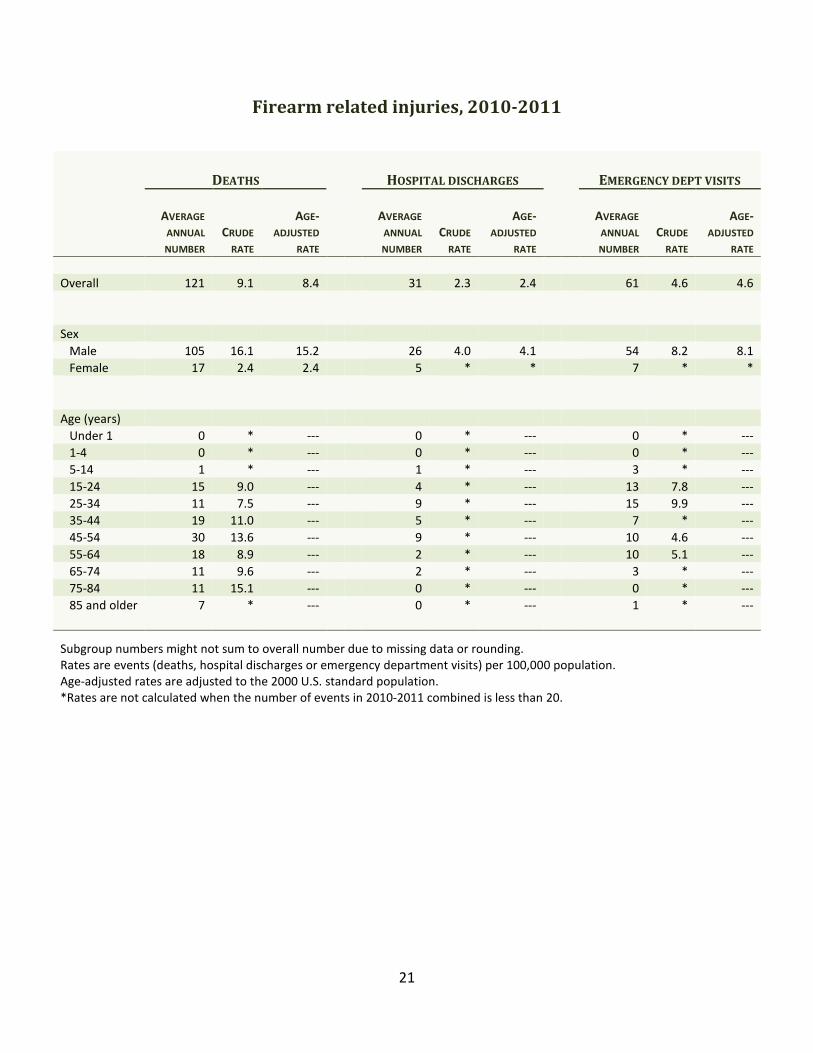
Firearm related injuries, 2010-2011
DEATHS HOSPITAL DISCHARGES EMERGENCY DEPT VISITS
AVERAGE
ANNUAL
NUMBER
CRUDE
RATE
AGE-
ADJUSTED
RATE
AVERAGE
ANNUAL
NUMBER
CRUDE
RATE
AGE-
ADJUSTED
RATE
AVERAGE
ANNUAL
NUMBER
CRUDE
RATE
AGE-
ADJUSTED
RATE
Overall 121 9.1 8.4 31 2.3 2.4 61 4.6 4.6
Sex
Male 105 16.1 15.2 26 4.0 4.1 54 8.2 8.1
Female 17 2.4 2.4 5 * * 7 * *
Age (years)
Under 1 0 * --- 0 * --- 0 * ---
1-4 0 * --- 0 * --- 0 * ---
5-14 1 * --- 1 * --- 3 * ---
15-24 15 9.0 --- 4 * --- 13 7.8 ---
25-34 11 7.5 --- 9 * --- 15 9.9 ---
35-44 19 11.0 --- 5 * --- 7 * ---
45-54 30 13.6 --- 9 * --- 10 4.6 ---
55-64 18 8.9 --- 2 * --- 10 5.1 ---
65-74 11 9.6 --- 2 * --- 3 * ---
75-84 11 15.1 --- 0 * --- 0 * ---
85 and older 7 * --- 0 * --- 1 * ---
Subgroup numbers might not sum to overall number due to missing data or rounding.
Rates are events (deaths, hospital discharges or emergency department visits) per 100,000 population.
Age-adjusted rates are adjusted to the 2000 U.S. standard population.
*Rates are not calculated when the number of events in 2010-2011 combined is less than 20.
22
Firearm data highlights: 2010-2011
• There were 242 firearm related deaths, 61 firearm related hospital discharges and 121
firearm related ED visits that did not result in hospitalization among Maine residents in
2010-2011. Every month, on average, there were 10 firearm related deaths, three
firearm related hospital discharges and five firearm related ED visits.
• Males were at significantly higher risk than females of firearm related deaths, hospital
discharges and ED visits. Nearly nine out of every 10 firearm related deaths (86.4
percent), hospital discharges (85.2 percent) and ED visits (88.4 percent) occurred among
males.
• There were no firearm related deaths, hospital discharges or ED visits among children
under 5 years of age. Two firearm related deaths, one hospital discharge and five ED
visits occurred among 5-14 year olds in 2010-2011.
• Most (85.1 percent) of the firearm related deaths were suicides; 13.2 percent were
homicides, 0.8 percent were unintentional and 0.8 percent were the result of legal
intervention. A different intent pattern was seen among firearm related hospital
discharges, where almost half (45.9 percent) were unintentional, a third (32.8 percent)
were self-inflicted, 9.8 percent were the result of legal intervention, 8.2 percent were
assaults and 3.3 percent were of undetermined intent. Similarly, among ED visits, 62.8
percent were unintentional, 22.3 percent were self-inflicted, 8.3 percent were assaults,
3.3 percent were the result of legal intervention and 3.3 percent were of undetermined
intent.
23
Unintentional motor vehicle traffic related injuries, 2010-2011
DEATHS HOSPITAL DISCHARGES EMERGENCY DEPT VISITS
AVERAGE
ANNUAL
NUMBER
CRUDE
RATE
AGE-
ADJUSTED
RATE
AVERAGE
ANNUAL
NUMBER
CRUDE
RATE
AGE-
ADJUSTED
RATE
AVERAGE
ANNUAL
NUMBER
CRUDE
RATE
AGE-
ADJUSTED
RATE
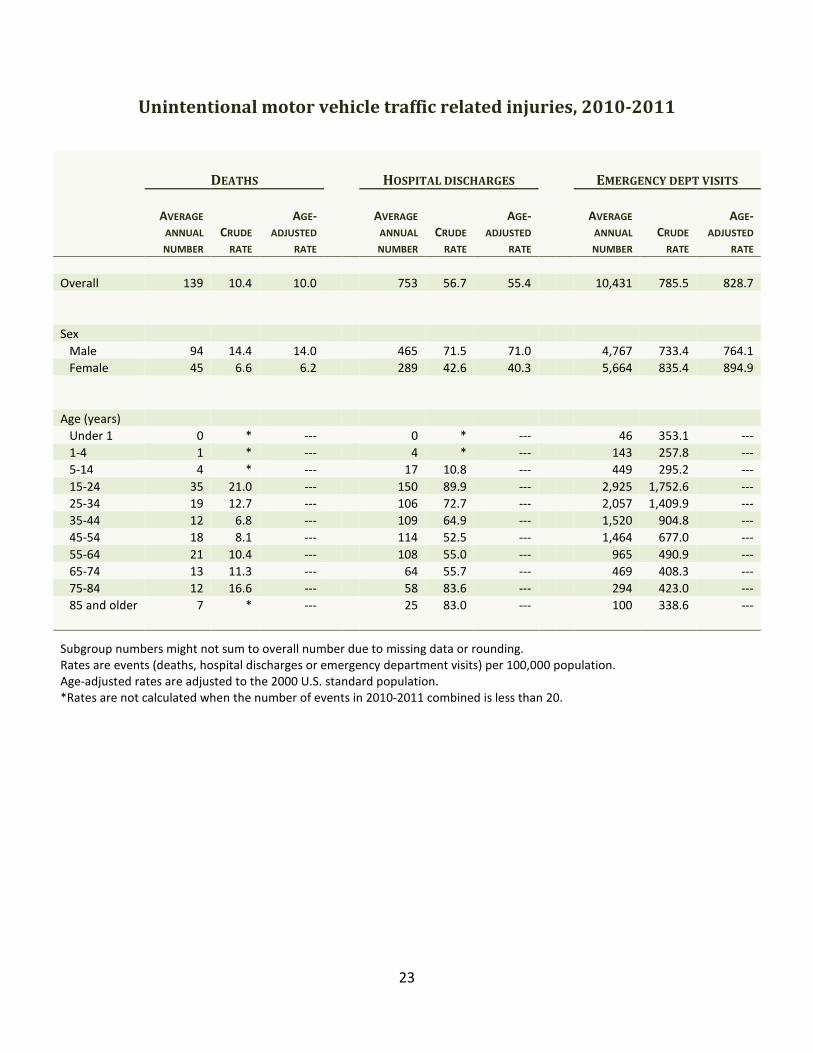
Overall 139 10.4 10.0 753 56.7 55.4 10,431 785.5 828.7
Sex
Male 94 14.4 14.0 465 71.5 71.0 4,767 733.4 764.1
Female 45 6.6 6.2 289 42.6 40.3 5,664 835.4 894.9
Age (years)
Under 1 0 * --- 0 * --- 46 353.1 ---
1-4 1 * --- 4 * --- 143 257.8 ---
5-14 4 * --- 17 10.8 --- 449 295.2 ---
15-24 35 21.0 --- 150 89.9 --- 2,925 1,752.6 ---
25-34 19 12.7 --- 106 72.7 --- 2,057 1,409.9 ---
35-44 12 6.8 --- 109 64.9 --- 1,520 904.8 ---
45-54 18 8.1 --- 114 52.5 --- 1,464 677.0 ---
55-64 21 10.4 --- 108 55.0 --- 965 490.9 ---
65-74 13 11.3 --- 64 55.7 --- 469 408.3 ---
75-84 12 16.6 --- 58 83.6 --- 294 423.0 ---
85 and older 7 * --- 25 83.0 --- 100 338.6 ---
Subgroup numbers might not sum to overall number due to missing data or rounding.
Rates are events (deaths, hospital discharges or emergency department visits) per 100,000 population.
Age-adjusted rates are adjusted to the 2000 U.S. standard population.
*Rates are not calculated when the number of events in 2010-2011 combined is less than 20.
24
Motor vehicle traffic incident data highlights: 2010-2011
• “Motor vehicle traffic” refers to incidents that take place on a public highway or street
and includes drivers and passengers, as well as pedestrians, pedal cyclists and animal
riders injured in these incidents.10
• In 2010-2011, 277 deaths, 1,506 hospital discharges and 20,861 ED visits that did not
end in hospitalization among Maine residents were related to unintentional motor
vehicle traffic incidents. Every week, on average, there were three deaths, 14 hospital
discharges and 201 ED visits that were due to unintentional motor vehicle traffic
incidents.
• Males were at significantly higher risk than females of both unintentional motor vehicle
traffic deaths and hospital discharges, but females were at significantly higher risk of
unintentional motor vehicle traffic ED visits. Males accounted for 67.5 percent of
unintentional motor vehicle traffic deaths and 61.7 percent of unintentional motor
vehicle traffic hospital discharges, but only 45.7 percent of unintentional motor vehicle
traffic ED visits.
• Mainers 15-24 years of age made up 12.6 percent of the population, but accounted for
25.3 percent of the unintentional motor vehicle traffic deaths, 19.9 percent of the
hospital discharges and 28.0 percent of the ED visits. They were at significantly higher
risk of unintentional motor vehicle traffic related ED visits than any other age group.
• Almost half (46.9 percent) of unintentional motor vehicle traffic deaths, 31.5 percent of
unintentional motor vehicle traffic hospital discharges and 10.4 percent of unintentional
motor vehicle traffic ED visits involved a traumatic brain injury.
• On the 2011 Maine Integrated Youth Health Survey, 12.0 percent of Maine high school
students reported they never or rarely wore a seat belt when driving a car or other
vehicle and 8.5 percent said they never or rarely wore a seat belt when riding in a car
driven by someone else. Five percent (5.0 percent) of high school students said they
had driven a car or other vehicle during the past 30 days when they had been drinking
alcohol; 15.8 percent had ridden in a car or other vehicle driven by someone who had
been drinking alcohol and 21.8 percent had ridden in a car driven by someone who had
been taking illegal drugs such as marijuana during this same time period. Four of every
10 Maine high school students (41.4 percent) reported they had done other activities
(such as eating, talking on a cell phone, combing their hair, etc.) while driving during the
past 30 days.6
• The 2011 Maine Integrated Youth Health Survey also found that 5.1 percent of Maine
middle school (7th
and 8th
grade) students never or rarely wore a seat belt when riding in
a car. Three of every 10 middle school students (28.4 percent) reported they had ever
ridden in a car or other vehicle driven by someone who had been drinking alcohol and
10.2 percent had ever ridden in a car or other vehicle driven by someone who had been
taking illegal drugs such as marijuana.7
• On the 2011 Behavioral Risk Factor Surveillance System survey, 3.9 percent of Maine
adults aged 18 and older reported they never or seldom used a seat belt when driving or
riding in a car.11
On the 2010 Behavioral Risk Factor Surveillance System survey, 1.2
25
percent of Mainers aged 18 years and older reported they had driven at least once after
having too much to drink during the past month.12
• Maine met the Healthy Maine 2010 target of reducing nonfatal injuries caused by motor
vehicle crashes (as measured by hospital discharges) to no more than 82 per 100,000
(age-adjusted) and also met the target of reducing deaths caused by motor vehicle
crashes to no more than 10.6 per 100,000 (age-adjusted).5 Healthy Maine 2020 includes
a goal to reduce motor vehicle crash related deaths to no more than 10.0 per 100,000
(age-adjusted).1
26
Poisoning related injuries, 2010-2011
DEATHS HOSPITAL DISCHARGES EMERGENCY DEPT VISITS
AVERAGE
ANNUAL
NUMBER
CRUDE
RATE
AGE-
ADJUSTED
RATE
AVERAGE
ANNUAL
NUMBER
CRUDE
RATE
AGE-
ADJUSTED
RATE
AVERAGE
ANNUAL
NUMBER
CRUDE
RATE
AGE-
ADJUSTED
RATE
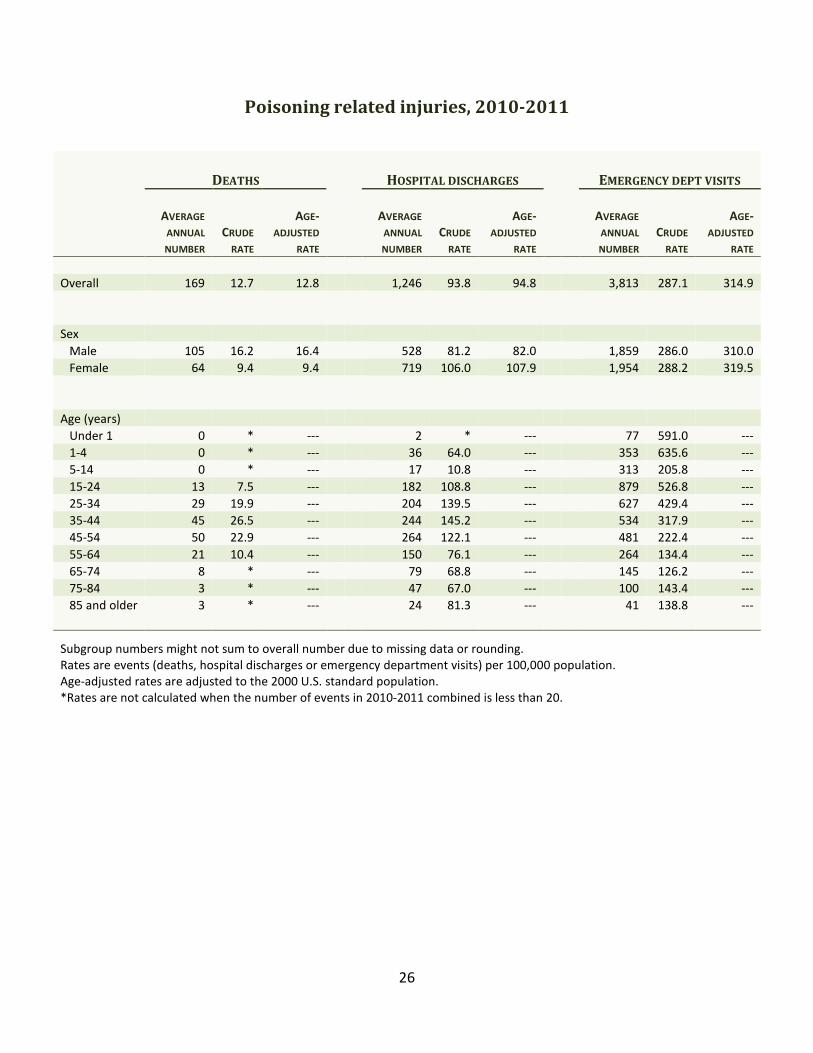
Overall 169 12.7 12.8 1,246 93.8 94.8 3,813 287.1 314.9
Sex
Male 105 16.2 16.4 528 81.2 82.0 1,859 286.0 310.0
Female 64 9.4 9.4 719 106.0 107.9 1,954 288.2 319.5
Age (years)
Under 1 0 * --- 2 * --- 77 591.0 ---
1-4 0 * --- 36 64.0 --- 353 635.6 ---
5-14 0 * --- 17 10.8 --- 313 205.8 ---
15-24 13 7.5 --- 182 108.8 --- 879 526.8 ---
25-34 29 19.9 --- 204 139.5 --- 627 429.4 ---
35-44 45 26.5 --- 244 145.2 --- 534 317.9 ---
45-54 50 22.9 --- 264 122.1 --- 481 222.4 ---
55-64 21 10.4 --- 150 76.1 --- 264 134.4 ---
65-74 8 * --- 79 68.8 --- 145 126.2 ---
75-84 3 * --- 47 67.0 --- 100 143.4 ---
85 and older 3 * --- 24 81.3 --- 41 138.8 ---
Subgroup numbers might not sum to overall number due to missing data or rounding.
Rates are events (deaths, hospital discharges or emergency department visits) per 100,000 population.
Age-adjusted rates are adjusted to the 2000 U.S. standard population.
*Rates are not calculated when the number of events in 2010-2011 combined is less than 20.
27
Poisoning data highlights: 2010-2011
• There were 338 poisoning deaths, 2,492 poisoning hospital discharges and 7,625
poisoning ED visits that did not end in hospitalization among Maine residents in 2010-
2011. Every week, on average, there were three deaths, 24 hospital discharges and 73
ED visits due to poisoning.
• Males were at significantly higher risk than females for poisoning deaths. Conversely,
females were at significantly higher risk than males for poisoning hospital discharges.
• Poisoning deaths and hospital discharges were less common at the younger and older
ends of the age spectrum. Mainers 35-44 years of age were at significantly higher risk of
these events than all other age groups except 25-34 and 45-54 year olds. Conversely,
children under 5 years of age were at significantly higher risk of poisoning ED visits than
all other age groups.
• Nearly eight of every 10 poisoning deaths (76.3 percent) were unintentional; another
21.6 percent were suicides. Among poisoning hospital discharges, 54.7 percent were
self-inflicted and 37.1 percent were unintentional. Among poisoning ED visits, 59.1
percent were unintentional and 28.2 percent were self-inflicted.
• Most (86.4 percent) of the poisoning deaths in 2011 were acute drug overdoses.
• Healthy Maine 2020 includes a goal to maintain the baseline rate of all poisoning deaths
(14.9 per 100,000, age-adjusted) and unintentional/undetermined intent poisoning
deaths (11.8 per 100,000, age-adjusted) through 2020.1

28
Injury type
The following sections present information for these indicators:
• Hip fracture, in residents aged 65 years and older
• Traumatic brain injury
29
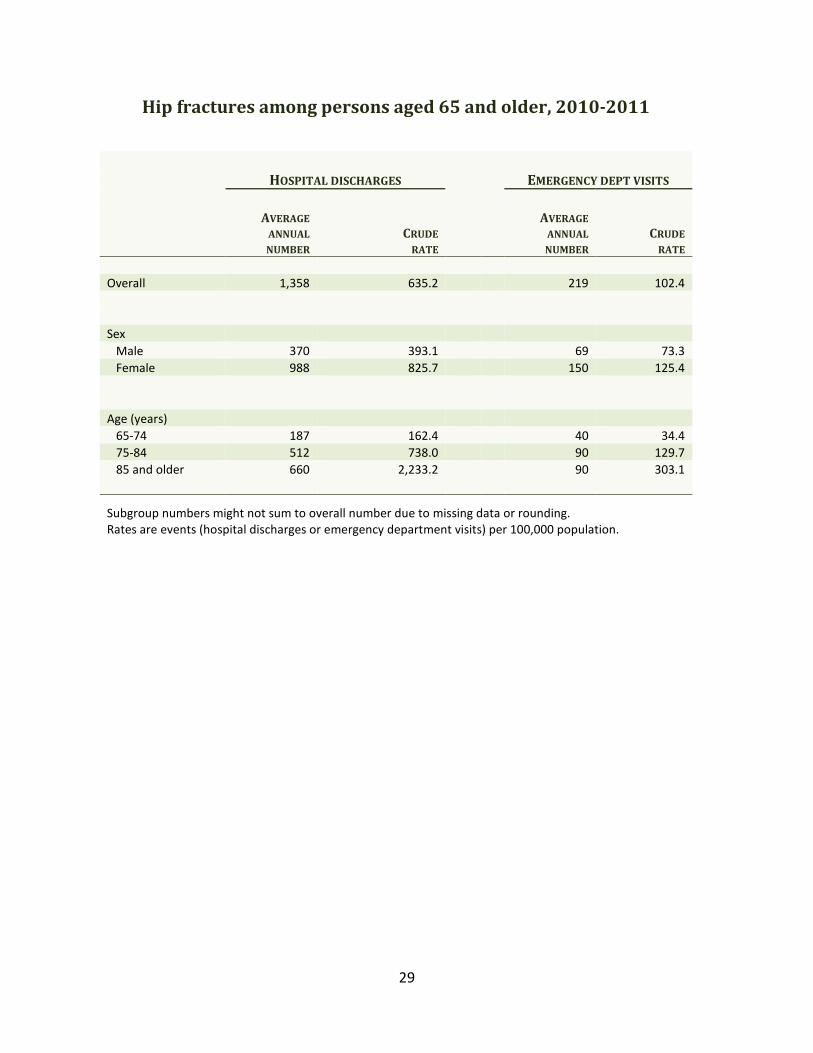
Hip fractures among persons aged 65 and older, 2010-2011
HOSPITAL DISCHARGES EMERGENCY DEPT VISITS
AVERAGE
ANNUAL
NUMBER
CRUDE
RATE
AVERAGE
ANNUAL
NUMBER
CRUDE
RATE
Overall 1,358 635.2 219 102.4
Sex
Male 370 393.1 69 73.3
Female 988 825.7 150 125.4
Age (years)
65-74 187 162.4 40 34.4
75-84 512 738.0 90 129.7
85 and older 660 2,233.2 90 303.1
Subgroup numbers might not sum to overall number due to missing data or rounding.
Rates are events (hospital discharges or emergency department visits) per 100,000 population.
30
Hip fracture data highlights: 2010-2011
• Hip fractures can cause serious health problems and can result in premature death or
reduced quality of life.13
• There were 2,716 hip fracture hospital discharges and 438 hip fracture ED visits that did
not end in hospitalization among Maine residents aged 65 and older in 2010-2011.
Every week, on average, there were 26 hip fracture hospital discharges and four hip
fracture ED visits in this age group.
• Females were at significantly higher risk than males of having a hip fracture hospital
discharge or ED visit. The hospital discharge rate for females was twice that of males.
Seven of every 10 hip fracture discharges (72.8 percent) and ED visits (68.5 percent)
among Mainers aged 65 and older were for women.
• The risk of hip fracture hospital discharge increased significantly with increasing age
among older Mainers. The risk among people aged 85 and older was almost 14 times
greater than the risk among 65-74 year olds. A similar pattern was seen for hip fracture
ED visits, where the risk among Mainers aged 85 and older was almost nine times
greater than among 65-74 year olds.
• Nine of every 10 hip fracture hospital discharges (93.2 percent) and ED visits (88.1
percent) among Mainers aged 65 and older were known to be due to unintentional falls.
(The cause of another 2.7 percent of hip fracture hospital discharges and 8.0 percent of
hip fracture ED visits was not reported, so it is likely that the true percentage that were
due to unintentional falls was more than what is noted here.)
31
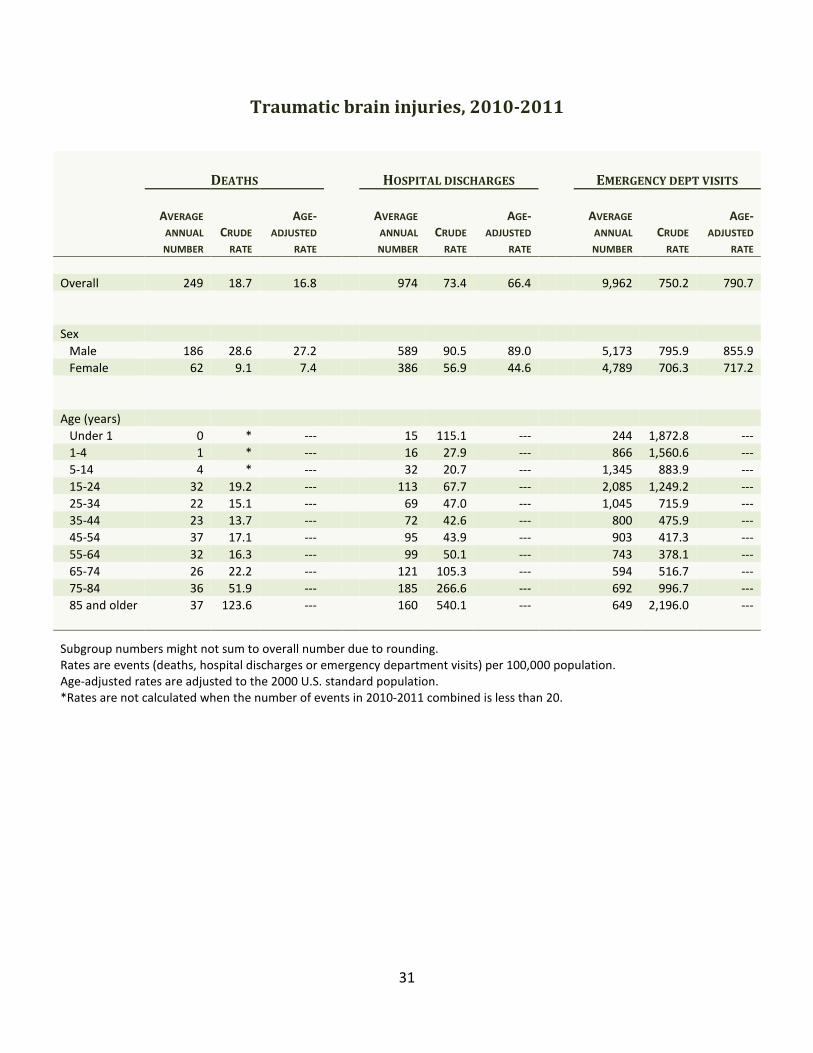
Traumatic brain injuries, 2010-2011
DEATHS HOSPITAL DISCHARGES EMERGENCY DEPT VISITS
AVERAGE
ANNUAL
NUMBER
CRUDE
RATE
AGE-
ADJUSTED
RATE
AVERAGE
ANNUAL
NUMBER
CRUDE
RATE
AGE-
ADJUSTED
RATE
AVERAGE
ANNUAL
NUMBER
CRUDE
RATE
AGE-
ADJUSTED
RATE
Overall 249 18.7 16.8 974 73.4 66.4 9,962 750.2 790.7
Sex
Male 186 28.6 27.2 589 90.5 89.0 5,173 795.9 855.9
Female 62 9.1 7.4 386 56.9 44.6 4,789 706.3 717.2
Age (years)
Under 1 0 * --- 15 115.1 --- 244 1,872.8 ---
1-4 1 * --- 16 27.9 --- 866 1,560.6 ---
5-14 4 * --- 32 20.7 --- 1,345 883.9 ---
15-24 32 19.2 --- 113 67.7 --- 2,085 1,249.2 ---
25-34 22 15.1 --- 69 47.0 --- 1,045 715.9 ---
35-44 23 13.7 --- 72 42.6 --- 800 475.9 ---
45-54 37 17.1 --- 95 43.9 --- 903 417.3 ---
55-64 32 16.3 --- 99 50.1 --- 743 378.1 ---
65-74 26 22.2 --- 121 105.3 --- 594 516.7 ---
75-84 36 51.9 --- 185 266.6 --- 692 996.7 ---
85 and older 37 123.6 --- 160 540.1 --- 649 2,196.0 ---
Subgroup numbers might not sum to overall number due to rounding.
Rates are events (deaths, hospital discharges or emergency department visits) per 100,000 population.
Age-adjusted rates are adjusted to the 2000 U.S. standard population.
*Rates are not calculated when the number of events in 2010-2011 combined is less than 20.
32
Traumatic brain injury data highlights: 2010-2011
• Traumatic brain injury (TBI) occurs when sudden trauma results in injury to the brain.
TBIs can result “when the head suddenly and violently hits an object, or when an object
pierces the skull and enters brain tissue.”14
• There were 497 TBI related deaths, 1,948 TBI related hospital discharges and 19,923 TBI
related ED visits that did not end in hospitalization among Maine residents in 2010-
2011. Every week, on average, there were five deaths, 19 hospital discharges and 192
ED visits that were TBI related.
• Males were at significantly higher risk than females for TBI related deaths, hospital
discharges and ED visits.
• Mainers aged 85 and older were at significantly higher risk than all other age groups for
TBI related deaths, hospital discharges and ED visits.
• Persons 65 years and older represented only 16.1 percent of the Maine population in
2010-2011, but accounted for more than a third of TBI related deaths (39.4 percent),
almost half of TBI related hospital discharges (47.8 percent) and one of every five TBI
related ED visits (19.4 percent).
• Almost two-thirds of the TBI related deaths (61.0 percent) were unintentional, 35.0
percent were suicide and 3.8 percent were homicide. The remaining 0.2 percent were
legal intervention. A different pattern was seen among TBI related hospital discharges,
nearly all of which (91.2 percent) were unintentional; 4.9 percent were assault and 1.4
percent were self-inflicted. The remaining 2.5 percent were of undetermined, other or
unknown intent. Among TBI related ED visits, 87.3 percent were unintentional, 7.4
percent were assault, 0.2 percent were self-inflicted and 0.1 percent were due to legal
intervention. The remaining 4.9 percent were of undetermined, other or unknown
intent.
• The three leading causes of TBI related deaths were suicide (35.0 percent),
unintentional falls (26.4 percent) and unintentional motor vehicle traffic incidents (26.2
percent). The three leading causes of TBI related hospital discharges were unintentional
falls (54.4 percent), unintentional motor vehicle traffic incidents (24.4 percent) and
assault (4.9 percent). Among TBI related ED visits, the most common known causes
were unintentional falls (49.1 percent), struck by or against (19.9 percent; defined as
unintentionally striking against or being struck by an object or person) and unintentional
motor vehicle traffic incidents (10.9 percent).
33
Technical notes
1. Data sources
Deaths. The 2010 and 2011 death certificate statistical datasets were used to describe injury
deaths. We obtained the 2010 file in March 2013 and the 2011 file in May 2013. The datasets
include deaths of all Maine residents, regardless of where the death occurred. They are
multiple cause of death files that include not only the underlying cause of death, but also any
contributing causes. All injury fatality indicators in this report, except traumatic brain injury,
were calculated by searching the underlying cause of death field. The traumatic brain injury
fatality indicator was calculated by searching both underlying and contributing cause fields. We
used the federal Centers for Disease Control and Prevention’s (CDC) guidelines and definitions
of injury indicators15, 16
whenever possible. Where CDC definitions were not available (i.e.,
unintentional injury fatalities), we followed the External Cause of Injury Mortality Matrix for
ICD-10.17
Appendix B lists the specific ICD-10 codes used in defining the injury fatality
indicators.
Hospital Discharges. The 2010 and 2011 inpatient (hospital discharge) datasets from the Maine
Health Data Organization were used to describe injury hospital discharges. We obtained both
files in June 2013. The datasets include discharges from all nonfederal hospitals in Maine.
Following CDC guidelines, we limited our analysis to hospital discharges on which the principal
diagnosis was an injury (i.e., ICD-9-CM code 800-909.2, 909.4, 909.9, 910-994.9, 995.5-995.59
or 995.80-995.85) and excluded discharges from psychiatric and rehabilitation hospitals.
(Discharges from psychiatric and rehabilitation units in general hospitals are included in the
analysis.) All injury hospital discharge indicators in this report, except traumatic brain injury
and near-drowning, were calculated based on the first-listed external cause of injury code (E-
code) that was not E000-E030, E849, E967, E869.4, E870-E879 or E930-E949, or, if there were
no other E-codes on the discharge record, the first-listed E967, E869.4, E870-E879 or E930-E949
code. The E-code selection process followed CDC guidelines. The traumatic brain injury
hospital discharge indicator was coded using nature of disease codes (N-codes). The near-
drowning indicator was coded using a combination of E-codes and N-codes. We used CDC’s
guidelines and definitions of injury indicators15,16
whenever possible. Where CDC definitions
were not available (i.e., unintentional injury hospital discharges), we followed the
Recommended Framework of E-Code Groupings for Presenting Injury Mortality and Morbidity
Data.18
Appendix C lists the specific ICD-9-CM codes used in defining the hospital discharge
injury indicators.
Emergency department visits. The 2010 and 2011 outpatient and inpatient (hospital
discharge) datasets from the Maine Health Data Organization were used to describe injury
emergency department (ED) visits. We obtained the 2010 file in June 2013 and the 2011 file in
October 2013. The outpatient datasets include outpatient encounters (including ED visits) at
nonfederal hospitals in Maine. The inpatient datasets include discharges from all nonfederal
hospitals in the state. Following CDC guidelines, we limited our analysis to ED visits at non-
psychiatric/non-rehabilitation hospitals that did not end with the person being admitted to that
34
hospital (identified by linking the inpatient and outpatient datasets) and that either had an
injury principal diagnosis (i.e., ICD-9-CM code 800-909.2, 909.4, 909.9, 910-994.9, 995.5-995.59
or 995.80-995.85) or an external cause of injury code (E-code) of E800-E869, E880-E929 or
E950-E999. All injury ED indicators in this report, except traumatic brain injury and near-
drowning, were calculated based on the first-listed E-code that was not E000-E030, E849, E967,
E869.4, E870-E879 or E930-E949, or, if there were no other E-codes on the visit record, the
first-listed E967, E869.4, E870-E879 or E930-E949 code. The E-code selection process followed
CDC guidelines. The traumatic brain injury ED indicator was coded using nature of disease
codes (N-codes). The near-drowning indicator was coded using a combination of E-codes and
N-codes. We used CDC’s guidelines and definitions of injury indicators15,16
whenever possible.
Where CDC definitions were not available (i.e., unintentional injury ED visits), we followed the
Recommended Framework of E-Code Groupings for Presenting Injury Mortality and Morbidity
Data.18
Appendix C lists the specific ICD-9-CM codes used in defining the ED injury indicators.
Maine Integrated Youth Health Survey. The 2011 Maine Integrated Youth Health Survey was
used to provide supplemental information for the suicide, assault and unintentional motor
vehicle traffic indicators. This written survey monitors select health conditions and health risk
behaviors among Maine students. The middle school survey is administered to 7th
and 8th
graders. The high school survey is administered to 9th
through 12th
graders.
Behavioral Risk Factor Surveillance System. The Maine 2010 and 2011 Behavioral Risk Factor
Surveillance System surveys were used to provide supplemental information for the
unintentional falls and unintentional motor vehicle traffic indicators. The survey is
administered by phone, and tracks health conditions and risk behaviors among Mainers aged 18
years and older.
2. Average annual counts
Average annual counts were calculated by summing the 2010 and 2011 counts, dividing by 2,
and then rounding to the nearest whole number.
3. Rates
Population data. 2010 and 2011 population estimates used in calculating rates were obtained
from the U.S. Census Bureau.19, 20
Crude rates. Crude rates were calculated by summing the number of events in 2010 and 2011
for a particular indicator and dividing that total by the 2010 plus 2011 population. Rates are
expressed per 100,000 population. Crude rates were calculated for the population as a whole,
by sex and by age.
35
Age-adjusted rates. The direct method (applying age-specific Maine rates to the 2000 U.S.
standard population) was used to calculate age-adjusted rates. Rates are expressed per
100,000 population. Age-adjusted rates were calculated for the population as a whole and by
sex.
Suppression of rates. Rates based on small numbers tend not to be reliable or precise, so
following CDC practice,15,16
rates were not calculated if the number of events was less than 20.
Using rates.4 The choice of a crude rate versus an age-adjusted rate depends on the purpose
for which a rate will be used. Crude rates (or the number of events) should be used to measure
or compare the absolute magnitude of injury indicators. Age-adjusted rates should only be
used for comparison purposes, when you want to control for differences due only to
differences in age composition (e.g., to compare Maine with another state that has a much
younger population or to look at Maine data for two different years and control for the aging of
the population over time). The numeric value of an age-adjusted rate depends on the standard
population used and therefore has no intrinsic meaning. The age-adjusted rates presented in
this report can only be compared with other age-adjusted rates that were adjusted to the same
2000 U.S. standard population.
Comparing rates. Age- or sex-specific comparisons were done by placing 95 percent confidence
intervals (not shown) around the crude rates. If the intervals did not overlap, the rates were
considered to be statistically significantly different.
4. Limitations
This report is subject to several limitations:
• ED visits and hospital discharges of Maine residents that took place in another state or at
a federal hospital in Maine are not included.
• Cause of death was not available for Maine residents who died out of state in 2010-2011,
so the death counts and rates presented in this report might be slightly underestimated.
On average, about 3 percent of deaths of Maine residents each year occur out of state.
• External cause of injury was not available for 7.1 percent of 2010 injury ED visits, 5.2
percent of 2011 injury ED visits, 3.3 percent of 2010 injury hospital discharges and 3.6
percent of 2011 injury hospital discharges. As such, the counts and rates reported here
for particular injury indicators (e.g., unintentional fall, poisoning) should be treated as
minimum estimates. (“Not available” means either there was no E-code on the record or
the only E-code was E000-E030, E849, E967, E869.4, E870-E879 or E930-E949.)
• The deaths and ED visits reported here for a given injury indicator are not mutually
exclusive; individuals who died in the ED are included in both figures. Similarly, the
deaths and hospital discharges reported here for a given injury indicator are not mutually
exclusive; individuals who died while an inpatient in the hospital are included in both
figures.
36
• A given person might appear more than once in the ED or hospital discharge counts and
rates for a given indicator. This can occur if a person was seen in the ED or hospitalized
more than once at the same hospital for the same injury or was transferred from one
hospital to another. Hence, the number of unique individuals who were seen in the ED or
hospitalized for a particular indicator will be less than the number of ED visits or hospital
discharges reported here for that indicator.
• The use of death, hospital discharge and ED data means that this report reflects the
moderate to severe portion of the injury spectrum and, as such, underestimates the
overall burden of injury in Maine. A more complete picture of injury in the state would
require information on individuals with injuries who are treated in non-hospital
outpatient settings (e.g., primary care physician’s offices) or do not seek any treatment.
• Survey data reported here are based on self-report and may be subject to recall errors or
to people giving the response they feel is expected or acceptable, rather than the
response that most accurately reflects their behavior.
5. Comparisons with other reports
Care should be taken when comparing the data presented here with data in other reports.
Comparisons should only be made if the methodologies are similar. For example, the CDC
methodology used in this report limits hospital discharge analyses to discharges from general
hospitals for which the principal diagnosis was an injury. The results obtained using this
method will differ from analyses that include all hospitals or all discharges, regardless of what
the principal diagnosis was.
The indicator definitions used in the Maine annual and biannual injury reports have changed
somewhat over time, in keeping with changes in the CDC guidelines for particular years. It is,
therefore, important, when comparing rates across reports, to also compare the case
definitions used to calculate those rates.
See Appendices B and C for indicator definitions used in this report.
Survey results from the Maine Integrated Youth Health Survey presented in injury reports
should not be compared to data from the Maine Youth Risk Behavior Survey presented in
earlier reports, even when the question wording is similar or identical.
37
References
1. Maine Center for Disease Control and Prevention, Maine Department of Health and
Human Services. Healthy Maine 2020. Augusta, ME.
2. Holder Y, Peden M, Krug E, Lund J, Gururaj G, Kobusingye O, eds. Injury surveillance
guidelines. Geneva: World Health Organization; 2001.
3. National Center for Injury Prevention and Control, Centers for Disease Control and
Prevention. Web-based Injury Statistics Query and Reporting System (WISQARS).
Available at: http://www.cdc.gov/injury/wisqars/. Accessed 2/19/2014.
4. U.S. Department of Health and Human Services. Tracking Healthy People 2010. U.S.
Government Printing Office. Available at:
http://www.healthypeople.gov/Document/html/tracking/THP_PartA.htm#Age
Adjustment. Accessed 7/14/2006.
5. Bureau of Health, Maine Department of Health and Human Services. Healthy Maine
2010: longer and healthier lives (chapter 6: injury). Augusta, ME. Available at:
http://www.maine.gov/dhhs/mecdc/phdata/healthy-maine.htm.
6. Maine Integrated Youth Health Survey (MIYHS): 2011 high school summary report.
Available at:
https://data.mainepublichealth.gov/miyhs/files/Summary%20Reports%20PDF-
State/2011High%20School%20Summary%20Report.pdf. Accessed 3/13/2014.
7. Maine Integrated Youth Health Survey (MIYHS): 2011 middle school summary report.
Available at:
https://data.mainepublichealth.gov/miyhs/files/Summary%20Reports%20PDF-
State/2011Middle%20School%20Summary%20Report.pdf. Accessed 3/13/2014.
8. Working together to end domestic violence homicide in Maine: the 9th report of the
Maine Domestic Abuse Homicide Review Panel – January 2012. Available at:
http://www.maine.gov/ag/dynld/documents/Working_Together_to_End_Domestic_Vio
lence_04-11-12.pdf. Accessed 3/13/2014.
9. 2010 Behavioral Risk Factor Surveillance System, Maine core questions data report.
10. ICD-9-CM for hospitals, volumes 1, 2 & 3. Supplementary classification of external
causes of injury and poisoning: Ingenix, Inc.; 2003.
11. 2011 Behavioral Risk Factor Surveillance System, Maine core questions data report.
12. Centers for Disease Control and Prevention. Behavioral Risk Factor Surveillance System:
prevalence and trends data, Maine - 2010 Injury. Available at
38
http://apps.nccd.cdc.gov/brfss/display.asp?cat=IN&yr=2010&qkey=7315&state=ME.
Accessed 3/14/2014.
13. Centers for Disease Control and Prevention. Hip fractures among older adults. Available
at: http://www.cdc.gov/HomeandRecreationalSafety/Falls/adulthipfx.html. Accessed
10/15/2009.
14. National Institute of Neurological Disorders and Stroke -- National Institutes of Health.
NINDS traumatic brain injury information page (updated 7/8/05). Available at:
http://www.ninds.nih.gov/disorders/tbi/tbi.htm. Accessed 10/4/2005.
15. Thomas KE, Johnson RL. State injury indicators report: instructions for preparing 2010
data. Atlanta (GA): Centers for Disease Control and Prevention, National Center for
Injury Prevention and Control; 2012. Available at:
http://www.cdc.gov/injury/pdfs/2010_State_Injury_Indicator_Instructions-a.pdf.
16. Thomas KE, Johnson RL. State injury indicators report: instructions for Preparing 2011
Data. Atlanta (GA): Centers for Disease Control and Prevention, National Center for
Injury Prevention and Control; 2013. Available at:
http://www.cdc.gov/injury/pdfs/2011_State_Injury_Indicator_Instructions-a.pdf.
17. Centers for Disease Control and Prevention. External cause of injury mortality matrix for
ICD-10 (12/10/2002). Available at:
http://www.cdc.gov/nchs/data/ice/icd10_transcode.pdf. Accessed 8/2/2005.
18. Centers for Disease Control and Prevention. Recommended framework of E-Code
groupings for presenting injury mortality and morbidity data (December 1, 2008).
Available at: http://www.cdc.gov/ncipc/osp/matrix2.htm. Accessed 7/28/2009.
19. U.S. Census Bureau. Intercensal estimates of the resident population by single year of
age and sex for states and the United States: April 1, 2000 to July 1, 2010. Available
from http://www.census.gov/popest/data/intercensal/state/state2010.html. Accessed
7/17/2013.
20. U.S. Census Bureau. State single year of age and sex population estimates: April 1, 2010
to July 1, 2011—RESIDENT available from
http://www.census.gov/popest/data/state/asrh/2011/index.html. Accessed 7/26/2013.
39
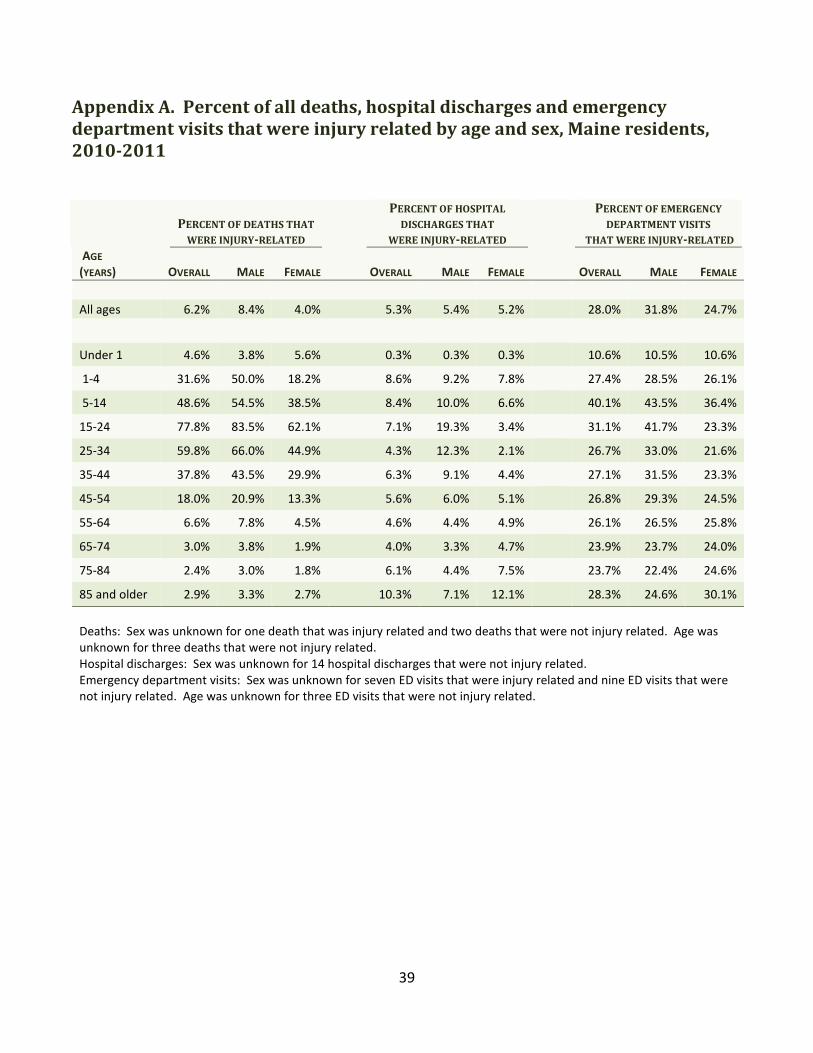
Appendix A. Percent of all deaths, hospital discharges and emergency
department visits that were injury related by age and sex, Maine residents,
2010-2011
PERCENT OF DEATHS THAT
WERE INJURY-RELATED
PERCENT OF HOSPITAL
DISCHARGES THAT
WERE INJURY-RELATED
PERCENT OF EMERGENCY
DEPARTMENT VISITS
THAT WERE INJURY-RELATED
AGE
(YEARS) OVERALL MALE FEMALE OVERALL MALE FEMALE
OVERALL MALE FEMALE
All ages 6.2% 8.4% 4.0% 5.3% 5.4% 5.2% 28.0% 31.8% 24.7%
Under 1 4.6% 3.8% 5.6% 0.3% 0.3% 0.3% 10.6% 10.5% 10.6%
1-4 31.6% 50.0% 18.2% 8.6% 9.2% 7.8% 27.4% 28.5% 26.1%
5-14 48.6% 54.5% 38.5% 8.4% 10.0% 6.6% 40.1% 43.5% 36.4%
15-24 77.8% 83.5% 62.1% 7.1% 19.3% 3.4% 31.1% 41.7% 23.3%
25-34 59.8% 66.0% 44.9% 4.3% 12.3% 2.1% 26.7% 33.0% 21.6%
35-44 37.8% 43.5% 29.9% 6.3% 9.1% 4.4% 27.1% 31.5% 23.3%
45-54 18.0% 20.9% 13.3% 5.6% 6.0% 5.1% 26.8% 29.3% 24.5%
55-64 6.6% 7.8% 4.5% 4.6% 4.4% 4.9% 26.1% 26.5% 25.8%
65-74 3.0% 3.8% 1.9% 4.0% 3.3% 4.7% 23.9% 23.7% 24.0%
75-84 2.4% 3.0% 1.8% 6.1% 4.4% 7.5% 23.7% 22.4% 24.6%
85 and older 2.9% 3.3% 2.7% 10.3% 7.1% 12.1% 28.3% 24.6% 30.1%
Deaths: Sex was unknown for one death that was injury related and two deaths that were not injury related. Age was
unknown for three deaths that were not injury related.
Hospital discharges: Sex was unknown for 14 hospital discharges that were not injury related.
Emergency department visits: Sex was unknown for seven ED visits that were injury related and nine ED visits that were
not injury related. Age was unknown for three ED visits that were not injury related.
40
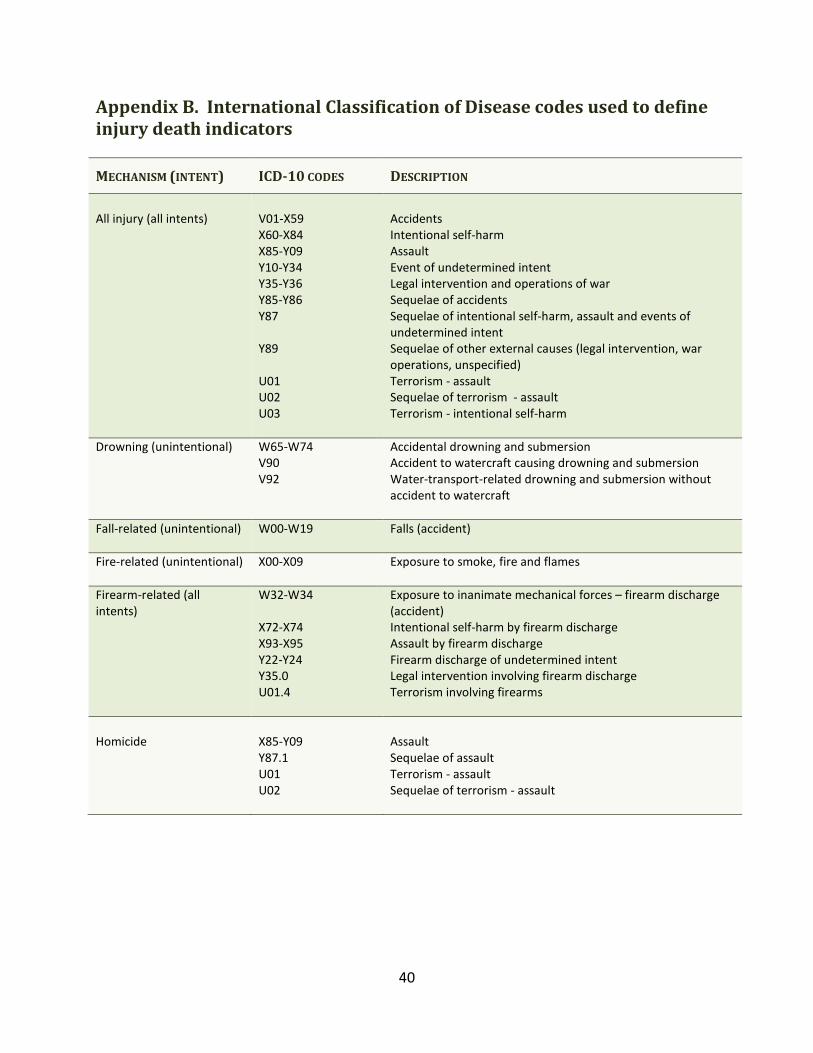
Appendix B. International Classification of Disease codes used to define
injury death indicators
MECHANISM (INTENT) ICD-10 CODES DESCRIPTION
All injury (all intents)
V01-X59
X60-X84
X85-Y09
Y10-Y34
Y35-Y36
Y85-Y86
Y87
Y89
U01
U02
U03
Accidents
Intentional self-harm
Assault
Event of undetermined intent
Legal intervention and operations of war
Sequelae of accidents
Sequelae of intentional self-harm, assault and events of
undetermined intent
Sequelae of other external causes (legal intervention, war
operations, unspecified)
Terrorism - assault
Sequelae of terrorism - assault
Terrorism - intentional self-harm
Drowning (unintentional) W65-W74
V90
V92
Accidental drowning and submersion
Accident to watercraft causing drowning and submersion
Water-transport-related drowning and submersion without
accident to watercraft
Fall-related (unintentional)
W00-W19 Falls (accident)
Fire-related (unintentional)
X00-X09 Exposure to smoke, fire and flames
Firearm-related (all
intents)
W32-W34
X72-X74
X93-X95
Y22-Y24
Y35.0
U01.4
Exposure to inanimate mechanical forces – firearm discharge
(accident)
Intentional self-harm by firearm discharge
Assault by firearm discharge
Firearm discharge of undetermined intent
Legal intervention involving firearm discharge
Terrorism involving firearms
Homicide
X85-Y09
Y87.1
U01
U02
Assault
Sequelae of assault
Terrorism - assault
Sequelae of terrorism - assault
41
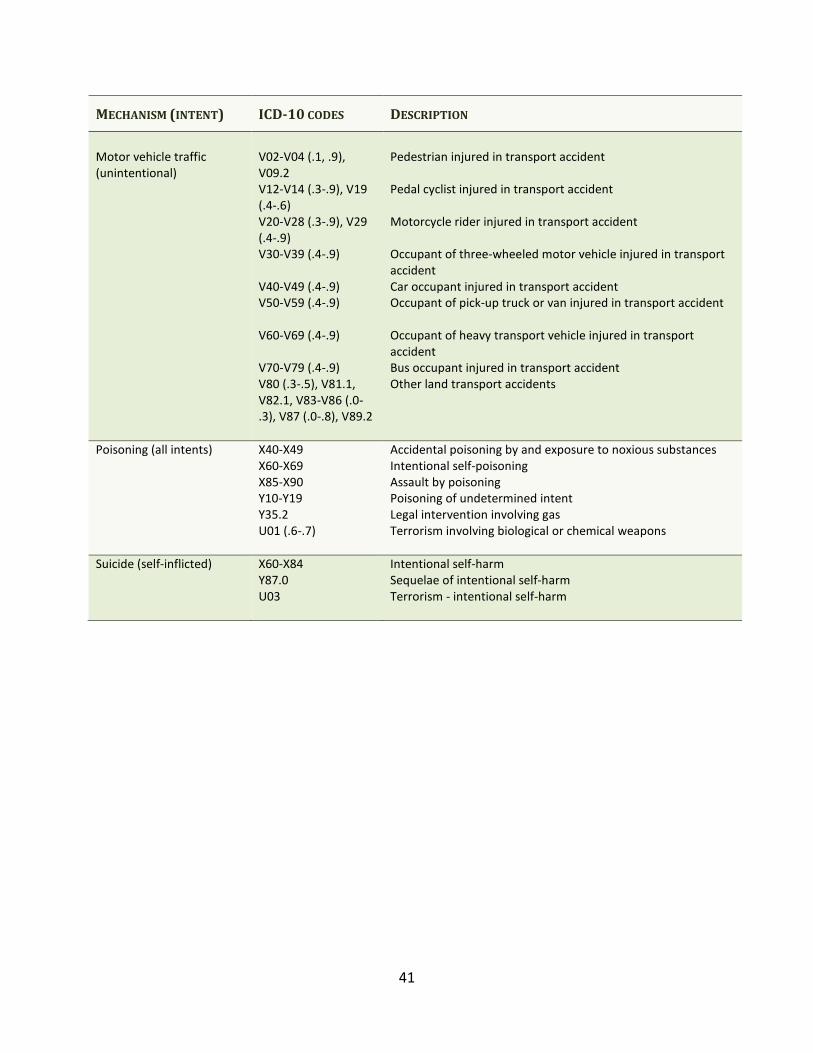
MECHANISM (INTENT) ICD-10 CODES DESCRIPTION
Motor vehicle traffic
(unintentional)
V02-V04 (.1, .9),
V09.2
V12-V14 (.3-.9), V19
(.4-.6)
V20-V28 (.3-.9), V29
(.4-.9)
V30-V39 (.4-.9)
V40-V49 (.4-.9)
V50-V59 (.4-.9)
V60-V69 (.4-.9)
V70-V79 (.4-.9)
V80 (.3-.5), V81.1,
V82.1, V83-V86 (.0-
.3), V87 (.0-.8), V89.2
Pedestrian injured in transport accident
Pedal cyclist injured in transport accident
Motorcycle rider injured in transport accident
Occupant of three-wheeled motor vehicle injured in transport
accident
Car occupant injured in transport accident
Occupant of pick-up truck or van injured in transport accident
Occupant of heavy transport vehicle injured in transport
accident
Bus occupant injured in transport accident
Other land transport accidents
Poisoning (all intents) X40-X49
X60-X69
X85-X90
Y10-Y19
Y35.2
U01 (.6-.7)
Accidental poisoning by and exposure to noxious substances
Intentional self-poisoning
Assault by poisoning
Poisoning of undetermined intent
Legal intervention involving gas
Terrorism involving biological or chemical weapons
Suicide (self-inflicted) X60-X84
Y87.0
U03
Intentional self-harm
Sequelae of intentional self-harm
Terrorism - intentional self-harm
42
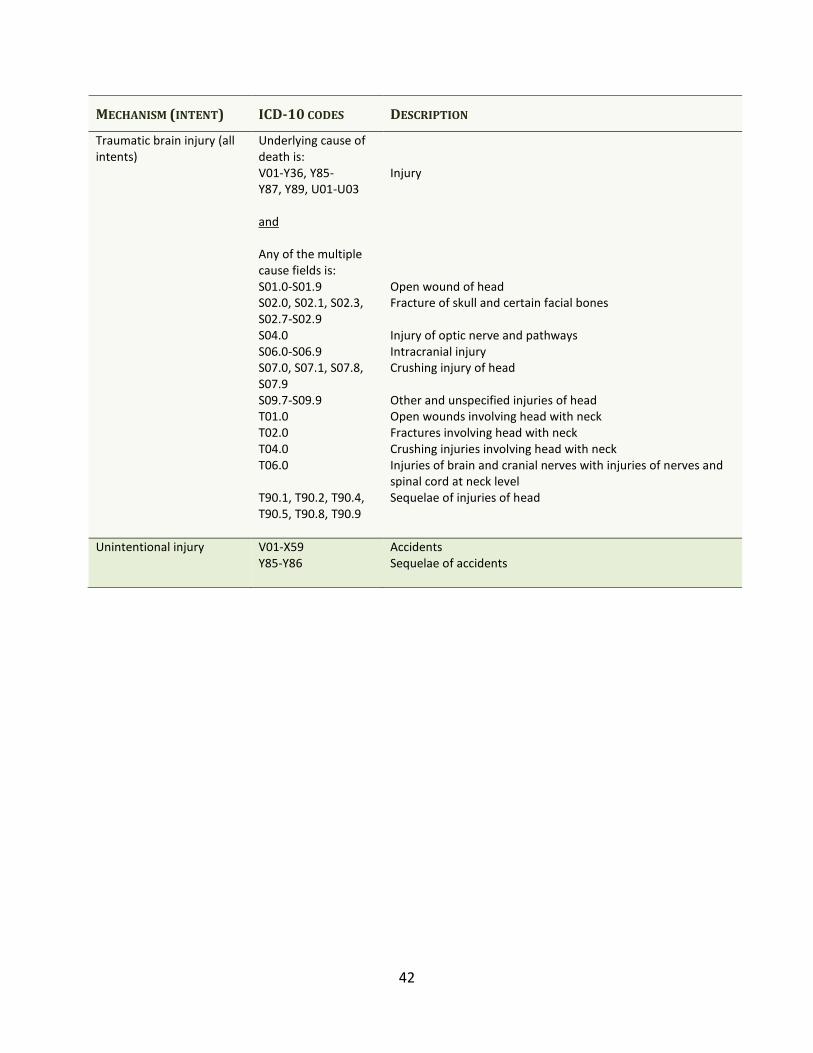
MECHANISM (INTENT) ICD-10 CODES DESCRIPTION
Traumatic brain injury (all
intents)
Underlying cause of
death is:
V01-Y36, Y85-
Y87, Y89, U01-U03
and
Any of the multiple
cause fields is:
S01.0-S01.9
S02.0, S02.1, S02.3,
S02.7-S02.9
S04.0
S06.0-S06.9
S07.0, S07.1, S07.8,
S07.9
S09.7-S09.9
T01.0
T02.0
T04.0
T06.0
T90.1, T90.2, T90.4,
T90.5, T90.8, T90.9
Injury
Open wound of head
Fracture of skull and certain facial bones
Injury of optic nerve and pathways
Intracranial injury
Crushing injury of head
Other and unspecified injuries of head
Open wounds involving head with neck
Fractures involving head with neck
Crushing injuries involving head with neck
Injuries of brain and cranial nerves with injuries of nerves and
spinal cord at neck level
Sequelae of injuries of head
Unintentional injury
V01-X59
Y85-Y86
Accidents
Sequelae of accidents
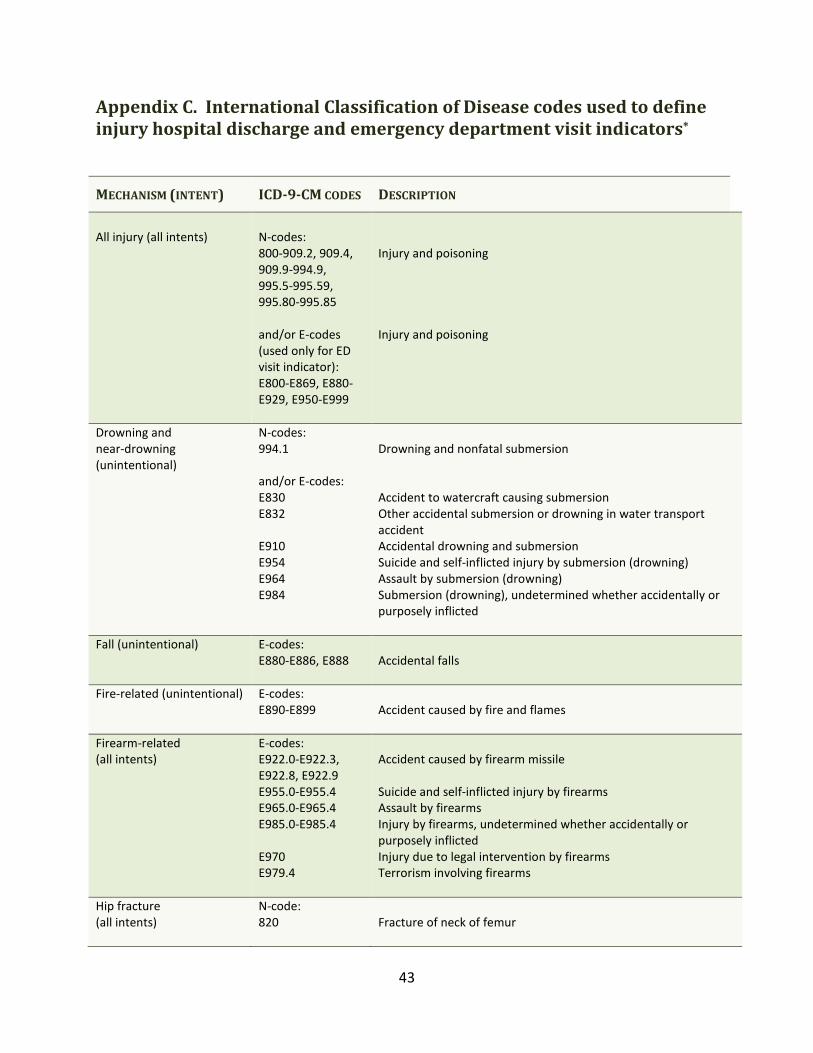
43
Appendix C. International Classification of Disease codes used to define
injury hospital discharge and emergency department visit indicators*
MECHANISM (INTENT) ICD-9-CM CODES DESCRIPTION
All injury (all intents)
N-codes:
800-909.2, 909.4,
909.9-994.9,
995.5-995.59,
995.80-995.85
and/or E-codes
(used only for ED
visit indicator):
E800-E869, E880-
E929, E950-E999
Injury and poisoning
Injury and poisoning
Drowning and
near-drowning
(unintentional)
N-codes:
994.1
and/or E-codes:
E830
E832
E910
E954
E964
E984
Drowning and nonfatal submersion
Accident to watercraft causing submersion
Other accidental submersion or drowning in water transport
accident
Accidental drowning and submersion
Suicide and self-inflicted injury by submersion (drowning)
Assault by submersion (drowning)
Submersion (drowning), undetermined whether accidentally or
purposely inflicted
Fall (unintentional) E-codes:
E880-E886, E888
Accidental falls
Fire-related (unintentional) E-codes:
E890-E899
Accident caused by fire and flames
Firearm-related
(all intents)
E-codes:
E922.0-E922.3,
E922.8, E922.9
E955.0-E955.4
E965.0-E965.4
E985.0-E985.4
E970
E979.4
Accident caused by firearm missile
Suicide and self-inflicted injury by firearms
Assault by firearms
Injury by firearms, undetermined whether accidentally or
purposely inflicted
Injury due to legal intervention by firearms
Terrorism involving firearms
Hip fracture
(all intents)
N-code:
820
Fracture of neck of femur
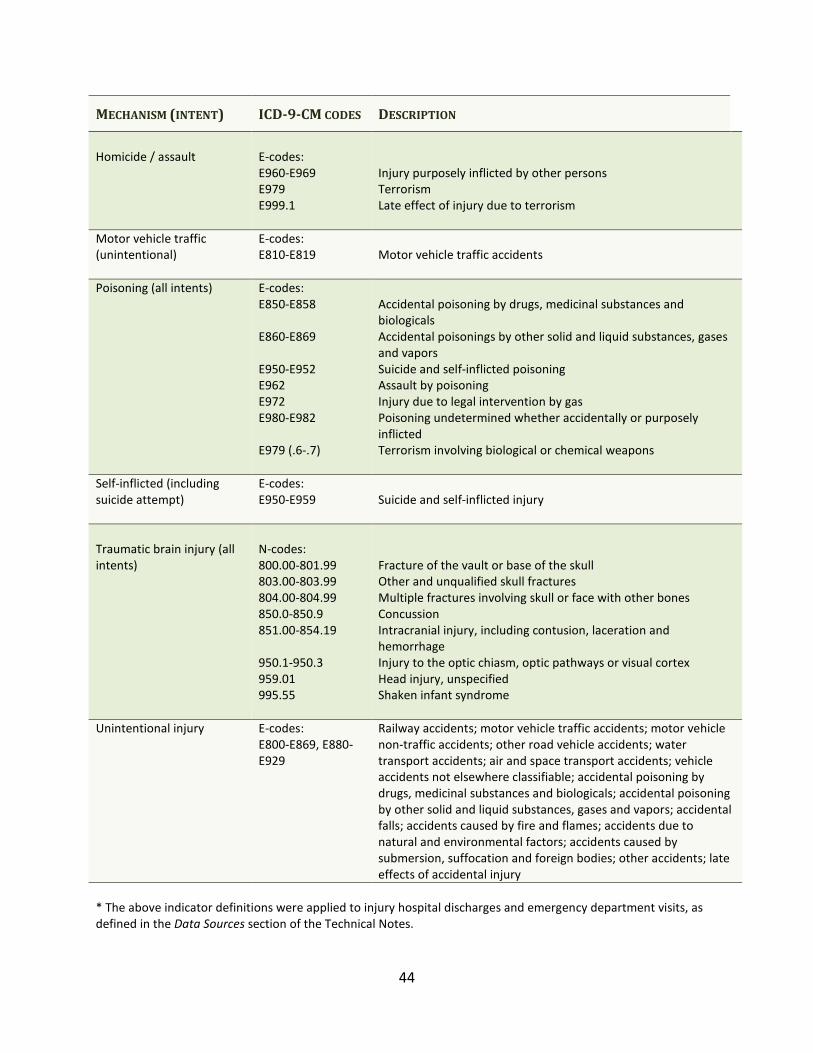
44
MECHANISM (INTENT) ICD-9-CM CODES DESCRIPTION
Homicide / assault
E-codes:
E960-E969
E979
E999.1
Injury purposely inflicted by other persons
Terrorism
Late effect of injury due to terrorism
Motor vehicle traffic
(unintentional)
E-codes:
E810-E819
Motor vehicle traffic accidents
Poisoning (all intents) E-codes:
E850-E858
E860-E869
E950-E952
E962
E972
E980-E982
E979 (.6-.7)
Accidental poisoning by drugs, medicinal substances and
biologicals
Accidental poisonings by other solid and liquid substances, gases
and vapors
Suicide and self-inflicted poisoning
Assault by poisoning
Injury due to legal intervention by gas
Poisoning undetermined whether accidentally or purposely
inflicted
Terrorism involving biological or chemical weapons
Self-inflicted (including
suicide attempt)
E-codes:
E950-E959
Suicide and self-inflicted injury
Traumatic brain injury (all
intents)
N-codes:
800.00-801.99
803.00-803.99
804.00-804.99
850.0-850.9
851.00-854.19
950.1-950.3
959.01
995.55
Fracture of the vault or base of the skull
Other and unqualified skull fractures
Multiple fractures involving skull or face with other bones
Concussion
Intracranial injury, including contusion, laceration and
hemorrhage
Injury to the optic chiasm, optic pathways or visual cortex
Head injury, unspecified
Shaken infant syndrome
Unintentional injury E-codes:
E800-E869, E880-
E929
Railway accidents; motor vehicle traffic accidents; motor vehicle
non-traffic accidents; other road vehicle accidents; water
transport accidents; air and space transport accidents; vehicle
accidents not elsewhere classifiable; accidental poisoning by
drugs, medicinal substances and biologicals; accidental poisoning
by other solid and liquid substances, gases and vapors; accidental
falls; accidents caused by fire and flames; accidents due to
natural and environmental factors; accidents caused by
submersion, suffocation and foreign bodies; other accidents; late
effects of accidental injury
* The above indicator definitions were applied to injury hospital discharges and emergency department visits, as
defined in the Data Sources section of the Technical Notes.

The Department of Health and Human Services (DHHS) does not discriminate on the basis of disability, race, color, creed, gender,
sexual orientation, age, or national origin, in admission to, access to, or operations of its programs, services, or activities, or its hiring or
employment practices. This notice is provided as required by Title II of the Americans with Disabilities Act of 1990 and in accordance
with the Civil Rights Act of 1964 as amended, Section 504 of the Rehabilitation Act of 1973, as amended, the Age Discrimination Act of
1975, Title IX of the Education Amendments of 1972 and the Maine Human Rights Act and Executive Order Regarding State of Maine
Contracts for Services. Questions, concerns, complaints or requests for additional information regarding the ADA may be forwarded to
DHHS’ ADA Compliance/EEO Coordinators, 11 State House Station – 221 State Street, Augusta, Maine 04333, 207-287-4289 (V), 207-
287-3488 (V), TTY users call Maine relay 711. Individuals who need auxiliary aids for effective communication in program and services
of DHHS are invited to make their needs and preferences known to the ADA Compliance/EEO Coordinators. This notice is available in
alternate formats, upon request.