Embed Size (px)
Citation preview

2010–2011 Minerals Yearbook
U.S. Department of the Interior U.S. Geological Survey
OKLAHOMA [ADVANCE RELEASE]
June 2015

^
!
Cem
Cem
Cem
Per
lim
e
SG
SG
SG
SG
SG
SG
SG
SG
SGSG
SG
SG
SG
SG
SG
SG
SG
SG
SG
SG
SG SG
SG
SG
SG
SG
SG
SG
SG
he
SG
SG
SG
Cla
y
SG SG
SG
SGSG
Con
cent
ratio
n of
min
eral
op
erat
ions
SG
SG
SG
SG
Tuls
a
LE F
LORE
LIN
COLN
LOGA
N LOVE
MAJ
OR
MAR
SHAL
L
MAY
ES
MCC
LAIN
MCC
URTA
IN
MUR
RAY
MUS
KOGE
E
NOB
LE
NOW
ATA
OKFU
SKEE
OKLA
HOM
AOK
MUL
GEE
OSAG
E
OTTA
WA
PAW
NEE
PAYN
E
PITT
SBUR
G
PON
TOTO
C
POTT
AWAT
OMIE
PUSH
MAT
AHA
ROGE
RM
ILLS
ROGE
RS
SEM
INOL
E
SEQU
OYAH
STEP
HEN
S
TEXA
S
TILL
MAN
TULS
AW
AGON
ER
WAS
HIN
GTON
WAS
HITAW
OODS
WOO
DWAR
D
MCI
NTO
SH
ADAI
R
ALFA
LFA
ATOK
A
BEAV
ER
BECK
HAM
BLAI
NE
BRYA
N
CADD
OCAN
ADIA
N
CART
ER
CHER
OKEE
CHOC
TAW
CIM
ARRO
N
CLEV
ELAN
D
COAL
COM
ANCH
E
COTT
ON
CRAI
G
CREE
K
CUST
ER
DELA
WAR
E
DEW
EY
ELLI
S
GARF
IELD
GARV
IN
GRAD
Y
GRAN
T
GREE
R
HARM
ONHARP
ER
HASK
ELL
HUGH
ES
JACK
SON
JEFF
ERSO
N
JOHN
STON
KAY
KIN
GFIS
HER
KIOW
ALA
TIM
ER
Cla
yC
lay
Cla
y
Cla
y
Okla
hom
a Ci
ty
CS
CS
CS
CS
CS
CS
CS
CS
CS
CS
CS
CS
CS
CS
CS
CS
CS
CS
CS
CS
CS
CS
CS
CS
CS
CS
CS
CS
CS
CS
CS
CS
CS
CS
CS
CS
Cla
y
Gyp
Gyp G
yp
Gyp
IS
IS
IS
IS
II
I
Salt
Tri
D-G
r
D-S
d
Fel
Cla
y
^ !
1
D-S
d
D-G
r
D-l
D-l
Gyp
-s
Sour
ce: O
klah
oma
Geo
logi
cal S
urve
y/U
.S. G
eolo
gica
l Sur
vey
(201
0–11
).OK
LAH
OM
A
Albe
rs e
qual
are
a pr
ojec
tion
050
100
Kilo
met
ers
Coun
ty b
ound
ary
Capi
tal
City
Crus
hed
ston
e/sa
nd a
nd
grav
el d
istri
ct b
ound
ary
Cem
Cem
ent p
lant
Cla
yC
omm
on c
lay
CS
Cru
shed
ston
e
D-G
rD
imen
sion
gra
nite
D-S
dD
imen
sion
sand
ston
eFe
lFe
ldsp
ar
Gyp
-sSy
nthe
tic g
ypsu
mh
eh
eliu
mI
Iodi
neIS
Indu
stria
l san
d
Per
Perli
te p
lant
Salt
Salt
SGC
onst
ruct
ion
sand
and
gra
vel
Tri
Trip
oli
MIN
ERAL
SYM
BOLS
(Prin
cipa
l pro
duci
ng a
reas
)
LEGE
ND
1
2
3
45
lim
e
lim
e pl
ant
D-l
Dim
ensi
on li
mes
tone
Gyp
Gyp
sum

OklahOma—2010–2011 [aDVaNCE RElEaSE] 38.1
The Mineral indusTry of oklahoMaThis chapter has been prepared under a Memorandum of Understanding between the U.S. Geological Survey and the
Oklahoma Geological Survey for collecting information on all nonfuel minerals.
In 2011, Oklahoma’s nonfuel mineral production1 was valued at $608 million, based upon annual U.S. Geological Survey (USGS) data. This was an $83 million (12%) decrease from the State’s total nonfuel mineral value of $691 million in 2010, which followed a $31 million (5%) increase from 2009. The State decreased in rank to 32d in 2011 from 30th in 2010 and from 28th in 2009 among the 50 States in total nonfuel mineral production value, accounting for just over 0.8% of the U.S. total value of $74.7 billion in 2011. On a per capita basis, the State ranked 23d with a value of $160; the national average was $240.
In 2011, crushed stone continued to be Oklahoma’s leading nonfuel mineral commodity, based upon production value. although the production value decreased by $15.3 million (5%), crushed stone still accounted for 50% of the State’s total nonfuel mineral production value, a slightly higher percentage than in previous years. Other leading mineral commodities in the State included portland cement, industrial sand and gravel, construction sand and gravel, and crude iodine (in descending order of production value). In 2011, industrial sand and gravel had the largest increase in production value, up by $4.8 million (7%), despite a decrease in production of 281,000 metric tons (t) (14%). The production value of dimension stone increased by $3.8 million (150%), with production increasing by 7,000 t (25%). The production value of crude gypsum increased more than 15% as production quantity increased by 5% (actual data withheld—company proprietary data). Other mineral commodities that increased in production value and quantity were construction sand and gravel and clays, with the remainder decreasing in production value.
In 2011, the largest decrease in publishable production value took place in crushed stone, down by $15.3 million (5%). Of the commodities having production data that could not be disclosed in order to avoid revealing company proprietary data, portland cement and iodine decreased in value the most significantly, each decreasing by more than 25%. Feldspar and masonry cement production values decreased by 19% and 16%, respectively, with decreases of less than 5% for salt and lime (values withheld—company proprietary data). No Grade-a helium or tripoli production was reported in Oklahoma in 2011; helium had been produced in 2010 and tripoli was last produced in 2009.
1The terms “nonfuel mineral production” and related “values” encompass variations in meaning, depending upon the mineral products. Production may be measured by mine shipments, mineral commodity sales, or marketable production (including consumption by producers) as is applicable to the individual mineral commodity.
all USGS mineral production data published in this chapter are those available as of May 2013. Data in this report are rounded to three significant digits and percentages are calculated from unrounded data. all USGS mineral Industry Surveys and USGS minerals Yearbook chapters—mineral commodity, State, and country—can be retrieved over the Internet at http://minerals.usgs.gov/minerals.
In 2010, crushed stone had the largest increase in production value among mineral commodities, by $25.3 million (9%), to $321 million and accounted for about half of the State’s total nonfuel mineral production value. Industrial sand and gravel had the second largest increase, by $17.8 million (38%), and had a 524,000 t (34%) increase in production quantity. Grade-a helium increased in production value by more than 10% (production value data withheld—company proprietary data). The only other commodities to increase in production value were salt, by 11%; iodine, by 3%; and masonry cement, by less than 2%.
In 2010, the largest decrease in production value took place in construction sand and gravel, down by $7 million (10%), accounting for 23% of the total decrease in the State’s total nonfuel mineral production value. Dimension stone decreased by $1.8 million (42%). among commodities with production data that were concealed to protect proprietary data, significant decreases occurred in the value of masonry cement, by 42%; feldspar, by 24%; gypsum, by 13%; and portland cement, by 4%.
In 2010 and 2011, Oklahoma remained the primary domestic producer of iodine. The State continued to be the Nation’s leading producer of crude gypsum among 19 and 16 producing States in 2010 and 2011, respectively. The State rose from seventh in 2010 to sixth in 2011 in the production of common clays among 40 and 41 common-clay-producing States, respectively. In 2011, Oklahoma rose to 12th from 13th in the production of crushed stone. The State remained ranked fourth among six Grade-a helium-producing States in 2010. Grade-a helium was not produced in the State in 2011. Oklahoma continued to rank 11th among 26 masonry-cement-producing States, and 13th among 16 salt-producing States. The State declined in rank in the production of industrial sand and gravel, from fourth in 2009 to fifth in 2010 and to eighth in 2011.
The narrative information that follows was provided by the Oklahoma Geological Survey2 (OGS). Production and other data in the text that follow are those reported by the OGS based upon that agency’s own surveys and estimates, and may differ from USGS data.
Overview
The Oklahoma Department of mines (ODOm) recorded nonfuel mineral production from 475 mines in the State during 2010, from a total of 502 mine operators and 761 permitted mining sites on file. Most of the producing mines were open
2Stanley T. krukowski, Industrial minerals Geologist IV and Chief, Industrial minerals Unit, Geologic Resources Section of the Oklahoma Geological Survey, authored the text of the State mineral industry information provided by that agency.

38.2 [aDVaNCE RElEaSE] U.S. GEOlOGICal SURVEY mINERalS YEaRBOOk—2010–2011
pit mines. Exceptions were brine wells from which iodine and salt were produced, natural gas wells from which helium was produced, and one underground mine from which limestone was produced. Out of 77 counties in Oklahoma, 70 had existing mining permits in 2010. The downturn in home construction resulted in decreased demand and production of construction materials, including crushed stone, construction sand and gravel, masonry and portland cement, common clay for brick manufacture, and gypsum used in portland cement and wallboard production.
The Oklahoma miner Training Institute (OmTI) (operated under the direction of the Oklahoma mining Commission) provided free mine safety and health classes both at mine sites throughout the State and at Eastern Oklahoma State College in Wilburton, latimer County, for all mining companies that held active mining permits in Oklahoma. In 2010, based on preliminary data, the OmTI provided mine safety and health instruction through 267 classes, totaling more than 1,760 classroom hours of instruction for 95 coal miners and almost 4,300 metal and nonmetal miners.
Commodities Review
Industrial Minerals
Sand and Gravel, Construction, and Stone, Crushed.—In October, 2010, Dolese Bros. Co. (Oklahoma City, Ok) expanded its construction materials business into Tulsa and northeast Oklahoma through its acquisition of a&m Concrete, Inc. Dolese was among Oklahoma’s largest construction materials companies. With this acquisition, Dolese expanded to 40 ready-mix concrete plants in Oklahoma and louisiana, with 300 concrete mixer trucks. In 2010, Dolese operated 15 construction sand and gravel and crushed stone facilities (mecoy, 2010).
In December, 2010, building material company Summit materials, llC (Denver, CO) announced that it had concluded the acquisition of Rk hall Construction ltd. (Paris, TX), Buster Crushed Stone, llC, and other associated companies
(Blackstone Group L.P., The, 2010). R.k. hall had four operations in southeast Oklahoma in 2010 and the company had focused on aggregates, asphalt production, paving, and construction.
Government Actions and Legislation
In June 2010, the Governor of Oklahoma signed into law house Bill 1281, which raised the current noncoal production fees to $0.009 per metric ton ($0.01 per short ton) from $0.007 per metric ton ($0.0075 per short ton) and reduced the number of times the ODOm is required to inspect certain mines, from at least once a month to four to six times annually. The rate change for noncoal mineral production was permanent and became effective for every quarter thereafter. The last prior fee increase took place in July 1986 (marks, 2010).
The U.S. Office of Surface Mining Reclamation and Enforcement awarded the mid-Continent Regional award to the Oklahoma Conservation Commission’s abandoned mine land Program for the 61st Street North S.W. aml Reclamation Project in Wagoner County. Wildlife habitat improvement at the site projects included the planting of 2,000 trees and the addition of 1.6 hectares (ha) of wetlands to the 2.4 ha that previously existed (Renner and Brown, 2010).
References Cited
Blackstone Group l.P., The, 2010, Summit materials expands platform with strategic acquisitions: New York, NY, The Blackstone Group l.P., December 1. (accessed November 7, 2013, at http://www.blackstone.com/news-views/press-releases/details/summit-materials-expands-platform-with-strategic-acquisitions.)
marks, Dawn, 2010, 2010 session in review: Oklahoma house of Representatives, second session, 52nd Oklahoma legislature, p. 85. (accessed November 14, 2014, at http://www.okhouse.gov/Documents/2010SessionInReview.pdf.)
mecoy, Don, 2010, Dolese acquisition opens Tulsa market: The Oklahoman, October 27. (accessed November 7, 2013, at http://newsok.com/dolese-acquisition-opens-tulsa-market/article/3508487?custom_click=pod_headline_local-financial-news.)
Renner, Steve, and Brown, Kirstin, 2010, Southwest AML Partnership meeting: National association of abandoned mine land Programs Newsletter, v. 32, no. 2, p. 3. (accessed September 26, 2014, at http://naamlp.net/Newsletter/Fall_2010.pdf.)

OklahOma—2010–2011 [aDVaNCE RElEaSE] 38.3
2010
Qua
ntity
Val
ueQ
uant
ityV
alue
Qua
ntity
Val
ueC
lays
, com
mon
572
2,80
055
42,
600
570
2,72
0G
emst
ones
, nat
ural
Na
4N
a4
Na
4G
ypsu
m, c
rude
WW
WW
WW
Sand
and
gra
vel:
Con
stru
ctio
n12
,100
r71
,700
r10
,600
64,6
0010
,700
65,9
00In
dust
rial
1,53
0r
47,0
00r
2,06
064
,800
1,78
069
,600
Ston
e:C
rush
ed36
,100
r29
6,00
0r
39,2
0032
1,00
039
,100
306,
000
Dim
ensi
on35
4,33
028
2,52
035
6,31
0C
ombi
ned
valu
es o
f cem
ent,
feld
spar
, gyp
sum
(cru
de),
heliu
m [G
rade
-a (2
009–
10)]
, iod
ine
(cru
de),
lime,
salt,
tripo
li (2
009)
, and
val
ues i
ndic
ated
by
sym
bol W
XX
239,
000
rX
X23
6,00
0X
X15
8,00
0To
tal
XX
660,
000
rX
X69
1,00
0X
X60
8,00
0
TaB
lE 1
NO
NFU
El R
aW
mIN
ERa
l PR
OD
UC
TIO
N IN
Ok
lah
Om
a1,
2
(Tho
usan
d m
etric
tons
and
thou
sand
dol
lars
unl
ess o
ther
wis
e sp
ecifi
ed)
1 Prod
uctio
n as
mea
sure
d by
min
e sh
ipm
ents
, sal
es, o
r mar
keta
ble
prod
uctio
n (in
clud
ing
cons
umpt
ion
by p
rodu
cers
).2 D
ata
are
roun
ded
to n
o m
ore
than
thre
e si
gnifi
cant
dig
its; m
ay n
ot a
dd to
tota
ls sh
own.
2009
r Rev
ised
. Na
Not
ava
ilabl
e. W
With
held
to a
void
dis
clos
ing
com
pany
pro
prie
tary
dat
a. W
ithhe
ld v
alue
s inc
lude
d in
“C
ombi
ned
valu
es”
data
. XX
Not
app
licab
le
2011
min
eral
Qua
ntity
Qua
ntity
Qua
ntity
Num
ber
(thou
sand
Val
ueU
nit
Num
ber
(thou
sand
Val
ueU
nit
Num
ber
(thou
sand
Val
ueU
nit
Type
of q
uarri
esm
etric
tons
)(th
ousa
nds)
valu
eof
qua
rries
met
ric to
ns)
(thou
sand
s)va
lue
of q
uarri
esm
etric
tons
)(th
ousa
nds)
valu
eli
mes
tone
251
30,9
00r
$258
,000
r$8
.33
4834
,000
$277
,000
$8.1
746
33,7
00$2
62,0
00$7
.77
Dol
omite
----
----
12
167.
981
18
8.39
Gra
nite
42,
810
24,4
008.
704
2,58
021
,900
8.47
42,
550
21,9
008.
59Sa
ndst
one
and
quar
tzite
38
r54
3r
4,87
0r
8.97
91,
040
8,87
08.
5613
970
8,06
08.
30m
isce
llane
ous s
tone
12r
1,84
014
,200
7.72
141,
620
12,8
007.
9215
1,82
013
,700
7.52
Tota
l or a
vera
geX
X36
,100
r29
6,00
0r
8.34
XX
39,2
0032
1,00
08.
19X
X39
,100
306,
000
7.82
3 Incl
udes
sand
ston
e-qu
artz
ite re
porte
d w
ith n
o di
stin
ctio
n be
twee
n th
e tw
o ki
nds o
f sto
ne.
2 Incl
udes
lim
esto
ne-d
olom
ite re
porte
d w
ith n
o di
stin
ctio
n be
twee
n th
e tw
o ki
nds o
f sto
ne.
2011
r Rev
ised
. XX
Not
app
licab
le.
1 Dat
a ar
e ro
unde
d to
no
mor
e th
an th
ree
sign
ifica
nt d
igits
, exc
ept u
nit v
alue
; may
not
add
to to
tals
show
n.
TaB
lE 2
Ok
lah
Om
a: C
RU
ShED
STO
NE
SOlD
OR
USE
D IN
Th
E U
NIT
ED S
TaTE
S, B
Y T
YPE
1
2010
2009

38.4 [aDVaNCE RElEaSE] U.S. GEOlOGICal SURVEY mINERalS YEaRBOOk—2010–2011
Use Quantity ValueConstruction:
Coarse aggregate (+1½ inch):Riprap and jetty stone 157 2,170Filter stone 159 1,660Other coarse aggregate 184 1,420
Coarse aggregate, graded:Concrete aggregate, coarse 377 4,320Bituminous aggregate, coarse 333 2,960Bituminous surface-treatment aggregate W WRailroad ballast W WOther graded coarse aggregate 3,490 27,700
Fine aggregate (-⅜ inch):Stone sand, bituminous mix or seal W WScreening, undesignated 180 1,180Other fine aggregate 1 9
Coarse and fine aggregates:Graded road base or subbase 1,080 12,300Unpaved road surface 188 1,330Terrazzo and exposed aggregate W WCrusher run or fill or waste 674 6,560Other coarse and fine aggregates W W
agricultural:agricultural, limestone 105 447Poultry grit and mineral food W W
Chemical and metallurgical:Cement manufacture W Wlime manufacture W WChemical Stone W W
Special:mining dusting or acid water treatment W W
asphalt fillers or extenders W WOther miscellaneous uses and specified uses not listed W W
Unspecified:2
Reported 23,300 214,000Estimated 6,330 53,400Total 39,200 321,000
W Withheld to avoid disclosing company proprietary data; included in “Total.”1Data are rounded to no more than three significant digits; may not add to totals shown.2Reported and estimated production without a breakdown by end use.
TaBlE 3OklahOma: CRUShED STONE SOlD OR USED BY PRODUCERS
IN 2010, BY USE1
(Thousand metric tons and thousand dollars)

OklahOma—2010–2011 [aDVaNCE RElEaSE] 38.5
Use Quantity ValueConstruction:
Coarse aggregate (+1½ inch):Riprap and jetty stone 296 4,630Filter stone 174 1,340Unspecified coarse aggregate 547 4,480
Coarse aggregate, graded:Concrete aggregate, coarse W WBituminous aggregate, coarse W WBituminous surface-treatment aggregate W WRailroad ballast 2 20Unspecified graded coarse aggregate 7,040 56,300
Fine aggregate (-⅜ inch):Stone sand, concrete W WStone sand, bituminous mix or seal 4 33Screening, undesignated 1,180 6,280Unspecified fine aggregate 624 5,290
Coarse and fine aggregates:Graded road base or subbase 1,080 8,600Unpaved road surface 89 791Terrazzo and exposed aggregate 3 296Crusher run or fill or waste 3,590 21,700Unspecified coarse and fine aggregates 831 5,440Unspecified and other construction materials W W
agricultural:agricultural, limestone 211 1,640Poultry grit and mineral food W W
Chemical and metallurgical:lime manufacture W WFlux stone 233 1,990
Special:mining dusting or acid water treatment W Wasphalt fillers or extenders W W
Unspecified:2
Reported 13,800 113,000Estimated 8,640 67,800Total 39,100 306,000
W Withheld to avoid disclosing company proprietary data; included in “Total.” 1Data are rounded to no more than three significant digits.2Reported and estimated production without a breakdown by end use.
TaBlE 4OklahOma: CRUShED STONE SOlD OR USED BY PRODUCERS
IN 2011, BY USE1
(Thousand metric tons and thousand dollars)

38.6 [aDVaNCE RElEaSE] U.S. GEOlOGICal SURVEY mINERalS YEaRBOOk—2010–2011
Use Quantity Value Quantity Value Quantity ValueConstruction:
Coarse aggregate (+1½ inch)2 -- -- W W 102 1,030Coarse aggregate, graded3 -- -- W W W WFine aggregate (-⅜ inch)4 -- -- 15 119 14 93Coarse and fine aggregates5 -- -- 619 6,210 W WOther construction materials -- -- -- -- -- --
agricultural6 -- -- 17 71 W WChemical and metallurgical7 -- -- -- -- W WSpecial8 -- -- -- -- W WOther miscellaneous uses and specified uses not listed9 -- -- 3 5 -- --Unspecified:10
Reported 65 295 5,970 56,800 816 7,570Estimated -- -- 2,040 17,500 1,350 10,900Total11 65 295 8,810 82,700 3,350 26,400
Use Quantity Value Quantity ValueConstruction:
Coarse aggregate (+1½ inch)2 W W 191 1,520Coarse aggregate, graded3 W W 133 1,170Fine aggregate (-⅜ inch)4 W W 62 384Coarse and fine aggregates5 W W 638 6,000Other construction materials -- -- -- --
agricultural6 -- -- W WChemical and metallurgical7 W W -- --Special8 -- -- -- --Other miscellaneous uses and specified uses not listed9 -- -- W WUnspecified:10
Reported 11,800 107,000 4,740 42,300Estimated 1,310 11,200 1,640 13,800Total11 19,300 168,000 7,480 65,700
TaBlE 5OklahOma: CRUShED STONE SOlD OR USED BY PRODUCERS IN 2010, BY USE aND DISTRICT1
(Thousand metric tons and thousand dollars)
6Includes agricultural limestone, poultry grit and mineral food, and other agricultural uses.7Includes cement manufacture, lime manufacture, dead-burned dolomite manufacture, flux stone, chemical stone, glass manufacture, and sulfur oxide removal.
1Data are rounded to no more than three significant digits; may not add to totals shown.
8Includes mine dusting or acid water treatment, whiting or whitening substance, and other fillers or extenders.9Includes drain fields, waste material, lightweight aggregate (slate), pipe bedding, refractory stone (including ganister), and other miscellaneous uses.10Reported and estimated production without a breakdown by end use.11District totals may not add up to the published State total, owing to revisions made after the production of the table and (or) proprietary data being withheld.
W Withheld to avoid disclosing company proprietary data; included in “Total.” -- Zero.
District 1 District 2 District 3
District 4
5Includes graded road base or subbase, unpaved road surface, terrazzo and exposed aggregate, crusher run, roofing granules, and other coarse and fine aggregates.
District 5
2Includes macadam, riprap and jetty stone, filter stone, and other coarse aggregates.3Includes concrete aggregate (coarse), bituminous aggregate (coarse), bituminous surface-treatment aggregate, railroad ballast, and other graded coarse aggregates.4Includes stone sand (concrete), stone sand (bituminous mix or seal), screening (undesignated), and other fine aggregates.
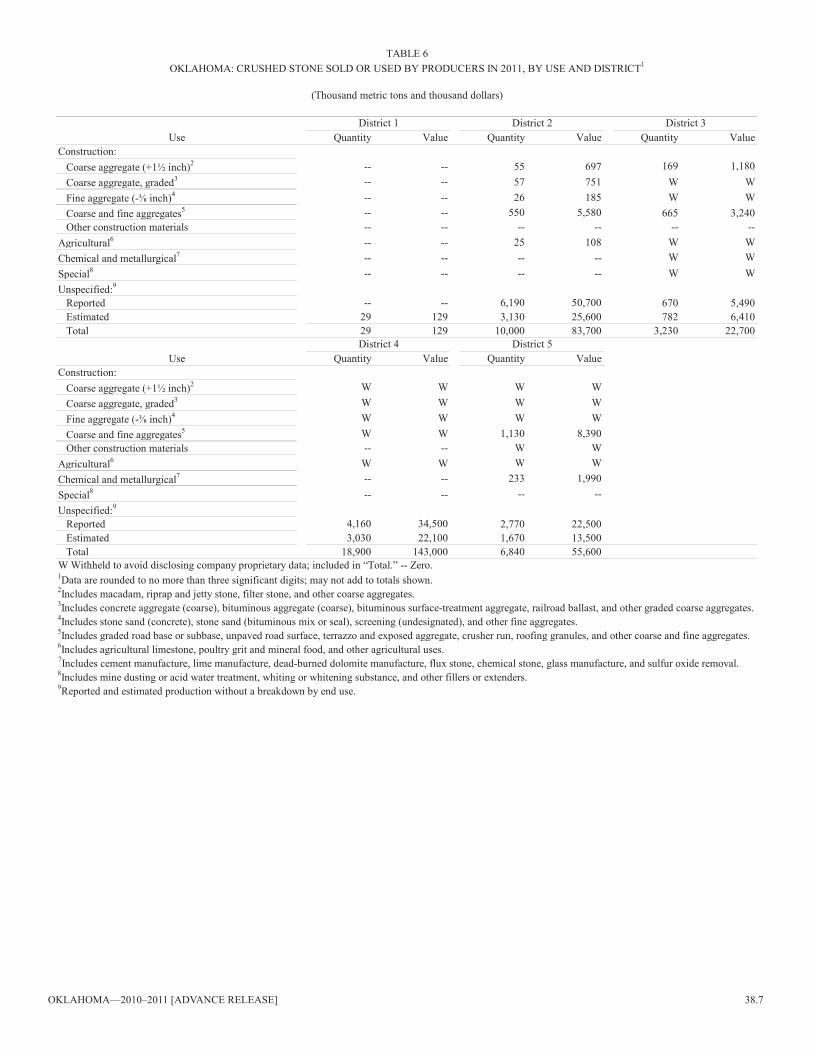
OklahOma—2010–2011 [aDVaNCE RElEaSE] 38.7
Use Quantity Value Quantity Value Quantity ValueConstruction:
Coarse aggregate (+1½ inch)2 -- -- 55 697 169 1,180Coarse aggregate, graded3 -- -- 57 751 W WFine aggregate (-⅜ inch)4 -- -- 26 185 W WCoarse and fine aggregates5 -- -- 550 5,580 665 3,240Other construction materials -- -- -- -- -- --
agricultural6 -- -- 25 108 W WChemical and metallurgical7 -- -- -- -- W WSpecial8 -- -- -- -- W WUnspecified:9
Reported -- -- 6,190 50,700 670 5,490Estimated 29 129 3,130 25,600 782 6,410Total 29 129 10,000 83,700 3,230 22,700
Use Quantity Value Quantity ValueConstruction:
Coarse aggregate (+1½ inch)2 W W W WCoarse aggregate, graded3 W W W WFine aggregate (-⅜ inch)4 W W W WCoarse and fine aggregates5 W W 1,130 8,390Other construction materials -- -- W W
agricultural6 W W W WChemical and metallurgical7 -- -- 233 1,990Special8 -- -- -- --Unspecified:9
Reported 4,160 34,500 2,770 22,500Estimated 3,030 22,100 1,670 13,500Total 18,900 143,000 6,840 55,600
1Data are rounded to no more than three significant digits; may not add to totals shown.
TaBlE 6OklahOma: CRUShED STONE SOlD OR USED BY PRODUCERS IN 2011, BY USE aND DISTRICT1
(Thousand metric tons and thousand dollars)
8Includes mine dusting or acid water treatment, whiting or whitening substance, and other fillers or extenders.
District 1 District 2 District 3
2Includes macadam, riprap and jetty stone, filter stone, and other coarse aggregates.
District 4 District 5
9Reported and estimated production without a breakdown by end use.
3Includes concrete aggregate (coarse), bituminous aggregate (coarse), bituminous surface-treatment aggregate, railroad ballast, and other graded coarse aggregates.4Includes stone sand (concrete), stone sand (bituminous mix or seal), screening (undesignated), and other fine aggregates.5Includes graded road base or subbase, unpaved road surface, terrazzo and exposed aggregate, crusher run, roofing granules, and other coarse and fine aggregates.6Includes agricultural limestone, poultry grit and mineral food, and other agricultural uses.7Includes cement manufacture, lime manufacture, dead-burned dolomite manufacture, flux stone, chemical stone, glass manufacture, and sulfur oxide removal.
W Withheld to avoid disclosing company proprietary data; included in “Total.” -- Zero.

38.8 [aDVaNCE RElEaSE] U.S. GEOlOGICal SURVEY mINERalS YEaRBOOk—2010–2011
Quantity(thousand Value Unit
Use metric tons) (thousands) valueConcrete aggregates and concrete products2 2,950 $20,900 $7.08asphaltic concrete aggregates and other bituminous mixtures 278 1,110 3.99Road base and coverings 176 861 4.89Fill 1,040 3,090 2.97Other miscellaneous uses3 33 572 17.33Unspecified:4
Reported 1,500 9,300 6.20Estimated 4,020 24,600 6.12Total or average 10,600 64,600 6.09
TaBlE 7OklahOma: CONSTRUCTION SaND aND GRaVEl SOlD OR USED IN 2010,
BY maJOR USE CaTEGORY1
2Includes plaster and gunite sands.3Includes snow and ice control.4Reported and estimated production without a breakdown by end use.
1Data are rounded to no more than three significant digits, except unit value; may not add to totals shown.
Quantity(thousand Value Unit
Use metric tons) (thousands) valueConcrete aggregates and concrete products2 3,170 $23,000 $7.26asphaltic concrete aggregates and other bituminous mixtures 493 2,140 4.34Road base and coverings 177 1,060 5.99Fill 740 1,880 2.54Other miscellaneous uses3 21 224 10.67Unspecified:4
Reported 1,940 12,800 6.60Estimated 4,140 24,700 5.97Total or average 10,700 65,900 6.16
TaBlE 8OklahOma: CONSTRUCTION SaND aND GRaVEl SOlD OR USED IN 2011,
BY maJOR USE CaTEGORY1
2Includes plaster and gunite sands.3Includes snow and ice control.4Reported and estimated production without a breakdown by end use.
1Data are rounded to no more than three significant digits, except unit value; may not add to totals shown.

OklahOma—2010–2011 [aDVaNCE RElEaSE] 38.9
Use Quantity Value Quantity Value Quantity ValueConcrete aggregates and concrete products2 W W 1,740 10,900 W Wasphaltic concrete aggregates and road base materials W W 98 456 W WFill W W 543 1,470 W WOther miscellaneous uses3 -- -- 7 39 -- --Unspecified:4
Reported 28 400 460 2,530 568 3,130Estimated 675 4,650 1,020 6,250 338 1,970Total 1,860 12,800 3,870 21,700 923 5,230
Use Quantity Value Quantity ValueConcrete aggregates and concrete products2 W W 120 757asphaltic concrete aggregates and road base materials W W 27 108Fill W W 59 197Other miscellaneous uses3 W W -- --Unspecified:4
Reported -- -- 448 3,240Estimated 1,170 6,780 873 5,370Total 1,830 11,100 1,520 9,670
being withheld.
11District totals may not add up to the published State total, owing to revisions made after the production of the table and (or) proprietary data
3Includes snow and ice control.4Reported and estimated production without a breakdown by end use.
District 4 District 5
W Withheld to avoid disclosing company proprietary data; included in “Total.” -- Zero.1Data are rounded to no more than three significant digits; may not add to totals shown.2Includes plaster and gunite sands.
District 1 District 2 District 3
TaBlE 9OklahOma: CONSTRUCTION SaND aND GRaVEl SOlD OR USED IN 2010,
BY USE aND DISTRICT1
(Thousand metric tons and thousand dollars)

38.10 [aDVaNCE RElEaSE] U.S. GEOlOGICal SURVEY mINERalS YEaRBOOk—2010–2011
Use Quantity Value Quantity Value Quantity ValueConcrete aggregates and concrete products2 W W 1,820 11,700 19 138asphaltic concrete aggregates and road base materials W W 504 2,240 -- --Fill 269 542 367 981 5 15Other miscellaneous uses3 18 192 1 2 -- --Unspecified:4
Reported 16 246 509 2,940 518 3,280Estimated 515 3,210 1,280 7,020 681 4,240Total 1,930 13,900 4,490 24,900 1,220 7,670
Use Quantity Value Quantity ValueConcrete aggregates and concrete products2 W W -- --asphaltic concrete aggregates and road base materials W W -- --Fill 75 250 23 86Other miscellaneous uses3 3 30 -- --Unspecified:4
Reported 490 3,210 412 3,080Estimated 795 4,920 862 5,360Total 1,740 10,800 1,300 8,530
3Includes snow and ice control.4Reported and estimated production without a breakdown by end use.
District 4 District 5
W Withheld to avoid disclosing company proprietary data; included in “Total.” -- Zero.1Data are rounded to no more than three significant digits.2Includes plaster and gunite sands.
District 1 District 2 District 3
TaBlE 10OklahOma: CONSTRUCTION SaND aND GRaVEl SOlD OR USED IN 2011,
BY USE aND DISTRICT1
(Thousand metric tons and thousand dollars)