Embed Size (px)
Citation preview
2010 Blackstone Investor Day
September 23, 2010
Hilton New YorkNew York, NY
0
Forward‐Looking Statements and Important Disclosures
This presentation may contain forward‐looking statements within the meaning of Section 27A of the Securities Act of 1933 and Section 21E of the Securities Exchange Act of 1934 which reflect Blackstone’s current views with respect to, among other things, Blackstone’s operations and financial performance. You can identify these forward‐looking statements by the use of words such as “outlook,” “believes,” “expects,” “potential,” “continues,” “may,”“will,” “should,” “seeks,” “approximately,” “predicts,” “intends,” “plans,” “estimates,” “anticipates” or the negative version of these words or other comparable words. Such forward‐looking statements are subject to various risks and uncertainties. Accordingly, there are or will be important factors that could cause actual outcomes or results to differ materially from those indicated in these statements. Blackstone believes these factors include but are not limited to those described under the section entitled “Risk Factors” in its Annual Report on Form 10‐K for the fiscal year ended December 31, 2009, as such factors may be updated from time to time in its periodic filings with the SEC, which are accessible on the SEC’s website at www.sec.gov. These factors should not be construed as exhaustive and should be read in conjunction with the other cautionary statements that are included in the SEC filings.
Blackstone undertakes no obligation to publicly update or review any forward‐looking statement, whether as a result of new information, future developments or otherwise.
This presentation includes Non‐GAAP Financial Measures. You should also read the appendix to this presentation –Reconciliation of Non‐GAAP Financial Measures.
This release is for informational purposes only and does not constitute an offer of any Blackstone fund or an offer to enter into any investment program with Blackstone. Such an offer may only be made by means of an offering memorandum, which would have a complete description of the relevant fund or program, including the risks applicable thereto.
2010 Blackstone Investor Day
Agenda – Thursday, September 23, 2010Time Function Location 8:00 – 8:05 am Introduction and Overview of The Blackstone Group
Joan Solotar – Senior Managing Director, External Relations and Strategy, The Blackstone Group
Trianon Ballroom, 3rd Floor
8:05 – 8:20 am Welcome Remarks Stephen A. Schwarzman – Chairman, CEO & Co‐Founder, The Blackstone Group
Trianon Ballroom, 3rd Floor
8:20 – 9:00 am Financial Overview Laurence Tosi (“LT”) – Chief Financial Officer, The Blackstone Group
Trianon Ballroom, 3rd Floor
9:00 – 9:40 am Portfolio Operations Group James Quella – Senior Managing Director, The Blackstone Group
Trianon Ballroom, 3rd Floor
9:40 – 10:25 am Private Equity Garrett Moran – Senior Managing Director, The Blackstone Group Vikrant Sawhney – Senior Managing Director, The Blackstone Group
Trianon Ballroom, 3rd Floor
10:25 – 10:45 am BREAK – Cyber Café Petit Trianon, 3rd Floor 10:45 – 11:25 am Blackstone Advisory Partners
John Studzinski – Senior Managing Director, The Blackstone Group Trianon Ballroom, 3rd Floor
11:30 – 12:10 pm Restructuring & Reorganization Advisory Timothy Coleman – Senior Managing Director, The Blackstone Group
Trianon Ballroom, 3rd Floor
12:10 – 12:30 pm BREAK – Cyber Café Petit Trianon, 3rd Floor 12:30 – 1:30 pm GSO Credit Platform – Working Lunch
Bennett Goodman – Senior Managing Director, The Blackstone Group & Founder, GSO Capital Partners
Mercury Ballroom, 3rd Floor
1:30 – 1:45 pm BREAK – Cyber Café Petit Trianon, 3rd Floor 1:45 – 2:35 pm Real Estate
Jonathan Gray – Senior Managing Director, The Blackstone Group Trianon Ballroom, 3rd Floor
2:35 – 3:25 pm Blackstone Alternative Asset Management (“BAAM”) J. Tomilson Hill – Vice Chairman, The Blackstone Group
Trianon Ballroom, 3rd Floor
3:25 – 4:30 pm Wrap‐up and Q&A Stephen A. Schwarzman – Chairman, CEO & Co‐Founder, The Blackstone Group Hamilton E. James – President & COO, The Blackstone Group
Trianon Ballroom, 3rd Floor
4:30 – 5:30 pm COCKTAIL RECEPTION Petit Trianon, 3rd Floor
2010 Blackstone Investor Day
I. Introduction and Overview of The Blackstone Group
II. Financial Overview
III. Portfolio Operations Group
IV. Private Equity
V. Blackstone Advisory Partners
VI. Restructuring & Reorganization Advisory
VII. GSO Credit Platform
VIII. Real Estate
IX. Blackstone Alternative Asset Management (“BAAM”)
Appendix
A. Reconciliation of Non‐GAAP Financial Measures
B. Speaker Biographies
Table of Contents

I. Introduction and Overview of The Blackstone Group
2010 Blackstone Investor Day
1
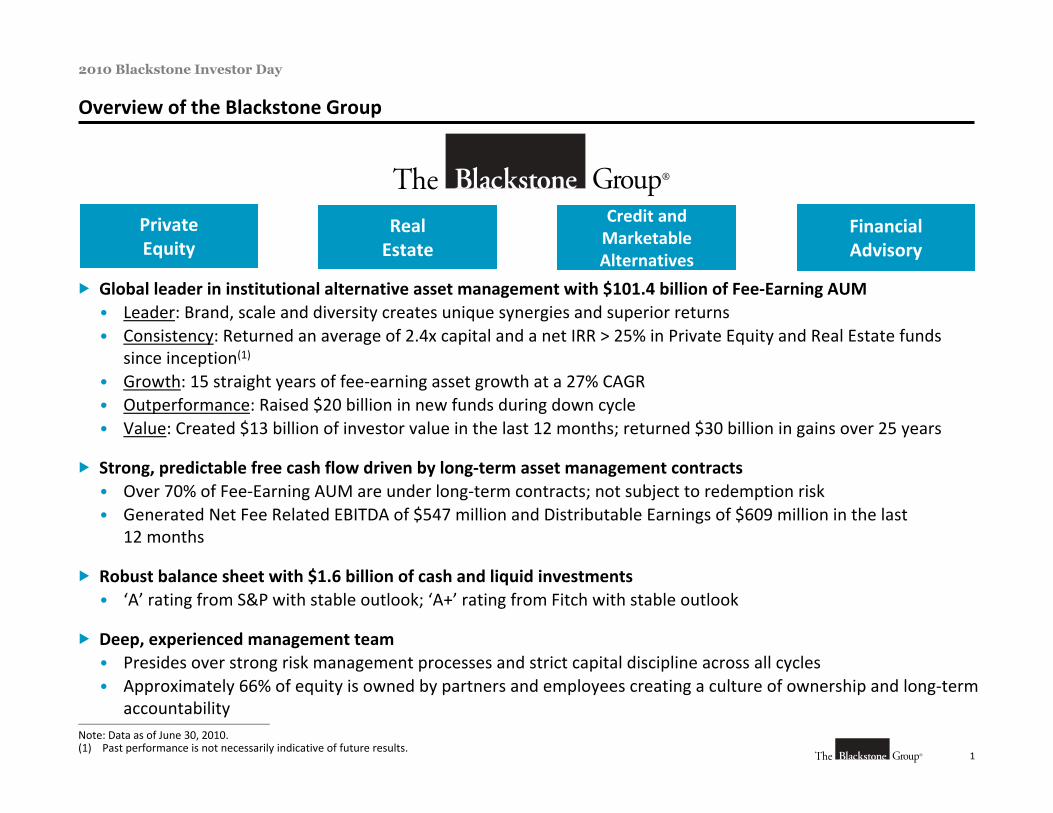
Overview of the Blackstone Group
Global leader in institutional alternative asset management with $101.4 billion of Fee‐Earning AUM • Leader: Brand, scale and diversity creates unique synergies and superior returns • Consistency: Returned an average of 2.4x capital and a net IRR > 25% in Private Equity and Real Estate funds
since inception(1)
• Growth: 15 straight years of fee‐earning asset growth at a 27% CAGR• Outperformance: Raised $20 billion in new funds during down cycle• Value: Created $13 billion of investor value in the last 12 months; returned $30 billion in gains over 25 years
Strong, predictable free cash flow driven by long‐term asset management contracts• Over 70% of Fee‐Earning AUM are under long‐term contracts; not subject to redemption risk• Generated Net Fee Related EBITDA of $547 million and Distributable Earnings of $609 million in the last
12 months
Robust balance sheet with $1.6 billion of cash and liquid investments• ‘A’ rating from S&P with stable outlook; ‘A+’ rating from Fitch with stable outlook
Deep, experienced management team • Presides over strong risk management processes and strict capital discipline across all cycles• Approximately 66% of equity is owned by partners and employees creating a culture of ownership and long‐term
accountability
Private Equity
Credit and Marketable Alternatives
RealEstate
FinancialAdvisory
________________________________________________
Note: Data as of June 30, 2010.(1) Past performance is not necessarily indicative of future results.

II. Financial Overview
1
2010 Blackstone Investor Day
$3 $4$8 $8 $12 $13 $14
$22$27
$32
$51
$70
$83$91
$96$101
$0
$20
$40
$60
$80
$100
$120
1995 1996 1997 1998 1999 2000 2001 2002 2003 2004 2005 2006 2007 2008 2009 June2010
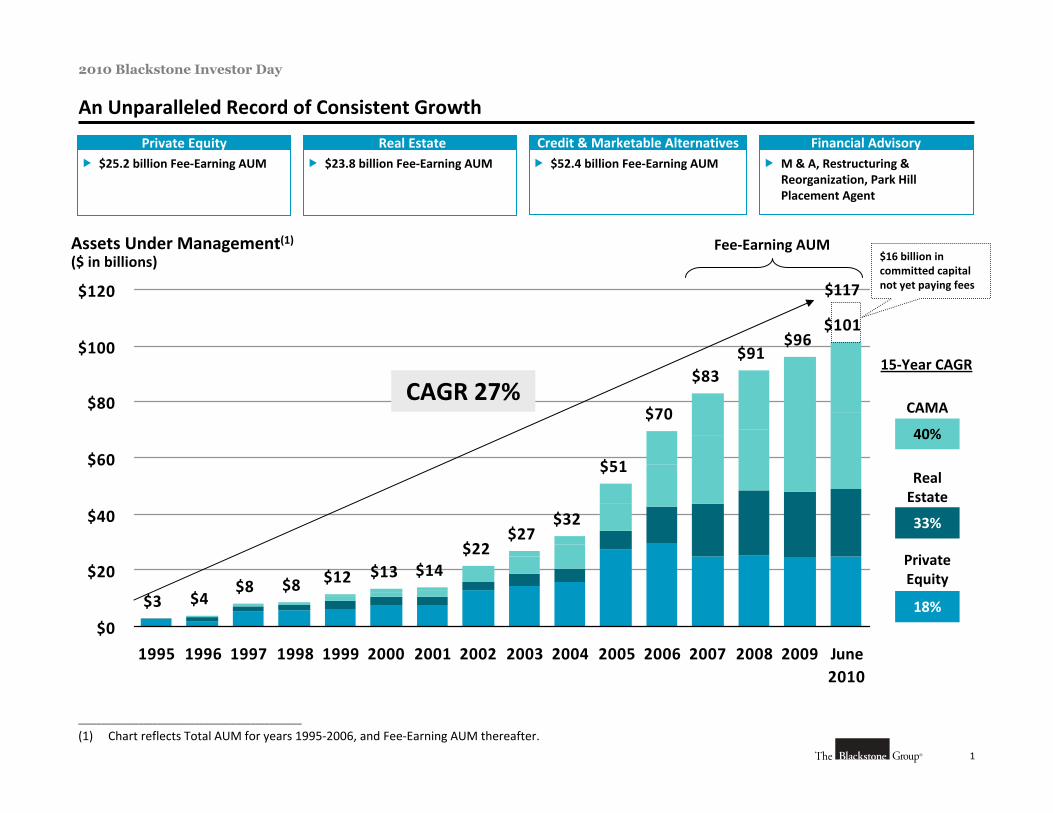
An Unparalleled Record of Consistent Growth
Assets Under Management(1)($ in billions)
Fee‐Earning AUM
CAGR 27%
$52.4 billion Fee‐Earning AUM
Credit & Marketable Alternatives M & A, Restructuring &
Reorganization, Park Hill Placement Agent
Financial Advisory $23.8 billion Fee‐Earning AUM
Real Estate $25.2 billion Fee‐Earning AUM
Private Equity
CAMA
Private Equity
Real Estate
40%
33%
18%
15‐Year CAGR
$117
$16 billion in committed capital not yet paying fees
________________________________________________
(1) Chart reflects Total AUM for years 1995‐2006, and Fee‐Earning AUM thereafter.
2
2010 Blackstone Investor Day
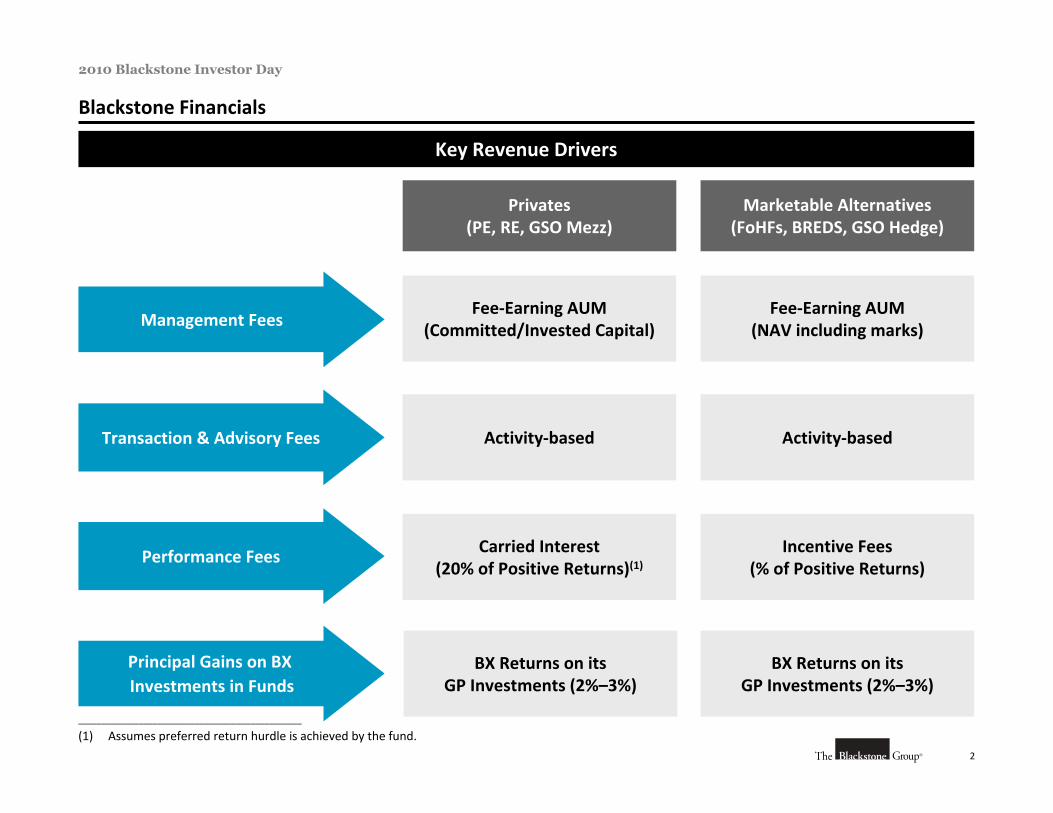
Blackstone Financials
Management Fees
Transaction & Advisory Fees
Principal Gains on BX Investments in Funds
Key Revenue Drivers
Fee‐Earning AUM (Committed/Invested Capital)
Fee‐Earning AUM(NAV including marks)
Privates(PE, RE, GSO Mezz)
Marketable Alternatives(FoHFs, BREDS, GSO Hedge)
Activity‐based
BX Returns on its GP Investments (2%–3%)
BX Returns on its GP Investments (2%–3%)
Activity‐based
Performance Fees Incentive Fees(% of Positive Returns)
Carried Interest(20% of Positive Returns)(1)
________________________________________________
(1) Assumes preferred return hurdle is achieved by the fund.
3
2010 Blackstone Investor Day
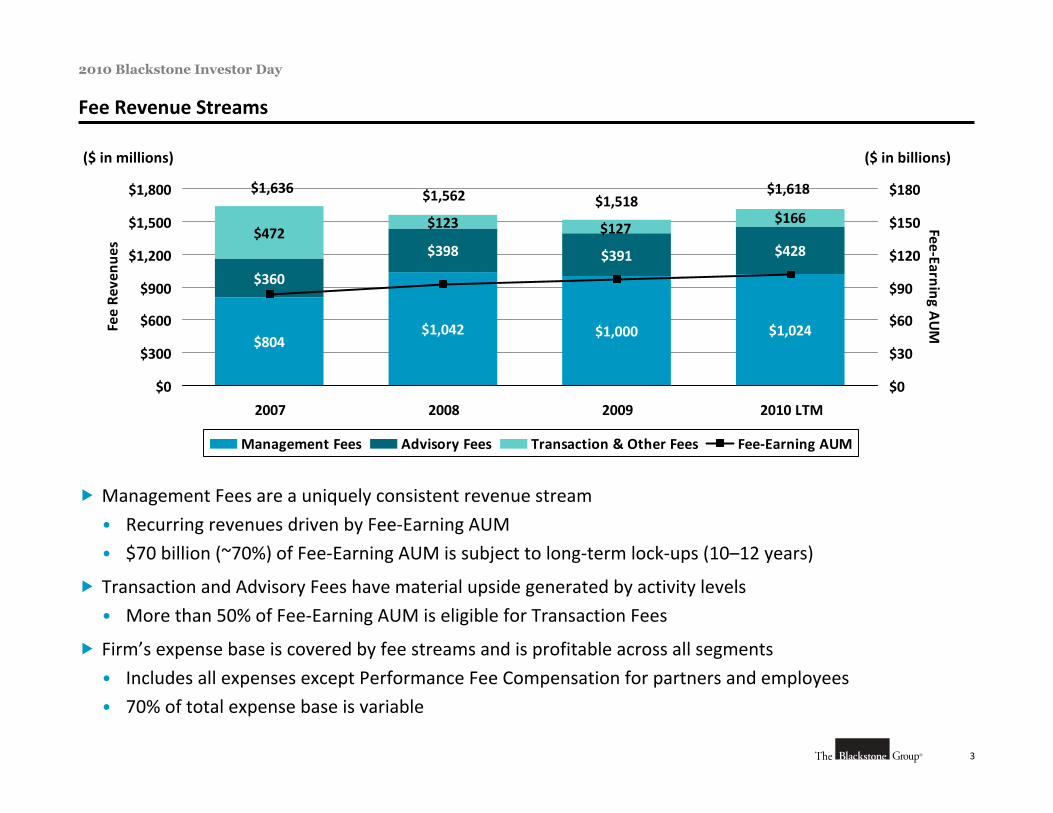
Fee Revenue Streams
Management Fees are a uniquely consistent revenue stream
• Recurring revenues driven by Fee‐Earning AUM
• $70 billion (~70%) of Fee‐Earning AUM is subject to long‐term lock‐ups (10–12 years)
Transaction and Advisory Fees have material upside generated by activity levels
• More than 50% of Fee‐Earning AUM is eligible for Transaction Fees
Firm’s expense base is covered by fee streams and is profitable across all segments
• Includes all expenses except Performance Fee Compensation for partners and employees
• 70% of total expense base is variable
$804$1,042 $1,000 $1,024
$360
$398 $391 $428$472
$123 $166$127
$0
$300
$600
$900
$1,200
$1,500
$1,800
2007 2008 2009 2010 LTM
Fee Re
venu
es
$0
$30
$60
$90
$120
$150
$180
Fee‐Earning AUM
Management Fees Advisory Fees Transaction & Other Fees Fee‐Earning AUM
$1,636 $1,562 $1,518$1,618
($ in millions) ($ in billions)
4
2010 Blackstone Investor Day
Realized Performance Revenue Streams
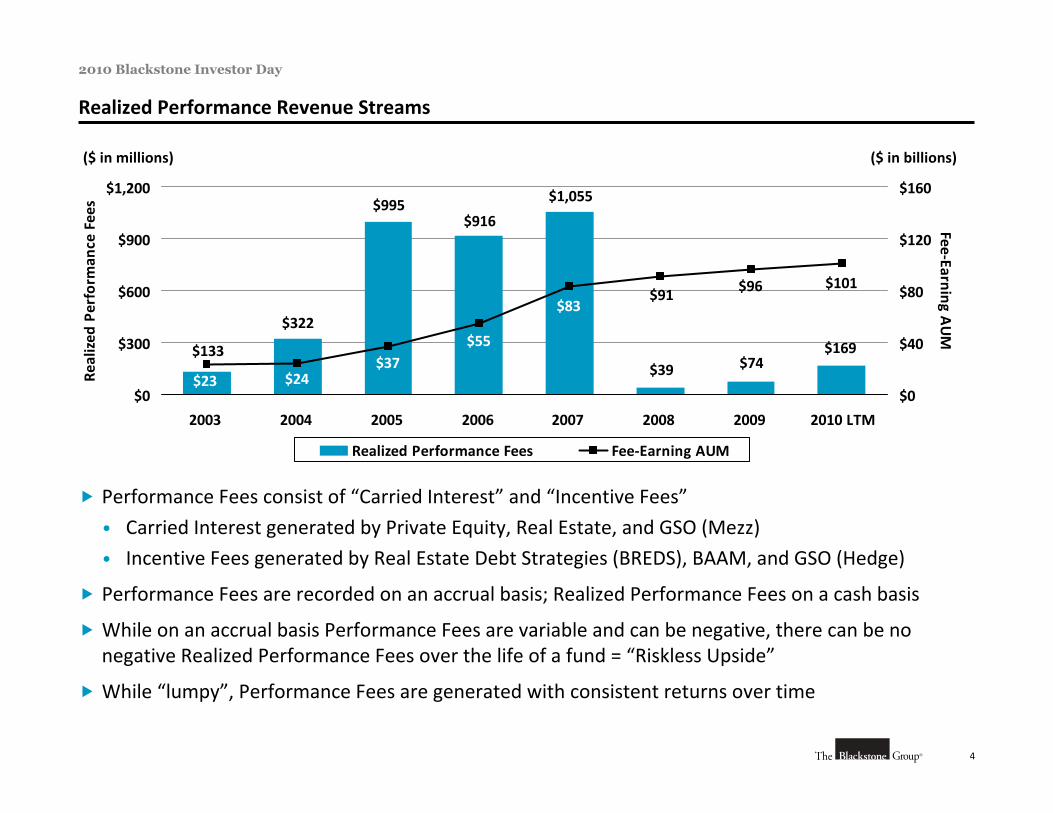
Performance Fees consist of “Carried Interest” and “Incentive Fees”
• Carried Interest generated by Private Equity, Real Estate, and GSO (Mezz)
• Incentive Fees generated by Real Estate Debt Strategies (BREDS), BAAM, and GSO (Hedge)
Performance Fees are recorded on an accrual basis; Realized Performance Fees on a cash basis
While on an accrual basis Performance Fees are variable and can be negative, there can be no negative Realized Performance Fees over the life of a fund = “Riskless Upside”
While “lumpy”, Performance Fees are generated with consistent returns over time
$169$74$39
$1,055
$916$995
$133
$322
$101$96$91$83
$55$37
$24$23$0
$300
$600
$900
$1,200
2003 2004 2005 2006 2007 2008 2009 2010 LTM
Realized
Perform
ance Fees
$0
$40
$80
$120
$160
Fee‐Earning AUM
Realized Performance Fees Fee‐Earning AUM
($ in millions) ($ in billions)
5
2010 Blackstone Investor Day
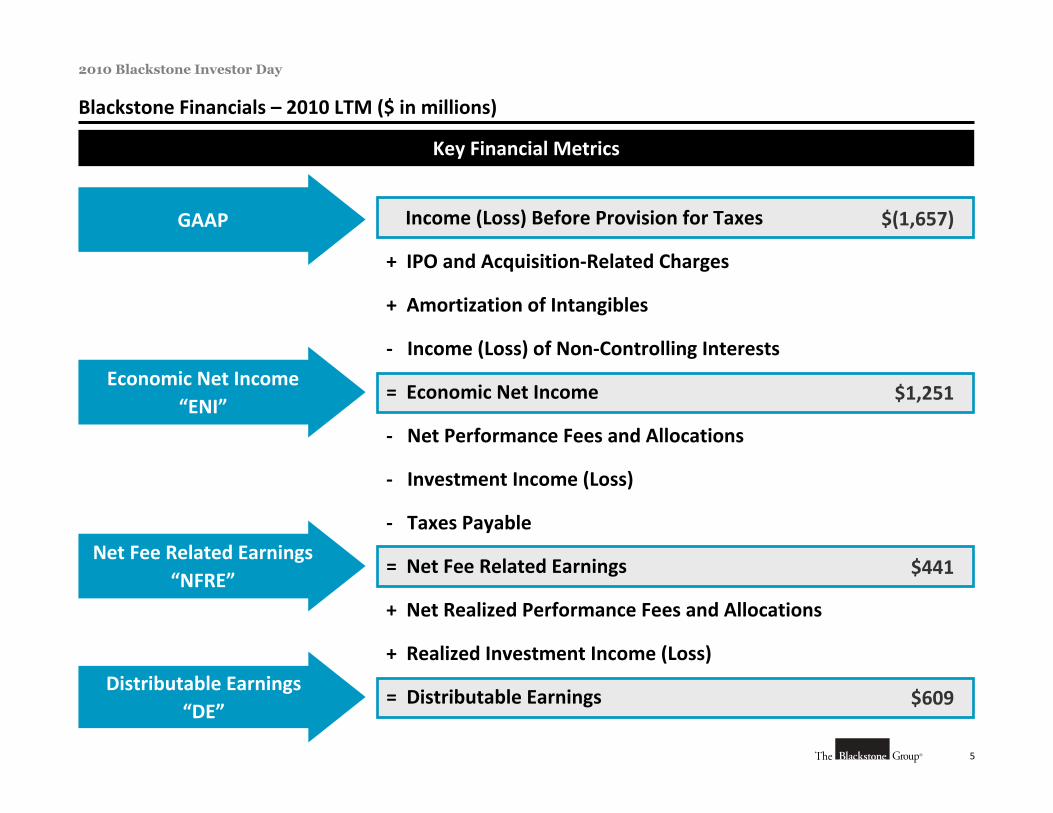
Blackstone Financials – 2010 LTM ($ in millions)
Economic Net Income“ENI”
Distributable Earnings“DE”
Key Financial Metrics
Income (Loss) Before Provision for Taxes
+ IPO and Acquisition‐Related Charges
+ Amortization of Intangibles
‐ Income (Loss) of Non‐Controlling Interests
= Economic Net Income
‐ Net Performance Fees and Allocations
‐ Investment Income (Loss)
‐ Taxes Payable
= Net Fee Related Earnings
+ Net Realized Performance Fees and Allocations
+ Realized Investment Income (Loss)
= Distributable Earnings
Net Fee Related Earnings“NFRE”
GAAP $(1,657)
$1,251
$441
$609
6
2010 Blackstone Investor Day
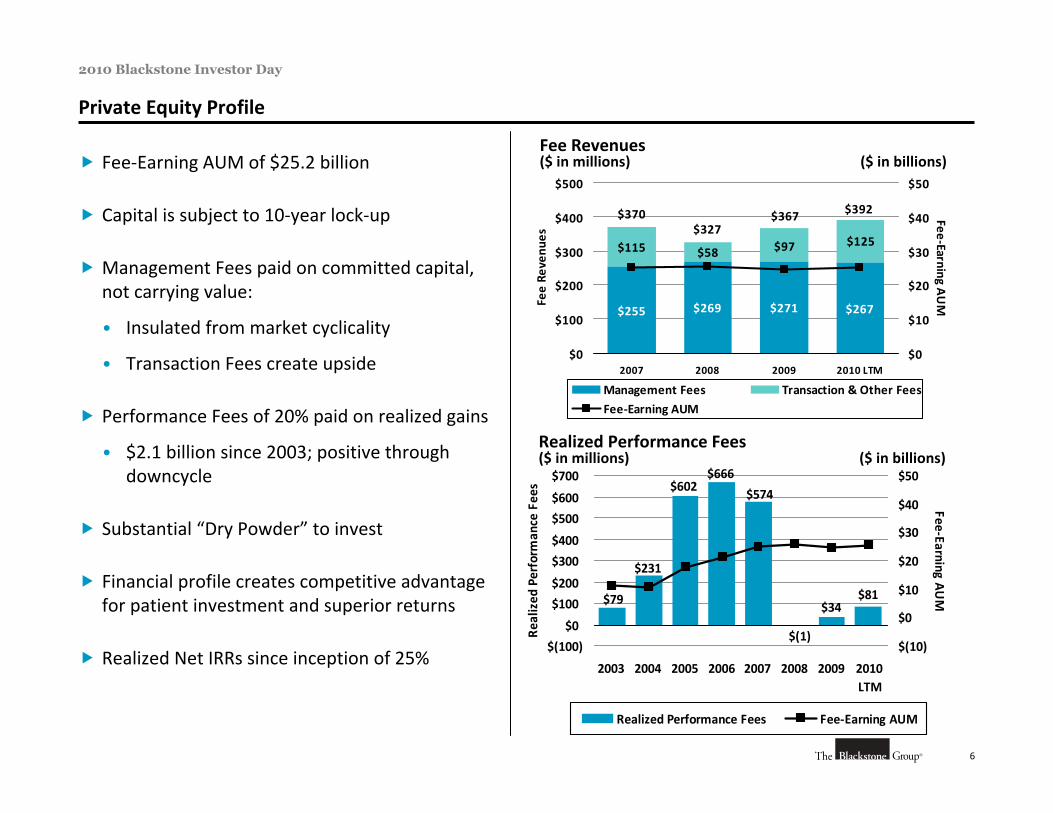
Private Equity Profile
$81$34
$(1)
$574
$666$602
$231
$79
$(100)
$0
$100
$200
$300
$400
$500
$600
$700
2003 2004 2005 2006 2007 2008 2009 2010LTM
Rea
lized
Perform
ance Fee
s
$(10)
$0
$10
$20
$30
$40
$50
Fee‐Earning AUM
Realized Performance Fees Fee‐Earning AUM
Fee Revenues($ in millions) ($ in billions) Fee‐Earning AUM of $25.2 billion
Capital is subject to 10‐year lock‐up
Management Fees paid on committed capital, not carrying value:
• Insulated from market cyclicality
• Transaction Fees create upside
Performance Fees of 20% paid on realized gains
• $2.1 billion since 2003; positive through downcycle
Substantial “Dry Powder” to invest
Financial profile creates competitive advantage for patient investment and superior returns
Realized Net IRRs since inception of 25%
Realized Performance Fees($ in millions) ($ in billions)
$255 $269 $271 $267
$115 $58$125$97
$392$367$327
$370
$0
$100
$200
$300
$400
$500
2007 2008 2009 2010 LTM
Fee Re
venu
es
$0
$10
$20
$30
$40
$50
Fee‐Earning AUM
Management Fees Transaction & Other Fees
Fee‐Earning AUM
7
2010 Blackstone Investor Day
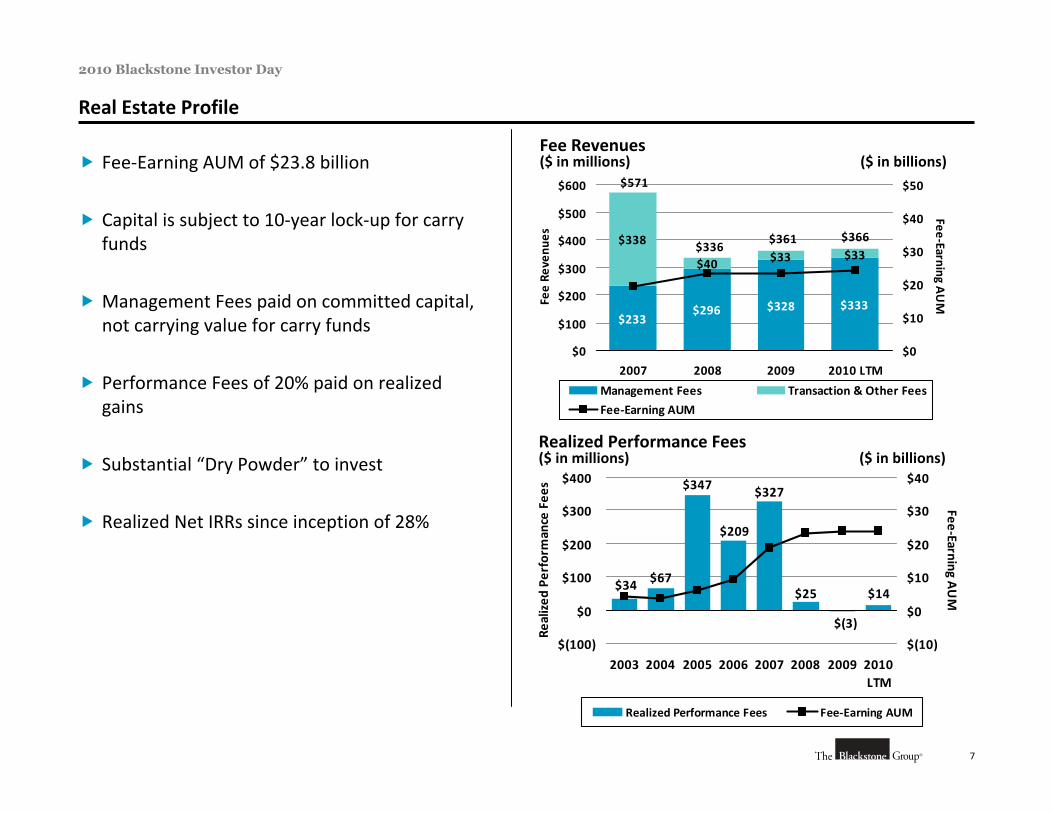
Real Estate Profile
$233$296 $328 $333
$338
$40 $33 $33$361
$571
$336$366
$0
$100
$200
$300
$400
$500
$600
2007 2008 2009 2010 LTM
Fee Re
venu
es
$0
$10
$20
$30
$40
$50
Fee‐Earning AUM
Management Fees Transaction & Other Fees
Fee‐Earning AUM
$(3)
$14$25
$327
$209
$347
$67$34
$(100)
$0
$100
$200
$300
$400
2003 2004 2005 2006 2007 2008 2009 2010LTM
Realized
Perform
ance Fee
s
$(10)
$0
$10
$20
$30
$40
Fee‐Earning AUM
Realized Performance Fees Fee‐Earning AUM
Fee‐Earning AUM of $23.8 billion
Capital is subject to 10‐year lock‐up for carry funds
Management Fees paid on committed capital, not carrying value for carry funds
Performance Fees of 20% paid on realized gains
Substantial “Dry Powder” to invest
Realized Net IRRs since inception of 28%
Fee Revenues($ in millions) ($ in billions)
Realized Performance Fees($ in millions) ($ in billions)
8
2010 Blackstone Investor Day
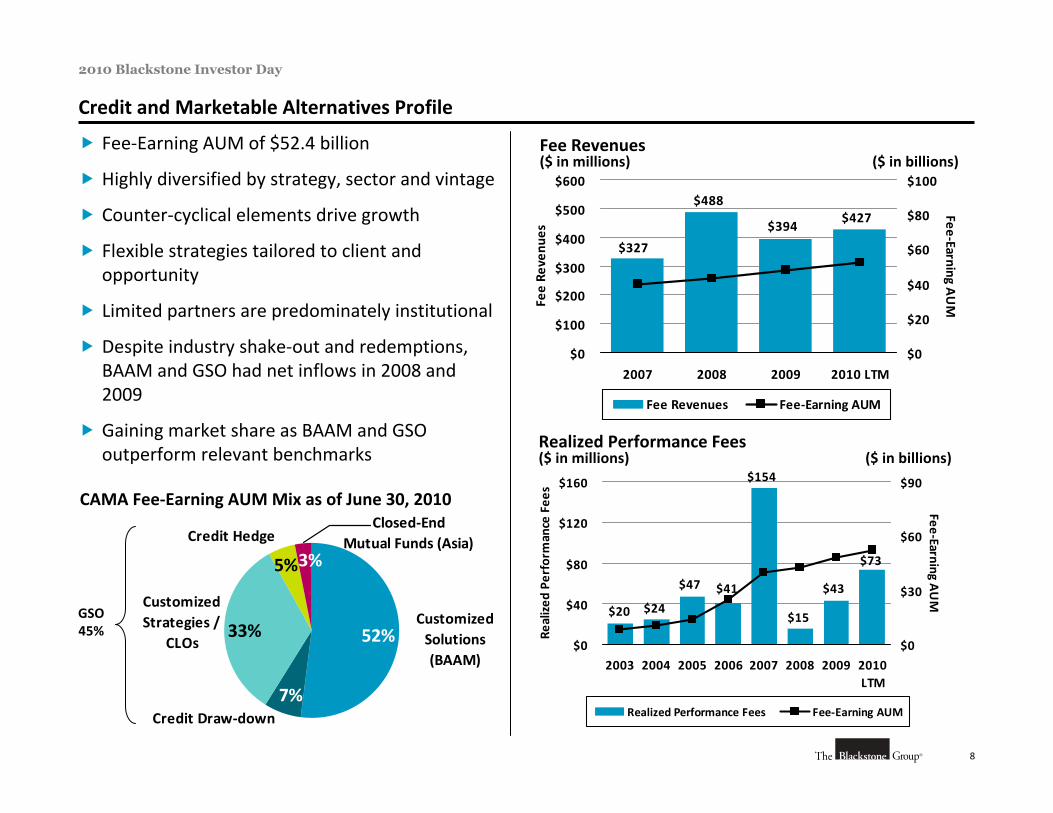
5%
7%
3%
33% 52%CustomizedSolutions(BAAM)
Credit Draw‐down
Customized Strategies /
CLOs
Credit HedgeClosed‐End
Mutual Funds (Asia)
Fee‐Earning AUM of $52.4 billion
Highly diversified by strategy, sector and vintage
Counter‐cyclical elements drive growth
Flexible strategies tailored to client and opportunity
Limited partners are predominately institutional
Despite industry shake‐out and redemptions, BAAM and GSO had net inflows in 2008 and 2009
Gaining market share as BAAM and GSO outperform relevant benchmarks
Credit and Marketable Alternatives Profile
CAMA Fee‐Earning AUM Mix as of June 30, 2010
GSO45%
$43
$73
$15
$154
$41$47
$24$20
$0
$40
$80
$120
$160
2003 2004 2005 2006 2007 2008 2009 2010LTM
Realized
Perform
ance Fee
s
$0
$30
$60
$90
Fee‐Earning AUM
Realized Performance Fees Fee‐Earning AUM
$427$394
$488
$327
$0
$100
$200
$300
$400
$500
$600
2007 2008 2009 2010 LTM
Fee Re
venu
es
$0
$20
$40
$60
$80
$100
Fee‐Earning AUM
Fee Revenues Fee‐Earning AUM
Fee Revenues($ in millions) ($ in billions)
Realized Performance Fees($ in millions) ($ in billions)
9
2010 Blackstone Investor Day
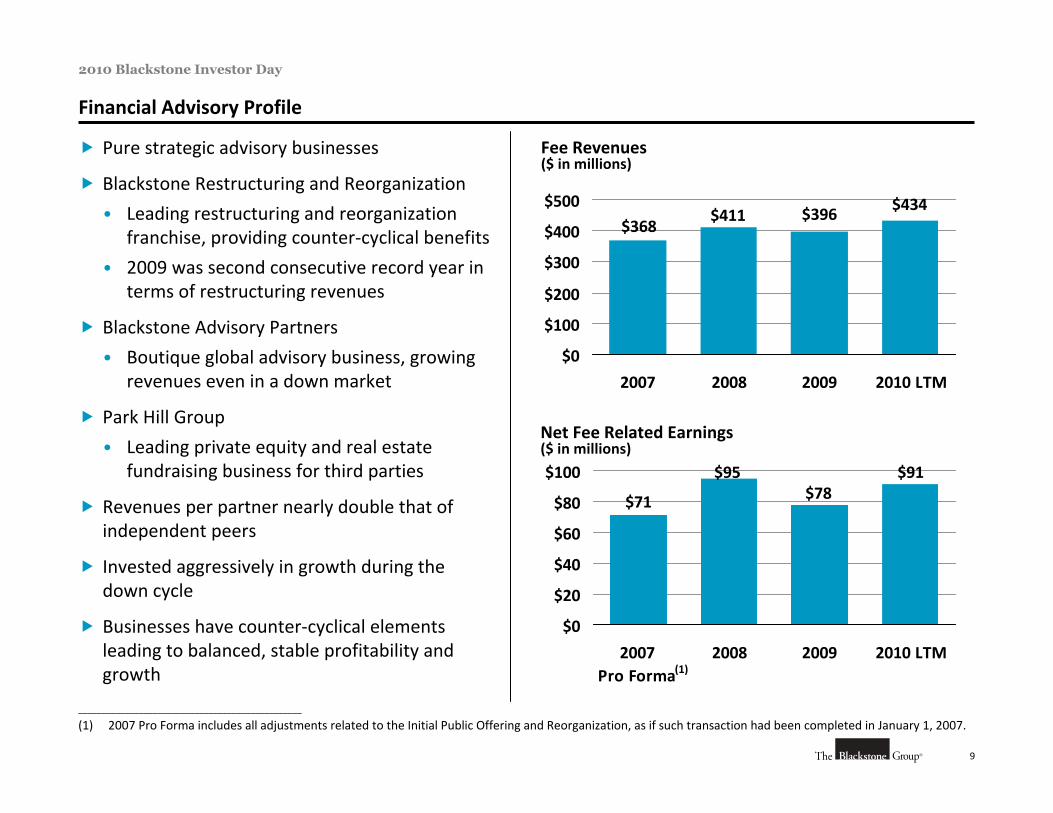
Pure strategic advisory businesses
Blackstone Restructuring and Reorganization
• Leading restructuring and reorganization franchise, providing counter‐cyclical benefits
• 2009 was second consecutive record year in terms of restructuring revenues
Blackstone Advisory Partners
• Boutique global advisory business, growing revenues even in a down market
Park Hill Group
• Leading private equity and real estate fundraising business for third parties
Revenues per partner nearly double that of independent peers
Invested aggressively in growth during the down cycle
Businesses have counter‐cyclical elements leading to balanced, stable profitability and growth
Financial Advisory Profile
Fee Revenues($ in millions)
$434$396$411$368
$0
$100
$200
$300
$400
$500
2007 2008 2009 2010 LTM
Net Fee Related Earnings($ in millions)
$91$78
$95
$71
$0
$20
$40
$60
$80
$100
2007 Pro Forma
2008 2009 2010 LTM
________________________________________________
(1) 2007 Pro Forma includes all adjustments related to the Initial Public Offering and Reorganization, as if such transaction had been completed in January 1, 2007.
(1)
10
2010 Blackstone Investor Day
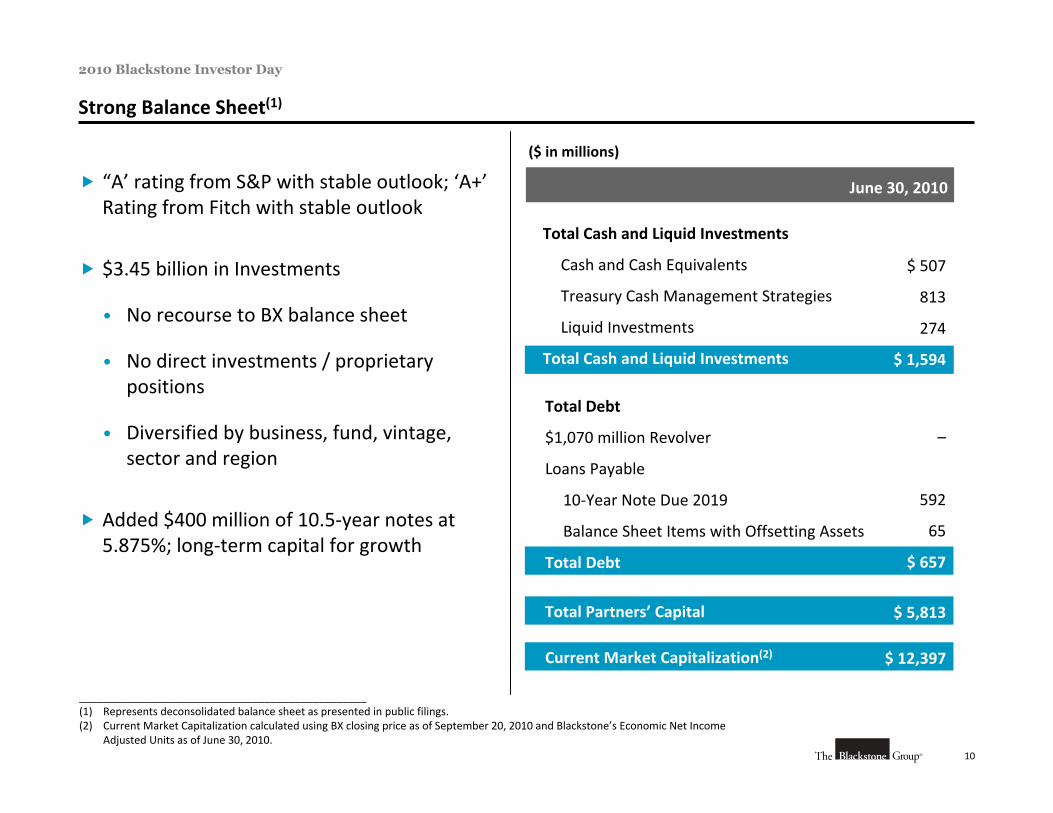
Strong Balance Sheet(1)
“A’ rating from S&P with stable outlook; ‘A+’Rating from Fitch with stable outlook
$3.45 billion in Investments
• No recourse to BX balance sheet
• No direct investments / proprietary positions
• Diversified by business, fund, vintage, sector and region
Added $400 million of 10.5‐year notes at 5.875%; long‐term capital for growth
June 30, 2010
Total Cash and Liquid Investments
Cash and Cash Equivalents
Treasury Cash Management Strategies
Liquid Investments
Total Cash and Liquid Investments
$ 507
813
274
$ 1,594
Total Debt
$1,070 million Revolver
Loans Payable
10‐Year Note Due 2019
Balance Sheet Items with Offsetting Assets
Total Debt
–
592
65
$ 657
($ in millions)
Total Partners’ Capital $ 5,813
________________________________________________(1) Represents deconsolidated balance sheet as presented in public filings.(2) Current Market Capitalization calculated using BX closing price as of September 20, 2010 and Blackstone’s Economic Net Income
Adjusted Units as of June 30, 2010.
Current Market Capitalization(2) $ 12,397

III. Portfolio Operations Group
1
2010 Blackstone Investor Day
Our Mission: Sustainable Competitive Advantage Delivering Long‐Term Value
Blackstone’s Portfolio Operations Group… works with our investment teams and portfolio company senior management to help acquired businesses become more productive, competitive and efficient
In the process, we build stronger enterprises, preserve and create jobs, and enable our portfolio companies to achieve lasting value for both our fund investors and successor owners
2
2010 Blackstone Investor Day
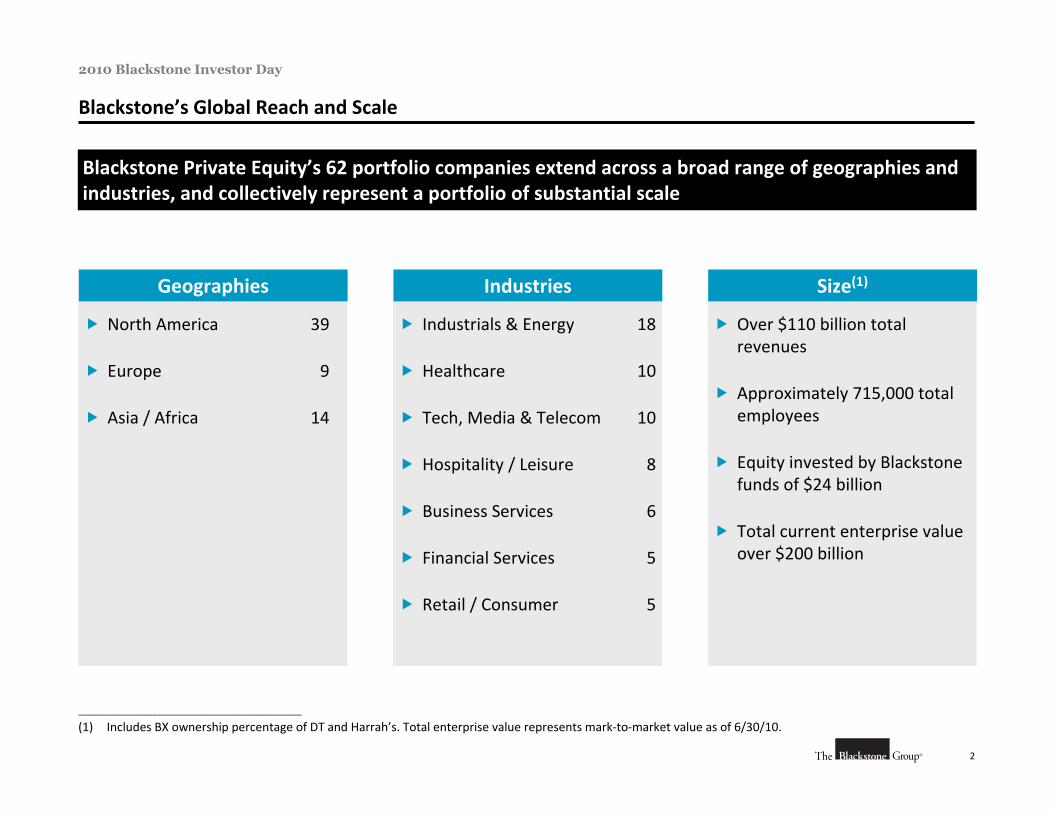
Blackstone’s Global Reach and Scale
Blackstone Private Equity’s 62 portfolio companies extend across a broad range of geographies and industries, and collectively represent a portfolio of substantial scale
North America 39
Europe 9
Asia / Africa 14
Geographies
Industrials & Energy 18
Healthcare 10
Tech, Media & Telecom 10
Hospitality / Leisure 8
Business Services 6
Financial Services 5
Retail / Consumer 5
Industries
Over $110 billion total revenues
Approximately 715,000 total employees
Equity invested by Blackstone funds of $24 billion
Total current enterprise value over $200 billion
Size(1)
________________________________________________
(1) Includes BX ownership percentage of DT and Harrah’s. Total enterprise value represents mark‐to‐market value as of 6/30/10.
3
2010 Blackstone Investor Day
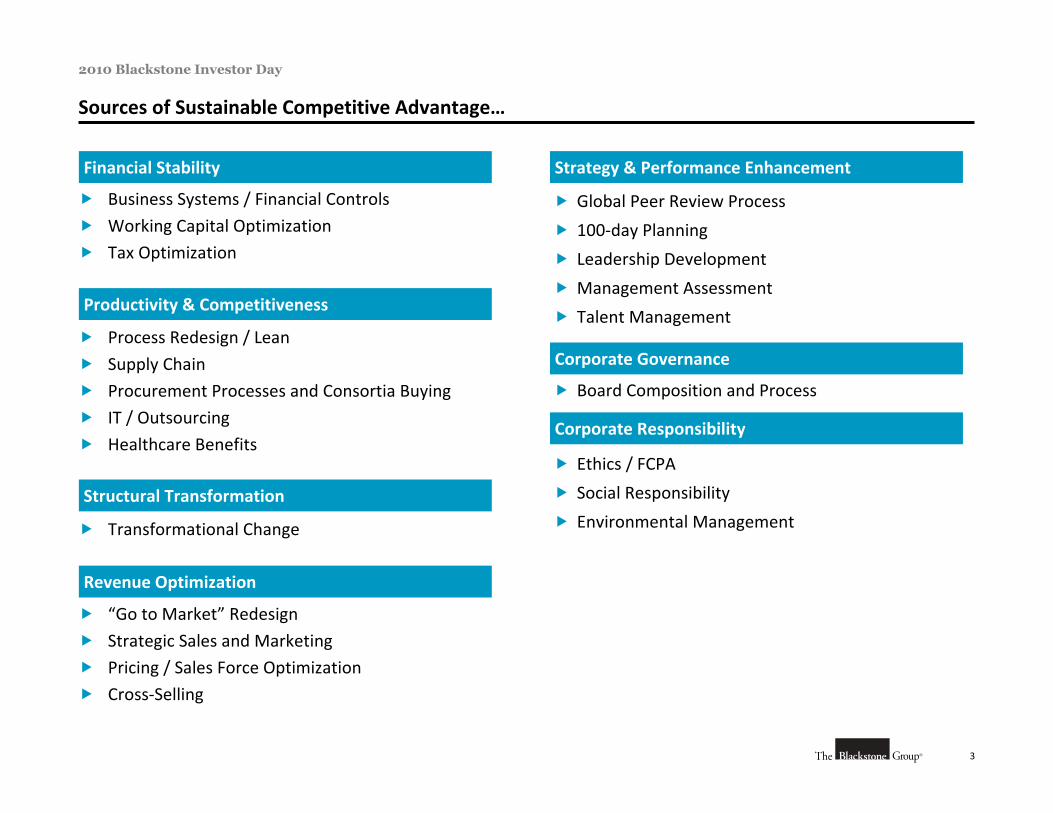
Financial Stability
Productivity & Competitiveness
Structural Transformation
Revenue Optimization
Strategy & Performance Enhancement
Corporate Governance
Corporate Responsibility
Sources of Sustainable Competitive Advantage…
Business Systems / Financial Controls
Working Capital Optimization
Tax Optimization
Process Redesign / Lean
Supply Chain
Procurement Processes and Consortia Buying
IT / Outsourcing
Healthcare Benefits
Transformational Change
“Go to Market” Redesign
Strategic Sales and Marketing
Pricing / Sales Force Optimization
Cross‐Selling
Global Peer Review Process
100‐day Planning
Leadership Development
Management Assessment
Talent Management
Board Composition and Process
Ethics / FCPA
Social Responsibility
Environmental Management
4
2010 Blackstone Investor Day
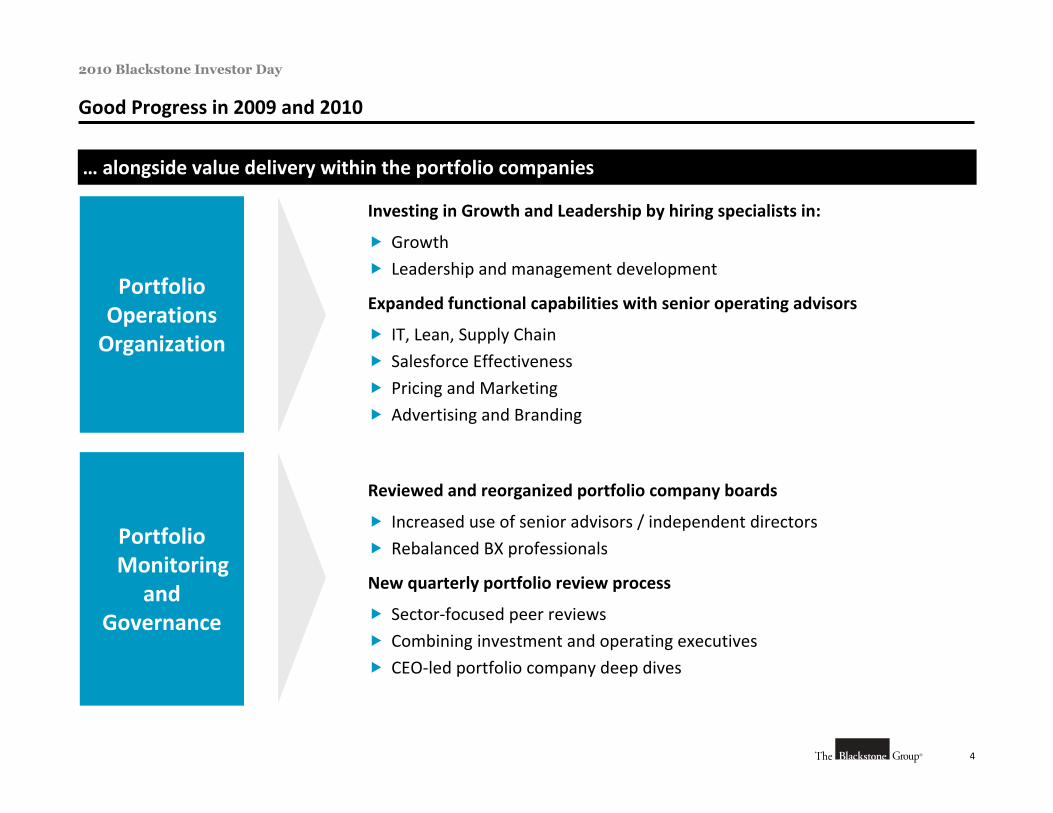
Good Progress in 2009 and 2010
… alongside value delivery within the portfolio companies
Portfolio Operations Organization
Investing in Growth and Leadership by hiring specialists in:
Growth
Leadership and management development
Expanded functional capabilities with senior operating advisors
IT, Lean, Supply Chain
Salesforce Effectiveness
Pricing and Marketing
Advertising and Branding
Portfolio Monitoring
and Governance
Reviewed and reorganized portfolio company boards
Increased use of senior advisors / independent directors
Rebalanced BX professionals
New quarterly portfolio review process
Sector‐focused peer reviews
Combining investment and operating executives
CEO‐led portfolio company deep dives
5
2010 Blackstone Investor Day
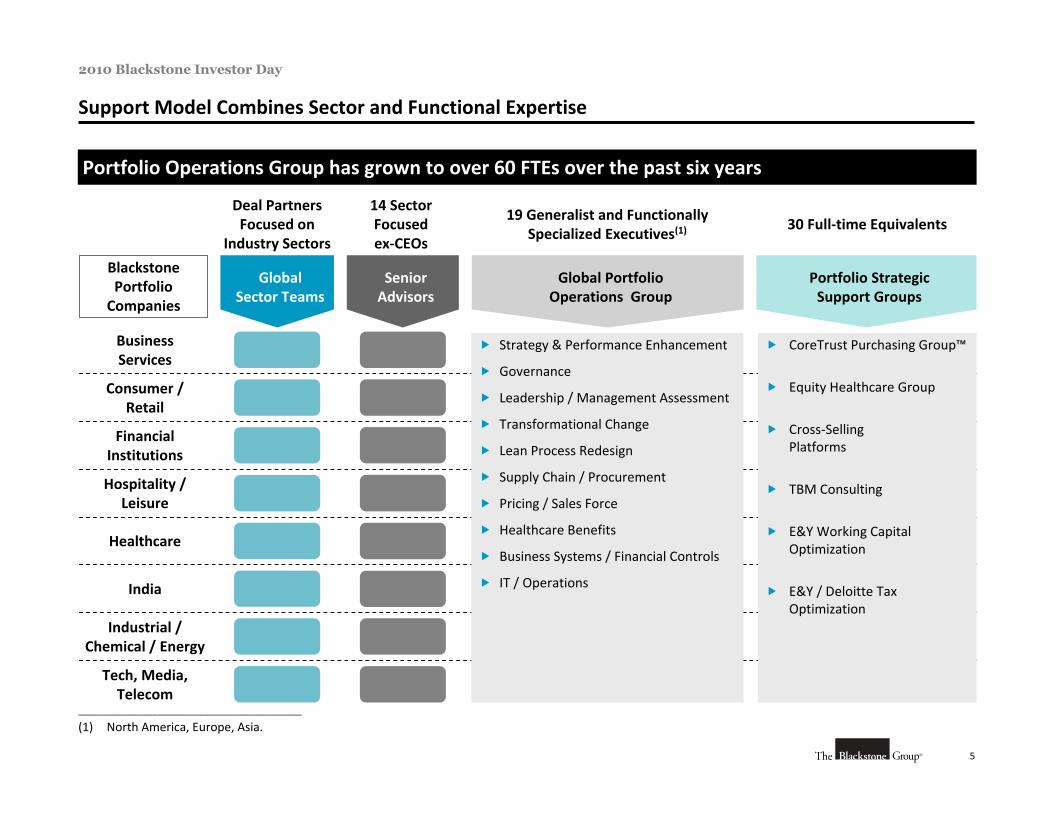
Support Model Combines Sector and Functional Expertise
Portfolio Operations Group has grown to over 60 FTEs over the past six years
________________________________________________
(1) North America, Europe, Asia.
Deal Partners Focused on
Industry Sectors
14 Sector Focused ex‐CEOs
19 Generalist and Functionally Specialized Executives(1)
30 Full‐time Equivalents
Blackstone Portfolio Companies
Portfolio Strategic Support Groups
GlobalSector Teams
Senior Advisors
Global PortfolioOperations Group
BusinessServices
Consumer / Retail
Financial Institutions
Hospitality / Leisure
Healthcare
India
Industrial /Chemical / Energy
Tech, Media, Telecom
Strategy & Performance Enhancement
Governance
Leadership / Management Assessment
Transformational Change
Lean Process Redesign
Supply Chain / Procurement
Pricing / Sales Force
Healthcare Benefits
Business Systems / Financial Controls
IT / Operations
CoreTrust Purchasing Group™
Equity Healthcare Group
Cross‐SellingPlatforms
TBM Consulting
E&Y Working Capital Optimization
E&Y / Deloitte Tax Optimization
6
2010 Blackstone Investor Day
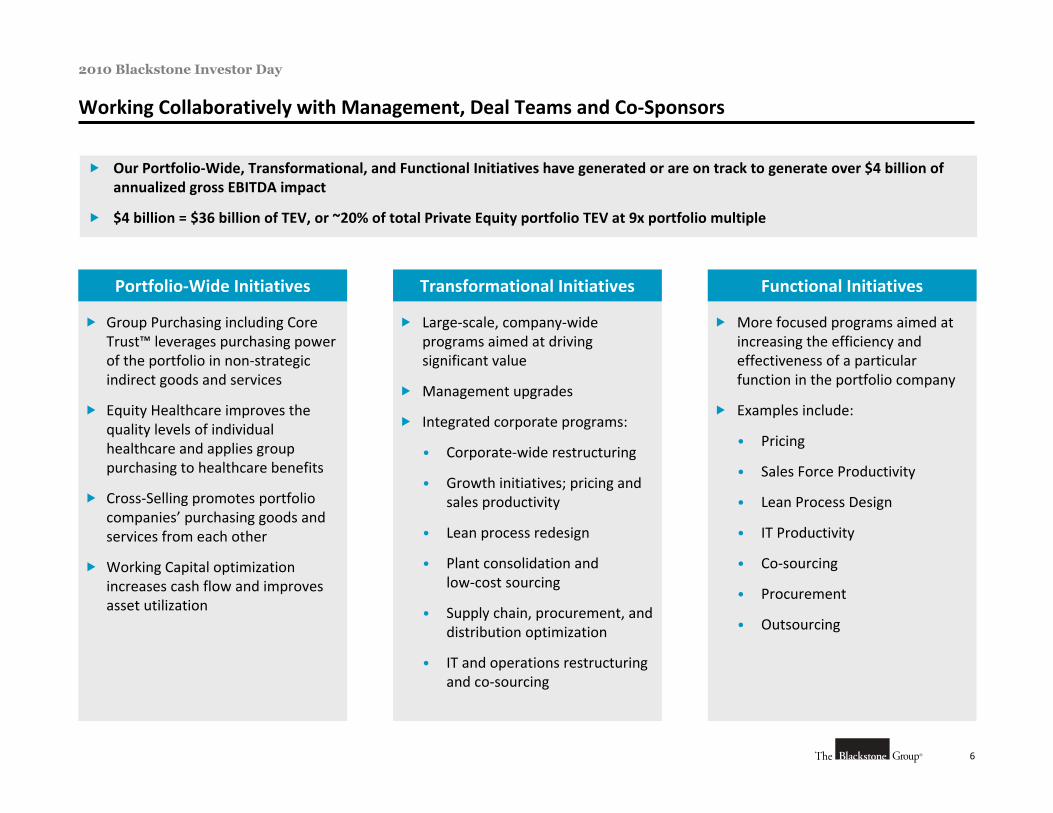
Working Collaboratively with Management, Deal Teams and Co‐Sponsors
Our Portfolio‐Wide, Transformational, and Functional Initiatives have generated or are on track to generate over $4 billion of annualized gross EBITDA impact
$4 billion = $36 billion of TEV, or ~20% of total Private Equity portfolio TEV at 9x portfolio multiple
Group Purchasing including Core Trust™ leverages purchasing power of the portfolio in non‐strategic indirect goods and services
Equity Healthcare improves the quality levels of individual healthcare and applies group purchasing to healthcare benefits
Cross‐Selling promotes portfolio companies’ purchasing goods and services from each other
Working Capital optimization increases cash flow and improves asset utilization
Portfolio‐Wide Initiatives
Large‐scale, company‐wide programs aimed at driving significant value
Management upgrades
Integrated corporate programs:
• Corporate‐wide restructuring
• Growth initiatives; pricing and sales productivity
• Lean process redesign
• Plant consolidation and low‐cost sourcing
• Supply chain, procurement, and distribution optimization
• IT and operations restructuring and co‐sourcing
Transformational Initiatives
More focused programs aimed at increasing the efficiency and effectiveness of a particular function in the portfolio company
Examples include:
• Pricing
• Sales Force Productivity
• Lean Process Design
• IT Productivity
• Co‐sourcing
• Procurement
• Outsourcing
Functional Initiatives
7
2010 Blackstone Investor Day
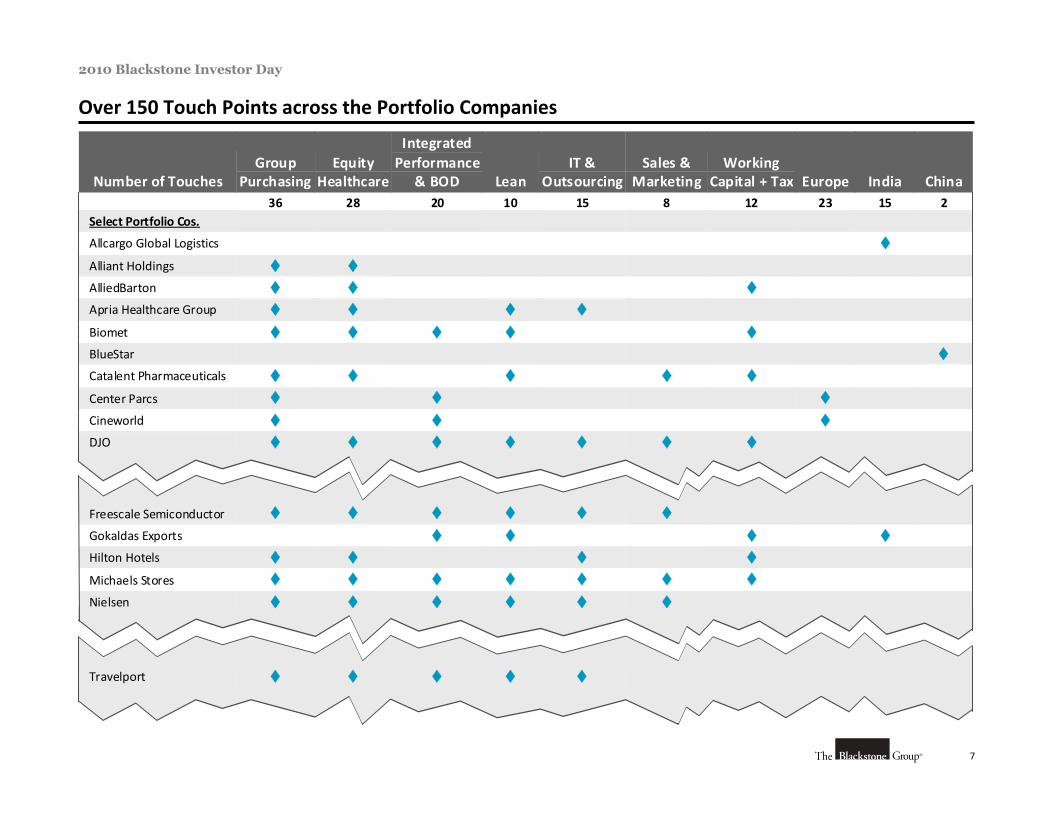
Freescale Semiconductor
Gokaldas Exports Hilton Hotels Michaels Stores
Nielsen
Travelport
Number of Touches Group
Purchasing Equity
Healthcare
Integrated Performance
& BOD Lean IT &
Outsourcing Sales &
MarketingWorking
Capital + Tax Europe India China 36 28 20 10 15 8 12 23 15 2 Select Portfolio Cos. Allcargo Global Logistics
Alliant Holdings AlliedBarton Apria Healthcare Group Biomet BlueStar Catalent Pharmaceuticals Center Parcs Cineworld DJO
Over 150 Touch Points across the Portfolio Companies
8
2010 Blackstone Investor Day
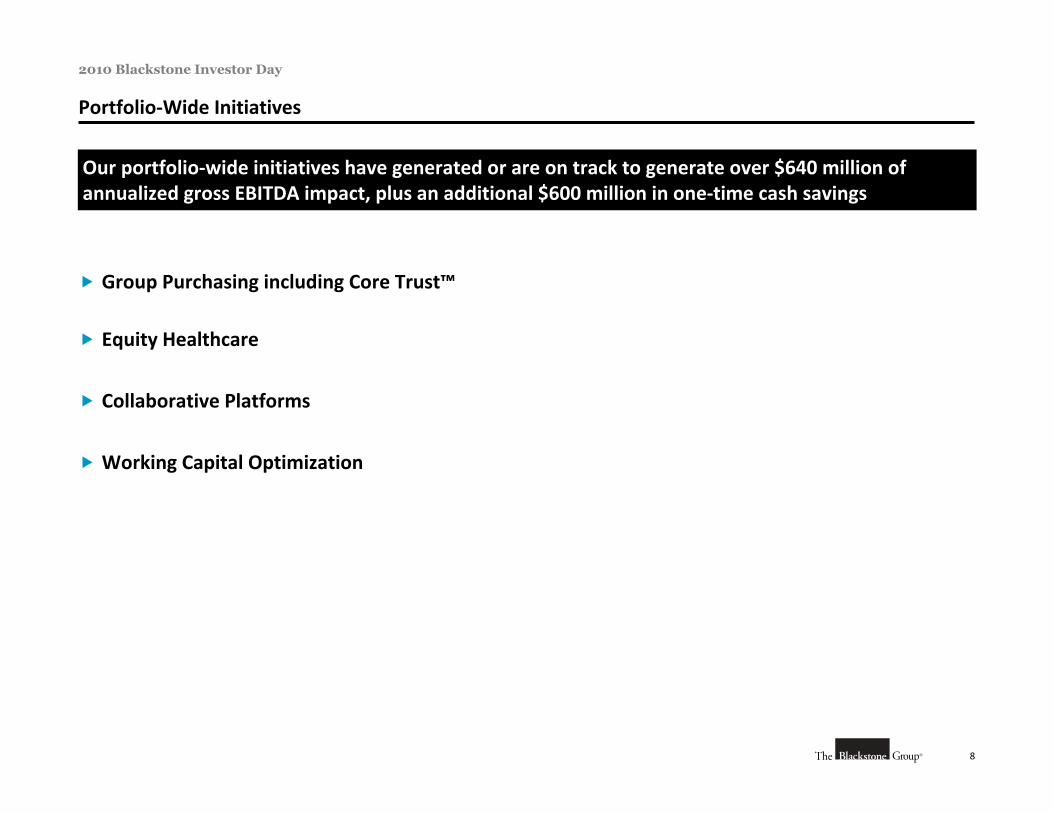
Portfolio‐Wide Initiatives
Group Purchasing including Core Trust™
Equity Healthcare
Collaborative Platforms
Working Capital Optimization
Our portfolio‐wide initiatives have generated or are on track to generate over $640 million of annualized gross EBITDA impact, plus an additional $600 million in one‐time cash savings
9
2010 Blackstone Investor Day
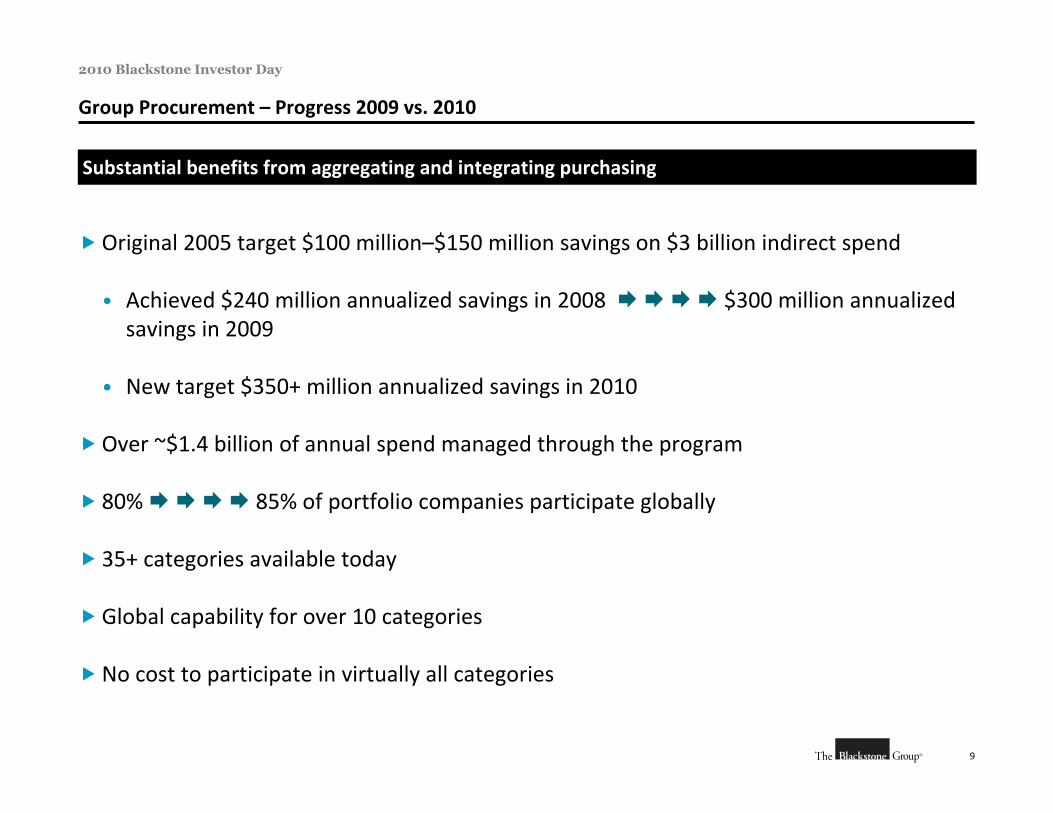
Group Procurement – Progress 2009 vs. 2010
Original 2005 target $100 million–$150 million savings on $3 billion indirect spend
• Achieved $240 million annualized savings in 2008 $300 million annualized savings in 2009
• New target $350+ million annualized savings in 2010
Over ~$1.4 billion of annual spend managed through the program
80% 85% of portfolio companies participate globally
35+ categories available today
Global capability for over 10 categories
No cost to participate in virtually all categories
Substantial benefits from aggregating and integrating purchasing
10
2010 Blackstone Investor Day
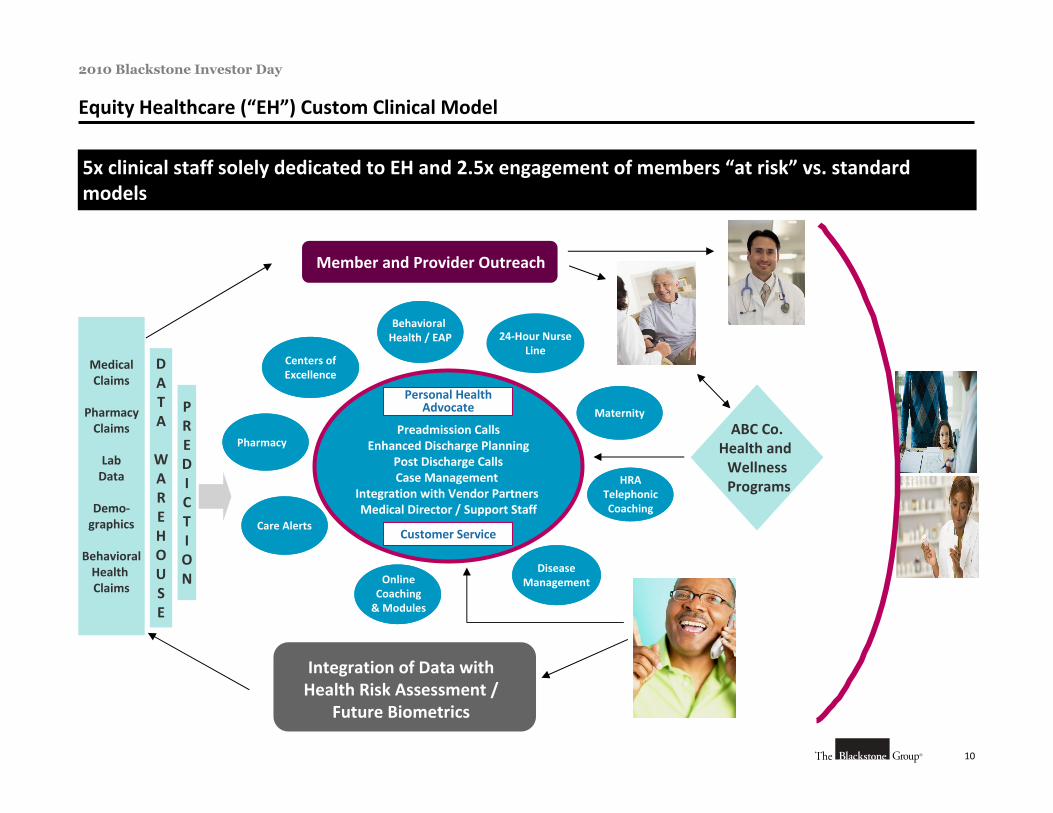
Equity Healthcare (“EH”) Custom Clinical Model
5x clinical staff solely dedicated to EH and 2.5x engagement of members “at risk” vs. standard models
Preadmission CallsEnhanced Discharge Planning
Post Discharge CallsCase Management
Integration with Vendor Partners Medical Director / Support Staff
Vendors
Personal Health Advocate
Behavioral Health / EAP
Disease Management
Centers of Excellence
Customer Service
24‐Hour Nurse Line
Online Coaching & Modules
Care Alerts
Pharmacy
Maternity
MedicalClaims
PharmacyClaims
LabData
Demo‐graphics
BehavioralHealth Claims
DATA
WAREHOUSE
Health Risk Assessment
ABC Co.Health and Wellness ProgramsHRA
Telephonic Coaching
PREDICTION
Integration of Data with Health Risk Assessment /
Future Biometrics
Member and Provider Outreach
11
2010 Blackstone Investor Day
Equity Healthcare – First Year Results: 2009
Aggregate EH trend is 6.4% vs. U.S. corporate average ~10.6%(1)
2009 estimated net savings of $35 million for 25 portfolio companies
• $19 million medical claim savings due to better quality and decision making
• $16 million administration (ASO) fee savings
Aggressive savings target of $100+ million
• Continued investment in incentives and plan design
• New membership growth
________________________________________________
(1) Segal Trend Survey.
12
2010 Blackstone Investor Day
Cross‐Selling Opportunity and Program (B2B)
Cross‐selling B2B program continues to grow rapidly, with material revenue and EBITDA impact
Allcargo – logistics
T‐Mobile Wireless – telecom
SunGard – business services
RGIS – inventory management
Performance Food Group – food distribution into hotels, theme parks
Merlin, Michaels Stores, Universal, Tragus, CineWorld, Center Parcs, others – employee promotional discounts / co‐marketing
Intelenet – business process outsourcing
Orbitz , Hilton Hotels, La Quinta – travel services
Alliant Insurance – insurance, employee benefits consulting
AlliedBarton – security services and employee screening
Republic Services – waste management
Full‐time resource in Portfolio Operations Group to coordinate cross‐selling programs (B2B and B2C)
Specific Product / Service Opportunities Examples:
13
2010 Blackstone Investor Day
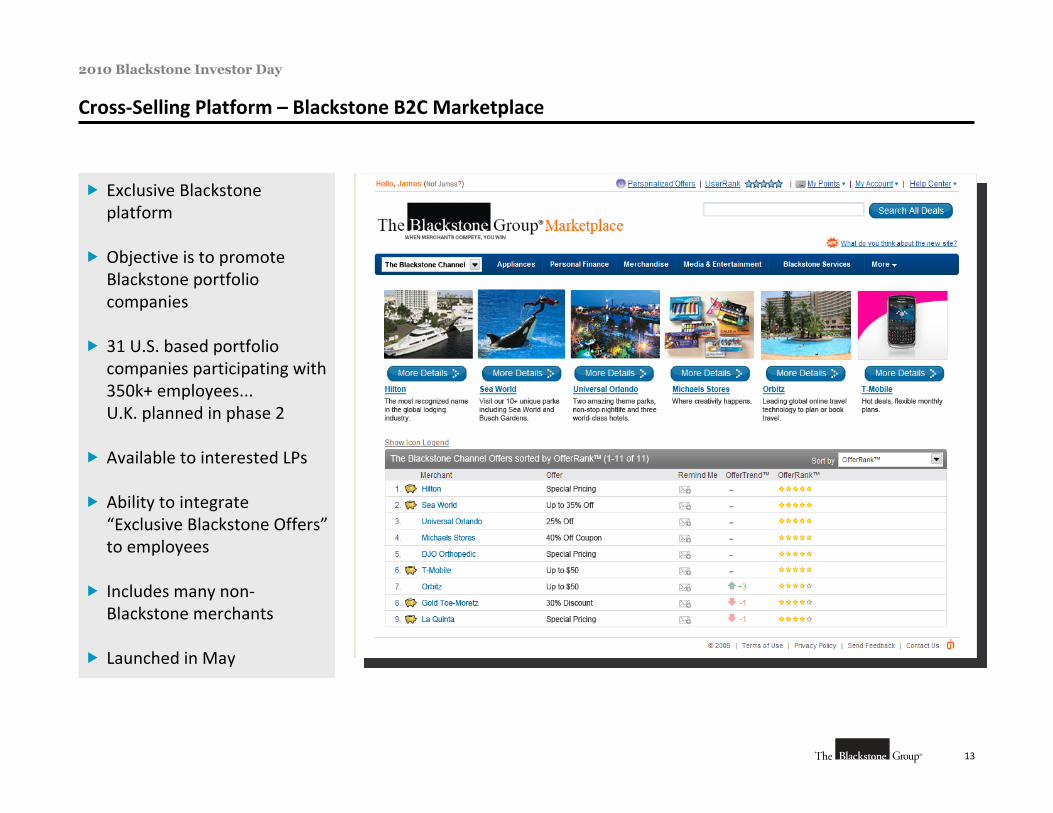
Cross‐Selling Platform – Blackstone B2C Marketplace
Exclusive Blackstone platform
Objective is to promote Blackstone portfolio companies
31 U.S. based portfolio companies participating with 350k+ employees... U.K. planned in phase 2
Available to interested LPs
Ability to integrate “Exclusive Blackstone Offers”to employees
Includes many non‐Blackstone merchants
Launched in May

14
2010 Blackstone Investor Day
CxO On‐line Network for Portfolio Senior Executives (CEO, CFO, CPO, CHRO, CMO, CIO…)
Welcome to The Blackstone Group CEO Network
CEO Network
Welcome to the CEO Network! Our site promotes relationship building among the CEOs of our Portfolio Companies, such as yourself. You will find the latest personal and contact information for members as well as opportunities to interact with them through surveys and discussion boards.
To begin the process you will need to register by clicking on the “New Member Registration” link below. If you have already registered with us, please log in by entering your E‐mail address and Password and then clicking on the “Login” button below.
We hope you enjoy your experience and encourage your feedback as we continue to update the site to meet your needs.
15
2010 Blackstone Investor Day
Environmental Sustainability Initiative
Environmental Sustainability Task Force formed in 2008 to establish Blackstone as PE industry leader in environmental stewardship
Three primary areas of focus:
• Blackstone energy consumption and environmental impact
• Portfolio energy consumption and environmental impact (both PE and RE)
• Environmental risk assessment in all investment processes
Targeting meaningful energy and carbon reductions over the next five years
• Top‐tier of companies globally
• Sharing expertise across portfolio
• Full compliance with CRC mandate across European portfolio
Broad communication program being launched this quarter
• Documenting environmental and cost benefits for the firm and portfolio
Portfolio Operations Group plans to retain a Chief Sustainability Officer (“CSO”) to drive portfolio‐wide initiatives

16
2010 Blackstone Investor Day
Our Mission: Sustainable Competitive Advantage Delivering Long‐Term Value
Blackstone’s Portfolio Operations Group… works with our investment teams and portfolio company senior management to help acquired businesses become more productive, competitive and efficient
In the process, we build stronger enterprises, preserve and create jobs, and enable our portfolio companies to achieve lasting value for both our fund investors and successor owners

IV. Private Equity
1
2010 Blackstone Investor Day
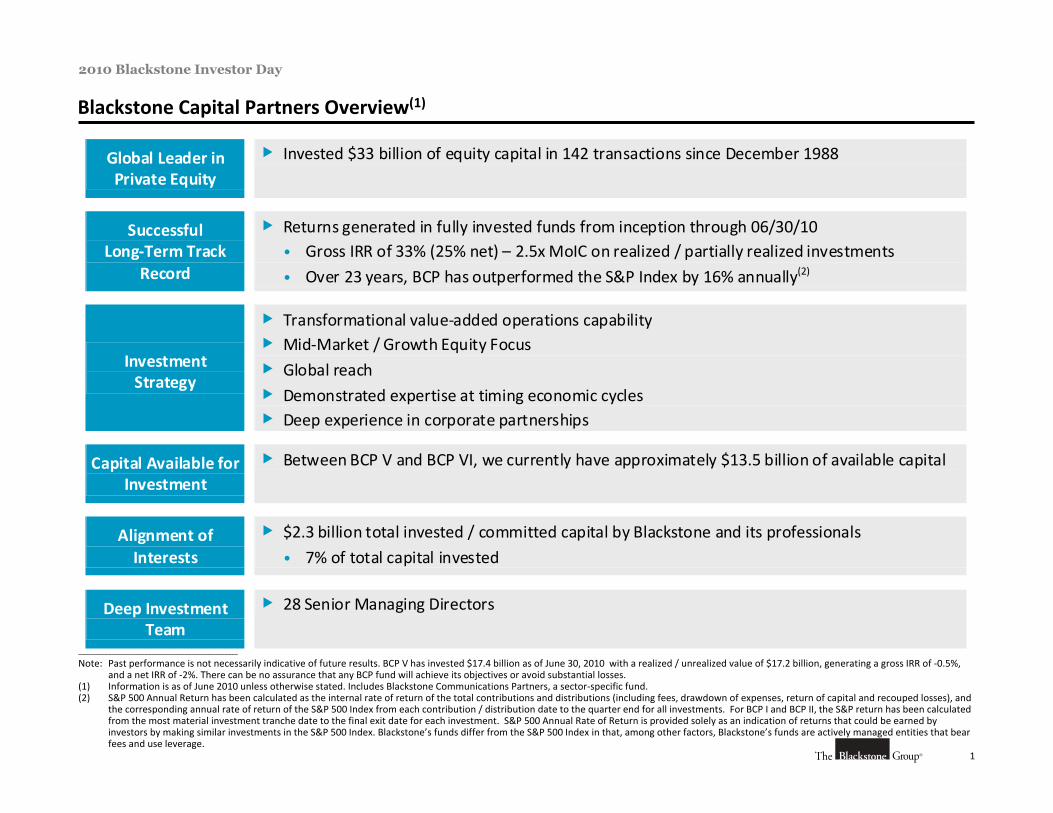
Blackstone Capital Partners Overview(1)
________________________________________________
Note: Past performance is not necessarily indicative of future results. BCP V has invested $17.4 billion as of June 30, 2010 with a realized / unrealized value of $17.2 billion, generating a gross IRR of ‐0.5%, and a net IRR of ‐2%. There can be no assurance that any BCP fund will achieve its objectives or avoid substantial losses.
(1) Information is as of June 2010 unless otherwise stated. Includes Blackstone Communications Partners, a sector‐specific fund.(2) S&P 500 Annual Return has been calculated as the internal rate of return of the total contributions and distributions (including fees, drawdown of expenses, return of capital and recouped losses), and
the corresponding annual rate of return of the S&P 500 Index from each contribution / distribution date to the quarter end for all investments. For BCP I and BCP II, the S&P return has been calculated from the most material investment tranche date to the final exit date for each investment. S&P 500 Annual Rate of Return is provided solely as an indication of returns that could be earned byinvestors by making similar investments in the S&P 500 Index. Blackstone’s funds differ from the S&P 500 Index in that, among other factors, Blackstone’s funds are actively managed entities that bear fees and use leverage.
Global Leader in Private Equity
Invested $33 billion of equity capital in 142 transactions since December 1988
Successful Long‐Term Track
Record
Returns generated in fully invested funds from inception through 06/30/10 • Gross IRR of 33% (25% net) – 2.5x MoIC on realized / partially realized investments
• Over 23 years, BCP has outperformed the S&P Index by 16% annually(2)
Investment Strategy
Transformational value‐added operations capability Mid‐Market / Growth Equity Focus Global reach Demonstrated expertise at timing economic cycles Deep experience in corporate partnerships
Capital Available for Investment
Between BCP V and BCP VI, we currently have approximately $13.5 billion of available capital
Alignment of Interests
$2.3 billion total invested / committed capital by Blackstone and its professionals
• 7% of total capital invested
Deep Investment Team
28 Senior Managing Directors
2
2010 Blackstone Investor Day
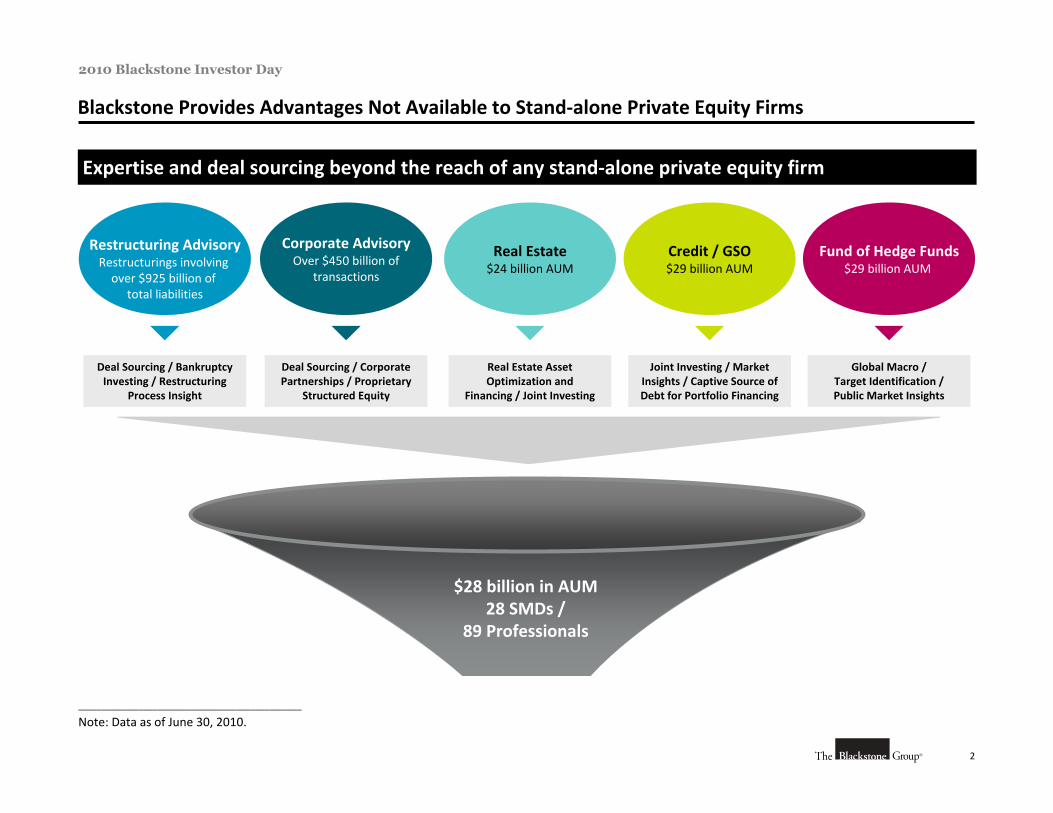
Blackstone Provides Advantages Not Available to Stand‐alone Private Equity Firms
Expertise and deal sourcing beyond the reach of any stand‐alone private equity firm
Real Estate$24 billion AUM
Restructuring AdvisoryRestructurings involving over $925 billion of
total liabilities
Corporate AdvisoryOver $450 billion of
transactions
Credit / GSO$29 billion AUM
Fund of Hedge Funds$29 billion AUM
$28 billion in AUM 28 SMDs /
89 Professionals
Global Macro /Target Identification / Public Market Insights
Joint Investing / Market Insights / Captive Source of Debt for Portfolio Financing
Real Estate Asset Optimization and
Financing / Joint Investing
Deal Sourcing / Corporate Partnerships / Proprietary
Structured Equity
Deal Sourcing / Bankruptcy Investing / Restructuring
Process Insight
________________________________________________
Note: Data as of June 30, 2010.
3
2010 Blackstone Investor Day
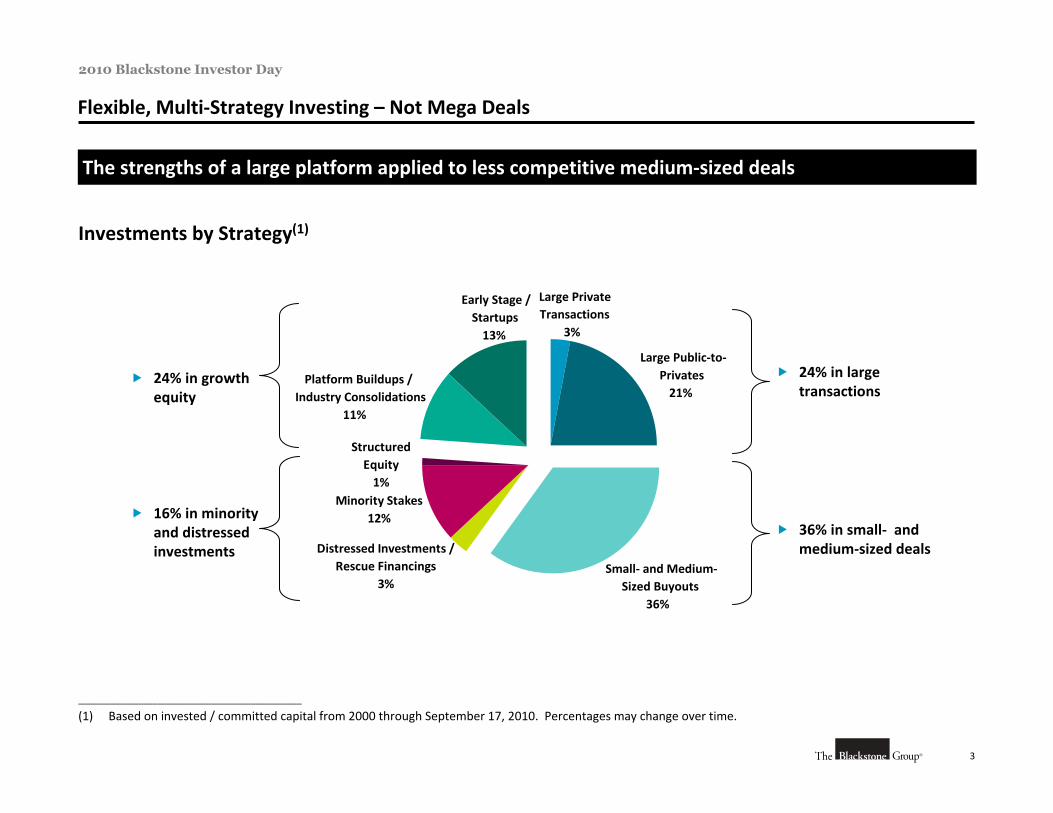
Distressed Investments /Rescue Financings
3%
Minority Stakes12%
Structured Equity1%
Flexible, Multi‐Strategy Investing – Not Mega Deals
The strengths of a large platform applied to less competitive medium‐sized deals
Investments by Strategy(1)
24% in large transactions
36% in small‐ and medium‐sized deals
24% in growth equity
16% in minority and distressed investments
________________________________________________
(1) Based on invested / committed capital from 2000 through September 17, 2010. Percentages may change over time.
Large PrivateTransactions
3%
Large Public‐to‐Privates21%
Platform Buildups /Industry Consolidations
11%
Early Stage /Startups13%
Small‐ and Medium‐Sized Buyouts
36%
4
2010 Blackstone Investor Day
BlackstoneHeadquarters
Private Equity Office
Affiliated Office
Advisors
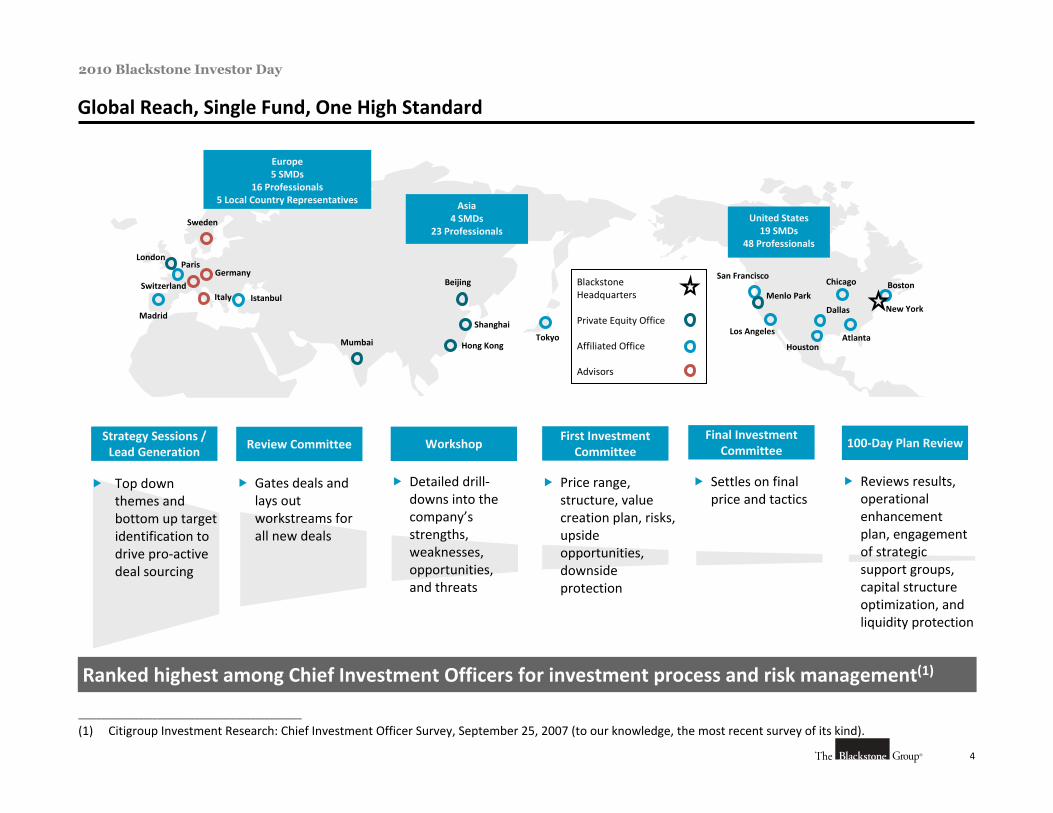
Global Reach, Single Fund, One High Standard
Paris
Mumbai Hong Kong
Madrid
GermanyBeijing
Asia4 SMDs
23 Professionals
Tokyo
IstanbulNew York
San Francisco
United States19 SMDs
48 Professionals
HoustonAtlanta
Boston
Los Angeles
Menlo Park
Dallas
Sweden
ItalySwitzerland
Shanghai
Chicago
Detailed drill‐downs into the company’s strengths, weaknesses, opportunities, and threats
Top down themes and bottom up target identification to drive pro‐active deal sourcing
Gates deals and lays out workstreams for all new deals
Price range, structure, value creation plan, risks, upside opportunities, downside protection
First InvestmentCommittee
Strategy Sessions /Lead Generation
Review Committee Workshop 100‐Day Plan ReviewFinal Investment
Committee
Settles on final price and tactics
Reviews results, operational enhancement plan, engagement of strategic support groups, capital structure optimization, and liquidity protection
Europe5 SMDs
16 Professionals5 Local Country Representatives
________________________________________________
(1) Citigroup Investment Research: Chief Investment Officer Survey, September 25, 2007 (to our knowledge, the most recent survey of its kind).
Ranked highest among Chief Investment Officers for investment process and risk management(1)
London
5
2010 Blackstone Investor Day
Consistent Investment Performance
____________________________________________
Note: Past performance is not necessarily indicative of future results. Inherent in an investment in any BCP / BCOM fund is significant risk and volatility, and there can be no assurance that any BCP / BCOM fund will achieve its objectives or avoid substantial losses.
(1) Based on each closed BCP / BCOM fund’s net IRR as of June 30, 2010 compared to Thomson Reuters’ data as of March 31, 2010, the most current data available. As BCP V is still investing, it is not considered a closed fund and is excluded from this analysis. As BCOM is a sector‐specific communications fund, BCOM’s net IRR was compared to the Thomson Reuters’ Telecom Funds Index rather than the Buyout / Mezzanine Funds Index used to compare the BCP funds.
(2) Includes investments made by Blackstone’s Side‐by‐Side investment entities; excludes LP Co‐investments. (3) S&P 500 Annual Return has been calculated as the internal rate of return of the total contributions and distributions (including fees, drawdown of expenses, return of capital and recouped losses),
and the corresponding annual rate of return of the S&P 500 Index from each contribution / distribution date to the quarter end for all investments. For BCP I and BCP II, the S&P return has been calculated from the most material investment tranche date to the final exit date for each investment. S&P 500 Annual Rate of Return is provided solely as an indication of returns that could be earned by investors by making similar investments in the S&P 500 Index. Blackstone’s funds differ from the S&P 500 Index in that, among other factors, Blackstone’s funds are actively managed entities that bear fees and use leverage.
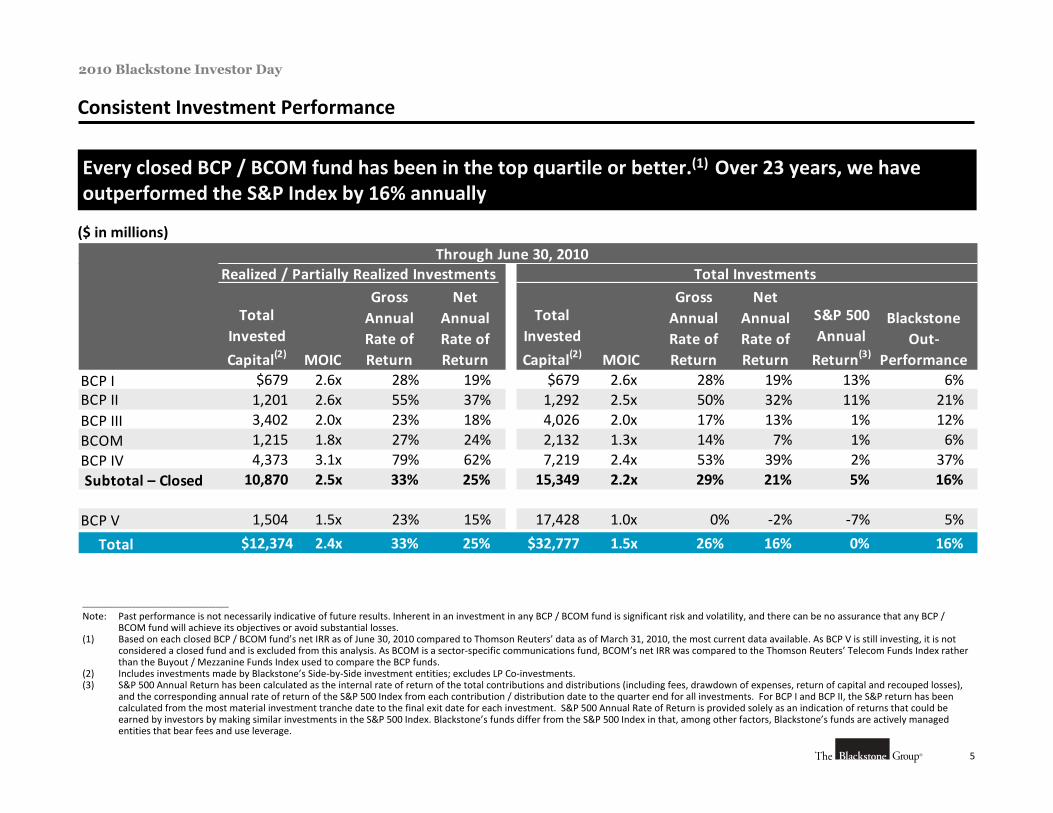
Every closed BCP / BCOM fund has been in the top quartile or better.(1) Over 23 years, we have outperformed the S&P Index by 16% annually
Realized / Partially Realized Investments Total Investments
Gross Annual Rate of Return
Total Invested
Capital(2) MOIC
Gross Annual Rate of Return
S&P 500 Annual
Return(3)
BCP I $679 2.6x 28% 19% $679 2.6x 28% 19% 13% 6%BCP II 1,201 2.6x 55% 37% 1,292 2.5x 50% 32% 11% 21%BCP III 3,402 2.0x 23% 18% 4,026 2.0x 17% 13% 1% 12%BCOM 1,215 1.8x 27% 24% 2,132 1.3x 14% 7% 1% 6%BCP IV 4,373 3.1x 79% 62% 7,219 2.4x 53% 39% 2% 37% Subtotal – Closed 10,870 2.5x 33% 25% 15,349 2.2x 29% 21% 5% 16%
BCP V 1,504 1.5x 23% 15% 17,428 1.0x 0% ‐2% ‐7% 5%
Total $12,374 2.4x 33% 25% $32,777 1.5x 26% 16% 0% 16%
Blackstone Out‐
Performance
Through June 30, 2010
Net Annual Rate of Return
Net AnnualRate ofReturnMOIC
Total Invested
Capital(2)
($ in millions)
6
2010 Blackstone Investor Day
Recent Valuation Changes
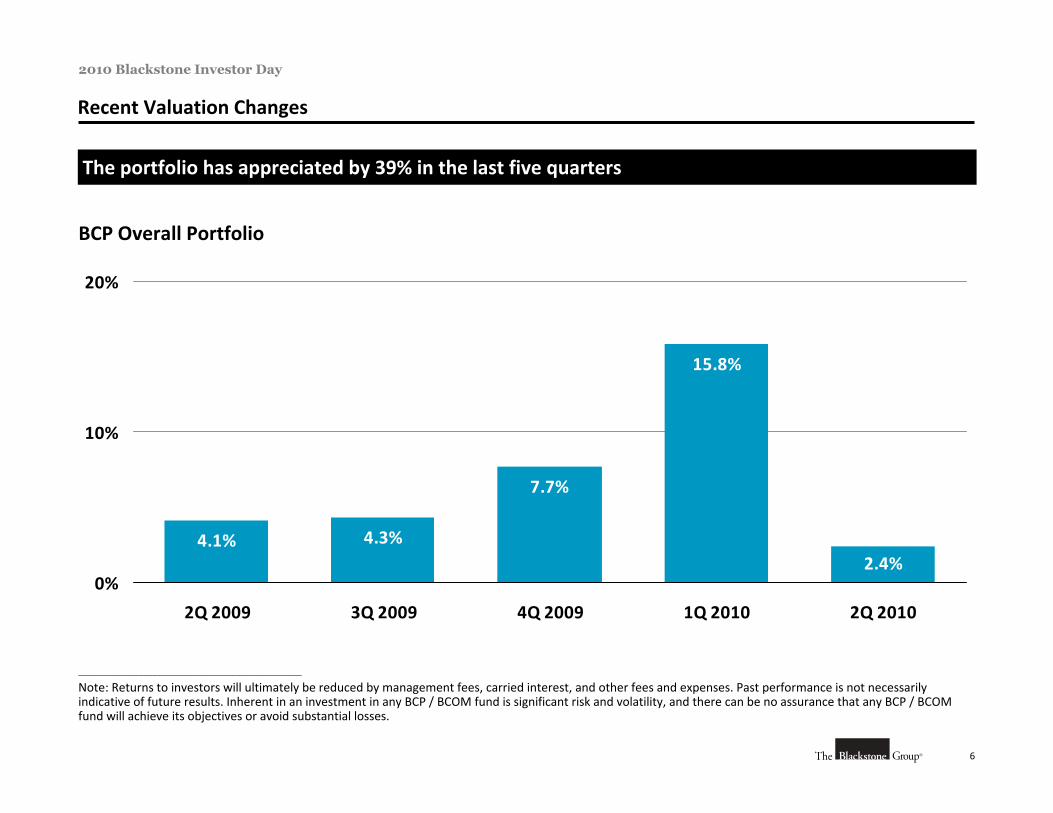
The portfolio has appreciated by 39% in the last five quarters
BCP Overall Portfolio
7.7%
15.8%
2.4%4.1% 4.3%
0%
10%
20%
2Q 2009 3Q 2009 4Q 2009 1Q 2010 2Q 2010
________________________________________________
Note: Returns to investors will ultimately be reduced by management fees, carried interest, and other fees and expenses. Past performance is not necessarily indicative of future results. Inherent in an investment in any BCP / BCOM fund is significant risk and volatility, and there can be no assurance that any BCP / BCOM fund will achieve its objectives or avoid substantial losses.
7
2010 Blackstone Investor Day
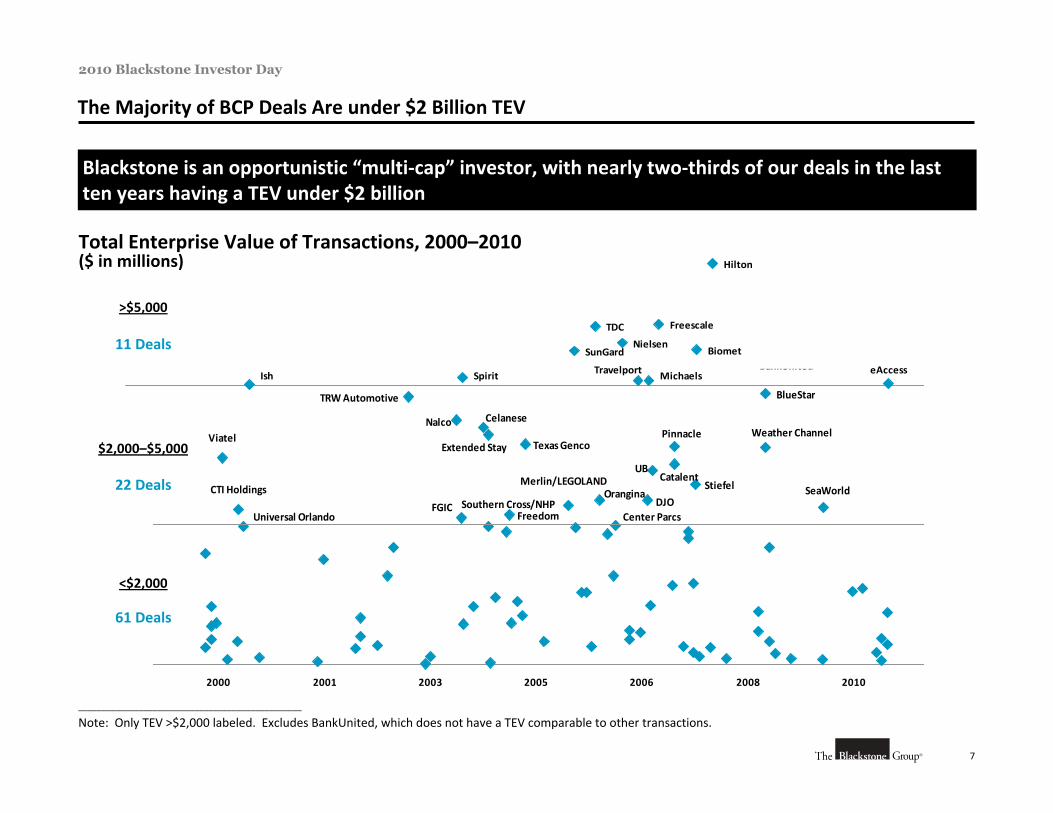
The Majority of BCP Deals Are under $2 Billion TEV
Blackstone is an opportunistic “multi‐cap” investor, with nearly two‐thirds of our deals in the last ten years having a TEV under $2 billion
________________________________________________
Note: Only TEV >$2,000 labeled. Excludes BankUnited, which does not have a TEV comparable to other transactions.
Total Enterprise Value of Transactions, 2000–2010($ in millions)
Viatel
CTI Holdings
Universal Orlando
TRW Automotive
Nalco
FGIC
Celanese
Freedom
Extended Stay
Southern Cross/NHP
Texas Genco
Merlin/LEGOLANDOrangina
Center ParcsDJO
UBCatalent
Pinnacle
Stiefel
Weather Channel
BlueStar
SeaWorld
2000 2001 2003 2005 2006 2008 2010 2011
>$5,000
$2,000–$5,000
<$2,000
11 Deals
22 Deals
61 Deals
Ish Spirit
SunGard
TDC
Nielsen
Travelport Michaels
Freescale
Biomet
Hilton
BankUnited eAccess
8
2010 Blackstone Investor Day
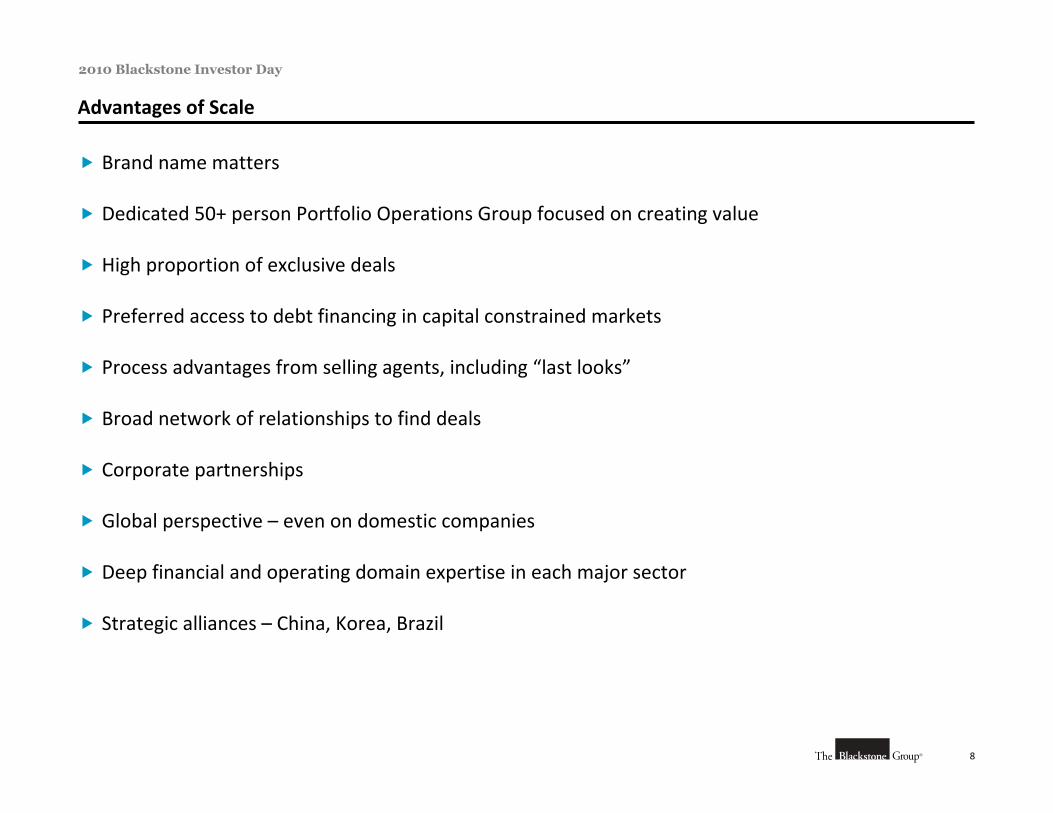
Advantages of Scale
Brand name matters
Dedicated 50+ person Portfolio Operations Group focused on creating value
High proportion of exclusive deals
Preferred access to debt financing in capital constrained markets
Process advantages from selling agents, including “last looks”
Broad network of relationships to find deals
Corporate partnerships
Global perspective – even on domestic companies
Deep financial and operating domain expertise in each major sector
Strategic alliances – China, Korea, Brazil
9
2010 Blackstone Investor Day
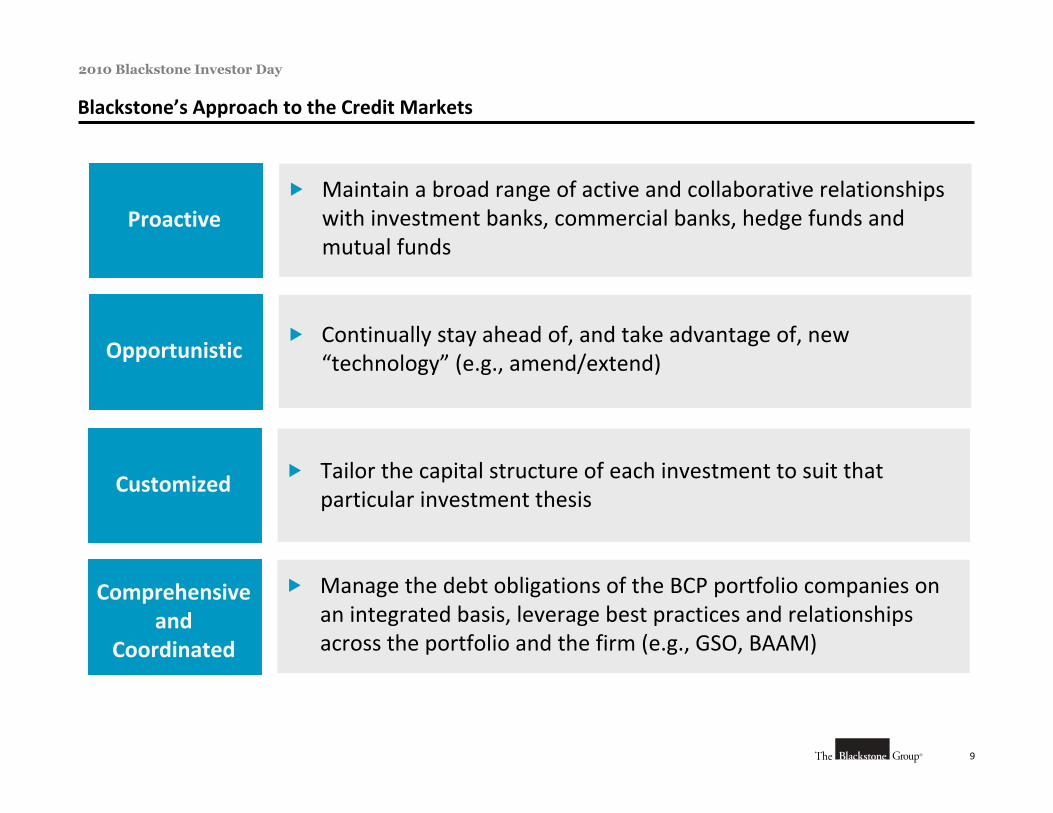
Blackstone’s Approach to the Credit Markets
Proactive Maintain a broad range of active and collaborative relationships
with investment banks, commercial banks, hedge funds and mutual funds
Opportunistic Continually stay ahead of, and take advantage of, new
“technology” (e.g., amend/extend)
Customized Tailor the capital structure of each investment to suit that particular investment thesis
Comprehensive and
Coordinated
Manage the debt obligations of the BCP portfolio companies on an integrated basis, leverage best practices and relationships across the portfolio and the firm (e.g., GSO, BAAM)
10
2010 Blackstone Investor Day
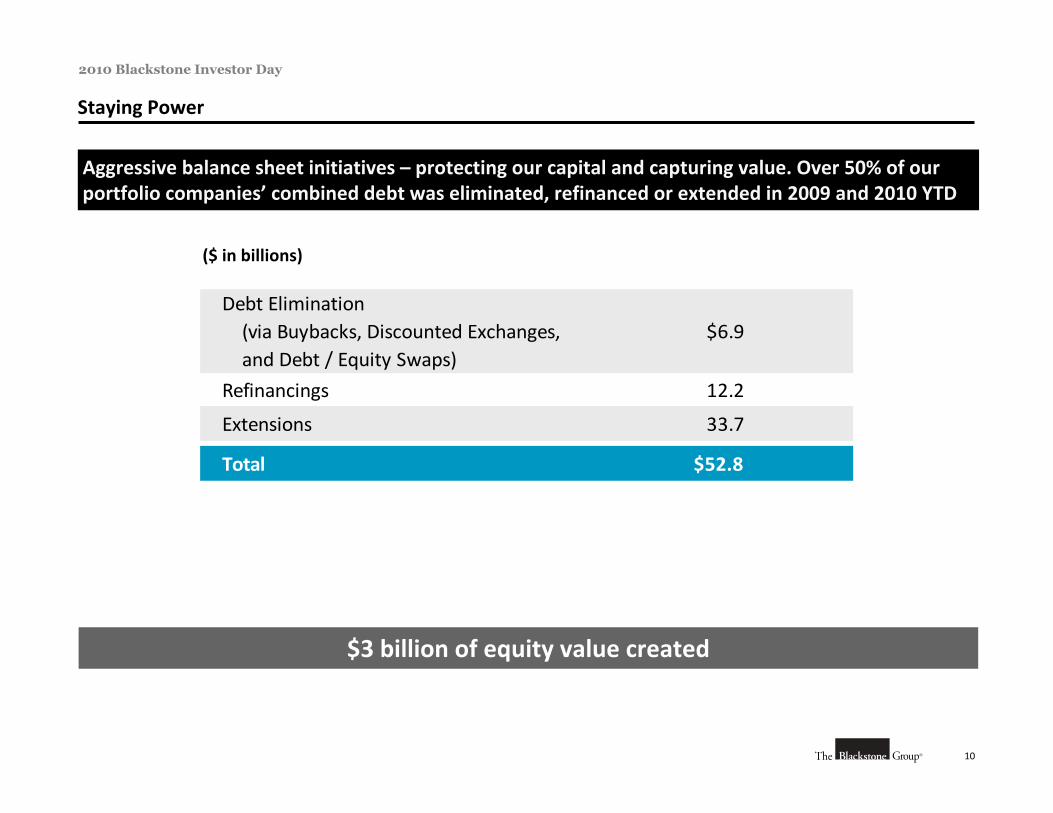
Staying Power
Aggressive balance sheet initiatives – protecting our capital and capturing value. Over 50% of our portfolio companies’ combined debt was eliminated, refinanced or extended in 2009 and 2010 YTD
($ in billions)
Debt Elimination (via Buybacks, Discounted Exchanges, and Debt / Equity Swaps)
$6.9
Refinancings 12.2
Extensions 33.7
Total $52.8
$3 billion of equity value created
11
2010 Blackstone Investor Day
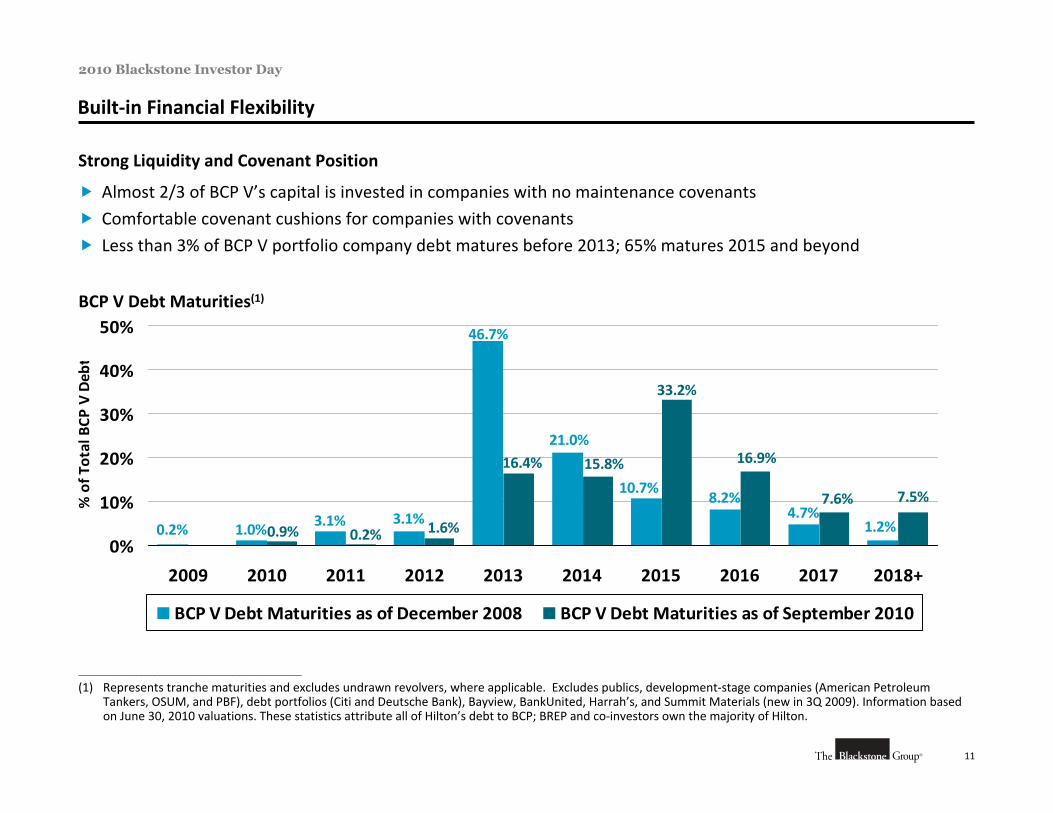
Built‐in Financial Flexibility
________________________________________________
(1) Represents tranche maturities and excludes undrawn revolvers, where applicable. Excludes publics, development‐stage companies (American Petroleum Tankers, OSUM, and PBF), debt portfolios (Citi and Deutsche Bank), Bayview, BankUnited, Harrah’s, and Summit Materials (new in 3Q 2009). Information based on June 30, 2010 valuations. These statistics attribute all of Hilton’s debt to BCP; BREP and co‐investors own the majority of Hilton.
Strong Liquidity and Covenant Position
Almost 2/3 of BCP V’s capital is invested in companies with no maintenance covenants
Comfortable covenant cushions for companies with covenants
Less than 3% of BCP V portfolio company debt matures before 2013; 65% matures 2015 and beyond
BCP V Debt Maturities(1)
7.5%
1.2%4.7%
8.2%10.7%
21.0%
46.7%
3.1%1.0%0.2% 3.1%
7.6%
16.9%
33.2%
15.8%16.4%
1.6%0.2%0.9%0%
10%
20%
30%
40%
50%
2009 2010 2011 2012 2013 2014 2015 2016 2017 2018+
% of T
otal BCP
V Deb
t
BCP V Debt Maturities as of December 2008 BCP V Debt Maturities as of September 2010
12
2010 Blackstone Investor Day
Credit Markets Outlook for BCP VI
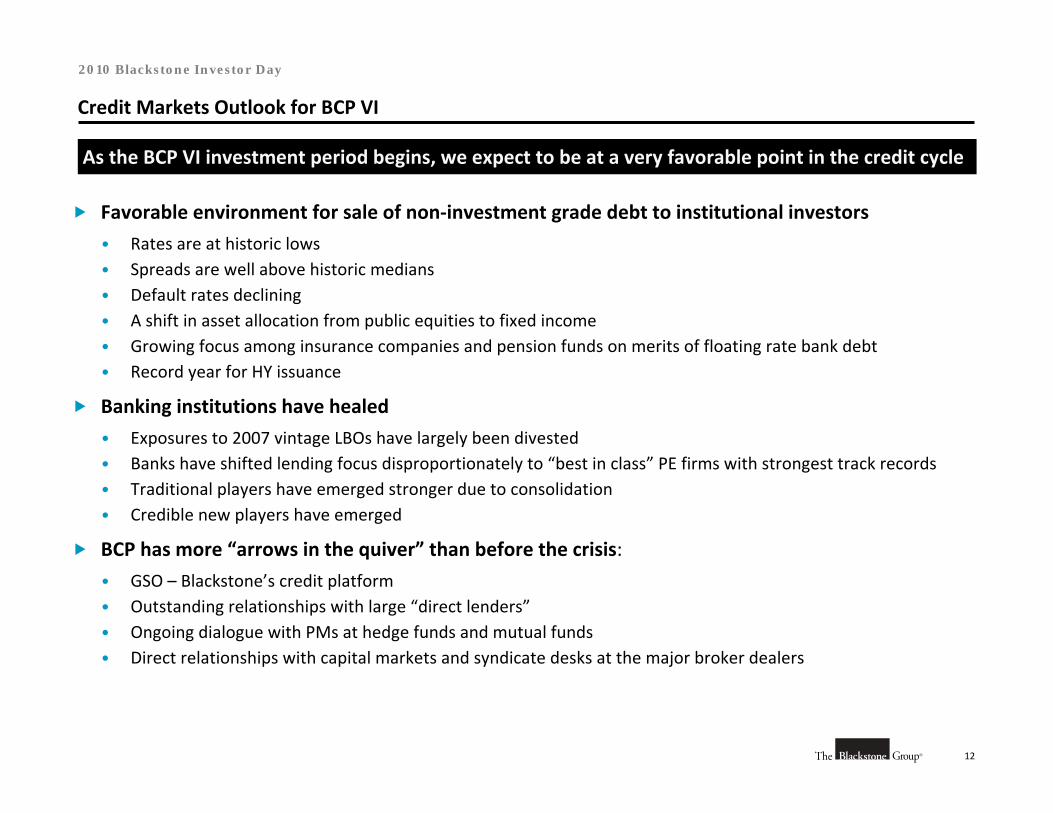
As the BCP VI investment period begins, we expect to be at a very favorable point in the credit cycle
Favorable environment for sale of non‐investment grade debt to institutional investors
• Rates are at historic lows• Spreads are well above historic medians• Default rates declining• A shift in asset allocation from public equities to fixed income• Growing focus among insurance companies and pension funds on merits of floating rate bank debt• Record year for HY issuance
Banking institutions have healed
• Exposures to 2007 vintage LBOs have largely been divested• Banks have shifted lending focus disproportionately to “best in class” PE firms with strongest track records• Traditional players have emerged stronger due to consolidation• Credible new players have emerged
BCP has more “arrows in the quiver” than before the crisis:
• GSO – Blackstone’s credit platform• Outstanding relationships with large “direct lenders”• Ongoing dialogue with PMs at hedge funds and mutual funds• Direct relationships with capital markets and syndicate desks at the major broker dealers
13
2010 Blackstone Investor Day
BCP V Outlook
We expect BCP V to generate a 2x MOIC(1)
• Average revenue and EBITDA growth rates of 5.1% and 8.3%, respectively
• Average margin improvement of 80 bps
Solid balance sheets with comfortable covenant and maturity profiles
91% of BCP V capital invested / committed
• Expect to close investment period in the next few months
________________________________________________
(1) While Blackstone currently believes that the assumptions on which this projection is based are reasonable under current circumstances, there is no guarantee that the conditions on which such assumptions are based will materialize or otherwise be applicable to these funds. There can be no assurance that any fund managed by Blackstone will be profitable or avoid substantial losses. Above projections do not include any assumptions regarding investment time horizon or the rate of return on funds managed by Blackstone. Ultimate returns to investors will be reduced by management fees, fund expenses and carried interest.”
14
2010 Blackstone Investor Day
Overview of Current Environment
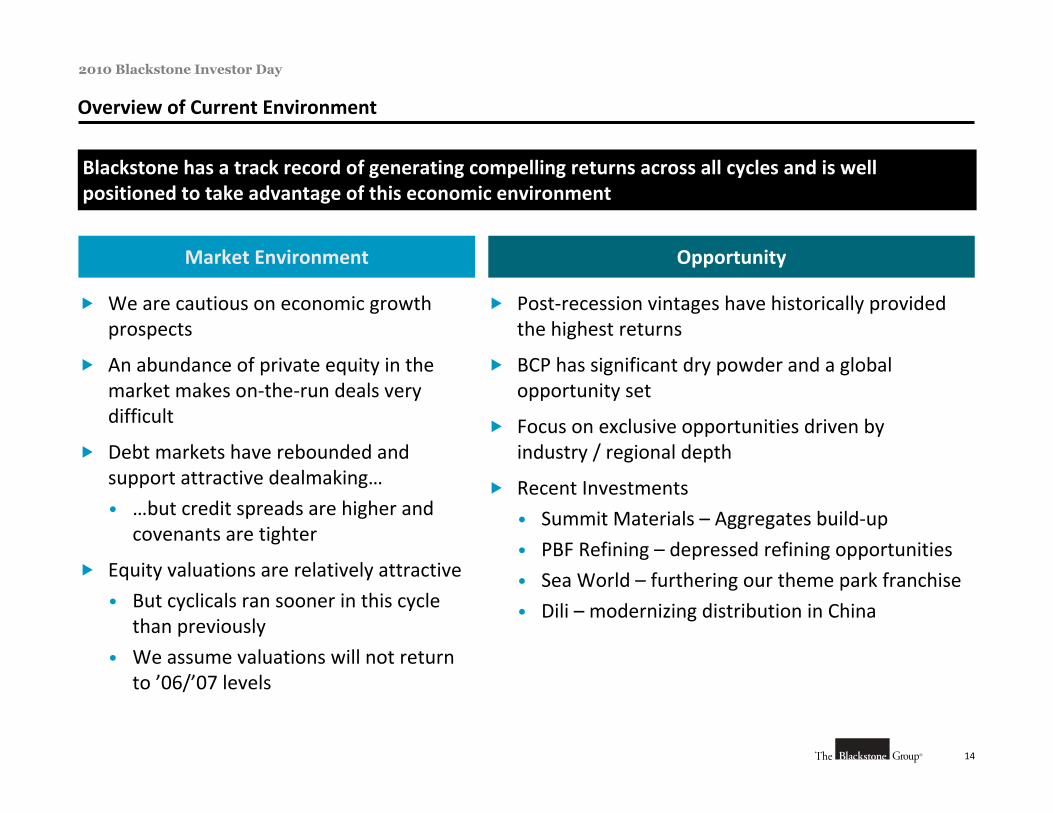
Blackstone has a track record of generating compelling returns across all cycles and is well positioned to take advantage of this economic environment
Market Environment
We are cautious on economic growth prospects
An abundance of private equity in the market makes on‐the‐run deals very difficult
Debt markets have rebounded and support attractive dealmaking…
• …but credit spreads are higher and covenants are tighter
Equity valuations are relatively attractive
• But cyclicals ran sooner in this cycle than previously
• We assume valuations will not return to ’06/’07 levels
Opportunity
Post‐recession vintages have historically provided the highest returns
BCP has significant dry powder and a global opportunity set
Focus on exclusive opportunities driven byindustry / regional depth
Recent Investments
• Summit Materials – Aggregates build‐up
• PBF Refining – depressed refining opportunities
• Sea World – furthering our theme park franchise
• Dili – modernizing distribution in China
15
2010 Blackstone Investor Day
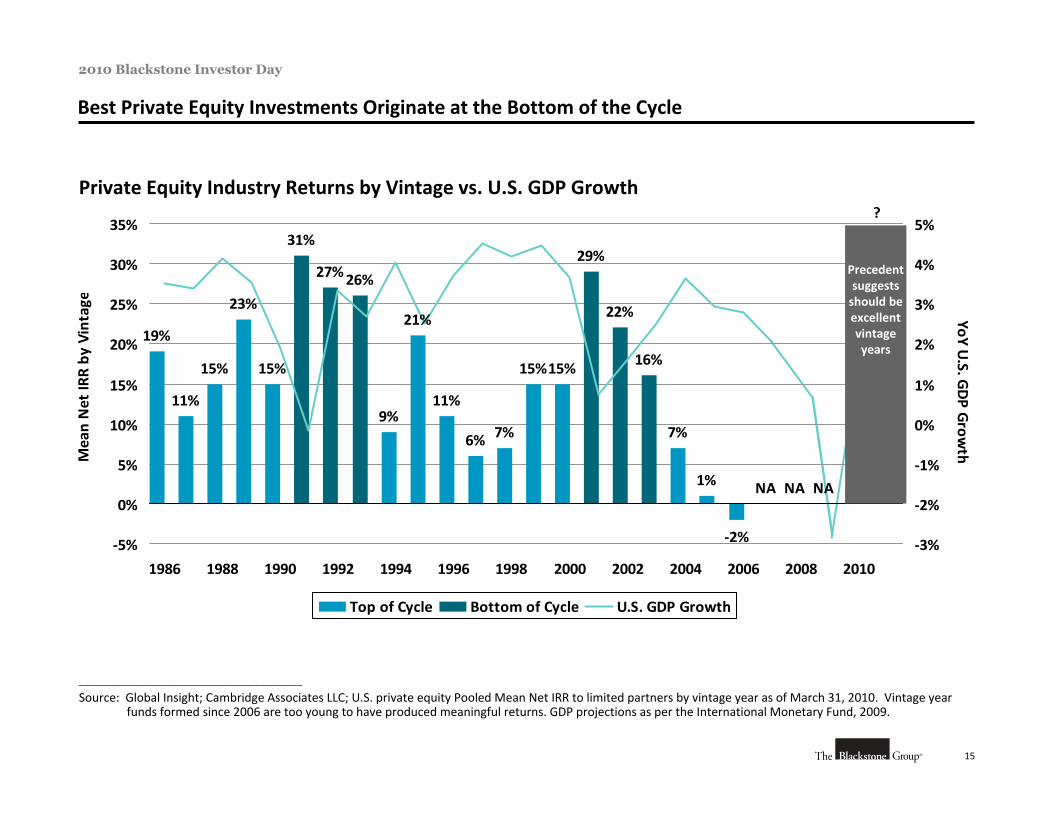
Best Private Equity Investments Originate at the Bottom of the Cycle
________________________________________________
Source: Global Insight; Cambridge Associates LLC; U.S. private equity Pooled Mean Net IRR to limited partners by vintage year as of March 31, 2010. Vintage year funds formed since 2006 are too young to have produced meaningful returns. GDP projections as per the International Monetary Fund, 2009.
Private Equity Industry Returns by Vintage vs. U.S. GDP Growth
19%
11%
15%
23%
15%
31%
27%26%
9%
21%
11%
6% 7%
15%15%
29%
22%
16%
7%
1%
‐2%
– –NA NA NA
‐5%
0%
5%
10%
15%
20%
25%
30%
35%
1986 1988 1990 1992 1994 1996 1998 2000 2002 2004 2006 2008 2010
Mean Net IR
R by
Vintage
‐3%
‐2%
‐1%
0%
1%
2%
3%
4%
5%
YoY U.S. G
DP G
rowth
Top of Cycle Bottom of Cycle U.S. GDP Growth
Precedent suggests should be excellent vintage years
?
16
2010 Blackstone Investor Day
Fundraising and New Initiatives
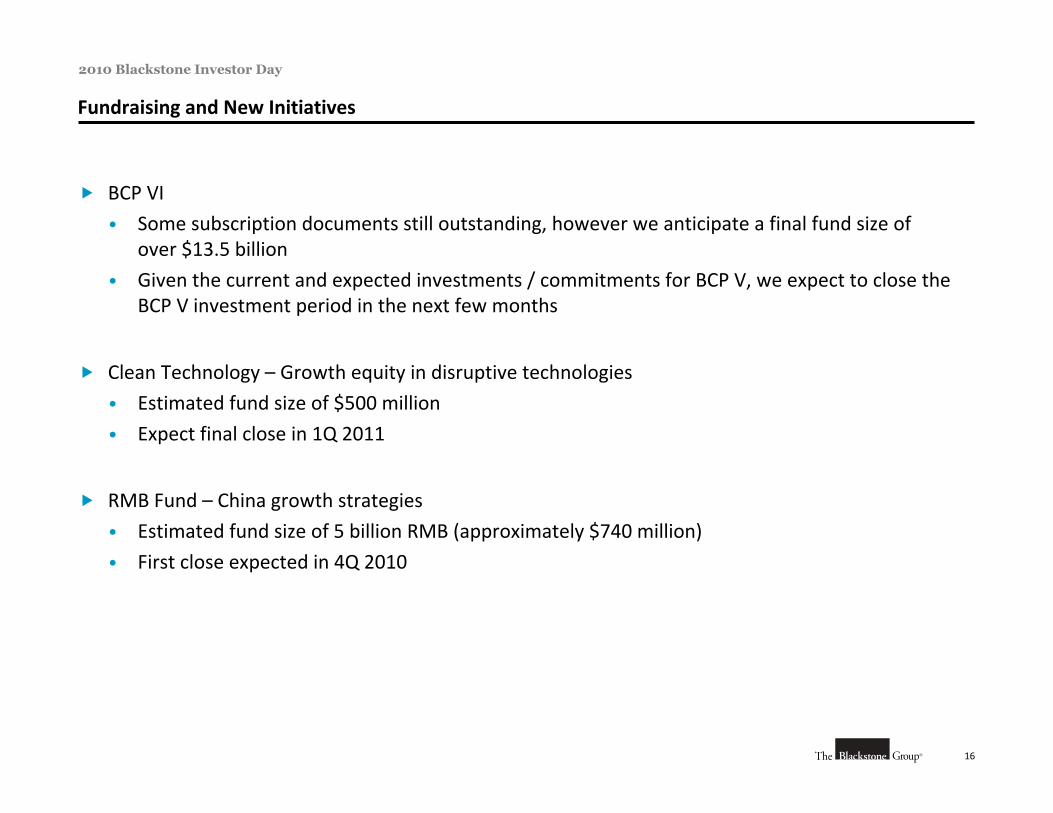
BCP VI
• Some subscription documents still outstanding, however we anticipate a final fund size of over $13.5 billion
• Given the current and expected investments / commitments for BCP V, we expect to close the BCP V investment period in the next few months
Clean Technology – Growth equity in disruptive technologies
• Estimated fund size of $500 million
• Expect final close in 1Q 2011
RMB Fund – China growth strategies
• Estimated fund size of 5 billion RMB (approximately $740 million)
• First close expected in 4Q 2010
17
2010 Blackstone Investor Day
Fundraising and New Initiatives (Cont’d)
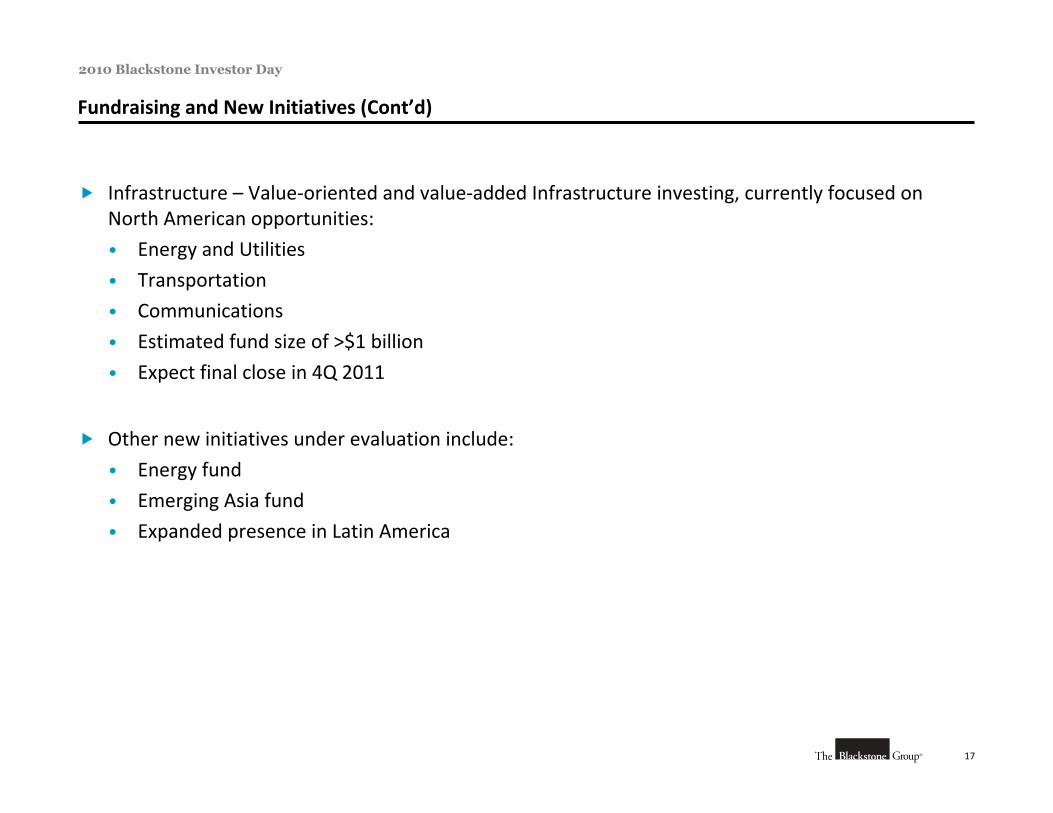
Infrastructure – Value‐oriented and value‐added Infrastructure investing, currently focused on North American opportunities:
• Energy and Utilities
• Transportation
• Communications
• Estimated fund size of >$1 billion
• Expect final close in 4Q 2011
Other new initiatives under evaluation include:
• Energy fund
• Emerging Asia fund
• Expanded presence in Latin America

V. Blackstone Advisory Partners

A. BAP Overview
2
2010 Blackstone Investor Day
A. BAP Overview
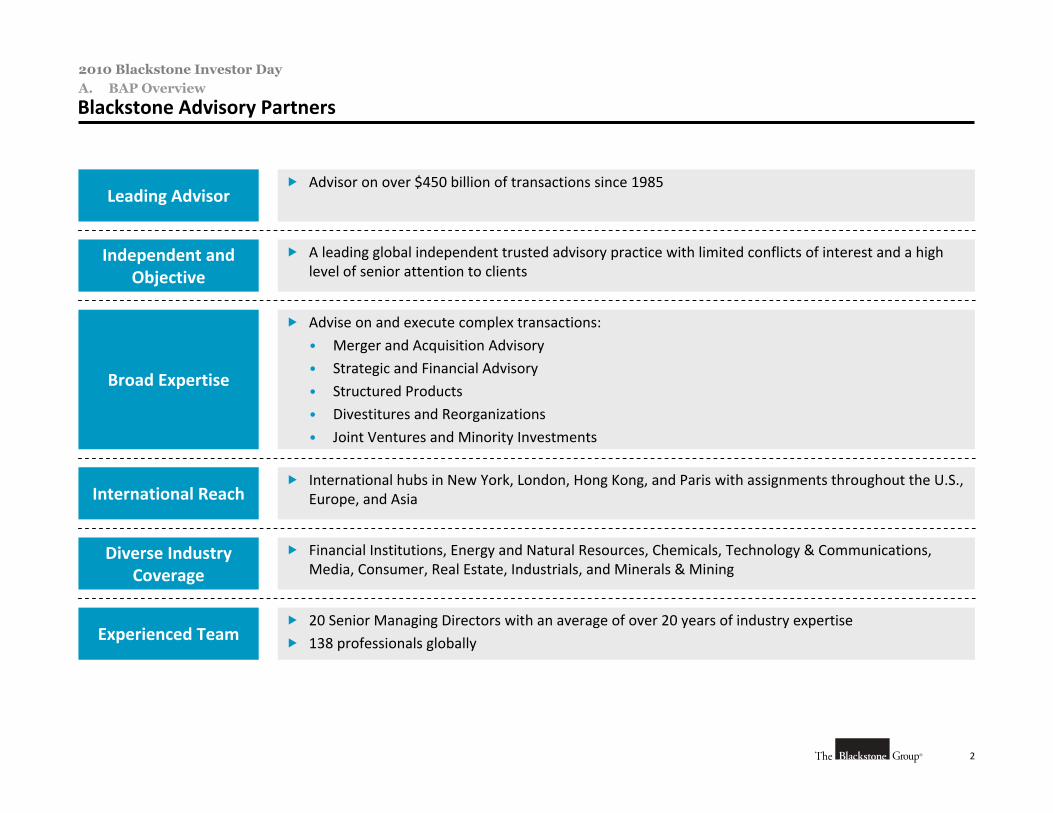
Blackstone Advisory Partners
Leading Advisor Advisor on over $450 billion of transactions since 1985
Independent and Objective
A leading global independent trusted advisory practice with limited conflicts of interest and a high level of senior attention to clients
Broad Expertise
Advise on and execute complex transactions:
• Merger and Acquisition Advisory
• Strategic and Financial Advisory
• Structured Products
• Divestitures and Reorganizations
• Joint Ventures and Minority Investments
International Reach International hubs in New York, London, Hong Kong, and Paris with assignments throughout the U.S.,
Europe, and Asia
Diverse Industry Coverage
Financial Institutions, Energy and Natural Resources, Chemicals, Technology & Communications, Media, Consumer, Real Estate, Industrials, and Minerals & Mining
Experienced Team 20 Senior Managing Directors with an average of over 20 years of industry expertise
138 professionals globally
3
2010 Blackstone Investor Day
A. BAP Overview
Overview of Blackstone Advisory Partners: Superior Investment Banking Advice
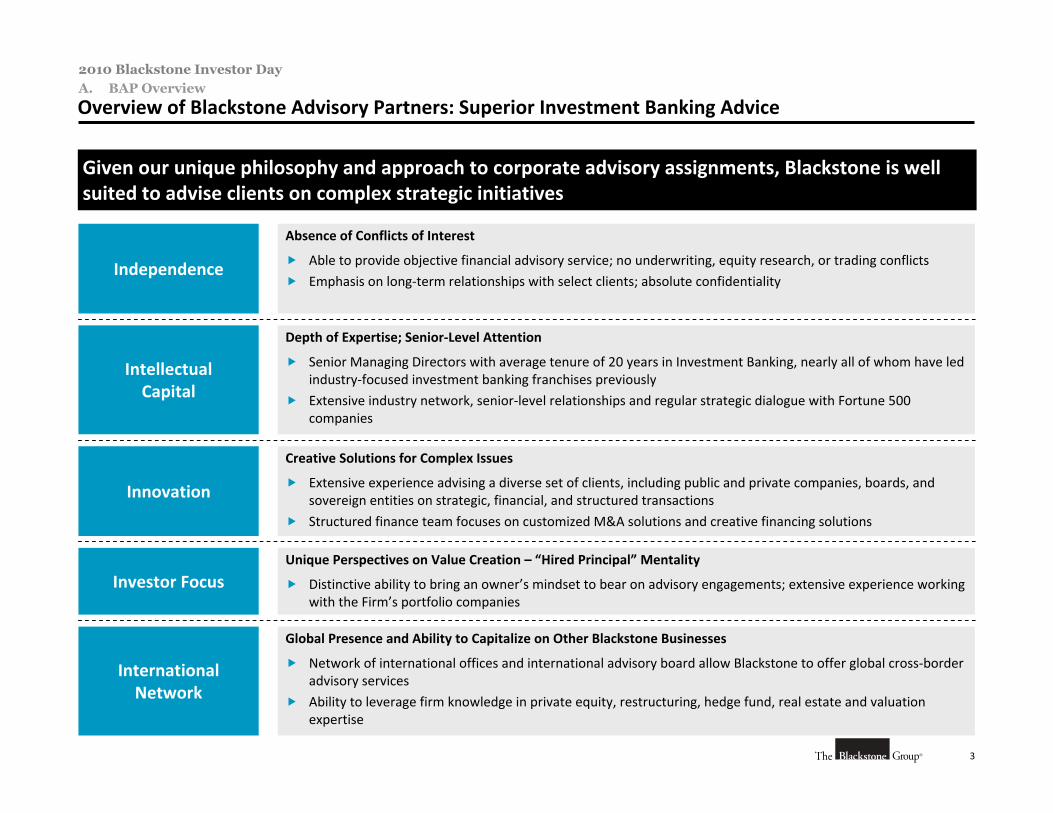
Independence
Absence of Conflicts of Interest
Able to provide objective financial advisory service; no underwriting, equity research, or trading conflicts
Emphasis on long‐term relationships with select clients; absolute confidentiality
Intellectual Capital
Depth of Expertise; Senior‐Level Attention
Senior Managing Directors with average tenure of 20 years in Investment Banking, nearly all of whom have led industry‐focused investment banking franchises previously
Extensive industry network, senior‐level relationships and regular strategic dialogue with Fortune 500 companies
Innovation
Creative Solutions for Complex Issues
Extensive experience advising a diverse set of clients, including public and private companies, boards, and sovereign entities on strategic, financial, and structured transactions
Structured finance team focuses on customized M&A solutions and creative financing solutions
Investor FocusUnique Perspectives on Value Creation – “Hired Principal” Mentality
Distinctive ability to bring an owner’s mindset to bear on advisory engagements; extensive experience working with the Firm’s portfolio companies
International Network
Global Presence and Ability to Capitalize on Other Blackstone Businesses
Network of international offices and international advisory board allow Blackstone to offer global cross‐border advisory services
Ability to leverage firm knowledge in private equity, restructuring, hedge fund, real estate and valuation expertise
Given our unique philosophy and approach to corporate advisory assignments, Blackstone is well suited to advise clients on complex strategic initiatives
4
2010 Blackstone Investor Day
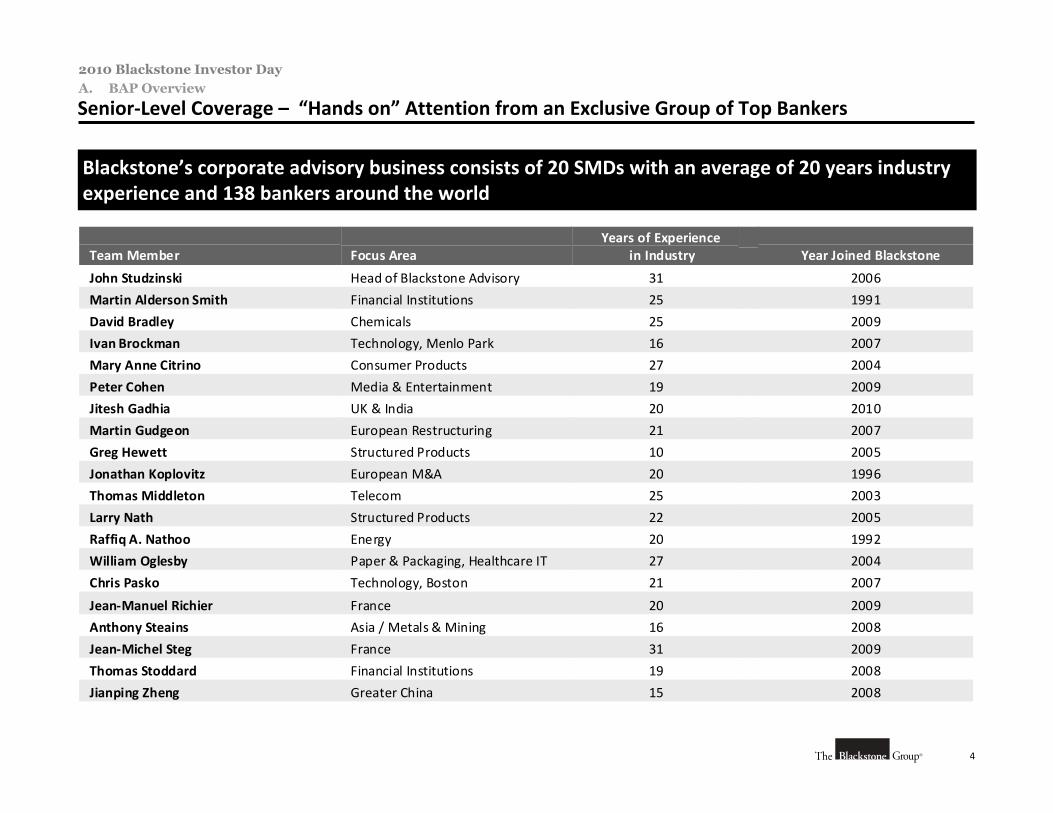
Senior‐Level Coverage – “Hands on” Attention from an Exclusive Group of Top Bankers
Blackstone’s corporate advisory business consists of 20 SMDs with an average of 20 years industry experience and 138 bankers around the world
A. BAP Overview
Team Member Focus Area
Years of Experience in Industry Year Joined Blackstone
John Studzinski Head of Blackstone Advisory 31 2006
Martin Alderson Smith Financial Institutions 25 1991
David Bradley Chemicals 25 2009
Ivan Brockman Technology, Menlo Park 16 2007
Mary Anne Citrino Consumer Products 27 2004
Peter Cohen Media & Entertainment 19 2009
Jitesh Gadhia UK & India 20 2010
Martin Gudgeon European Restructuring 21 2007
Greg Hewett Structured Products 10 2005
Jonathan Koplovitz European M&A 20 1996
Thomas Middleton Telecom 25 2003
Larry Nath Structured Products 22 2005
Raffiq A. Nathoo Energy 20 1992
William Oglesby Paper & Packaging, Healthcare IT 27 2004
Chris Pasko Technology, Boston 21 2007
Jean‐Manuel Richier France 20 2009
Anthony Steains Asia / Metals & Mining 16 2008
Jean‐Michel Steg France 31 2009
Thomas Stoddard Financial Institutions 19 2008
Jianping Zheng Greater China 15 2008
5
2010 Blackstone Investor Day
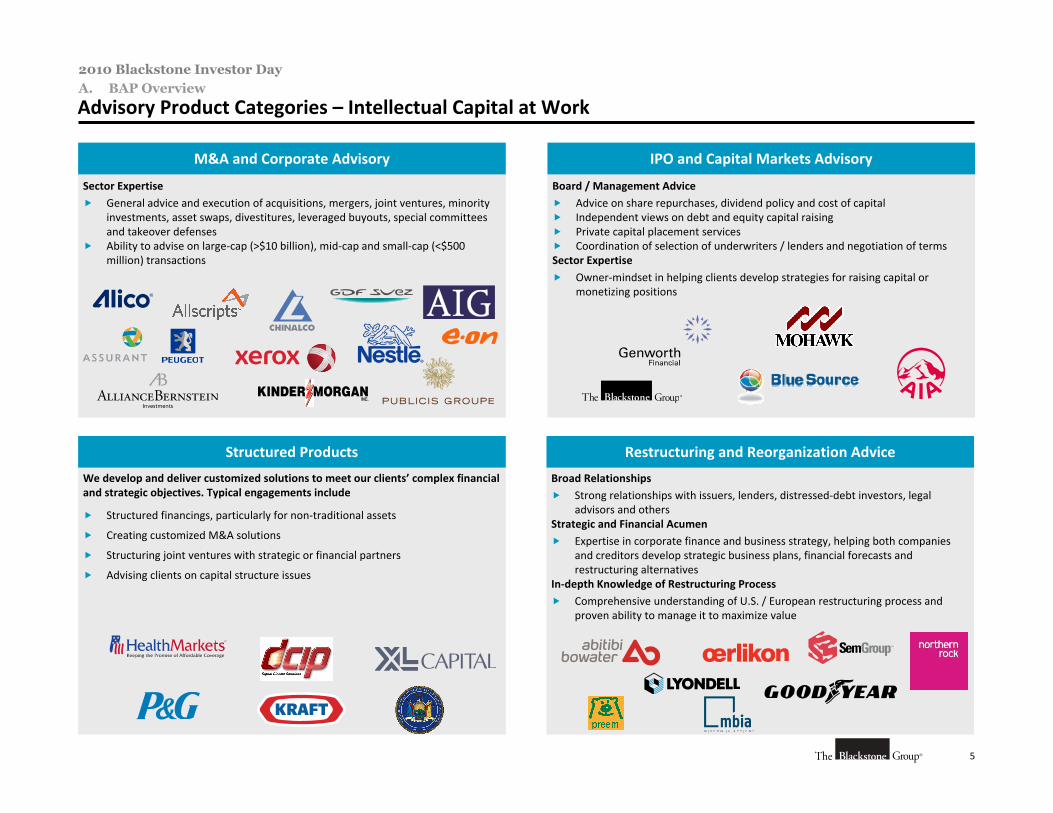
Advisory Product Categories – Intellectual Capital at Work
Sector Expertise General advice and execution of acquisitions, mergers, joint ventures, minority
investments, asset swaps, divestitures, leveraged buyouts, special committees and takeover defenses
Ability to advise on large‐cap (>$10 billion), mid‐cap and small‐cap (<$500 million) transactions
M&A and Corporate Advisory
Board / Management Advice Advice on share repurchases, dividend policy and cost of capital Independent views on debt and equity capital raising Private capital placement services Coordination of selection of underwriters / lenders and negotiation of termsSector Expertise
Owner‐mindset in helping clients develop strategies for raising capital or monetizing positions
IPO and Capital Markets Advisory
Broad Relationships Strong relationships with issuers, lenders, distressed‐debt investors, legal
advisors and othersStrategic and Financial Acumen Expertise in corporate finance and business strategy, helping both companies
and creditors develop strategic business plans, financial forecasts and restructuring alternatives
In‐depth Knowledge of Restructuring Process Comprehensive understanding of U.S. / European restructuring process and
proven ability to manage it to maximize value
Restructuring and Reorganization Advice
A. BAP Overview
We develop and deliver customized solutions to meet our clients’ complex financial and strategic objectives. Typical engagements include
Structured financings, particularly for non‐traditional assets
Creating customized M&A solutions
Structuring joint ventures with strategic or financial partners
Advising clients on capital structure issues
Structured Products
6
2010 Blackstone Investor Day
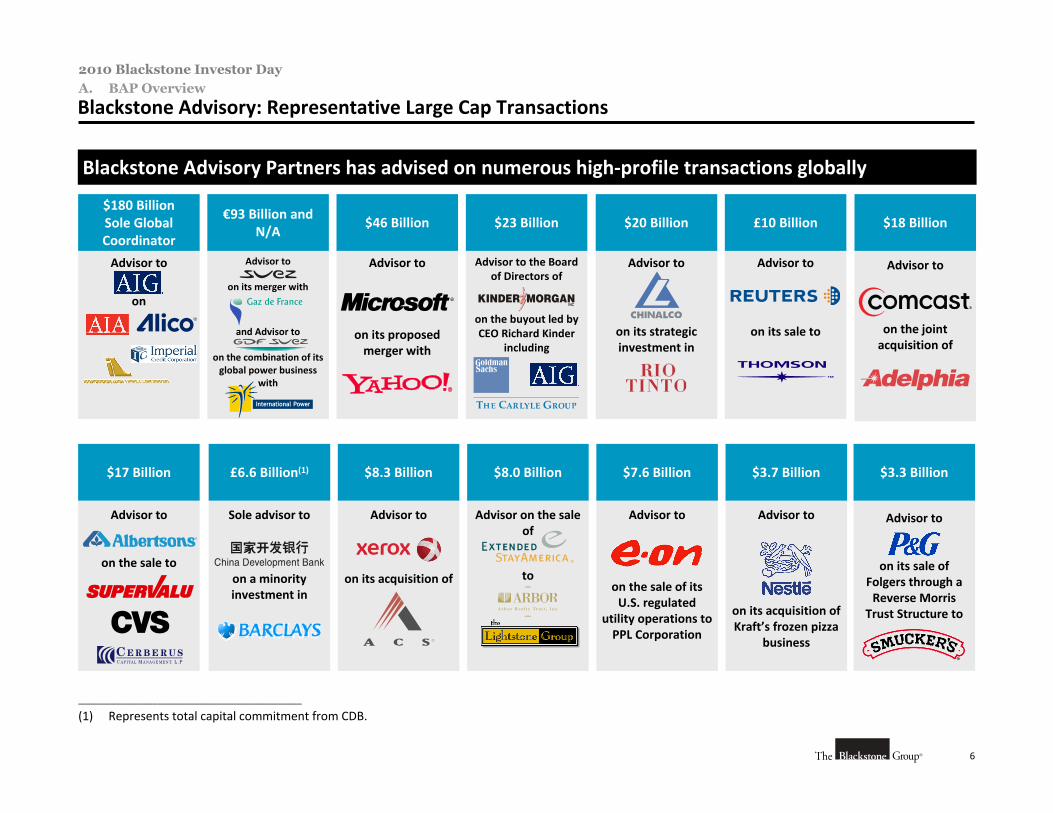
Blackstone Advisory: Representative Large Cap Transactions
Blackstone Advisory Partners has advised on numerous high‐profile transactions globally
________________________________________________
(1) Represents total capital commitment from CDB.
Advisor to
on
$180 BillionSole Global Coordinator
Advisor to
on its acquisition of
$8.3 Billion
Advisor to
on its acquisition ofKraft’s frozen pizza
business
$3.7 Billion
Advisor to
on the sale of its U.S. regulated
utility operations to PPL Corporation
$7.6 Billion
Advisor to
on its merger with
and Advisor to
on the combination of its global power business
with
€93 Billion and N/A
Sole advisor to
on a minority investment in
£6.6 Billion(1)
Advisor to
on its sale to
£10 Billion
Advisor to
on its proposed merger with
$46 Billion
Advisor to the Board of Directors of
on the buyout led by CEO Richard Kinder
including
$23 Billion
Advisor to
on the joint acquisition of
$18 Billion
Advisor to
on the sale to
$17 Billion
Advisor on the sale of
to
$8.0 Billion
Advisor to
on its strategic investment in
$20 Billion
A. BAP Overview
Advisor to
on its sale of Folgers through a Reverse Morris
Trust Structure to
$3.3 Billion

B. BAP Highlights
8
2010 Blackstone Investor Day
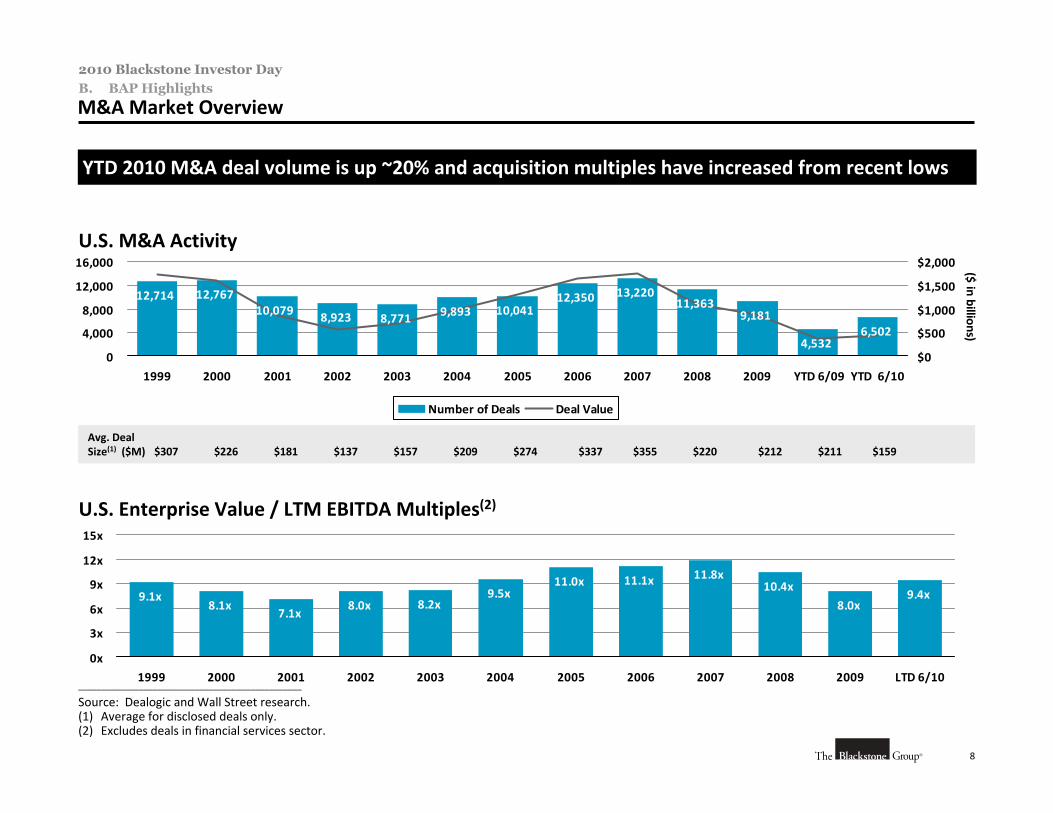
M&A Market OverviewB. BAP Highlights
________________________________________________
Source: Dealogic and Wall Street research.(1) Average for disclosed deals only.(2) Excludes deals in financial services sector.
U.S. M&A Activity
10,079 8,923 8,771 9,893 10,04112,350 13,220
11,3639,181
4,5326,502
12,76712,714
0
4,000
8,000
12,000
16,000
1999 2000 2001 2002 2003 2004 2005 2006 2007 2008 2009 YTD 6/09 YTD 6/10
$0
$500
$1,000
$1,500
$2,000 ($ in billions)
Number of Deals Deal Value
U.S. Enterprise Value / LTM EBITDA Multiples(2)
7.1x8.0x 8.2x
9.5x11.0x 11.1x 11.8x
10.4x
8.0x9.4x
8.1x9.1x
0x
3x
6x
9x
12x
15x
1999 2000 2001 2002 2003 2004 2005 2006 2007 2008 2009 LTD 6/10
YTD 2010 M&A deal volume is up ~20% and acquisition multiples have increased from recent lows
Avg. DealSize(1) ($M) $307 $226 $181 $137 $157 $209 $274 $337 $355 $220 $212 $211 $159
9
2010 Blackstone Investor Day
M&A Market Overview (Cont’d)
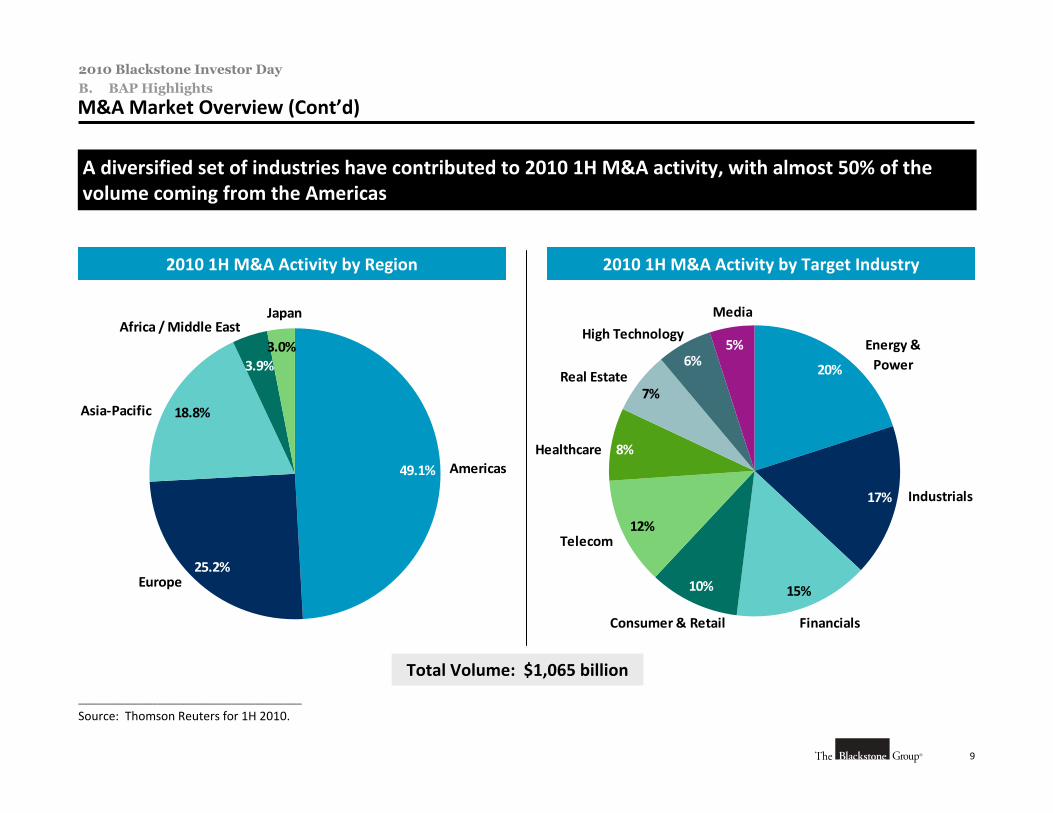
2010 1H M&A Activity by Region 2010 1H M&A Activity by Target Industry
3.9%3.0%
18.8%
25.2%
49.1% Americas
Europe
Asia‐Pacific
Africa / Middle EastJapan
5%
20%
17%
15%
12%
7%
6%
8%
10%
Energy & Power
Industrials
FinancialsConsumer & Retail
Telecom
Healthcare
Real Estate
High Technology
Media
Total Volume: $1,065 billion
________________________________________________
Source: Thomson Reuters for 1H 2010.
B. BAP Highlights
A diversified set of industries have contributed to 2010 1H M&A activity, with almost 50% of the volume coming from the Americas
10
2010 Blackstone Investor Day
BAP Market OverviewB. BAP Highlights
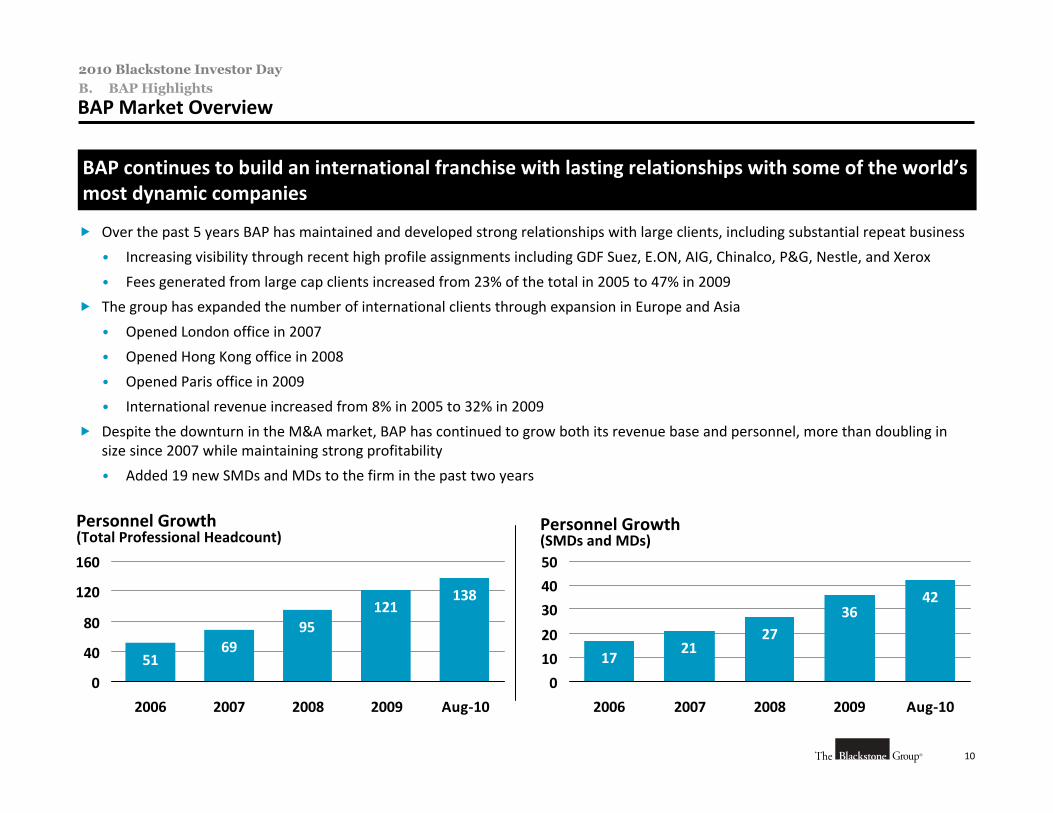
Personnel Growth (Total Professional Headcount)
138121
9569
51
0
40
80
120
160
2006 2007 2008 2009 Aug‐10
Personnel Growth(SMDs and MDs)
BAP continues to build an international franchise with lasting relationships with some of the world’s most dynamic companies
Over the past 5 years BAP has maintained and developed strong relationships with large clients, including substantial repeat business
• Increasing visibility through recent high profile assignments including GDF Suez, E.ON, AIG, Chinalco, P&G, Nestle, and Xerox
• Fees generated from large cap clients increased from 23% of the total in 2005 to 47% in 2009
The group has expanded the number of international clients through expansion in Europe and Asia
• Opened London office in 2007
• Opened Hong Kong office in 2008
• Opened Paris office in 2009
• International revenue increased from 8% in 2005 to 32% in 2009
Despite the downturn in the M&A market, BAP has continued to grow both its revenue base and personnel, more than doubling in size since 2007 while maintaining strong profitability
• Added 19 new SMDs and MDs to the firm in the past two years
4236
2721
17
0
10
20
30
40
50
2006 2007 2008 2009 Aug‐10
11
2010 Blackstone Investor Day
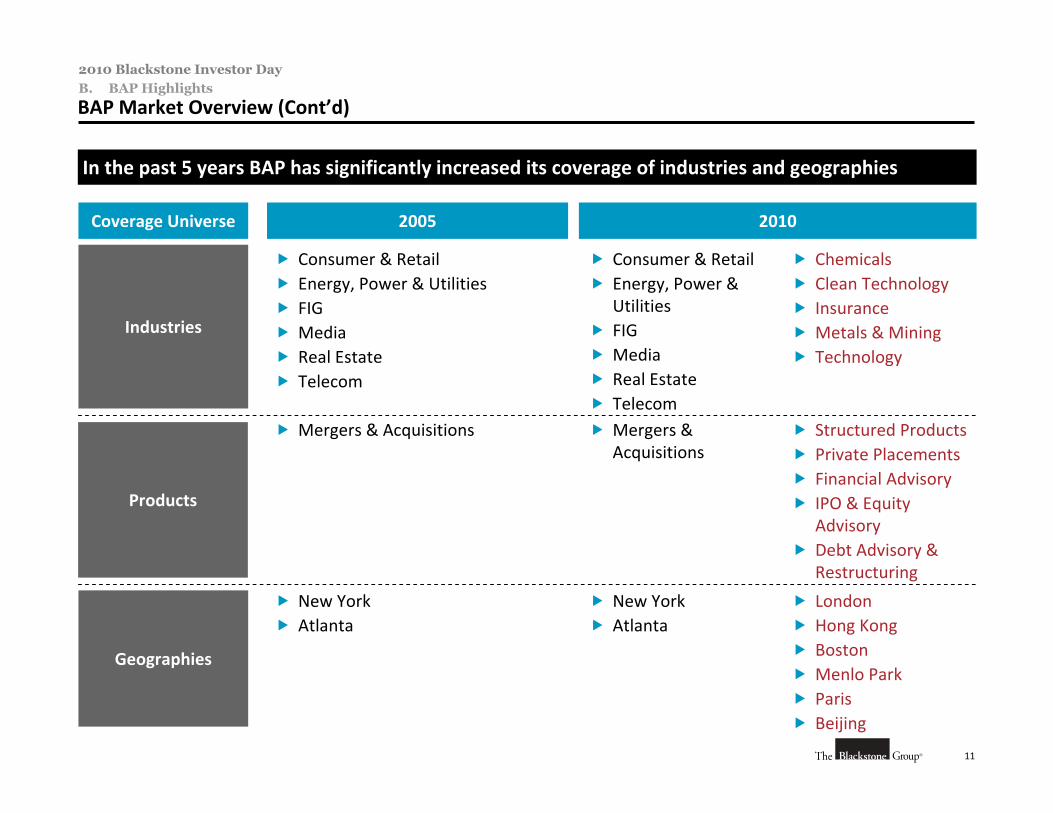
BAP Market Overview (Cont’d)B. BAP Highlights
In the past 5 years BAP has significantly increased its coverage of industries and geographies
2005 2010Coverage Universe
Industries
Products
Geographies
Consumer & Retail Energy, Power & Utilities FIG Media Real Estate Telecom
Consumer & Retail Energy, Power &
Utilities FIG Media Real Estate Telecom
Chemicals Clean Technology Insurance Metals & Mining Technology
Mergers & Acquisitions Mergers & Acquisitions
Structured Products Private Placements Financial Advisory IPO & Equity
Advisory Debt Advisory &
Restructuring
New York Atlanta
New York Atlanta
London Hong Kong Boston Menlo Park Paris Beijing
12
2010 Blackstone Investor Day
2009 and 2010 YTD Performance SummaryB. BAP Highlights
Despite a challenging macro environment, BAP recorded year‐over‐year growth in 2009 and is well positioned for strong performance in 2010
2009 highlights included:
• Year‐over‐year revenue growth, despite M&A market slowdown
• Added 4 new SMDs
• Geographic expansion with the opening of Paris office, increased German presence and build‐out of Asia offices
• Bolstered capabilities in FIG, Chemicals, and Media
• Maintained strong revenue / SMD relative to competitors
2010 achievements included:
• Top 10 ranking in M&A league tables in 1Q
• Strong pipeline of over 100 projects
• Diverse transaction base across industries and geographies
• Expanded European and Asian business
• Approximately 50% of deals have an international component
13
2010 Blackstone Investor Day
B. BAP Highlights
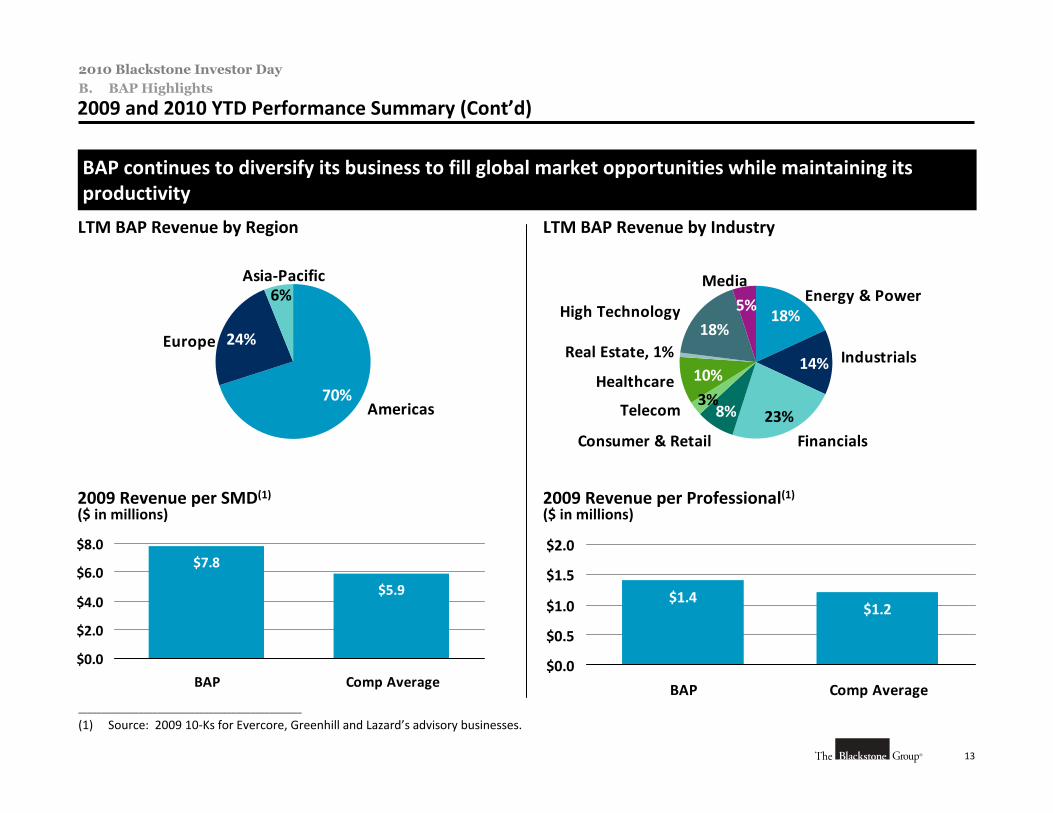
BAP continues to diversify its business to fill global market opportunities while maintaining its productivity
70%
6%
24%
Americas
Europe
Asia‐Pacific
LTM BAP Revenue by IndustryLTM BAP Revenue by Region
$7.8
$5.9
$0.0
$2.0
$4.0
$6.0
$8.0
BAP Comp Average
2009 Revenue per SMD(1)
($ in millions)
$1.4$1.2
$0.0
$0.5
$1.0
$1.5
$2.0
BAP Comp Average
2009 Revenue per Professional(1)($ in millions)
________________________________________________
(1) Source: 2009 10‐Ks for Evercore, Greenhill and Lazard’s advisory businesses.
5%18%
23%3%
18%
14%
8%
10%
Energy & Power
Industrials
FinancialsConsumer & Retail
Telecom
Healthcare
Real Estate, 1%
High Technology
Media
2009 and 2010 YTD Performance Summary (Cont’d)
14
2010 Blackstone Investor Day
Key Initiatives for 2011B. BAP Highlights
BAP stands uniquely positioned and ready to capitalize on the global recovery, with a number of key initiatives for 2011
Recent trends suggest an increase in M&A volume in Fall 2010/2011
• Opening of credit markets has encouraged strategics and financials to pursue new deals
• Emerging market M&A is increasing; Blackstone’s international presence and strong brand allow it to benefit
Continued turmoil and uncertainty at larger firms provides business and hiring opportunities for BAP
• Boutique M&A market share has increased over the past decade
• Major dealmakers at large banks have been moving to smaller advisory firms at record levels
2011 areas of focus include:
• Europe: Germany and potential alliances for other jurisdictions (Eastern and Southern Europe)
• Growth in Asian presence, plus new expansion into Australia
• Further focus on BRIC markets
• Opportunistic expansion in select industry verticals
– Healthcare
– Natural Resources / Oil & Gas
– Industrials
• Globalizing major industry verticals, including FIG, Consumer Products

VI. Restructuring & Reorganization Advisory

A. Restructuring Group Overview
2
2010 Blackstone Investor Day
A. Restructuring Group Overview
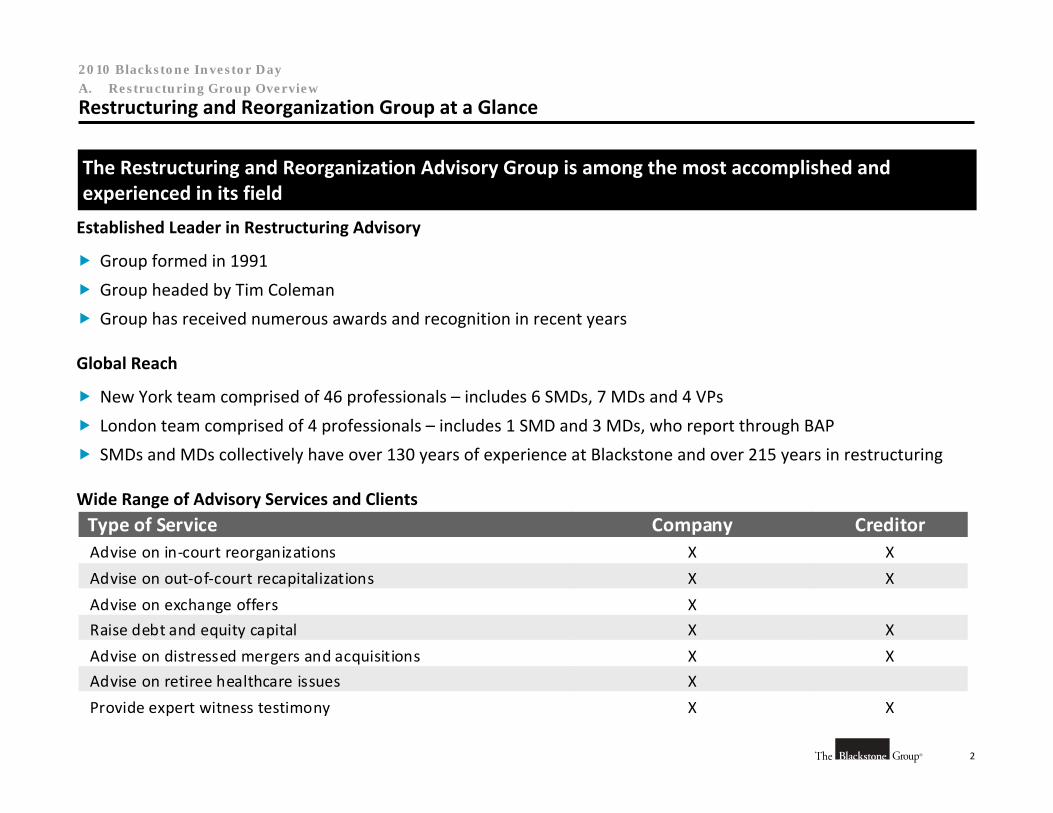
Restructuring and Reorganization Group at a Glance
The Restructuring and Reorganization Advisory Group is among the most accomplished and experienced in its field
Established Leader in Restructuring Advisory
Group formed in 1991
Group headed by Tim Coleman
Group has received numerous awards and recognition in recent years
Global Reach
New York team comprised of 46 professionals – includes 6 SMDs, 7 MDs and 4 VPs
London team comprised of 4 professionals – includes 1 SMD and 3 MDs, who report through BAP
SMDs and MDs collectively have over 130 years of experience at Blackstone and over 215 years in restructuring
Wide Range of Advisory Services and ClientsType of Service Company CreditorAdvise on in‐court reorganizations X X
Advise on out‐of‐court recapitalizations X X
Advise on exchange offers X
Raise debt and equity capital X X
Advise on distressed mergers and acquisitions X X
Advise on retiree healthcare issues X
Provide expert witness testimony X X
3
2010 Blackstone Investor Day
A. Restructuring Group Overview
Highly Experienced Team
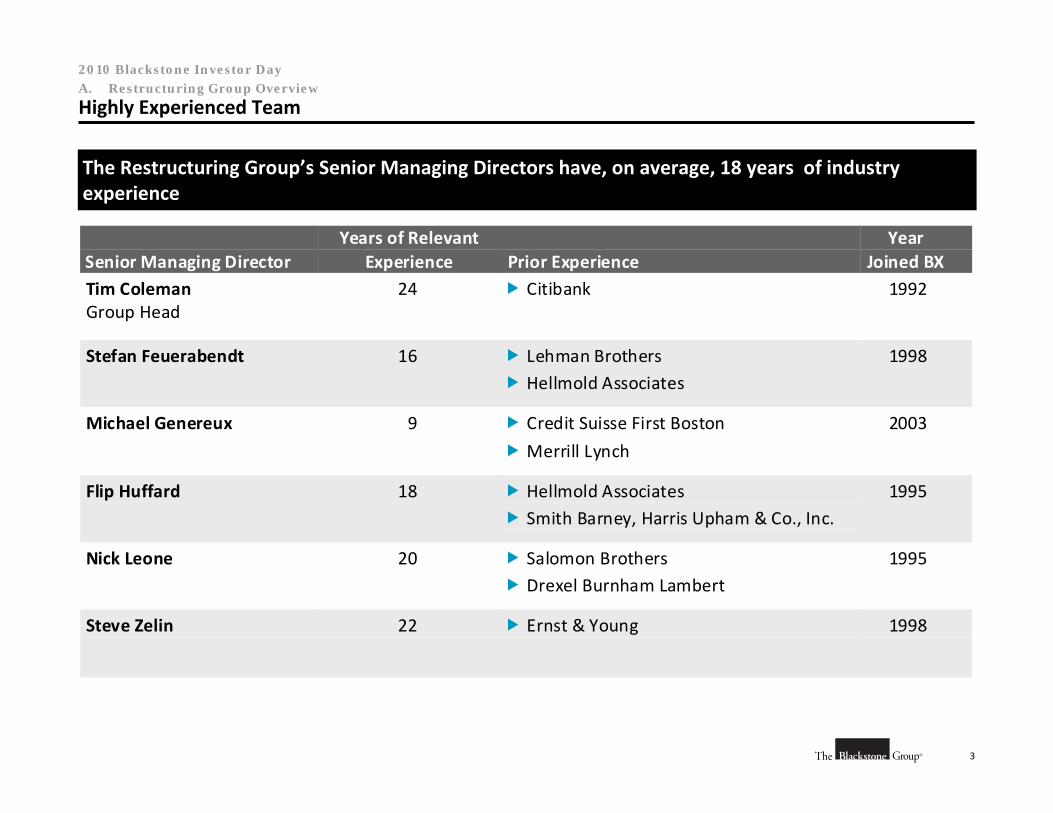
The Restructuring Group’s Senior Managing Directors have, on average, 18 years of industry experience
Senior Managing Director Years of Relevant
Experience Prior Experience Year
Joined BX Tim Coleman Group Head
24 Citibank 1992
Stefan Feuerabendt 16 Lehman Brothers Hellmold Associates
1998
Michael Genereux 9 Credit Suisse First Boston Merrill Lynch
2003
Flip Huffard 18 Hellmold Associates Smith Barney, Harris Upham & Co., Inc.
1995
Nick Leone 20 Salomon Brothers Drexel Burnham Lambert
1995
Steve Zelin 22 Ernst & Young 1998
4
2010 Blackstone Investor Day
A. Restructuring Group Overview
Blackstone Restructuring Recognition
Blackstone’s restructuring advisory efforts have received substantial praise over recent years
Thomson’s International Financing Review
Awarded “Restructuring Deal of the Year” in 2009 for the Ford Motor Company tender offer and deleveraging transactions
Awarded “Restructuring of the Year” in 2008 for the restructuring of Credit‐Based Asset Servicing and Securitization LLC (“C‐BASS”)
Named “North American Restructuring House of the Year” for the years 2004 and 2005
Turnaround Atlas Awards
Awarded “Turnaround of the Year” ($5+ billion) and “Automotive Industry & Services Deal of the Year” in 2010 for the restructuring of Ford Motor Company
Awarded “Turnaround of the Year” ($1+ billion) in 2010 for the SemGroup Corporation reorganization
Awarded “Corporate Turnaround Deal of the Year” ($500+ million) in 2010 for the restructuring of Merisant Company
Awarded “Beverage, Food & Service Deal of the Year” in 2009 for the reorganization of Mrs. Fields Companies
Turnaround Management Association
Awarded “Mega Company Turnaround of the Year” in 2007 for the Winn‐Dixie Stores reorganization
5
2010 Blackstone Investor Day
A. Restructuring Group Overview
Restructuring and Reorganization Group Role
We provide clients a wide range of advisory services including, but not limited to, the following:
Advise on out‐of‐court recapitalizations and in‐court reorganizations
• Develop strategic business plans, financial forecasts and liquidity forecasts
• Analyze complex legal and capital structures
• Perform complex valuation assignments
• Negotiate consensual solutions in complex and often contentious distressed situations
Advise on exchange offers
Advise on capital markets transactions, including raising all forms of capital
• Debtor‐in‐possession financing
• Secured financing
• Second lien
• Other subordinated debt and equity
Advise on mergers, acquisitions and divestitures of assets or operations
• Divest businesses or other assets in court and out of court
• Advise on mergers and other combinations
• Advise buyers of distressed companies and distressed assets
Advise on pension and retiree healthcare issues
Provide expert witness testimony
6
2010 Blackstone Investor Day
A. Restructuring Group Overview
Selected Restructuring Clients
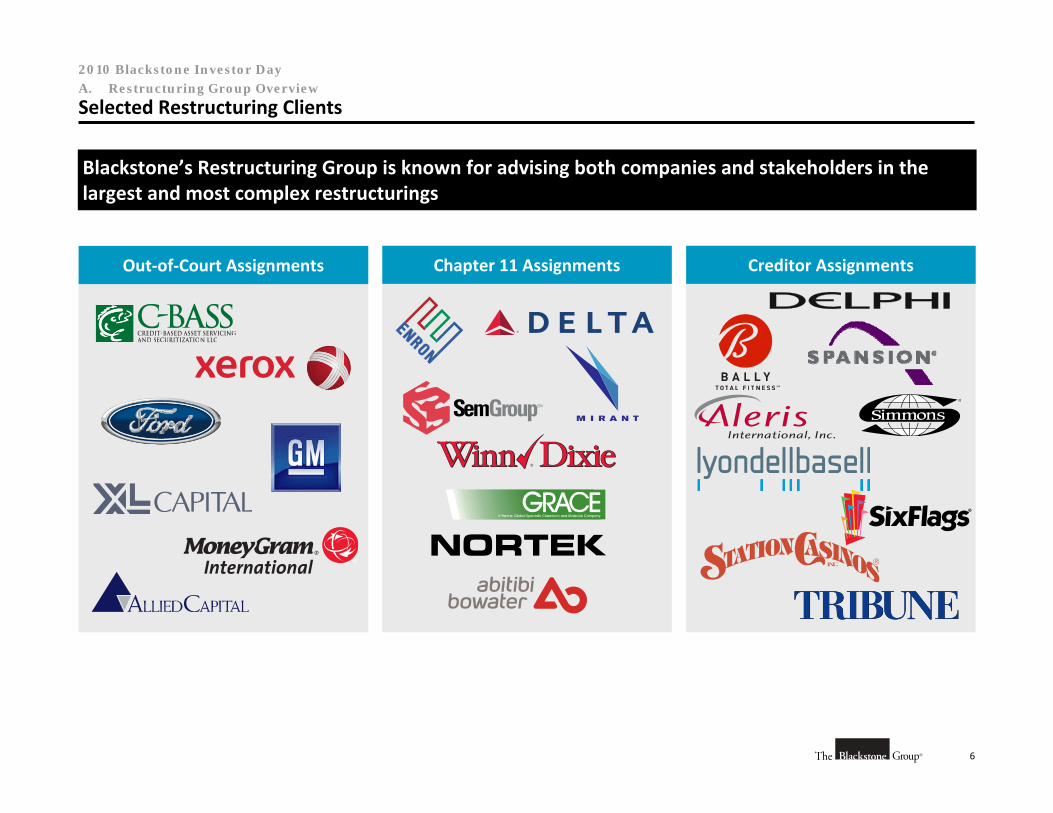
Blackstone’s Restructuring Group is known for advising both companies and stakeholders in the largest and most complex restructurings
Chapter 11 AssignmentsOut‐of‐Court Assignments Creditor Assignments
7
2010 Blackstone Investor Day
A. Restructuring Group Overview
Broad Industry Expertise – 13 Top Industry Specialties
Automotive
Energy
Consumer Products
Financial Services
Healthcare / Medical Products
Infrastructure
Leisure / Entertainment
Manufacturing / Basic Industry
Media / Communications
Retail / Supermarkets
Steel
Transportation
Real Estate / Casinos

B. Restructuring Market Trends
9
2010 Blackstone Investor Day
B. Restructuring Market Trends
Current Environment Overview
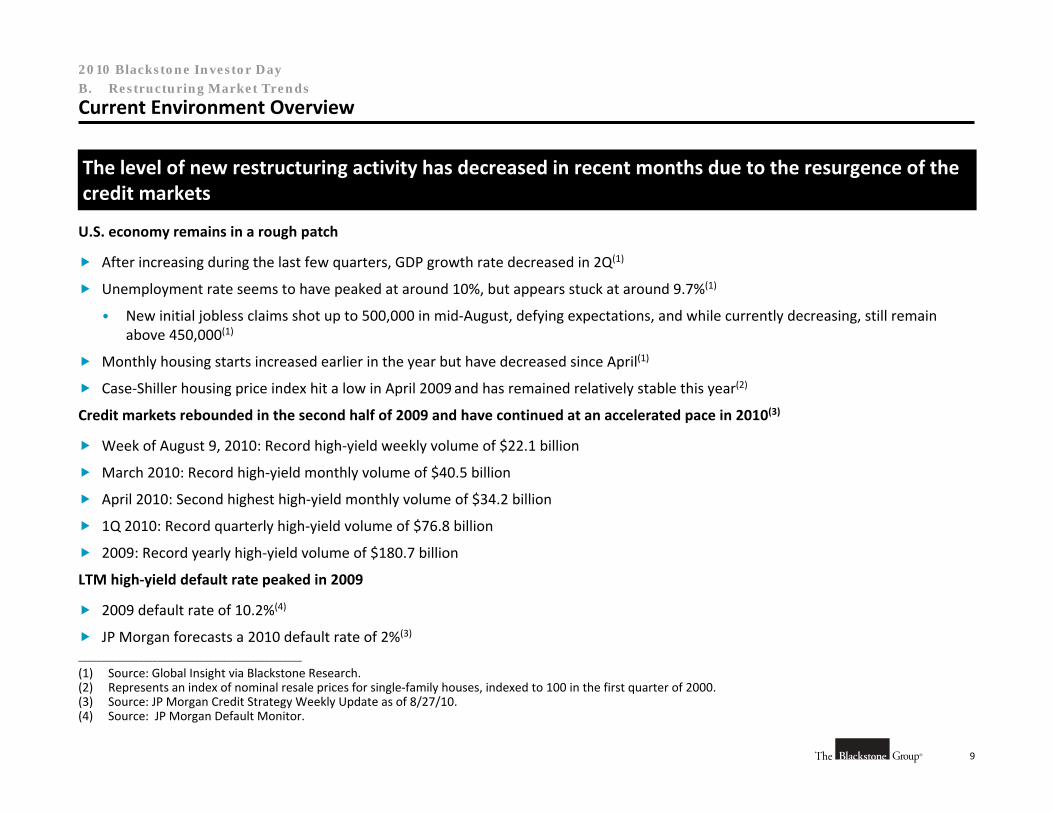
The level of new restructuring activity has decreased in recent months due to the resurgence of the credit markets
U.S. economy remains in a rough patch
After increasing during the last few quarters, GDP growth rate decreased in 2Q(1)
Unemployment rate seems to have peaked at around 10%, but appears stuck at around 9.7%(1)
• New initial jobless claims shot up to 500,000 in mid‐August, defying expectations, and while currently decreasing, still remain above 450,000(1)
Monthly housing starts increased earlier in the year but have decreased since April(1)
Case‐Shiller housing price index hit a low in April 2009 and has remained relatively stable this year(2)
Credit markets rebounded in the second half of 2009 and have continued at an accelerated pace in 2010(3)
Week of August 9, 2010: Record high‐yield weekly volume of $22.1 billion
March 2010: Record high‐yield monthly volume of $40.5 billion
April 2010: Second highest high‐yield monthly volume of $34.2 billion
1Q 2010: Record quarterly high‐yield volume of $76.8 billion
2009: Record yearly high‐yield volume of $180.7 billion
LTM high‐yield default rate peaked in 2009
2009 default rate of 10.2%(4)
JP Morgan forecasts a 2010 default rate of 2%(3)
________________________________________________
(1) Source: Global Insight via Blackstone Research.(2) Represents an index of nominal resale prices for single‐family houses, indexed to 100 in the first quarter of 2000.(3) Source: JP Morgan Credit Strategy Weekly Update as of 8/27/10. (4) Source: JP Morgan Default Monitor.
10
2010 Blackstone Investor Day
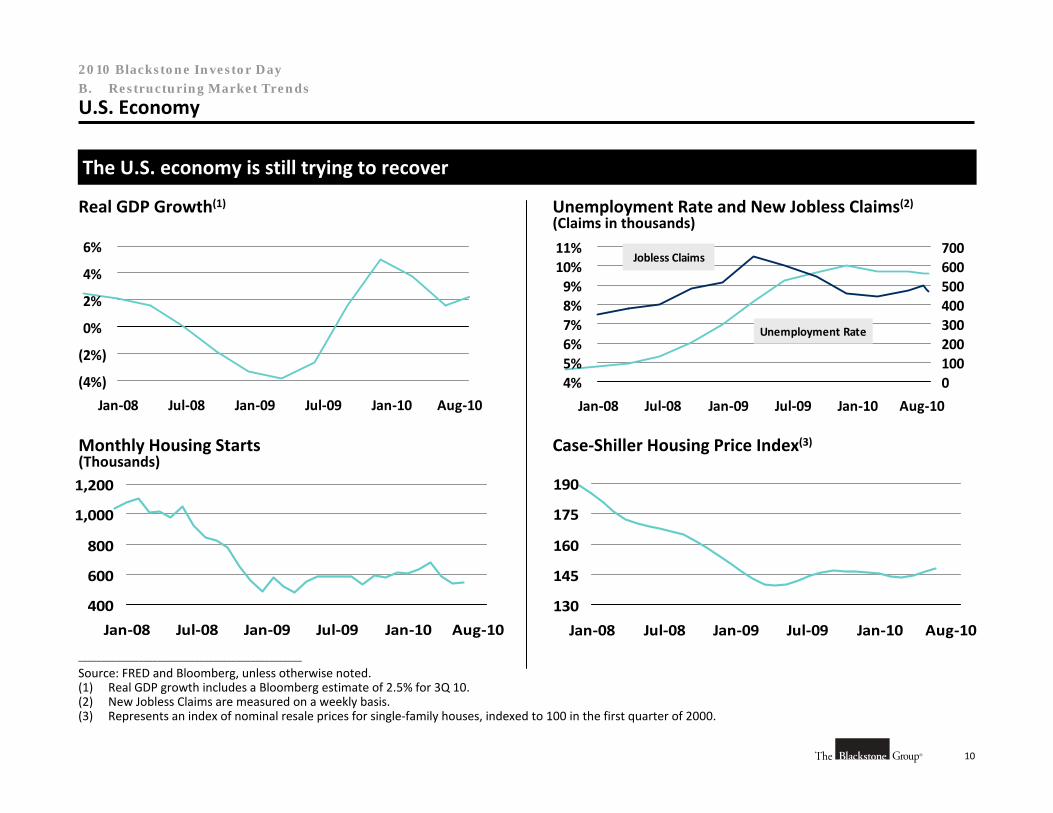
Unemployment Rate and New Jobless Claims(2)(Claims in thousands)
4%5%6%7%8%9%10%11%
Jan‐08 Jul‐08 Jan‐09 Jul‐09 Jan‐10 Aug‐10
0100200300400500600700
Unemployment Rate
Jobless Claims
Monthly Housing Starts(Thousands)
400
600
800
1,000
1,200
Jan‐08 Jul‐08 Jan‐09 Jul‐09 Jan‐10 Aug‐10
Case‐Shiller Housing Price Index(3)
130
145
160
175
190
Jan‐08 Jul‐08 Jan‐09 Jul‐09 Jan‐10 Aug‐10
B. Restructuring Market Trends
U.S. Economy
The U.S. economy is still trying to recover
________________________________________________
Source: FRED and Bloomberg, unless otherwise noted.(1) Real GDP growth includes a Bloomberg estimate of 2.5% for 3Q 10.(2) New Jobless Claims are measured on a weekly basis.(3) Represents an index of nominal resale prices for single‐family houses, indexed to 100 in the first quarter of 2000.
Real GDP Growth(1)
(4%)
(2%)
0%
2%
4%
6%
Jan‐08 Jul‐08 Jan‐09 Jul‐09 Jan‐10 Aug‐10
11
2010 Blackstone Investor Day
31
39
22
57
44
61
12
31
8
36
7
13
55
52
60
77
50
1
49
$0
$20
$40
$60
$80
1Q 2Q 3Q 4Q 1Q 2Q 3Q 4Q 1Q 2Q 3Q 4Q 1Q 2Q 3Q 4Q 1Q 2Q 3Q
2006 2007 2008(2) 2009 2010
B. Restructuring Market Trends
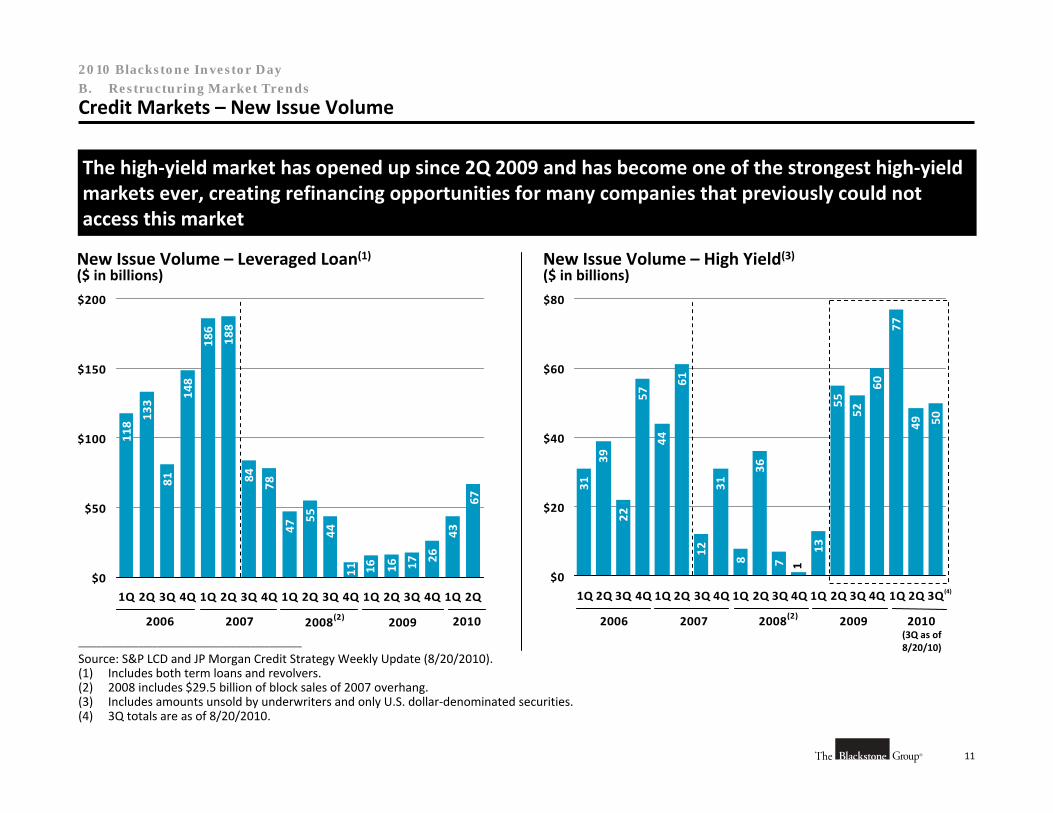
Credit Markets – New Issue Volume
The high‐yield market has opened up since 2Q 2009 and has become one of the strongest high‐yield markets ever, creating refinancing opportunities for many companies that previously could not access this market
________________________________________________
Source: S&P LCD and JP Morgan Credit Strategy Weekly Update (8/20/2010).(1) Includes both term loans and revolvers.(2) 2008 includes $29.5 billion of block sales of 2007 overhang.(3) Includes amounts unsold by underwriters and only U.S. dollar‐denominated securities.(4) 3Q totals are as of 8/20/2010.
New Issue Volume – Leveraged Loan(1)($ in billions)
118
133
81
148
186
188
84
78
47
55
44
17 26
43
67
161611$0
$50
$100
$150
$200
1Q 2Q 3Q 4Q 1Q 2Q 3Q 4Q 1Q 2Q 3Q 4Q 1Q 2Q 3Q 4Q 1Q 2Q
2006 2007 2008(2) 2009 2010
New Issue Volume – High Yield(3)
($ in billions)
(3Q as of 8/20/10)
(4)
12
2010 Blackstone Investor Day
B. Restructuring Market Trends
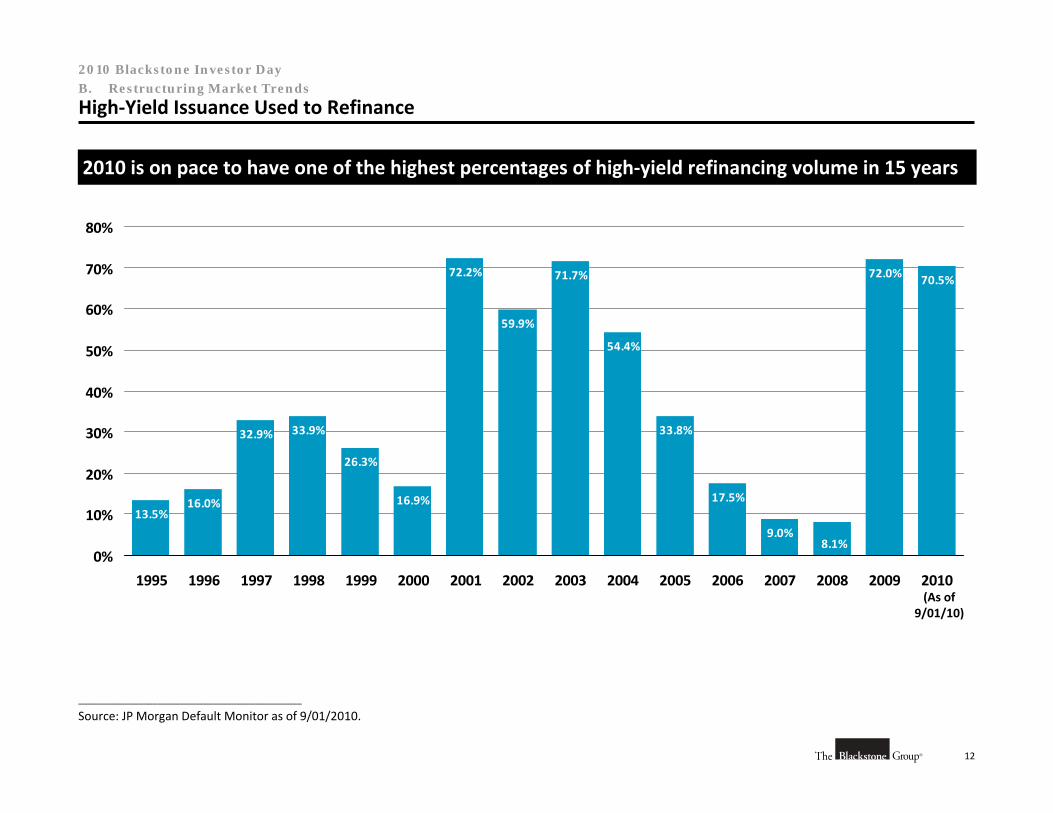
High‐Yield Issuance Used to Refinance
13.5%16.0%
32.9% 33.9%
26.3%
16.9%
72.2% 71.7%
54.4%
33.8%
72.0% 70.5%
8.1%9.0%
17.5%
59.9%
0%
10%
20%
30%
40%
50%
60%
70%
80%
1995 1996 1997 1998 1999 2000 2001 2002 2003 2004 2005 2006 2007 2008 2009 2010
2010 is on pace to have one of the highest percentages of high‐yield refinancing volume in 15 years
________________________________________________
Source: JP Morgan Default Monitor as of 9/01/2010.
(As of 9/01/10)
13
2010 Blackstone Investor Day
141
71
(25) (21)(16) (13)
1730 40
(13) (28) (36)(70)
(42)
12 ‐13 41
141
8381
(25)(52)(38)
43
(49) (83)
($80)
($40)
$0
$40
$80
$120
2010 2011 2012 2013 2014 2015 2016 2017 2018 or Later
High‐Yield Bonds Institutional Loans Overall
B. Restructuring Market Trends
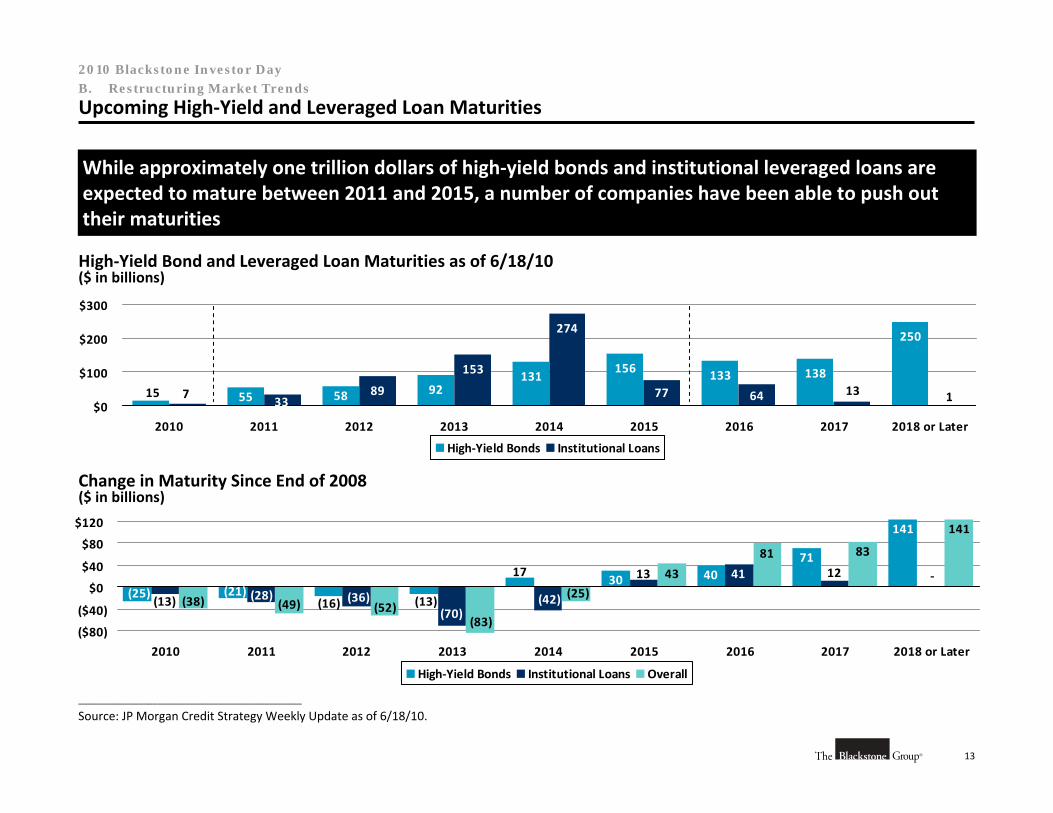
Upcoming High‐Yield and Leveraged Loan Maturities
While approximately one trillion dollars of high‐yield bonds and institutional leveraged loans are expected to mature between 2011 and 2015, a number of companies have been able to push out their maturities
________________________________________________
Source: JP Morgan Credit Strategy Weekly Update as of 6/18/10.
High‐Yield Bond and Leveraged Loan Maturities as of 6/18/10($ in billions)
138
250
77133156
131925855 15 64 113
274
153
8933
7$0
$100
$200
$300
2010 2011 2012 2013 2014 2015 2016 2017 2018 or Later
High‐Yield Bonds Institutional Loans
Change in Maturity Since End of 2008($ in billions)
14
2010 Blackstone Investor Day
B. Restructuring Market Trends
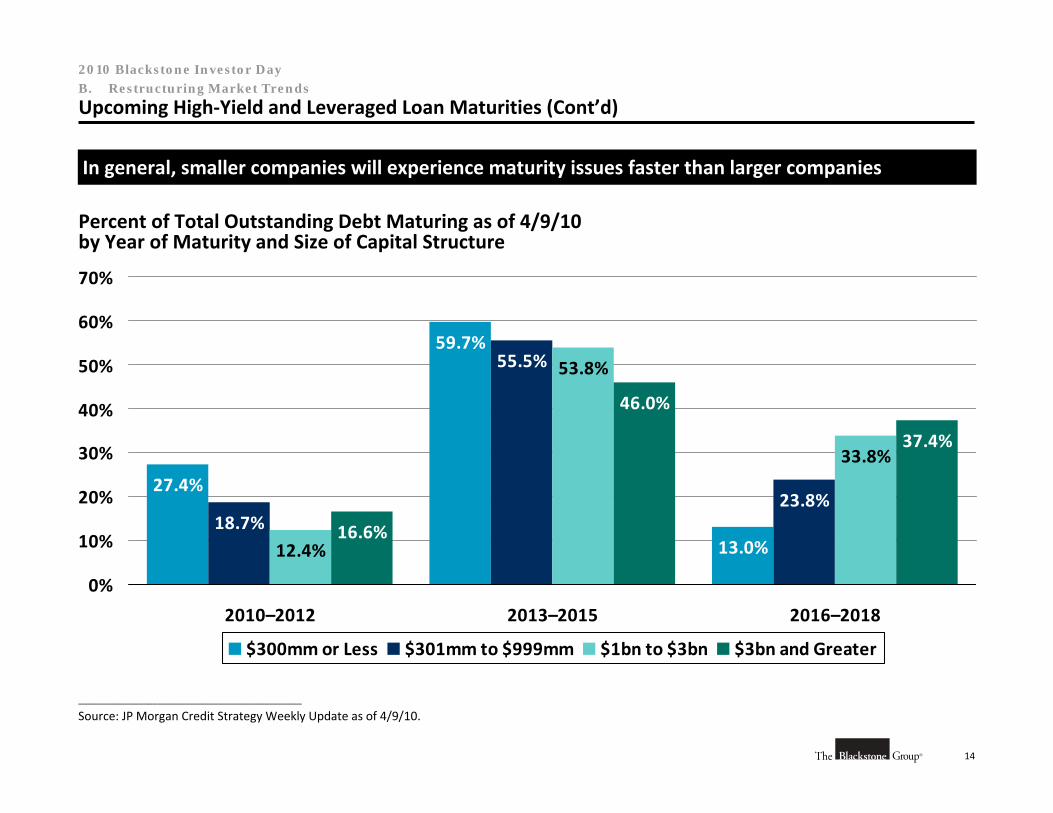
Upcoming High‐Yield and Leveraged Loan Maturities (Cont’d)
________________________________________________
Source: JP Morgan Credit Strategy Weekly Update as of 4/9/10.
In general, smaller companies will experience maturity issues faster than larger companies
Percent of Total Outstanding Debt Maturing as of 4/9/10by Year of Maturity and Size of Capital Structure
27.4%
59.7%
13.0%18.7%
55.5%
23.8%
12.4%
53.8%
33.8%
16.6%
46.0%
37.4%
0%
10%
20%
30%
40%
50%
60%
70%
2010–2012 2013–2015 2016–2018
$300mm or Less $301mm to $999mm $1bn to $3bn $3bn and Greater
15
2010 Blackstone Investor Day
B. Restructuring Market Trends
High‐Yield Debt Issuance and Restructuring Cycles
Restructuring cycles are driven largely by the high‐yield and the institutional leveraged loan markets
Improving credit markets have allowed many distressed companies to defer restructuring through refinancing
While the high‐yield market appears to be a major contributor to the recovering capital markets and the reduction in new restructuring assignments, it is most likely setting the stage for the next restructuring cycle
While maturities are important, a high percentage of defaults occur because of covenant breaches and cash flow shortages
New high‐yield debt financing and refinancing may only serve to defer rather than prevent restructurings
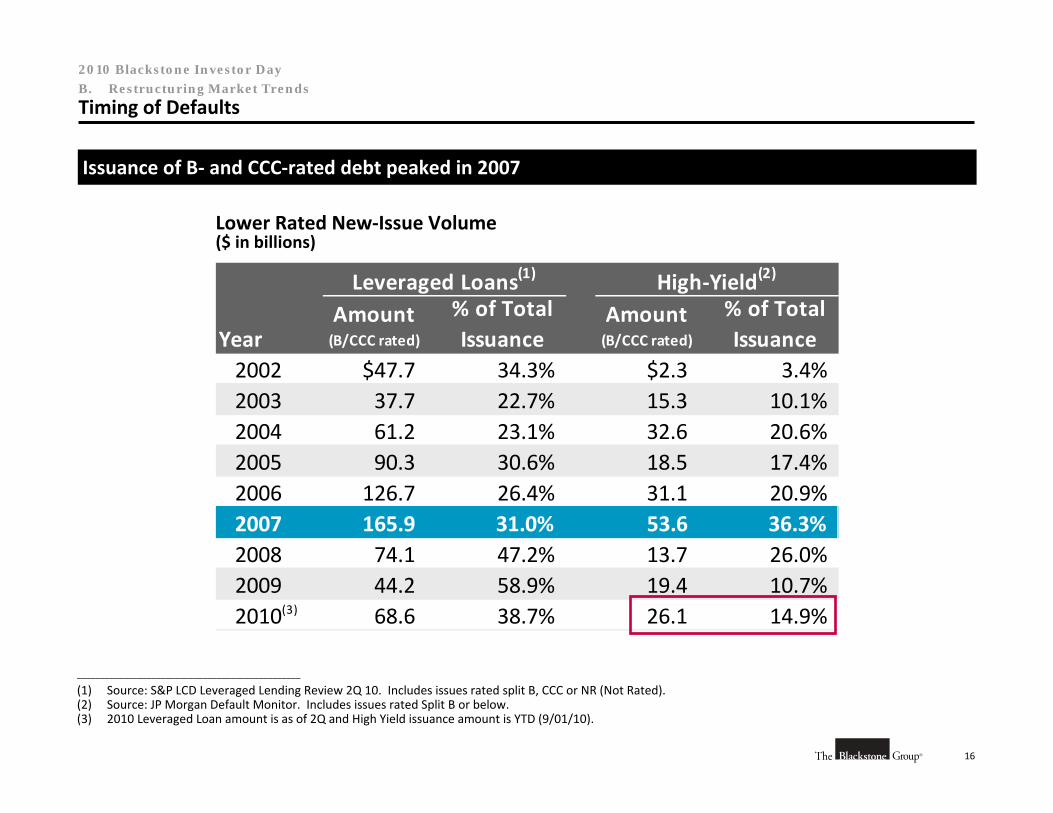
16
2010 Blackstone Investor Day
B. Restructuring Market Trends
Timing of Defaults
Lower Rated New‐Issue Volume($ in billions)
Leveraged Loans(1) High‐Yield(2)
YearAmount (B/CCC rated)
% of Total Issuance
Amount (B/CCC rated)
% of Total Issuance
2002 $47.7 34.3% $2.3 3.4%2003 37.7 22.7% 15.3 10.1%2004 61.2 23.1% 32.6 20.6%2005 90.3 30.6% 18.5 17.4%2006 126.7 26.4% 31.1 20.9%2007 165.9 31.0% 53.6 36.3%2008 74.1 47.2% 13.7 26.0%2009 44.2 58.9% 19.4 10.7%2010(3) 68.6 38.7% 26.1 14.9%
________________________________________________
(1) Source: S&P LCD Leveraged Lending Review 2Q 10. Includes issues rated split B, CCC or NR (Not Rated).(2) Source: JP Morgan Default Monitor. Includes issues rated Split B or below.(3) 2010 Leveraged Loan amount is as of 2Q and High Yield issuance amount is YTD (9/01/10).
Issuance of B‐ and CCC‐rated debt peaked in 2007
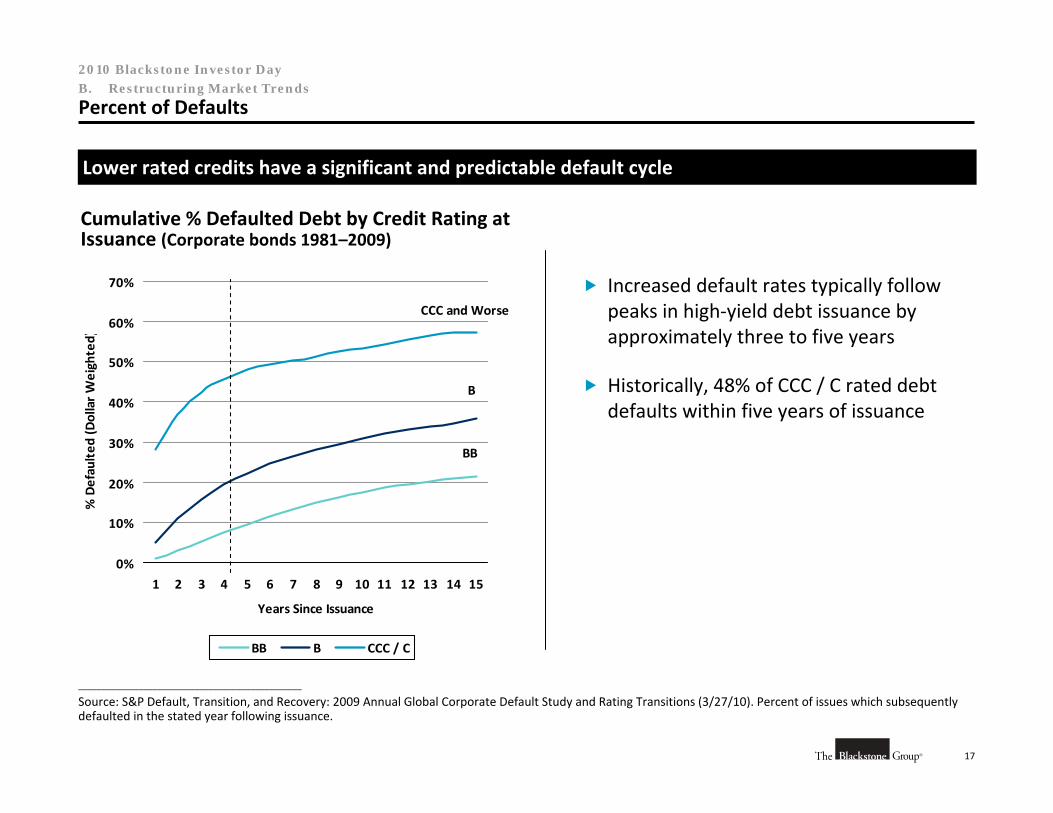
17
2010 Blackstone Investor Day
B. Restructuring Market Trends
Percent of Defaults
Cumulative % Defaulted Debt by Credit Rating at Issuance (Corporate bonds 1981–2009)
0%
10%
20%
30%
40%
50%
60%
70%
1 2 3 4 5 6 7 8 9 10 11 12 13 14 15
Years Since Issuance
% Defaulted
(Dollar Weighted)
BB B CCC / C
CCC and Worse
B
BB
________________________________________________
Source: S&P Default, Transition, and Recovery: 2009 Annual Global Corporate Default Study and Rating Transitions (3/27/10). Percent of issues which subsequently defaulted in the stated year following issuance.
Lower rated credits have a significant and predictable default cycle
Increased default rates typically follow peaks in high‐yield debt issuance by approximately three to five years
Historically, 48% of CCC / C rated debt defaults within five years of issuance
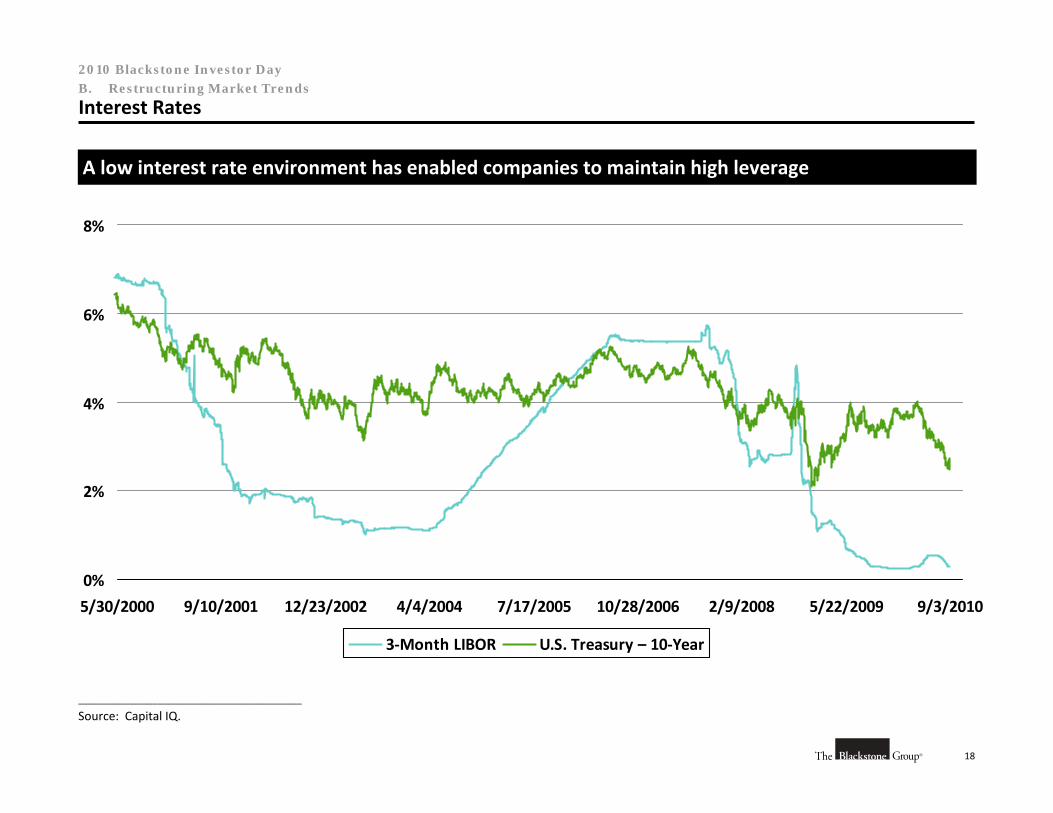
18
2010 Blackstone Investor Day
0%
2%
4%
6%
8%
5/30/2000 9/10/2001 12/23/2002 4/4/2004 7/17/2005 10/28/2006 2/9/2008 5/22/2009 9/3/2010
3‐Month LIBOR U.S. Treasury – 10‐Year
B. Restructuring Market Trends
Interest Rates
________________________________________________
Source: Capital IQ.
A low interest rate environment has enabled companies to maintain high leverage
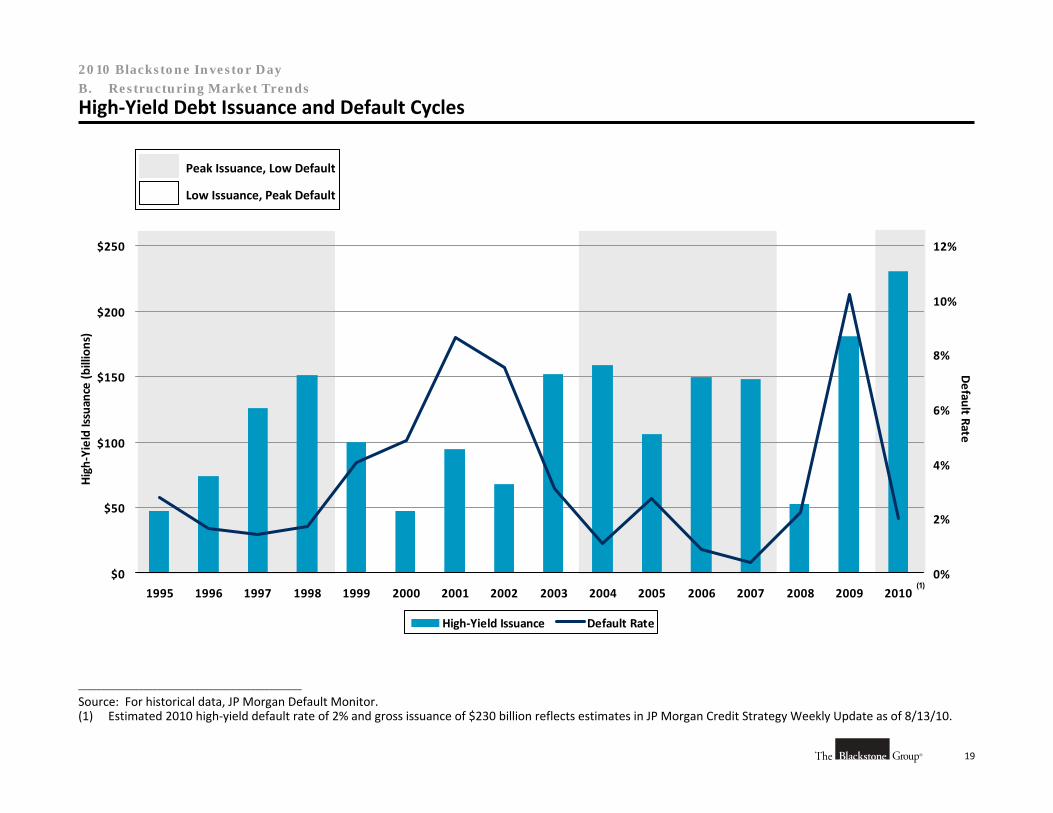
19
2010 Blackstone Investor Day
$0
$50
$100
$150
$200
$250
1995 1996 1997 1998 1999 2000 2001 2002 2003 2004 2005 2006 2007 2008 2009 2010
High‐Yield Issuance (b
illions)
0%
2%
4%
6%
8%
10%
12%
Default Rate
High‐Yield Issuance Default Rate
B. Restructuring Market Trends
High‐Yield Debt Issuance and Default Cycles
________________________________________________
Source: For historical data, JP Morgan Default Monitor. (1) Estimated 2010 high‐yield default rate of 2% and gross issuance of $230 billion reflects estimates in JP Morgan Credit Strategy Weekly Update as of 8/13/10.
(1)
Peak Issuance, Low Default
Low Issuance, Peak Default
20
2010 Blackstone Investor Day
B. Restructuring Market Trends
Observations
High‐yield new issue volume increased significantly in 4Q 2009 and has continued to be robust
• Over the past few months, many large companies were able to access the high‐yield debt market in order to extend their debt maturities
• Smaller companies, however, did not have similar access to refinancing sources
Low interest rates have helped companies remain highly levered
The economy has certain structural problems that are likely to persist and potentially create problems for companies expecting economic momentum to pick up materially
• High unemployment
• Lackluster GDP growth and retail sales as consumers deleverage

C. Conclusions
22
2010 Blackstone Investor Day
C. Conclusions
Conclusions
The dichotomy between a weak economy and robust capital markets could lead to a few different possible scenarios:
• The current cycle could be on a temporary hiatus and could continue for quite a while
– Double‐dip scenarios still remain a possibility
– Consumer confidence has improved slightly but is still low
– High unemployment rates may persist into the future
– The housing sector could take years to recover from the current economic downturn
• The current restructuring cycle could be over, but significant high‐yield offerings could suggest the cycle will begin anew in approximately 3 to 5 years (typical pattern after peak high‐yield issuance)
– Low interest rates may only delay inevitable liquidity issues facing struggling industries
• The current restructuring cycle could be over and the next cycle could begin as historical patterns would predict (typical restructuring cycle is 8 to 10 years)
– The stimulus plan could turn the economy around
– Refinancing done at reasonable rates could provide manageable interest payments
What does this mean for the current restructuring cycle?

Appendix: Select Case Studies
24
2010 Blackstone Investor Day
Appendix: Select Case Studies
Ford Motor Company
Company Overview
Ford Motor Company (“Ford” or the “company”) designs, develops, manufactures and services cars and trucks worldwide
• Company has significant international operations throughout Europe, Asia, and South America
Ford Motor Credit Company (“FMCC”) provides retail and wholesale automotive financing products to dealers, customers and leasing companies worldwide
Background Issues
As of March 3, 2009, Ford was highly levered, with over $35 billion of debt and over $1.8 billion of annual interest expense
Ford’s existing debt traded at severely discounted prices due to the bleak macroeconomic and automotive outlook as well as expectations of continued cash burn. As of March 3, 2009:
• Secured Term Loan traded between $30.00–$32.00
• Unsecured Notes traded between $18.00–$20.00
• Convertible Notes traded between $20.00–$22.00
The Treasury mandated that General Motors and Chrysler, as a result of accepting government loans, reduce unsecured indebtedness by at least two thirds by March 31, 2009
• Ford decided to execute its own balance sheet restructuring to remain competitive with other domestic OEMs and improve its financial profile to ensure long‐term viability
In addition to having a multi‐layered capital structure, Ford had a number of legal and practical restrictions on the use of cash, incurrence of indebtedness and ability to grant additional liens which complicated its balance sheet restructuring
Work Plan Ford retained Blackstone in January 2009 to advise on various
deleveraging transactions During the ensuing months, Blackstone:
• Assisted Ford on structuring two tender offers and a 3(a)9 exchange designed to reduce unsecured indebtedness and alleviate near‐term secured maturities
• Analyzed Credit Agreement and Indentures and determined legal means of executing transactions using FMCC cash
• Built comprehensive recapitalization and financial models to analyze the impact of the transactions on Ford’s capital structure, liquidity, credit profile and equity value
• Assisted company in evaluating alternatives to equitize claims under Voluntary Employee Beneficiary Association
• Assisted the company in developing and presenting its debt restructuring plan to the UAW, government and key stakeholders
• Assisted the company in developing a comprehensive communications and public relations strategies
• Assisted company in executing transactions serving as Restructuring Co‐Advisor, Structuring Agent and Global Lead Dealer Manager for the Unsecured tender offer and Auction Agent for the Term Loan BDutch Auction
Final Outcome On April 3, 2009, the company successfully tendered for $2.2 billion of
Secured Term Loan and $3.4 billion of Unsecured Bonds and successfully exchanged cash and stock for $4.3 billion of Unsecured Convertible Notes
As a result of this complex set of transactions, Ford reduced its total indebtedness by $9.9 billion and eliminated $556 million of annual interest expense with $2.4 billion of cash and 468 million shares of Ford stock
The company remains the only domestic automaker to avoid accepting government loans and has been praised by the White House as well as members of the House and Senate for executing an extremely successful balance sheet and operational restructuring without any government assistance
25
2010 Blackstone Investor Day
Appendix: Select Case Studies
Xerox Corporation
Company Overview
Xerox is a leader in the global document market. The company develops, manufactures, markets, services and finances a range of documentequipment, software, solutions and services
Xerox operates in over 130 countries worldwide, and distributes its products in the Western Hemisphere through divisions, wholly owned subsidiaries and third‐party distributors
Work Plan Blackstone advised on an overall restructuring of Xerox’s capital structure. The financing work included: Extensive due diligence, including meetings with operational and finance
groups in Europe, South America, and North America Creation of detailed financial forecast with flexibility to analyze:
• Impacts of various operating assumptions and cash sources and uses by geography
• Effects of various financing and restructuring proposals, including transition to third‐party customer financing
Identified additional financing to fund liquidity crisis as Xerox undertook major asset sales and shut down negative cash flow operations
Development of various restructuring alternatives including analysis of legal and corporate structure
Assisted in the negotiation and structuring of capital market transactions consistent with legal and corporate structureBackground Issues
Xerox faced various issues beginning in mid‐1999 including:
• Execution issues consolidating customer administration centers• Difficult execution of a major sales force realignment
• SEC investigation into accounting issues at Mexican division
In May 2000, Xerox’s credit rating was downgraded and subsequently lost access to the commercial paper financing market – a primary financing source
• By October 2000, Xerox had $5.4 billion of commercial paper outstanding which would rapidly come due over the course of three months
With this backdrop, Xerox hired Blackstone to assist in formulating a restructuring and financing plan
Final Outcome
In July 2002, Blackstone negotiated a new $4.2 billion credit agreement satisfactory to Xerox and creditors, avoiding bankruptcy
• Obtained 100% approval of entire 59‐member bank group
• Achieved terms that preserved adequate liquidity
• Implemented creative solution that allowed the refinancing to close prior to the resolution of an SEC investigation and restatement
In February 2003, Blackstone assisted in the negotiation and execution of $3.6 billion of new financing, which refinanced the outstanding amounts under the credit agreement:
• Secured credit facility and senior notes
• Mandatory convertible preferred stock and new common stock
In 2009, Blackstone’s Advisory Group advised Xerox on its $8.3 billion acquisition of Affiliated Computer Services

VII. GSO Credit Platform

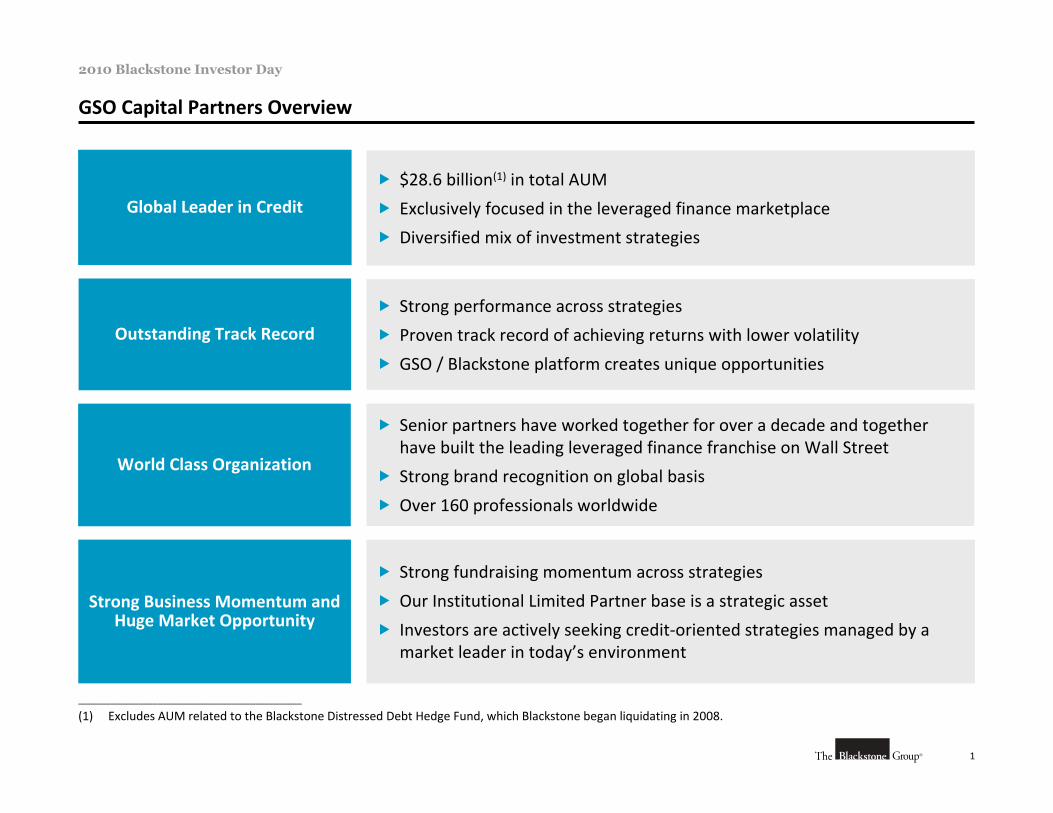
1
2010 Blackstone Investor Day
GSO Capital Partners Overview
Global Leader in Credit
World Class Organization
Strong Business Momentum and Huge Market Opportunity
$28.6 billion(1) in total AUM
Exclusively focused in the leveraged finance marketplace
Diversified mix of investment strategies
Senior partners have worked together for over a decade and together have built the leading leveraged finance franchise on Wall Street
Strong brand recognition on global basis
Over 160 professionals worldwide
Strong fundraising momentum across strategies
Our Institutional Limited Partner base is a strategic asset
Investors are actively seeking credit‐oriented strategies managed by a market leader in today’s environment
Outstanding Track Record
Strong performance across strategies
Proven track record of achieving returns with lower volatility
GSO / Blackstone platform creates unique opportunities
________________________________________________
(1) Excludes AUM related to the Blackstone Distressed Debt Hedge Fund, which Blackstone began liquidating in 2008.
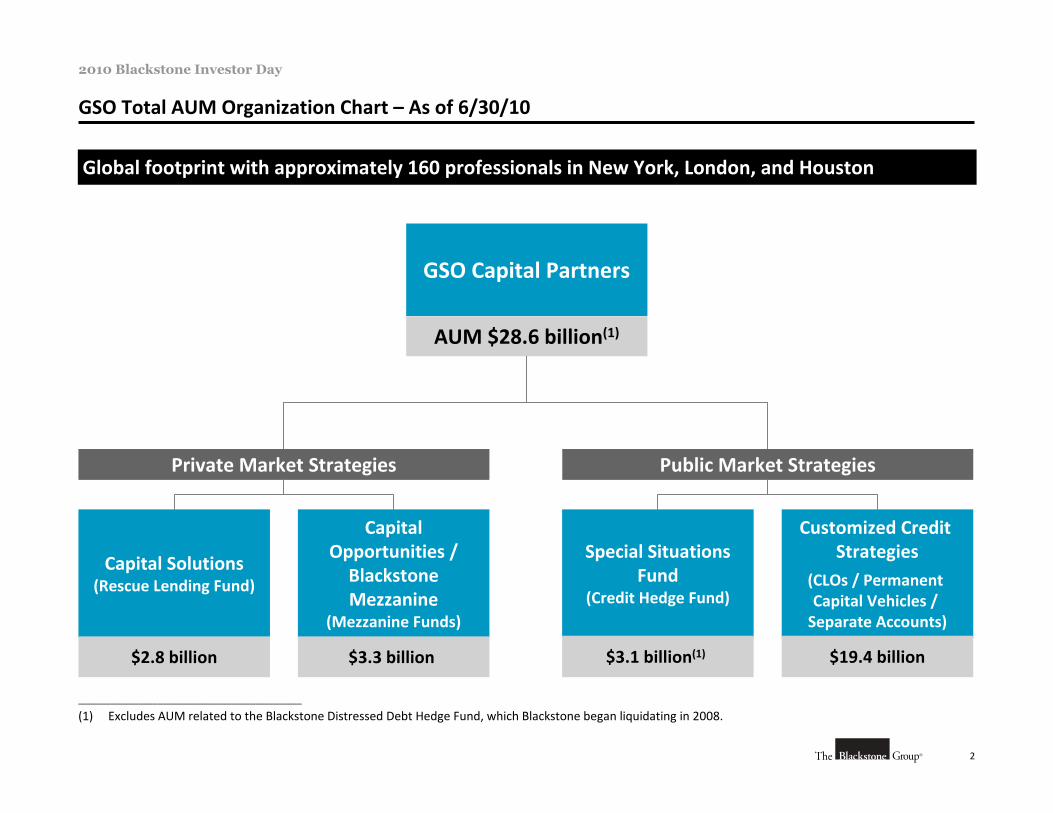
2
2010 Blackstone Investor Day
GSO Total AUM Organization Chart – As of 6/30/10
GSO Capital Partners
AUM $28.6 billion(1)
Customized Credit Strategies
(CLOs / Permanent Capital Vehicles / Separate Accounts)
$19.4 billion
Capital Solutions(Rescue Lending Fund)
$2.8 billion
Capital Opportunities / Blackstone Mezzanine
(Mezzanine Funds)
$3.3 billion
Private Market Strategies Public Market Strategies
Special Situations Fund
(Credit Hedge Fund)
$3.1 billion(1)
Global footprint with approximately 160 professionals in New York, London, and Houston
________________________________________________
(1) Excludes AUM related to the Blackstone Distressed Debt Hedge Fund, which Blackstone began liquidating in 2008.
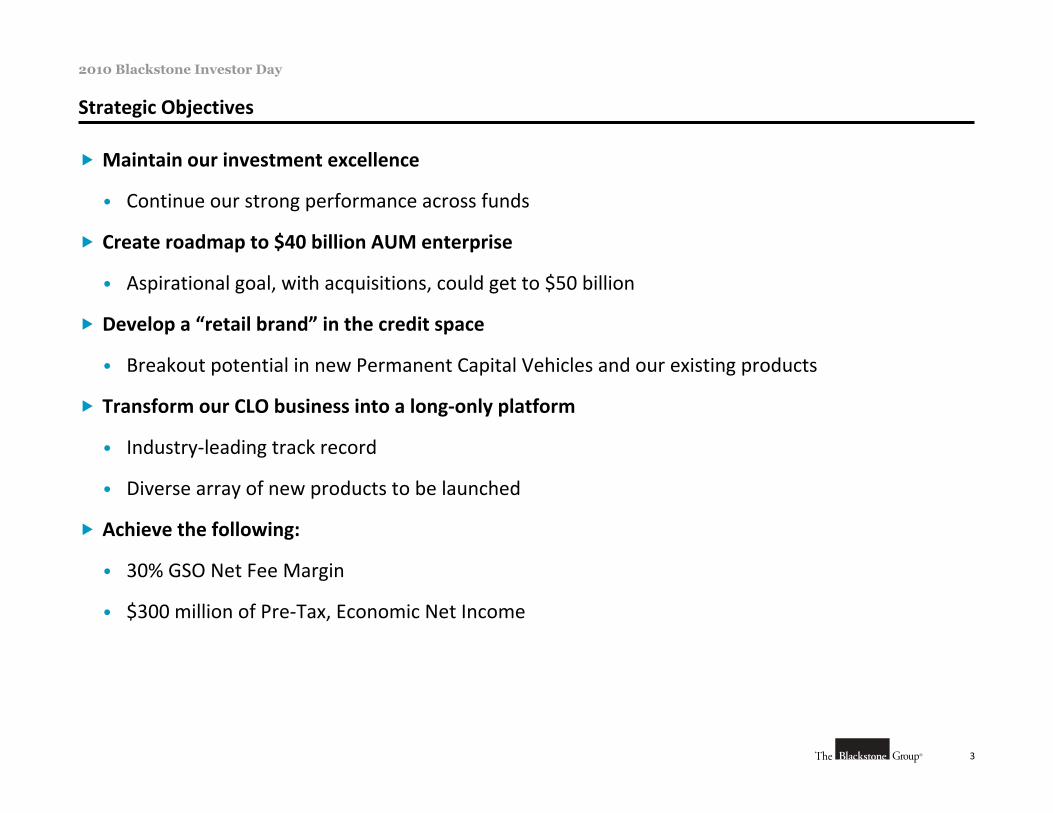
3
2010 Blackstone Investor Day
Strategic Objectives
Maintain our investment excellence
• Continue our strong performance across funds
Create roadmap to $40 billion AUM enterprise
• Aspirational goal, with acquisitions, could get to $50 billion
Develop a “retail brand” in the credit space
• Breakout potential in new Permanent Capital Vehicles and our existing products
Transform our CLO business into a long‐only platform
• Industry‐leading track record
• Diverse array of new products to be launched
Achieve the following:
• 30% GSO Net Fee Margin
• $300 million of Pre‐Tax, Economic Net Income
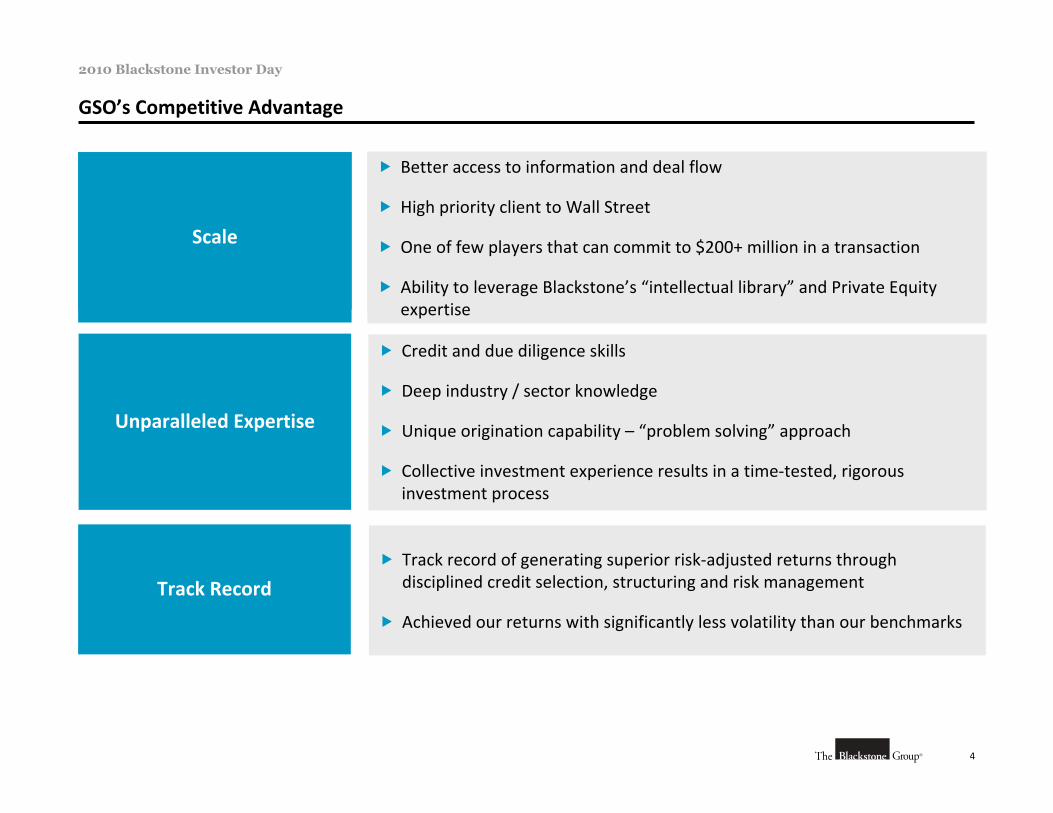
4
2010 Blackstone Investor Day
GSO’s Competitive Advantage
Scale
Unparalleled Expertise
Track Record
Better Access to Information and Deal Flow
High Priority Client to Wall Street
One of Few Players that can Commit to $200 million + in a Transaction
Ability to Leverage Blackstone’s “Intellectual Library” and Private Equity Expertise
Credit and due diligence skills
Deep industry / sector knowledge
Unique origination capability – “problem solving” approach
Collective investment experience results in a time‐tested, rigorous investment process
Track record of generating superior risk‐adjusted returns through disciplined credit selection, structuring and risk management
Achieved our returns with significantly less volatility than our benchmarks
Scale
Better access to information and deal flow
High priority client to Wall Street
One of few players that can commit to $200+ million in a transaction
Ability to leverage Blackstone’s “intellectual library” and Private Equity expertise
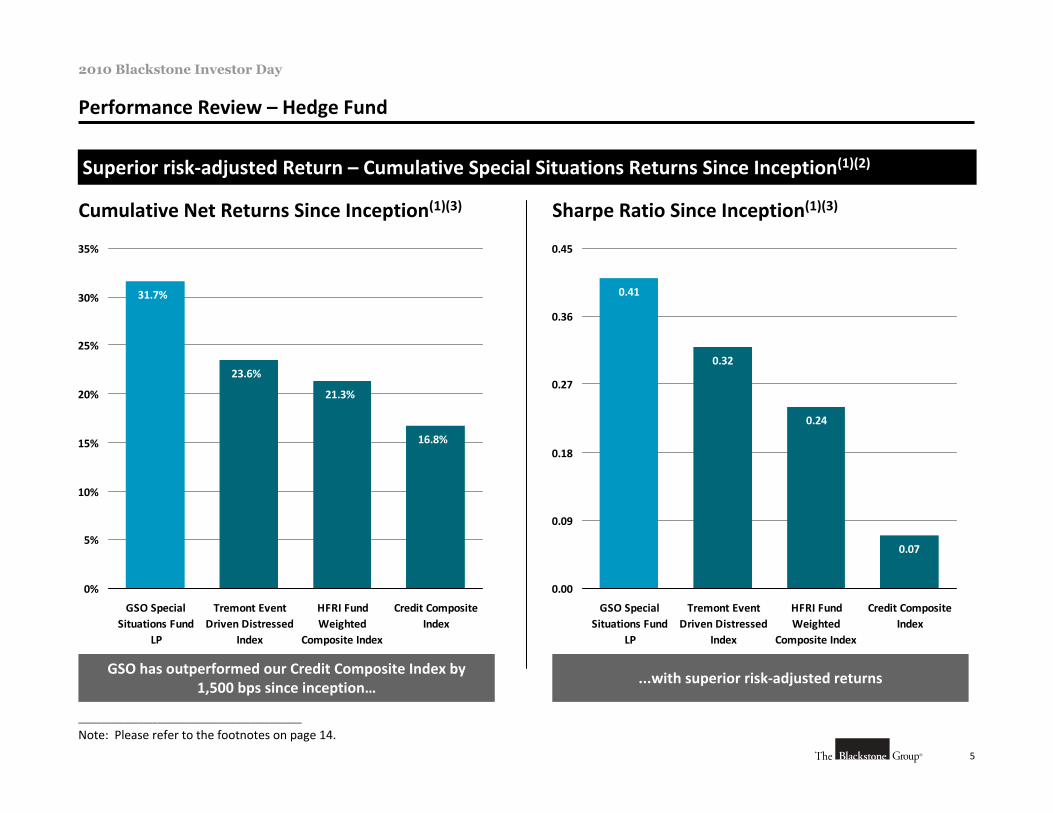
5
2010 Blackstone Investor Day
Performance Review – Hedge Fund
GSO has outperformed our Credit Composite Index by 1,500 bps since inception…
...with superior risk‐adjusted returns
________________________________________________
Note: Please refer to the footnotes on page 14.
Superior risk‐adjusted Return – Cumulative Special Situations Returns Since Inception(1)(2)
Cumulative Net Returns Since Inception(1)(3)
16.8%
21.3%
23.6%
31.7%
0%
5%
10%
15%
20%
25%
30%
35%
GSO SpecialSituations Fund
LP
Tremont EventDriven Distressed
Index
HFRI FundWeighted
Composite Index
Credit CompositeIndex
Sharpe Ratio Since Inception(1)(3)
0.07
0.24
0.32
0.41
0.00
0.09
0.18
0.27
0.36
0.45
GSO SpecialSituations Fund
LP
Tremont EventDriven Distressed
Index
HFRI FundWeighted
Composite Index
Credit CompositeIndex
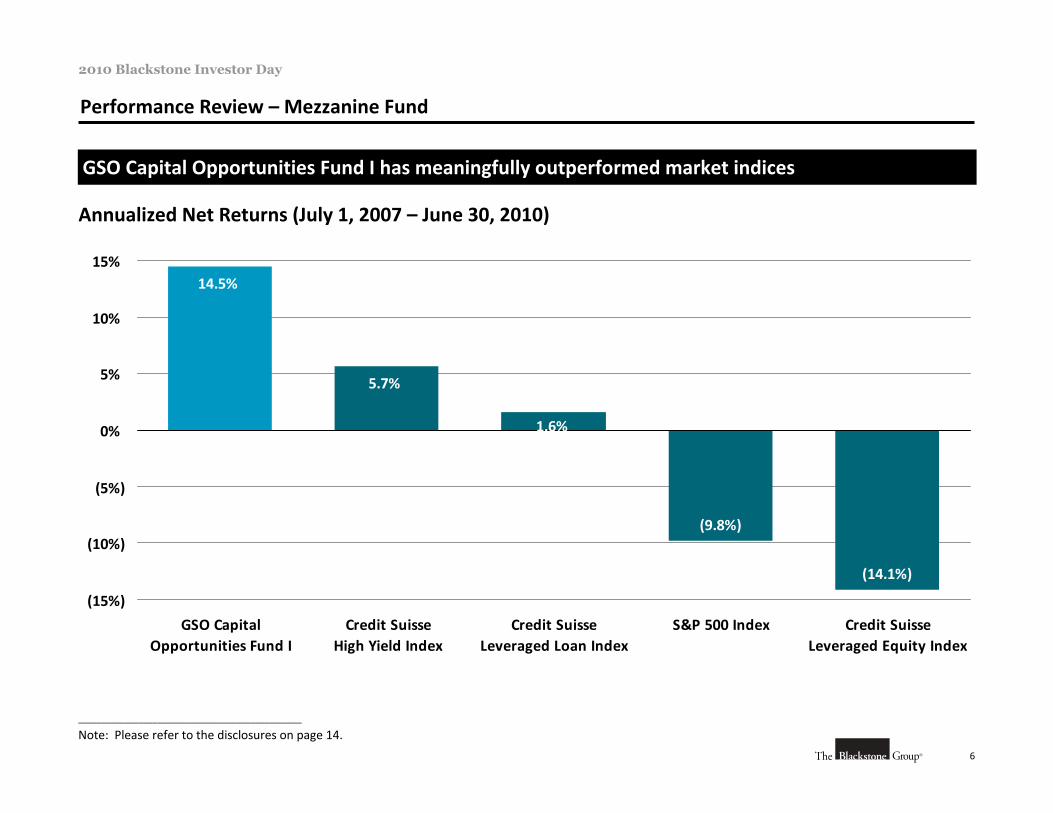
6
2010 Blackstone Investor Day
Performance Review – Mezzanine Fund
________________________________________________
Note: Please refer to the disclosures on page 14.
Annualized Net Returns (July 1, 2007 – June 30, 2010)
(9.8%)
(14.1%)
1.6%
5.7%
14.5%
(15%)
(10%)
(5%)
0%
5%
10%
15%
GSO CapitalOpportunities Fund I
Credit SuisseHigh Yield Index
Credit SuisseLeveraged Loan Index
S&P 500 Index Credit SuisseLeveraged Equity Index
GSO Capital Opportunities Fund I has meaningfully outperformed market indices
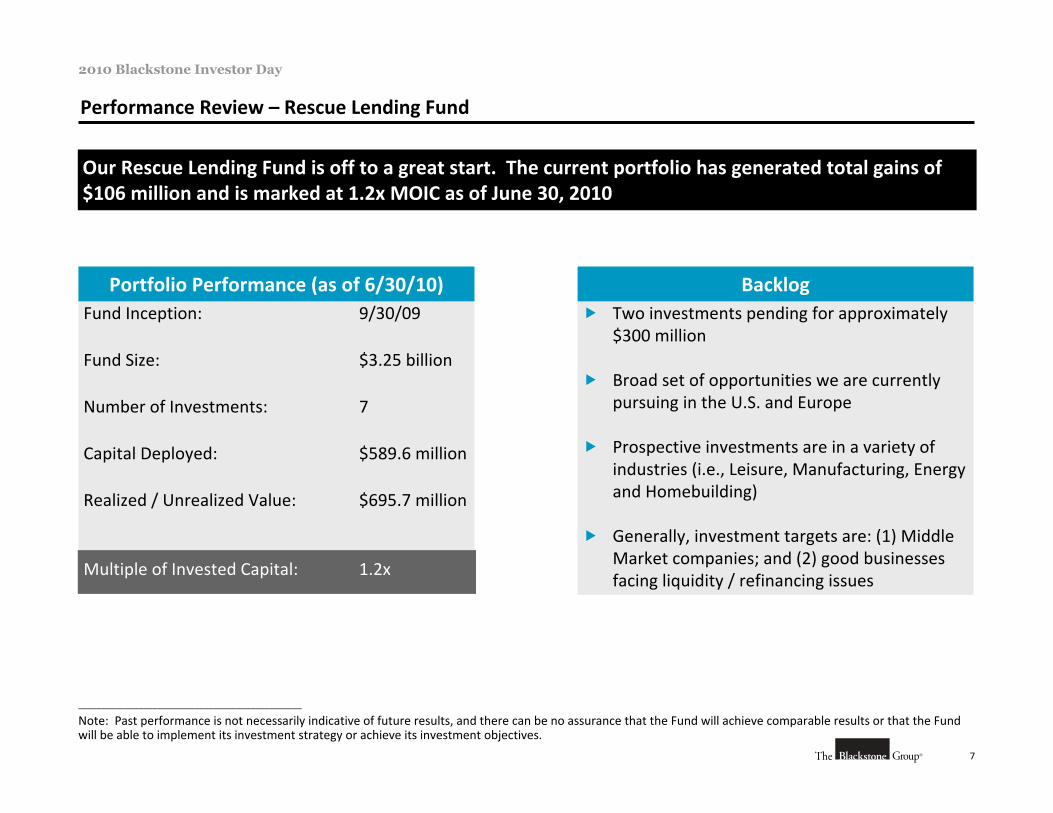
7
2010 Blackstone Investor Day
Performance Review – Rescue Lending Fund
________________________________________________
Note: Past performance is not necessarily indicative of future results, and there can be no assurance that the Fund will achieve comparable results or that the Fund will be able to implement its investment strategy or achieve its investment objectives.
Portfolio Performance (as of 6/30/10)
Our Rescue Lending Fund is off to a great start. The current portfolio has generated total gains of $106 million and is marked at 1.2x MOIC as of June 30, 2010
Backlog Two investments pending for approximately
$300 million
Broad set of opportunities we are currently pursuing in the U.S. and Europe
Prospective investments are in a variety of industries (i.e., Leisure, Manufacturing, Energy and Homebuilding)
Generally, investment targets are: (1) Middle Market companies; and (2) good businesses facing liquidity / refinancing issues
Fund Inception: 9/30/09
Fund Size: $3.25 billion
Number of Investments: 7
Capital Deployed: $589.6 million
Realized / Unrealized Value: $695.7 million
Multiple of Invested Capital: 1.2x
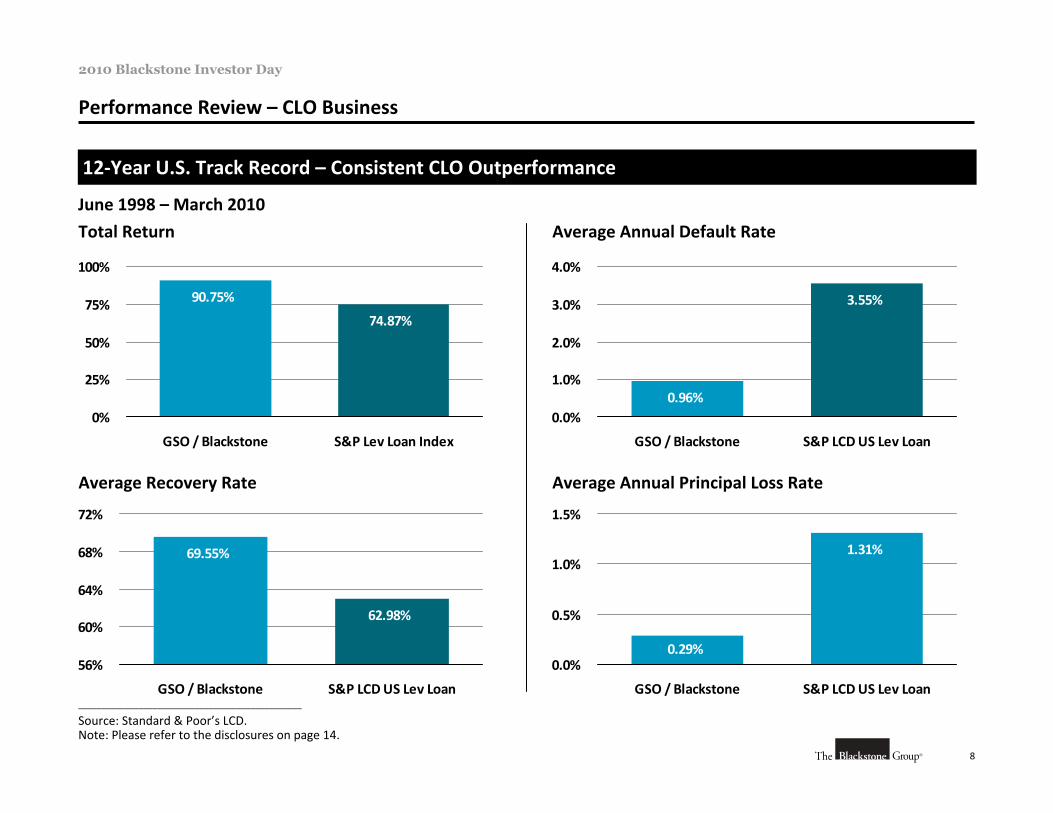
8
2010 Blackstone Investor Day
Performance Review – CLO Business
June 1998 – March 2010
________________________________________________
Source: Standard & Poor’s LCD.Note: Please refer to the disclosures on page 14.
12‐Year U.S. Track Record – Consistent CLO Outperformance
1.31%
0.29%0.0%
0.5%
1.0%
1.5%
GSO / Blackstone S&P LCD US Lev Loan
62.98%
69.55%
56%
60%
64%
68%
72%
GSO / Blackstone S&P LCD US Lev Loan
3.55%
0.96%0.0%
1.0%
2.0%
3.0%
4.0%
GSO / Blackstone S&P LCD US Lev Loan
Total Return
74.87%
90.75%
0%
25%
50%
75%
100%
GSO / Blackstone S&P Lev Loan Index
Average Annual Default Rate
Average Recovery Rate Average Annual Principal Loss Rate
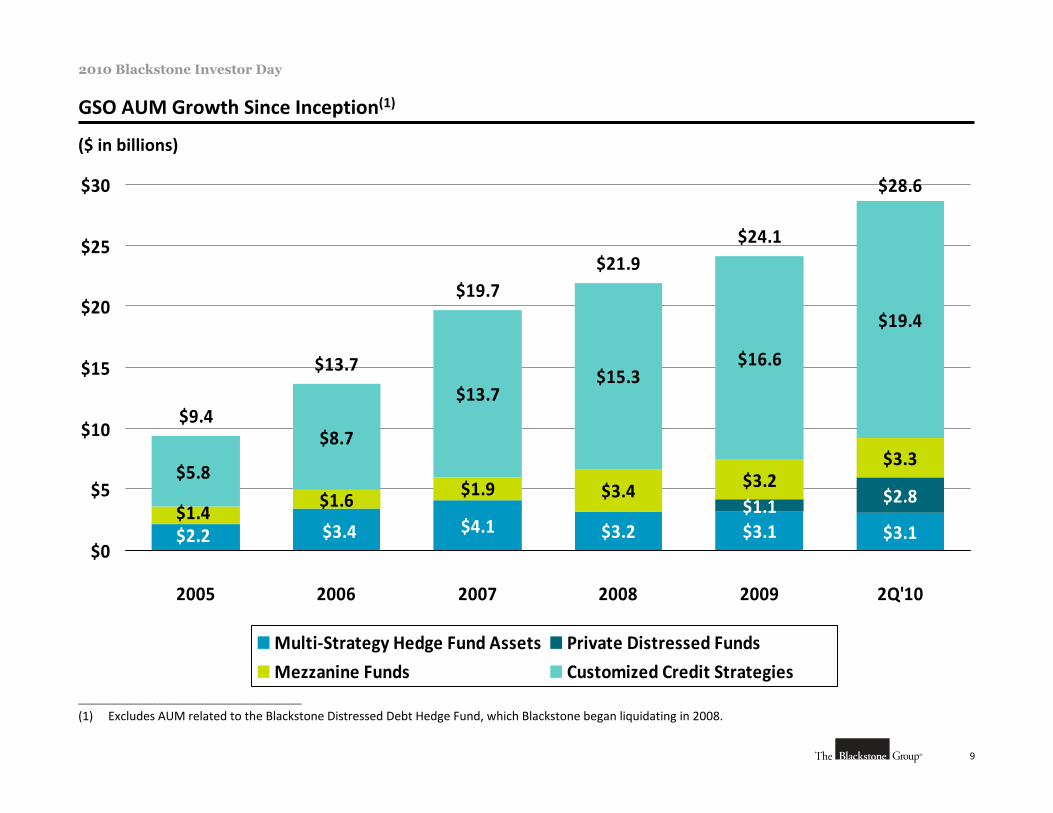
9
2010 Blackstone Investor Day
GSO AUM Growth Since Inception(1)
($ in billions)
$4.1 $3.2 $3.1 $3.1$1.1 $2.8$3.4 $3.2
$3.3$8.7
$13.7$15.3
$16.6
$19.4
$2.2 $3.4
$1.6$1.4
$1.9$5.8
$28.6
$9.4
$13.7
$19.7$21.9
$24.1
$0
$5
$10
$15
$20
$25
$30
2005 2006 2007 2008 2009 2Q'10
Multi‐Strategy Hedge Fund Assets Private Distressed Funds
Mezzanine Funds Customized Credit Strategies ________________________________________________
(1) Excludes AUM related to the Blackstone Distressed Debt Hedge Fund, which Blackstone began liquidating in 2008.
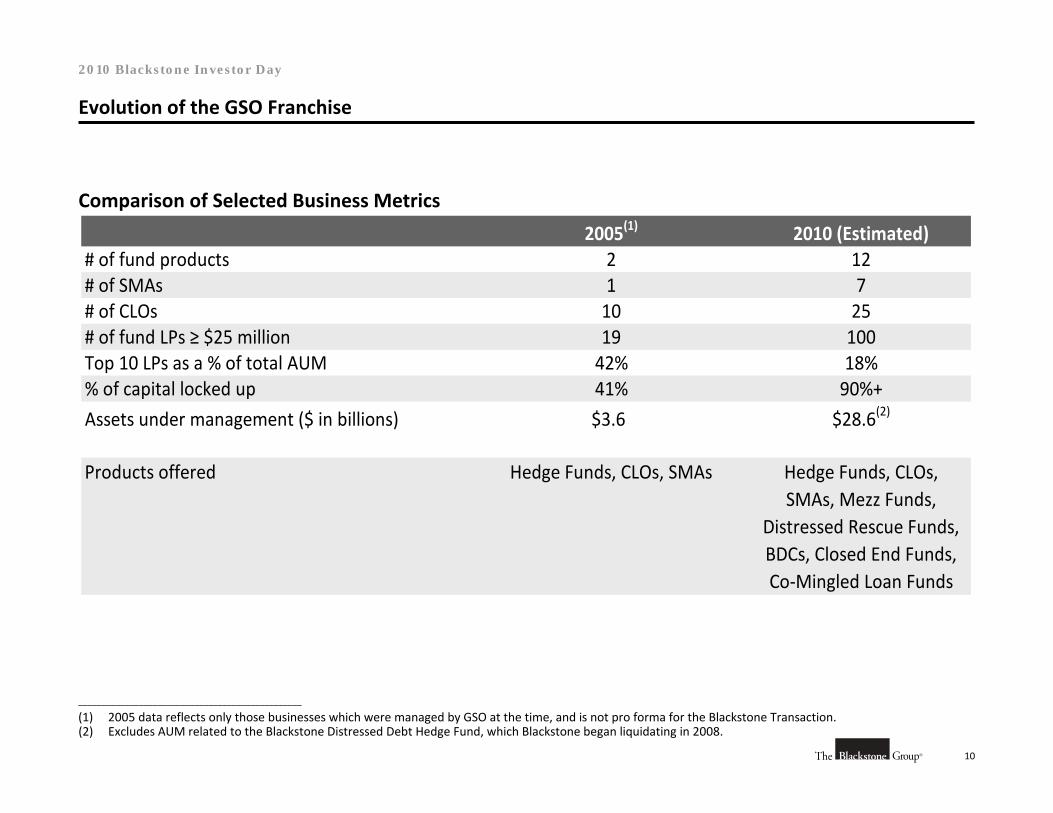
10
2010 Blackstone Investor Day
Evolution of the GSO Franchise
2005(1) 2010 (Estimated)# of fund products 2 12# of SMAs 1 7# of CLOs 10 25# of fund LPs ≥ $25 million 19 100Top 10 LPs as a % of total AUM 42% 18%% of capital locked up 41% 90%+
Assets under management ($ in billions) $3.6 $28.6(2)
Products offered Hedge Funds, CLOs, SMAs Hedge Funds, CLOs, SMAs, Mezz Funds,
Distressed Rescue Funds, BDCs, Closed End Funds, Co‐Mingled Loan Funds
________________________________________________
(1) 2005 data reflects only those businesses which were managed by GSO at the time, and is not pro forma for the Blackstone Transaction.(2) Excludes AUM related to the Blackstone Distressed Debt Hedge Fund, which Blackstone began liquidating in 2008.
Comparison of Selected Business Metrics
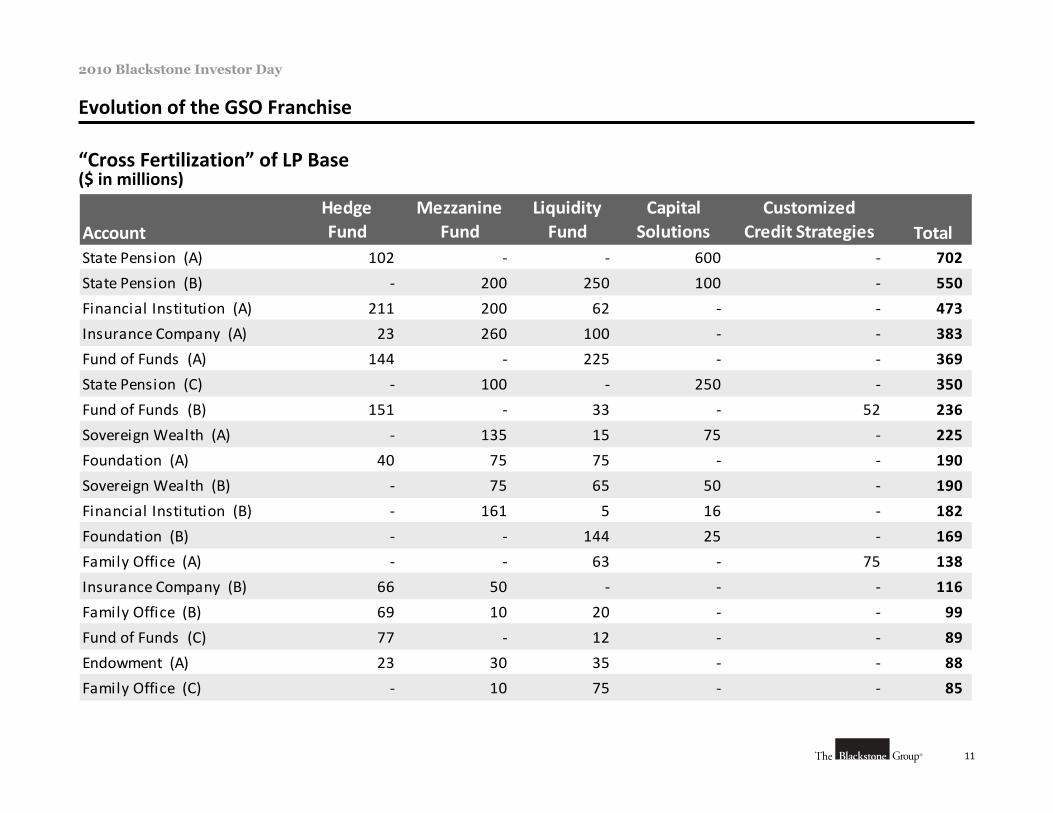
11
2010 Blackstone Investor Day
Evolution of the GSO Franchise
“Cross Fertilization” of LP Base($ in millions)
AccountHedgeFund
Mezzanine Fund
Liquidity Fund
Capital Solutions
CustomizedCredit Strategies Total
State Pension (A) 102 ‐ ‐ 600 ‐ 702
State Pension (B) ‐ 200 250 100 ‐ 550
Financial Institution (A) 211 200 62 ‐ ‐ 473
Insurance Company (A) 23 260 100 ‐ ‐ 383
Fund of Funds (A) 144 ‐ 225 ‐ ‐ 369
State Pension (C) ‐ 100 ‐ 250 ‐ 350
Fund of Funds (B) 151 ‐ 33 ‐ 52 236
Sovereign Wealth (A) ‐ 135 15 75 ‐ 225
Foundation (A) 40 75 75 ‐ ‐ 190
Sovereign Wealth (B) ‐ 75 65 50 ‐ 190
Financial Institution (B) ‐ 161 5 16 ‐ 182
Foundation (B) ‐ ‐ 144 25 ‐ 169
Family Office (A) ‐ ‐ 63 ‐ 75 138
Insurance Company (B) 66 50 ‐ ‐ ‐ 116
Family Office (B) 69 10 20 ‐ ‐ 99
Fund of Funds (C) 77 ‐ 12 ‐ ‐ 89
Endowment (A) 23 30 35 ‐ ‐ 88
Family Office (C) ‐ 10 75 ‐ ‐ 85
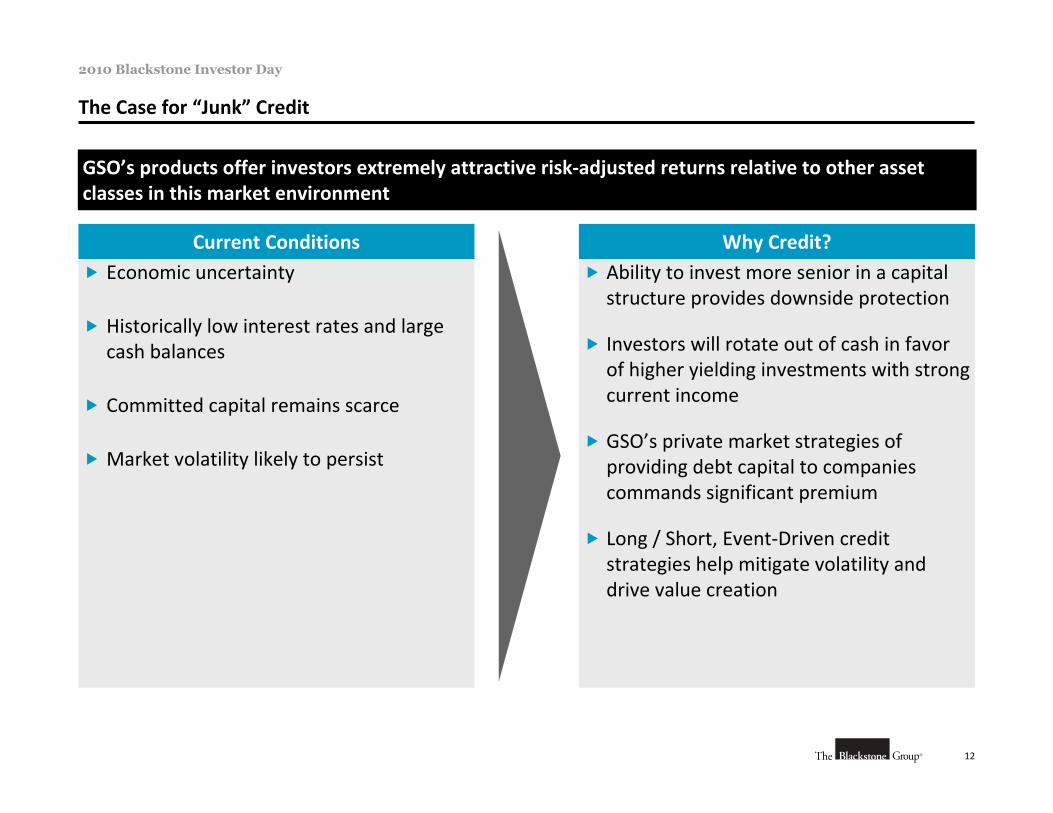
12
2010 Blackstone Investor Day
The Case for “Junk” Credit
GSO’s products offer investors extremely attractive risk‐adjusted returns relative to other asset classes in this market environment
Current Conditions Economic uncertainty
Historically low interest rates and large cash balances
Committed capital remains scarce
Market volatility likely to persist
Why Credit? Ability to invest more senior in a capital
structure provides downside protection
Investors will rotate out of cash in favor of higher yielding investments with strong current income
GSO’s private market strategies of providing debt capital to companies commands significant premium
Long / Short, Event‐Driven credit strategies help mitigate volatility and drive value creation
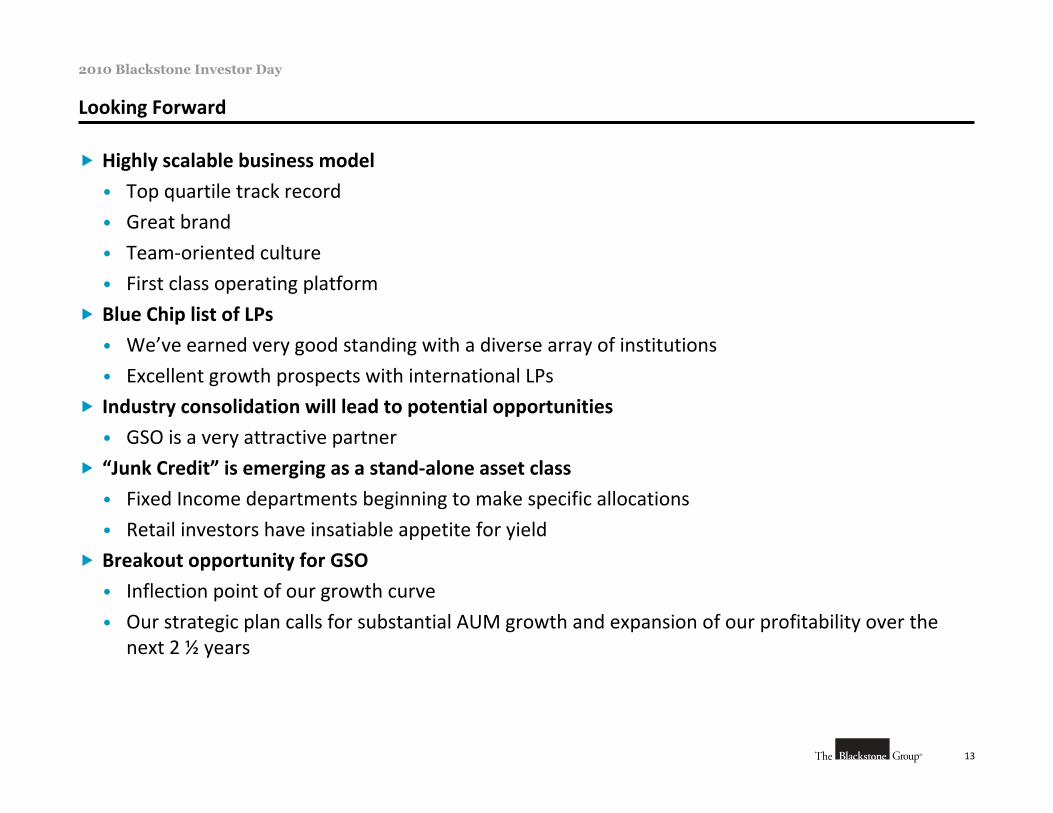
13
2010 Blackstone Investor Day
Looking Forward
Highly scalable business model
• Top quartile track record
• Great brand
• Team‐oriented culture
• First class operating platform
Blue Chip list of LPs
• We’ve earned very good standing with a diverse array of institutions
• Excellent growth prospects with international LPs
Industry consolidation will lead to potential opportunities
• GSO is a very attractive partner
“Junk Credit” is emerging as a stand‐alone asset class
• Fixed Income departments beginning to make specific allocations
• Retail investors have insatiable appetite for yield
Breakout opportunity for GSO
• Inflection point of our growth curve
• Our strategic plan calls for substantial AUM growth and expansion of our profitability over the next 2 ½ years
14
2010 Blackstone Investor Day
Performance Review Footnotes and Disclosures
Performance Review: Hedge Fund
(1) Net performance from January 2006 (first full year of the Fund) through June 2010.
(2) The volatility of the indices reflected above and elsewhere in this report may be materially different from the performance of the Fund. In addition, these indices employ different investmentguidelines and criteria than the Fund; as a result, the holdings in the Fund may differ significantly from the securities that comprise the indices. The performance of these indices has not necessarily been selected to represent an appropriate benchmark to compare to the performance of the Fund, but rather is disclosed to allow for comparison of the Fund’s performance to that of well‐known, relevant indices. A summary of the investment guidelines for these indices is available upon request.
(3) Credit Composite Index reflects the average portfolio construction since inception which consists of the following mix of indices: 60% CS Leveraged Loan Index, 25% CS High Yield Index and 15% CS Leveraged Equity Index which we believe is generally consistent with the mix of the Special Situations Fund.
Performance Review: Mezzanine Fund
Credit Suisse High Yield Index is an unmanaged market value‐weighted index designed to mirror the investable universe of the U.S. dollar‐denominated high yield debt market. New issues are added to the index upon issuance if they qualify according to the following criteria: issues must be publicly registered in the United States or issued under Rule 144A with registration rights; issues must be rated “B” or lower; the minimum amount outstanding is $75 million; and issues must be U.S. dollar‐denominated straight corporate debt, including cash‐pay, zero‐coupon, stepped‐rate and pay‐in‐kind (PIK) bonds. Floating‐rate and convertible bonds and preferred stock are not included; if an issuer has more than two issues outstanding, only the two most liquid issues are included in the index.
Credit Suisse Leveraged Loan Index is an unmanaged market value‐weighted index designed to mirror the investable universe of the U.S. dollar‐denominated leveraged loan market. New issues are added to the index on their effective date if they qualify according to the following criteria: loan facilities must be rated “B” or lower; only fully‐funded term loan facilities are included; and issuers must be domiciled in developed countries.
Standard & Poor’s 500 Index (the “S&P 500”) sets forth the performance of a well‐known broad‐based stock market index assuming reinvestment of dividends. The S&P 500 contains only publicly traded, seasoned equity securities.
Credit Suisse Leveraged Equity Index is an unmanaged market‐weighted index designed to mirror the investable universe of the public equity of issuers in the high yield debt market. The index includes the common stock of every issuer in the Credit Suisse High Yield Index which has public equity.
There are significant differences between the GSO Capital Opportunities Fund I’s investments and the indices. For instance, GSO Capital Opportunities Fund I may use leverage and invest in investments that have a greater degree of risk and volatility, as well as less liquidity, than those investments contained in the indices. Moreover, the indices do not reflect the reinvestment of income or dividends and the indices are not subject to any management fees, performance compensation or expenses. It should not be assumed that GSO Capital Opportunities Fund I will invest in any specific investments that comprise the indices, nor should it be understood to mean that there is a correlation between GSO Capital Opportunities Fund I’s returns and the performance of the indices. The statistical data regarding these indices has been obtained from sources believed to be reliable. It is not possible to invest in these indices. These indices are being presented for comparison purposes only to show how GSO Capital Opportunities Fund I’s performance compares to the broad global markets.
Performance Review: CLO Business
Past performance is not necessarily indicative of future results, and there can be no assurance that the Fund will achieve a comparable composition or that the Fund will be able to implement its investment strategy or achieve its investment objectives. Unless otherwise indicated, all yields and rates of return are presented on a “gross” basis and do not reflect the management fees, fund expenses, organizational expenses, performance compensation, taxes and other related expenses that are borne by investors in the portfolios described herein which, in the aggregate, are expected to be substantial and may result in “net” returns being materially lower than those presented herein. Investors are encouraged to contact GSO representatives to discuss any questions they may have concerning the performance information contained herein. Further information may be made available to such investors upon request.

VIII. Real Estate

A. Real Estate Overview
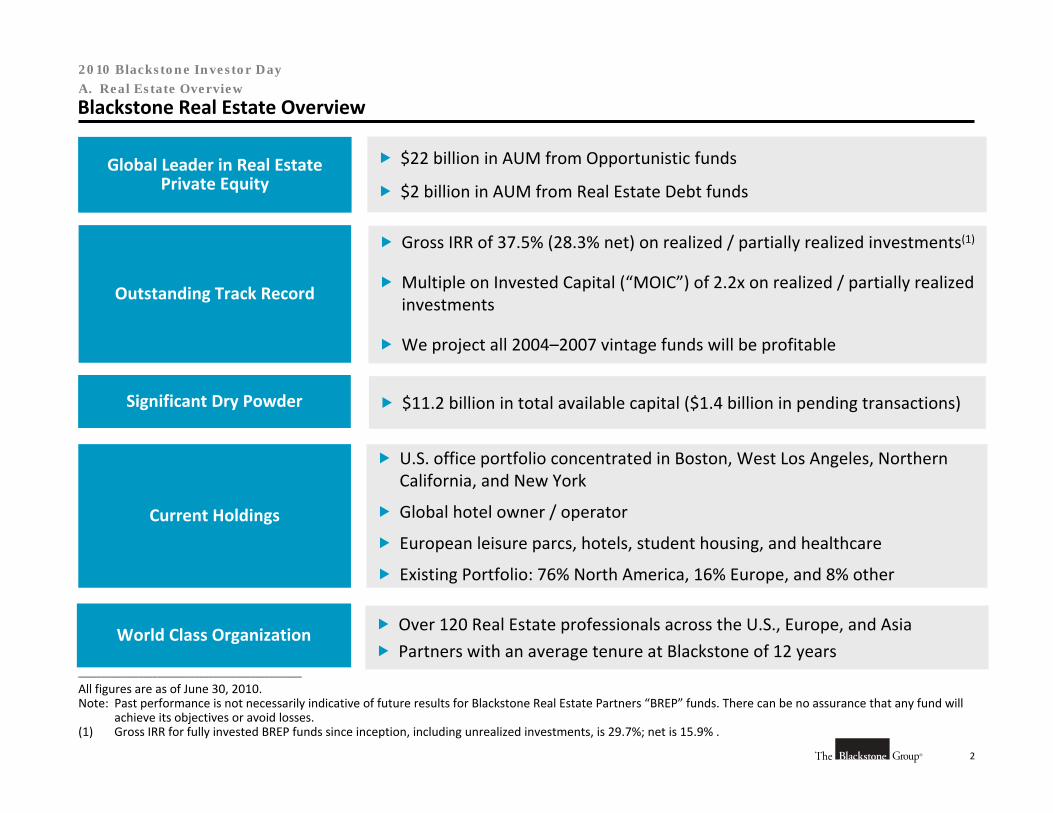
2
2010 Blackstone Investor Day
Blackstone Real Estate Overview
World Class Organization
Global Leader in Real Estate Private Equity
Outstanding Track Record
Significant Dry Powder
Current Holdings
$22 billion in AUM from Opportunistic funds
$2 billion in AUM from Real Estate Debt funds
Gross IRR of 37.5% (28.3% net) on realized / partially realized investments(1)
Multiple on Invested Capital (“MOIC”) of 2.2x on realized / partially realized investments
We project all 2004–2007 vintage funds will be profitable
$11.2 billion in total available capital ($1.4 billion in pending transactions)
U.S. office portfolio concentrated in Boston, West Los Angeles, Northern California, and New York
Global hotel owner / operator
European leisure parcs, hotels, student housing, and healthcare
Existing Portfolio: 76% North America, 16% Europe, and 8% other
Over 120 Real Estate professionals across the U.S., Europe, and Asia
Partners with an average tenure at Blackstone of 12 years________________________________________________
All figures are as of June 30, 2010.Note: Past performance is not necessarily indicative of future results for Blackstone Real Estate Partners “BREP” funds. There can be no assurance that any fund will
achieve its objectives or avoid losses. (1) Gross IRR for fully invested BREP funds since inception, including unrealized investments, is 29.7%; net is 15.9% .
A. Real Estate Overview
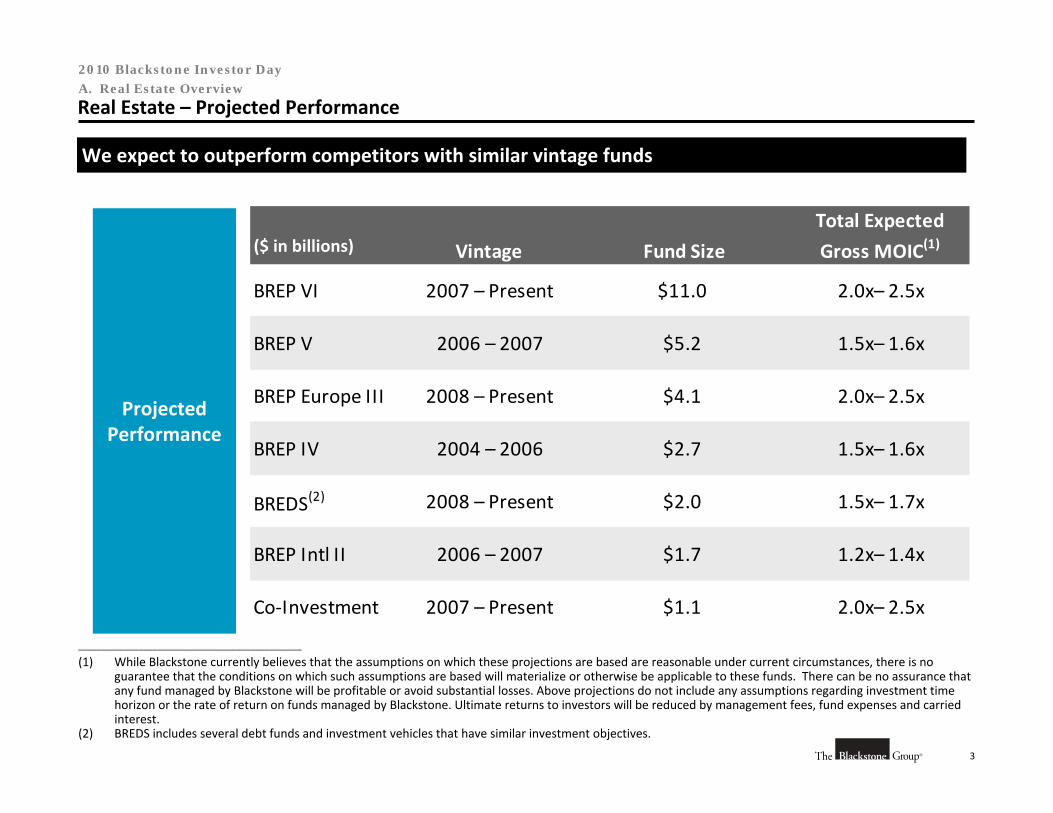
3
2010 Blackstone Investor Day
Real Estate – Projected Performance
We expect to outperform competitors with similar vintage funds
Projected Performance
Vintage Fund Size
Total Expected
Gross MOIC(1)
BREP VI 2007 – Present $11.0 2.0x– 2.5x
BREP V 2006 – 2007 $5.2 1.5x– 1.6x
BREP Europe III 2008 – Present $4.1 2.0x– 2.5x
BREP IV 2004 – 2006 $2.7 1.5x– 1.6x
BREDS(2) 2008 – Present $2.0 1.5x– 1.7x
BREP Intl II 2006 – 2007 $1.7 1.2x– 1.4x
Co‐Investment 2007 – Present $1.1 2.0x– 2.5x
________________________________________________
(1) While Blackstone currently believes that the assumptions on which these projections are based are reasonable under current circumstances, there is no guarantee that the conditions on which such assumptions are based will materialize or otherwise be applicable to these funds. There can be no assurance that any fund managed by Blackstone will be profitable or avoid substantial losses. Above projections do not include any assumptions regarding investment time horizon or the rate of return on funds managed by Blackstone. Ultimate returns to investors will be reduced by management fees, fund expenses and carried interest.
(2) BREDS includes several debt funds and investment vehicles that have similar investment objectives.
A. Real Estate Overview
($ in billions)
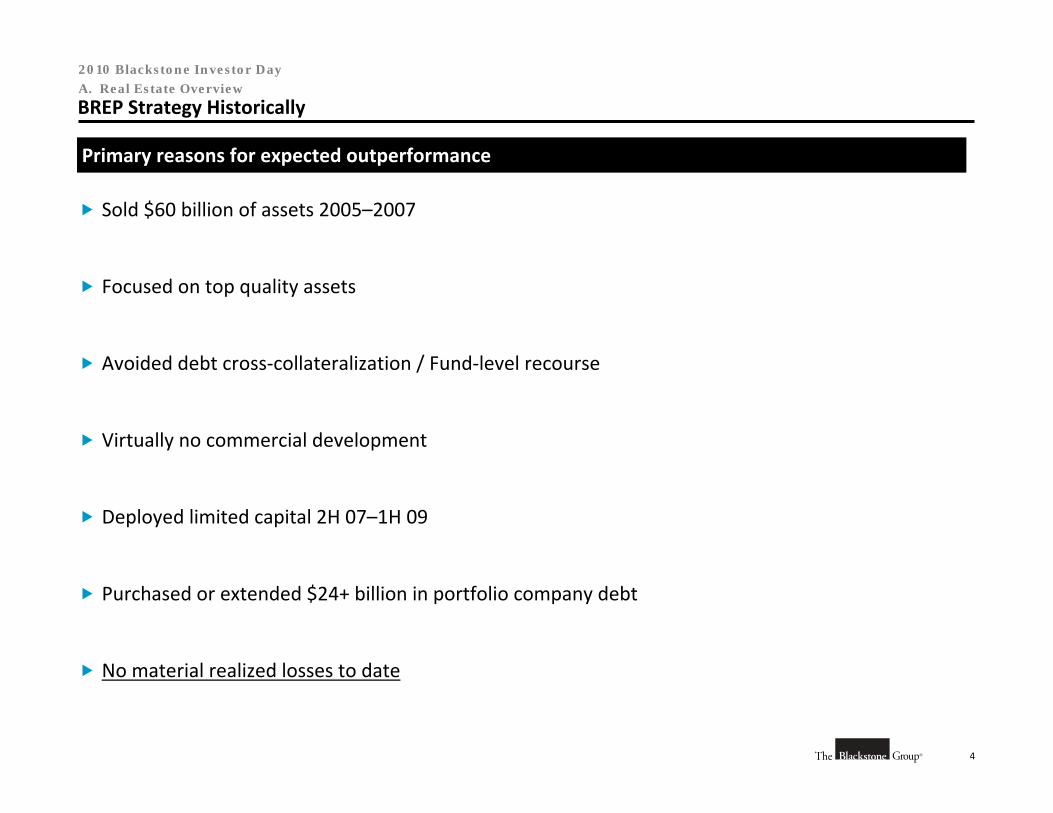
4
2010 Blackstone Investor Day
BREP Strategy Historically
Primary reasons for expected outperformance
Sold $60 billion of assets 2005–2007
Focused on top quality assets
Avoided debt cross‐collateralization / Fund‐level recourse
Virtually no commercial development
Deployed limited capital 2H 07–1H 09
Purchased or extended $24+ billion in portfolio company debt
No material realized losses to date
A. Real Estate Overview
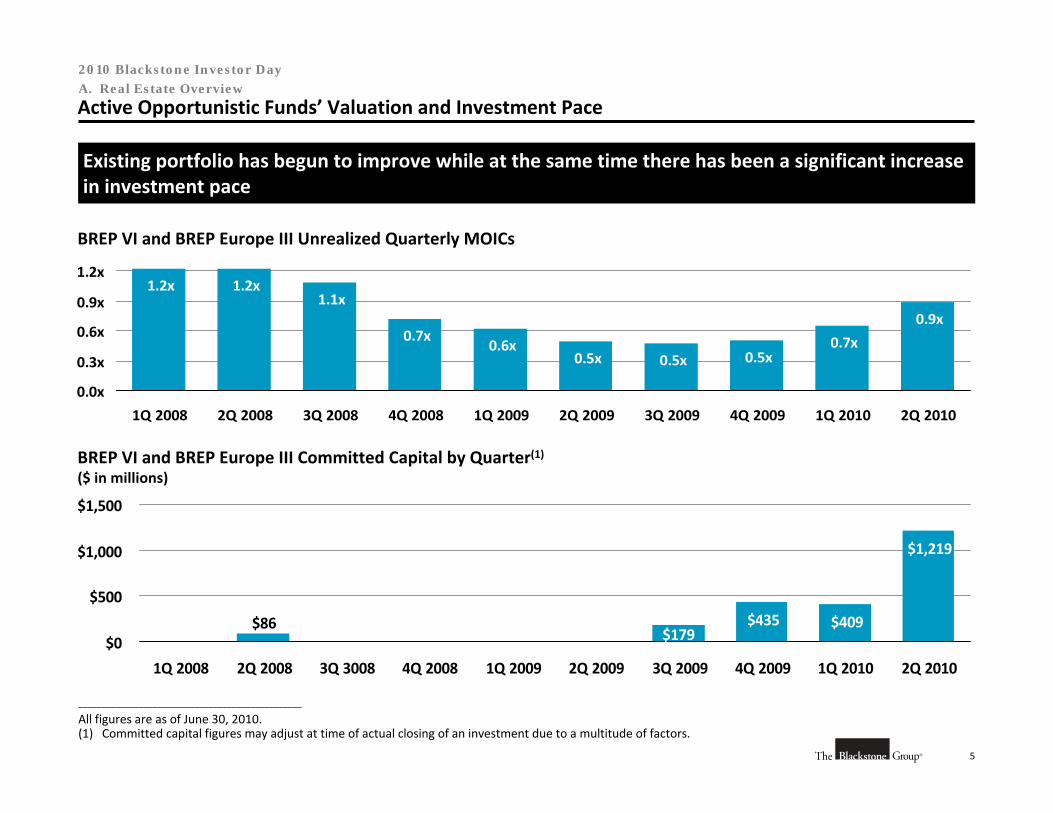
5
2010 Blackstone Investor Day
Active Opportunistic Funds’ Valuation and Investment Pace
0.5x 0.5x
0.9x
0.7x
1.2x
0.5x 0.6x
1.1x
0.7x
1.2x
0.0x
0.3x
0.6x
0.9x
1.2x
1Q 2008 2Q 2008 3Q 2008 4Q 2008 1Q 2009 2Q 2009 3Q 2009 4Q 2009 1Q 2010 2Q 2010
BREP VI and BREP Europe III Unrealized Quarterly MOICs
Existing portfolio has begun to improve while at the same time there has been a significant increase in investment pace
$179 $86 $435 $409
$1,219
$0
$500
$1,000
$1,500
1Q 2008 2Q 2008 3Q 3008 4Q 2008 1Q 2009 2Q 2009 3Q 2009 4Q 2009 1Q 2010 2Q 2010
BREP VI and BREP Europe III Committed Capital by Quarter(1)($ in millions)
A. Real Estate Overview
________________________________________________
All figures are as of June 30, 2010.(1) Committed capital figures may adjust at time of actual closing of an investment due to a multitude of factors.
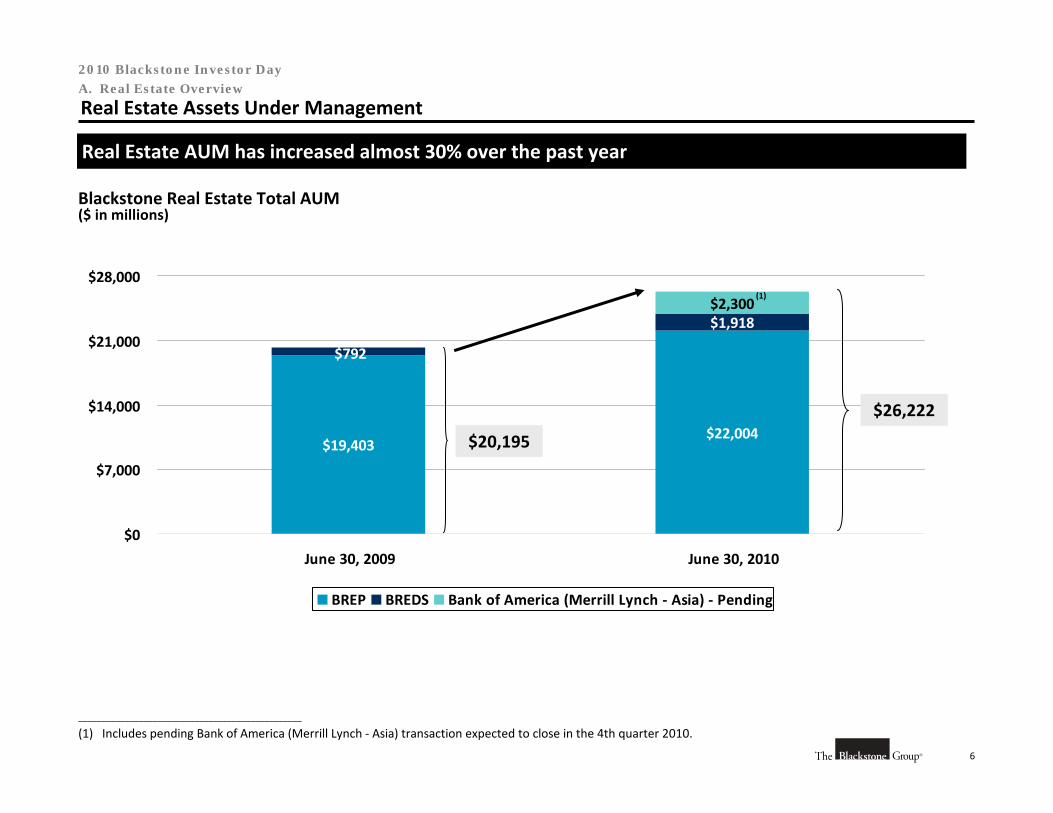
6
2010 Blackstone Investor Day
________________________________________________
(1) Includes pending Bank of America (Merrill Lynch ‐ Asia) transaction expected to close in the 4th quarter 2010.
Real Estate AUM has increased almost 30% over the past year
Real Estate Assets Under Management
Blackstone Real Estate Total AUM($ in millions)
A. Real Estate Overview
$19,403$22,004
$1,918
$792
$2,300
$0
$7,000
$14,000
$21,000
$28,000
June 30, 2009 June 30, 2010
BREP BREDS Bank of America (Merrill Lynch ‐ Asia) ‐ Pending
(1)
$20,195
$26,222
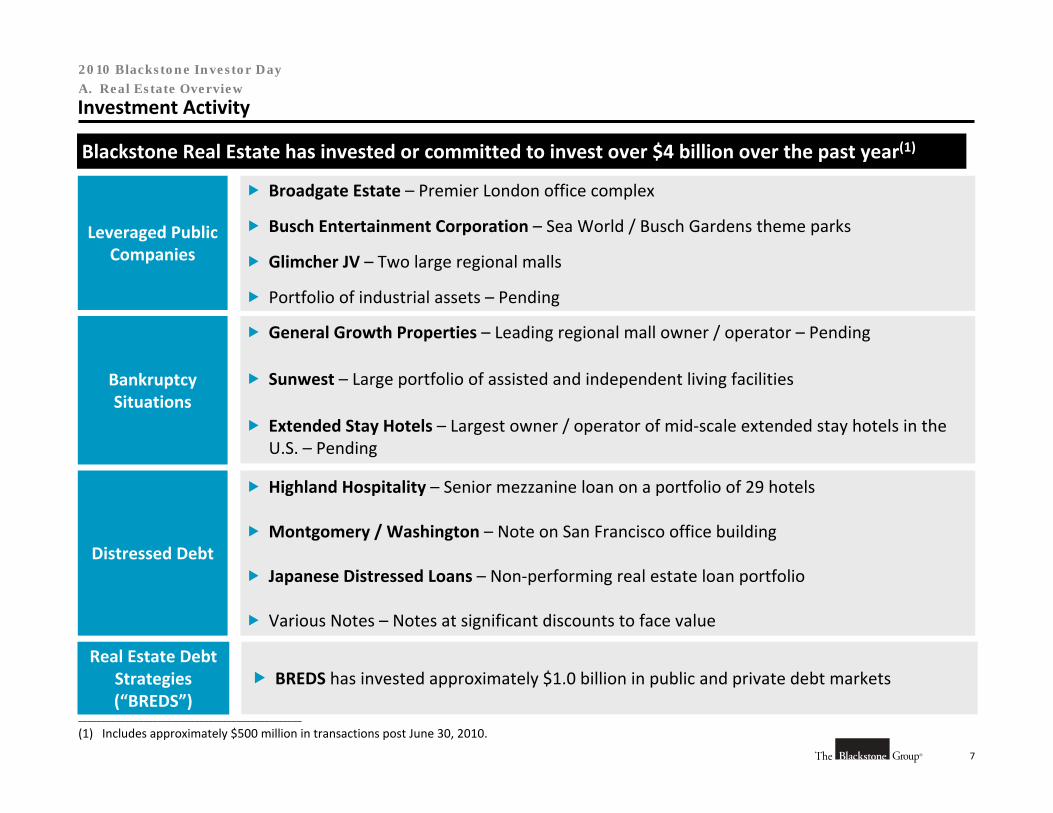
7
2010 Blackstone Investor Day
Investment Activity
Blackstone Real Estate has invested or committed to invest over $4 billion over the past year(1)
Broadgate Estate – Premier London office complex
Busch Entertainment Corporation – Sea World / Busch Gardens theme parks
Glimcher JV – Two large regional malls
Portfolio of industrial assets – Pending
General Growth Properties – Leading regional mall owner / operator – Pending
Sunwest – Large portfolio of assisted and independent living facilities
Extended Stay Hotels – Largest owner / operator of mid‐scale extended stay hotels in the U.S. – Pending
Highland Hospitality – Senior mezzanine loan on a portfolio of 29 hotels
Montgomery / Washington – Note on San Francisco office building
Japanese Distressed Loans – Non‐performing real estate loan portfolio
Various Notes – Notes at significant discounts to face value
Leveraged Public Companies
Bankruptcy Situations
Distressed Debt
BREDS has invested approximately $1.0 billion in public and private debt marketsReal Estate Debt
Strategies (“BREDS”)
A. Real Estate Overview
________________________________________________
(1) Includes approximately $500 million in transactions post June 30, 2010.
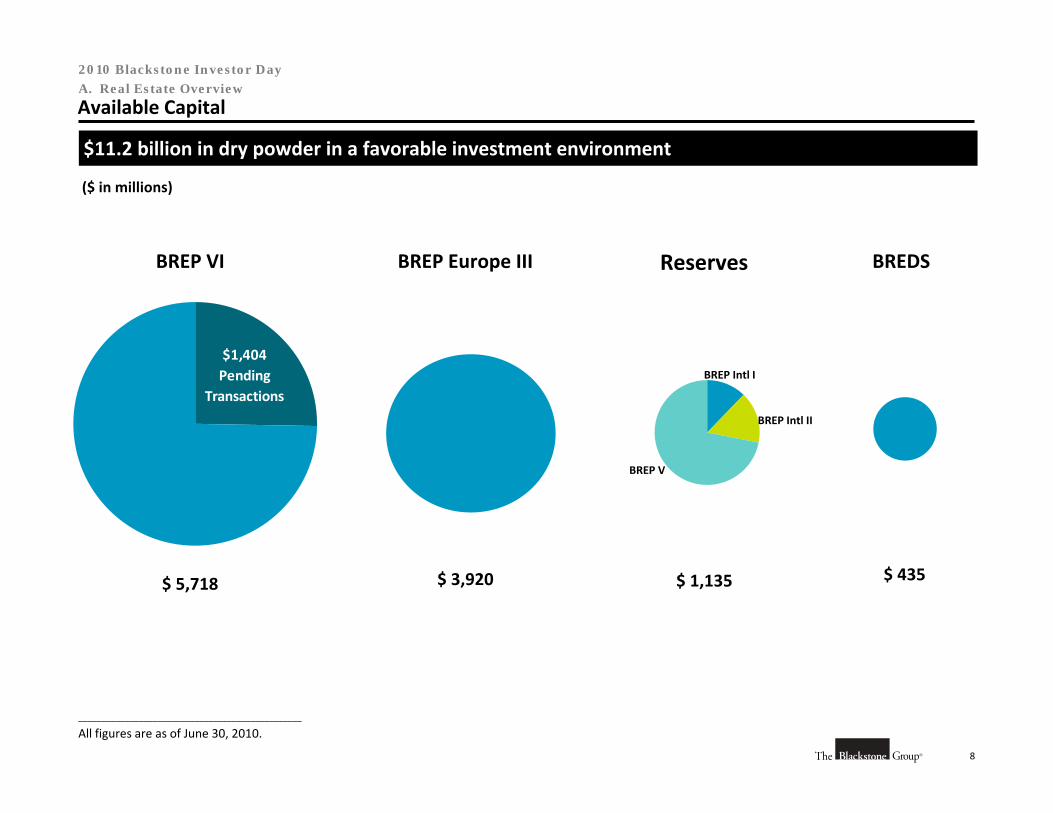
8
2010 Blackstone Investor Day
Available Capital
$11.2 billion in dry powder in a favorable investment environment
($ in millions)
A. Real Estate Overview
________________________________________________
All figures are as of June 30, 2010.
$1,404Pending
Transactions
ReservesBREP VI BREP Europe III BREDS
$ 5,718 $ 1,135$ 3,920 $ 435
BREP Intl I
BREP Intl II
BREP V

B. Real Estate Market Overview
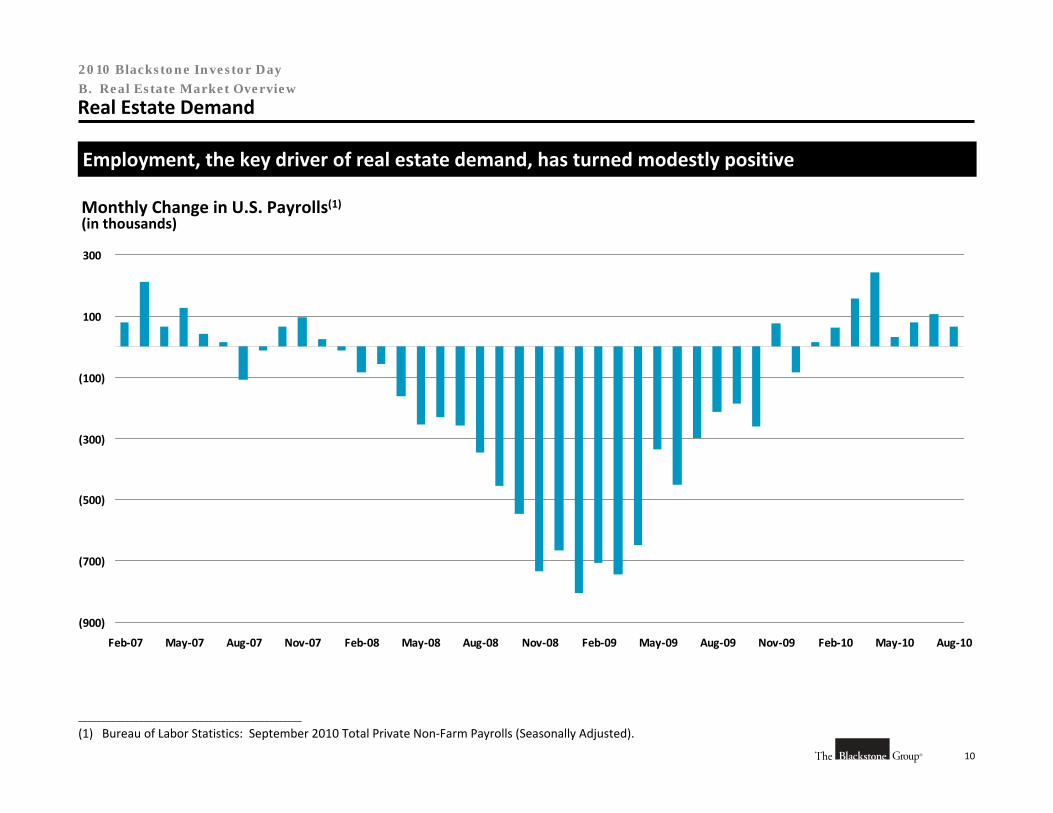
10
2010 Blackstone Investor Day
________________________________________________
(1) Bureau of Labor Statistics: September 2010 Total Private Non‐Farm Payrolls (Seasonally Adjusted).
Real Estate Demand
Monthly Change in U.S. Payrolls(1)(in thousands)
(900)
(700)
(500)
(300)
(100)
100
300
Feb‐07 May‐07 Aug‐07 Nov‐07 Feb‐08 May‐08 Aug‐08 Nov‐08 Feb‐09 May‐09 Aug‐09 Nov‐09 Feb‐10 May‐10 Aug‐10
Employment, the key driver of real estate demand, has turned modestly positive
B. Real Estate Market Overview
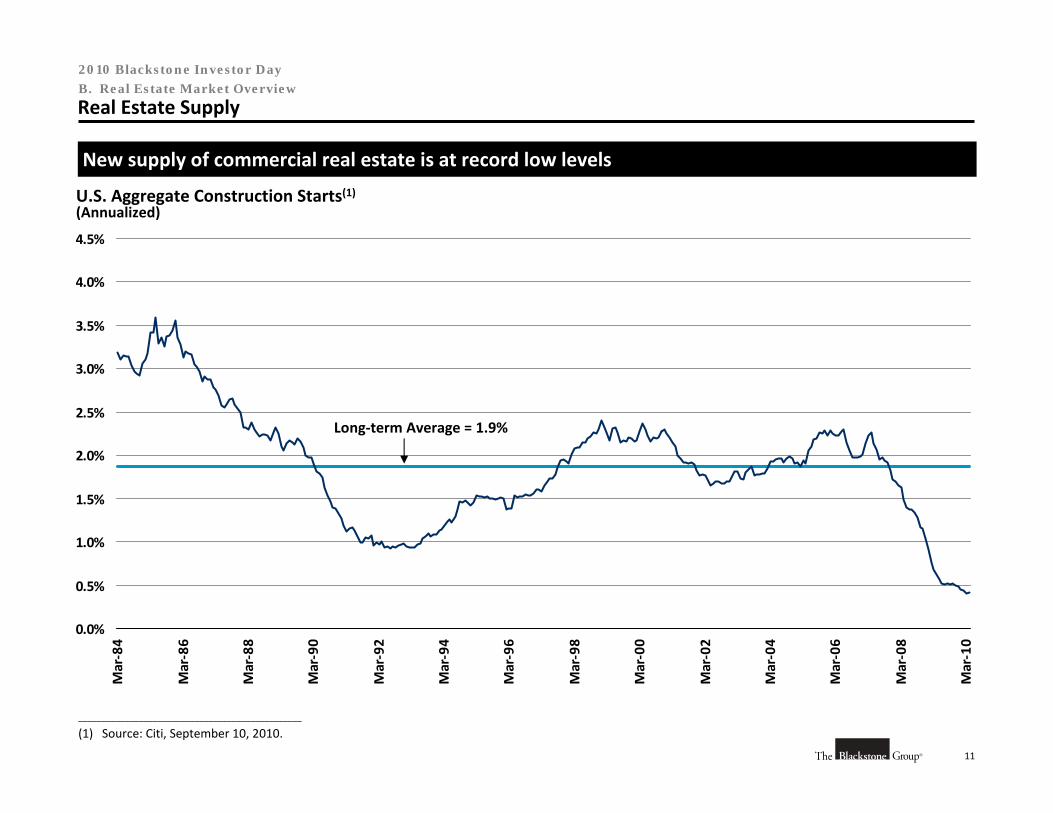
11
2010 Blackstone Investor Day
0.0%
0.5%
1.0%
1.5%
2.0%
2.5%
3.0%
3.5%
4.0%
4.5%
Mar‐84
Mar‐86
Mar‐88
Mar‐90
Mar‐92
Mar‐94
Mar‐96
Mar‐98
Mar‐00
Mar‐02
Mar‐04
Mar‐06
Mar‐08
Mar‐10
New supply of commercial real estate is at record low levels
U.S. Aggregate Construction Starts(1)(Annualized)
Long‐term Average = 1.9%
________________________________________________
(1) Source: Citi, September 10, 2010.
Real Estate SupplyB. Real Estate Market Overview
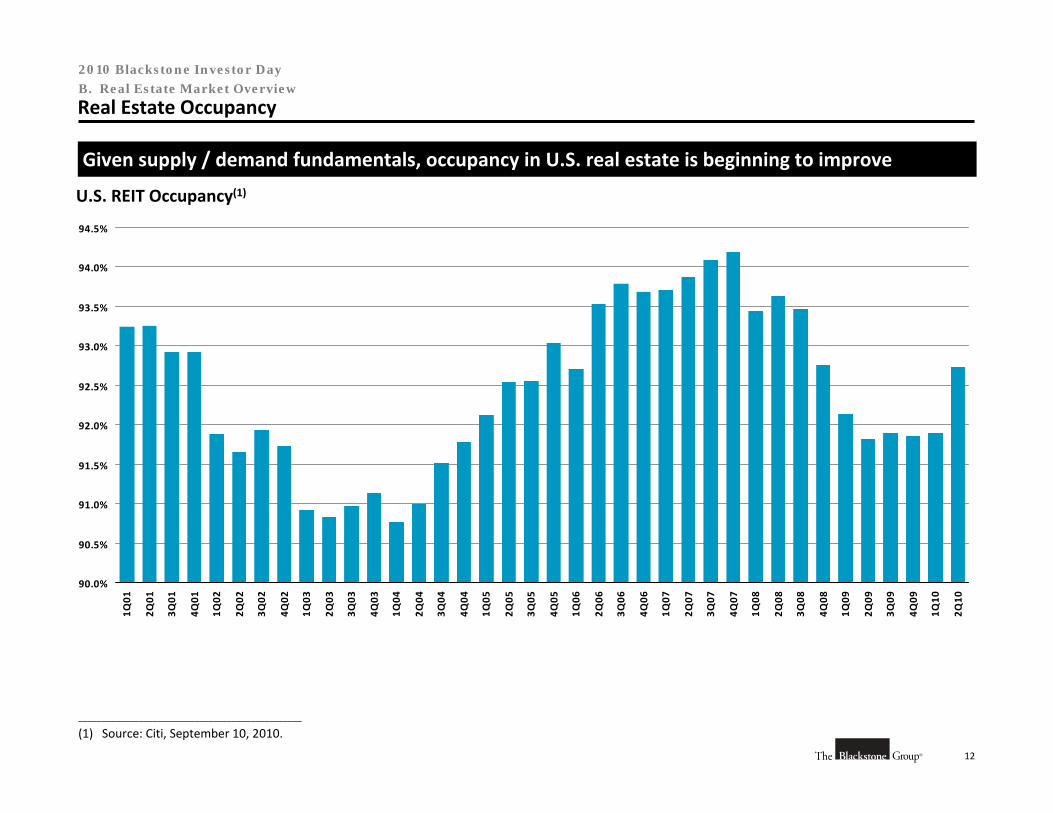
12
2010 Blackstone Investor Day
Real Estate Occupancy
U.S. REIT Occupancy(1)
Given supply / demand fundamentals, occupancy in U.S. real estate is beginning to improve
90.0%
90.5%
91.0%
91.5%
92.0%
92.5%
93.0%
93.5%
94.0%
94.5%
1Q01
2Q01
3Q01
4Q01
1Q02
2Q02
3Q02
4Q02
1Q03
2Q03
3Q03
4Q03
1Q04
2Q04
3Q04
4Q04
1Q05
2Q05
3Q05
4Q05
1Q06
2Q06
3Q06
4Q06
1Q07
2Q07
3Q07
4Q07
1Q08
2Q08
3Q08
4Q08
1Q09
2Q09
3Q09
4Q09
1Q10
2Q10
B. Real Estate Market Overview
________________________________________________
(1) Source: Citi, September 10, 2010.
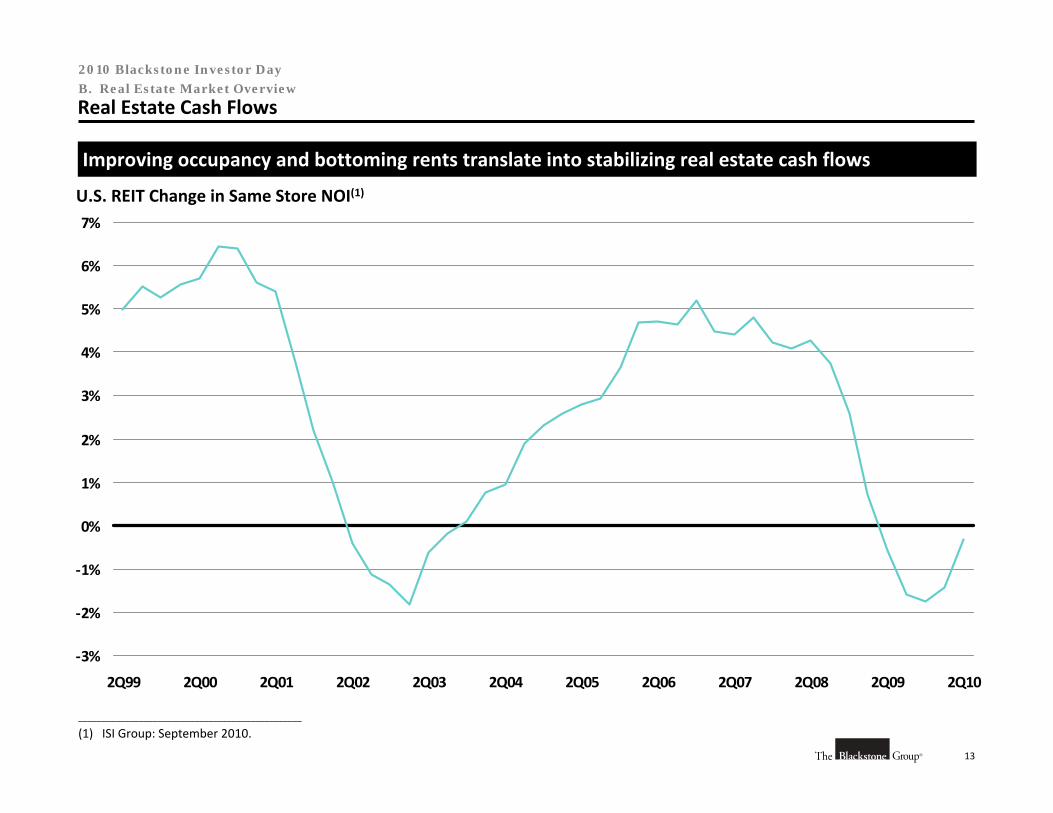
13
2010 Blackstone Investor Day
‐3%
‐2%
‐1%
0%
1%
2%
3%
4%
5%
6%
7%
2Q99 2Q00 2Q01 2Q02 2Q03 2Q04 2Q05 2Q06 2Q07 2Q08 2Q09 2Q10
Real Estate Cash Flows
U.S. REIT Change in Same Store NOI(1)
Improving occupancy and bottoming rents translate into stabilizing real estate cash flows
B. Real Estate Market Overview
________________________________________________
(1) ISI Group: September 2010.
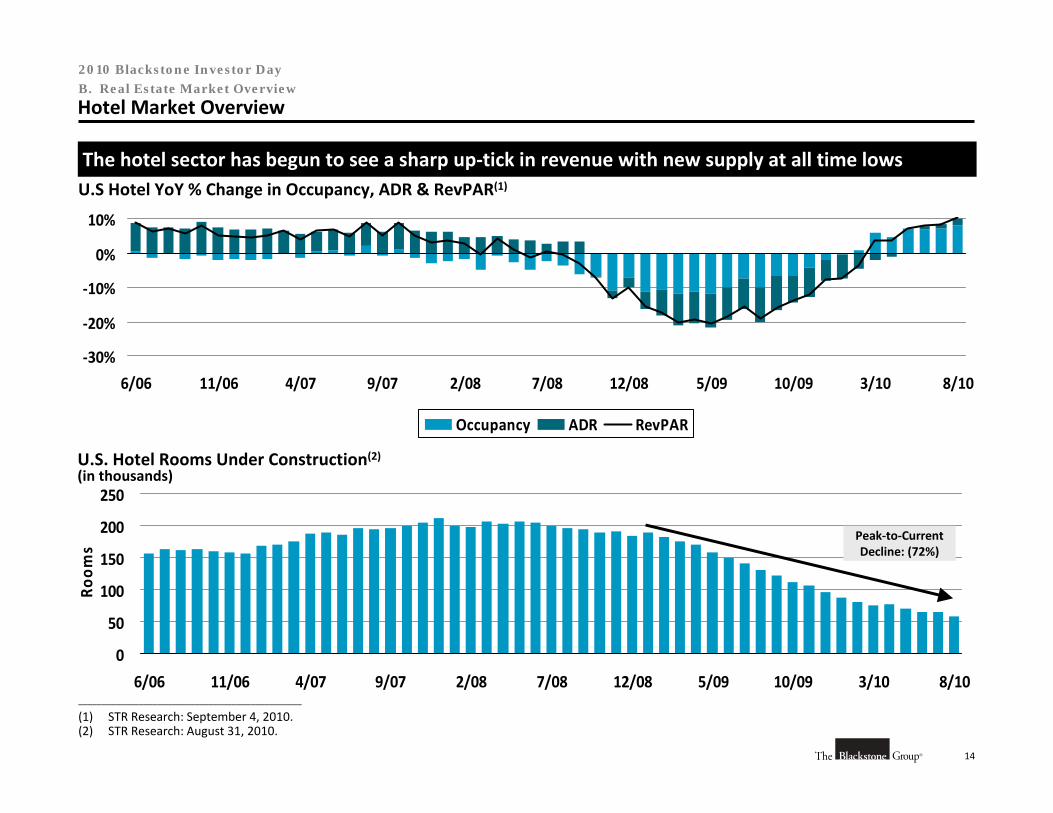
14
2010 Blackstone Investor Day
0
50
100
150
200
250
6/06 11/06 4/07 9/07 2/08 7/08 12/08 5/09 10/09 3/10 8/10
Room
s
‐30%
‐20%
‐10%
0%
10%
6/06 11/06 4/07 9/07 2/08 7/08 12/08 5/09 10/09 3/10 8/10
Occupancy ADR RevPAR
Hotel Market Overview
The hotel sector has begun to see a sharp up‐tick in revenue with new supply at all time lows
U.S. Hotel Rooms Under Construction(2)
(in thousands)
Peak‐to‐Current Decline: (72%)
U.S Hotel YoY % Change in Occupancy, ADR & RevPAR(1)
B. Real Estate Market Overview
________________________________________________
(1) STR Research: September 4, 2010.(2) STR Research: August 31, 2010.
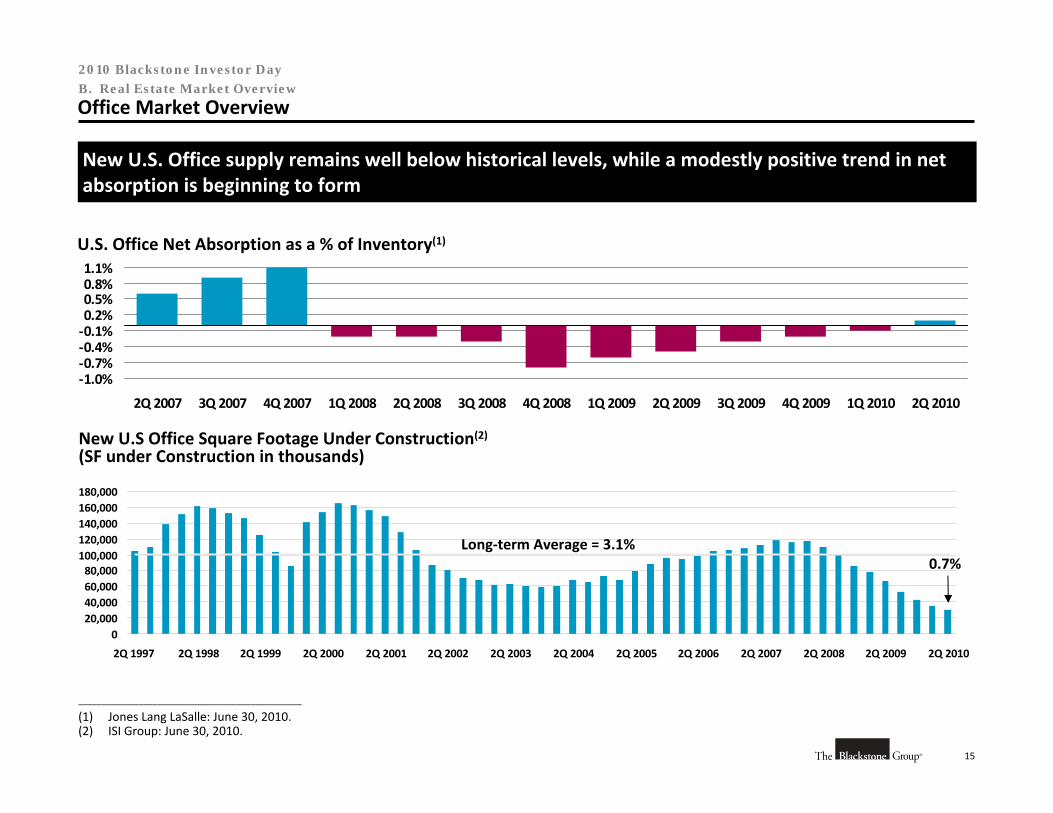
15
2010 Blackstone Investor Day
Office Market Overview
020,00040,00060,00080,000100,000120,000140,000160,000180,000
2Q 1997 2Q 1998 2Q 1999 2Q 2000 2Q 2001 2Q 2002 2Q 2003 2Q 2004 2Q 2005 2Q 2006 2Q 2007 2Q 2008 2Q 2009 2Q 2010
New U.S. Office supply remains well below historical levels, while a modestly positive trend in net absorption is beginning to form
Long‐term Average = 3.1%0.7%
B. Real Estate Market Overview
U.S. Office Net Absorption as a % of Inventory(1)
New U.S Office Square Footage Under Construction(2)
(SF under Construction in thousands)
________________________________________________
(1) Jones Lang LaSalle: June 30, 2010.(2) ISI Group: June 30, 2010.
‐1.0%‐0.7%‐0.4%‐0.1%0.2%0.5%0.8%1.1%
2Q 2007 3Q 2007 4Q 2007 1Q 2008 2Q 2008 3Q 2008 4Q 2008 1Q 2009 2Q 2009 3Q 2009 4Q 2009 1Q 2010 2Q 2010
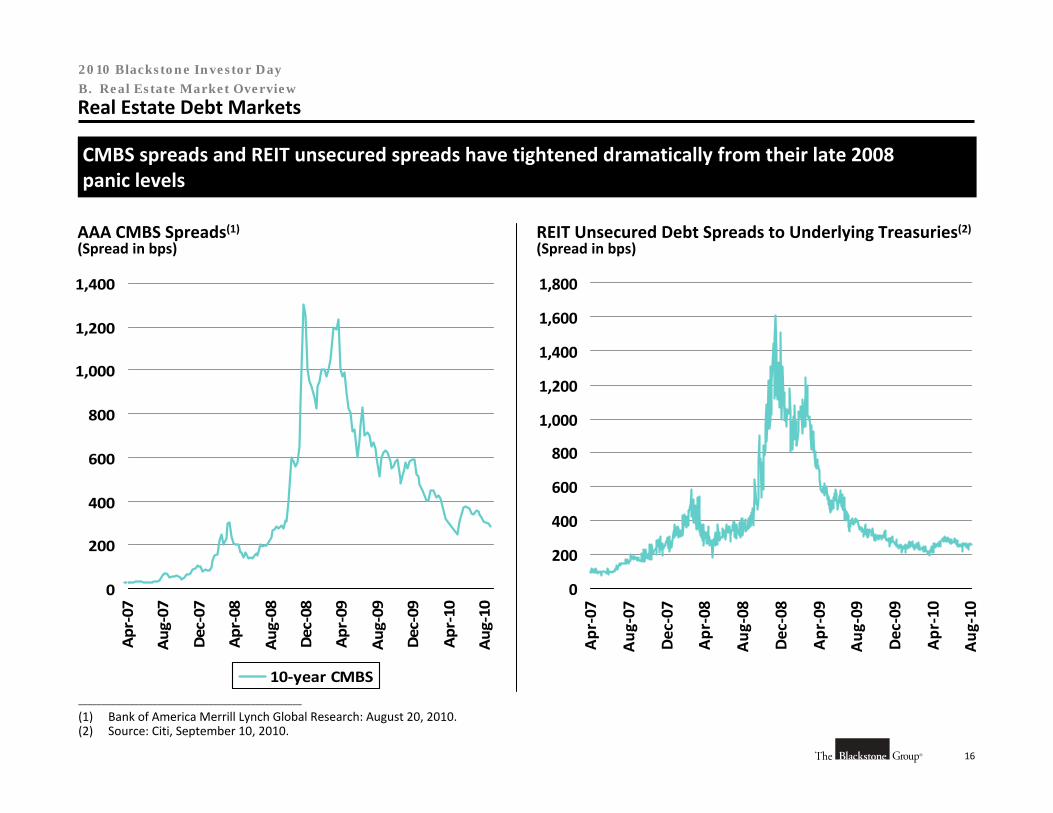
16
2010 Blackstone Investor Day
AAA CMBS Spreads(1)(Spread in bps)
0
200
400
600
800
1,000
1,200
1,400
Apr‐07
Aug‐07
Dec‐07
Apr‐08
Aug‐08
Dec‐08
Apr‐09
Aug‐09
Dec‐09
Apr‐10
Aug‐10
10‐year CMBS
CMBS spreads and REIT unsecured spreads have tightened dramatically from their late 2008 panic levels
REIT Unsecured Debt Spreads to Underlying Treasuries(2)(Spread in bps)
Real Estate Debt Markets
0
200
400
600
800
1,000
1,200
1,400
1,600
1,800
Apr‐07
Aug
‐07
Dec‐07
Apr‐08
Aug
‐08
Dec‐08
Apr‐09
Aug
‐09
Dec‐09
Apr‐10
Aug
‐10
B. Real Estate Market Overview
________________________________________________
(1) Bank of America Merrill Lynch Global Research: August 20, 2010.(2) Source: Citi, September 10, 2010.
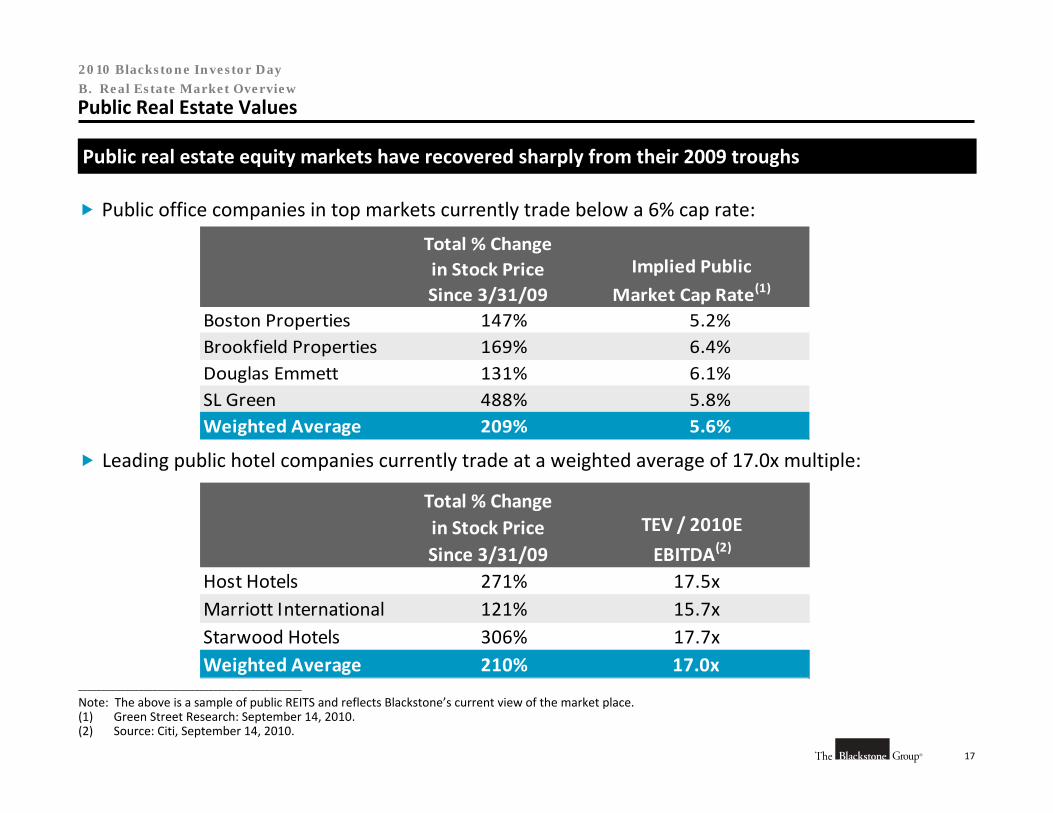
17
2010 Blackstone Investor Day
Public Real Estate Values
Total % Change in Stock PriceSince 3/31/09
Implied Public
Market Cap Rate(1)
Boston Properties 147% 5.2%Brookfield Properties 169% 6.4%Douglas Emmett 131% 6.1%SL Green 488% 5.8%Weighted Average 209% 5.6%
Public real estate equity markets have recovered sharply from their 2009 troughs
Public office companies in top markets currently trade below a 6% cap rate:
Leading public hotel companies currently trade at a weighted average of 17.0x multiple:
Total % Change in Stock PriceSince 3/31/09
TEV / 2010E
EBITDA(2)
Host Hotels 271% 17.5xMarriott International 121% 15.7xStarwood Hotels 306% 17.7xWeighted Average 210% 17.0x
B. Real Estate Market Overview
________________________________________________
Note: The above is a sample of public REITS and reflects Blackstone’s current view of the market place.(1) Green Street Research: September 14, 2010.(2) Source: Citi, September 14, 2010.
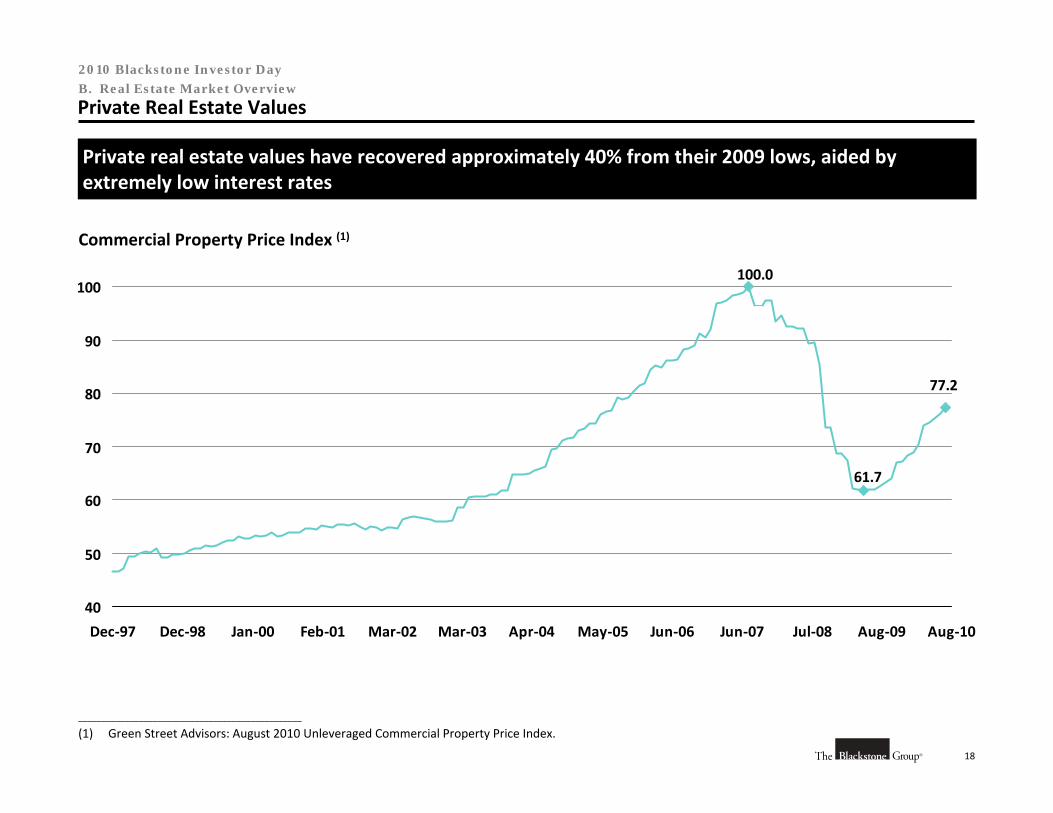
18
2010 Blackstone Investor Day
Private Real Estate Values
Commercial Property Price Index (1)
77.2
61.7
100.0
40
50
60
70
80
90
100
Dec‐97 Dec‐98 Jan‐00 Feb‐01 Mar‐02 Mar‐03 Apr‐04 May‐05 Jun‐06 Jun‐07 Jul‐08 Aug‐09 Aug‐10
Private real estate values have recovered approximately 40% from their 2009 lows, aided by extremely low interest rates
B. Real Estate Market Overview
________________________________________________
(1) Green Street Advisors: August 2010 Unleveraged Commercial Property Price Index.
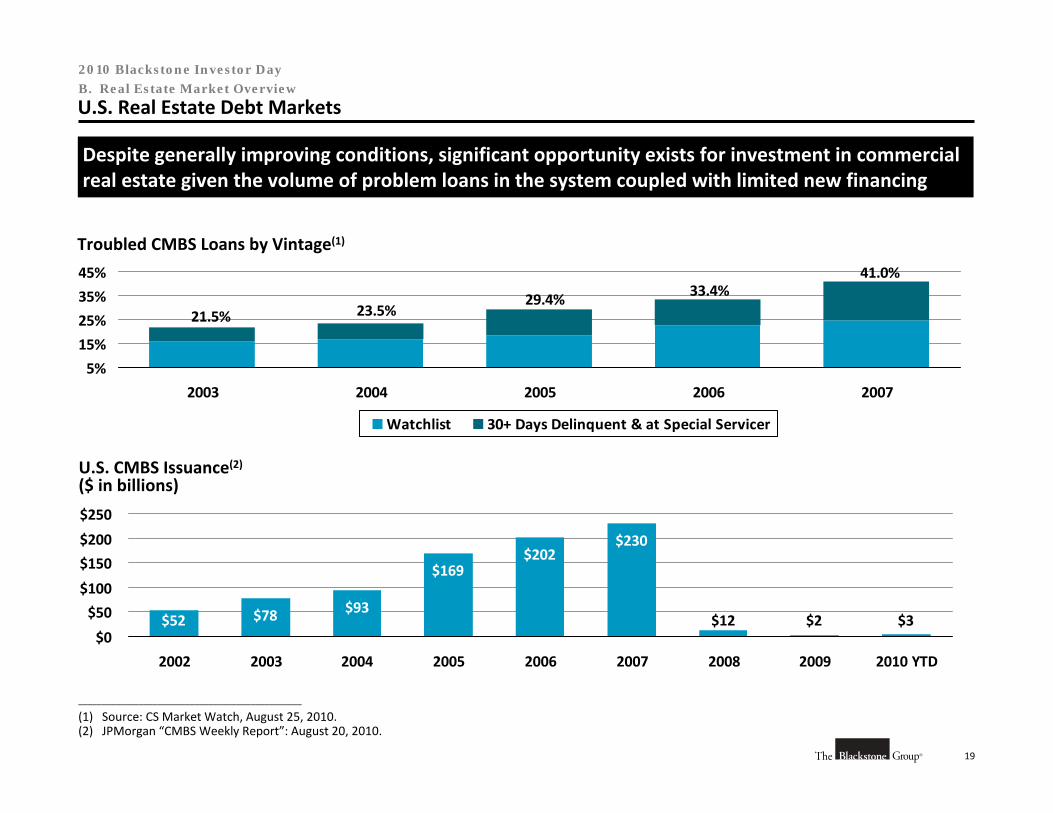
19
2010 Blackstone Investor Day
U.S. Real Estate Debt Markets
Despite generally improving conditions, significant opportunity exists for investment in commercial real estate given the volume of problem loans in the system coupled with limited new financing
B. Real Estate Market Overview
________________________________________________
(1) Source: CS Market Watch, August 25, 2010.(2) JPMorgan “CMBS Weekly Report”: August 20, 2010.
41.0%33.4%29.4%
23.5%21.5%
5%
15%
25%
35%
45%
2003 2004 2005 2006 2007
Watchlist 30+ Days Delinquent & at Special Servicer
Troubled CMBS Loans by Vintage(1)
U.S. CMBS Issuance(2)($ in billions)
$52 $78 $93
$169$202
$3$2$12
$230
$0
$50
$100
$150
$200
$250
2002 2003 2004 2005 2006 2007 2008 2009 2010 YTD
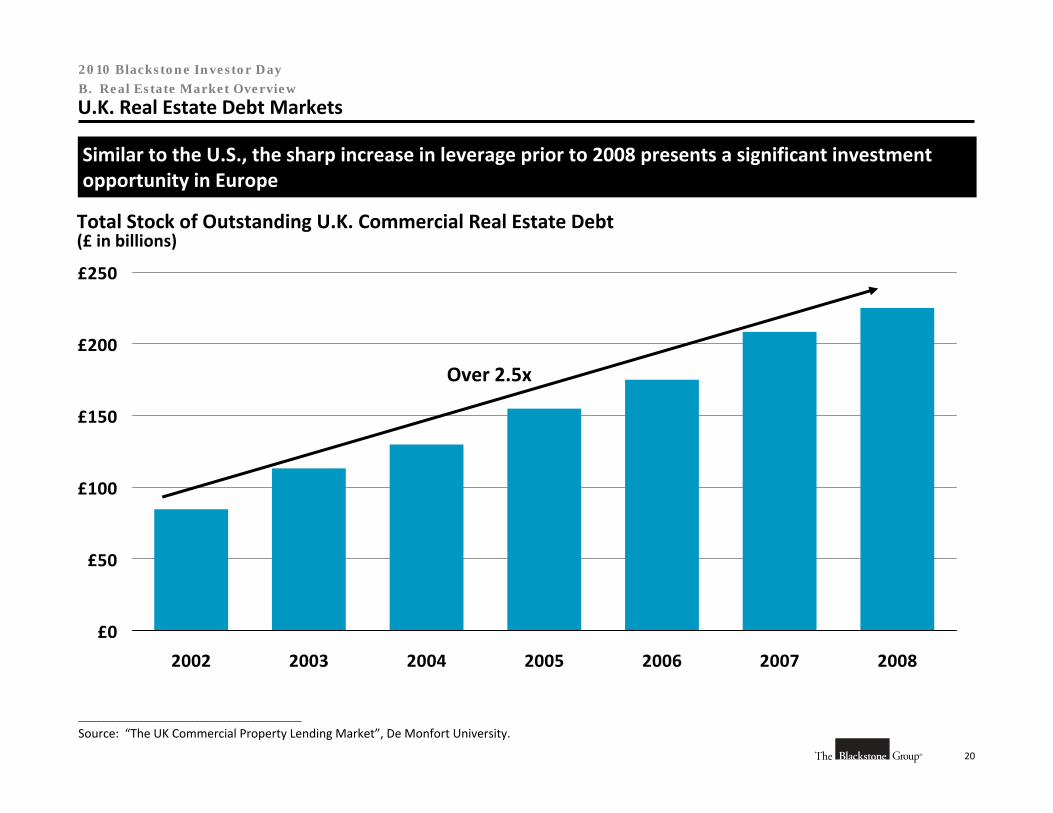
20
2010 Blackstone Investor Day
U.K. Real Estate Debt Markets
Total Stock of Outstanding U.K. Commercial Real Estate Debt(£ in billions)
£0
£50
£100
£150
£200
£250
2002 2003 2004 2005 2006 2007 2008
Similar to the U.S., the sharp increase in leverage prior to 2008 presents a significant investment opportunity in Europe
Over 2.5x
B. Real Estate Market Overview
________________________________________________
Source: “The UK Commercial Property Lending Market”, De Monfort University.

C. Blackstone Real Estate Outlook
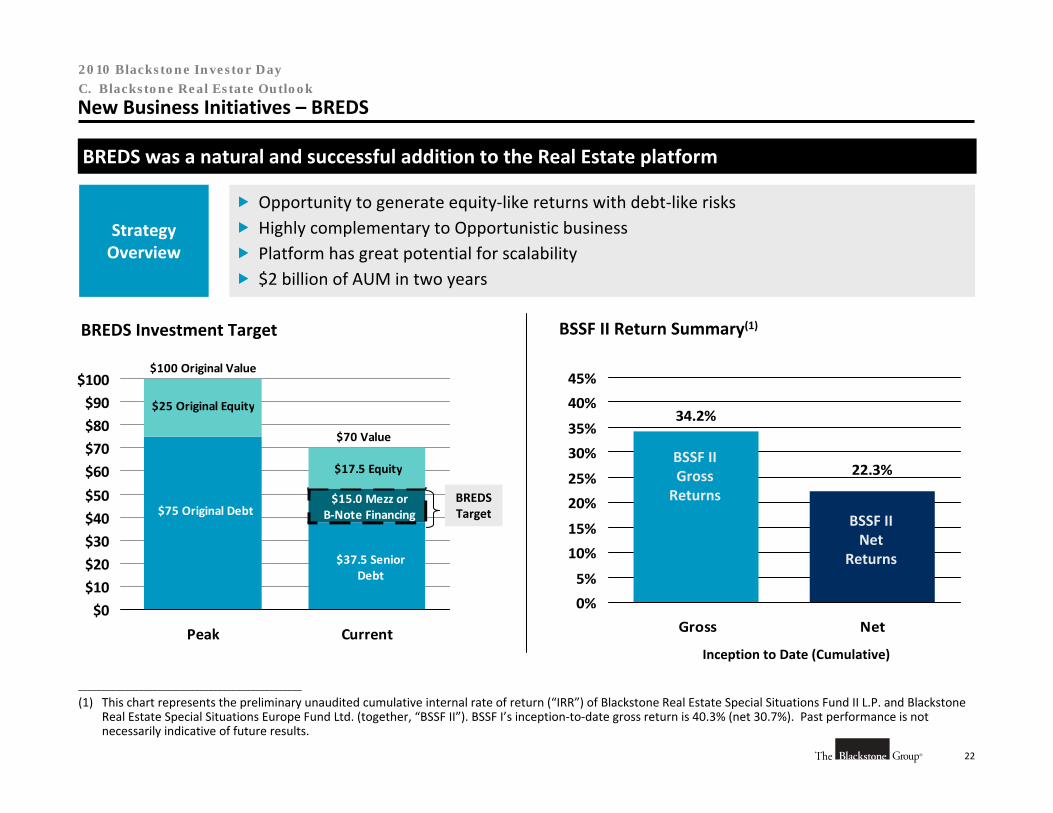
22
2010 Blackstone Investor Day
New Business Initiatives – BREDS
BREDS was a natural and successful addition to the Real Estate platform
C. Blackstone Real Estate Outlook
34.2%
22.3%
0%
5%
10%
15%
20%
25%
30%
35%
40%
45%
Gross Net
BSSF IIGrossReturns
BSSF II Return Summary(1)
Strategy Overview
Opportunity to generate equity‐like returns with debt‐like risks Highly complementary to Opportunistic business Platform has great potential for scalability $2 billion of AUM in two years
$0
$10
$20
$30
$40
$50
$60
$70
$80
$90
$100
Peak Current
$75 Original Debt
$25 Original Equity
$17.5 Equity
$15.0 Mezz or B‐Note Financing
$37.5 Senior Debt
$100 Original Value
$70 Value
BREDS Investment Target
BREDSTarget BSSF II
NetReturns
Inception to Date (Cumulative)
________________________________________________
(1) This chart represents the preliminary unaudited cumulative internal rate of return (“IRR”) of Blackstone Real Estate Special Situations Fund II L.P. and Blackstone Real Estate Special Situations Europe Fund Ltd. (together, “BSSF II”). BSSF I’s inception‐to‐date gross return is 40.3% (net 30.7%). Past performance is notnecessarily indicative of future results.
23
2010 Blackstone Investor Day
New Business Initiatives – Asia
BREP has the opportunity to significantly increase its presence in Asia
In 2007 Blackstone Real Estate opened offices in Mumbai, Tokyo, and Hong Kong staffed with seasoned investment professionals from New York, London, and the region
Deployed limited capital before market decline
Invested approximately $500 million in the region post‐September 2008
Blackstone has entered into an agreement to manage approximately $2 billion in real estate assets from Bank of America / Merrill Lynch Asia
Why:
• Grows on‐the‐ground presence
• Expands local relationships
• Provides better market knowledge
• Widens lender contacts
• Increases Limited Partner base
C. Blackstone Real Estate Outlook
24
2010 Blackstone Investor Day
Blackstone Real Estate Summary
Our business is extremely well positioned
We expect to outperform competitors and produce solid returns for our Limited Partners
Competitive landscape has been altered with fewer General Partners competing for new investments and fundraising dollars because of legacy and/or parent company issues
The current investment environment is highly attractive with $11+ billion in dry powder; we have unique position for large, complex real estate investments
Opportunity to substantially increase BREDS platform and Asian investment business
Stable long‐term management fee base
Significant carried interest potential from existing funds
C. Blackstone Real Estate Outlook

IX. Blackstone Alternative Asset Management (“BAAM”)
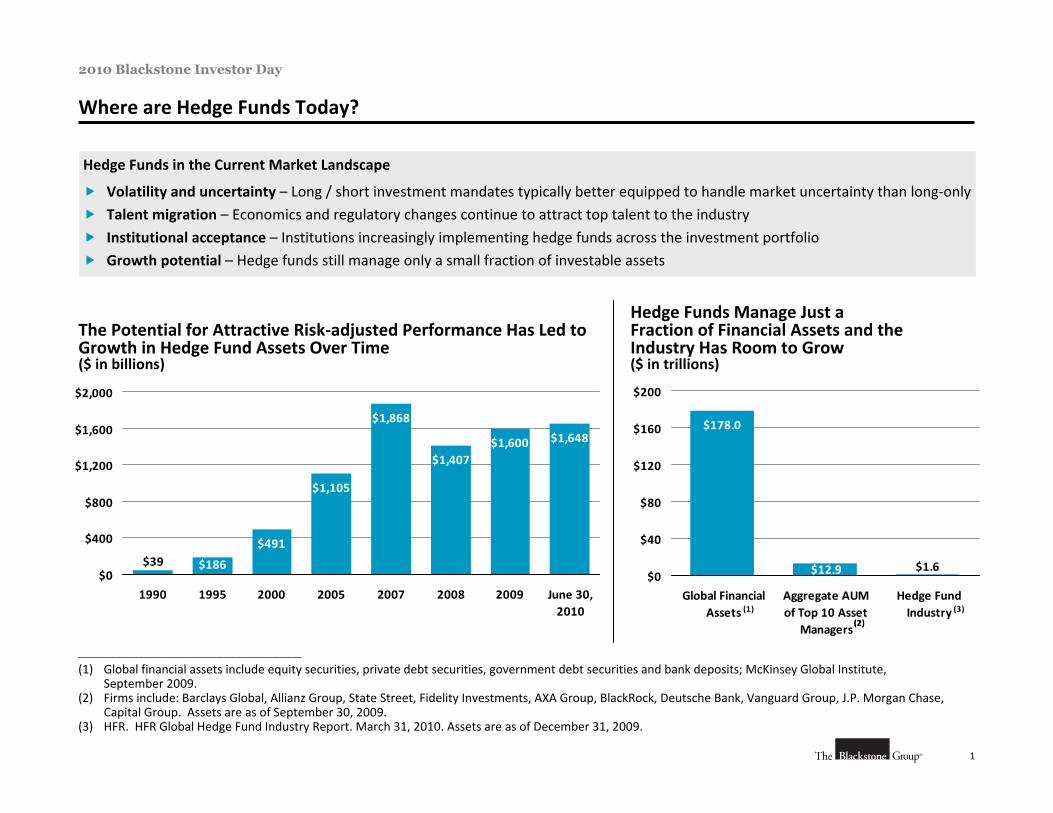
1
2010 Blackstone Investor Day
Where are Hedge Funds Today?
________________________________________________
(1) Global financial assets include equity securities, private debt securities, government debt securities and bank deposits; McKinsey Global Institute, September 2009.
(2) Firms include: Barclays Global, Allianz Group, State Street, Fidelity Investments, AXA Group, BlackRock, Deutsche Bank, Vanguard Group, J.P. Morgan Chase, Capital Group. Assets are as of September 30, 2009.
(3) HFR. HFR Global Hedge Fund Industry Report. March 31, 2010. Assets are as of December 31, 2009.
Hedge Funds in the Current Market Landscape
Volatility and uncertainty – Long / short investment mandates typically better equipped to handle market uncertainty than long‐only
Talent migration – Economics and regulatory changes continue to attract top talent to the industry
Institutional acceptance – Institutions increasingly implementing hedge funds across the investment portfolio
Growth potential – Hedge funds still manage only a small fraction of investable assets
The Potential for Attractive Risk‐adjusted Performance Has Led to Growth in Hedge Fund Assets Over Time($ in billions)
$1,648$1,600$1,407
$1,868
$1,105
$491
$186$39$0
$400
$800
$1,200
$1,600
$2,000
1990 1995 2000 2005 2007 2008 2009 June 30,2010
Hedge Funds Manage Just a Fraction of Financial Assets and the Industry Has Room to Grow($ in trillions)
$1.6$12.9
$178.0
$0
$40
$80
$120
$160
$200
Global FinancialAssets
Aggregate AUMof Top 10 Asset
Managers
Hedge FundIndustry(1)
(2)(2)
(3)
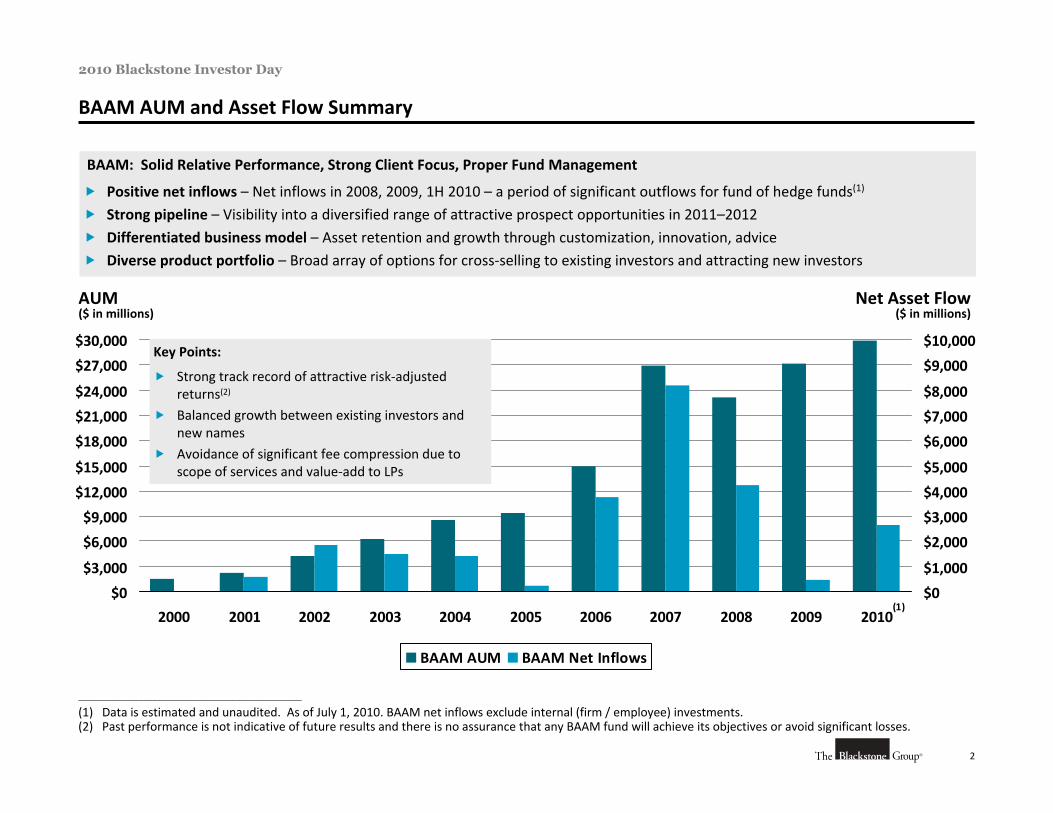
2
2010 Blackstone Investor Day
BAAM AUM and Asset Flow Summary
________________________________________________
(1) Data is estimated and unaudited. As of July 1, 2010. BAAM net inflows exclude internal (firm / employee) investments.(2) Past performance is not indicative of future results and there is no assurance that any BAAM fund will achieve its objectives or avoid significant losses.
BAAM: Solid Relative Performance, Strong Client Focus, Proper Fund Management
Positive net inflows – Net inflows in 2008, 2009, 1H 2010 – a period of significant outflows for fund of hedge funds(1)
Strong pipeline – Visibility into a diversified range of attractive prospect opportunities in 2011–2012
Differentiated business model – Asset retention and growth through customization, innovation, advice
Diverse product portfolio – Broad array of options for cross‐selling to existing investors and attracting new investors
AUM($ in millions)
$0
$3,000
$6,000
$9,000
$12,000
$15,000
$18,000
$21,000
$24,000
$27,000
$30,000
2000 2001 2002 2003 2004 2005 2006 2007 2008 2009 2010
$0
$1,000
$2,000
$3,000
$4,000
$5,000
$6,000
$7,000
$8,000
$9,000
$10,000
BAAM AUM BAAM Net Inflows
(1)
Key Points:
Strong track record of attractive risk‐adjusted returns(2)
Balanced growth between existing investors and new names
Avoidance of significant fee compression due to scope of services and value‐add to LPs
Net Asset Flow($ in millions)
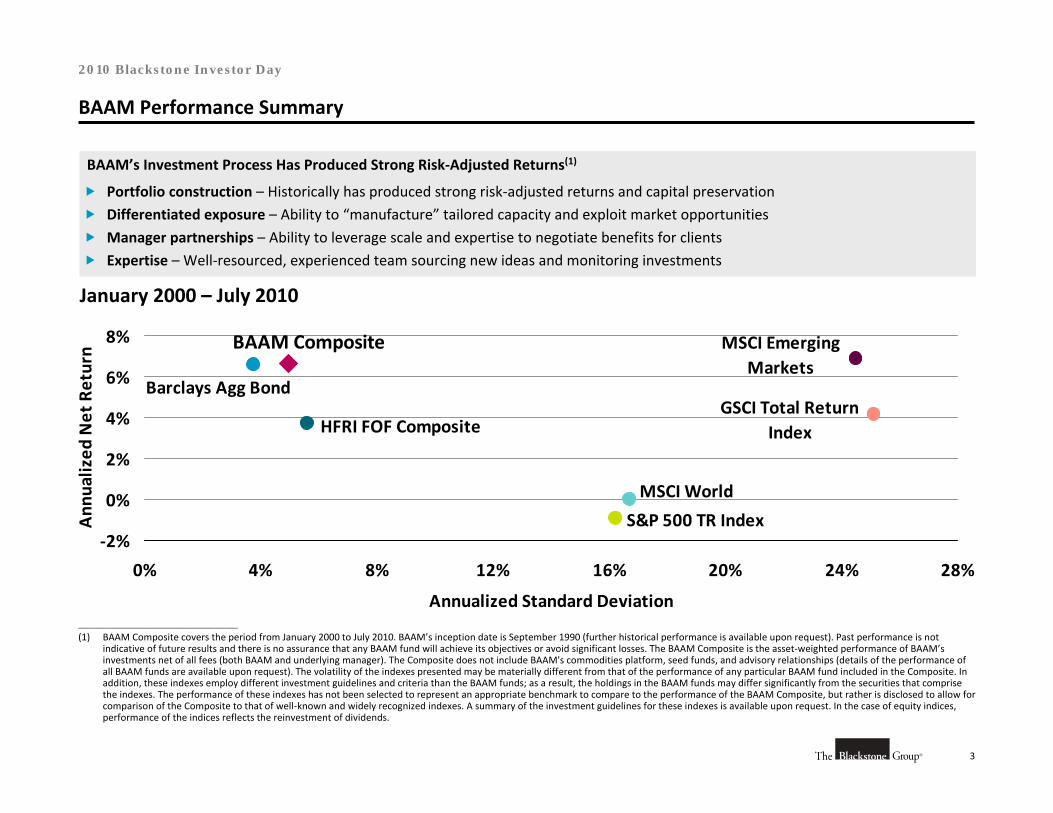
3
2010 Blackstone Investor Day
BAAM Performance Summary
BAAM’s Investment Process Has Produced Strong Risk‐Adjusted Returns(1)
Portfolio construction – Historically has produced strong risk‐adjusted returns and capital preservation
Differentiated exposure – Ability to “manufacture” tailored capacity and exploit market opportunities
Manager partnerships – Ability to leverage scale and expertise to negotiate benefits for clients
Expertise – Well‐resourced, experienced team sourcing new ideas and monitoring investments
January 2000 – July 2010
________________________________________________
(1) BAAM Composite covers the period from January 2000 to July 2010. BAAM’s inception date is September 1990 (further historical performance is available upon request). Past performance is not indicative of future results and there is no assurance that any BAAM fund will achieve its objectives or avoid significant losses. The BAAM Composite is the asset‐weighted performance of BAAM’sinvestments net of all fees (both BAAM and underlying manager). The Composite does not include BAAM's commodities platform, seed funds, and advisory relationships (details of the performance of all BAAM funds are available upon request). The volatility of the indexes presented may be materially different from that of the performance of any particular BAAM fund included in the Composite. In addition, these indexes employ different investment guidelines and criteria than the BAAM funds; as a result, the holdings in the BAAM funds may differ significantly from the securities that comprise the indexes. The performance of these indexes has not been selected to represent an appropriate benchmark to compare to the performance of the BAAM Composite, but rather is disclosed to allow for comparison of the Composite to that of well‐known and widely recognized indexes. A summary of the investment guidelines for these indexes is available upon request. In the case of equity indices, performance of the indices reflects the reinvestment of dividends.
HFRI FOF Composite
Barclays Agg Bond
MSCI Emerging Markets
GSCI Total Return Index
MSCI World
BAAM Composite
S&P 500 TR Index‐2%
0%
2%
4%
6%
8%
0% 4% 8% 12% 16% 20% 24% 28%
Annualized Standard Deviation
Ann
ualized
Net Return
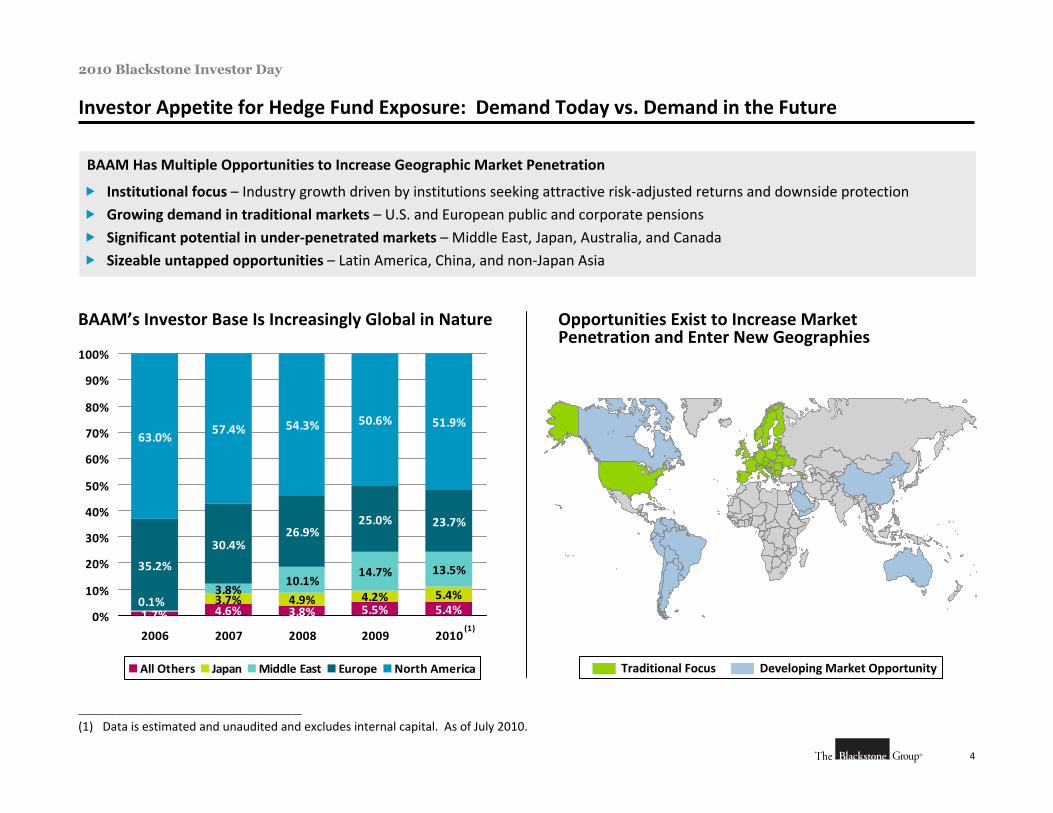
4
2010 Blackstone Investor Day
Investor Appetite for Hedge Fund Exposure: Demand Today vs. Demand in the Future
________________________________________________
(1) Data is estimated and unaudited and excludes internal capital. As of July 2010.
BAAM Has Multiple Opportunities to Increase Geographic Market Penetration
Institutional focus – Industry growth driven by institutions seeking attractive risk‐adjusted returns and downside protection
Growing demand in traditional markets – U.S. and European public and corporate pensions
Significant potential in under‐penetrated markets – Middle East, Japan, Australia, and Canada
Sizeable untapped opportunities – Latin America, China, and non‐Japan Asia
BAAM’s Investor Base Is Increasingly Global in Nature
3.8%10.1%
14.7% 13.5%35.2%
30.4%26.9%
25.0% 23.7%
63.0%57.4% 54.3% 50.6% 51.9%
1.7% 4.6% 3.8% 5.5% 5.4%3.7% 4.9% 4.2% 5.4%0.1%
0%
10%
20%
30%
40%
50%
60%
70%
80%
90%
100%
2006 2007 2008 2009 2010
All Others Japan Middle East Europe North America
(1)
Opportunities Exist to Increase Market Penetration and Enter New Geographies
Traditional Focus Developing Market Opportunity
5
2010 Blackstone Investor Day
Product Innovation: Key Differentiator of the BAAM Model
BAAM “Reverse Engineers” New Solutions to Client Problems
BAAM engages clients to identify key issues in institutional portfolio management
BAAM has a track record of successfully addressing client concerns(1):
• Long‐biased commodities strategy – launched May 2007; over $1 billion in AUM(2)
• Hedge fund seeding platform – first fund launched in 2007; over $1 billion in AUM and commitments(2)
• Long‐only equity “replacement” strategies – increasing interest in hedged exposure, alpha generation
• Customized mandates – ability to accommodate specific risk and return targets
• Solutions research – ongoing across emerging markets and “long‐only” substitute product opportunities
BAAM has developed an array of services for strategic partners, including:
• Advisory services
• Access to BAAM research and proprietary technology platform
• Proactive knowledge transfer and training
• Transitioning and rebuilding troubled client hedge fund portfolios
BAAM is a thoughtful, value‐added partner
• Insight into key regulatory developments and industry responses
• Perspectives on approaches to top‐down asset allocation and other key client investment processes
• Thoughts regarding potential tactical allocations and market opportunities________________________________________________
(1) Past performance is no guarantee of future results.(2) AUM is estimated and unaudited. As of August 1, 2010.
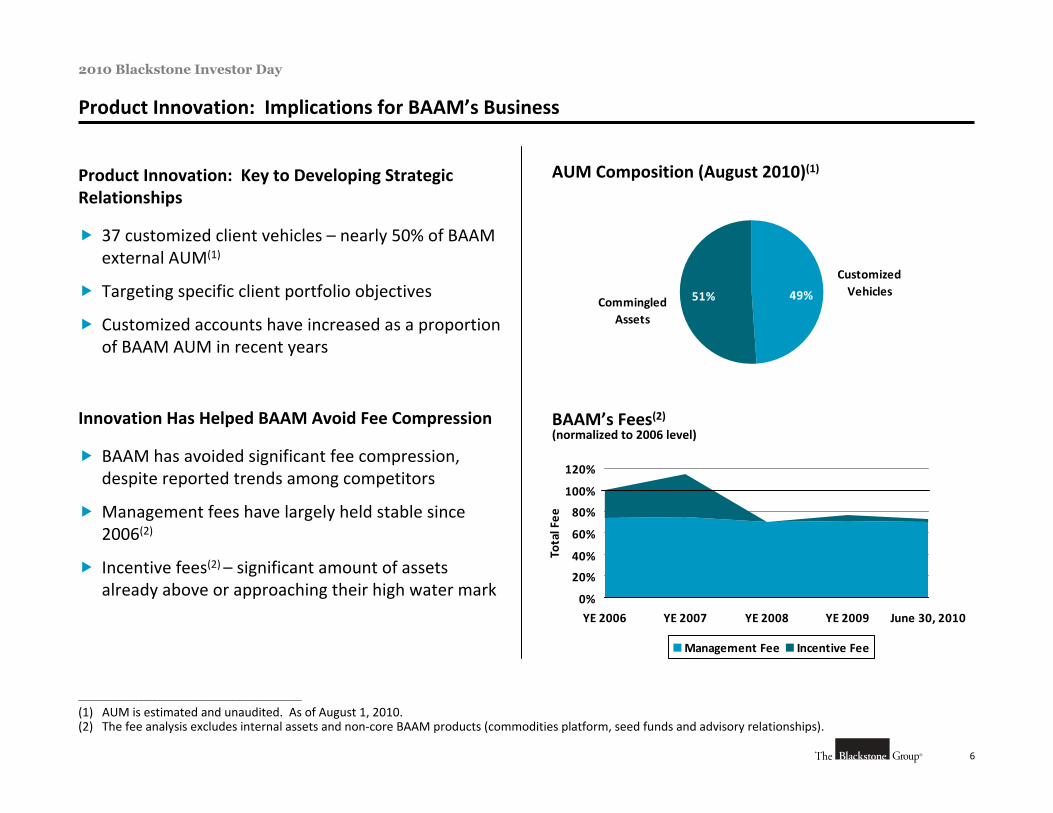
6
2010 Blackstone Investor Day
Product Innovation: Implications for BAAM’s Business
________________________________________________
(1) AUM is estimated and unaudited. As of August 1, 2010.(2) The fee analysis excludes internal assets and non‐core BAAM products (commodities platform, seed funds and advisory relationships).
Product Innovation: Key to Developing Strategic Relationships
37 customized client vehicles – nearly 50% of BAAM external AUM(1)
Targeting specific client portfolio objectives
Customized accounts have increased as a proportion of BAAM AUM in recent years
Innovation Has Helped BAAM Avoid Fee Compression
BAAM has avoided significant fee compression, despite reported trends among competitors
Management fees have largely held stable since 2006(2)
Incentive fees(2) – significant amount of assets already above or approaching their high water mark
AUM Composition (August 2010)(1)
51% 49%
Customized Vehicles
Commingled Assets
BAAM’s Fees(2)(normalized to 2006 level)
0%
20%
40%
60%
80%
100%
120%
YE 2006 YE 2007 YE 2008 YE 2009 June 30, 2010
Total Fee
Management Fee Incentive Fee
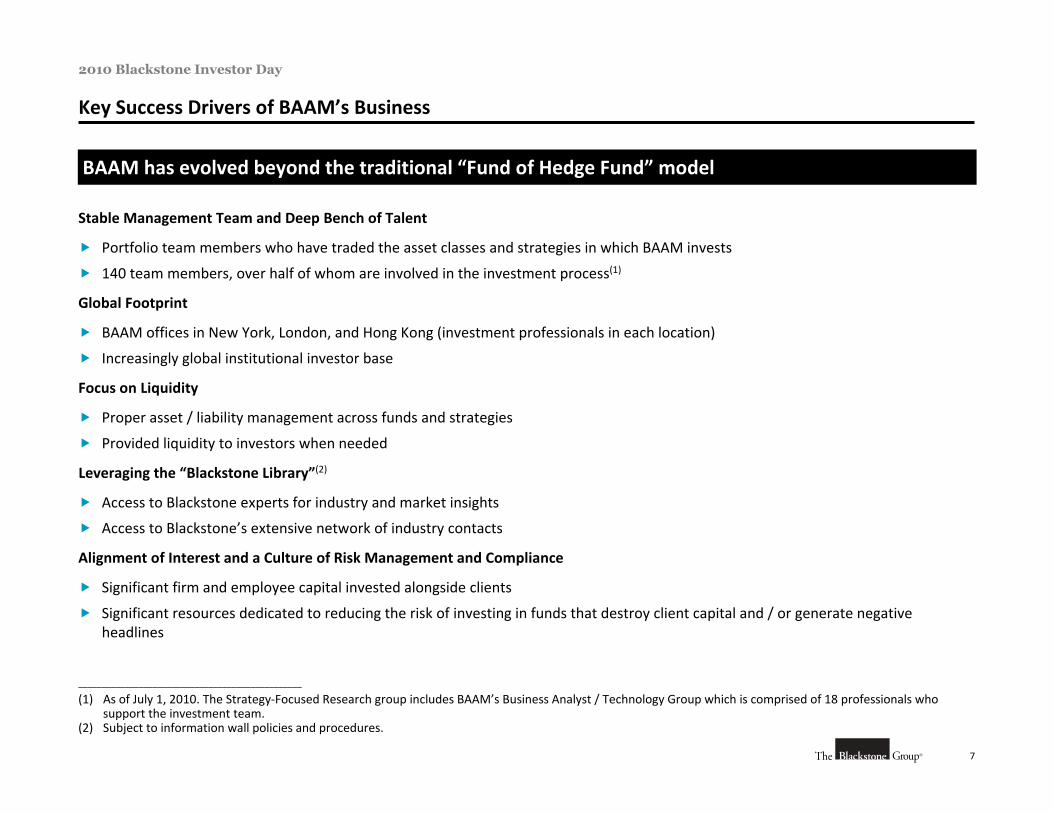
7
2010 Blackstone Investor Day
Key Success Drivers of BAAM’s Business
Stable Management Team and Deep Bench of Talent
Portfolio team members who have traded the asset classes and strategies in which BAAM invests
140 team members, over half of whom are involved in the investment process(1)
Global Footprint
BAAM offices in New York, London, and Hong Kong (investment professionals in each location)
Increasingly global institutional investor base
Focus on Liquidity
Proper asset / liability management across funds and strategies
Provided liquidity to investors when needed
Leveraging the “Blackstone Library”(2)
Access to Blackstone experts for industry and market insights
Access to Blackstone’s extensive network of industry contacts
Alignment of Interest and a Culture of Risk Management and Compliance
Significant firm and employee capital invested alongside clients
Significant resources dedicated to reducing the risk of investing in funds that destroy client capital and / or generate negative headlines
________________________________________________
(1) As of July 1, 2010. The Strategy‐Focused Research group includes BAAM’s Business Analyst / Technology Group which is comprised of 18 professionals who support the investment team.
(2) Subject to information wall policies and procedures.
BAAM has evolved beyond the traditional “Fund of Hedge Fund” model
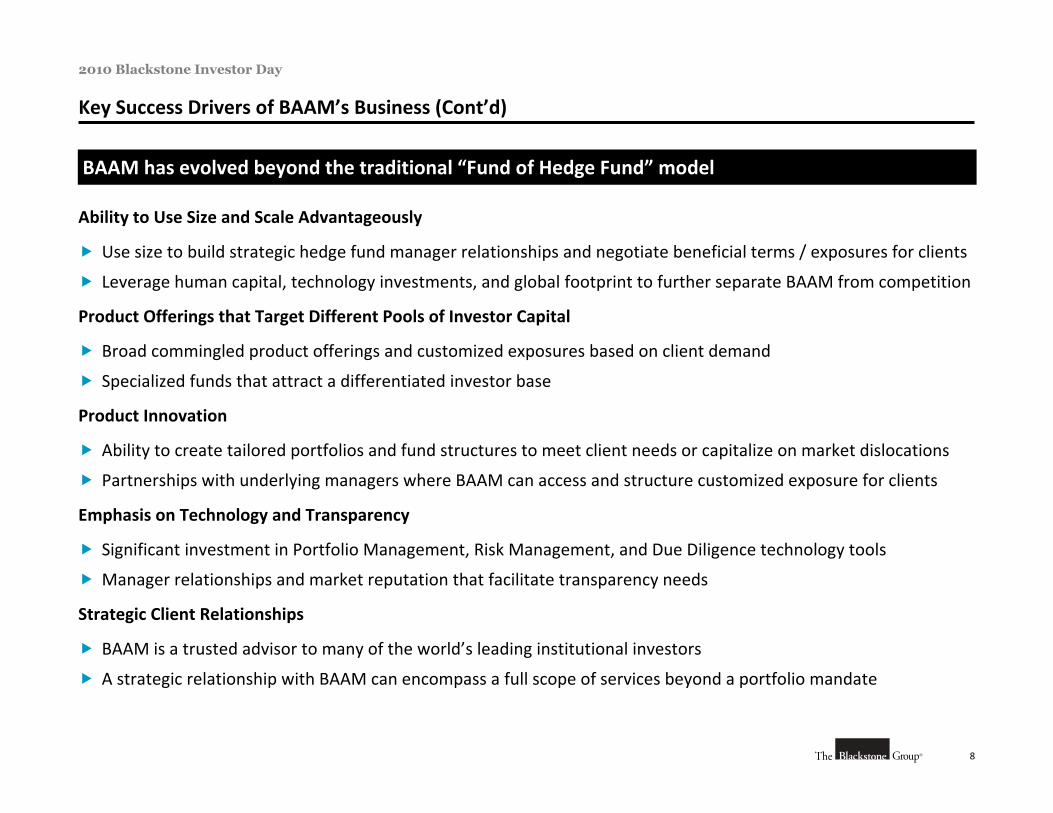
8
2010 Blackstone Investor Day
Key Success Drivers of BAAM’s Business (Cont’d)
Ability to Use Size and Scale Advantageously
Use size to build strategic hedge fund manager relationships and negotiate beneficial terms / exposures for clients
Leverage human capital, technology investments, and global footprint to further separate BAAM from competition
Product Offerings that Target Different Pools of Investor Capital
Broad commingled product offerings and customized exposures based on client demand
Specialized funds that attract a differentiated investor base
Product Innovation
Ability to create tailored portfolios and fund structures to meet client needs or capitalize on market dislocations
Partnerships with underlying managers where BAAM can access and structure customized exposure for clients
Emphasis on Technology and Transparency
Significant investment in Portfolio Management, Risk Management, and Due Diligence technology tools
Manager relationships and market reputation that facilitate transparency needs
Strategic Client Relationships
BAAM is a trusted advisor to many of the world’s leading institutional investors
A strategic relationship with BAAM can encompass a full scope of services beyond a portfolio mandate
BAAM has evolved beyond the traditional “Fund of Hedge Fund” model

A. Reconciliation of Non-GAAP Financial Measures
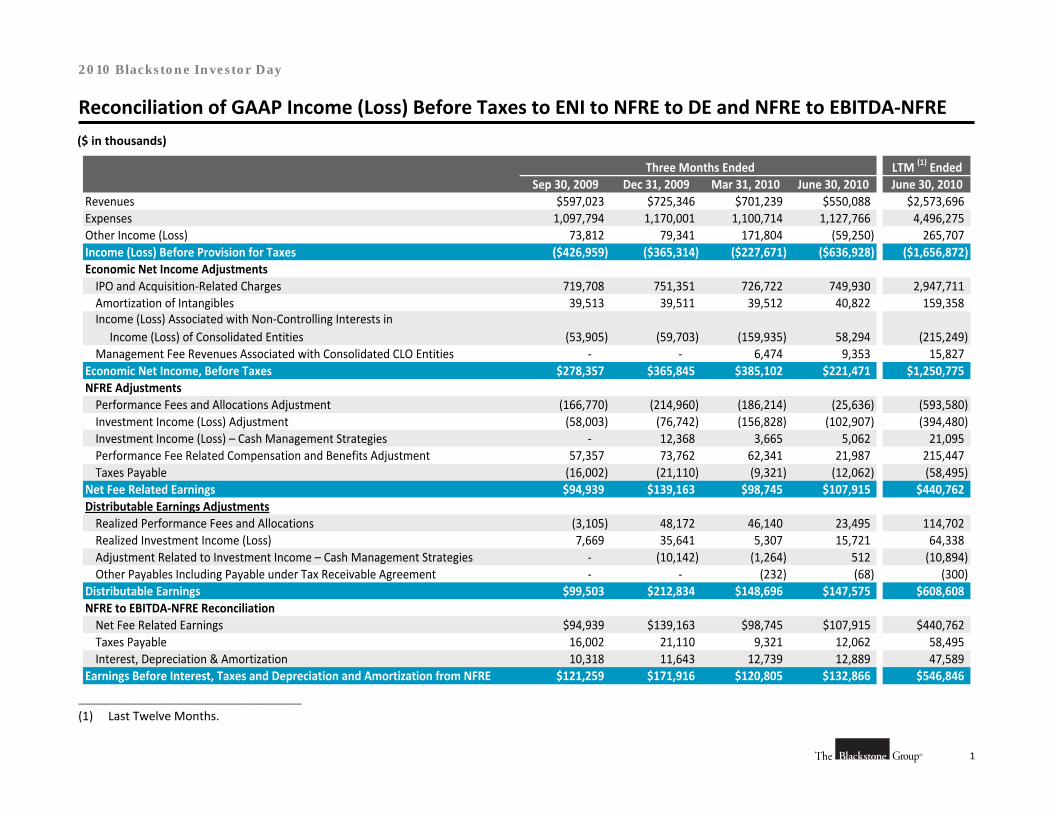
1
2010 Blackstone Investor Day
Reconciliation of GAAP Income (Loss) Before Taxes to ENI to NFRE to DE and NFRE to EBITDA‐NFRE
($ in thousands)
Three Months Ended LTM (1) EndedSep 30, 2009 Dec 31, 2009 Mar 31, 2010 June 30, 2010 June 30, 2010
Revenues $597,023 $725,346 $701,239 $550,088 $2,573,696Expenses 1,097,794 1,170,001 1,100,714 1,127,766 4,496,275 Other Income (Loss) 73,812 79,341 171,804 (59,250) 265,707 Income (Loss) Before Provision for Taxes ($426,959) ($365,314) ($227,671) ($636,928) ($1,656,872)Economic Net Income AdjustmentsIPO and Acquisition‐Related Charges 719,708 751,351 726,722 749,930 2,947,711 Amortization of Intangibles 39,513 39,511 39,512 40,822 159,358 Income (Loss) Associated with Non‐Controlling Interests in Income (Loss) of Consolidated Entities (53,905) (59,703) (159,935) 58,294 (215,249) Management Fee Revenues Associated with Consolidated CLO Entities ‐ ‐ 6,474 9,353 15,827
Economic Net Income, Before Taxes $278,357 $365,845 $385,102 $221,471 $1,250,775NFRE AdjustmentsPerformance Fees and Allocations Adjustment (166,770) (214,960) (186,214) (25,636) (593,580) Investment Income (Loss) Adjustment (58,003) (76,742) (156,828) (102,907) (394,480) Investment Income (Loss) – Cash Management Strategies ‐ 12,368 3,665 5,062 21,095 Performance Fee Related Compensation and Benefits Adjustment 57,357 73,762 62,341 21,987 215,447 Taxes Payable (16,002) (21,110) (9,321) (12,062) (58,495)
Net Fee Related Earnings $94,939 $139,163 $98,745 $107,915 $440,762Distributable Earnings AdjustmentsRealized Performance Fees and Allocations (3,105) 48,172 46,140 23,495 114,702 Realized Investment Income (Loss) 7,669 35,641 5,307 15,721 64,338 Adjustment Related to Investment Income – Cash Management Strategies ‐ (10,142) (1,264) 512 (10,894) Other Payables Including Payable under Tax Receivable Agreement ‐ ‐ (232) (68) (300)
Distributable Earnings $99,503 $212,834 $148,696 $147,575 $608,608NFRE to EBITDA‐NFRE ReconciliationNet Fee Related Earnings $94,939 $139,163 $98,745 $107,915 $440,762Taxes Payable 16,002 21,110 9,321 12,062 58,495 Interest, Depreciation & Amortization 10,318 11,643 12,739 12,889 47,589
Earnings Before Interest, Taxes and Depreciation and Amortization from NFRE $121,259 $171,916 $120,805 $132,866 $546,846
________________________________________________
(1) Last Twelve Months.
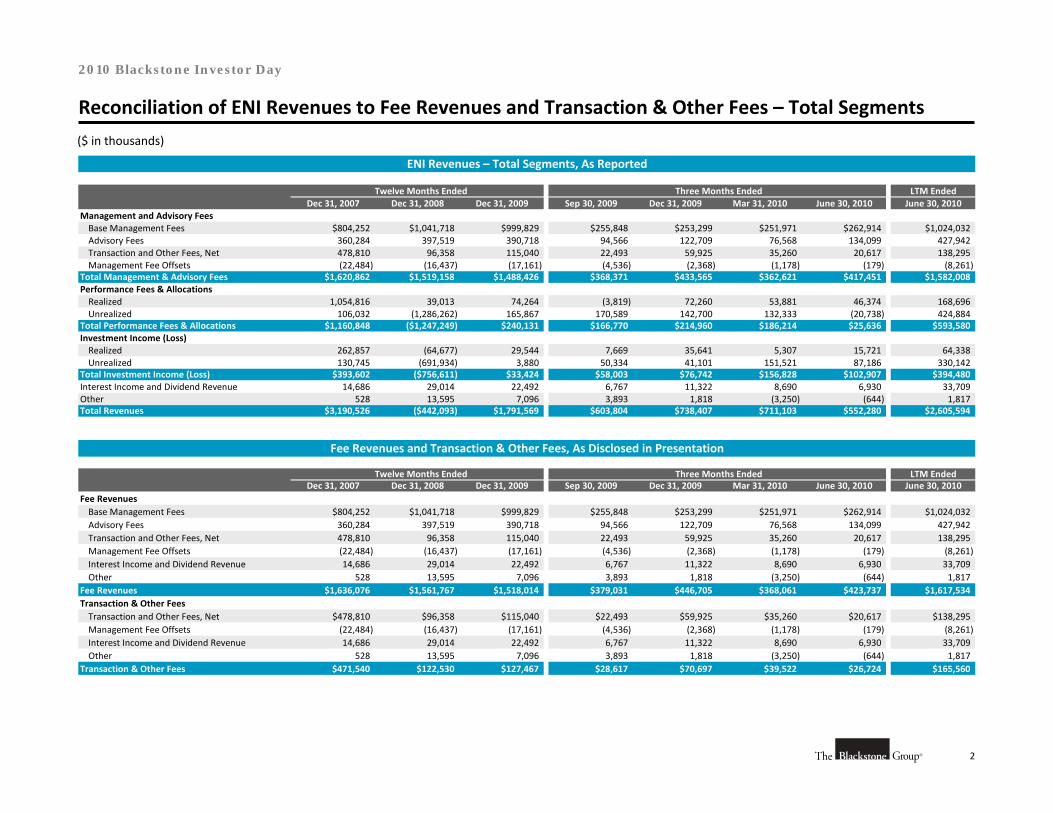
2
2010 Blackstone Investor Day
Reconciliation of ENI Revenues to Fee Revenues and Transaction & Other Fees – Total Segments
($ in thousands)
Twelve Months Ended Three Months Ended LTM EndedDec 31, 2007 Dec 31, 2008 Dec 31, 2009 Sep 30, 2009 Dec 31, 2009 Mar 31, 2010 June 30, 2010 June 30, 2010
Management and Advisory FeesBase Management Fees $804,252 $1,041,718 $999,829 $255,848 $253,299 $251,971 $262,914 $1,024,032Advisory Fees 360,284 397,519 390,718 94,566 122,709 76,568 134,099 427,942Transaction and Other Fees, Net 478,810 96,358 115,040 22,493 59,925 35,260 20,617 138,295Management Fee Offsets (22,484) (16,437) (17,161) (4,536) (2,368) (1,178) (179) (8,261)
Total Management & Advisory Fees $1,620,862 $1,519,158 $1,488,426 $368,371 $433,565 $362,621 $417,451 $1,582,008Performance Fees & AllocationsRealized 1,054,816 39,013 74,264 (3,819) 72,260 53,881 46,374 168,696Unrealized 106,032 (1,286,262) 165,867 170,589 142,700 132,333 (20,738) 424,884
Total Performance Fees & Allocations $1,160,848 ($1,247,249) $240,131 $166,770 $214,960 $186,214 $25,636 $593,580Investment Income (Loss)Realized 262,857 (64,677) 29,544 7,669 35,641 5,307 15,721 64,338Unrealized 130,745 (691,934) 3,880 50,334 41,101 151,521 87,186 330,142
Total Investment Income (Loss) $393,602 ($756,611) $33,424 $58,003 $76,742 $156,828 $102,907 $394,480Interest Income and Dividend Revenue 14,686 29,014 22,492 6,767 11,322 8,690 6,930 33,709Other 528 13,595 7,096 3,893 1,818 (3,250) (644) 1,817Total Revenues $3,190,526 ($442,093) $1,791,569 $603,804 $738,407 $711,103 $552,280 $2,605,594
Twelve Months Ended Three Months Ended LTM EndedDec 31, 2007 Dec 31, 2008 Dec 31, 2009 Sep 30, 2009 Dec 31, 2009 Mar 31, 2010 June 30, 2010 June 30, 2010
Fee RevenuesBase Management Fees $804,252 $1,041,718 $999,829 $255,848 $253,299 $251,971 $262,914 $1,024,032Advisory Fees 360,284 397,519 390,718 94,566 122,709 76,568 134,099 427,942Transaction and Other Fees, Net 478,810 96,358 115,040 22,493 59,925 35,260 20,617 138,295Management Fee Offsets (22,484) (16,437) (17,161) (4,536) (2,368) (1,178) (179) (8,261)Interest Income and Dividend Revenue 14,686 29,014 22,492 6,767 11,322 8,690 6,930 33,709Other 528 13,595 7,096 3,893 1,818 (3,250) (644) 1,817
Fee Revenues $1,636,076 $1,561,767 $1,518,014 $379,031 $446,705 $368,061 $423,737 $1,617,534Transaction & Other FeesTransaction and Other Fees, Net $478,810 $96,358 $115,040 $22,493 $59,925 $35,260 $20,617 $138,295Management Fee Offsets (22,484) (16,437) (17,161) (4,536) (2,368) (1,178) (179) (8,261)Interest Income and Dividend Revenue 14,686 29,014 22,492 6,767 11,322 8,690 6,930 33,709Other 528 13,595 7,096 3,893 1,818 (3,250) (644) 1,817
Transaction & Other Fees $471,540 $122,530 $127,467 $28,617 $70,697 $39,522 $26,724 $165,560
ENI Revenues – Total Segments, As Reported
Fee Revenues and Transaction & Other Fees, As Disclosed in Presentation
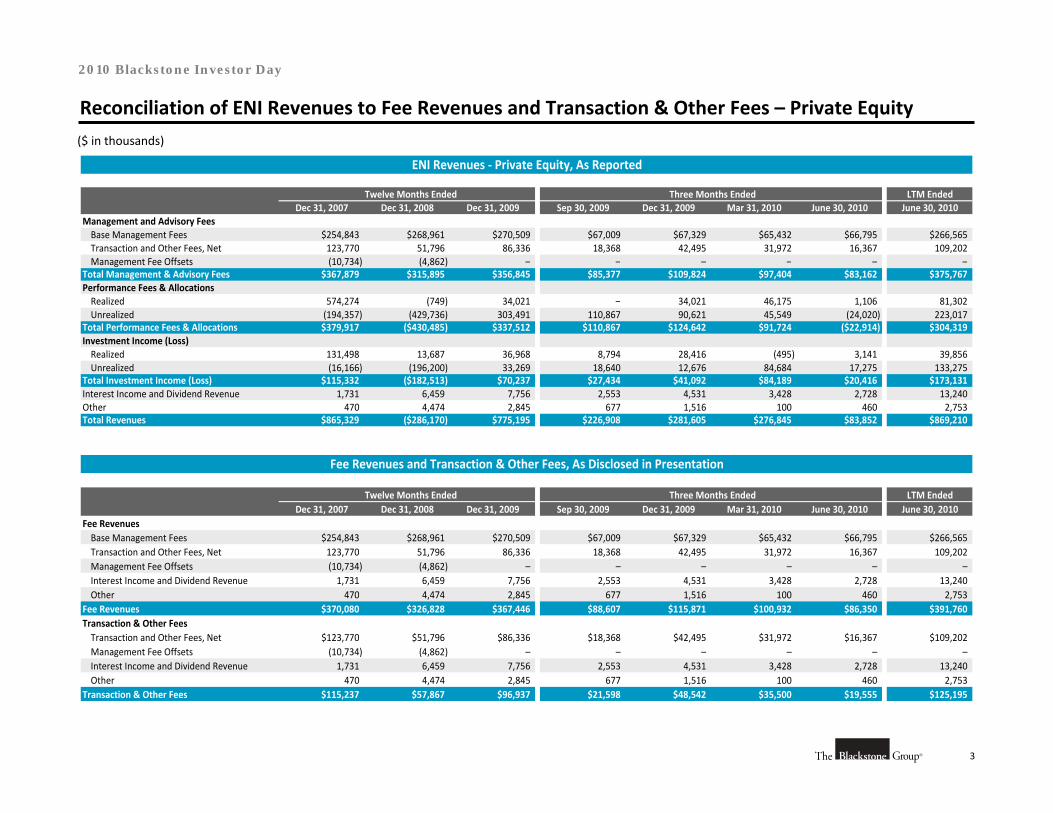
3
2010 Blackstone Investor Day
($ in thousands)
Reconciliation of ENI Revenues to Fee Revenues and Transaction & Other Fees – Private Equity
Twelve Months Ended Three Months Ended LTM EndedDec 31, 2007 Dec 31, 2008 Dec 31, 2009 Sep 30, 2009 Dec 31, 2009 Mar 31, 2010 June 30, 2010 June 30, 2010
Management and Advisory FeesBase Management Fees $254,843 $268,961 $270,509 $67,009 $67,329 $65,432 $66,795 $266,565Transaction and Other Fees, Net 123,770 51,796 86,336 18,368 42,495 31,972 16,367 109,202Management Fee Offsets (10,734) (4,862) – – – – – –
Total Management & Advisory Fees $367,879 $315,895 $356,845 $85,377 $109,824 $97,404 $83,162 $375,767Performance Fees & AllocationsRealized 574,274 (749) 34,021 – 34,021 46,175 1,106 81,302Unrealized (194,357) (429,736) 303,491 110,867 90,621 45,549 (24,020) 223,017
Total Performance Fees & Allocations $379,917 ($430,485) $337,512 $110,867 $124,642 $91,724 ($22,914) $304,319Investment Income (Loss)Realized 131,498 13,687 36,968 8,794 28,416 (495) 3,141 39,856Unrealized (16,166) (196,200) 33,269 18,640 12,676 84,684 17,275 133,275
Total Investment Income (Loss) $115,332 ($182,513) $70,237 $27,434 $41,092 $84,189 $20,416 $173,131Interest Income and Dividend Revenue 1,731 6,459 7,756 2,553 4,531 3,428 2,728 13,240Other 470 4,474 2,845 677 1,516 100 460 2,753Total Revenues $865,329 ($286,170) $775,195 $226,908 $281,605 $276,845 $83,852 $869,210
Twelve Months Ended Three Months Ended LTM EndedDec 31, 2007 Dec 31, 2008 Dec 31, 2009 Sep 30, 2009 Dec 31, 2009 Mar 31, 2010 June 30, 2010 June 30, 2010
Fee RevenuesBase Management Fees $254,843 $268,961 $270,509 $67,009 $67,329 $65,432 $66,795 $266,565Transaction and Other Fees, Net 123,770 51,796 86,336 18,368 42,495 31,972 16,367 109,202Management Fee Offsets (10,734) (4,862) – – – – – –Interest Income and Dividend Revenue 1,731 6,459 7,756 2,553 4,531 3,428 2,728 13,240Other 470 4,474 2,845 677 1,516 100 460 2,753
Fee Revenues $370,080 $326,828 $367,446 $88,607 $115,871 $100,932 $86,350 $391,760Transaction & Other FeesTransaction and Other Fees, Net $123,770 $51,796 $86,336 $18,368 $42,495 $31,972 $16,367 $109,202Management Fee Offsets (10,734) (4,862) – – – – – –Interest Income and Dividend Revenue 1,731 6,459 7,756 2,553 4,531 3,428 2,728 13,240Other 470 4,474 2,845 677 1,516 100 460 2,753
Transaction & Other Fees $115,237 $57,867 $96,937 $21,598 $48,542 $35,500 $19,555 $125,195
ENI Revenues ‐ Private Equity, As Reported
Fee Revenues and Transaction & Other Fees, As Disclosed in Presentation
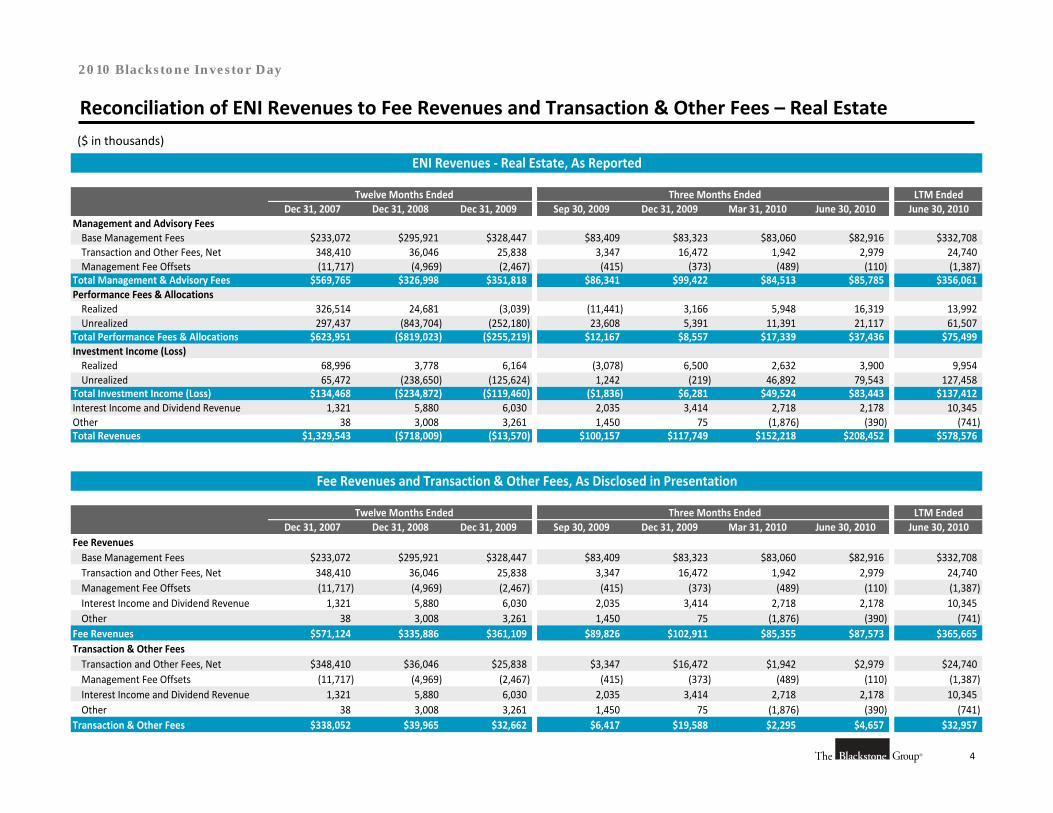
4
2010 Blackstone Investor Day
($ in thousands)
Reconciliation of ENI Revenues to Fee Revenues and Transaction & Other Fees – Real Estate
Twelve Months Ended Three Months Ended LTM EndedDec 31, 2007 Dec 31, 2008 Dec 31, 2009 Sep 30, 2009 Dec 31, 2009 Mar 31, 2010 June 30, 2010 June 30, 2010
Management and Advisory FeesBase Management Fees $233,072 $295,921 $328,447 $83,409 $83,323 $83,060 $82,916 $332,708Transaction and Other Fees, Net 348,410 36,046 25,838 3,347 16,472 1,942 2,979 24,740Management Fee Offsets (11,717) (4,969) (2,467) (415) (373) (489) (110) (1,387)
Total Management & Advisory Fees $569,765 $326,998 $351,818 $86,341 $99,422 $84,513 $85,785 $356,061Performance Fees & AllocationsRealized 326,514 24,681 (3,039) (11,441) 3,166 5,948 16,319 13,992Unrealized 297,437 (843,704) (252,180) 23,608 5,391 11,391 21,117 61,507
Total Performance Fees & Allocations $623,951 ($819,023) ($255,219) $12,167 $8,557 $17,339 $37,436 $75,499Investment Income (Loss)Realized 68,996 3,778 6,164 (3,078) 6,500 2,632 3,900 9,954Unrealized 65,472 (238,650) (125,624) 1,242 (219) 46,892 79,543 127,458
Total Investment Income (Loss) $134,468 ($234,872) ($119,460) ($1,836) $6,281 $49,524 $83,443 $137,412Interest Income and Dividend Revenue 1,321 5,880 6,030 2,035 3,414 2,718 2,178 10,345Other 38 3,008 3,261 1,450 75 (1,876) (390) (741)Total Revenues $1,329,543 ($718,009) ($13,570) $100,157 $117,749 $152,218 $208,452 $578,576
Twelve Months Ended Three Months Ended LTM EndedDec 31, 2007 Dec 31, 2008 Dec 31, 2009 Sep 30, 2009 Dec 31, 2009 Mar 31, 2010 June 30, 2010 June 30, 2010
Fee RevenuesBase Management Fees $233,072 $295,921 $328,447 $83,409 $83,323 $83,060 $82,916 $332,708Transaction and Other Fees, Net 348,410 36,046 25,838 3,347 16,472 1,942 2,979 24,740Management Fee Offsets (11,717) (4,969) (2,467) (415) (373) (489) (110) (1,387)Interest Income and Dividend Revenue 1,321 5,880 6,030 2,035 3,414 2,718 2,178 10,345Other 38 3,008 3,261 1,450 75 (1,876) (390) (741)
Fee Revenues $571,124 $335,886 $361,109 $89,826 $102,911 $85,355 $87,573 $365,665Transaction & Other FeesTransaction and Other Fees, Net $348,410 $36,046 $25,838 $3,347 $16,472 $1,942 $2,979 $24,740Management Fee Offsets (11,717) (4,969) (2,467) (415) (373) (489) (110) (1,387)Interest Income and Dividend Revenue 1,321 5,880 6,030 2,035 3,414 2,718 2,178 10,345Other 38 3,008 3,261 1,450 75 (1,876) (390) (741)
Transaction & Other Fees $338,052 $39,965 $32,662 $6,417 $19,588 $2,295 $4,657 $32,957
ENI Revenues ‐ Real Estate, As Reported
Fee Revenues and Transaction & Other Fees, As Disclosed in Presentation
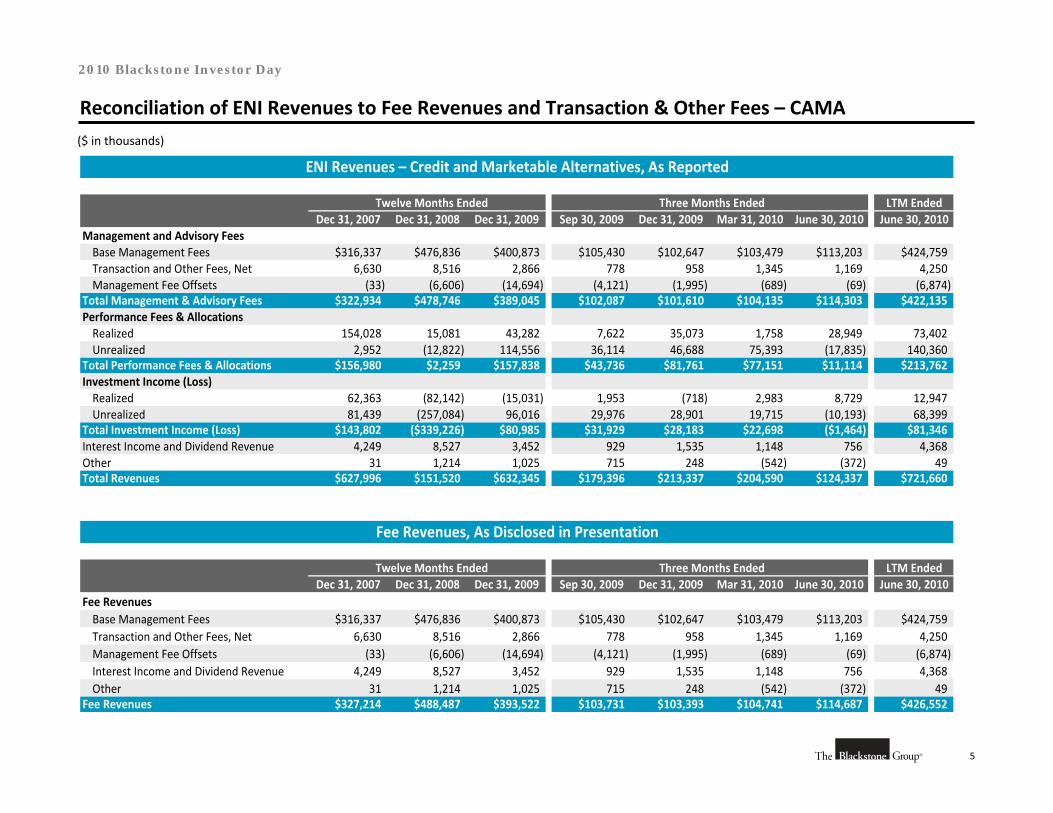
5
2010 Blackstone Investor Day
($ in thousands)
Reconciliation of ENI Revenues to Fee Revenues and Transaction & Other Fees – CAMA
Twelve Months Ended Three Months Ended LTM EndedDec 31, 2007 Dec 31, 2008 Dec 31, 2009 Sep 30, 2009 Dec 31, 2009 Mar 31, 2010 June 30, 2010 June 30, 2010
Management and Advisory FeesBase Management Fees $316,337 $476,836 $400,873 $105,430 $102,647 $103,479 $113,203 $424,759Transaction and Other Fees, Net 6,630 8,516 2,866 778 958 1,345 1,169 4,250Management Fee Offsets (33) (6,606) (14,694) (4,121) (1,995) (689) (69) (6,874)
Total Management & Advisory Fees $322,934 $478,746 $389,045 $102,087 $101,610 $104,135 $114,303 $422,135Performance Fees & AllocationsRealized 154,028 15,081 43,282 7,622 35,073 1,758 28,949 73,402 Unrealized 2,952 (12,822) 114,556 36,114 46,688 75,393 (17,835) 140,360
Total Performance Fees & Allocations $156,980 $2,259 $157,838 $43,736 $81,761 $77,151 $11,114 $213,762Investment Income (Loss)Realized 62,363 (82,142) (15,031) 1,953 (718) 2,983 8,729 12,947 Unrealized 81,439 (257,084) 96,016 29,976 28,901 19,715 (10,193) 68,399
Total Investment Income (Loss) $143,802 ($339,226) $80,985 $31,929 $28,183 $22,698 ($1,464) $81,346Interest Income and Dividend Revenue 4,249 8,527 3,452 929 1,535 1,148 756 4,368 Other 31 1,214 1,025 715 248 (542) (372) 49 Total Revenues $627,996 $151,520 $632,345 $179,396 $213,337 $204,590 $124,337 $721,660
Twelve Months Ended Three Months Ended LTM EndedDec 31, 2007 Dec 31, 2008 Dec 31, 2009 Sep 30, 2009 Dec 31, 2009 Mar 31, 2010 June 30, 2010 June 30, 2010
Fee RevenuesBase Management Fees $316,337 $476,836 $400,873 $105,430 $102,647 $103,479 $113,203 $424,759Transaction and Other Fees, Net 6,630 8,516 2,866 778 958 1,345 1,169 4,250 Management Fee Offsets (33) (6,606) (14,694) (4,121) (1,995) (689) (69) (6,874) Interest Income and Dividend Revenue 4,249 8,527 3,452 929 1,535 1,148 756 4,368 Other 31 1,214 1,025 715 248 (542) (372) 49
Fee Revenues $327,214 $488,487 $393,522 $103,731 $103,393 $104,741 $114,687 $426,552
ENI Revenues – Credit and Marketable Alternatives, As Reported
Fee Revenues, As Disclosed in Presentation
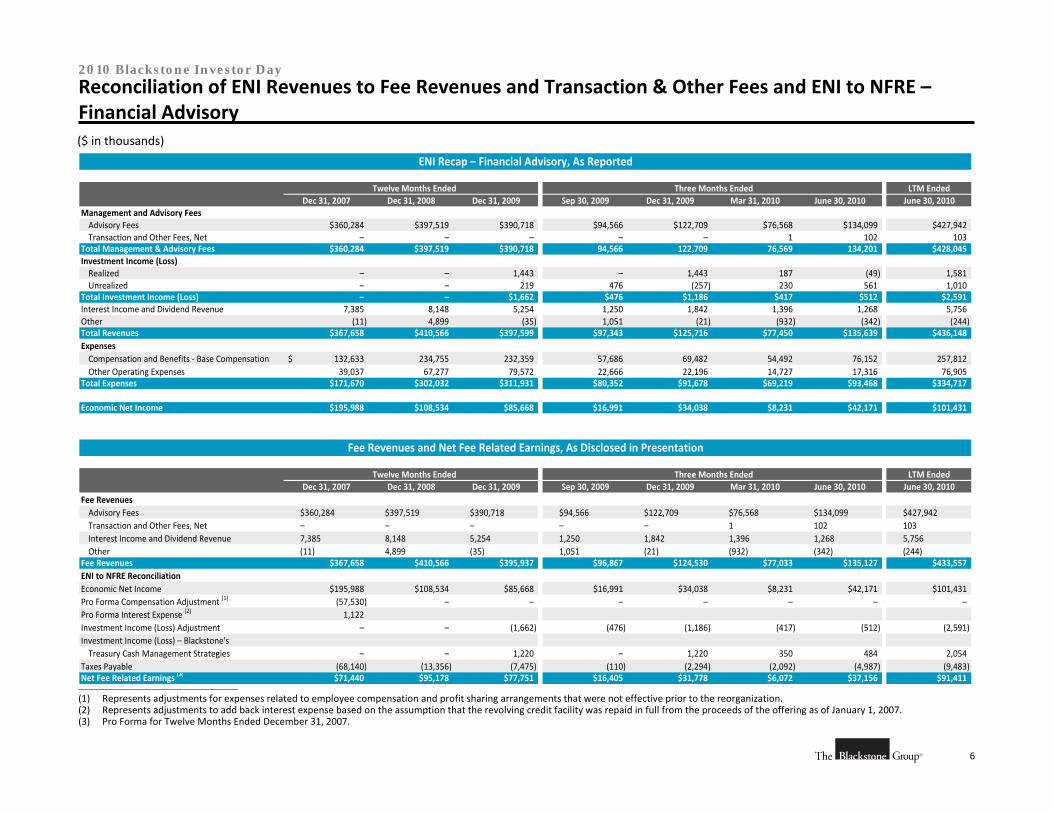
6
2010 Blackstone Investor Day
($ in thousands)
Reconciliation of ENI Revenues to Fee Revenues and Transaction & Other Fees and ENI to NFRE –Financial Advisory
Twelve Months Ended Three Months Ended LTM EndedDec 31, 2007 Dec 31, 2008 Dec 31, 2009 Sep 30, 2009 Dec 31, 2009 Mar 31, 2010 June 30, 2010 June 30, 2010
Management and Advisory FeesAdvisory Fees $360,284 $397,519 $390,718 $94,566 $122,709 $76,568 $134,099 $427,942Transaction and Other Fees, Net – – – – – 1 102 103
Total Management & Advisory Fees $360,284 $397,519 $390,718 94,566 122,709 76,569 134,201 $428,045Investment Income (Loss)Realized – – 1,443 – 1,443 187 (49) 1,581Unrealized – – 219 476 (257) 230 561 1,010
Total Investment Income (Loss) – – $1,662 $476 $1,186 $417 $512 $2,591Interest Income and Dividend Revenue 7,385 8,148 5,254 1,250 1,842 1,396 1,268 5,756Other (11) 4,899 (35) 1,051 (21) (932) (342) (244)Total Revenues $367,658 $410,566 $397,599 $97,343 $125,716 $77,450 $135,639 $436,148ExpensesCompensation and Benefits ‐ Base Compensation 132,633$ 234,755 232,359 57,686 69,482 54,492 76,152 257,812 Other Operating Expenses 39,037 67,277 79,572 22,666 22,196 14,727 17,316 76,905
Total Expenses $171,670 $302,032 $311,931 $80,352 $91,678 $69,219 $93,468 $334,717
Economic Net Income $195,988 $108,534 $85,668 $16,991 $34,038 $8,231 $42,171 $101,431
Twelve Months Ended Three Months Ended LTM EndedDec 31, 2007 Dec 31, 2008 Dec 31, 2009 Sep 30, 2009 Dec 31, 2009 Mar 31, 2010 June 30, 2010 June 30, 2010
Fee RevenuesAdvisory Fees $360,284 $397,519 $390,718 $94,566 $122,709 $76,568 $134,099 $427,942Transaction and Other Fees, Net – – – – – 1 102 103Interest Income and Dividend Revenue 7,385 8,148 5,254 1,250 1,842 1,396 1,268 5,756Other (11) 4,899 (35) 1,051 (21) (932) (342) (244)
Fee Revenues $367,658 $410,566 $395,937 $96,867 $124,530 $77,033 $135,127 $433,557ENI to NFRE ReconciliationEconomic Net Income $195,988 $108,534 $85,668 $16,991 $34,038 $8,231 $42,171 $101,431Pro Forma Compensation Adjustment (1) (57,530) – – – – – – –Pro Forma Interest Expense (2) 1,122Investment Income (Loss) Adjustment – – (1,662) (476) (1,186) (417) (512) (2,591)Investment Income (Loss) – Blackstone's Treasury Cash Management Strategies – – 1,220 – 1,220 350 484 2,054
Taxes Payable (68,140) (13,356) (7,475) (110) (2,294) (2,092) (4,987) (9,483)Net Fee Related Earnings (3) $71,440 $95,178 $77,751 $16,405 $31,778 $6,072 $37,156 $91,411
ENI Recap – Financial Advisory, As Reported
Fee Revenues and Net Fee Related Earnings, As Disclosed in Presentation
________________________________________________
(1) Represents adjustments for expenses related to employee compensation and profit sharing arrangements that were not effective prior to the reorganization.(2) Represents adjustments to add back interest expense based on the assumption that the revolving credit facility was repaid in full from the proceeds of the offering as of January 1, 2007.(3) Pro Forma for Twelve Months Ended December 31, 2007.

B. Speaker Biographies

2010 Blackstone Investor Day
Presenter Biographies
Stephen A. Schwarzman is Chairman, CEO and Co‐Founder of Blackstone and the Chairman of the board of directors of its general partner, Blackstone Group Management L.L.C. He has been involved in all phases of the firm’s development since its founding in 1985.
Mr. Schwarzman began his career at Lehman Brothers, where he was elected Managing Director in 1978 at the age of 31. He was engaged principally in the firm’s mergers and acquisitions business from 1977 to 1984, and served as Chairman of the firm’s Mergers & Acquisitions Committee in 1983 and 1984.
Mr. Schwarzman is a member of The Council on Foreign Relations and The Business Council. He is on the board of The New York Public Library, and The Asia Society. He serves on The JP Morgan Chase National Advisory Board, The New York City Partnership Board of Directors and The Advisory Board of the School of Economics and Management, Tsinghua University, Beijing. Mr. Schwarzman is a Trustee of The Frick Collection in New York City and Chairman Emeritus of the Board of The John F. Kennedy Center for the Performing Arts. He also was awarded the Légiond’honneur by President Jacques Chirac.
Mr. Schwarzman holds a BA from Yale University and an MBA from Harvard Business School. He has served as an adjunct professor at the Yale School of Management and on the Harvard Business School Board of Dean’s Advisors.
Hamilton (“Tony”) E. James is President, Chief Operating Officer of Blackstone, and a member of the board of directors of our general partner, Blackstone Group Management L.L.C. He is also a member of Blackstone’s Management and Executive Committees and sits on each of the firm’s investment committees.
Prior to joining Blackstone Mr. James was Chairman of Global Investment Banking and Private Equity at Credit Suisse First Boston and a member of the Executive Board. Prior to the acquisition of Donaldson, Lufkin & Jenrette by Credit Suisse First Boston in 2000, Mr. James was the Chairman of DLJ’s Banking Group, responsible for all the firm’s investment banking and merchant banking activities. Mr. James joined DLJ in 1975 as an Investment Banking associate. He became head of DLJ’s global M&A group in 1982, founded DLJ Merchant Banking, Inc. in 1985, and was named Chairman of the Banking Group in 1995. He is a Director of Costco Wholesale Corporation and Swift River Investments, Inc., and has served on a number of other corporate Boards.
Mr. James is Vice Chairman of The Kennedy Center Corporate Fund Board, Trustee and member of The Executive Committee of The Second Stage Theatre, Trustee of The Metropolitan Museum of Art , Vice Chairman of Trout Unlimited’s Coldwater Conservation Fund, Trustee of Woods Hole Oceanographic, Trustee of Wildlife Conservation Society, Advisory Board member of The Montana Land Reliance, and Chairman Emeritus of the Board of Trustees of American Ballet Theatre. He is also a former member of the President’s Export Council – Subcommittee on Technology & Competitiveness.
Mr. James graduated magna cum laude with a BA from Harvard College in 1973 and was a John Harvard Scholar. He earned an MBA with high distinction from the Harvard Business School and graduated as a Baker Scholar in 1975.
2010 Blackstone Investor Day
Presenter Biographies
Timothy Coleman is a Senior Managing Director and Head of the Restructuring & Reorganization Group. Mr. Coleman also serves as a member of Blackstone’s Executive Committee.
Since joining Blackstone in 1992, Mr. Coleman has worked on a variety of restructuring and reorganization assignments for companies, creditor groups, special committees of corporate boards, corporate parents of troubled companies and acquirers of distressed assets. Mr. Coleman’s most notable assignments include Adelphia, AT&T (in the restructurings of AT&T Canada, Alestra, AT&T Broadband and Excite@Home), Bear Stearns Asset Management, Bidermann Industries USA, Inc., Cable & Wireless Holdings, Camelot Music, Inc., CellNet Data Systems Inc., Credit‐Based Asset Servicing and Securitization LLC (“C‐BASS”), Criimi Mae, Delta Air Lines, Edison Brothers Stores, Inc., Ermis Maritime Shipping, Financial Guaranty Insurance Company (“FGIC”), FLAG Telecom, Geneva Steel Company, Guangdong Enterprises, Harnischfeger Industries, Harrah’s Jazz Company, JPS Textile Group, Inc., Koll Real Estate, Mirant Corp., Molten Metal Technology, Inc., RCN, R.H. Macy & Co., Stratosphere Corporation, Supercanal Holding, S.A., Vencor, Inc., Williams Communications, Xerox Corporation and XL Capital.
The International Financing Review recognized Mr. Coleman’s efforts in the restructuring of C‐BASS by naming the transaction the Restructuring of the Year in 2008.
Before joining Blackstone, Mr. Coleman was a Vice President at Citibank N.A. for twelve years, where he divided his time between corporate restructuring, real estate restructuring, and loan syndications.
Mr. Coleman is a frequent guest lecturer at Columbia University and New York University. He is a member of the inMotion Board of Directors and the Board of Leaders of the Marshall School of Business at the University of Southern California.
Mr. Coleman received a BA from the University of California at Santa Barbara and an MBA from the University of Southern California.
Bennett J. Goodman, Senior Managing Director of The Blackstone Group and a Member of the Blackstone Group Executive Committee, is a Founder of GSO Capital Partners.
Before co‐founding GSO Capital Partners in 2005, Mr. Goodman was Chairman, Founder and Managing Partner of the Alternative Capital Division of Credit Suisse First Boston. He was responsible for overseeing $33 billion of assets under management, including investment partnerships for private equity investments, mezzanine securities, real estate investments and several credit oriented investment strategies. Mr. Goodman was a member of the Executive Board and the Management Council of CSFB. Additionally, Mr. Goodman served as the Chairman of the Corporate Bank, overseeing CSFB’s $35 billion of global corporate lending activities.
Mr. Goodman joined CSFB in 2000 when it acquired Donaldson, Lufkin & Jenrette (“DLJ”) where he was Global Head of Leveraged Finance. Mr. Goodman joined DLJ in 1988 as the founder of the High Yield Capital Markets Group. In 1993, DLJ became the #1 global issuer of high yield bonds and Mr. Goodman’s team retained that coveted market position for the next 11 consecutive years. Prior to joining DLJ, Mr. Goodman worked in the high yield business at Drexel Burnham Lambert from 1984 to 1988.
Mr. Goodman graduated from Lafayette College and the Harvard Business School. He is on the Board of Directors of the Film Society of Lincoln Center, the Cancer Research Institute and the American Jewish Committee (Westchester Chapter). He also serves on the Dean’s Council of Mt. Sinai School of Medicine and the investment committee of the Lafayette College endowment. Mr. Goodman received the 2004 Lifetime Achievement Award from Euromoney Magazine for his career achievements in the global capital markets.

2010 Blackstone Investor Day
Presenter Biographies
Jonathan D. Gray is Senior Managing Director and Co‐Head of Real Estate. He is also a member of Blackstone’s Management and Executive Committees.
Since joining Blackstone in 1992, Mr. Gray has led the privatization of eleven public real estate companies valued at more than $100 billion including Extended Stay America, Carr America, Equity Office Properties and Hilton Hotels. Mr. Gray previously worked in the Advisory Group and the Private Equity Group at Blackstone.
Mr. Gray received a BS in Economics from the Wharton School, as well as a BA in English from the College of Arts and Sciences of the University of Pennsylvania, where he graduated magna cum laude and was elected to Phi Beta Kappa. He currently serves as a board member of the Pension Real Estate Association, NAREIT, Harlem Village Academies and Trinity School.
J. Tomilson Hill is President and Chief Executive Officer of the Funds of Hedge Funds group, a Vice Chairman of Blackstone and a member of the board of directors of our general partner, Blackstone Group Management L.L.C.
Mr. Hill previously served as Co‐Head of the Corporate and Mergers and Acquisitions Advisory group before assuming his role in the Funds of Hedge Funds group. In his current capacity, Mr. Hill is responsible for overseeing the day‐to‐day activities of the group, including investment management, client relationships, marketing, operations and administration. He also serves as a member of Blackstone’s Management and Executive Committees.
Before joining Blackstone in 1993, Mr. Hill began his career at First Boston, later becoming one of the Co‐Founders of its Mergers & Acquisitions Department. After running the Mergers & Acquisitions Department at Smith Barney, he joined Lehman Brothers as a partner in 1982, serving as Co‐Head and subsequently Head of Investment Banking. Later, he served as Co‐Chief Executive Officer of Lehman Brothers and Co‐President and Co‐COO of Shearson Lehman Brothers Holding Inc.
Mr. Hill is a graduate of Harvard College and the Harvard Business School. He is a member of the Council on Foreign Relations where he chairs the Investment Committee and serves on the Council’s Board of Directors, and is a member of the Board of Directors of Lincoln Center Theater, where he serves as President. Mr. Hill serves as Chairman of the Board of Trustees of the Smithsonian’s Hirshhorn Museum and Sculpture Garden. He is a member of the Advisory Board of Christie’s and a member of the Board of Directors of OpenPeak Inc.

2010 Blackstone Investor Day
Presenter Biographies
Garrett M. Moran is a Senior Managing Director and Chief Operating Officer of the Private Equity Group. He is a member of Blackstone’s Executive Committee, as well as all investment committees for the Private Equity Group.
Prior to joining Blackstone in 2005, Mr. Moran was a Senior Principal and the President of MMC Capital. Before joining MMC Capital in 2002, Mr. Moran had a long career at Donaldson, Lufkin & Jenrette. His last position there was Vice Chairman and co‐head of the Banking Group. He joined DLJ in 1982 as an investment banking associate and subsequently headed the firm’s High Yield Bond Department and served as Chief Operating Officer of DLJ’S Taxable Fixed Income Division. He was Vice Chairman and co‐head of the Banking Group of DLJ at the time of the firm’s acquisition by Credit Suisse First Boston Corporation. Following that acquisition, Mr. Moran served CSFB as co‐head of the investment banking integration effort and subsequently was the head of CSFB’s Private Equity Division.
Mr. Moran is a board member of the Posse Foundation, former Chairman of the Board of Trustees of the Brunswick School and former Vice Chairman of the board of Middlebury College. He received a BA from Middlebury College and an MBA from the Wharton School of the University of Pennsylvania.
James A. Quella is a Senior Managing Director and Senior Operating Partner in the Private Equity Group.
Mr. Quella is responsible for monitoring the strategy and operational performance of Blackstone portfolio companies and providing direct assistance in the oversight of large investments. He is also a member of the firm’s Private Equity Investment Committee.
Prior to joining Blackstone in 2004, Mr. Quella was a Managing Director and Senior Operating Partner with DLJ Merchant Banking Partners‐CSFB Private Equity. Prior to that, Mr. Quella worked at Mercer Management Consulting and Strategic Planning Associates, its predecessor firm, where he served as a senior consultant to CEOs and senior management teams, and was Co‐Vice Chairman with shared responsibility for overall management of the firm.
Mr. Quella received a BA in International Studies from the University of Chicago/University of Wisconsin‐Madison and an MBA with dean’s honors from the University of Chicago. He is also the co‐author of Profit Patterns: 30 Ways to Anticipate and Profit from the Strategic Forces Reshaping Your Business. Mr. Quella has been a member of various Private Equity company boards and currently serves as a Director of Catalent, Freescale Semiconductor, Graham Packaging, Michaels Stores, Inc., and Vanguard Health Systems.
Vikrant Sawhney is a Senior Managing Director in the Private Equity Group and is based in New York. Mr. Sawhney leads the Private Equity Group’s capital markets activities and also works closely with GSO, Advisory & Restructuring Group and various other parts of the firm on credit‐related matters.
Before joining Blackstone in 2007, Mr. Sawhney worked as a Managing Director in the Financial Sponsors Group at Deutsche Bank, where he was responsible for managing the firm’s relationships with Blackstone and several other large private equity firms. Prior to joining Deutsche Bank, Mr. Sawhney was an Associate at the law firm of Simpson Thacher & Bartlett.
Mr. Sawhney received a BA, magna cum laude, from Dartmouth College, where he was elected to Phi Beta Kappa. He also received a J.D., cum laude, from Harvard Law School.
2010 Blackstone Investor Day
Presenter Biographies
John Studzinski CBE is a Senior Managing Director and global head of Blackstone Advisory Partners LP. Mr. Studzinski is based in both New York and London.
Mr. Studzinski’s primary role is to oversee Blackstone’s global advisory business. He is a member of the firm’s Executive Committee.
Before joining Blackstone in 2006, Mr. Studzinski was a member of the Group Management Board and co‐head of investment banking at HSBC based in London from 2003 to 2006. Prior to that he was at Morgan Stanley from 1980 to 2003, where he served as head of the European Investment Banking Division and Deputy Chairman of Morgan Stanley International.
His recent transaction experience includes advising the Board of AIG on its global restructuring, the Ministers of the Government of the Ukraine, the Board of Reuters on the merger with Thomson, China Development Bank on its investment in Barclays PLC, the Board of Northern Rock on its restructuring, the Board of Suez on the proposed merger with Gaz de France, the Board of Unilever on the Dual Head Structure, the BAT senior management on certain material strategic options and the Board of Petrochina on a possible acquisition of Unocal.
Mr. Studzinski graduated from Bowdoin College in 1978 with a double BA Degree magna cum laude in Biology & Sociology. He received an MBA from the University of Chicago in 1980 in Finance and Marketing. He is Vice‐Chair and Director of Human Rights Watch where he serves on the Executive Committee as well as Chairman of the Investment Committee. He also serves as a Trustee of Bowdoin College, the Tate Foundation, The Passage Day Centre for the Homeless and The Royal Parks Foundation. He is a member of the Council of The Royal College of Art and is Chair of the Emmaus Revives Lives campaign. In mid 2007, Mr. Studzinski stepped down as a trustee of the Tate and became Chairman of Benjamin Franklin House. In 2001, he established the Genesis Foundation which supports and nurtures emerging composers, directors, writers and actors into sustained careers in the arts.
Mr. Studzinski was made a Knight of the Order of St. Gregory for his humanitarian work for the homeless. He was also made a Knight Commander of Saint Sylvester. He received the Prince of Wales Ambassador’s Award in recognition of his contribution to the homeless. He received the Beacon Prize in 2004 for services to philanthropy and in October 2007 was voted Banker of the Year by the Variety Club UK. In 2008, he was named in the Queen’s New Year Honours List as a Commander of the British Empire (“CBE”) for his services to the Arts and to Charity.
Laurence Tosi, a Senior Managing Director, is the firm’s Chief Financial Officer. He also serves on the firm’s Executive Committee.
Before joining Blackstone in 2008, Laurence Tosi was the Chief Operating Officer for the Global Markets and Investment Banking Group of Merrill Lynch & Co. Prior to that, he was Senior Vice President and Finance Director responsible for Merrill Lynch’s global finance organization, including worldwide accounting, regulatory reporting, budgeting and corporate development.
Laurence Tosi received a BA, a JD and an MBA from Georgetown University.

2010 Blackstone Investor Day
Presenter Biographies
Joan Solotar is a Senior Managing Director in the External Relations and Strategy Group of The Blackstone Group and a member of the firm’s Executive Committee. Ms. Solotar has management responsibility for shareholder relations and public affairs and also guides the firm on analyzing strategic development opportunities.
Before joining Blackstone in 2007, Ms. Solotar was with Banc of America Securities where she was a Managing Director and Head of Equity Research. She started her career in equity research at The First Boston Corporation and prior to joining Bank of America was part of the financial services team at Donaldson, Lufkin & Jenrette and later with CSFB as a Managing Director. Ms. Solotar was ranked each year from 1995 to 2002 in the Brokers and Asset Management category on the Institutional Investor All‐America Research Team, and consistently ranked highly in the Greenwich Survey of portfolio managers. She also served as Chairperson of the Research Committee for the Securities Industry Association.
Ms. Solotar received a BS in Management Information Systems at the State University of New York at Albany and an MBA in Finance at NYU. She is currently on the Board of Directors of the East Harlem Tutorial Program.
Weston Tucker is a Vice President in the External Relations and Strategy Group.
Since joining Blackstone, Mr. Tucker has been involved in Blackstone’s dealings with the investment community.
Before joining Blackstone in 2007, Mr. Tucker worked as an associate in JPMorgan’s equity research department, covering telecom and cable. He began his career at AT&T, where he worked in a variety of finance roles including investor relations and communications, as well as corporate development.
Mr. Tucker graduated summa cum laude with a BS in Business Administration (Finance) from Ohio State University.

2010 Blackstone Investor Day
Notes

2010 Blackstone Investor Day
Notes

2010 Blackstone Investor Day
Notes

2010 Blackstone Investor Day
Notes

2010 Blackstone Investor Day
Notes

2010 Blackstone Investor Day
Notes

2010 Blackstone Investor Day
OfficesNew York345 Park AvenueNew York, NY 10154Phone: +1 212 583 5000 (TBG) Fax: +1 212 583 5749 (TBG)Phone: +1 212 583 5799 (Park Hill)Fax: +1 212 583 5639 (Park Hill)
New York – GSO280 Park Avenue11th FloorNew York, NY 10017Phone: +1 212 503 2100Fax: +1 212 503 6930
Atlanta4401 Northside Parkway3rd Floor, Suite 375Atlanta, GA 30327Phone: +1 404 460 2321Fax: +1 404 460 2337
BostonExchange Place53 State StreetBoston, MA 02109Phone: +1 617 646 2900 (BAP) Fax: +1 617 646 2905 (BAP)Phone: +1 866 800 8933 (Asia Adv.)Phone: +1 617 598 2000 (Asia Adv.)(outside North America)
Chicago200 West Madison StreetSuite 3800Chicago, IL 60606Phone: +1 312 705 3070Fax: +1 312 705 3079
Dallas3949 Maple AvenueSuite 400Dallas, TX 75219Phone: +1 214 661 8390Fax: +1 214 661 8395
Houston – GSO11 Greenway Plaza30th Floor, Suite 3050Houston, TX 77046Phone: +1 713 358 1400Fax: +1 713 358 1401
Los Angeles1299 Ocean AvenueSuite 320Santa Monica, CA 90401Phone: +1 310 310 6949Fax: +1 310 310 6998
Menlo Park2494 Sand Hill RoadSuite 200Menlo Park, CA 94025Phone: +1 650 798 3800Fax: +1 650 798 3801
San Francisco101 California StreetSuite 2880San Francisco, CA 94111Phone: +1 415 276 5900Fax: +1 415 276 5919
London40 Berkeley SquareLondon, W1J 5ALUnited KingdomPhone: +44 (0) 20 7451 4000Fax: +44 (0) 20 7451 4001Fax: +44 (0) 20 7451 4091(Park Hill)
London – GSO13 Hanover Square5th FloorLondon W1S 1HNUnited KingdomPhone: +44 (0) 20 7758 9000Fax: +44 (0) 20 7758 9098 / 9099
Paris3 Rue Paul Cezanne 4th Floor 75008 Paris FrancePhone: +33 (0) 1 56 69 16 30Fax: +33 (0) 1 56 69 16 31
MumbaiExpress Towers, 5th FloorNariman PointMumbai – 400 021IndiaPhone: +91 (0) 22 6752 8520 (BFSIP)Fax: +91 (0) 22 6752 8530 (BFSIP)Phone: +91 (0) 22 6752 8500 (BAIP)Fax: +91 (0) 22 6752 8531 (BAIP)
Hong KongTwo International Finance Centre9th Floor, Suite 9018 Finance StreetCentral, Hong KongPhone: +852 3656 8600Fax: +852 3656 8601
Tokyo11F AIG Building1-1-3 Marunouchi, Chiyoda-kuTokyo, 100-0005JapanPhone: +81 (03) 4577 8400Fax: +81 (03) 4577 8401
BeijingWinland International Finance CenterUnit F817-18No. 7, Finance StreetXicheng District, BeijingChina 100140Phone: +86 10 6649 7300Fax: +86 10 6649 7301 (Pvt Equity)Fax: +86 10 6649 7310 (Corp. Advisory)
SydneyAngel PlaceSuite 2802123 Pitt StreetSydney, NSW 2000AustraliaPhone: +61 2 8016 7200Fax: +61 2 8016 7201
ShanghaiUnit 1101, DBS Bank TowerNo. 1318 Lujjazui Ring Road, PudongShanghai 200120, PRCPhone: +86 21 6169 8188Fax: +86 21 6169 8189