Embed Size (px)
Citation preview
ETHEKWIN I ELECTR IC ITY
ANNUAL REPORT2 0 1 0 / 2 0 1 1

EThekwini Electricity supplies more than 640 000 customers in an area coveringnearly 2 000 square kilometres. This encompasses the area of the eThekwiniMetropolitan Region and some adjacent areas.
Electricity for the main supply to the Metro Region is purchased at275 000 volts from Eskom at three in-feed points. EThekwini Electricity alsopurchases electricity from Eskom for , Winkelspruit, Mpumalanga and Magabeni.From these points electricity is transmitted and distributed for use by the fullspectrum of customers ranging from the large industrial and commercial sectorto the residential communities. EThekwini Electricity purchases just over 5%of the total energy generated by Eskom. EThekwini Electricity operates underthe Electricity Regulation Act, 2006. Its policies are determined by the MetropolitanCouncil of Durban and the National Energy Regulator of South Africa (NERSA).
EThekwini Electricity - a leader in electricity distribution providing energy forthe future.
To provide electricity, public lighting and other energy services that satisfy ourcustomers and community whilst maintaining sound business principles.
To develop the Electricity Unit as an undertaking that maximises the value ofits electricity supplies and makes effective use of all its resources
Our Vision
Our Mission
Scope
Strategy

EThekwini Municipality is currentlygenerating electricity from householdwaste, reducing greenhouse gasemissions. The project captures methanerich gas from two landfill sites to providefuel for the production of electricity. Thegas is captured by sinking wells up to40m deep in the landfill waste sites, thewells are ducted to the generator throughinterconnecting pipes linked to anunderground main gas collector andextracted via a roots blower system whichmaintains a partial vacuum in the pipesresulting in the gas being sucked out ofthe landfill.
Operational sites:1. Bisasar Road - 7km from the
Durban Central Business District
2. Mariannhill located in the western areaof Durban in the Metro area formerlycalled the Inner West City Council.
The approx. combined operating outputof the these sites: 7.5 MW.
The South African Government has developed an integrated resource plan for a 20 year period that provides an indication of the country’sfuture electricity demand as well as various supply side options. The Long-term Electricity Planning goal is to ensure sustainabledevelopment considering: Technical constraints, Economic constraints, Social constraints and Externalities.
The recently adopted Intergrated Resource Plan has provided a clear indication of national government’s commitment to promoterenewable energy as a source of energy supply. This plan is complemented by the Renewable Energy Independent Power ProducerProcurement Programme implemented by the National Energy Regulator of South Africa (NERSA) to stimulate the renewable energymarket in South Africa.
EThekwini Municipality (EM) hereby responds to the IRP and is committed to promoting the up-take of renewable energy projects withinits boundaries.
This project involves the installation offour wind turbines and masts for operationin Durban. The project was initiated byBremen Overseas Research andDevelopment Association (BORDA) undertheir “Re-powering” program. The fourunits (150 kW each) were originally usedby HanseWasser Waste Water Treatment(HWWT) but were decommissioned aftera town planning ordnance held thatHWWT remove these wind turbinesfollowing the town planning authority'sapproval of HWWT's application for alarger wind farm on their premises.
BORDA together wi th DeutschWindtechnik have since worked togetherwith eThekwini Municipality and visitshave been conducted between bothBremen and Durban to further developthe Wind re-powering Project.
The WindRe-powering Project
Solar PV Plant
A solar CPV power plant located in thecity of Durban would serve as a highvisibility flagship project that will alsodemonstrate South Africa's capability andreadiness to implement renewable energyprojects on a large scale as well aspromote the renewable energy investmentpotential in the country. The Solar PVarray is one of the largest in the country,making eThekwini Municipality a frontrunner to contribute to the country'srenewable energy target as set by theDepartment of Energy. The CPV systemincorporates high-performance triple-junction solar cells - the same solar cellsutilised to power satellite systems. Triple-junction cells have the solar industry'shighest conversion efficiency of nearly40%, double the efficiency of conventionalsolar cells.
The CPV system requires a high precisiondual axis tracker. At each moment of theday, the CPV modules have to beperpendicularly aligned to the sunlight inorder to concentrate its light directly ontothe cells. The dual-axis tracker systemfollows the course of the sun from eastto west and its height above the horizon.Thirty-four CPV units can produce up to500 kW peak.
The Landfill Site
3 OverviewHead of Electricity
4-9 HV OperationsDepartmentDepartment OverviewHV Planning BranchHV Projects BranchHV Substations BranchHV Lines BranchHV Cables BranchHV Network Control Branch
10-13 MV/LV OperationsDepartmentDepartment OverviewNetwork Control BranchConstruction Planning andWorks BranchMaintenance BranchLighting Works BranchLighting Planning Branch
14-20 Technical SupportDepartmentDepartment OverviewCommunications Networks BranchElectrical Workshops BranchMechanical Workshops BranchNetwork Drawing Office and Survey BranchProtection and Test BranchTechnology Services BranchSHERQ and Training Branch
21-25 Customer and Retail Services Department
Department OverviewPricing and Marketing BranchRevenue Protection BranchMeter Engineering BranchCustomer Services BranchContact Centre Branch
26-31 CommercialDepartmentDepartment OverviewAdministration BranchProductivity BranchInformation Technology BranchFinance BranchProcurement BranchBusiness Risk Branch
32-34 Human ResourcesDepartmentDepartment OverviewHuman Resources Services BranchHuman Resources Administration BranchTraining/Skills Development Branch
35-45 GraphsAnnual Capital ExpenditureAnnual RevenueSystems Maximum Demand per annum and growthover previous yearEnergy Sales per annumand growth over previous yearGrowth of Bulk CustomersAverage MWh per Bulk Customerper monthGrowth of Business and General CustomersAverage kWh per Business and General CustomerGrowth of Credit Residential Customers
Average kWh per Credit ResidentialCustomerGrowth of Prepayment ResidentialCustomersAverage kWh per PrepaymentResidential Customer per monthOverall Growth of CustomersOverall Average kWh per Customerper monthNumber of EmployeesEnergy sold per Employee (GWh)Free Basic ElectricityAverage Free Basic Electricity ClaimsDistribution of Energy Sales for financialyear 2010/2011Distribution of Revenue from Sales forfinancial year 2010/2011Distribution of Expenditure for financialyear 2010/2011New Connections per region forfinancial year 2010/2011
46-60 Annual FinancialStatementsStatement of Financial Position at 30 June 2011Statement of Financial Performance for the year ended 30 June 2011Statement of Financial Changesin net assets for the year ended 30 June 2011Notes to the Financial Statements for the year ended30 June 2011
61-63 Statistical DataCustomer Base StatisticsMaximum Demand and Energy Sales per annumExpenditure per annum
CONTENTS

Name:Sandile Maphumulo
Designation:Head - Electricity Unit
Resume’:Sandile began his career as anapprentice electrician 26 years ago.He progressed through the rankswithin the council and culminated atthe helm of the organisation inNovember 2006 as the Head of Electricity.
Further Experience within eThekwini:Deputy Head - MV/LV Operations Manager - Lighting Works Manager - Regional Operations
Professional Affiliation:President of the AMEU (2007),SA Board member of EDI HoldingsSALGA representative on national committees
�
�
�
�
HEADS OVERVIEWAs we conclude another financial year, I am bursting in the sunshine of our business success as I realize that wehave once again successfully completed a rewarding 365 days of serving the people of eThekwini with reliable andhigh quality electrical services. I have pleasure in presenting to you our financial statements as well as an overviewof our organization, highlighting our individual department's goals, aspirations and achievements over the last year.In 2010 we continued the implementation of our new, more rigorous skills program to recruit, develop and retaincommitted and inspired employees which are not only responsible for keeping the lights burning but also accountablefor upholding our vision to be a leading electricity distributor. Our staffing levels have risen by approximately 3%over the last year bringing our employee count to 2200. We are committed to taking care of our employee's careeraspirations and we are embarking on a talent management program to recognize and uplift our employees toensure that we harness the full capacity of our resources in a disciplined and consistent manner.
Traditionally across the municipalities, electrical service delivery has often proved to be challenging both in regardsto timing and meeting cost targets. At eThekwini, we have adopted a strategic, stepwise plan in spreading electricalservices to all sectors of the community ensuring that we are able to play our part in enriching the lives of all SouthAfricans. Our approach is working well and adding more vigor to the process of electrification. As a result of ournew improved plan, we were able to complete a total of 15329 new connections for the last financial year and wehope to increase these figures year on year.
As the number of legal connections grow in our area of supply, unfortunately so too does the illegal ones. Althoughwe are continuing with our anti theft campaigns and mitigation strategies to restrain this country wide endemic, weare faced with the stark reality that our loss figures are progressively climbing. We have deployed security intelligenceteams on the ground coupled with undercover investigators to help purge the city of this problem. Whilst we intensifyour efforts, we make an appeal to the community to be part of this process and report electricity theft. SILENCEGIVES THIEVES THE OPPORTUNITY TO CONTINUE …..
Electricity is the lifeblood of economic growth in the 21st century and eThekwini is committed to keeping electricityprices as low as possible. However due to the national increases, we are forced to adjust our tariffs in accordancewith this higher than average increases to remain sustainable. With Eskom's tariffs increasing by 28.9 %, an averagetariff increase of 25% was passed on to customers in Durban during 2010.The impact of higher prices as well asthe slowed economy has resulted in customers in Durban using less electricity when compared to last year. Whilstthe reduction reflects a declining revenue stream as our growth projections have not materialized, our disciplinedcost management approach kept our financials healthy and positive.
The safety of our people is our key concern and we are always striving to reduce accidents and achieve aninjury/accident free year. We are also dedicated to environmental preservation and minimizing the environmentalimpact of our operations. Whilst our primary response to climate change continues to focus on using energy moreproficiently, we have a keen interest in investigating localized renewable energy options with an intention of reducingour reliance on coal fired power stations and contributing to a carbon neutral society.
Quality leadership is critical to the success of this unit and I would like tothank my executive team for displaying such qualities, for taking ownershipof the unit's strategy, for debating its core principles and for stress testing itto ensure that it is robust and able to take us to the top.
I also wish to pay tribute to the management teams and to all the employees,who have responded so eagerly and competently to the diverse challengesthat were experienced during the year. It is with your dedication that we areable to keep the electrons flowing!!! RS MAPHUMULO
HV OPERATIONS
Name:Anthony Dold
Designation:Deputy Head - HV Operations
Qualification:B.Sc. Electrical Engineering
Professional Registration:PrEng (ECSA)
Experience:
Within eThekwini:HV Operations 21 yrsProject Engineer 13 yrsTest Engineer 03 yrsContracts Engineer 04 yrs
�
�
�
�
�
The HV Operations Department is responsible for the planning, construction, operation andmaintenance of eThekwini Electricity's primary network of high voltage lines, cables andsubstations. The projects undertaken by this Department are to provide for increased bulkcapacity and to improve the reliability of the regions electricity supply.
Accordingly they are typically large, high cost projects which require considerable time andattention to satisfy environmental legislation in the first instance and then 30 months or morein the construction phase.
Our HV Department prides itself in providing reliable, state of the art solutions for the deliveryof high voltage power from our intake points to our customers and secondary networks.
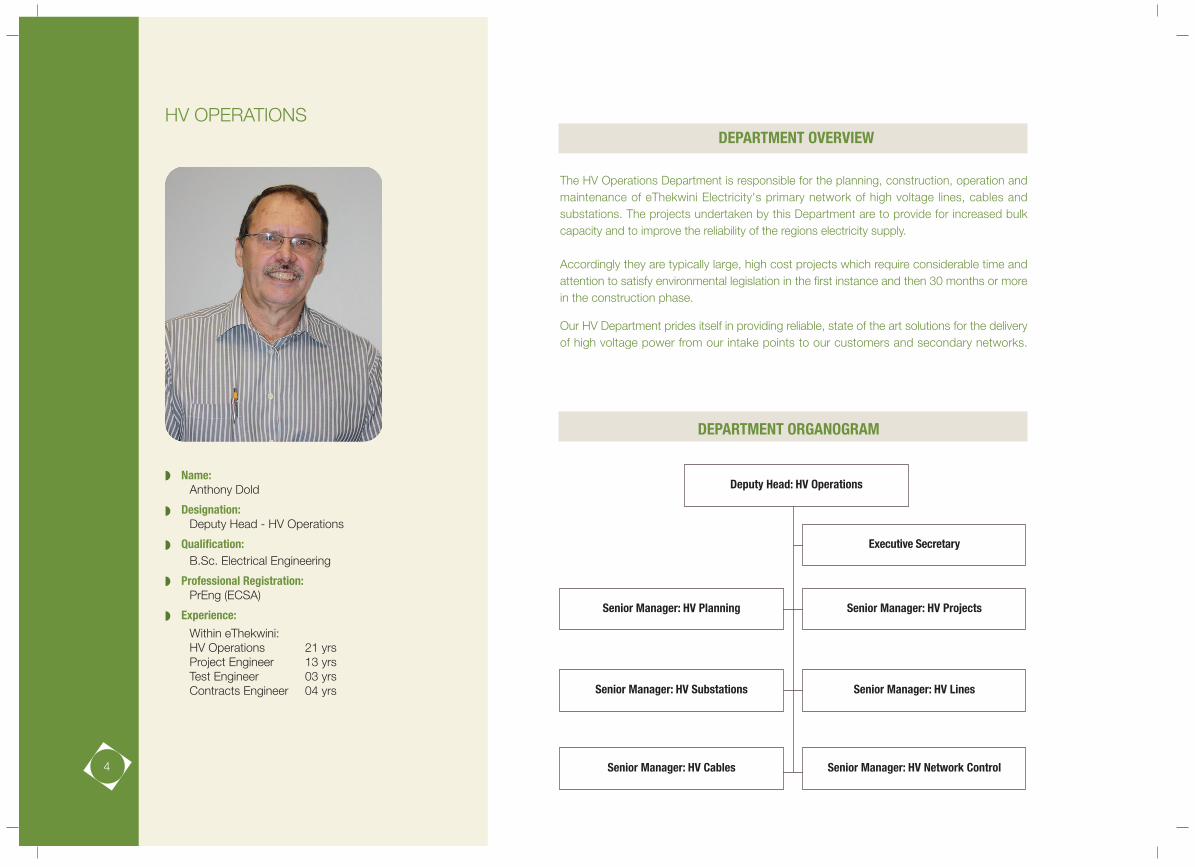
Senior Manager: HV Substations
Senior Manager: HV Planning Senior Manager: HV Projects
Senior Manager: HV Lines
Senior Manager: HV Cables Senior Manager: HV Network Control
Deputy Head: HV Operations
Executive Secretary
DEPARTMENT OVERVIEW
DEPARTMENT ORGANOGRAM
4
The analysis of the transmission system capability is also ongoing. The transmissionsystem network diagrams were reviewed and updated and using this data, thedetailed model of the 275 kV and 132 kV transmission system was updated. Thismodel allows HV Planning to analyse powerflows and system fault levels down tothe medium voltage busbars of all 132 kV substations. In a joint effort betweeneThekwini Electricity and Eskom, the voltage stability of the combinedEskom/eThekwini transmission system was analysed. The calculated stability limitsserve as a guide for network control and form part of the supply agreement withEskom. A network master plan for the eThekwini Electricity's area of supply is inits final stage and this will become the basis for future planning.
HV PROJECTS BRANCHThe HV Projects Division is responsible for the detailed design and specificationof equipment and management of major system reinforcement projects. Therewere 37 projects in progress during the 2010/2011 year. The status of the projectsat the end of the period under review is as follows:
� Avoca 132/11 kV Substation: This substation will provide supply to the River Horse Development and surrounding areas and also facilitate the de-commissioning of the old and unreliable Corronation 33/11 kV Substation. Commissioned 2 x 30 MVA 132/11 kV transformers and associated 132 kV and 11 kV switchgear.
� Tongaat 132/11 kV Substation: This substation is required to replace substationson the 33 kV network. Commissioned 4 x 30 MVA 132/11 kV transformers and associated 132 and 11 kV switchgear. Completed installation and commissioning of the 132 kV supply cable.
� Parlock 132 kV Switching Station: Establishment of a 132 kV switching stationto provide for a new 132 kV interconnector between various sources. All primary and secondary plant installation complete. Final commissioning and overhead line cut-ins are in progress.
� Phoenix Industrial 132/11 kV Substation: Replacement of the ageing and unreliable 11 kV switchgear. First phase of the board has been replaced and are in the progress of being commissioned.
� Hillcrest 132/11 kV Substation: The load is reaching the firm capacity and the11 kV switchgear needs to be replaced and extended. Fourth phase of the replacement is in the final stages of testing before commissioning. Fifth and final stage to commence afterwards.
� Phoenix North 132/11 kV Substation: The commercial and residential load demand has increased and the firm capacity needs to be upgraded from30 MVA to 60 MVA. Civil works are in progress and transformers have been delivered.
HV PLANNING BRANCHHV Planning involves the forecasting of future growth and predetermining wheredevelopment and increase in demand will take place. This is done by constantliaison with major developers, other service units and large customers in order toensure that the electrical infrastructure upgrades, which normally take years toconstruct, are initiated early.
This department also carries out load flow studies to determine weak points in thenetwork and motivate for funding to improve the network and maintain systemreliability.
During the year under review, the principal details of the following proposals wereconcluded and handed over to the HV Projects Branch for execution:
� Establishment of SAPREF 132/11 kV Substation� Upgrade of Umlazi 132/11 kV Substation� Installation of 275 kV bus section at Durban South Substation� Upgrade of Klaarwater/Umgeni 132 kV Overhead Line
Environmental impact assessment studies and planning/design work was still inprogress in respect of the following projects at the end of the period reviewed inthis report:
� Establishment of Austerville 132/11 kV Substation� Establishment of Kloof 132/11 kV Substation� Establishment of Underwood Road 132/11 kV Substation� Establishment of Mahogany Ridge 132/11 kV Substation� Establishment of Stockville 132 kV Switching station� Establishment of NCP 132/11 kV Substation� Establishment of Bridge City 132/11 kV Substation� Establishment of Klaarwater 400/275/132 kV Substation� Establishment of Bellair 275/132 kV Substation� Establishment of K E Masinga 132/11 kV Substation� Establishment of Glenwood 132/11 kV Substation� Establishment of Rossburgh 132/11 kV Substation� Establishment of Jameson Park 132/11 kV Substation� Establishment of Verulam 132/11 kV Substation� Establishment of Reunion 132/11 kV Substation� Establishment of Verulam 132 kV Substation� Upgrade of Pineside 132/11 kV Substation� Upgrade of Gateway 132/11 kV Substation
5
� Randles 132/11 kV Substation: New substation being fed by the more reliable132 kV system due to the Sydenham 33/11 kV Substation reaching its firm capacity. Civil works has been completed. Installation of 4 x 30 MVA132/11 kV transformers and associated 132 and 11 kV equipment are inprogress. Installation of the 132 kV supply cable is in progress.
� Mondi 132/33 kV Substation: Establishment of a new 132/33 kV substation to increase reliability to large industrial customers in the Southern Industrial Basin. One new 142 MVA 132/33 kV transformer has been delivered. The other transformer, 33 kV switchgear and feeder cables are on order.
� Pinetown 132/11 kV Substation: The commercial and residential load demandin the Pinetown, New Germany and Cowies Hill areas has increased and the firm capacity needs to be upgraded from 30 MVA to 60 MVA. Final stages ofcivil work are in progress. Primary equipment is on order and awaiting delivery.
� Durban South 132 kV Buscoupler and Coedmore Feeder: The buscoupler andfeeder was damaged and certain 132 kV equipment needed to be replaced. All equipment for buscoupler and feeder was replaced and re-commissioned.
� Chatsworth 132/11 kV Substation: The commercial and residential load demandin the area has increased and the firm capacity needs to be upgraded from 30 MVA to 60 MVA. New 132 and 11 kV switchgear has been installed and commissioned.
� Newlands 132/11 kV Substation: The commercial and residential load demandin the area has increased and the firm capacity needs to be upgraded from30 MVA to 60 MVA. Installed 2 x 30 MVA transformers and associated 132 kVequipment and in final stages of being commissioned. First phase of 11 kV board replacement in final stages before commissioning.
� Blair Atholl 132/11 kV Substation: The commercial and residential load demandin the Westville area has increased and the firm capacity needs to be upgradedfrom 30 MVA to 60 MVA. Civil works has been completed and all primary plant
are on order with first deliveries expected in September 2011.� Havenside 132/11 kV Substation: The commercial and residential load demand
in the Chatsworth area has increased and the firm capacity needs to be upgraded from 30 MVA to 60 MVA. 132 kV switchgear has been installed andfinal testing is in progress.
� Karim Lane: Replacement of the 11 kV switchgear required due to its age andunreliability. First phase of the replacement is in progress and requires temporaryboard to be commissioned.
� Ridgeview 132/11 kV Substation: The commercial and residential load demandin the Cato Manor area has increased and the 11 kV system needs to be reinforced. All primary plant has been installed and commissioning is in final stages.
� Clermont 132/11 kV Substation: The commercial and residential load demandin the area has increased and the firm capacity needs to be upgraded from 30 MVA to 60 MVA. Minor civil works in progress. All primary and secondary plant delivered and installation currently in progress.
� Fynnlands 132/11 kV Substation: The commercial and residential load demandhas increased and the firm capacity needs to be upgraded from 30 MVA to 60 MVA. Civil works are in final stages and with 132 kV equipment delivered and rest of primary plant on order.
� Umbogintwini 132/33 kV Substation: Replace the 33/11 kV transformers with132/11 kV transformers and associated equipment. Civil work for first phase in final stages. 132 kV equipment delivered with rest of primary plant on order.
� Umhlanga Ridgeside 132/11 kV Substation: This substation will provide supplyto the various Umhlanga developments and also facilitate the de-commissioningof the old and unreliable Umhlanga and Glenashley 33/11 kV Substations. Civil works have been completed. 4 x 30MVA 132/11 kV Transformers, 11 kVswitchgear and secondary plant are installed and being commissioned. Installation of the 132 kV supply cable is in progress and 132 kV GIS is on order.
� Pearce Road 33/11 kV Substation: Replacement of the 11 kV switchgear required due to it becoming obsolete. Completed with switchgear replaced and commissioned.
� Glenashley 33/11 kV Substation: Replacement of the 11 kV switchgear requireddue to it becoming obsolete. New switchgear has been installed and in final stages of commissioning of first phase.
� Pineside 132/11 kV Substation: Conversion required from the 33/11 kV systemto the more reliable 132/11 kV system. Advanced stage of pre-commission testing of the plant.
� Reservoir Hills 132/11 kV Substation: Extension of the 11 kV switchgear requireddue to the circuits that are at maximum load. Completed as switchgear has been replaced and commissioned.
� Kingsburgh 132/11 kV Substation: New substation for the anticipated demandin the Winkelspruit and Illovo areas and de-commissioning of parts of the oldand unreliable 33 kV network in the Southern region. Installed 2 x 132/11 kV transformers and associated 132 and 11 kV switchgear. Minor civil works andstoning in progress. In advanced stage for final commissioning of substation.
� Klaarwater 275/132 kV Substation: Upgrade current 250 MVA transformers to 315 MVA due to the increase in load. The fifth transformer and all its associated equipment has been installed and commissioned. Procurement for the replacement of the other 4 x 250 MVA 275/132 kV transformers and their associated equipment are in progress.
� Klaarwater and Durban North Substation Capacitor Banks: Replacement required for the old and unreliable capacitor banks. First set of capacitor bankshave been replaced and commissioned. Civil works for second set of capacitor
banks are in advanced stage and plant has been delivered.� Gyles 33/11 kV Substation: Replace old and unreliable 6.6 kV switchgear with
new 11 kV switchgear. New 11 kV switchgear has been installed and testingis in progress.
6
Consequently they are gradually being phased out and replaced by vacuum andgas circuit breakers. However there are still a large amount of oil circuit breakerspresent in HV substations especially at 11 kV. As a result great resources (staff,labour, material, and time) are spent on maintaining this type of switchgear becauseof their old age and the insulating medium used in them. A significant amount ofplant is older than 40 years of age. There are frequent problems associated withtheir old age such as shortage of spares and mal-operation. This has ledto substations such as Amanzimtoti, Bluff, Fynnlands, Maidstone, Trurolands, SnellParade, and Point being de-commissioned. The completion of some major projectsin the past year (and others to be completed shortly) as referred to in HV ProjectsBranch, will allow for de-commissioning of a number of other unreliable substations.The major challenge in the HV Substation Branch was the shortage of staff especiallyelectricians and electrical inspectors. The section operated on a 62.% staffcomplement for the greater part of 2010/11. This made it difficult to cope with thebacklog in the maintenance of equipment. The introduction of the Asset CareCenter helped in the introduction of new business processes and new KPI's thatwould govern the planned maintenance of the equipment. The appointment of theDiagnostic Technician and the assistance from Candidate Technicians increasedthe number of Electrical diagnostic tests conducted on the plant and equipmentfor the year.
Highlights
Replacement of plant and equipment:Umhlanga Rocks Substation - 33 kV dogbox circuit breaker replacementCongella substation - 132/11 kV Transformer 1Gyles Substation - 33/11 kV Transformer 1Kloof Substation - 33/11 kV Transformer 2Frametex Substation - 132/11 kV Transformer 1Sukuma Substation - 132/11 kV Transformer T2 tap changer replacement
Electrical tests were done on the following transformersPineside substation - 132/11 kV Transformers T1A and T1BGreenbury Substation - 132/11 kV Transformer T1Congella Substation - 132/33 kV Transformer T1City Central Substation - 33/11 kV Transformer T1Waterfall Substation - 132/11 kV Transformer T1Jacobs Substation - 132/11 kV Transformer T2A and T2BMarianridge Substation - 132/11 kV Transformer T2A and T1BKloof Substation - 33/11 kV Transformer T2Jameson Park Substation - 33/11 kV Transformer T2
� Mobeni South 132/11 kV Substation: The commercial and residential load demand in the Mobeni South area has increased and the firm capacity needsto be upgraded from 30 MVA to 60 MVA. New 11 kV switchgear has been energised through the existing 11 kV switchgear.
� Greenbury 132/11 kV Substation: The commercial and residential load demandin the area has increased and the firm capacity needs to be upgraded from 30 MVA to 60 MVA. All primary plant has been installed and final testing in progress.
� Umdloti Beach 132/11 kV Substation: The commercial and residential load demand in the area has increased and the firm capacity needs to be upgradedfrom 30 MVA to 60 MVA. All primary plant has been installed and final testingin progress.
� Ottawa 132/11 kV Substation: Transformers were moved to more critical substations and two new transformers are required. 1 x 30 MVA 132/11 kV transformer installed.
� Dalton Rd 132/11 kV Substation: The commercial and residential load demandin the area has increased and the firm capacity needs to be upgraded from 30 MVA to 60 MVA. 132 kV and 11 kV loop cables completed. 132 kV terminations to be done before final commissioning.
� Plangweni 132 kV Substation: New 132 kV switchyard required to feed the Transnet Pump station. All primary plant has been installed and final testing in progress.
� Spare 33/11 kV Transformer and 11 kV Mobile Switchgear: Spares required for on-going projects and maintenance. Spare transformer has been deliveredand spare mobile switchgear is on order.
� Marrianridge 132/11 kV Substation: The commercial and residential load demand in the area has increased and the firm capacity needs to be upgradedfrom 30 MVA to 60 MVA. Civil works have been completed.
� Plangweni Transnet 132 kV Substation: New 132 kV substation at Transnet'sside being supplied from Plangweni. 132 kV supply cable has been installed.Final testing in progress.
HV SUBSTATIONS BRANCHThe HV Substations Branch of HV Operations deals with the operation andmaintenance of equipment that has voltage ranging from 11 kV to 275 kV. Thereare 5 National key point substations that import energy from Eskom at 275kV. The275kV is then transformed to 132 kV, 132 kV transformed to 33 kV and 11 kV,and 33 kV is then transformed to 11 kV and in few cases to 6.6 kV. The types ofequipment that the HV Substation Branch works on, covers switchgear, powertransformers, instrument transformers, busbars, surge arresters, lightning masts,and power line carriers. The different types of insulating medium in circuitbreakers are oil, vacuum and gas. The oil circuit breakers are of old technologythat render themselves uneconomical to maintain and unsafe to operate.
7
The theft of steel members from overhead line towers remains a serious threatto the security of supply for eThekwini Electricity and Eskom.
HV CABLES BRANCHThe high voltage (HV) cables Branch is responsible for the maintenance andoperation of all 132 kV and 33 kV underground transmission cables, as well asall the 11 kV cables that forms part of the primary network infrastructure.
The maintenance of pressurised gas and fluid-filled cables continues to be aproblem. A number of leaks and faults had to be located and repaired on severalstrategic cables, some of which have now been in service in excess of 40 years.Major projects are under way to replace several unreliable cable circuits of thistype in the near future. The Branch was also involved in the establishment of new132/11 kV substations which allowed decommissioning of very old and troublesomecables. Woodlands - Mobil 2, Tongaat-Trurolands and Tongaat-Maidstone aresome of the cables that were decommissioned in the 2010/2011 financial year.Although there is progress being made regarding these problematic cables, it willtake many years before they are completely phased out of the network, thereforethe Branch is also investigating some short term solutions in efficient maintenanceand solving problems associated with these cables, such as a more technologicallyadvanced PFT leak location method.
In 2010/2011, the Branch experienced an increase in the number of 132 kV faults,most notably on the Rossburgh-Congella, Old Fort-Alice Street and Beachwalk-Cathedral circuits. This is a cause for concern as these are regarded as strategiccircuits and prolonged faults on these circuits jeopardise the security of supply.Most of the initial faults on these cables were due to mechanical damage and/orvandalism by third parties. The Branch has already implemented measures toovercome/minimise these failures, the design of the bridge at Joseph Nduli StreetBridge was modified in order to secure the Old Fort-Alice Street cable circuit andthe underground warning tapes is now laid over the 33 kV and 132 kV circuits tominimise mechanical damages.
Cable jointing and terminating is a routine activity for the Branch, this is intricate,time consuming and a specialised process. Over the past years the Branch hasbeen under pressure when it comes to performing these jointing and terminatingduties due to issues such as resource availability, difficulty in hiring new skilledelectricians and a general lack of system security. To strengthen and enhance theskills of in-house electricians, the Branch appointed a team of specialists toconduct a two weeks theoretical and practical jointing and terminating trainingcourse for electricians.
The work backlog was reduced since the Branch appointed a reputable contractorin the field of high voltage cables to assist in performing jointing and terminatingon the 33 kV and 132 kV cables.
The transformer oil filteration/regeneration was done on the following transformersPhoenix Industrial Substation - 132/11 kV Transformers T1A & T1B oil fitrationJameson Park Substation - 33/11 kV Transformer T2 oil filterationJacobs Substation - 132/11 kV Transformers T2A and T2B oil filtrationMarianridge Substation - 132/11 Transformers T1B and T2A oil filtarationCongella Substation - 132/11 kV Transformer T1A oil filterationWaterfall Substation - 123/11 kV Transformer T1 oil fiterationCity Central substation - 33/11 kV Transformer T1 oil filterationGreenbury Substation - 132/11 kV Transformer T1 oil filterationGyles Substation - 33/6.6 kV Transformer T2 oil filterationWestmead Substation - 132/11 kV Transformer T1B oil filterationCahtsworth Substation - 132/11 kV Transformer T2A 0il filteration
Other repairsCoronation Substation - Transformer T1 tap changer repairLivingstone Substation - Transformer T2 tap changer repairCity Central Substation - Transformer T1 tap changer repairWestmead Substation - Transformer 1B full maintenance
Substation constructionDurban South oil entrapment around transformer 2AMerewent oil entrapment around all three transformers
LowlightsThe incidents of copper theft in HV substations were a threat to substation stability.Security guards were placed in those substations that were not mannedto reduce theft and unnecessary outages.
HV LINES BRANCHThe HV Lines Branch is responsible for the operation and maintenance of the highvoltage overhead line system presently consisting of 141 circuit kilometres of 275kV,444 circuit kilometres of 132kV and 35.75 circuit kilometres of 33kV overhead line.The routine safety and maintenance inspections scheduled for the year are up to-date due to increased staff compliments and fewer faults experienced during thefinancial year.
In keeping with the refurbishment master plan a further contract is to be awardedin the new year and the following sections of line will undergo refurbishment:-
� Ottawa to Durban North 275kV overhead line� Durban South to Lotus Park 132kV overhead line� Tee- Marian ridge 132 KV overhead line� Klaarwater to Woodlangs 132kV overhead line8

The Division has also embarked on a security drive over the last year. From asoftware point of view, the Division has engaged with security consultants inCanada for guidance on achieving NERC-CIP compliance. A security policy hasbeen drafted and phase 1 of the security audits will begin early 2012.
A pilot project to install CCTV cameras at 6 substations with high theft rates hasrecently been completed. This system allows for the real-time monitoring of thesestations. Staff are able to monitor work being carried out by contractors as wellas identify acts of theft. A new contract will be awarded in 2012 to install camerasat most of the HV substations over a 5 year period. Efforts on the integration ofCCTV with an Access System are also being investigated.
The financial year 2010/2011 also saw the appointment of two electricians whichbrings the complement of electricians to nine, four of which are competent andfive of which are pre-competent. The top priority for 2011/2012 will be to train thepre-competent electricians to reach the required level of competency. This increasein staff complement will allow more efficient planning of work and hence increasethe Branch's productivity level and also reduce the overdue maintenance. The postof an engineer was also filled and he is expected to assist the Branch in developingmore efficient maintenance methods such as implementation of condition monitoringand diagnostic testing of cables in order to reduce the risk of unplanned, expensiveoutages.
HV NETWORK CONTROLThe Network Control Branch comprises of 3 Divisions: HV Network Control,Systems Performance and Network Management & Control Systems.
HV Network Control DivisionThe HV Network Control Division is responsible for the safe operation and efficientperformance of the High Voltage Network, which incorporates a 24-hour, mannedHV network control centre with remote control and alarm facilities. Durban's primarytransmission network is monitored and controlled from this network room usinga sophisticated Supervisory Control and Data Acquisition (SCADA) system. TheBranch continues to carry out detailed exercises to ensure its readiness in responseto possible disasters which may affect the electricity network. In addition, plansare in progress for the future establishment of a Disaster Recovery Centre.
System Performance DivisionThe system Performance Division is responsible for the network optimization andquality of supply. The Branch continues to strive to ensure that customer complaintsregarding power quality issues are addressed and resolved swiftly. The Quality ofSupply database has been redesigned to improve the information available on theinternet for public view.
Network Management & Control Systems DivisionThe Network Management Division is responsible for deploying electronic technologiesfor the monitoring and Control of the electrical Network. Over the last year theDivision has upgraded several legacy tele-control schemes at TransmissionSubstations. Also, as part of the smart grid initiative, the Division has also mademajor headway in the provision of tele-control schemes at Distribution Substations.To date, approximately 50 Distributor Substations have been commissioned withtele-control capabilities. The Division has upgraded its legacy FSK communicationtechnology to IP. This ensures seamless integration to secondary systems andprovides communication redundancy over the WAN.
A Process Historian has also been commissioned and deployed on the SCADAnetwork. This Historian serves SCADA data to the business environment and allowsfor easy reporting of load and event data.
9
10
DEPARTMENT OVERVIEW
DEPARTMENT ORGANOGRAM
MV/LV OPERATIONS
The MV/LV Operations Department is responsible for the planning, construction operation andmaintenance of the Unit's medium and low voltage network. The department plays a major rolein connecting new customers to the electrical grid thus helping to spread electrical services toall sectors of the community. The department is also responsible for providing public/street lightingand has a strategic focus of introducing new and improved energy efficient lighting technologiesinto the city. Further to the above roles, the department manages and controls all medium to lowvoltage substations.
Advancements in technology with the benefit of cost/operational optimization is driving significantchanges in the electricity supply industry and the MV/LV Department is strategically embracingthese advancements to improve the overall operation, stability and reliability of the network.
Senior Manager: Maintenance
Senior Manager: Network Control
Deputy Head: MV/LV Operations
Senior Manager: Lighting Planning
Executive Secretary
Senior Manager: Lighting Works
Senior Manager: Construction Planning& Works
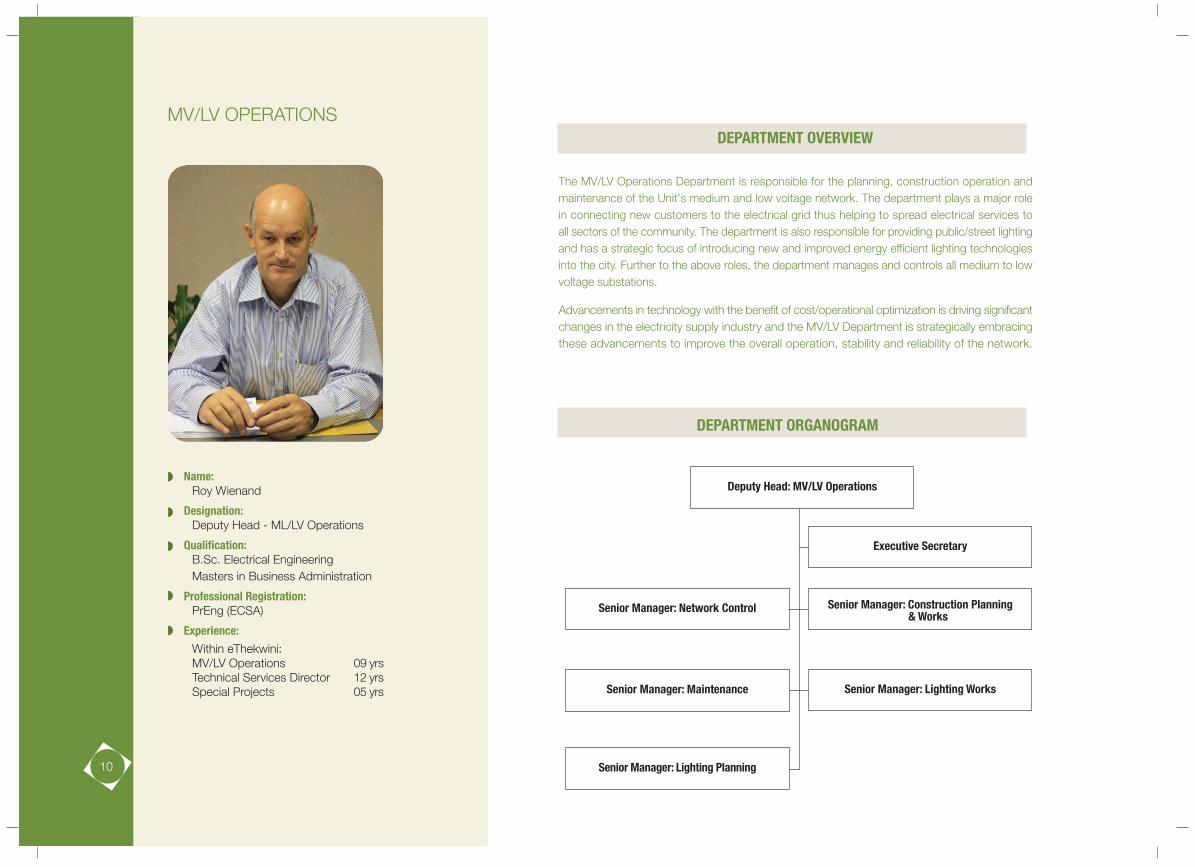
Name:Roy Wienand
Designation:Deputy Head - ML/LV Operations
Qualification:B.Sc. Electrical EngineeringMasters in Business Administration
Professional Registration:PrEng (ECSA)
Experience:
Within eThekwini:MV/LV Operations 09 yrsTechnical Services Director 12 yrsSpecial Projects 05 yrs
�
�
�
�
�
we have made great strides in the lengthy process to re-wire our existing substationsin order to install the mini RTU's. Thus far ninety (90) RTU's have been installedin distributor substations, and with the second batch of twenty five (25) installedand ready for commission in October 2011. We are eager to see it being able tocommunicate real time information from equipment on the network to the ControlCentre, we anticipate a reduction in system outages, shorter response times andexpect greater security of supply.
Last financial year the City's Architectural department undertook a project for newoffices for the Faults Division of Network Control. The new offices are ninety percentcomplete and the staff can move into their new domain in the upcoming months.
eThekwini Electricity is faced with many security challenges, however the greateststruggle is cable theft. At Network Control we constantly play a supporting roleto Electricity's Business Risk section, whether it is identifying cable at the sceneof thefts or reporting cases of cable theft to the SAPS. We will continue to pledgeour commitment to assisting the Business Risk section and the SAPS to reducethe level of theft on the network.
Electricity is the corner stone of economic progress and social development,therefore in the year ahead we will ensure that the level of commitment affordedis second to none. We believe service is a culture and we will strive to implementa service strategy and make it a key factor in Network Control to ensure anacceptable quality of supply and service to our fellow citizens.
CONSTRUCTION PLANNING AND WORKS BRANCHThe year commenced amidst the 2010 World Cup Soccer. The preparations werecomplete and everyone was in the operations mode, ready to respond to unexpectedoutages. The electrical network was configured for maximum reliability, andsupplemented with standby personnel. Apart from a few minor glitches, whichwere timeously resolved, the citizens of eThekwini enjoyed the benefits of a stablenetwork. While wrapping up the World Cup, consideration was given to sustainingthe network performance as a build up for follow-on events like the 123rd OlympicSession and COP 17. Once again, with the impending cuts in capital funding, wemanaged to hold onto our allocation of R191 million, and we managed to spendit. The electricity supply upgrade from 6,600 to 11,000 volts in the Bulff/ Wentworth/Fynnlands and Glenwood areas were completed. The preparation for a similarupgrade in the Umbilo area is in progress, and expected to be completed beforeJanuary 2012. A few more ageing switchboards were replaced, and new installationswere commissioned to provide adequate and reliable supply to new and existingcustomers while ensuring operator safety. The performance of the medium voltagenetwork has improved over the years. Westmead and Springfield areas havecapacity constraints which will be resolved when primary substations in theseareas are commissioned. The islanded supply in the greater Tongaat area wasrerouted and integrated into eThekwini's network via the recentlycommissioned Tongaat 132/11 kV substation.
NETWORK CONTROL BRANCHThe function of the Network Control Branch is to ensure an uninterrupted supplyof electricity to homes, commercial business and industrial companies withineThekwini Municipality's area of supply. There are a number of factors that contributeto outages, such as defective equipment, theft on our electrical network and ofcourse Mother Nature can sometimes be unpredictable. When inclement weatherconditions persist, power outages hit our coastal town hard. On a twenty four (24)hour basis our dedicated team are responsible for maintaining the electrical networkand in the event of a system disruption, we must respond appropriately andpromptly to facilitate the co-ordination of the system and customer load restoration.
For the period under review the following faults were attended to;
Type of Fault Number of incidents
Individual Faults 240625LV Faults 6271MV Faults 4478Total 251374Total incidents of copper theft: 4 047
Our city is host to the 17th United Nations Framework Convention on ClimateChange (COP 17) in November 2011. It is envisaged that more than 5000 delegatesand visitors from across the world booked at various hotels throughout Durbanand we have undertaken measures to ensure stable supply and backup powerto all these hotels in the event of an outage.
At Network Control we realise that our performance directly impacts on the qualityof life to our citizens. In a crisis situation like a power outage every second countsand it pays to have the best that technology can provide, hence in the last financialyear we have made an excellent investment in acquiring the Outage ManagementSystem (OMS). The process of getting an accurate electronic network model isa mammoth task and there is a tremendous amount of configuration to the standardOMS product that is required to suit our business processes and safety regulations.A pilot area has been prepared and a dedicated team of skilled personnel havespent a considerable amount of time configuring and testing the system. Thissystem of computer-based tools and utility procedures will assist to efficiently &effectively become aware of, diagnose & locate outages, incorporate damageassessments into estimated restoration times, prioritize crew restoration activities,improve customer communications for unplanned outages and maintain historicalrecords of statistical indices on electrical outages.
Further attempts for technological improvements towards a smart grid are theinstallation of mini remote terminal units (RTU's) into all of our substations. Thiswill provide valuable information on the state and performance of the distributionnetwork and after successful product testing of the mini RTU, we have began toinstall the units. We are pleased that through perseverance and some elbow grease,
11
at all levels and the staff vacancy levels have significantly reduced. The technicalstaff will however, need to go through a mandatory pre-competency period beforethey are deemed to be fully functional and are able to work independently.
The Branch has seen a significant increase in maintenance expenditure over thepast few years. This figure has increased significantly, especially during the past5 years and is now in excess of R300 million per annum. This increase in expenditurewas mainly due to a considerable focus on fault rectification caused predominantlyby an ageing network, third party damage, theft of infrastructure, vandalism andthe acquisition of external service providers which has resulted in reduced levelsof workmanship. The co-operation of internal staff, consultants and contractorsin delivering an acceptable level of service to our customers is vital in ensuring thatthis Branch meets it objectives.
LIGHTING WORKS BRANCHLighting Works Division is responsible for construction and maintenance of about200 000 streetlights in the whole of the eThekwini Municipality area of supply. Thedivision is constantly experiencing increasing volumes of complaints relating totheft of the lighting infrastructure since 2010 and beyond. And the replacementcost to council is also increasing at the same rate.
The division had a turnaround since the beginning of 2011 in terms of incidents/accidents from a 1 star to a 5 star which was due to the help received fromSHERQ & Training Branch in ensuring the effectiveness of the safety awarenesscampaign in line with the safety standards as laid out by the municipality. Thedivision strived to maintain an above 70% turnaround time on faults/complaintsreceived and attended to within 5 working days. The division awarded competenciesto eight newly appointed electricians which is in line with improving service delivery.
Management would like to thank all staff in the division for their loyalty and dedicationin keeping the lights burning during the challenging times.
LIGHTING PLANNING BRANCHThe Lighting Planning Branch is responsible for the planning, design, inspectionand maintenance of the public lighting infrastructure for the eThekwini Municipality,including the planning and design of new lighting installations, upgrading of existinglighting infrastructure, research and investigation into new lighting technologiesand bulk lamp replacements.
The Department of Energy's grant of R35m, topped up with eThekwini Electricity'sfunding, saw another 12,615 dwellings electrified, with prepaid meters, under theElectrification program. Another 60,000 people can now look forward to an improvedquality of life. 2,830 non-prepaid supplies were provided to other residential,industrial and commercial developments within the eThekwini municipal area.Upgrades to major roads necessitate the relocation of electrical services. This yearOld Main Road in Hillcrest and the Umgeni/N2 interchange in Springfield kept thecrews busy.
We had little success in filling vacant positions in the Planning and ConstructionBranch, mainly due to the focus given to the Maintenance and Lighting Branches.Positions still vacant include Electricians, Planning Officers, Technicians and ChiefEngineers and the Construction Manager. The Branch is supplemented withConsultants for the processing of applications for new connections and projectmanagement of electrification service installations. Contractors complement ourstaff in installing reticulation infrastructure and connecting new services. The effortsof all staff and agents, acting on our behalf, are greatly appreciated.
MAINTENANCE BRANCHThe Maintenance Planning and Works Branch is responsible for the inspection,maintenance planning, maintenance implementation and repair of medium andlow voltage faults on the electrical distribution network within the municipal supplyarea. This Branch comprises of six regional works depots and a MaintenancePlanning Division based at the Electricity Headquarters. The Branch consists ofa Senior Manager, 7 Managers, Engineers, Technicians, Electricians and the variouslevels of administration and assistant staff.
The maintenance of eThekwini Electricity's distribution network is vital in ensuringthe integrity and reliability of supply to our large customer base. This Branch pridesitself on high standards and strives to comply with various national standards andthe Power Quality Charter in order to meet the requirements of customers. Themajor challenge facing the Branch is the growing pandemic of theft of electricalinfrastructure. The growing global need for non ferrous metals such as copper hasresulted in high volumes of theft of electrical infrastructure both locally and abroad.The net result for this Branch is that it theft has significantly increased the workload,maintenance budgets had to be increased, supply restoration times have increasedand the integrity of the electrical network becomes compromised. The ElectricityUnit is however investigating various methods of monitoring and dealing with thescourge of theft.
Rapid growth of the electrical network coupled with the shortage in human resourcesand an increase in failures, has resulted in significant backlogs of planned andpreventative maintenance work. The Branch has undertaken an aggressiverecruitment drive, during the year under review to bolster its internal resources andreduce the reliance on external service providers. Various appointments were made12

The Lighting Planning Branch is also responsible for the planning, designing,installationand testing of capital projects. Projects were planned for major route improvements,new major routes, lighting of parks, stadium lighting, beachfront lighting, CBDlighting, cemetery lighting and sundry lighting. Major projects for the current andfuture financial years include; Umgeni Road/N2 Interchange, Mpumulanga Township,MR 577 (Kwadabeka), Snell Parade, Umhlanga Promenade, Umdloti Beach Road,Old Main Road (Hillcrest) and Inanda Road (Waterfall). Lighting projects that werecoordinated by the Strategic Projects Unit for the 2010 Soccer World Cup havebeen taken over by the Electricity Unit.These include most of the priority routesin the Durban CBD, routes in the vicinity of soccer stadiums and training venuesused for the world cup.
The Branch operates on an annual budget of approximately 20 million rands, takinginto account salaries, allowances, general expenses, repairs and maintenance.Repairs and maintenance accounts for 80 percent of this operating budget andthis further broken down into beachfront painting, electrical streetlighting and polepainting. There are currently approximately 200 000 streetlight installations,49 cemeteries, 242 parks, 12 beaches, 17 subway lanes, 31 swimming pools and93 stadiums and sports fields that the municipality is responsible and provideslighting for.
With the national electricity crisis in recent years and the ever-increasing emphasison energy efficiency, the Lighting Planning Branch has dedicated itself to researchand investigation into new lighting technologies. Technology such as LED (LightEmitting Diode) lighting is being hailed as the future of lighting and is becomingincreasingly present in our environment. A pilot project was set up on MasabalalaYengwa Avenue (previously NMR Avenue), testing and evaluating LEDs from arange of manufacturers at different heights.
This project was successful and proved that LEDs are a feasible new form oftechnology despite being more expensive than conventional lighting. The Branchhas recently achieved an acceptable staff compliment and we now aim to workon building their skills and experience within the Division. Our long-term goals areto initiate complete audits of all public lighting systems and undertake the necessaryupgrades and improvements thereof.
The Lighting Planning Branch is responsible for the planning and design of capitalprojects. The annual capital budget was reduced to R10.7 million and projectswere planned for major route improvements, new major routes, lighting of parks,beachfront lighting, CBD lighting and sundry lighting. Major projects for the currentand future financial years include; Umgeni Road/N2 Interchange, completion ofMR 577 (Kwadebeka), Snell Parade promenade, M4 Ruth First Highway, Old MainRoad Hillcrest, Inanda Road (Waterfall) and floodlighting for ablution facilities ininformal settlements.
The Branch operates on an annual budget of approximately 20 million rands, takinginto account salaries, allowances, general expenses, repairs and maintenance.Repairs and maintenance accounts for 80 percent of this operating budget andthis is further broken down into planned maintenance, bulk lamp replacement andpole painting. There are currently approximately 180 000 streetlight installations,49 cemeteries, 242 parks, 12 beaches, 17 subway lanes, 31 swimming pools and93 stadia and sports fields for which the municipality is responsible and provideslighting for.
Many of our projects involve the interaction with other service units and externalentities such as Roads Provision, Architectural Department, Parks, Leisure& Cemeteries, Roads and Stormwater, Strategic Projects and Tongaat Huletts.We plan and design special lighting projects for these units.
With the national electricity crisis in recent years and the ever-increasing emphasison energy efficiency, the Lighting Planning Branch has dedicated itself to researchand investigation into new lighting technologies. Technology such as LED (LightEmitting Diode) lighting is being hailed as the future of lighting and is becomingincreasingly present in our environment. A pilot project was undertaken throughoutthe city in various suburbs. Consumers have shown an appreciation of this “new”white light.
In addition to LED lighting from various suppliers, the Lighting Planning Branch ispresently testing 50w hps, 50w metal halide, 57w CFL and induction streetlights.
With the COP 17 Convention on Climate Change on our doorstep, the LightingPlanning Branch have engaged with Philips Lighting SA through the Energy Officeand Eskom, to install low energy LED streetlighting around the InternationalConvention Centre. Grant funding of R4m was received from EEDSM for theinstallation of LED streetlights to replace the 80w mercury lamps in residentialareas.
13
TECHNICAL SUPPORT
Senior Manager: Communication Networks Manager: Electrical Workshops
Manager: Mechanical Workshops
Manager: Sherq & Training
Executive Secretary
Senior Manager: Protection & Test Senior Manager: Technology Services
Manager: Drawing Office
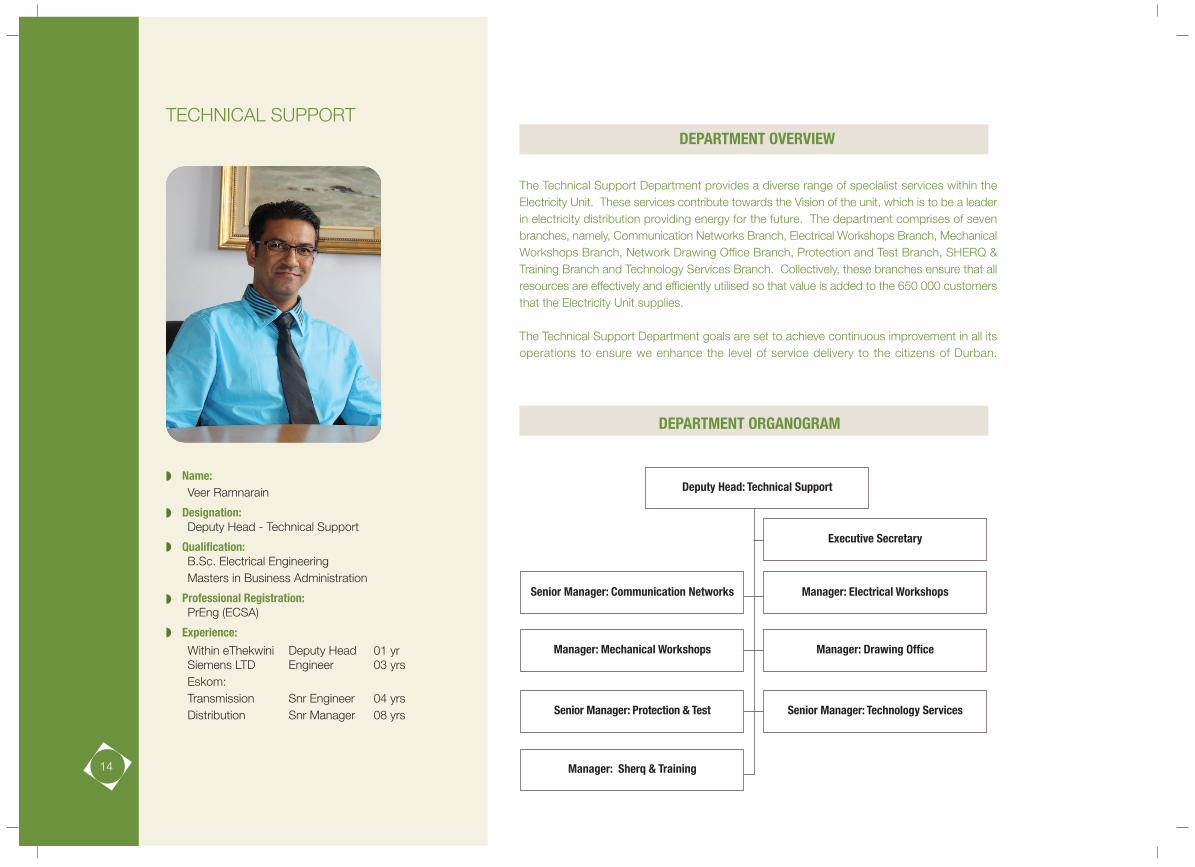
Deputy Head: Technical SupportName:Veer Ramnarain
Designation:Deputy Head - Technical Support
Qualification:B.Sc. Electrical EngineeringMasters in Business Administration
Professional Registration:PrEng (ECSA)
Experience:
Within eThekwini Deputy Head 01 yrSiemens LTD Engineer 03 yrsEskom:Transmission Snr Engineer 04 yrsDistribution Snr Manager 08 yrs
�
�
�
�
�
The Technical Support Department provides a diverse range of specialist services within theElectricity Unit. These services contribute towards the Vision of the unit, which is to be a leaderin electricity distribution providing energy for the future. The department comprises of sevenbranches, namely, Communication Networks Branch, Electrical Workshops Branch, MechanicalWorkshops Branch, Network Drawing Office Branch, Protection and Test Branch, SHERQ &Training Branch and Technology Services Branch. Collectively, these branches ensure that allresources are effectively and efficiently utilised so that value is added to the 650 000 customersthat the Electricity Unit supplies.
The Technical Support Department goals are set to achieve continuous improvement in all itsoperations to ensure we enhance the level of service delivery to the citizens of Durban.
DEPARTMENT OVERVIEW
DEPARTMENT ORGANOGRAM
14

� The successful installation and commissioning of 120 low power consumptionGPRS modems for all HV cable oil gauge alarm installations in the was a significant achievement as it by-passed the old and faulty pilot cables that prevented critical alarms getting back to Control.
� The installation and commissioning of a further 22 access multiplexers at HV substations ie. the final phase of the overall access multiplexer up-grade program which increased the link data rate capabilities from 8 to 155MB/sec(STM1) to accommodate increasing technical service demands.
� Completion of the installation and commissioning of the 6 planned Dense WaveDivision Multiplexers (DWDM) at critical major substation on the northern ringof the fibre optic network at which new fibre panels had been installed therebyexpanding the core channel count from one to eight for various vital technicalsystems and other services ie. Protection Schemes, Supervisory Control andData Acquisition (SCADA), Quality of Supply monitoring, Security Systems, Access Control, Substation Camera Surveillance, Smart Grid systems, IT andCity links.
� The successful acquisition, installation and commissioning of a new Voice overInternet Protocol (VOIP) PABX system which will provide clear digital quality voice communications via Electricity's extensive fibre optic network and the Wide Area Network that exists between Transmission Substations, the ControlCentre, Head Quarters and Regional Depots.
� The complete planning, acquisition, configuration, installation and commissioningof 52 x 1GByte optical port ruggedised switches with routing capabilities at major Wide Area Network (WAN) nodes including transmission substations, regional depots and the Control Centre thereby providing a significant increasein the available data throughput for present and future systems utilising InternetProtocol (IP) communications.
� The installation of termination and communication equipment at 2 new transmission and 16 new distributor Integrated Control and Protection (ICAP)substations and the commissioning of all required technical services via the fibre optic network and cellular radio networks respectively way before scheduleddeadlines.
� The re-instatement of services utilising the various communication networks within an average of 3.3 hours of fault notification was impressive consideringthe complexity and extent of the networks.
Major Projects for the 2011_12 year� Fibre Panel Up-grading: In Phase 3, a further 12 dust proof panels will be
installed in transmission� Access Multiplexer Up-grading: Phase 3 of the project is to install and commission
a further 9 multiplexers at HV substations� New Access Multiplexer Cards: Phase 1, entails the planning, installation and
commissioning of 20 Ether1 and 8 Sin4E cards into the fibre system� New DWDM Multiplexers: In Phase 3, 6 further fibre network nodes will be
equipped with multi-channel/wavelength
COMMUNICATION NETWORKS BRANCHThe Communication Network Branch is responsible for the fibre, radio/wireless,technical data, copper pilot and other medium communication networks thatprovide vital communication links for all technical systems/equipment that monitor,control and protect all electrical plant and equipment in the HV transmission andMV distribution networks from which all customers are supplied. It also providesfibre communication cores/data channels for the City and other departments withinElectricity.
The aim of this Branch is to investigate, plan, implement, maintain and repair therequired communication networks that ultimately enhance the security and qualityof electricity supply in the most effective manner and provide other users withcommunication links for the effective operation of their non-technical systems.
Key Deliverables� Timeous planning, installation, termination and commissioning of new fibre,
data, radio and copper pilot communication network links for new substations/other sites
� Timeous acquisition, installation and commissioning of customised dust proofequipment/termination panels, ruggedised carrier class DWDM and SDH accessmultiplexers, optical switches/routers/media converters, GPRS cellular radio modems, Voice over Internet Protocol (VOIP) adaptors, Etherpads/protocol converters and, electronic alarm boards at substations/other sites
� Protection, Security/Access Control, Telephone, IT and City systems by set deadlines.
� Timeous location and repair of all communication link and system equipmentfailures
� Timeous maintenance and repair of all communication links and system equipment
Highlights / Lowlights for the 2010_11 year� The increase in the technical staff complement enabled the Branch to investigate,
design, acquire, install and maintain in-house communication systems.� Final completion of the new Communication Networks Control Room equipped
with state of the art high definition video wall and control desk allowing the in-depth monitoring and configuration of all technical communication systems/equipment throughout the electricity supply area
� Completion of the installation and commissioning of a KVM (Keyboard Video Mouse) Display System in the new Communication Networks Control Room and the various Operational Workshops thereby allowing all networks in the supply area to be remotely monitored and configured from multiple locations.
� The completion of the roll-out of the GPRS cellular radio system to all 719 commissioned MV distributor substations thus allowing the control and monitoring of substation plant and equipment at these substations from the central Control Centre.
15
Key deliverablesTransformer Division� Acceptance testing on all new equipment purchased, ie. minisubstations,
transformers and ring main panels� Repair and overhaul transformers and minisubstations in the workshop and
on site.
Switchgear Division� Acceptance testing on new equipment purchased, ie. auto reclosers,
sectionalisers, ring main panels and motors� Repair and overhaul of auto reclosers, sectionalisers, ring main panels and
motors in the workshop and on site.
Oil Processing Division� To provide MV/LV Operations and HV Operations with regenerated transformer
oil.� Ensures the effective management of the processing, storage and issuing of
regenerated transformer oil
Reclamation Division� To provide all departments in eThekwini Electricity a portal to dispose all scrap
and unutilised electrical mains and apparatus� Timeous disposal of cables which have returned from site due to failure and
development.
Major projects for the 2011_12 year� Installation and commissiong of new test facility with computer based storage
of test results and information and share it with relevant personnel.� Installation and commisioning of new oil regeneration plant and automated oil
processing equipment
Key Challenges� Recruitment of sufficiently experienced staff to meet Branch's goals ie. Oil
Regen Plant Operator and Chemical Technician.� Disposal of scrap transformers and switchgear
� Data Switch, Router, Media Converter Up-grading: Phase 3, entails up-gradinglegacy equipment at 5 new HV substations
� Layer 3 Routing Software implementation on newly installed ruggedised switches: Phase 1, entails the installation, testing and commissioning of acquired routing software on 30 new 1GB optical port
� LAN Interface components to incorporate ABB Switches in GE Substation LAN Backbone: Phase 1, entails the acquisition, installation and commissioning
of suitable interface components for 15 major substations� Equipment Power Supply Up-grading: In Phase 2, the remaining 10 problematic
legacy communication equipment power supplies will be replaced at HV substations
� GPRS Radio System: In Phase 3, programming and implementation of GIS in-station software modifications
� New Disaster Recovery Centre, Westville: Planning and installation of dual 24csingle mode fibre optic cable links from the existing fibre network nodes at Blair Athol Major and Mayville Major
� Voice over IP (VOIP) PABX/Telephone System: In Phase 2, entails installing 45 'digital to analogue' adaptor units at transmission substations� Overall Technical WAN Management System: Phase 1, entails the investigation,
acquisition and installation of a more sophisticated and modern managementsystem that will replace/embracement all existing management systems
� Authentication Security System for the WAN/LAN Networks: Phase 1, entailsthe investigation, acquisition and installation of the system on existing technical
data network ports in substations, depots and Control Centre� Overall Notification System for all Communication Management Systems: Phase
1, entails the acquisition of a suitable notification system for management system problems/faults
� Overall Smart Grid Communication System: Phase 1, entails the investigation, compilation and issue of a Request for Information for a suitable system
Key challengesRecruitment and retention of scarce skills in the Communication Networks thatare required to maintain and operate the critical technical systems.
ELECTRICAL WORKSHOPS BRANCHThis Branch was established to make sure that all equipment received from themanufacturers are tested prior to installation into the Electricity Network. It hasbeen responsible for repairing those which have failed. This Branch is also responsibleto supply other departments with mineral oils which are utilized as coolant mediumin the transformers, autoreclosers, etc. The aim and objective of the Branch is toprovide specialist electrical support services to the Electricity Unit, & other Unitswithin eThekwini Municipality.
16

� To provide regular training to all staff on hardware and software utilised in theSurvey Section.
� To ensure that the Survey Section works in a safe environment.� To ensure that the Electricity Units assets are always positioned in the proper
road reserves and servitudes, by placing beacons to indicate registered boundarylines.
� To provide a cable tracing service to the Unit.
GIS Section� To provide the latest GIS technology to the various Departments within the
Electricity Unit.� To provide GIS data with minimal interruption to the Electricity Unit and external
customers.� To ensure GIS data integrity.� To market the ArcGIS Server and provide GIS software support to the Network
Drawing Office and the Electricity Unit.
Network Records Section� To integrate with the current and future business processes, to ensure that
changes made to the electrical network, are updated timeously in the GIS.� To provide accurate electrical records from all available source documents.� To provide a support service to various Planning and Maintenance Sections
within the Electricity Unit.� To provide a resident Draughtsperson at satellite Drawing Offices in Depots.� To provide in-house training in all aspects of draughting and operating in a GIS
environment.
Utility Plans Section� To respond to all correspondence by indicating the spatial location of the Units
assets, within three days.� To train a minimum of two Draughtspersons per annum to competently respond
to correspondence.� To collect asset data from the field when required.� To roster standby staff for after hours cable fault location.
Highlights / Lowlights for the 2010_11 year� The replacement of the monochrome plan printer and scanner will ensure
that a more reliable printing and scanning service is delivered to the Unit.� The appointment of eight Draughting staff has resulted in all Depots being
staff with Depot Draughtspersons.� The high demand for training from Technical Staff of MV/LV Operations and
the Customer Services Departments on the ArcGIS Server, indicates that thisWeb Application is being used on a daily basis to assist the business.
MECHANICAL WORKSHOPS BRANCHMechanical Workshops Branch provides a specialist mechanical support servicesto Electricity unit, other units within the municipality and external customers. TheBranch is involved with a wide range of repetitive fabrication and maintenance,and also a diversity of mechanical tasks that change on a daily as per requirementsof our customers. The aim of the Branch is to provide specialist mechanical supportservices to the Electricity Unit, & other Units within the Municipality.
Key DeliverablesThe work functions include:� Work Programming Division - costing, planning, design, research & purchasing.� Fitting, Machine & Rigging - manufacturing of galvanized equipment, repairs
to fibreglass ladders, maintenance & fabrication of electrical equipment, installation of support structures, rigging services & safety inspections.
� Welding Workshop - production work, maintenance, manufacturing & repair of electrical infrastructural equipment & component fabrication.
Highlights / Lowlights for the 2010_11 year� Achievement of ISO9001 accreditation within a record of seven months.� Publication of safety operating procedures (SOP) for all Mechanical workshops.� Calibration on all measuring equipment and solid tests weights.� New machinery / tooling for pre-payment meters acquired.
NETWORK DRAWING OFFICE AND SURVEY BRANCHThe Network Drawing Office and Survey Branch comprises of six divisions, namelyAdministration, Network Records, Geographic Information Systems (GIS), SpecialProjects, Utility Plans and Survey. The need for accurate spatially located Electricalassets and an efficient GIS is essential to support the many other enterprisesystems within the Electricity Unit.
Key DeliverablesAdmin Section� To provide an administrative service to the Network Drawing Office.� To provide a printing and scanning service to the Network Drawing Office and
the Electricity Unit.
Special projects section� To produce and maintain a database of LV circuit diagrams for the Electricity
Unit.� To provide specialised drawings and illustrations of equipment for procurement.
Survey Section� To deliver accurate, updated information, timeously and keep abreast with the
latest technology available in the Survey industry. 17
� The effective maintenance and repair of all dc systems in the electrical network.� The effective scheduling and record management of the above mentioned
testing and maintenance work.� The effective defining, updating and implementation of standards and procedures
with regards to protection and dc systems.� The effective calculation and application of optimised protection settings to
ensure proper discrimination.� The effective updating and maintaining of the network model to ensure reliability
of network studies.� The effective updating, maintaining and controlling of protection drawings� The effective and timeously investigation of protection and dc related mal-
operations.
Highlights / Lowlights for the 2010_11 year� Successful commissioning of a number of new HV substations, including
Shallcross, Gateway, La Mercy, Tongaat, and Avoca, as well as successful commissioning of 67 MV reticulation feeders.
� The P&T IEC61850 laboratory was completed and is currently operational. Thelab will be used to initiate key projects with other supporting technical divisions such as Communications and SCADA to improve skills and trainingfor IEC61850 substations.
� P&T initiated intense training programs to increase skill and competency levelsof newly appointed staff.
� P&T staff complement was severely impacted with the loss of key experiencedstaff members to both internal and external job opportunities.
� Attempted cable theft caused several protection mal-operations including a serious HV fault that affected the entire central supply grid and major HV key customers.
Major Projects in the 2011_12 year� Protection setting, testing and commissioning of numerous transmission
substations, including Randles 132/11kV S/S, Mondi 132/33kV S/S, Ridgeside132/11kV S/S and Kingsburgh 132/11kV S/S.
� Protection setting, testing and commissioning of additional switchgear and equipment in existing transmission substations, including Plangweni S/S, Fynnlands S/S, Klaarwater S/S, Phoenix North S/S, Springfield S/S and CongellaS/S.
� Standardisation of the relay configuration of all the REF 615 range relays in our system.
� Upgrading of battery charger units at various transmission substations and distributor substations.
� Upgrading of the differential protection scheme between Engen Tara 2 and Himalayas Road substations.
� Commissioning of new capacitor banks at Durban North and Klaarwater substations.
� Approximately 280 000 source documents have been converted to electronicformat and is accessible to all staff in the Unit.
Major Projects for the 2011_12 year� To provide LV Circuit Diagrams electronically via a Web browser to all staff
within the Electricity Unit.� Updating of all Codes of Practise drawings for the Technology Services
Division.� Provide survey information for the 132kV cable route from Randles Major to
Alpine Road, 132kV cable route from Gateway Major to Ridgeside Major, Inkanyezi Housing Project and Inanda/Amoti Cuba MV/LV Construction andthe Hammonds Farm Housing Project.
� To align the work processes in the Survey Division to the GIS, this will ensurethat survey work done on site integrates with the GIS.
� To integrate the GIS data with the Master Data Change process.� To introduce topology rules to the GIS data and build a geometric network.� To change work process to accommodate the data from the Master Data
Change process in the GIS.� To introduce an electronic, wayleave submission and approval application
process.
Key challenges� Educate local communities via Councillors, so that they understand the role
and activities of the Survey staff.� Integration of the existing GIS data to the proposed Network data model of
the Master Data Change Process.� Establishing processes to ensure the data from the Master Data Change
process is constantly updated in the GIS.
PROTECTION AND TEST BRANCHThis Branch is responsible for the forward planning, analysis, design, up-dating,testing, auditing, maintenance and repair of all protection and dc systems in theelectrical network.
Key Deliverables� The effective planning, designing and configuration of protection schemes to
ensure adequate security and safety to equipment, personnel and environment.� The effective testing and commissioning of substation installations, protection
systems and equipment.� To provide effective fault location and various acceptance testing services
within the Electricity Service Unit.� The effective maintenance and repair of protection equipment in the eThekwini
electrical network.18
� Introduction of Type 3 and Type 4 connectors for cable terminations within switchgear.
� Purchase and testing of two amorphous type distribution transformers. The aim is to quantify the benefit of these low loss transformers.
� Investigate innovative ways of restricting unauthorised access to distributor substations.
Key challenges� Training for new equipment: currently there is a lack of training offered to field
staff when new equipment is introduced.� Obtaining suitable candidates for the post of Standards Officers.
SHERQ & TRAINING BRANCHOperations Safety Branch is responsible for the design, implementation andmonitoring of systems to ensure compliance with the Occupational Health andSafety Act and associated Regulations throughout the Electricity Unit. This includesmonitoring of health services, risk assessments, safety audits, environmental audits,provision of standby personnel, and operational training/competency accreditationof all persons engaged in construction and maintenance, investigation intomachinery-related incidents, and the introduction of measures to prevent recurrences.
Key Deliverables
SafetyThis division has employed 5 Safety Officers and these are allocated to eachDeputy Head to ensure compliance within their GMR 2.1 responsibilities. TheSafety Officers assist +/- 50 Line Managers to comply with:� Town Clerk Chapter 25� Construction Regulations� Codes of Practice� Accident investigation (Root cause analysis)
TrainingThe 12 System Operations Senior Training Officers and 4 Technical Training officerswill conduct more research in the technology and training field. The Service Unitis obligated to deploy competent, committed and suitably qualified staff to operateon and affect suitable maintenance on electrical assets on our Network, and thisrequires a high level of training.
Technical Training involves the transfer of critical skills to staff thus ensuring anacceptable level of quality with regards to workmanship. Installation and maintenanceof equipment needs to be conducted in accordance with specifications and codesof practices as laid out by Original Equipment Manufacturers and the ElectricityDepartment. It is a well known fact that equipment reliability is greatly increased whenit is correctly assembled; installed and effective maintenance practices are implemented.
Key challenges� Recruiting and retaining specialised technical staff� Keeping abreast with new technology
TECHNOLOGY SERVICES BRANCHOne of the functions of the Branch is research into cost effective ways of distributingelectricity. This function can be divided into two, namely, the cost of goodspurchased and the costs associated with the installation, operation, maintenanceand disposal of the said goods. Over and above the issues relating to constructionand maintenance, safety of staff and public is high on the agenda both duringthe selection of a particular type of good and during its application. TechnologyServices has as its primary goals the adjudication of all tenders for technicalequipment, material and services supplied to the Service Unit, and the creationand maintenance of all technical codes of practice and instructions used byeThekwini Electricity staff and contractors.
Key DeliverablesThe Branch has continued its active participation in NRS projects as well asparticipating in SANS working groups where, in conjunction with work groupmembers from other municipalities, Eskom, mines and major suppliers, specificationsand guidelines have been prepared to promote uniform requirements for equipmentand design methods for use in distribution systems.
Highlights / Lowlights for the 2010_11 year� A pilot project for providing solar-powered lighting to ablution blocks in informal
settlements was successfully implemented. The intention is to roll-out to moreareas that are inaccessible to the grid.
� The Codes of Practice have now been published on Novell Vibe (Teaming) thus making them more accessible to all staff.
� Successful implementation of fixed-pattern switchgear to replace older switchgear.
Major Projects for 2011_12 year� Improved methods of fault identification of overhead networks: A project will
be piloted to test the application of through-fault indicators on the MV overheadnetwork.
� Revising and updating the Codes of Practices. The intention of this project is to update the CoPs with indexing which will make it more user-friendly.
� Pilot a project to determine the feasibility of utilising of LED luminaires on thestreet lighting network.
� Formation of an Oil working group and purchase of Oil regeneration plant toensure good quality of oil is utilised in equipment.
� Research project on corrosive sulphurs and its impact on transformers, together with Doble SA and University of Kwazulu-Natal. 19

System Operations Training provides staff with important knowledge to operateelectrical equipment safely. Any deviation from accepted operational proceduresgenerally leads to dire consequences such as damage to equipment, injury tostaff and in some cases, fatalities. Staff undergo intensive training on SafetyProcedures as exposure to medium and high voltage equipment is frequent inthe Electricity Unit. Most work cannot be carried out whilst equipment is live. Tothis end, certain guidelines and distinctive procedures need to be implementedand adhered to.
ICT TrainingA new Branch for Information Technology Training has been established. ThisBranch plans to appoint 8 ICT trainers. A close relationship will be built with theIT staff to ensure identification of shortfalls in IT competency of existing staff, andthis will be addressed when the trainers are appointed.
Highlights / Lowlights for the 2010_11 yearSHERQ & Training branch was instrumental in addressing the severe skills shortageswithin the Unit. To this end the following was achieved since 2008:� Reducing Engineer vacancies from 65% to 42% of 65 posts� Reducing Technician vacancies from 71% to 45% of 145 posts� Reducing Electrician vacancies from 72% to 36% of 331 posts� The appointment of 5 additional Senior Training Officers.� Training of 148 contractors in various technical courses.
Major Projects for 2011_12� Establish Science Expo centre� Touch Screen Simulator for relay training.� Introducing ISO accreditations
Key Challenges� Introduction of a database for all internal and external training records.� Training adequate resources in the next 3-5 years is our main challenge and
to this end the envisaged programme is to employ trainees every 6 months as follows:Apprentices (Electrical) - 20 every 6 months (Approved 100)Apprentices (Mechanical) - 2 per annum (Approved 6)Technician in Training - 10 every 6 months (Approved 40)Candidate Engineers - 5 per annum (Approved 30)Bursary Students - at least 5 in each year of study
20

DEPARTMENT OVERVIEW
DEPARTMENT ORGANOGRAM
Deputy Head: Customer & Retail Services
Senior Manager: Pricing & Marketing Manager: Customer Services
Senior Manager: Revenue Protection Manager: Meter Engineering
Manager: Contact Centre
Executive Secretary
The Customer & Retail Services Department provides a customer contact and retail servicesfunction for the Electricity Unit.
The Customer & Retail Services Department consists of more than 400 employees and performsa diverse range of functions for the Electricity Unit including:
� Accurate metering of electricity consumption� Designing of fair and cost-reflective electricity tariffs� Providing the services of a Contact Centre for reporting power outages, street light faults
and the theft of equipment and electricity by telephone, e-mail and fax� Assists with the protection of the city’s revenue� Provides four Customer Service Centres throughout the city.
Name:Sewraj Harilal
Designation:Deputy Head - Customer & Retail Services
Qualification:Certificated Engineer (GCC)Post Graduate diploma in Business AdministrationNational Teachers Diploma (Technical)
Experience:
Within eThekwini 14 yrsTongaat Town - Engineer 06 yrs Lecturer/Senior Lecturer 08 yrsElectrician/Technician 08 yrs
�
�
�
�
CUSTOMER AND RETAIL SERVICES
21
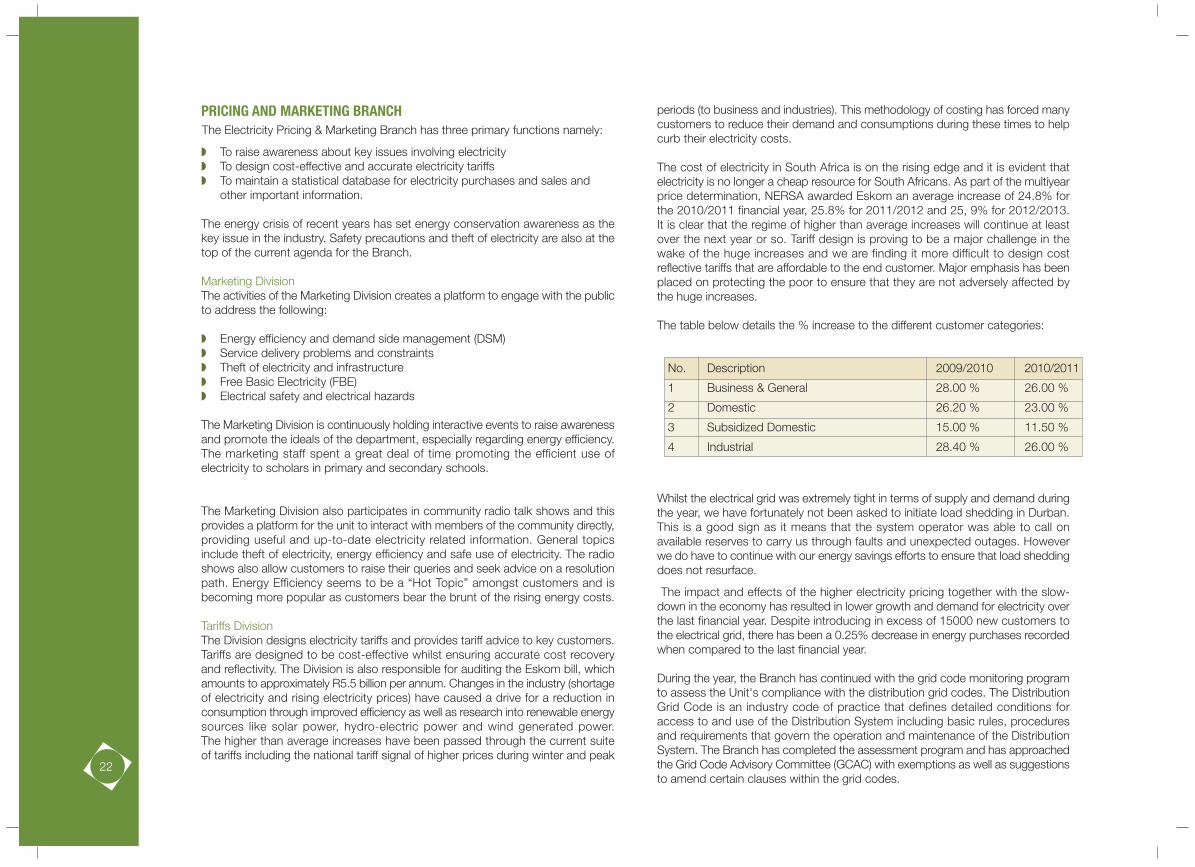
periods (to business and industries). This methodology of costing has forced manycustomers to reduce their demand and consumptions during these times to helpcurb their electricity costs.
The cost of electricity in South Africa is on the rising edge and it is evident thatelectricity is no longer a cheap resource for South Africans. As part of the multiyearprice determination, NERSA awarded Eskom an average increase of 24.8% forthe 2010/2011 financial year, 25.8% for 2011/2012 and 25, 9% for 2012/2013.It is clear that the regime of higher than average increases will continue at leastover the next year or so. Tariff design is proving to be a major challenge in thewake of the huge increases and we are finding it more difficult to design costreflective tariffs that are affordable to the end customer. Major emphasis has beenplaced on protecting the poor to ensure that they are not adversely affected bythe huge increases.
The table below details the % increase to the different customer categories:
Whilst the electrical grid was extremely tight in terms of supply and demand duringthe year, we have fortunately not been asked to initiate load shedding in Durban.This is a good sign as it means that the system operator was able to call onavailable reserves to carry us through faults and unexpected outages. Howeverwe do have to continue with our energy savings efforts to ensure that load sheddingdoes not resurface.
The impact and effects of the higher electricity pricing together with the slow-down in the economy has resulted in lower growth and demand for electricity overthe last financial year. Despite introducing in excess of 15000 new customers tothe electrical grid, there has been a 0.25% decrease in energy purchases recordedwhen compared to the last financial year.
During the year, the Branch has continued with the grid code monitoring programto assess the Unit's compliance with the distribution grid codes. The DistributionGrid Code is an industry code of practice that defines detailed conditions foraccess to and use of the Distribution System including basic rules, proceduresand requirements that govern the operation and maintenance of the DistributionSystem. The Branch has completed the assessment program and has approachedthe Grid Code Advisory Committee (GCAC) with exemptions as well as suggestionsto amend certain clauses within the grid codes.
PRICING AND MARKETING BRANCHThe Electricity Pricing & Marketing Branch has three primary functions namely:
� To raise awareness about key issues involving electricity� To design cost-effective and accurate electricity tariffs� To maintain a statistical database for electricity purchases and sales and
other important information.
The energy crisis of recent years has set energy conservation awareness as thekey issue in the industry. Safety precautions and theft of electricity are also at thetop of the current agenda for the Branch.
Marketing DivisionThe activities of the Marketing Division creates a platform to engage with the publicto address the following:
� Energy efficiency and demand side management (DSM)� Service delivery problems and constraints� Theft of electricity and infrastructure� Free Basic Electricity (FBE)� Electrical safety and electrical hazards
The Marketing Division is continuously holding interactive events to raise awarenessand promote the ideals of the department, especially regarding energy efficiency.The marketing staff spent a great deal of time promoting the efficient use ofelectricity to scholars in primary and secondary schools.
The Marketing Division also participates in community radio talk shows and thisprovides a platform for the unit to interact with members of the community directly,providing useful and up-to-date electricity related information. General topicsinclude theft of electricity, energy efficiency and safe use of electricity. The radioshows also allow customers to raise their queries and seek advice on a resolutionpath. Energy Efficiency seems to be a “Hot Topic” amongst customers and isbecoming more popular as customers bear the brunt of the rising energy costs.
Tariffs DivisionThe Division designs electricity tariffs and provides tariff advice to key customers.Tariffs are designed to be cost-effective whilst ensuring accurate cost recoveryand reflectivity. The Division is also responsible for auditing the Eskom bill, whichamounts to approximately R5.5 billion per annum. Changes in the industry (shortageof electricity and rising electricity prices) have caused a drive for a reduction inconsumption through improved efficiency as well as research into renewable energysources like solar power, hydro-electric power and wind generated power.The higher than average increases have been passed through the current suiteof tariffs including the national tariff signal of higher prices during winter and peak
No. Description 2009/2010 2010/2011
1 Business & General 28.00 % 26.00 %
2 Domestic 26.20 % 23.00 %
3 Subsidized Domestic 15.00 % 11.50 %
4 Industrial 28.40 % 26.00 %
22

REVENUE PROTECTION BRANCHThe Revenue Protection Branch ensures that non technical energy losses on thedistribution network are kept to a minimum by effectively disconnecting consumerswho are in arrears, combating illegal connections and swiftly reconnecting customersthat have settled their account.
Disconnections and Reconnections
Over the past few years, we have seen a steady increase in the total number ofcustomers disconnected. For this financial year, the total number of disconnectionsand reconnections carried out was 218 861. This figure has increased by 11 388when compared to the last financial year.
The Branch is in the process of carrying out a pilot project which uses an advancedform of paper less tracking (using a highly evolved digital pen and hand held device)to track the activities of disconnectors and to transfer the data from the field tothe office instantaneously. This project will go a long way in assisting theBranch in managing and auditing work carried out by contractors.
Sweep Project (Residential)
Due to the huge tariff increases over the past few years, customers are moretempted to tamper with their electricity supply. As a result, it has become crucialto enhance revenue protection measures to ensure early detection of tampering.Appointed contractors are required to carry out inspections of dwellings in designatedareas to identify tampered/faulty prepaid electricity meters and/or illegal metersand to record the GPS co-ordinates of each connection.The findings of the contractors are reported to the Branch, who would thendetermine the appropriate follow up action. EThekwini municipality has an integratedsystem in place that: -
� Provides a work management program to execute all remedial field operationsresulting from the initial field survey.
� Consolidate updated records with relevant findings and spatial coordinates into the back end MIMMS-Ellipse central data system.
� Have effective business intelligence and regular reporting to highlight trends, impact of operations and view on all key performance indicators.
EThekwini Municipality has appointed Consultants to project manage and supervisethe inspection, reporting, disconnection and reconnection of electrical services ineThekwini Electricity’s area of supply.
Meter Inspection
The verification of measurement and metering equipment of eThekwini Electricity’sBusiness & General customers continued with greater speed this year. The findings(Circuit faults) obtained are analysed and the back-charges raised on customer’saccounts accordingly. “'d2Circuit faults “'d2 in the meter installation means thatthere is a fault that affects the correct functioning of the meters, but does not affect
the supply to the customer. Typically, the following circuit faults are common findingin the field: Incorrect Wiring / Connections.
We are in the process of establishing a Metering Inspection section to ensure thatthe co-ordination and specific functions relating to electrical metering within theElectricity Department is performed to ensure optimal electrical operation ofmeters and enhanced quality of measurement thus minimizing errors.
Vandal Proof Metering Kiosk (Protective Structures) Project
The project entails installation of protective enclosures to conform to the requiredsafety standards, to prohibit the theft of electricity due to illegal connections andconsequently improve revenue collection in the areas affected.
The municipality’s objectives of pursuing the delivery of a tamper-proof meteringsystem and services includes but are not restricted to:
� Zero tolerance approach to theft and illegal connections.� Delivering an effective and sustainable service.� Ensuring affordable provision of services.� Catering for the needs of local communities.
Illegal Connections ProjectThe inspection, disconnection and removal of reported illegal services in areas withhigh volumes of illegal connections continued, namely, Cato Manor, Clare Estate,Reservoir Hills, Kenville, KwaMashu (Siyanda), Tongaat, Isipingo, Umlazi, andMpumalanga Township. In most of these areas, the illegal connections are adverselyaffecting the quality of supply to the legal users which often resulted in outageswhich extended over night. The under-ground mains (UGM) distribution networkhad to be converted to over-head mains (OHM) and various other modificationsare required to reduce the effect on legal customers. During sweepoperations, a number of suspects were arrested and prosecuted.
In an effort to reduce theft and minimize the inconvenience to legal paying residents,the following is being done:
� Convert some of the service connections for legitimate consumers from underground mains to overhead mains.
� The overhead bare copper low voltage circuits are being replaced with aerial bundled conductor (ABC) as a deterrent to tapping onto the line.
� Installation of anti-climb devices.� Reconfiguration of circuits to move away from high theft zones.
23

Primary Measures taken to control illegal connections:-Our illegal services contractor teams together with our internal security teams arerequired to patrol identified areas on a regular basis, to identify and remove illegalservices in these areas, as instructed by the Senior Manager (Revenue Protection).Some of the perpetrators of these illegal activities are caught and prosecuted.
Future Measures to be taken to curb electricity theft
� Rapid response to incidences of illegal connections taking place.� Conduct forensic investigation to collect or obtain evidence, i.e. collect evidence
using surveillance cameras and/or photographic evidence, of an illegal serviceor un-authorized connection, connecting onto our electricity network
� Lay criminal charges against the illegal perpetrators. This will go a long way in assisting us to ensure that the perpetrators are brought to book.
� We will also be focusing on revenue enhancement projects that will promote the electrification of informal settlements
METER ENGINEERING BRANCHThe key purpose of the Meter Engineering Branch is to ensure that all meteringequipment used for billing purposes are appropriately specified, installed andmaintained. To ensure these objectives are undertaken efficiently, the Branch issub divided into five specialist divisions namely
� Whole Current Metering (Construction),� Whole Current Metering (Maintenance),� Metering Workshop,� Advanced Metering & Projects� Bulk Metering division.
Whole current Metering Divisions (Construction and Maintenance)Whole current metering comprises of the maintenance and construction divisionsin order to optimized turnaround times due to the large consumer customer base.The division is largely responsible for all new metering applications and upgradesof small businesses, commercial and sectional title residential customers. Rectificationof on site faults and queries on all complex metering installations also forms asignificant part of this division's responsibilities.
Workshop DivisionThe primary function of this division is to repair, calibrate and test all single andthree phase electromechanical type meters. Prepayment meters are also testedin-house or sent back to the suppliers for specialized repairs. The section has anapproximate throughput of 2000 credit meters per month and is continuouslyunder pressure to process these meters in order to minimize the capital expenditure.The workshop has been housed in a larger premise and geared to cope with high
volumes of meter tests and calibrations. There will be significant upgrades to thisvenue soon; with the installation of new and advanced meter testing equipment.Enhanced quality procedures have also been implemented to improve efficiency.
Advanced Metering and projects DivisionThe Advanced Metering and Projects division is chiefly responsible for the acquisition,specification and commissioning of new metering technologies. During the pastyear, this section has been involved in the implementation of automated meterreading projects. These projects use GSM for the transmission of metering databack to the central station for billing purposes. GPRS is currently being investigatedas a cost effective alternative means of communication. Another important projectcurrently being undertaken by the division is the implementation of smart metering.The feasibility study for this project is nearing completion. The division is alsojointly working with ESKOM on multiple load control projects to ensure a healthynational grid during peak times.
Bulk Metering DivisionThe Bulk metering division is responsible for all new applications and upgradesfor the metering of large power users. This involves complex multi-feeder meterinstallations. The division is directly responsible for the generation of metering dataand maintenance of approximately 900 of our largest customers that bring inalmost 40% to 50% of our total revenue. In addition, the division undertakesplanning, forecasting and more importantly they execute load profile requestsfor the purpose of tariff analysis for our business customers
This Division is also forging ahead with the upgrade program targeted at multifeeder systems. Historically, multi feeder systems have been metered withsummation current transformers. To ensure improved metering accuracies, thesesystems are being reorganized to cater for individual feeder metering. The divisionhas also embarked on a meter replacement program which involves the retrofittingof retrofit all electromechanical Bulk meters with the newer more modern andaccurate electronic meters.
General
The shortage of skills has severely hindered the Branches ability to carry out itscore business activities, and attaining suitably qualified staff is a key priority in theupcoming year. The Meter Engineering Branch has been restructured and prioritywill be given to motivate, train and appoint suitably qualified staff to vacant posts.
A new and an exciting project for the forthcoming year will be the investigationinto new technologies such as smart metering for residential customers and anew multi-vendor advanced meter reading (AMR) system. This will enable theremote reading, disconnections and reconnections of meters for residentialcustomers. Smart metering will also enable the limitation of customers' loads24
which can be used to mitigate unwanted future load shedding procedures. Thenew AMR system will allow the division to expand on its existing supplier base,allowing flexibility in a progressively competitive market. The meter engineeringBranch will continue striving to provide an efficient and effective service to allstakeholders.
CUSTOMER SERVICES BRANCHThe Customer Services Branch covers a wide spectrum of services and supportto consumers and other Branches. The following are some of the Branches keydeliverables:
� Facilitate applications for service connections /alterations� Meter Readings� Auditing of meter readings� Cashiering facilities� Registration of customers for accounts� Providing technical advice to electrical contractors and consultants� Investigating electrocutions and reporting to Department of labour� Resolving a wide spectrum of complaints and queries by consumers and
applicants.
Administration/Technical
The Branch continues to provide a good service with the same number of staffdespite the larger query load due to more customers being connected and thecustomer financial constraints leading to more arrear payment situations. TheBranch has captured and processed in excess of 15000 new applications forelectricity during the course of the financial year. Some of the expert experienced Customer Service technical staff is are sweepingareas on behalf of Revenue Protection over weekends to verify accurate meteringon the larger installations with a good measure of success on identifying technicalproblems and tampering.
Meter Reading and Audit
The escalating crime is continuing to be felt by the meter readers as they find itmore difficult to access premises. More phone calls and appointments are beingmade to enter premises to read meters as residents fortify themselves. Audit staffcontinues to interrogate exception reports on meter readings for faulty and tamperedmeters which are handed over to Revenue Protection to do site visits to verify iftheft is taking place.
CONTACT CENTRE BRANCHUtilizing advanced telephony and communication technology; the Customer ContactCenter provides a platform for customers to interact with the Electricity Unit. TheContact Center offers a personalized customer support function to capture and
deal with electricity related problems. The Centre is equipped with a team ofprofessional operators who are well studied in the field of electricity distribution.
The Contact Centre provides a 24/7 call answering service to capturequeries from the users of the network. Typical queries include:
1. Electricity Outages 7. Tariff advice2. Meter Faults 8. Energy efficiency3. Status of New Connections 9. Street Light Failures4. Billing inaccuracies 10. Poor quality of supply5. Electricity Theft 11. Tariff changes6. Cable Theft 12. Demand side management
The contact centre is committed to building trust and understanding with everyinteraction between the municipality and its customers. The Branch endeavors toconvey accurate and truthful information in a speedy manner to all customersensuring that service excellence is maintained.
The contact center centre handled a total of 764 214 calls for the last financialyear. This is a marked increase when compared to last year's total of 689 352.The contact center centre has been re-organized and is now equipped to assistwith queries relating to account balances, customer service application requirementsand loading of meter readings. The contact center centre is able to acceptcorrespondence communication from the public via the following methods:
Toll free number: 080 131 3111Fax: 031 311 9641Email: [email protected]
25

DEPARTMENT OVERVIEW
DEPARTMENT ORGANOGRAM
Manager: Administration & Transport Manager: Productivity
Manager: Electricity Procurement
Senior Manager: Finance
Deputy Head: Finance & ICT Services
Executive Secretary
Manager: Business Risk Control
The Commercial Departments of Finance, Information Communication Technology, Productivityand Business Process Engineering, Supply Chain Management, Business Risk, Administrationand Transport play a vital support role to eThekwini Electricity. They also participate in numerousother Council projects/committees. Within the staffing constraints currently experienced theystrive to provide effective logistical support to the technical operations. A key feature of thesedepartments is to ensure that throughout legislative practicies, controls and policies and proceduresare complied with.
In addition to the onerous Local Government Legislative and governance controls we also haveto comply with the National Electricity Regulators (NERSA) stringent requirements pertaining toreporting as a ring-fenced Business Unit. NERSA’s Framework for Economic Regulation is complexand is presenting significant compliance challenges going forward.
Name:Keith Moulder
Designation:Deputy Head: Finance & ICT Services
Qualification:FCISPost Graduate Diploma-Business Admin
Experience:
Within eThekwini 20 yrs
Romatex - Director 10 yrs
Robinson & Co - FinancialManager 10 yrs
Standard Bank - Management 03 yrs
�
�
�
�
Senior Manager: Information & Communication Technology
COMMERCIAL
26
ADMINISTRATION BRANCHThe Administration Branch covers three key areas of the Department: Administration,Buildings, and Transport.
The Administration Section is responsible for providing an efficient and effectiveDocument Management System, and operates within the parameters of an approvedGovernmental Archival System. With the increased use of electronic media, meetingthe requirements of the Archival Act, is a major challenge. The exploration of anElectronic Document management System is currently being undertaken. Variousother Administrative functions are customer liaison, word processing of letters,reports, contract documents and transcribing of meetings, disciplines etc. and themicro-filming of electricity application forms.
The Transport Section controls and maintains the Service Unit's large fleet ofVehicle and Plant. This responsibility includes, purchase/disposals of vehicles,servicing, repairs and all statutory requirements. A major challenge is budgetryconstraints. The standardisation of specifications, with respect to vehicle type andmodel, has reduced maintenance costs. Fleet retail market developments haveresulted in fewer modifications to vehicles than previously required. For example,legislation requires that staff and equipment must be separated on a truck. Previously,major modifications had to be undertaken to achieve this. However, the currentretail market offers a standard crew cab which accommodates this requirement.Consequently major financial savings have been achieved.
The Building Maintenance Section is responsible for the general buildingmaintenance/security and the upkeep of the gardens/grounds at the ElectricitySpringfield Complex, Training Centre and HQ Complexes. Due to the rapid intakeof new recruits, the provision of office accommodation and parking areas hasbecome a major challenge. Various initiatives are being implemented to addressthese challenges, namely restructuring of existing office space, leasing of officespace, and erection of new buildings.
PRODUCTIVITY BRANCHThe Productivity Branch contributes to the upgrading of productivity and efficiencythroughout the Unit by closely monitoring the productivity of both in-house andcontractors teams, and ensuring that the undertaking remains cost effective whilstmaintaining a high level service standard to management.
Again we were unable to complete the new Incentive Bonus computer programmedue to staff shortages within ICT and the urgency of other projects, but hopefullythis project will be completed within the next financial year.
With the ever increasing number of contractors working for the Electricity Unit themonitoring and verification of worked claimed is essential thereby ensuring that ahigh standard of efficiency and productivity is maintained and that any fraudulentbooking of work is brought to the immediate notice of management.
With the imminent formation of a Business Process Section within the ProductivityBranch we will have the ability to introduce a new dimension to the overall increaseof efficiency and productivity by ensuring the most appropriate solutions are usedto meet the business needs. This will be achieved by creating a documentedoverview of all business processes within the Unit, to identify improvement prioritiesand to ensure that business processes meet both the user and businessrequirements, and that the best business practices are effectively managed.
The major challenge for the forthcoming year will be the creation of the “'d2BusinessProcess Section”'d3 where we will have to get approval for changes to the existingorganogram, creation of new posts together with the relevant duty schedules andthereafter the filling of these positions. Based on current HR timelines it is highlyunlikely this will happen before June 2012.
INFORMATION TECHNOLOGY BRANCHAs the saying goes, there is only one thing constant in ICT and that is change.The ICT Department, due to changing demands by both internal and externalcustomers / stakeholders has had a very busy and productive year. In addition tothe continuation of projects from the previous year, there have been a number ofnew projects and initiatives.
A key focus for the recent year was to improve ICT Governance and addressweaknesses in our Systems and Processes identified by our own Risk Assessments,the Auditor General and our internal ICT Auditors. eThekwini Electricity adoptedCOBIT (Control Objectives For IT) as the framework for improving Governancematurity, and as a consequence, have embarked on a number of projects andinitiatives to address the gaps in the Maturity Assessment that was concluded thisyear. One such initiative is a full Asset Inventory Survey and Systems Survey todetermine, amongst other things, the technology roadmap for both Hardware andSoftware Systems deployed in Electricity. The initiative would also determine aRisk profile for each of the systems and deliver comprehensive Documentation ofour entire systems landscape. This will assist greatly in the ongoing support,maintenance and planning of ICT in Electricity.
To improve governance we have implemented stricter change control proceduresand automated workflows to better control the entire technology life cycle whichwill address weaknesses identified by the Auditor General. Whilst continuousimprovement is necessary, the foundation has been laid for the improvement ofICT Governance and as a result, improvements in Service and ICT SystemsAvailability.
Although some good progress has been made in the recruitment of ICT Staff,especially in the area of Support, the number of vacant posts in the departmentremains unacceptably high, and is an impediment to achieving the department'sobjectives. There is also an ever greater need for specialized training as the relianceon external service providers for key systems support and maintenance is high.
27
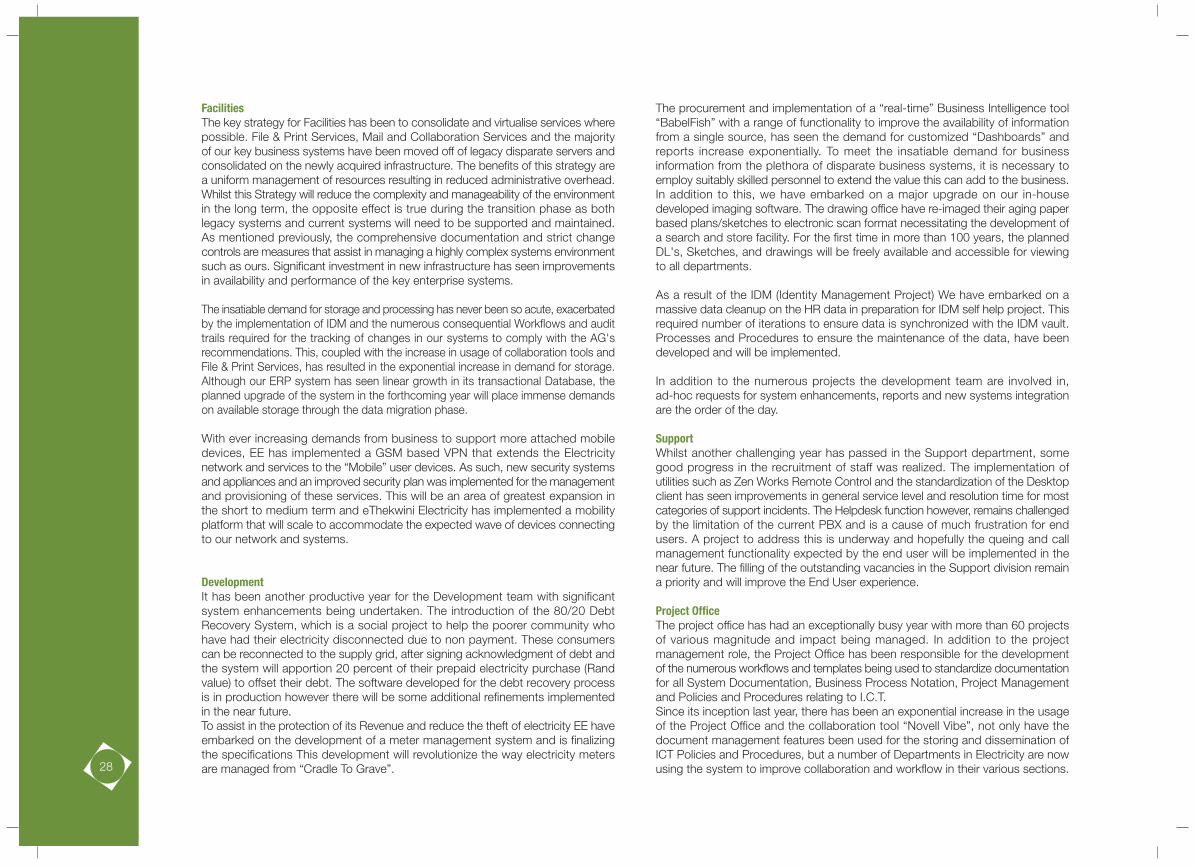
The procurement and implementation of a “real-time” Business Intelligence tool“BabelFish” with a range of functionality to improve the availability of informationfrom a single source, has seen the demand for customized “Dashboards” andreports increase exponentially. To meet the insatiable demand for businessinformation from the plethora of disparate business systems, it is necessary toemploy suitably skilled personnel to extend the value this can add to the business.In addition to this, we have embarked on a major upgrade on our in-housedeveloped imaging software. The drawing office have re-imaged their aging paperbased plans/sketches to electronic scan format necessitating the development ofa search and store facility. For the first time in more than 100 years, the plannedDL's, Sketches, and drawings will be freely available and accessible for viewingto all departments.
As a result of the IDM (Identity Management Project) We have embarked on amassive data cleanup on the HR data in preparation for IDM self help project. Thisrequired number of iterations to ensure data is synchronized with the IDM vault.Processes and Procedures to ensure the maintenance of the data, have beendeveloped and will be implemented.
In addition to the numerous projects the development team are involved in,ad-hoc requests for system enhancements, reports and new systems integrationare the order of the day.
SupportWhilst another challenging year has passed in the Support department, somegood progress in the recruitment of staff was realized. The implementation ofutilities such as Zen Works Remote Control and the standardization of the Desktopclient has seen improvements in general service level and resolution time for mostcategories of support incidents. The Helpdesk function however, remains challengedby the limitation of the current PBX and is a cause of much frustration for endusers. A project to address this is underway and hopefully the queing and callmanagement functionality expected by the end user will be implemented in thenear future. The filling of the outstanding vacancies in the Support division remaina priority and will improve the End User experience.
Project OfficeThe project office has had an exceptionally busy year with more than 60 projectsof various magnitude and impact being managed. In addition to the projectmanagement role, the Project Office has been responsible for the developmentof the numerous workflows and templates being used to standardize documentationfor all System Documentation, Business Process Notation, Project Managementand Policies and Procedures relating to I.C.T.Since its inception last year, there has been an exponential increase in the usageof the Project Office and the collaboration tool “Novell Vibe”, not only have thedocument management features been used for the storing and dissemination ofICT Policies and Procedures, but a number of Departments in Electricity are nowusing the system to improve collaboration and workflow in their various sections.
FacilitiesThe key strategy for Facilities has been to consolidate and virtualise services wherepossible. File & Print Services, Mail and Collaboration Services and the majorityof our key business systems have been moved off of legacy disparate servers andconsolidated on the newly acquired infrastructure. The benefits of this strategy area uniform management of resources resulting in reduced administrative overhead.Whilst this Strategy will reduce the complexity and manageability of the environmentin the long term, the opposite effect is true during the transition phase as bothlegacy systems and current systems will need to be supported and maintained.As mentioned previously, the comprehensive documentation and strict changecontrols are measures that assist in managing a highly complex systems environmentsuch as ours. Significant investment in new infrastructure has seen improvementsin availability and performance of the key enterprise systems.
The insatiable demand for storage and processing has never been so acute, exacerbatedby the implementation of IDM and the numerous consequential Workflows and audittrails required for the tracking of changes in our systems to comply with the AG'srecommendations. This, coupled with the increase in usage of collaboration tools andFile & Print Services, has resulted in the exponential increase in demand for storage.Although our ERP system has seen linear growth in its transactional Database, theplanned upgrade of the system in the forthcoming year will place immense demandson available storage through the data migration phase.
With ever increasing demands from business to support more attached mobiledevices, EE has implemented a GSM based VPN that extends the Electricitynetwork and services to the “Mobile” user devices. As such, new security systemsand appliances and an improved security plan was implemented for the managementand provisioning of these services. This will be an area of greatest expansion inthe short to medium term and eThekwini Electricity has implemented a mobilityplatform that will scale to accommodate the expected wave of devices connectingto our network and systems.
DevelopmentIt has been another productive year for the Development team with significantsystem enhancements being undertaken. The introduction of the 80/20 DebtRecovery System, which is a social project to help the poorer community whohave had their electricity disconnected due to non payment. These consumerscan be reconnected to the supply grid, after signing acknowledgment of debt andthe system will apportion 20 percent of their prepaid electricity purchase (Randvalue) to offset their debt. The software developed for the debt recovery processis in production however there will be some additional refinements implementedin the near future.To assist in the protection of its Revenue and reduce the theft of electricity EE haveembarked on the development of a meter management system and is finalizingthe specifications This development will revolutionize the way electricity metersare managed from “Cradle To Grave”.28
PROCUREMENT BRANCHThe Purchasing Section of Electricity provides a service for all Stock, Service OrdersNon Stock and Emergency Orders for the whole of Electricity and their depots.One of the Policies which is adopted by the Purchasing Department is ensuringthat the strategy and value delivery are continually kept under review and in linewith changes in technology and supply markets. Springfield complex Buying officeprovides a hands on procurement service to the Mechanicial workshop, Electricalworkshops, Transmission Cables, Substations and Central Depot.A major challenge for the forthcoming year will be the review of the “total life cycleof products” purchased and their impact on costs as well as environmental impact.
Bid Administration ReportThe Bid Administration Section administers 37 contracts for the supply of goodsand services of which 11 are labour contracts.
Most Projects embarked on in Electricity are now formally registered in Vibe andProject Managers and Project Team Members are utilizing the numerous “in-House”developed Templates for managing their project documentation and progressreports. In addition to this a number of automated workflows have been developedfor Change Control using Vibe.
FINANCE BRANCHThe Finance Branch is responsible for the financial monitoring over all activities ofthe Electricity Department. It is equally the FINAL custodian of the departmentsFixed Assets.
This includes, inter alia, the management, monitoring and control of revenue,expenditure, capital expenditure, insurance claims, financial systems, proceduresand the provision of advice and guidance on matters related to finance to allpersonnel. The Department's annual and medium term budgets, annual financialstatements and monthly management reports are prepared by the Finance Branch.The Branch also monitors compliance with statutory and internal regulations.In addition, the annual financial statements for the 2010/2011 year and the multiyearbudgets for the 2011/2012 year onwards were prepared and approved withindeadlines.
During the year under review, the Finance Branch continued to contribute to severalprojects in the Department, namely, the Outage Management System (OMS), theRevenue Management System (RMS) and the Asset Management System (AMS).
Phase One of the AMS implementation, which relates to HV, has been successfullycompleted and Phase Two; MV/LV is well underway and it is expected to beconcluded in the following Financial Year. Significant progress has been made inthe rollout of the OMS project.A project to introduce super vending in the current year was successfully implementedand a vendor appointed. The aim of this project is to increase the department'sfootprint of sales outlets for prepayment electricity within the eThekwini region andto provide several alternative methods of sale. Several other Branches were involvedin this project.
Another multiyear project that was intended for commencement in the financialyear under review is the Regulatory Reporting Manuals (RRM) required by theNational Energy Regulator of South Africa (NERSA). A directive from the Regulatoris awaited and if this project goes ahead, it will involve some major changes tosystems and processes, as well as the training of personnel throughout theDepartment. 28 With the audit and successful completion of the 2010/2011 AnnualFinancial Statements compilation, Management would like to recognise thededication and enthusiasm displayed by the staff.
29
Purchase order stats for July 2010 to June 2011
Price Category Order Type No. of Orders Total Order Value (R)
ESKOM Electricity Service Orders 4 3,920,000,000.00
Contracts Stock Orders 1 390.00
Contracts Service Orders 4 249 651 612 499.77
Contracts Non Stock Orders 16 1 314 366.44
Contracts Field Release Orders 69 25 775 762.88
Council Authority Service Orders 39 59 887 079.04
Council Authority Non Stock Orders 7 21 541 771.43
Escalation Orders Service Orders 1 105 000.00
Escalation Orders Field Release Orders 1 105 000.00
FPA Agreement Stock Orders 2 394 307 179 080.33
FPA Agreement Service Orders 235 160 029 445.28
FPA Agreement Non Stock Orders 112 12 661 488.88
Normal Purchases Stock Orders 1 917 26 094 024.12
Normal Purchases Service Orders 1 751 22 685 060.53
Normal Purchases Non Stock Orders 2 088 16 951 235.92
Quasi-Government/Inter-Departmental - Stock Orders 33 680 111.48
Service Orders 2 309 24 372 949.14
Non Stock Order 334 641 972.30
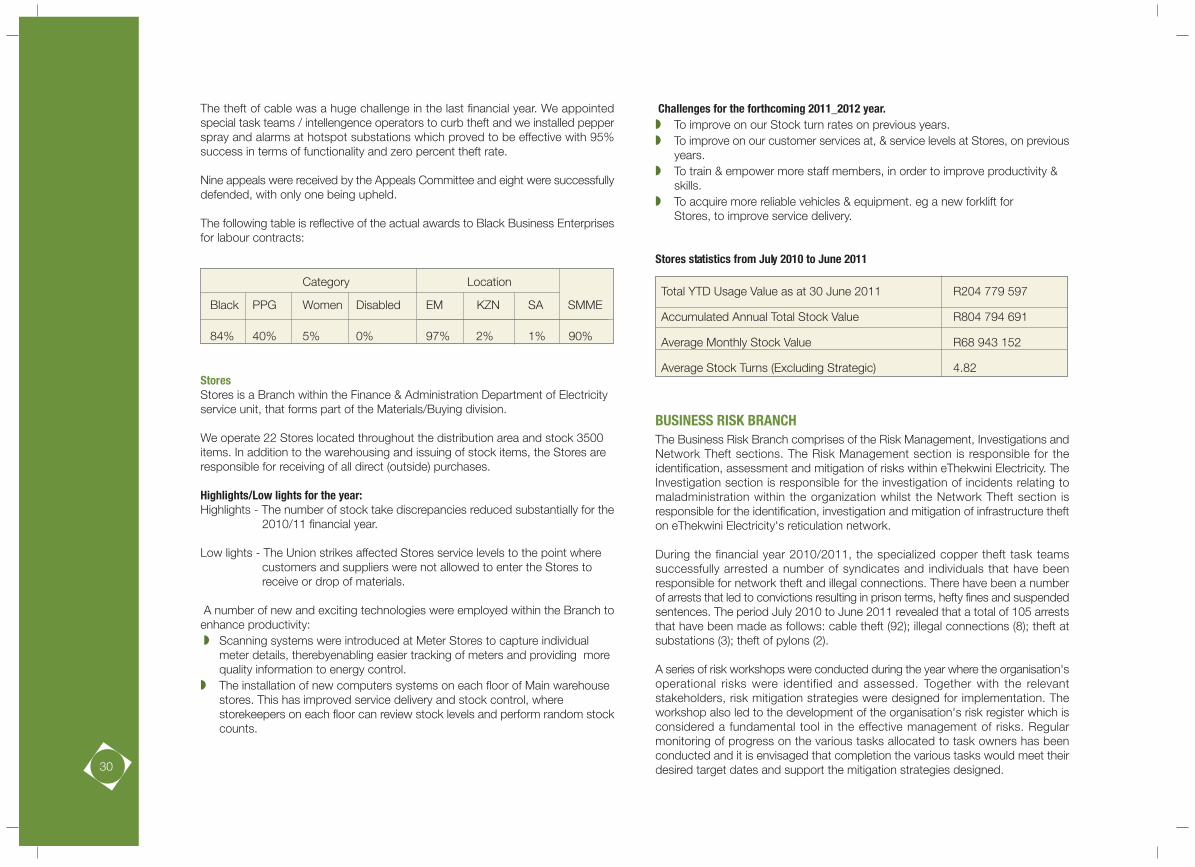
Challenges for the forthcoming 2011_2012 year.� To improve on our Stock turn rates on previous years.� To improve on our customer services at, & service levels at Stores, on previous
years.� To train & empower more staff members, in order to improve productivity & skills.� To acquire more reliable vehicles & equipment. eg a new forklift for Stores, to improve service delivery.
Stores statistics from July 2010 to June 2011
Total YTD Usage Value as at 30 June 2011 R204 779 597
Accumulated Annual Total Stock Value R804 794 691
Average Monthly Stock Value R68 943 152
Average Stock Turns (Excluding Strategic) 4.82
BUSINESS RISK BRANCHThe Business Risk Branch comprises of the Risk Management, Investigations andNetwork Theft sections. The Risk Management section is responsible for theidentification, assessment and mitigation of risks within eThekwini Electricity. TheInvestigation section is responsible for the investigation of incidents relating tomaladministration within the organization whilst the Network Theft section isresponsible for the identification, investigation and mitigation of infrastructure thefton eThekwini Electricity's reticulation network.
During the financial year 2010/2011, the specialized copper theft task teamssuccessfully arrested a number of syndicates and individuals that have beenresponsible for network theft and illegal connections. There have been a numberof arrests that led to convictions resulting in prison terms, hefty fines and suspendedsentences. The period July 2010 to June 2011 revealed that a total of 105 arreststhat have been made as follows: cable theft (92); illegal connections (8); theft atsubstations (3); theft of pylons (2).
A series of risk workshops were conducted during the year where the organisation'soperational risks were identified and assessed. Together with the relevantstakeholders, risk mitigation strategies were designed for implementation. Theworkshop also led to the development of the organisation's risk register which isconsidered a fundamental tool in the effective management of risks. Regularmonitoring of progress on the various tasks allocated to task owners has beenconducted and it is envisaged that completion the various tasks would meet theirdesired target dates and support the mitigation strategies designed.
The theft of cable was a huge challenge in the last financial year. We appointedspecial task teams / intellengence operators to curb theft and we installed pepperspray and alarms at hotspot substations which proved to be effective with 95%success in terms of functionality and zero percent theft rate.
Nine appeals were received by the Appeals Committee and eight were successfullydefended, with only one being upheld.
The following table is reflective of the actual awards to Black Business Enterprisesfor labour contracts:
Category Location
Black PPG Women Disabled EM KZN SA SMME
84% 40% 5% 0% 97% 2% 1% 90%
StoresStores is a Branch within the Finance & Administration Department of Electricityservice unit, that forms part of the Materials/Buying division.
We operate 22 Stores located throughout the distribution area and stock 3500items. In addition to the warehousing and issuing of stock items, the Stores areresponsible for receiving of all direct (outside) purchases.
Highlights/Low lights for the year:Highlights - The number of stock take discrepancies reduced substantially for the
2010/11 financial year.
Low lights - The Union strikes affected Stores service levels to the point where customers and suppliers were not allowed to enter the Stores to receive or drop of materials.
A number of new and exciting technologies were employed within the Branch toenhance productivity: � Scanning systems were introduced at Meter Stores to capture individual
meter details, therebyenabling easier tracking of meters and providing more quality information to energy control.
� The installation of new computers systems on each floor of Main warehouse stores. This has improved service delivery and stock control, where storekeepers on each floor can review stock levels and perform random stock counts.
30

During the financial year 2010/2011 a series of investigations into maladministrationwithin the organization was conducted resulting in internal disciplinary enquiriesand appropriate action being instituted.
In the ensuing year, the Branch intends to explore new technologies that areavailable on the market in an effort to enable us to adequately manage incidentsof network theft. We shall drive the process in convincing law makers into adoptinga more serious approach to incidents of copper theft. Should this be successful,we envisage that with the implementation of new/amended legislation, harshersentences would be meted out to perpetrators found guilty of copper theft. In thisregard, several cases brought before the courts have produced effective three yearimprisonments or hefty fines being imposed on those convicted. The Branch alsointends to intensify its marketing strategies to make consumers more aware andvigilant of suspects stealing cables and other Electricity infrastructure.
It is also our aim to conduct an “early identification process” of the organisationsfuture potential risks so as timeously alert management of the potential risks andenable risk mitigation strategies to be developed and implemented. In our driveto adopt a zero tolerance approach to maladministration within the organization,we will continue to pursue investigations and recommend whatever action wedeem necessary which we consider to be in the best interests of the organization.
31
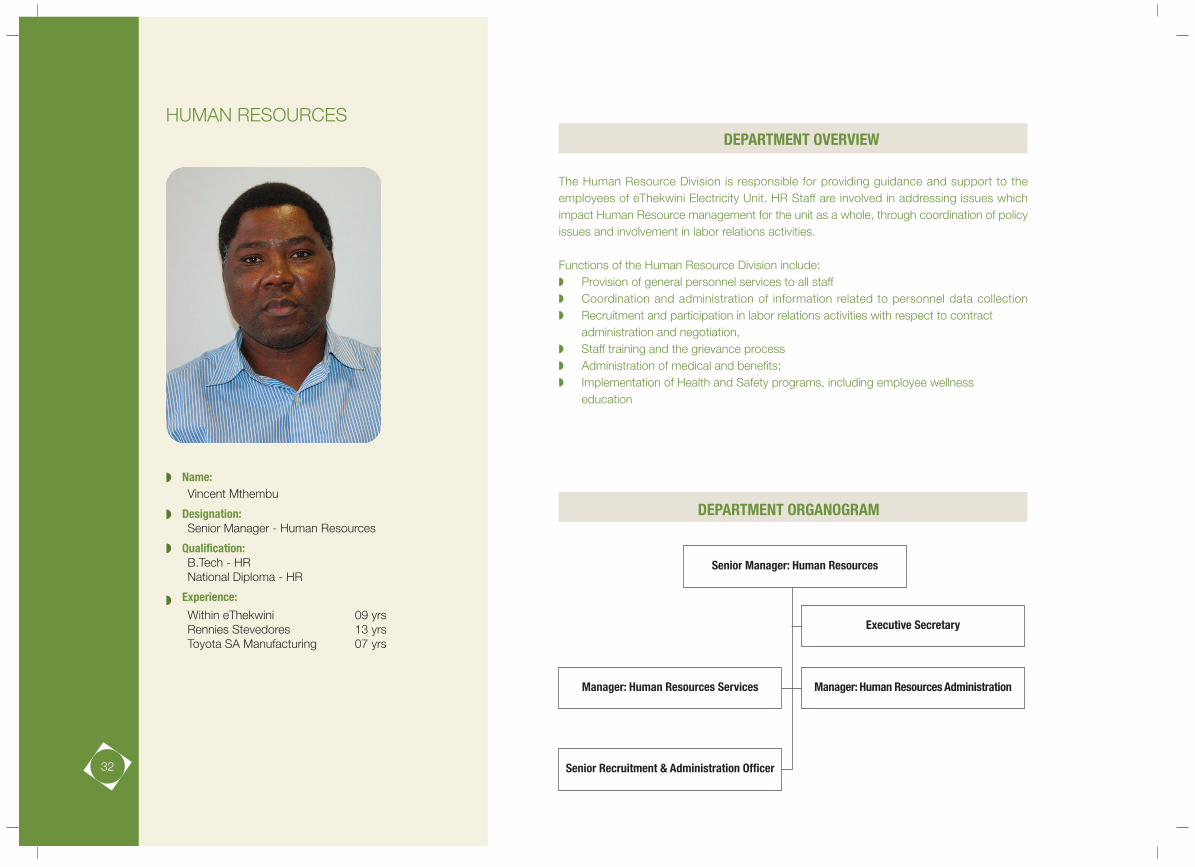
The Human Resource Division is responsible for providing guidance and support to theemployees of eThekwini Electricity Unit. HR Staff are involved in addressing issues whichimpact Human Resource management for the unit as a whole, through coordination of policyissues and involvement in labor relations activities.
Functions of the Human Resource Division include:� Provision of general personnel services to all staff� Coordination and administration of information related to personnel data collection� Recruitment and participation in labor relations activities with respect to contract
administration and negotiation,� Staff training and the grievance process� Administration of medical and benefits;� Implementation of Health and Safety programs, including employee wellness
education
HUMAN RESOURCES
Name:Vincent Mthembu
Designation:Senior Manager - Human Resources
Qualification:B.Tech - HRNational Diploma - HR
Experience:
Within eThekwini 09 yrsRennies Stevedores 13 yrsToyota SA Manufacturing 07 yrs
�
�
�
�
Manager: Human Resources Services Manager: Human Resources Administration
Senior Recruitment & Administration Officer
Senior Manager: Human Resources
Executive Secretary
DEPARTMENT OVERVIEW
DEPARTMENT ORGANOGRAM
32
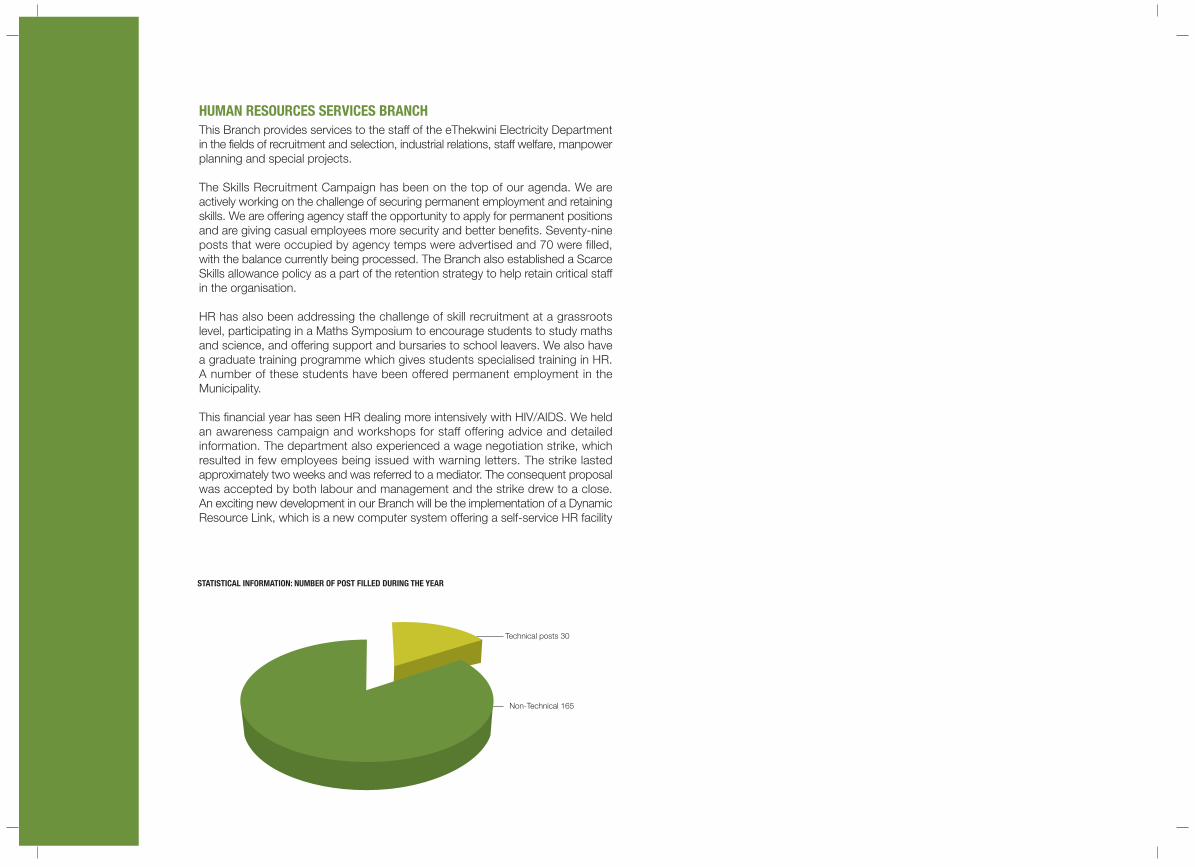
STATISTICAL INFORMATION: NUMBER OF POST FILLED DURING THE YEAR
Technical posts 30
Non-Technical 165
HUMAN RESOURCES SERVICES BRANCHThis Branch provides services to the staff of the eThekwini Electricity Departmentin the fields of recruitment and selection, industrial relations, staff welfare, manpowerplanning and special projects.
The Skills Recruitment Campaign has been on the top of our agenda. We areactively working on the challenge of securing permanent employment and retainingskills. We are offering agency staff the opportunity to apply for permanent positionsand are giving casual employees more security and better benefits. Seventy-nineposts that were occupied by agency temps were advertised and 70 were filled,with the balance currently being processed. The Branch also established a ScarceSkills allowance policy as a part of the retention strategy to help retain critical staffin the organisation.
HR has also been addressing the challenge of skill recruitment at a grassrootslevel, participating in a Maths Symposium to encourage students to study mathsand science, and offering support and bursaries to school leavers. We also havea graduate training programme which gives students specialised training in HR.A number of these students have been offered permanent employment in theMunicipality.
This financial year has seen HR dealing more intensively with HIV/AIDS. We heldan awareness campaign and workshops for staff offering advice and detailedinformation. The department also experienced a wage negotiation strike, whichresulted in few employees being issued with warning letters. The strike lastedapproximately two weeks and was referred to a mediator. The consequent proposalwas accepted by both labour and management and the strike drew to a close.An exciting new development in our Branch will be the implementation of a DynamicResource Link, which is a new computer system offering a self-service HR facility
STATISTICAL INFORMATION: EMPLOYEE WELFARE
0246
Number of cases
Gen
eral
Issu
es
Fam
ily, m
arita
l/div
orce
Alc
ohol
/sub
stan
ceab
use
Ber
eave
men
t
Fina
ncia
l
Poo
r pe
rfom
ance
coun
sellin
g
Car
eer/
voca
tiona
lco
unse
lling
Trau
ma
debr
iefin
g
8
10
1214
11
68 7 7
6
0
9
STATISTICAL INFORMATION: MEDICAL’S RESULTS
0
2
4
6
8
10
12
14
16
4
Undefi
ned
result
s
Result
ed in
Medica
l Boa
rding
Result
ed in
Tempo
rary D
isabil
ities
Result
ed in
Light
Duty
Emplo
yees
curre
ntly
on Te
mp Disa
bility
Emplo
yees
curre
ntly
on Li
ght D
uty
12
14
4
4
Number of cases
STATISTICAL INFORMATION: LABOUR TURNOVER
Number of cases
0
10
20
30
40
50
1
Normal
Retirem
ents
Resign
ation
sDea
th
Medica
l
Board
Early R
etirem
ents
17
35
1315
33

HUMAN RESOURCES ADMINISTRATION BRANCHIn the Human Resources Administration Branch we provide a service to bothexternal and internal staff.
The Human Resources Administration Branch was previously made up of the Pay,Leave and Administration Section. In July 2008 the Pay and Leave sections of allUnits of the eThekwini Municipality were centralised. As a result, the HumanResources Administration Branch has now taken on the role of the 'link' betweenthe employees of Electricity and the Centralised Pay and Leave sections in resolvingqueries relating to pay and leave. We assist the families of our deceased employeesin completing all relevant documentation, and liaising with the various parties toensure payment is made timeously to the families.
We are not only limited to assisting the field employees of the Electricity Unit, butalso play a role in providing a service to the Line Management of Electricity Unitwith statistical information, duty schedules, organograms, etc.
During the year under review seven Candidate Engineers were appointed. Thetotal number of employees engaged being 127 and 152 internal promotions havebeen processed for the year under review.
STATISTICAL INFORMATION: INDUSTRIAL RELATIONS
Number of cases
0
5
10
15
20
25
Discipl
inary
Matters
Dismiss
als
Grieva
nces
22
3
23
Resig
natio
ns
Term
inat
ion
of c
ontra
ct
Tran
sfer
s
Retir
emen
t
Med
ical
ly b
oard
ed
Ear
ly re
tirem
ent
Dism
issal
Dec
ease
d
STATISTICAL INFORMATION: TERMINATIONS
Number of cases
54
88
1
1415
25
11 12
24
26
88 10
21 19
10
2008/2009 2009/2010
Absc
onde
nce
TRAINING/SKILLS DEVELOPMENT BRANCHThe Skills Development Branch is responsible for ensuring that the Unit meets therequirements of the 'Skills Development Act'. We focus on non-technical trainingwhich includes ABET, Computer Training, Assisted Education, In Service Training,In-House Courses and External Courses by service providers. We assist the unitin developing and implementing the Workplace Skills Plan - monitoring and reportingon the WSPs of all its employees. We also source potential in-service traineesfrom the tertiary institutions for practical training in the Unit. Overall, our Branchstrives to meet the learning needs of the unit and identify learning solutions andinnovations.
The major project undertaken in the financial year was the development of theSkills Development Portal System. Managers were trained in using the system andassisted to create their teams in the Skills Development Portal. They were thentrained in producing WSP reports from this system.
The financial year also saw our Branch become more customer focused byemploying a dedicated Skills Development Practitioner who assists managers onskills development issues. In the future, the Branch plans are to increase attendanceat our training courses and to develop more technical learnership programmeswithin the Unit.
34
GRAPHS
ANNUAL CAPITAL EXPENDITURE ANNUAL REVENUE
Annual Revenue
FINANCIAL YEAR
2 000
Ran
ds (M
illons
)
6 000
5 000
4 000
3 000
1 000
099/00 00/01 01/02 02/03 03/04 04/05 05/06 06/07 07/08 08/09 09/10 10/11
7 000
8 000
FINANCIAL YEAR
Annual capital expenditure
Ran
ds (M
illons
)
1 000
2 000
3 000
4 000
5 000
6 000
7 000
99/00 00/01 01/02 02/03 03/04 04/05 05/06 06/07 07/08 08/09 09/10 10/110
8 000
35

SYSTEM MAXIMUM DEMAND ENERGY SALES PER ANNUM
2 000
1 800
1 600
1 400
1 200
1 000
800
600
400
200
-99/00 00/01 01/02 02/03 03/04 04/05 05/06 06/07 07/08 08/09 09/10 10/11
Max
imum
Dem
and
(MVA
)
8%
6%
4%
2%
0%
-2%
-4%
-6%
% G
row
th
10%
FINANCIAL YEAR
Maximum Demand (MVA)
% Growth
% G
row
th
FINANCIAL YEAR
Energy (GWh)
% Growth
8%
6%
4%
2%
0%
-2%
Ene
rgy
(GW
h)
12 000
10 000
8 000
6 000
4 000
2 000
0 -4%99/00 00/01 01/02 02/03 03/04 04/05 05/06 06/07 07/08 08/09 09/10 10/11
36

AVERAGE MWh PER BULK CUSTOMER/MONTH
Ran
d
Ene
rgy
(MW
h)
-
100
200
300
400
500
600
700 350
250
200
150
100
50
099/00 00/01 01/02 02/03 03/04 04/05 05/06 06/07 07/08 08/09 09/10 10/11
FINANCIAL YEAR
Average MWh/Bulk Customer/Month
Average Income (R)/Bulk Customer/Month
GROWTH OF BULK CUSTOMERS
FINANCIAL YEAR
Number of Bulk Customers
Energy Sold (GWh)
5.2
5.4
5.0
4.8
4.6
4.4
4.2
4.0
300
200
100
99/00 00/01 01/02 02/03 03/04 04/05 05/06 06/07 07/08 08/09 09/10 10/11
Ene
rgy
(GW
h)
Num
ber
of B
ulk
Cus
tom
ers
400
500
600
700
800
900
0
37

GROWTH OF BUSINESS AND GENERAL CUSTOMERS AVERAGE KWh PER BUSINESS AND GENERAL CUSTOMER/MONTH
Ene
rgy
(GW
h)
Num
ber o
f Bus
ines
s an
d G
ener
al C
usto
mer
s
99/00 00/01 01/02 02/03 03/04 04/05 05/06 06/07 07/08 08/09 09/10 10/11
3 500
3 000
2 500
2 000
1 500
1 000
500
00
5 000
10 000
15 000
20 000
25 000
30 000
35 000
40 000
45 000
50 000
FINANCIAL YEAR
Number of Business and General Customers
Energy Sold (GWh)
Ran
dEne
rgy
(kW
h)
99/00 00/01 01/02 02/03 03/04 04/05 05/06 06/07 07/08 08/09 09/10 10/110
1 000
2 000
3 000
4 000
5 000
6 000 4 000
3 500
3 000
2 500
2 000
1 500
1 000
500
0
FINANCIAL YEAR
Average kWh/B&G Customer/Month
Average Income (R)/B&G Customer/Month
38
GROWTH OF CREDIT RESIDENTIAL CUSTOMERS AVERAGE KWh PER CREDIT RESIDENTIAL CUSTOMER/MONTH
Ene
rgy
(GW
h)
Num
ber
of C
usto
mer
s
99/00 00/01 01/02 02/03 03/04 04/05 05/06 06/07 07/08 08/09 09/10 10/11280 000
285 000
290 000
295 000
300 000
305 000
310 000
315 000
320 000
325 000
330 000
0
500
1 000
1 500
2 000
2 500
3 000
3 500
FINANCIAL YEAR
Number of Credit Residential Customers
Energy Sold (GWh)
Ene
rgy
(kW
h)
Ran
d
0
100
200
300
400
500
600
700
800
900
100
0
200
300
400
500
600
99/00 00/01 01/02 02/03 03/04 04/05 05/06 06/07 07/08 08/09 09/10 10/11
FINANCIAL YEAR
Average kWh/Credit Residential Customer/Month
Average Income (R)/Credit Residential Customer/Month
39

GROWTH OF PREPAYMENT RESIDENTIAL CUSTOMERS AVERAGE KWh PER PREPAYMENT RESIDENTIAL CUSTOMER/MONTHN
umbe
r of
Cus
tom
ers
Ene
rgy
(GW
h)
100
-
200
300
400
500
600
700
800
900
0
50 000
100 000
150 000
200 000
250 000
300 000
350 000
99/00 00/01 01/02 02/03 03/04 04/05 05/06 06/07 07/08 08/09 09/10 10/11
FINANCIAL YEAR
Number of Prepayment Residential Customers
Energy Sold (GWh)
FINANCIAL YEAR
Average kWh/Prepayment Residential Customer/Month
Average Income (R)/Prepayment Residential Customer/Month
Ene
rgy
(kW
h)
99/00 00/01 01/02 02/03 03/04 04/05 05/06 06/07 07/08 08/09 09/10 10/110
50
100
150
200
250
0
20
40
60
80
100
120
140
160
Ran
d
40
OVERALL AVERAGE kWh PER CUSTOMER/MONTHOVERALL GROWTH OF CUSTOMERS
Ene
rgy
(GW
h)
Num
ber
of C
usto
mer
s
99/00 00/01 01/02 02/03 03/04 04/05 05/06 06/07 07/08 08/09 09/10 10/110
100 000
200 000
300 000
400 000
500 000
600 000
700 000
800 000
-
2 000
4 000
6 000
8 000
10 000
12 000
FINANCIAL YEAR
Number of Customers
Energy Sold (GWh)
Ran
d
Ene
rgy
(kW
h)
0
200
400
600
800
1 000
1 200
1 400
1 600
1 800
99/00 00/01 01/02 02/03 03/04 04/05 05/06 06/07 07/08 08/09 09/10 10/110
100
200
300
400
500
600
700
800
900
1 000
FINANCIAL YEAR
Overall Average kWh Per Customer/Month
Average Income (R)/Customer/Month
41

ENERGY SOLD PER EMPLOYEENUMBER OF EMPLOYEES
Num
ber
of E
mpl
oyee
s
99/00 00/01 01/02 02/03 03/04 04/05 05/06 06/07 07/08 08/09 09/10 10/110
500
1 000
1 500
2 000
2 500
Number of Employees
FINANCIAL YEAR
99/00 00/01 01/02 02/03 03/04 04/05 05/06 06/07 07/08 08/09 09/10 10/11
Ene
rgy
(GW
h)
8.00
7.00
6.00
5.00
4.00
3.00
2.00
1.00
-
Energy Sold Per Employee (GWh)
FINANCIAL YEAR
42
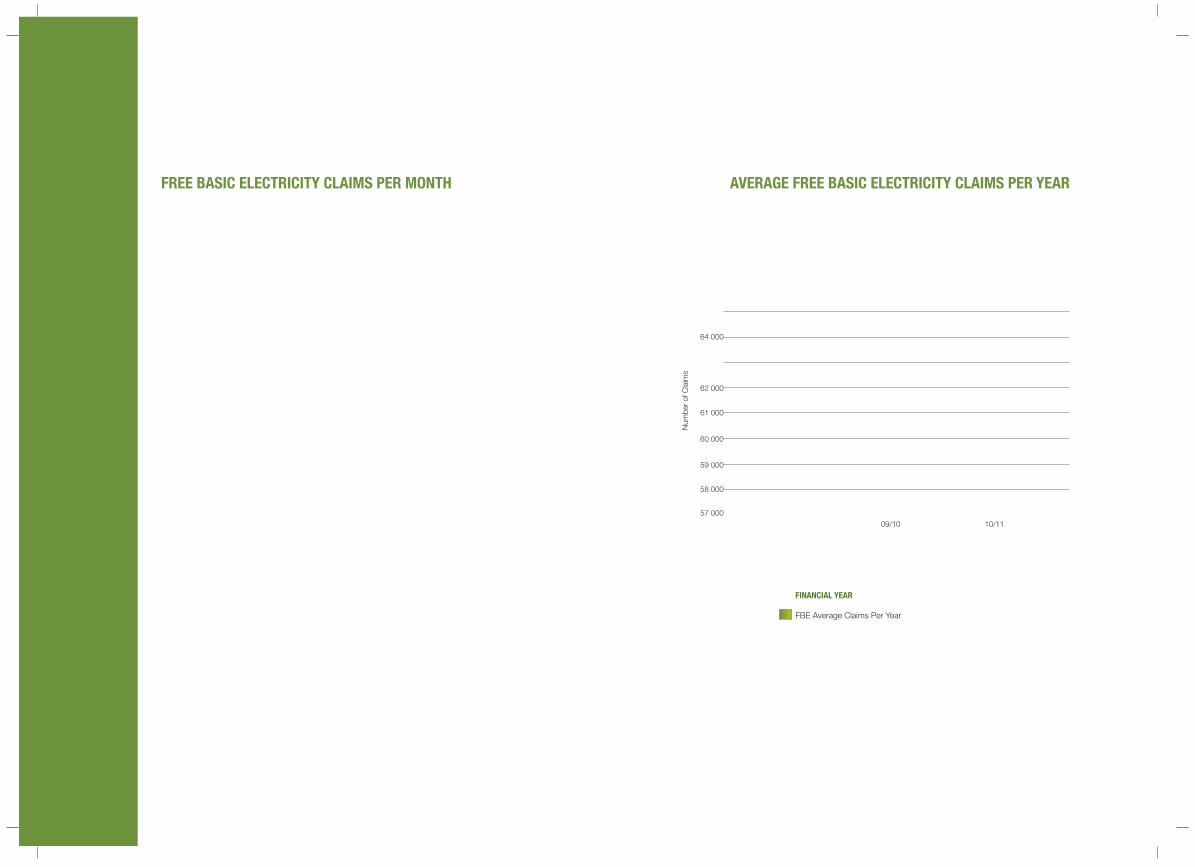
FREE BASIC ELECTRICITY CLAIMS PER MONTH AVERAGE FREE BASIC ELECTRICITY CLAIMS PER YEAR
FBE Average Claims Per Year
FINANCIAL YEAR
10/1157 000
58 000
59 000
60 000
61 000
62 000
64 000
Num
ber
of C
laim
s
09/10
63 000
65 000
MONTHS OF 2010/2011 FINANCIAL YEAR
Qualifying Customers
Total Claims
Jul Aug Sep Oct Nov Dec Jan Feb Mar Apr May Jun
70 000
60 000
50 000
20 000
10 000
0
Num
ber o
f Cus
tom
ers
30 000
40 000
80 000
90 000
43
08/09

DISTRIBUTION OF ENERGY SALES 2010/2011 DISTRIBUTION OF REVENUE FROM SALES 2010/2011
OTHER: Streetlighting, Traffic signals & Public lighting
Other 0.38%
Private Residences 23.08%
Business & general 26.96%
Prepayment 7.29%
Bulk 42.29%
Residential 29.90%
Bulk 36.92%
Prepayment 8.12%
Business & General 24.54%
44
Other 0.52%
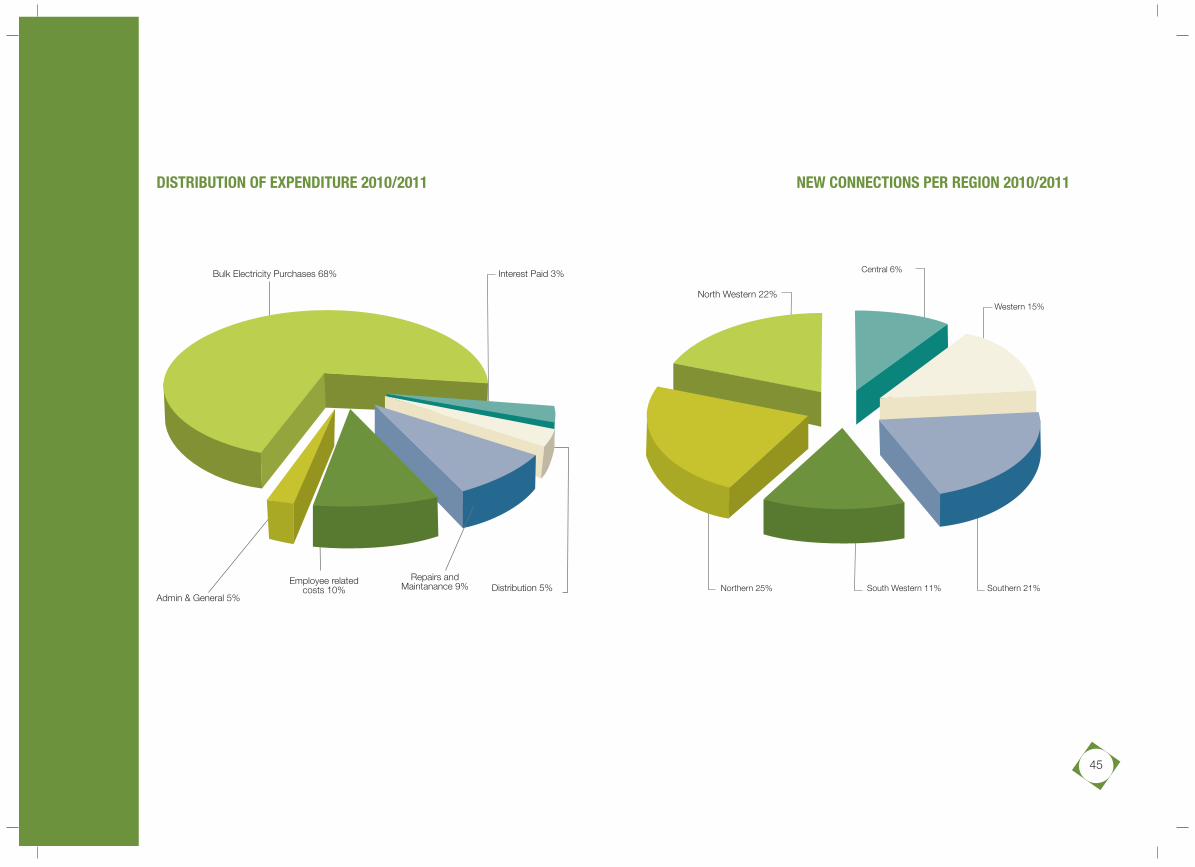
DISTRIBUTION OF EXPENDITURE 2010/2011 NEW CONNECTIONS PER REGION 2010/2011
Southern 21%
North Western 22%
South Western 11%
Central 6%
Western 15%
Northern 25%
Bulk Electricity Purchases 68%
Distribution 5%
Interest Paid 3%
Admin & General 5%
Employee relatedcosts 10%
Repairs andMaintanance 9%
45
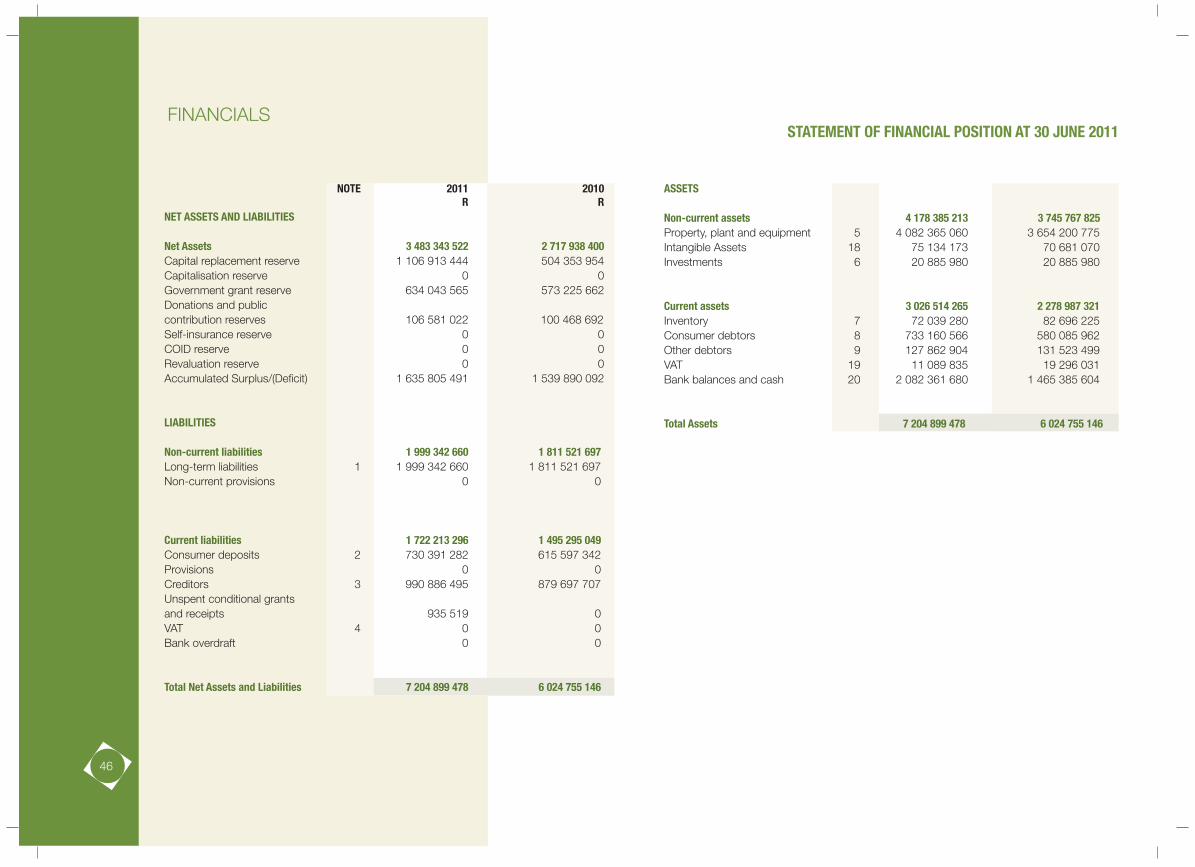
FINANCIALS
NOTE 2011 2010 R RNET ASSETS AND LIABILITIES Net Assets 3 483 343 522 2 717 938 400Capital replacement reserve 1 106 913 444 504 353 954Capitalisation reserve 0 0Government grant reserve 634 043 565 573 225 662Donations and publiccontribution reserves 106 581 022 100 468 692Self-insurance reserve 0 0COID reserve 0 0Revaluation reserve 0 0Accumulated Surplus/(Deficit) 1 635 805 491 1 539 890 092
LIABILITIES
Non-current liabilities 1 999 342 660 1 811 521 697Long-term liabilities 1 1 999 342 660 1 811 521 697Non-current provisions 0 0
Current liabilities 1 722 213 296 1 495 295 049Consumer deposits 2 730 391 282 615 597 342Provisions 0 0Creditors 3 990 886 495 879 697 707Unspent conditional grantsand receipts 935 519 0VAT 4 0 0Bank overdraft 0 0 Total Net Assets and Liabilities 7 204 899 478 6 024 755 146
STATEMENT OF FINANCIAL POSITION AT 30 JUNE 2011
ASSETS Non-current assets 4 178 385 213 3 745 767 825Property, plant and equipment 5 4 082 365 060 3 654 200 775Intangible Assets 18 75 134 173 70 681 070Investments 6 20 885 980 20 885 980 Current assets 3 026 514 265 2 278 987 321Inventory 7 72 039 280 82 696 225Consumer debtors 8 733 160 566 580 085 962Other debtors 9 127 862 904 131 523 499VAT 19 11 089 835 19 296 031Bank balances and cash 20 2 082 361 680 1 465 385 604 Total Assets 7 204 899 478 6 024 755 146
46
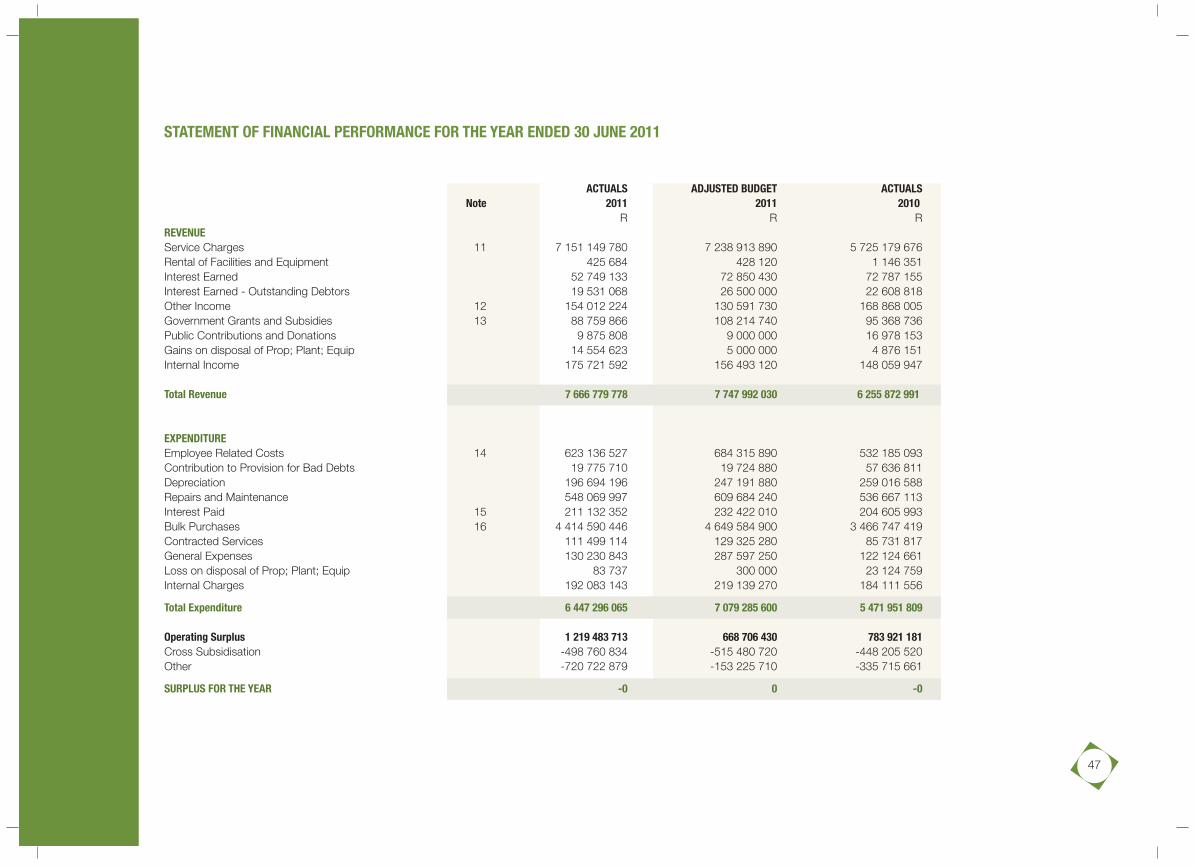
STATEMENT OF FINANCIAL PERFORMANCE FOR THE YEAR ENDED 30 JUNE 2011
ACTUALS ADJUSTED BUDGET ACTUALSNote 2011 2011 2010
R R RREVENUEService Charges 11 7 151 149 780 7 238 913 890 5 725 179 676Rental of Facilities and Equipment 425 684 428 120 1 146 351Interest Earned 52 749 133 72 850 430 72 787 155Interest Earned - Outstanding Debtors 19 531 068 26 500 000 22 608 818Other Income 12 154 012 224 130 591 730 168 868 005Government Grants and Subsidies 13 88 759 866 108 214 740 95 368 736Public Contributions and Donations 9 875 808 9 000 000 16 978 153Gains on disposal of Prop; Plant; Equip 14 554 623 5 000 000 4 876 151Internal Income 175 721 592 156 493 120 148 059 947
Total Revenue 7 666 779 778 7 747 992 030 6 255 872 991
EXPENDITUREEmployee Related Costs 14 623 136 527 684 315 890 532 185 093Contribution to Provision for Bad Debts 19 775 710 19 724 880 57 636 811Depreciation 196 694 196 247 191 880 259 016 588Repairs and Maintenance 548 069 997 609 684 240 536 667 113Interest Paid 15 211 132 352 232 422 010 204 605 993Bulk Purchases 16 4 414 590 446 4 649 584 900 3 466 747 419Contracted Services 111 499 114 129 325 280 85 731 817General Expenses 130 230 843 287 597 250 122 124 661Loss on disposal of Prop; Plant; Equip 83 737 300 000 23 124 759Internal Charges 192 083 143 219 139 270 184 111 556
Total Expenditure 6 447 296 065 7 079 285 600 5 471 951 809
Operating Surplus 1 219 483 713 668 706 430 783 921 181Cross Subsidisation -498 760 834 -515 480 720 -448 205 520Other -720 722 879 -153 225 710 -335 715 661
SURPLUS FOR THE YEAR -0 0 -0
47
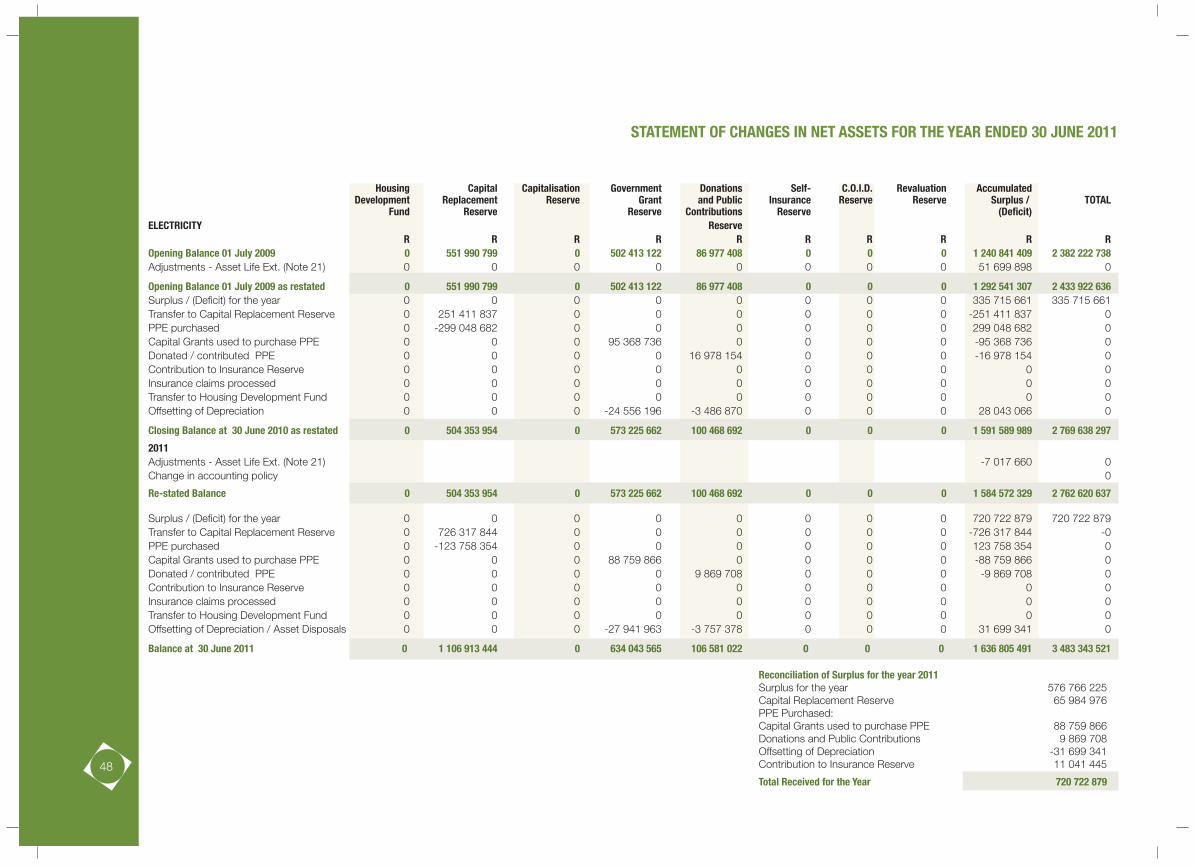
STATEMENT OF CHANGES IN NET ASSETS FOR THE YEAR ENDED 30 JUNE 2011
Reconciliation of Surplus for the year 2011Surplus for the year 576 766 225Capital Replacement Reserve 65 984 976PPE Purchased:Capital Grants used to purchase PPE 88 759 866Donations and Public Contributions 9 869 708Offsetting of Depreciation -31 699 341Contribution to Insurance Reserve 11 041 445
Total Received for the Year 720 722 879
Housing Capital Capitalisation Government Donations Self- C.O.I.D. Revaluation Accumulated Development Replacement Reserve Grant and Public Insurance Reserve Reserve Surplus / TOTAL
Fund Reserve Reserve Contributions Reserve (Deficit)ELECTRICITY Reserve
R R R R R R R R R ROpening Balance 01 July 2009 0 551 990 799 0 502 413 122 86 977 408 0 0 0 1 240 841 409 2 382 222 738Adjustments - Asset Life Ext. (Note 21) 0 0 0 0 0 0 0 0 51 699 898 0
Opening Balance 01 July 2009 as restated 0 551 990 799 0 502 413 122 86 977 408 0 0 0 1 292 541 307 2 433 922 636Surplus / (Deficit) for the year 0 0 0 0 0 0 0 0 335 715 661 335 715 661Transfer to Capital Replacement Reserve 0 251 411 837 0 0 0 0 0 0 -251 411 837 0PPE purchased 0 -299 048 682 0 0 0 0 0 0 299 048 682 0Capital Grants used to purchase PPE 0 0 0 95 368 736 0 0 0 0 -95 368 736 0Donated / contributed PPE 0 0 0 0 16 978 154 0 0 0 -16 978 154 0Contribution to Insurance Reserve 0 0 0 0 0 0 0 0 0 0Insurance claims processed 0 0 0 0 0 0 0 0 0 0Transfer to Housing Development Fund 0 0 0 0 0 0 0 0 0 0Offsetting of Depreciation 0 0 0 -24 556 196 -3 486 870 0 0 0 28 043 066 0
Closing Balance at 30 June 2010 as restated 0 504 353 954 0 573 225 662 100 468 692 0 0 0 1 591 589 989 2 769 638 297
2011Adjustments - Asset Life Ext. (Note 21) -7 017 660 0Change in accounting policy 0
Re-stated Balance 0 504 353 954 0 573 225 662 100 468 692 0 0 0 1 584 572 329 2 762 620 637
Surplus / (Deficit) for the year 0 0 0 0 0 0 0 0 720 722 879 720 722 879Transfer to Capital Replacement Reserve 0 726 317 844 0 0 0 0 0 0 -726 317 844 -0PPE purchased 0 -123 758 354 0 0 0 0 0 0 123 758 354 0Capital Grants used to purchase PPE 0 0 0 88 759 866 0 0 0 0 -88 759 866 0Donated / contributed PPE 0 0 0 0 9 869 708 0 0 0 -9 869 708 0Contribution to Insurance Reserve 0 0 0 0 0 0 0 0 0 0Insurance claims processed 0 0 0 0 0 0 0 0 0 0Transfer to Housing Development Fund 0 0 0 0 0 0 0 0 0 0Offsetting of Depreciation / Asset Disposals 0 0 0 -27 941 963 -3 757 378 0 0 0 31 699 341 0
Balance at 30 June 2011 0 1 106 913 444 0 634 043 565 106 581 022 0 0 0 1 636 805 491 3 483 343 521
48
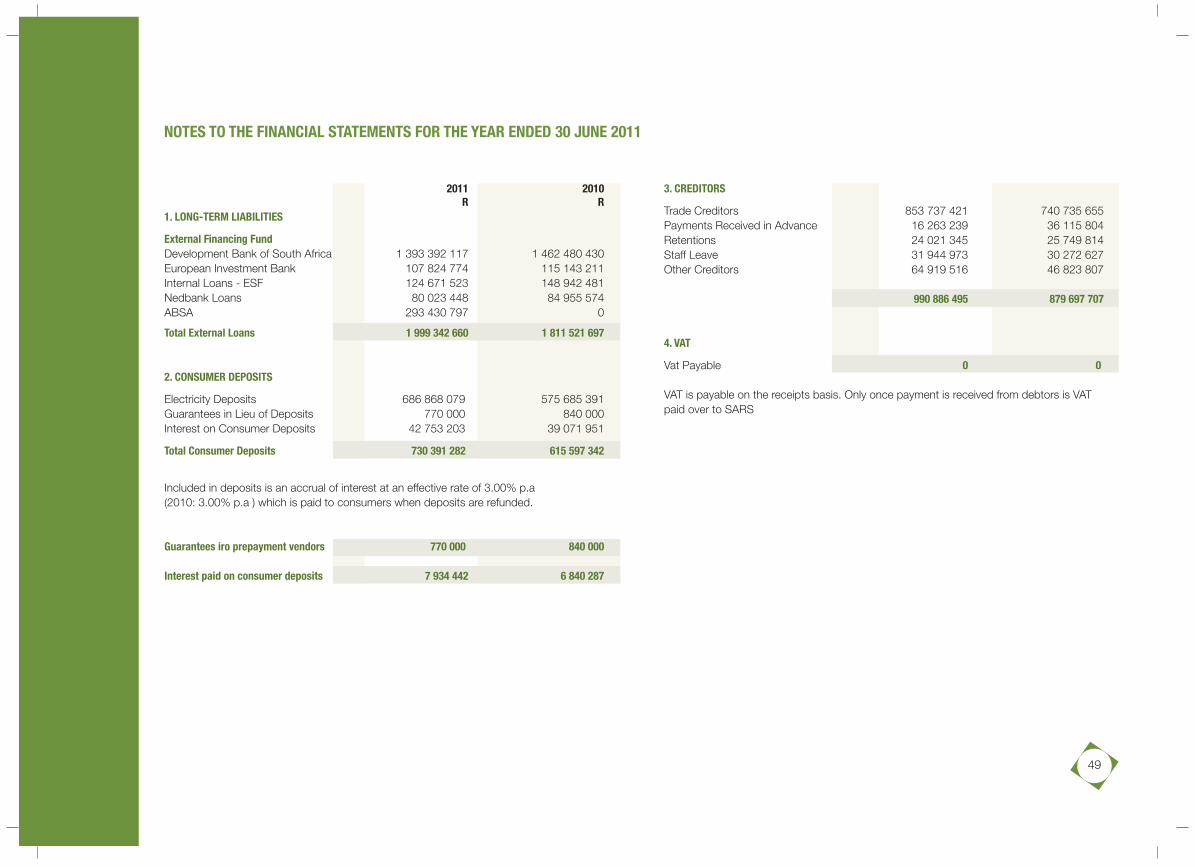
3. CREDITORS
Trade Creditors 853 737 421 740 735 655Payments Received in Advance 16 263 239 36 115 804Retentions 24 021 345 25 749 814Staff Leave 31 944 973 30 272 627Other Creditors 64 919 516 46 823 807
990 886 495 879 697 707
4. VAT
Vat Payable 0 0
VAT is payable on the receipts basis. Only once payment is received from debtors is VATpaid over to SARS
NOTES TO THE FINANCIAL STATEMENTS FOR THE YEAR ENDED 30 JUNE 2011
2011 2010R R
1. LONG-TERM LIABILITIES
External Financing FundDevelopment Bank of South Africa 1 393 392 117 1 462 480 430European Investment Bank 107 824 774 115 143 211Internal Loans - ESF 124 671 523 148 942 481Nedbank Loans 80 023 448 84 955 574ABSA 293 430 797 0
Total External Loans 1 999 342 660 1 811 521 697
2. CONSUMER DEPOSITS
Electricity Deposits 686 868 079 575 685 391Guarantees in Lieu of Deposits 770 000 840 000Interest on Consumer Deposits 42 753 203 39 071 951
Total Consumer Deposits 730 391 282 615 597 342
Included in deposits is an accrual of interest at an effective rate of 3.00% p.a(2010: 3.00% p.a ) which is paid to consumers when deposits are refunded.
Guarantees iro prepayment vendors 770 000 840 000
Interest paid on consumer deposits 7 934 442 6 840 287
49
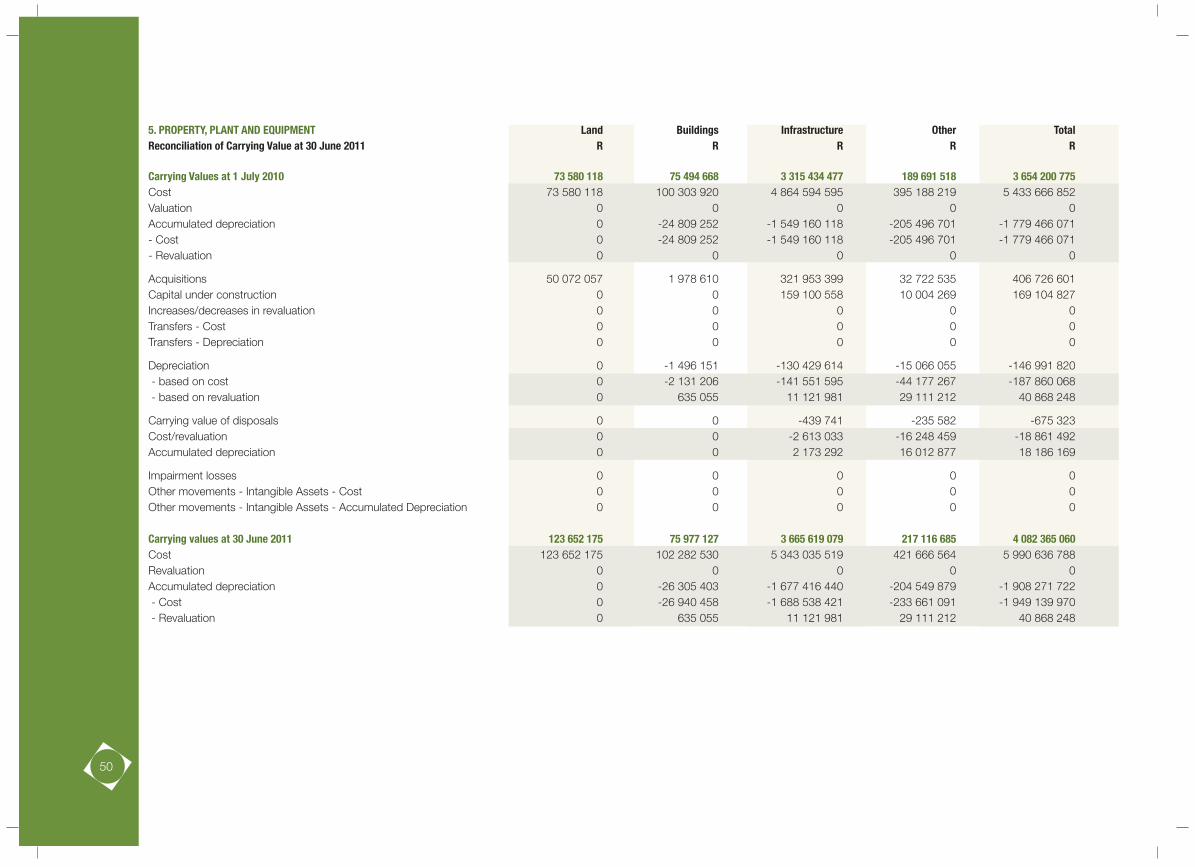
5. PROPERTY, PLANT AND EQUIPMENT Land Buildings Infrastructure Other TotalReconciliation of Carrying Value at 30 June 2011 R R R R R Carrying Values at 1 July 2010 73 580 118 75 494 668 3 315 434 477 189 691 518 3 654 200 775Cost 73 580 118 100 303 920 4 864 594 595 395 188 219 5 433 666 852Valuation 0 0 0 0 0Accumulated depreciation 0 -24 809 252 -1 549 160 118 -205 496 701 -1 779 466 071- Cost 0 -24 809 252 -1 549 160 118 -205 496 701 -1 779 466 071- Revaluation 0 0 0 0 0
Acquisitions 50 072 057 1 978 610 321 953 399 32 722 535 406 726 601Capital under construction 0 0 159 100 558 10 004 269 169 104 827Increases/decreases in revaluation 0 0 0 0 0Transfers - Cost 0 0 0 0 0Transfers - Depreciation 0 0 0 0 0
Depreciation 0 -1 496 151 -130 429 614 -15 066 055 -146 991 820 - based on cost 0 -2 131 206 -141 551 595 -44 177 267 -187 860 068 - based on revaluation 0 635 055 11 121 981 29 111 212 40 868 248
Carrying value of disposals 0 0 -439 741 -235 582 -675 323Cost/revaluation 0 0 -2 613 033 -16 248 459 -18 861 492Accumulated depreciation 0 0 2 173 292 16 012 877 18 186 169
Impairment losses 0 0 0 0 0Other movements - Intangible Assets - Cost 0 0 0 0 0Other movements - Intangible Assets - Accumulated Depreciation 0 0 0 0 0 Carrying values at 30 June 2011 123 652 175 75 977 127 3 665 619 079 217 116 685 4 082 365 060Cost 123 652 175 102 282 530 5 343 035 519 421 666 564 5 990 636 788Revaluation 0 0 0 0 0Accumulated depreciation 0 -26 305 403 -1 677 416 440 -204 549 879 -1 908 271 722 - Cost 0 -26 940 458 -1 688 538 421 -233 661 091 -1 949 139 970 - Revaluation 0 635 055 11 121 981 29 111 212 40 868 248
50

Reconciliation of Carrying Value at 30 June 2010 Land Buildings Infrastructure Other TotalR R R R R
Carrying Values at 1 July 2009 56 721 823 71 144 913 2 979 347 001 159 580 829 3 266 794 566Cost 56 721 823 94 036 709 4 342 987 111 337 009 549 4 830 755 192Valuation 0 0 0 0 0Accumulated depreciation 0 -22 891 796 -1 363 640 110 -177 428 720 -1 563 960 626 - Cost 0 -22 891 796 -1 363 640 110 -177 428 720 -1 563 960 626 - Revaluation 0 0 0 0 0 Acquisitions 16 858 295 0 251 368 553 53 512 824 321 739 672Capital under construction 0 6 267 211 321 075 377 22 496 410 349 838 998Increases/decreases in revaluation 0 0 0 0 0Transfers - Cost 0 0 0 0 0Transfers - Depreciation 0 0 -73 588 662 -9 140 519 -82 729 181
Depreciation 0 -1 917 456 -133 003 241 -34 758 739 -169 679 436 - based on cost 0 -1 917 456 -133 003 241 -34 758 739 -169 679 436 - based on revaluation 0 0 0 0 0
Carry value of disposals 0 0 -24 725 127 -1 999 287 -26 724 413Cost/revaluation 0 0 -50 836 446 -17 830 564 -68 667 010Accumulated depreciation 0 0 26 111 319 15 831 277 41 942 596 Impairment losses 0 0 -5 039 424 0 0Other movements - Intangible Assets - Cost 0 0 -7 933 360 0 0Other movements - Intangible Assets - Accumulated Depreciation 0 0 2 893 936 0 0
Carrying values at 30 June 2010 73 580 118 75 494 668 3 315 434 477 189 691 518 3 654 200 775Cost 73 580 118 100 303 920 4 864 594 595 395 188 219 5 433 666 852Revaluation 0 0 0 0 0Accumulated depreciation 0 -24 809 252 -1 549 160 118 -205 496 701 -1 779 466 071 - Cost 0 -24 809 252 -1 475 571 456 -196 356 182 -1 696 736 890 - Revaluation 0 0 0 0 0
51
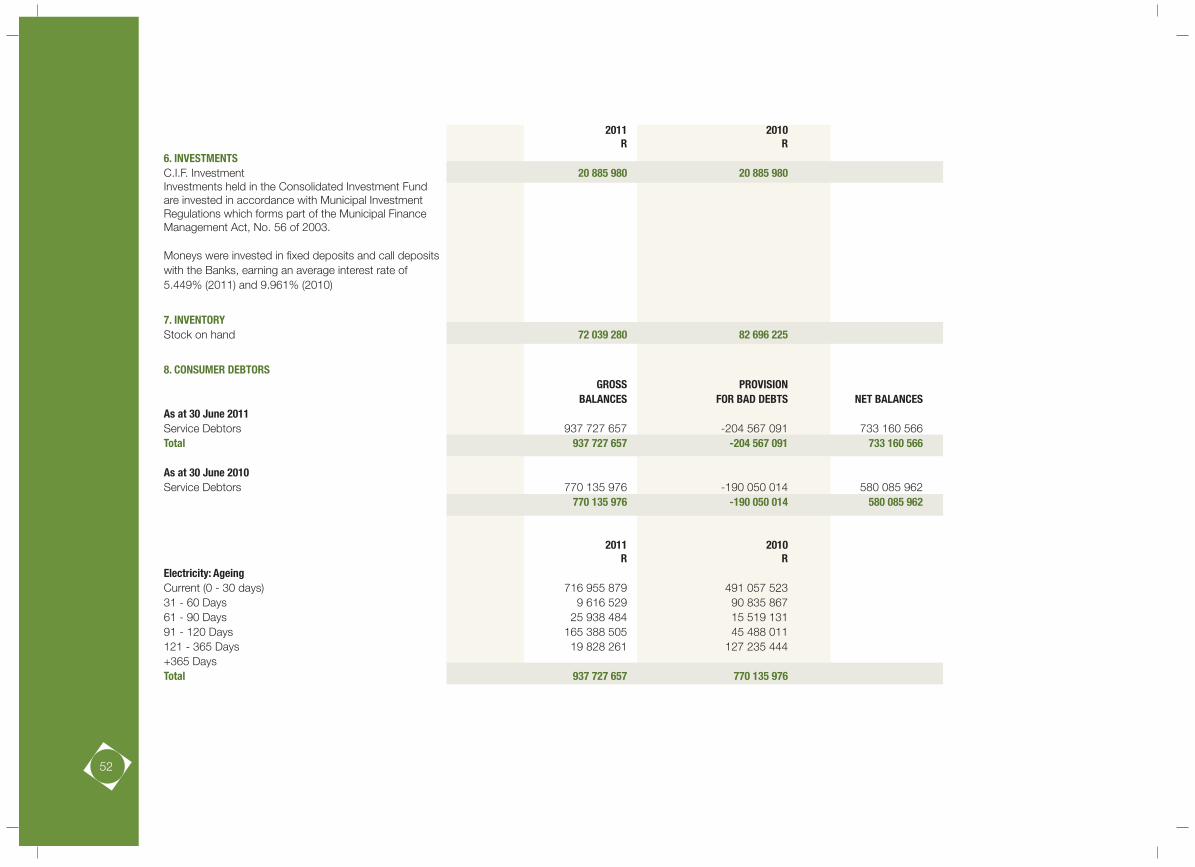
52
2011 2010 R R6. INVESTMENTSC.I.F. Investment 20 885 980 20 885 980Investments held in the Consolidated Investment Fundare invested in accordance with Municipal Investment Regulations which forms part of the Municipal Finance Management Act, No. 56 of 2003.
Moneys were invested in fixed deposits and call depositswith the Banks, earning an average interest rate of5.449% (2011) and 9.961% (2010)
7. INVENTORYStock on hand 72 039 280 82 696 225
8. CONSUMER DEBTORSGROSS PROVISION
BALANCES FOR BAD DEBTS NET BALANCESAs at 30 June 2011 Service Debtors 937 727 657 -204 567 091 733 160 566Total 937 727 657 -204 567 091 733 160 566
As at 30 June 2010Service Debtors 770 135 976 -190 050 014 580 085 962
770 135 976 -190 050 014 580 085 962
2011 2010 R RElectricity: AgeingCurrent (0 - 30 days) 716 955 879 491 057 52331 - 60 Days 9 616 529 90 835 86761 - 90 Days 25 938 484 15 519 13191 - 120 Days 165 388 505 45 488 011121 - 365 Days 19 828 261 127 235 444+365 DaysTotal 937 727 657 770 135 976
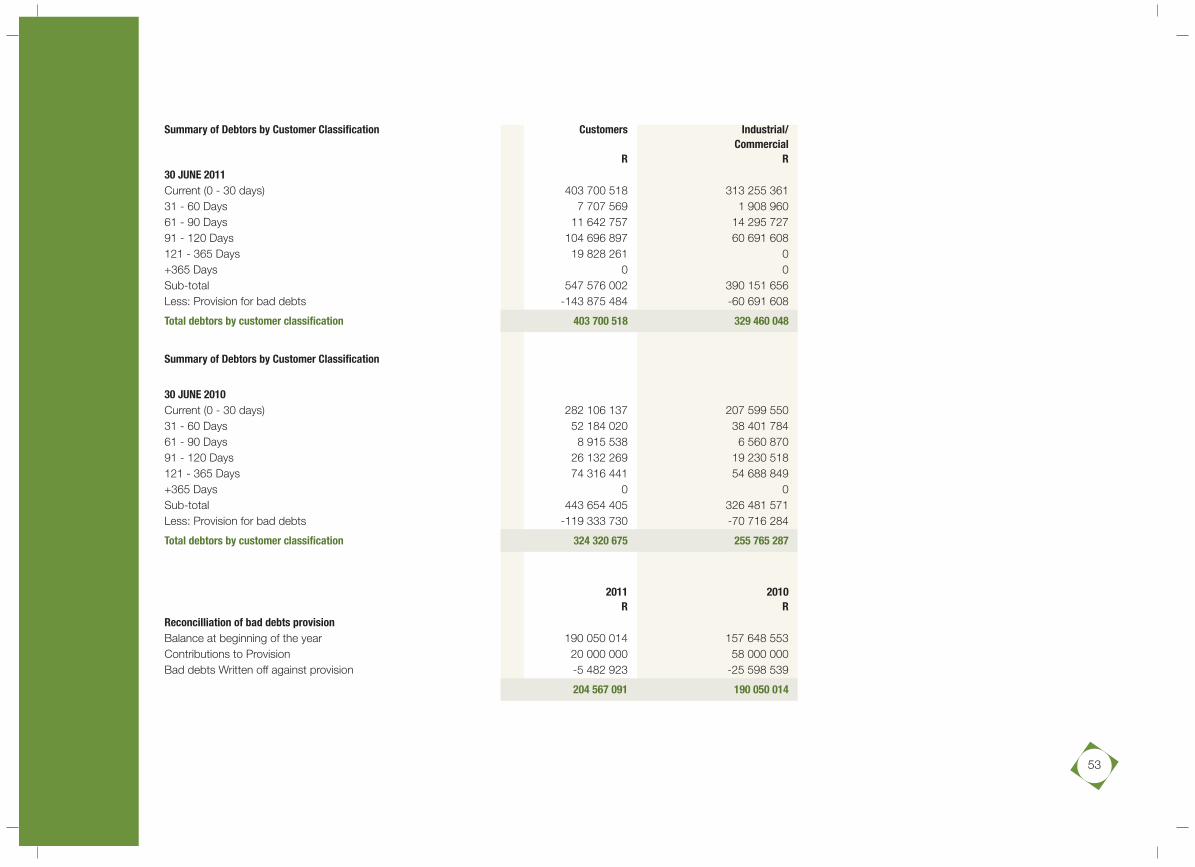
53
Summary of Debtors by Customer Classification Customers Industrial/Commercial
R R30 JUNE 2011Current (0 - 30 days) 403 700 518 313 255 36131 - 60 Days 7 707 569 1 908 96061 - 90 Days 11 642 757 14 295 72791 - 120 Days 104 696 897 60 691 608121 - 365 Days 19 828 261 0+365 Days 0 0Sub-total 547 576 002 390 151 656Less: Provision for bad debts -143 875 484 -60 691 608
Total debtors by customer classification 403 700 518 329 460 048
Summary of Debtors by Customer Classification
30 JUNE 2010Current (0 - 30 days) 282 106 137 207 599 55031 - 60 Days 52 184 020 38 401 78461 - 90 Days 8 915 538 6 560 87091 - 120 Days 26 132 269 19 230 518121 - 365 Days 74 316 441 54 688 849+365 Days 0 0Sub-total 443 654 405 326 481 571Less: Provision for bad debts -119 333 730 -70 716 284
Total debtors by customer classification 324 320 675 255 765 287
2011 2010
R RReconcilliation of bad debts provisionBalance at beginning of the year 190 050 014 157 648 553Contributions to Provision 20 000 000 58 000 000Bad debts Written off against provision -5 482 923 -25 598 539
204 567 091 190 050 014

2011 2010R R
9. OTHER DEBTORSInsurance Recoverables 106 600 770 91 156 125Private Jobs - Cost of Work done 3 230 571 19 233 890Prepayment Meter Token Sales 4 822 739 9 636 038Sundry Debtors - General 8 954 539 8 811 941Metro Water 54 423 352 476Mechanical Workshops 65 018 52 679Debtors Capital 1 307 415 1 311 328Insurance Sundry Accounts 2 229 797 815 919Apprentice Tools Cost/Recovery 86 415 153 103CL A/C - Refuse Disposal 66 876 0Corporate Services 444 340 0
127 862 904 131 523 499
10. BANK, CASH & OVERDRAFT BALANCESEthekwini Electricity has the following bank accounts:
Electricity Expenditure AccountFirst National Bank - Umhlanga -Account Number 62085722348Cash book balance at beginning of year 667 250 616 786 001 813Cash book balance at end of year 653 962 086 667 250 616Bank statement balance at beginning of year 7 255 589 5 743 965Bank statement balance at end of year 0 7 255 589
Electricity EFT AccountFirst National Bank - Umhlanga - Account Number 62085722463Cash book balance at beginning of year 16 949 116 852 12 019 213 334Cash book balance at end of year 19 082 372 456 16 949 116 852Bank statement balance at beginning of year 362 592 778 609 108 869
Bank statement balance at end of year 0 362 592 778
54
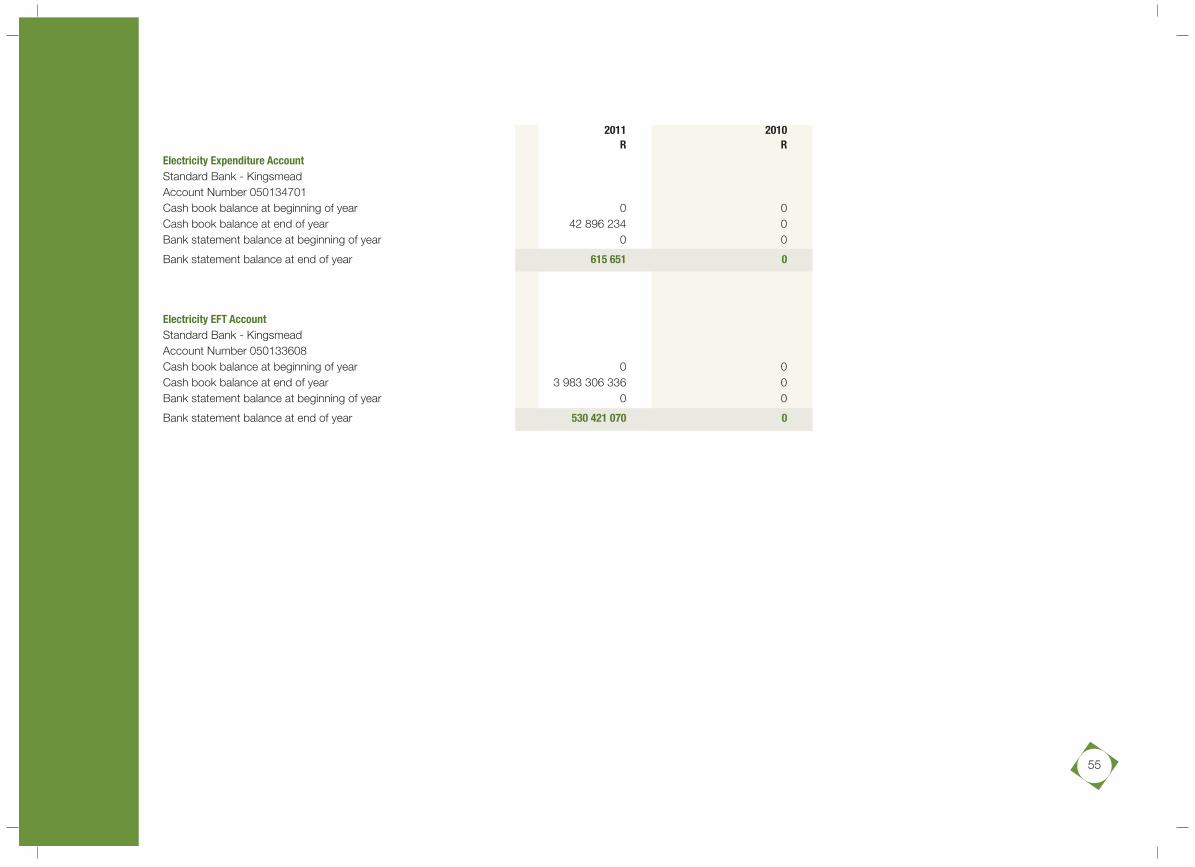
2011 2010R R
Electricity Expenditure AccountStandard Bank - Kingsmead Account Number 050134701Cash book balance at beginning of year 0 0Cash book balance at end of year 42 896 234 0Bank statement balance at beginning of year 0 0
Bank statement balance at end of year 615 651 0
Electricity EFT AccountStandard Bank - Kingsmead Account Number 050133608Cash book balance at beginning of year 0 0Cash book balance at end of year 3 983 306 336 0Bank statement balance at beginning of year 0 0
Bank statement balance at end of year 530 421 070 0
55
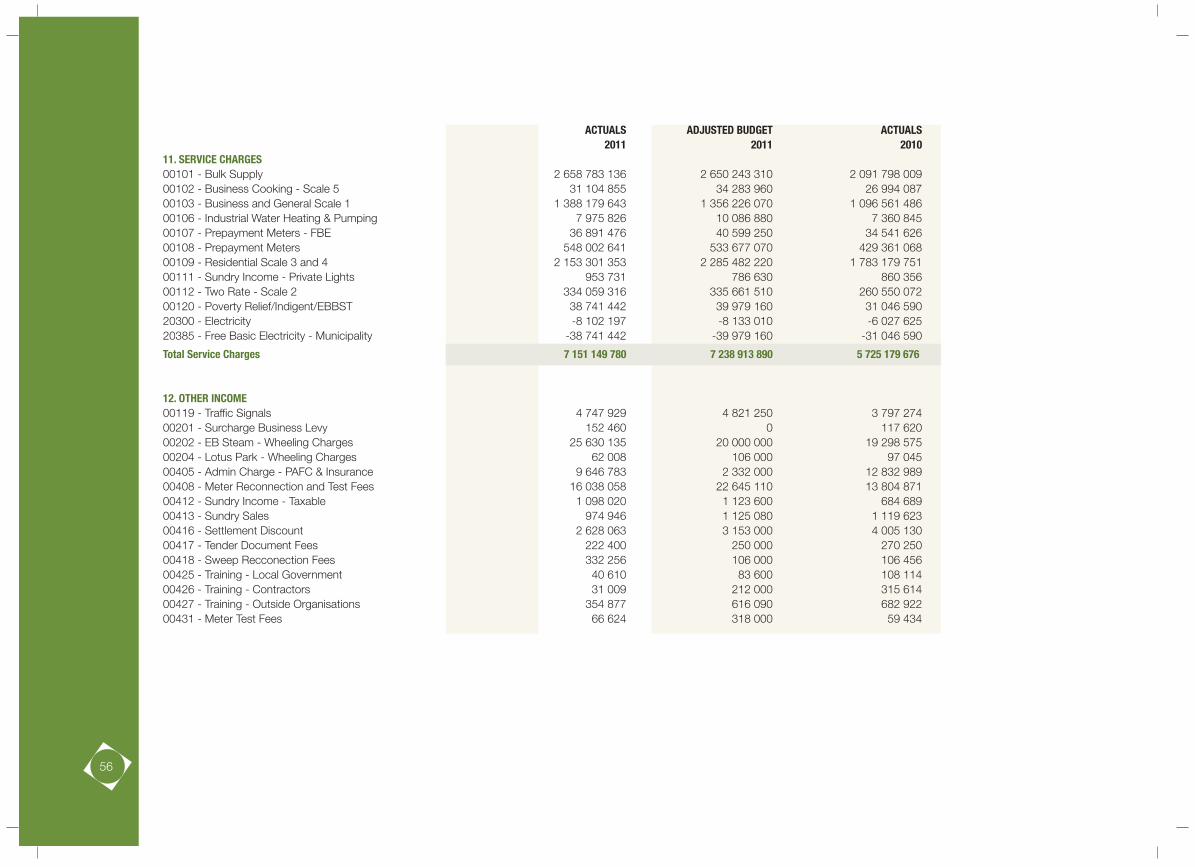
ACTUALS ADJUSTED BUDGET ACTUALS2011 2011 2010
11. SERVICE CHARGES00101 - Bulk Supply 2 658 783 136 2 650 243 310 2 091 798 00900102 - Business Cooking - Scale 5 31 104 855 34 283 960 26 994 08700103 - Business and General Scale 1 1 388 179 643 1 356 226 070 1 096 561 48600106 - Industrial Water Heating & Pumping 7 975 826 10 086 880 7 360 84500107 - Prepayment Meters - FBE 36 891 476 40 599 250 34 541 62600108 - Prepayment Meters 548 002 641 533 677 070 429 361 06800109 - Residential Scale 3 and 4 2 153 301 353 2 285 482 220 1 783 179 75100111 - Sundry Income - Private Lights 953 731 786 630 860 35600112 - Two Rate - Scale 2 334 059 316 335 661 510 260 550 07200120 - Poverty Relief/Indigent/EBBST 38 741 442 39 979 160 31 046 59020300 - Electricity -8 102 197 -8 133 010 -6 027 62520385 - Free Basic Electricity - Municipality -38 741 442 -39 979 160 -31 046 590
Total Service Charges 7 151 149 780 7 238 913 890 5 725 179 676
12. OTHER INCOME00119 - Traffic Signals 4 747 929 4 821 250 3 797 27400201 - Surcharge Business Levy 152 460 0 117 62000202 - EB Steam - Wheeling Charges 25 630 135 20 000 000 19 298 57500204 - Lotus Park - Wheeling Charges 62 008 106 000 97 04500405 - Admin Charge - PAFC & Insurance 9 646 783 2 332 000 12 832 98900408 - Meter Reconnection and Test Fees 16 038 058 22 645 110 13 804 87100412 - Sundry Income - Taxable 1 098 020 1 123 600 684 68900413 - Sundry Sales 974 946 1 125 080 1 119 62300416 - Settlement Discount 2 628 063 3 153 000 4 005 13000417 - Tender Document Fees 222 400 250 000 270 25000418 - Sweep Recconection Fees 332 256 106 000 106 45600425 - Training - Local Government 40 610 83 600 108 11400426 - Training - Contractors 31 009 212 000 315 61400427 - Training - Outside Organisations 354 877 616 090 682 92200431 - Meter Test Fees 66 624 318 000 59 434
56

ACTUALS ADJUSTED BUDGET ACTUALS2011 2011 2010
00434 - Promotional Items 1 003 0 1 93500435 - Proceeds from Insurance - Operating 27 512 276 18 000 000 39 723 06000455 - Rural Electrification Project 1 564 481 1 700 000 000506 - Prepayment Connection Fess 8 545 459 16 000 000 6 327 23100507 - Conventional Connection Fees 42 878 795 25 000 000 40 889 89700508 - Proceeds from Insurance - Capital 11 484 032 13 000 000 24 625 275Total Other Income 154 012 224 130 591 730 168 868 005
13. GOVERNMENT GRANTS AND SUBSIDIES00121 - Municipal Infrastructure Grant 0 0 000122 - Electrification Programme - D.M.E 0 0 000123 - Equitable Share 0 0 000500 - Capital Grant - MIG 5 000 000 5 000 000 000501 - Capital Grant - Demandside Management 0 25 000 000 000502 - Capital Grant - Equit Share 43 214 749 43 214 740 47 568 73600503 - Capital Grant - Electr. Prog 35 000 000 35 000 000 47 800 00000509 - Capital Grant - DANIDA Project 5 545 117 0 0Total Government Grants and Subsidies 88 759 866 108 214 740 95 368 736
13.1 M.I.G. GrantBalance unspent at beginning of year 0 0Current years receipts 5 000 000 5 000 000Conditions met - transferred to revenue -5 000 000 -5 000 000Conditions still to be met - transferred to liabilities 0 013.2 Electrification Programme - D.M.EBalance unspent at beginning of year 0 0Current years receipts 35 000 000 35 000 000Conditions met - transferred to revenue -35 000 000 -35 000 000Conditions still to be met - transferred to liabilities 0 013.3 Equitable ShareBalance unspent at beginning of year 0 0Current years receipts 43 214 749 43 214 749Conditions met - transferred to revenue -43 214 749 -43 214 749Conditions still to be met - transferred to liabilities 0 013.4 DANIDA GrantBalance unspent at beginning of year 0 0Current years receipts 5 545 117 0Conditions met - transferred to revenue -5 545 117 0Conditions still to be met - transferred to liabilities 0 0
57
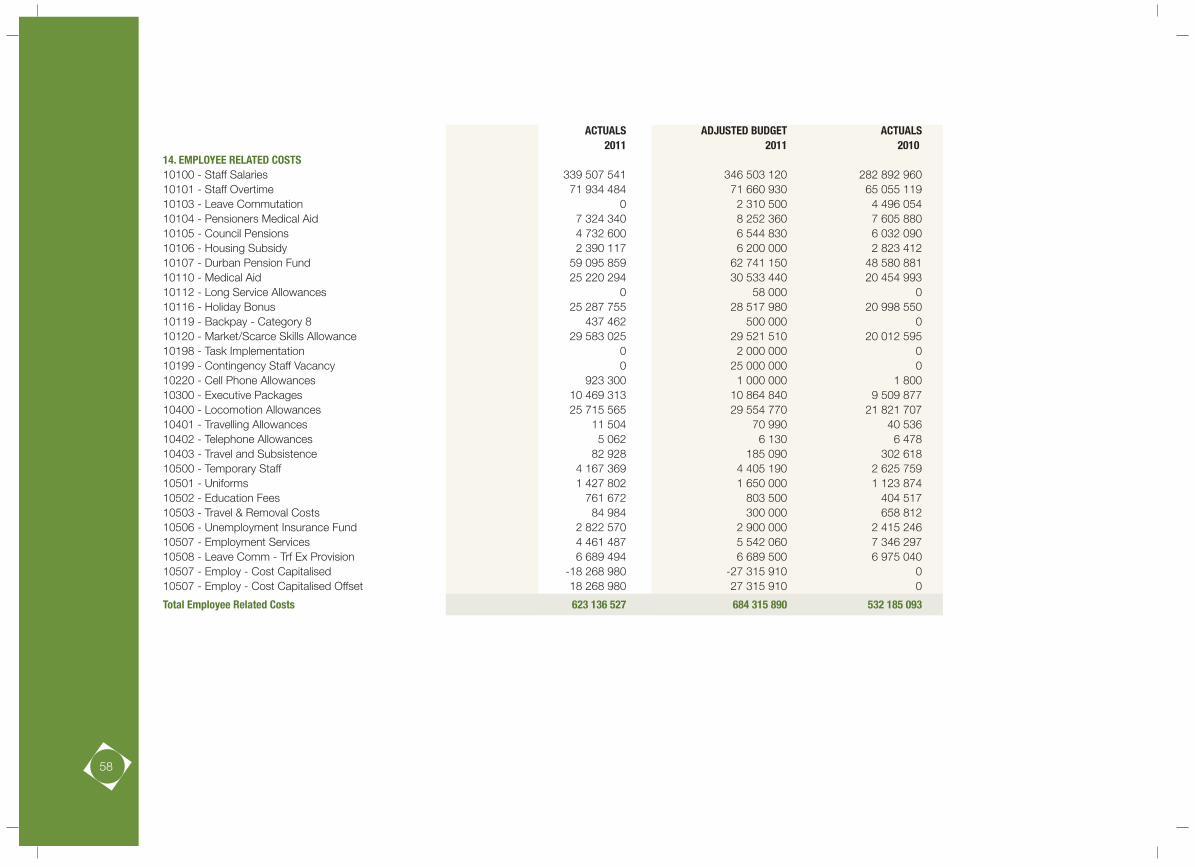
ACTUALS ADJUSTED BUDGET ACTUALS2011 2011 2010
14. EMPLOYEE RELATED COSTS10100 - Staff Salaries 339 507 541 346 503 120 282 892 96010101 - Staff Overtime 71 934 484 71 660 930 65 055 11910103 - Leave Commutation 0 2 310 500 4 496 05410104 - Pensioners Medical Aid 7 324 340 8 252 360 7 605 88010105 - Council Pensions 4 732 600 6 544 830 6 032 09010106 - Housing Subsidy 2 390 117 6 200 000 2 823 41210107 - Durban Pension Fund 59 095 859 62 741 150 48 580 88110110 - Medical Aid 25 220 294 30 533 440 20 454 99310112 - Long Service Allowances 0 58 000 010116 - Holiday Bonus 25 287 755 28 517 980 20 998 55010119 - Backpay - Category 8 437 462 500 000 010120 - Market/Scarce Skills Allowance 29 583 025 29 521 510 20 012 59510198 - Task Implementation 0 2 000 000 010199 - Contingency Staff Vacancy 0 25 000 000 010220 - Cell Phone Allowances 923 300 1 000 000 1 80010300 - Executive Packages 10 469 313 10 864 840 9 509 87710400 - Locomotion Allowances 25 715 565 29 554 770 21 821 70710401 - Travelling Allowances 11 504 70 990 40 53610402 - Telephone Allowances 5 062 6 130 6 47810403 - Travel and Subsistence 82 928 185 090 302 61810500 - Temporary Staff 4 167 369 4 405 190 2 625 75910501 - Uniforms 1 427 802 1 650 000 1 123 87410502 - Education Fees 761 672 803 500 404 51710503 - Travel & Removal Costs 84 984 300 000 658 81210506 - Unemployment Insurance Fund 2 822 570 2 900 000 2 415 24610507 - Employment Services 4 461 487 5 542 060 7 346 29710508 - Leave Comm - Trf Ex Provision 6 689 494 6 689 500 6 975 04010507 - Employ - Cost Capitalised -18 268 980 -27 315 910 010507 - Employ - Cost Capitalised Offset 18 268 980 27 315 910 0
Total Employee Related Costs 623 136 527 684 315 890 532 185 093
58
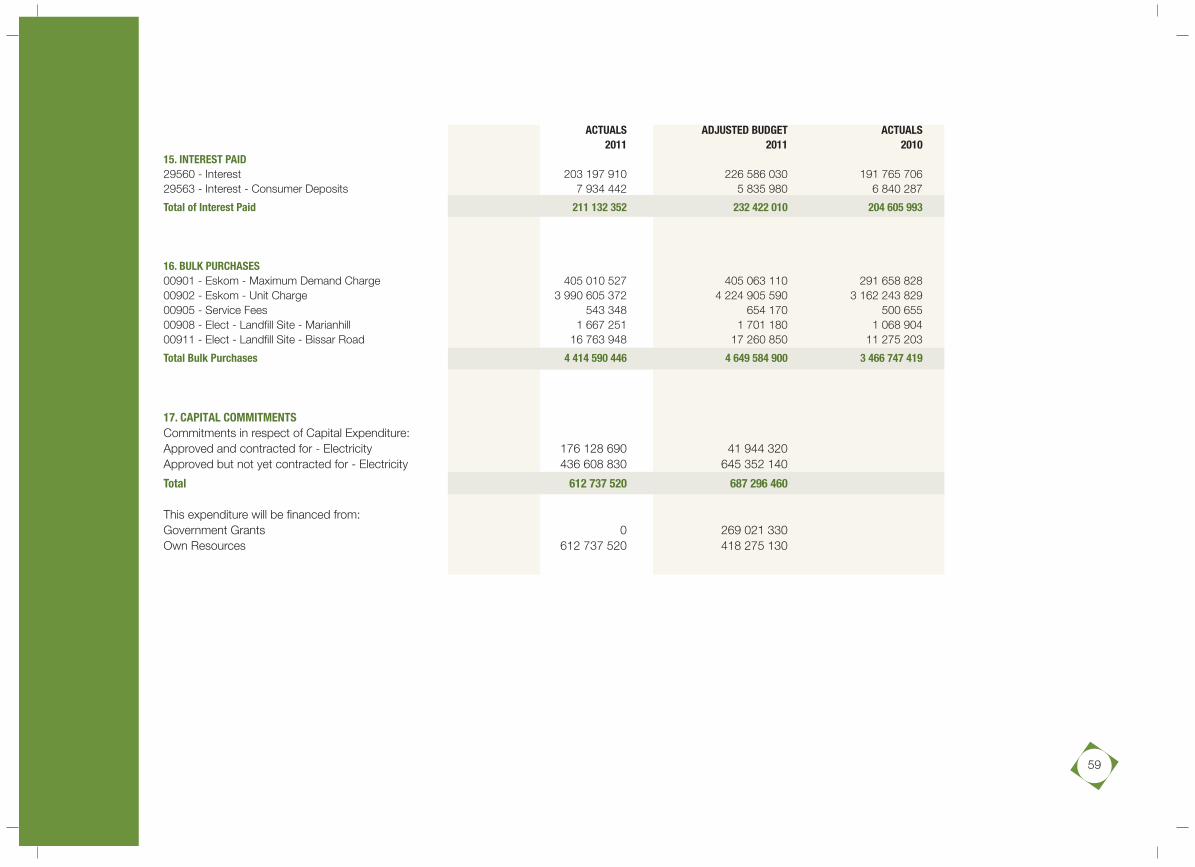
ACTUALS ADJUSTED BUDGET ACTUALS2011 2011 2010
15. INTEREST PAID29560 - Interest 203 197 910 226 586 030 191 765 70629563 - Interest - Consumer Deposits 7 934 442 5 835 980 6 840 287
Total of Interest Paid 211 132 352 232 422 010 204 605 993
16. BULK PURCHASES00901 - Eskom - Maximum Demand Charge 405 010 527 405 063 110 291 658 82800902 - Eskom - Unit Charge 3 990 605 372 4 224 905 590 3 162 243 82900905 - Service Fees 543 348 654 170 500 65500908 - Elect - Landfill Site - Marianhill 1 667 251 1 701 180 1 068 90400911 - Elect - Landfill Site - Bissar Road 16 763 948 17 260 850 11 275 203
Total Bulk Purchases 4 414 590 446 4 649 584 900 3 466 747 419
17. CAPITAL COMMITMENTSCommitments in respect of Capital Expenditure:Approved and contracted for - Electricity 176 128 690 41 944 320Approved but not yet contracted for - Electricity 436 608 830 645 352 140
Total 612 737 520 687 296 460
This expenditure will be financed from:Government Grants 0 269 021 330Own Resources 612 737 520 418 275 130
59
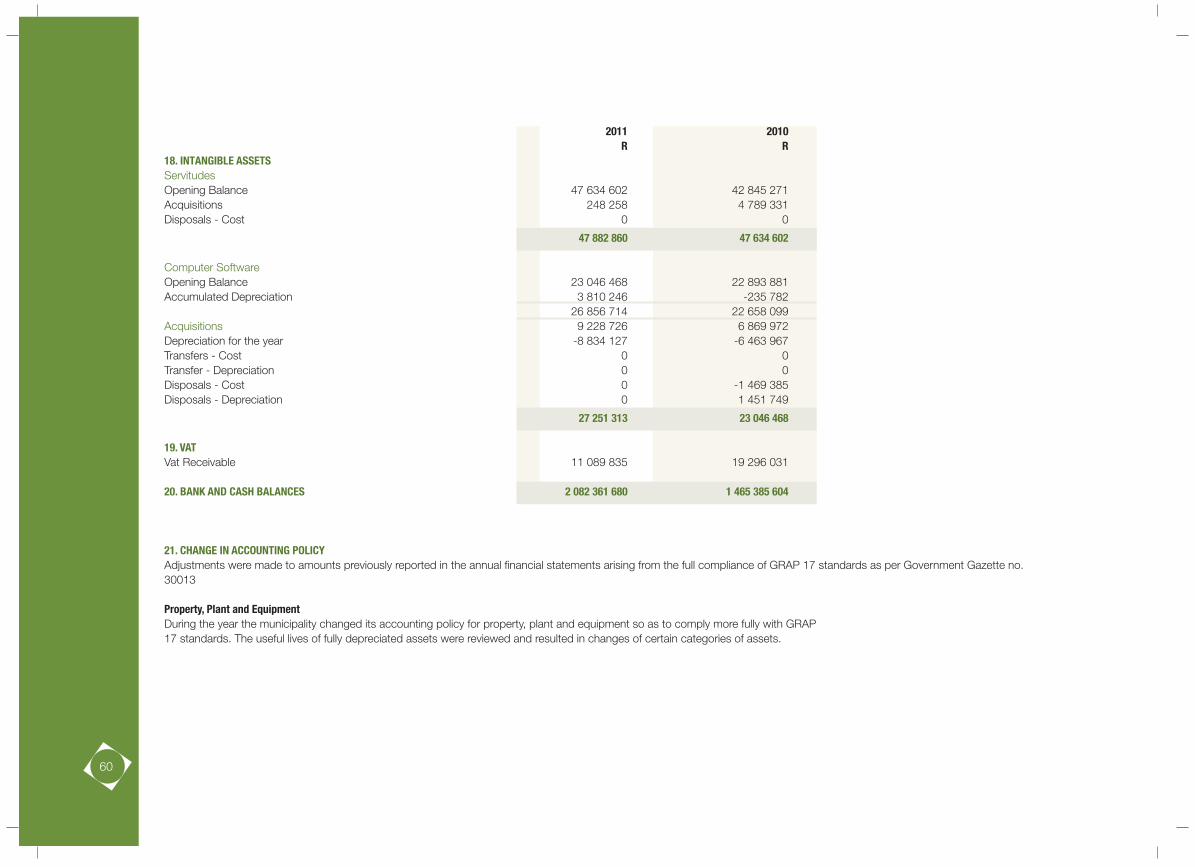
2011 2010R R
18. INTANGIBLE ASSETSServitudesOpening Balance 47 634 602 42 845 271Acquisitions 248 258 4 789 331Disposals - Cost 0 0
47 882 860 47 634 602
Computer SoftwareOpening Balance 23 046 468 22 893 881Accumulated Depreciation 3 810 246 -235 782
26 856 714 22 658 099Acquisitions 9 228 726 6 869 972Depreciation for the year -8 834 127 -6 463 967Transfers - Cost 0 0Transfer - Depreciation 0 0Disposals - Cost 0 -1 469 385Disposals - Depreciation 0 1 451 749
27 251 313 23 046 468
19. VATVat Receivable 11 089 835 19 296 031
20. BANK AND CASH BALANCES 2 082 361 680 1 465 385 604
21. CHANGE IN ACCOUNTING POLICYAdjustments were made to amounts previously reported in the annual financial statements arising from the full compliance of GRAP 17 standards as per Government Gazette no.30013
Property, Plant and EquipmentDuring the year the municipality changed its accounting policy for property, plant and equipment so as to comply more fully with GRAP17 standards. The useful lives of fully depreciated assets were reviewed and resulted in changes of certain categories of assets.
60
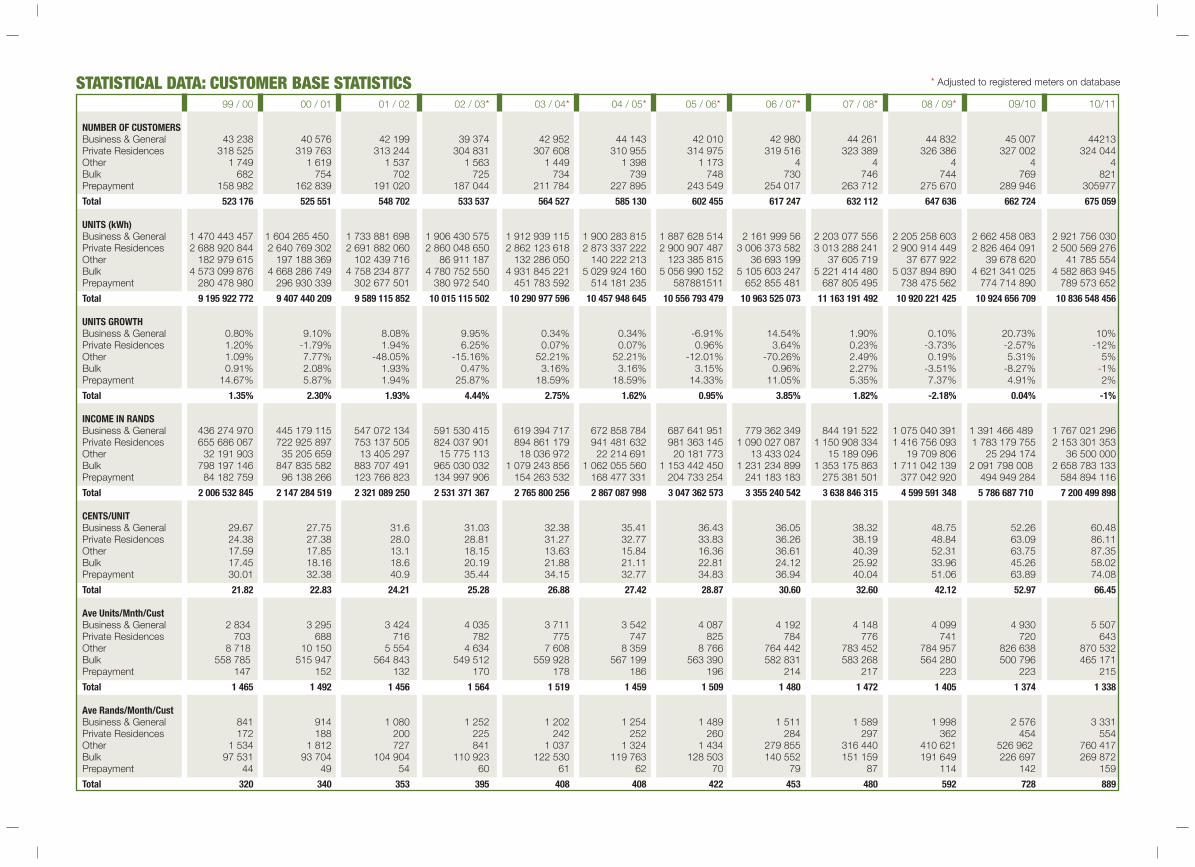
STATISTICAL DATA: CUSTOMER BASE STATISTICS * Adjusted to registered meters on database
99 / 00 00 / 01 01 / 02 02 / 03* 03 / 04* 04 / 05* 05 / 06* 06 / 07* 07 / 08* 08 / 09* 09/10 10/11
NUMBER OF CUSTOMERSBusiness & General 43 238 40 576 42 199 39 374 42 952 44 143 42 010 42 980 44 261 44 832 45 007 44213Private Residences 318 525 319 763 313 244 304 831 307 608 310 955 314 975 319 516 323 389 326 386 327 002 324 044Other 1 749 1 619 1 537 1 563 1 449 1 398 1 173 4 4 4 4 4Bulk 682 754 702 725 734 739 748 730 746 744 769 821Prepayment 158 982 162 839 191 020 187 044 211 784 227 895 243 549 254 017 263 712 275 670 289 946 305977
Total 523 176 525 551 548 702 533 537 564 527 585 130 602 455 617 247 632 112 647 636 662 724 675 059
UNITS (kWh)Business & General 1 470 443 457 1 604 265 450 1 733 881 698 1 906 430 575 1 912 939 115 1 900 283 815 1 887 628 514 2 161 999 56 2 203 077 556 2 205 258 603 2 662 458 083 2 921 756 030Private Residences 2 688 920 844 2 640 769 302 2 691 882 060 2 860 048 650 2 862 123 618 2 873 337 222 2 900 907 487 3 006 373 582 3 013 288 241 2 900 914 449 2 826 464 091 2 500 569 276Other 182 979 615 197 188 369 102 439 716 86 911 187 132 286 050 140 222 213 123 385 815 36 693 199 37 605 719 37 677 922 39 678 620 41 785 554Bulk 4 573 099 876 4 668 286 749 4 758 234 877 4 780 752 550 4 931 845 221 5 029 924 160 5 056 990 152 5 105 603 247 5 221 414 480 5 037 894 890 4 621 341 025 4 582 863 945Prepayment 280 478 980 296 930 339 302 677 501 380 972 540 451 783 592 514 181 235 587881511 652 855 481 687 805 495 738 475 562 774 714 890 789 573 652
Total 9 195 922 772 9 407 440 209 9 589 115 852 10 015 115 502 10 290 977 596 10 457 948 645 10 556 793 479 10 963 525 073 11 163 191 492 10 920 221 425 10 924 656 709 10 836 548 456
UNITS GROWTHBusiness & General 0.80% 9.10% 8.08% 9.95% 0.34% 0.34% -6.91% 14.54% 1.90% 0.10% 20.73% 10%Private Residences 1.20% -1.79% 1.94% 6.25% 0.07% 0.07% 0.96% 3.64% 0.23% -3.73% -2.57% -12%Other 1.09% 7.77% -48.05% -15.16% 52.21% 52.21% -12.01% -70.26% 2.49% 0.19% 5.31% 5%Bulk 0.91% 2.08% 1.93% 0.47% 3.16% 3.16% 3.15% 0.96% 2.27% -3.51% -8.27% -1%Prepayment 14.67% 5.87% 1.94% 25.87% 18.59% 18.59% 14.33% 11.05% 5.35% 7.37% 4.91% 2%
Total 1.35% 2.30% 1.93% 4.44% 2.75% 1.62% 0.95% 3.85% 1.82% -2.18% 0.04% -1%
INCOME IN RANDSBusiness & General 436 274 970 445 179 115 547 072 134 591 530 415 619 394 717 672 858 784 687 641 951 779 362 349 844 191 522 1 075 040 391 1 391 466 489 1 767 021 296Private Residences 655 686 067 722 925 897 753 137 505 824 037 901 894 861 179 941 481 632 981 363 145 1 090 027 087 1 150 908 334 1 416 756 093 1 783 179 755 2 153 301 353Other 32 191 903 35 205 659 13 405 297 15 775 113 18 036 972 22 214 691 20 181 773 13 433 024 15 189 096 19 709 806 25 294 174 36 500 000Bulk 798 197 146 847 835 582 883 707 491 965 030 032 1 079 243 856 1 062 055 560 1 153 442 450 1 231 234 899 1 353 175 863 1 711 042 139 2 091 798 008 2 658 783 133Prepayment 84 182 759 96 138 266 123 766 823 134 997 906 154 263 532 168 477 331 204 733 254 241 183 183 275 381 501 377 042 920 494 949 284 584 894 116
Total 2 006 532 845 2 147 284 519 2 321 089 250 2 531 371 367 2 765 800 256 2 867 087 998 3 047 362 573 3 355 240 542 3 638 846 315 4 599 591 348 5 786 687 710 7 200 499 898
CENTS/UNITBusiness & General 29.67 27.75 31.6 31.03 32.38 35.41 36.43 36.05 38.32 48.75 52.26 60.48Private Residences 24.38 27.38 28.0 28.81 31.27 32.77 33.83 36.26 38.19 48.84 63.09 86.11Other 17.59 17.85 13.1 18.15 13.63 15.84 16.36 36.61 40.39 52.31 63.75 87.35Bulk 17.45 18.16 18.6 20.19 21.88 21.11 22.81 24.12 25.92 33.96 45.26 58.02Prepayment 30.01 32.38 40.9 35.44 34.15 32.77 34.83 36.94 40.04 51.06 63.89 74.08
Total 21.82 22.83 24.21 25.28 26.88 27.42 28.87 30.60 32.60 42.12 52.97 66.45
Ave Units/Mnth/CustBusiness & General 2 834 3 295 3 424 4 035 3 711 3 542 4 087 4 192 4 148 4 099 4 930 5 507Private Residences 703 688 716 782 775 747 825 784 776 741 720 643Other 8 718 10 150 5 554 4 634 7 608 8 359 8 766 764 442 783 452 784 957 826 638 870 532Bulk 558 785 515 947 564 843 549 512 559 928 567 199 563 390 582 831 583 268 564 280 500 796 465 171Prepayment 147 152 132 170 178 186 196 214 217 223 223 215
Total 1 465 1 492 1 456 1 564 1 519 1 459 1 509 1 480 1 472 1 405 1 374 1 338
Ave Rands/Month/CustBusiness & General 841 914 1 080 1 252 1 202 1 254 1 489 1 511 1 589 1 998 2 576 3 331Private Residences 172 188 200 225 242 252 260 284 297 362 454 554Other 1 534 1 812 727 841 1 037 1 324 1 434 279 855 316 440 410 621 526 962 760 417Bulk 97 531 93 704 104 904 110 923 122 530 119 763 128 503 140 552 151 159 191 649 226 697 269 872Prepayment 44 49 54 60 61 62 70 79 87 114 142 159
Total 320 340 353 395 408 408 422 453 480 592 728 889

STATISTICAL DATA: MAXIMUM DEMAND AND ENERGY SALES PER ANNUM
# Figures now include sales and purchases for Tongaat, Mpumalanga and Magabeni.
Year MaximumkVA Percent Energy Percent Energy (kWh) Percent Percent Power factor Average monthly Number ofgrowth (kWh) sold growth purchased growth loss at system peak load factor customers
82/83 1 051 830 -2.20% 4 998 457 230 -11.14% 5 201 796 550 -13.03% 3.91% 93.00% 71.40% 205 961
83/84 1 060 522 0.83% 5 435 381 442 8.74% 5 680 986 500 9.21% 4.32% 92.00% 71.10% 214 095
84/85 1 078 638 1.71% 5 859 883 622 7.81% 6 145 270 000 8.17% 4.64% 93.00% 71.89% 223 420
85/86 1 084 951 0.59% 6 105 393 784 4.19% 6 464 060 277 5.19% 5.55% 94.00% 73.37% 228 193
86/87 1 126 872 3.86% 6 373 238 576 4.39% 6 689 247 137 3.48% 4.72% 99.60% 71.21% 237 857
87/88 1 151 613 2.20% 6 590 701 115 3.41% 6 889 777 935 3.00% 4.34% 97.20% 70.47% 245 831
88/89 1 196 636 3.91% 6 986 105 898 6.00% 7 337 830 336 6.50% 4.79% 98.40% 72.73% 252 518
89/90 1 232 618 3.01% 7 201 068 113 3.08% 7 634 669 960 4.05% 5.68% 100.00% 72.92% 284 661
90/91 1 268 538 2.91% 7 426 490 766 3.13% 7 697 377 076 0.82% 3.52% 100.00% 73.87% 290 070
91/92 1 286 335 1.40% 7 548 660 345 1.65% 7 928 532 199 3.00% 4.79% 97.50% 72.90% 299 948
92/93 1 313 385 2.10% 7 688 164 852 1.85% 8 145 319 531 2.73% 5.61% 100.00% 70.80% 329 969
93/94 1 383 431 5.33% 8 047 317 773 4.67% 8 494 913 446 4.29% 5.27% 99.90% 72.80% 359 516
94/95 1 426 277 3.10% 8 202 460 186 1.93% 8 738 907 153 2.87% 6.14% 99.90% 72.90% 386 361
95/96 1 469 256 3.01% 8 419 518 677 2.65% 9 021 770 028 3.24% 6.68% 99.90% 73.46% 428 035
96/97 1 585 122 7.89% 8 941 330 717 6.20% 9 571 358 173 6.09% 6.58% 99.90% 74.37% 451 751
97/98 # 1 585 060 0.00% 9 183 151 356 2.70% 9 813 695 486 2.53% 6.43% 99.90% 76.26% 477 416
98/99 # 1 601 635 1.05% 9 073 412 900 -1.19% 9 851 495 987 0.39% 7.90% 99.90% 76.55% 505 501
99/00 # 1 572 339 -1.83% 9 195 922 772 1.35% 9 956 607 592 1.07% 7.64% 98.60% 77.37% 523 176
00/01 # 1 592 211 1.26% 9 407 440 209 2.30% 10 105 748 000 1.50% 6.91% 98.60% 78.52% 525 551
01/02 # 1 610 173 1.13% 9 589 115 852 1.93% 10 224 641 034 1.18% 6.22% 98.10% 79.45% 548 702
02/03 # 1 650 089 2.48% 10 015 115 502 4.44% 10 552 641 000 3.21% 5.09% 98.00% 78.49% 533 527
03/04 # 1 667 942 1.08% 10 290 977 595 2.75% 10 803 947 948 2.38% 4.75% 99.90% 74.15% 564 527
04/05 # 1 765 855 5.87% 10 457 948 645 1.62% 11 053 953 456 2.31% 5.39% 99.80% 76.53% 585 130
05/06 # 1 783 038 0.97% 10 556 793 479 0.95% 11 186 048 110 1.19% 5.63% 99.90% 72.75% 602 455
06/07 # 1 857 178 4.16% 10 963 525 073 3.85% 11 580 771 534 3.53% 5.33% 98.13% 73.98% 617 247
07/08 # 1 890 043 1.77% 11 163 191 492 1.82% 11 751 787 312 1.48% 5.01% 97.27% 75.90% 632 112
08 / 09 # 1 897 005 0.37% 10 920 221 425 -2.18% 11 504 658 024 -2.10% 5.08% 95.65% 74.42% 647 636
09 / 10 1 812 881 -4.43% 10 924 565 709 0.04% 11 495 870 884 -0.08% 5.00% 95.57% 74.24% 662 727
10 / 11 1 817 870 0.28% 10 836 548 456 -0.81% 11 467 431 990 -0.25% 5.50% 95.46% 75.00% 675 059

ITEM OF EXPENDITURE 99/00 00/01 01/02 02/03 03/04 04/05 05/06 06/07 07/08 08/09 09/10 10/11
DISTRIBUTION and Admin
Admin and general 295 184 635 309 775 667 340 287 001 384 858 119 424 125 981 468 674 230 624 140 246 766 654 479 844 540 463 1 068 195 348 1 172 269 797 1 272 836 749
Distribution 159 970 654 178 709 812 203 666 642 217 681 180 231 773 520 237 287 044 248 674 868 258 564 682 351 321 008 391 069 539 536 667 113 548 069 997
Sub Total 455 155 289 488 485 479 543 953 643 602 539 299 655 899 501 705 961 274 872 815 114 1 025 219 161 1 195 861 471 1 459 264 887 1 708 936 910 1 820 906 746
% increase 2% 7% 11% 11% 9% 8% 24% 17% 17% 22% 17.1% 6.6%
% of total expenditure 22% 22% 24% 24% 24% 24% 27% 28% 29% 29% 27.3% 23.8%
FUNDS
Capital Development 0 0 0 0 0 0 0 0 0 0 0 0
Rates and Genaral 117 609 509 127 863 067 136 554 095 147 832 718 157 905 047 169 912 469 189 162 190 357 509 683 477 063 733 395 876 280 448 205 520 498 760 834
Working Capital 26 356 120 51 263 120 11 688 488 99 076 208 121 334 894 149 687 274 90 000 000 258 235 673 290 856 887 413 521 565 247 377 149 721 389 400
Durban Metro 0 0 0 0 0 0 181 914 287 0 0 0 0 0
Sub-Total 143 965 629 179 126 187 148 242 583 246 908 926 279 239 941 319 599 743 461 076 477 615 745 356 767 920 620 809 397 845 875 582 669 1 220 150 234
% increase -1% 24% -17% 67% 13% 14% 44% 34% 25% 5% 8.2% 39.4%
% of total expenditure 7% 8% 6% 10% 10% 11% 14% 17% 19% 16% 14.0% 15.9%
LOAN CHARGES
Sub-Total 318 036 375 325 115 264 320 336 624 273 858 000 315 325 905 316 056 450 R0* 0 0 0 0 0
% increase 0% 2% -1% -15% 15% 0% 0% -22% -9% 17% 12.2% 3.2%
% of total expenditure 15% 15% 14% 11% 11% 11% 0% 5% 4% 4% 3.3% 2.8%
Interest Paid 0 0 0 0 0 0 218 808 794 171 542 017 156 036 300 182 419 882 204 605 993 211 132 352
ELECTRICITY PURCHASED
Energy 968 823 865 1 011 443 391 1 093 769 108 1 234 592 321 1 328 370 998 1 348 184 097 1 376 760 971 1 531 383 275 1 637 026 628 2 196 144 780 3 175 088 591 4 009 579 919
Demand 176 737 637 184 242 277 196 929 985 173 807 591 201 826 269 256 148 581 268 764 753 296 218 910 324 328 379 444 662 350 291 658 828 405 010 527
Sub-Total 1 145 561 502 1 195 685 668 1 290 699 093 1 408 399 912 1 530 197 267 1 604 332 678 1 645 525 724 1 827 602 185 1 961 355 007 2 640 807 130 3 466 747 419 4 414 590 446
% increase 5% 4% 8% 9% 9% 5% 3% 11% 7% 35% 31.3% 27.3%
% of total expenditure 56% 55% 56% 56% 55% 54% 51% 50% 48% 52% 55.4% 57.6%
TOTAL
Total Amount 2 062 718 795 2 188 412 598 2 303 231 943 2 531 706 137 2 780 662 614 2 945 950 145 3 198 226 109 3 640 108 719 4 081 173 398 5 091 889 744 6 255 872 991 7 666 779 778
% increase 3% 6% 5% 10% 10% 6% 9% 14% 12% 25% 22.9% 22.6%
STATISTICAL DATA: EXPENDITURE PER ANNUMNOTE: Ratios of Admin and General Distribution have varied as a result of restructuring