Embed Size (px)
Citation preview
Karl Rexer, PhD President Rexer Analytics
www.RexerAnalytics.com
2010 Data Miner Survey Highlights … The Views of 735 Data Miners
Predictive Analytics World Washington, DC October 2010
© 2010 Rexer Analytics 2
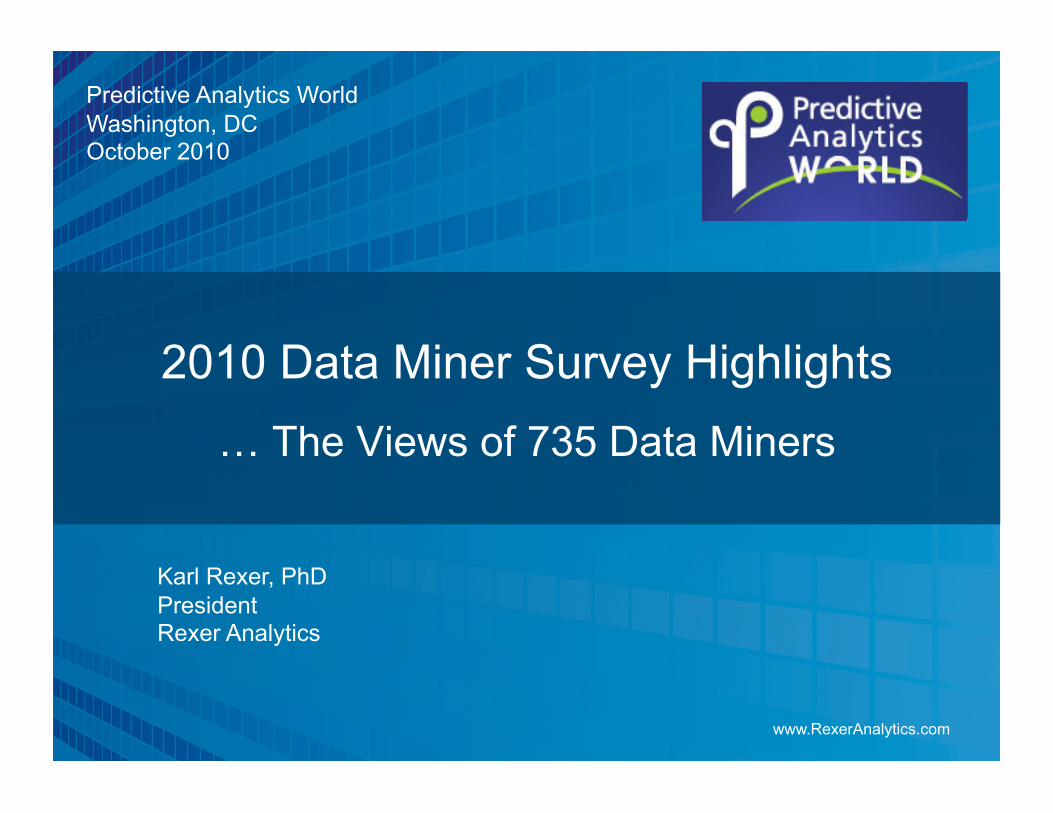
2010 Data Miner Survey: Overview
• Fourth annual survey
• 47 questions
• 10,000+ invitations emailed plus newsgroups, vendors, and snowball referrals
• Respondents: 735 data miners from 60 countries
33%
31%
12%
5%
19%
Corporate
Consultants
Note: Data from tool vendors was excluded from many analyses
Academics
NGO / Gov’t
Vendors
45%
36%
12% North America
• USA 40% • Canada 4%
Europe • Germany 7% • UK 5% • France 4% • Poland 4%
Asia Pacific • India 4% • Australia 3% • China 2%
Central & South America (4%)
• Columbia 2% • Brazil 1%
Middle East & Africa (3%) • Israel 1% • Turkey 1%
© 2010 Rexer Analytics 3
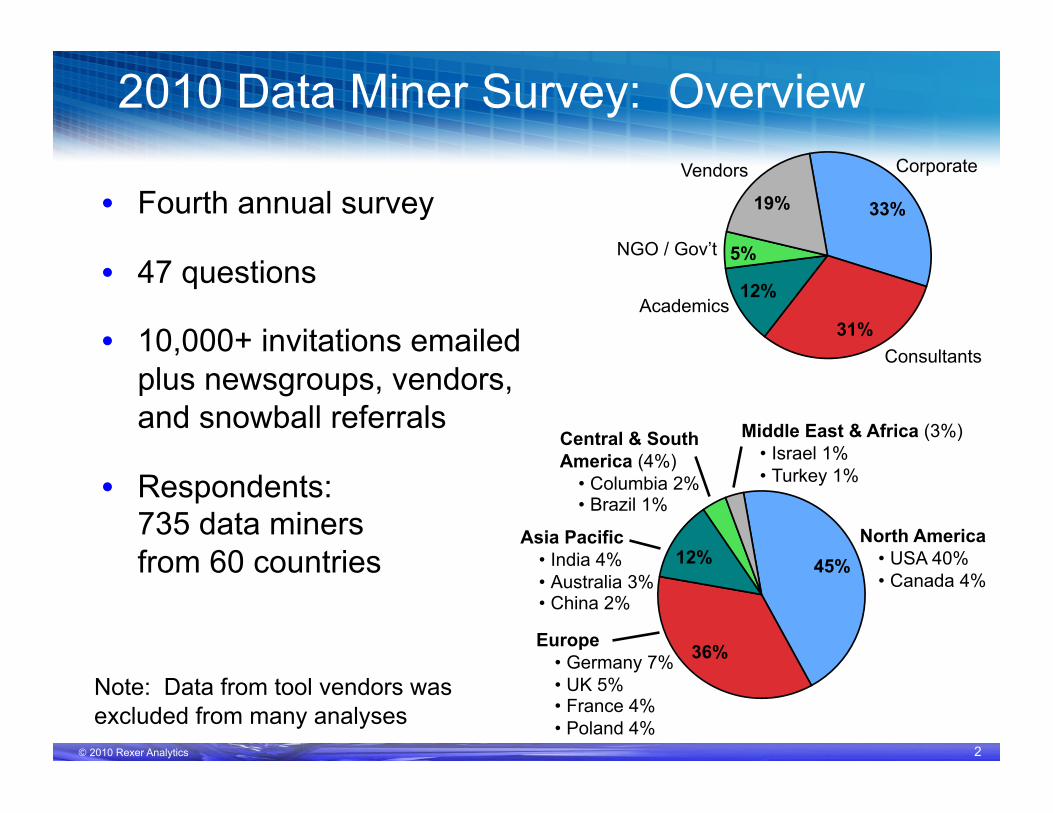
10%
10%
10%
11%
13%
13%
14%
15%
15%
25%
29%
41%
0% 10% 20% 30% 40% 50%
Government
Internet-based
Manufacturing
Medical
Technology
Pharmaceutical
Retail
Telecommunications
Insurance
Academic
Financial
CRM / Marketing
Fields Applying Data Mining
Question: In what fields do you TYPICALLY apply data mining? (Select all that apply)
• CRM / Marketing, Financial and Academic are the most commonly reported fields. This has been consistent since the 2007 survey. – Many data miners work in several fields.

© 2010 Rexer Analytics 4
8%
9%
9%
11%
12%
13%
14%
16%
21%
21%
22%
25%
26%
27%
31%
32%
60%
68%
69%
0% 10% 20% 30% 40% 50% 60% 70%
MARS Uplift Modeling
Link Analysis Genetic Algorithms
Social Network Analysis Rule Induction
Survival Analysis Anomoly Detection
Bayesian Support Vector
Machines
Ensemble Models Association Rules
Text Mining Factor Analysis
Neural Nets Time Series
Cluster Analysis Regression
Decision Trees
Data Mining Algorithms • Decision trees, regression, and cluster analysis continue to form a triad of core
algorithms for most data miners. This is very consistent, year to year. • However, a wide variety of algorithms are being used.
Question: What algorithms/analytic methods do you TYPICALLY use? (Select all that apply)
Corporate Consultants Academic NGO / Gov’t
10% 12% 4% 5%
Ensemble Models
Uplift Modeling
Corporate Consultants Academic NGO / Gov’t
21% 27% 20% 18%
© 2010 Rexer Analytics 5
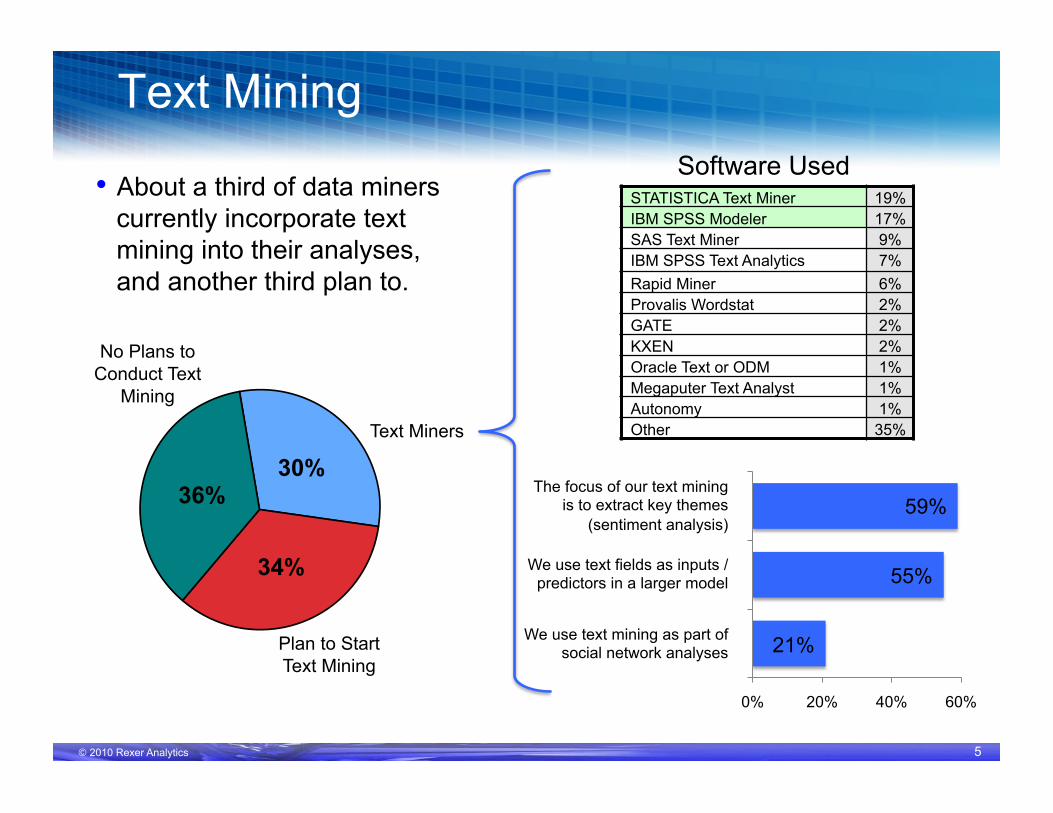
Text Mining
STATISTICA Text Miner 19% IBM SPSS Modeler 17% SAS Text Miner 9% IBM SPSS Text Analytics 7% Rapid Miner 6% Provalis Wordstat 2% GATE 2% KXEN 2% Oracle Text or ODM 1% Megaputer Text Analyst 1% Autonomy 1% Other 35% Text Miners
• About a third of data miners currently incorporate text mining into their analyses, and another third plan to.
Software Used
Plan to Start Text Mining
No Plans to Conduct Text
Mining
0% 20% 40% 60%
The focus of our text mining is to extract key themes
(sentiment analysis)
We use text fields as inputs / predictors in a larger model
We use text mining as part of social network analyses
30%
34%
36%
55%
59%
21%

© 2010 Rexer Analytics 6
35%
24%
49%
39%
26%
18%
7%
0% 60%
Computing Environments • A lot of data mining happens on desktop and laptop computers. • Frequently the data and processing is local
(not on servers, mainframe or cloud). • Only a small minority of data mining is on the cloud.
Question: What are the computing environments/platforms on which data mining/analytics occurs at your company/organization? (Check all that apply)
Cor
pora
te
Con
sulta
nt
Aca
dem
ic
NG
O /
Gov
’t
Vend
or
5% 10% 7% 3% 14%
20% 16% 14% 32% 26%
28% 30% 19% 29% 45%
48% 36% 25% 47% 39%
43% 49% 58% 58% 35%
29% 24% 15% 32% 37%
28% 36% 46% 42% 44%
Cloud Computing
Centralized Mainframe/Server
Local Server
Desktop PC/Workstation (with data & processing on server, mainframe or cloud)
Desktop PC/Workstation (with data & processing locally)
Laptop PC (with data & processing on server, mainframe or cloud)
Laptop PC (with data & processing locally)
Overall

© 2010 Rexer Analytics 7
Analytic Capability & Data Quality
• Analytic capability: – There’s room to improve if we’re going to “Compete on Analytics”.
Data Quality Question: How do you rate the quality of data available for analysis at your company/organization?
• Data quality: – 48% rate it “strong” or “very strong” (same as last year) – 16% rate it “poor” or “very poor” (13% last year)
Analytic Capability Question: How do you rate the analytic capabilities of your company/organization?
13% 35% 30% 20%
8% 40% 35% 13%
© 2010 Rexer Analytics 8
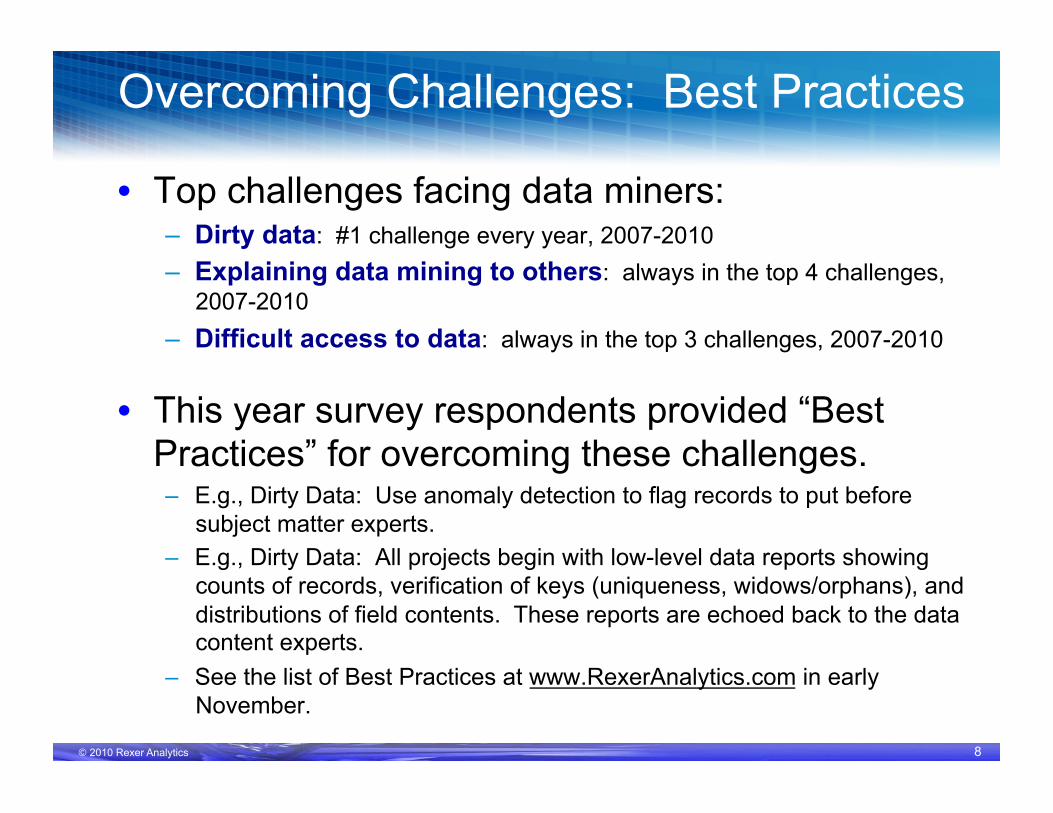
Overcoming Challenges: Best Practices
• Top challenges facing data miners: – Dirty data: #1 challenge every year, 2007-2010 – Explaining data mining to others: always in the top 4 challenges,
2007-2010 – Difficult access to data: always in the top 3 challenges, 2007-2010
• This year survey respondents provided “Best Practices” for overcoming these challenges. – E.g., Dirty Data: Use anomaly detection to flag records to put before
subject matter experts. – E.g., Dirty Data: All projects begin with low-level data reports showing
counts of records, verification of keys (uniqueness, widows/orphans), and distributions of field contents. These reports are echoed back to the data content experts.
– See the list of Best Practices at www.RexerAnalytics.com in early November.
© 2010 Rexer Analytics 9
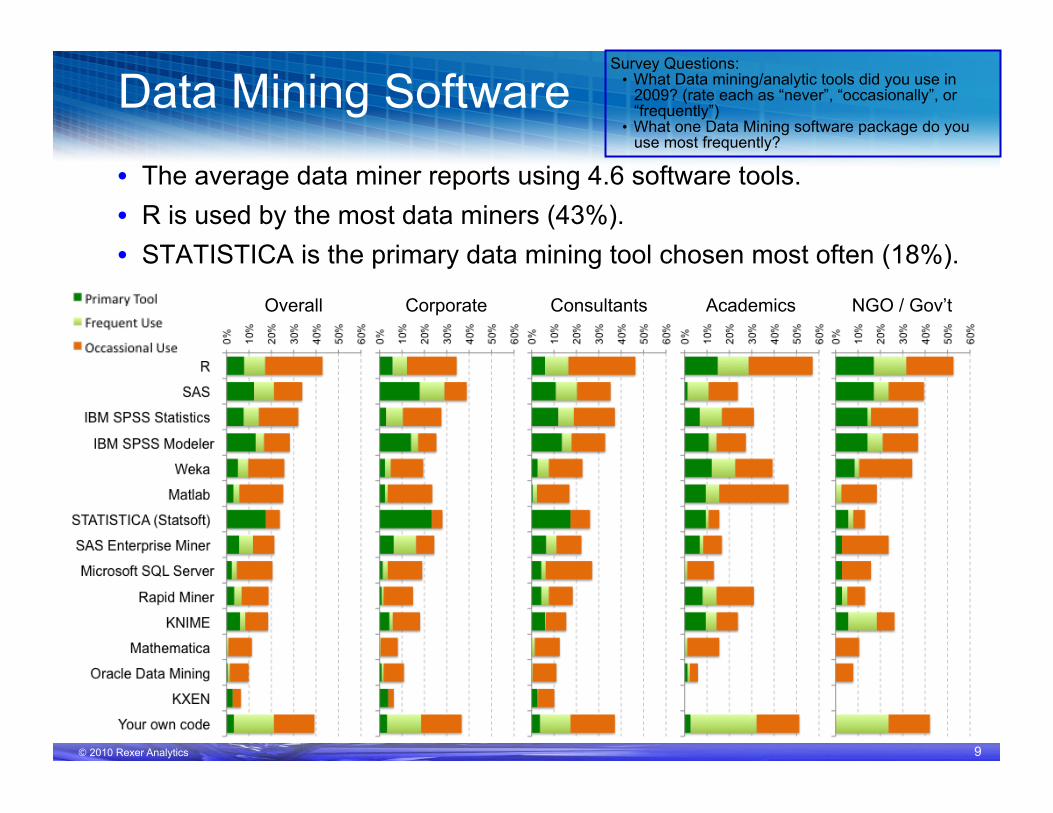
Data Mining Software Survey Questions:
• What Data mining/analytic tools did you use in 2009? (rate each as “never”, “occasionally”, or “frequently”)
• What one Data Mining software package do you use most frequently?
Overall Corporate Consultants Academics NGO / Gov’t
• The average data miner reports using 4.6 software tools. • R is used by the most data miners (43%). • STATISTICA is the primary data mining tool chosen most often (18%).
© 2010 Rexer Analytics 10
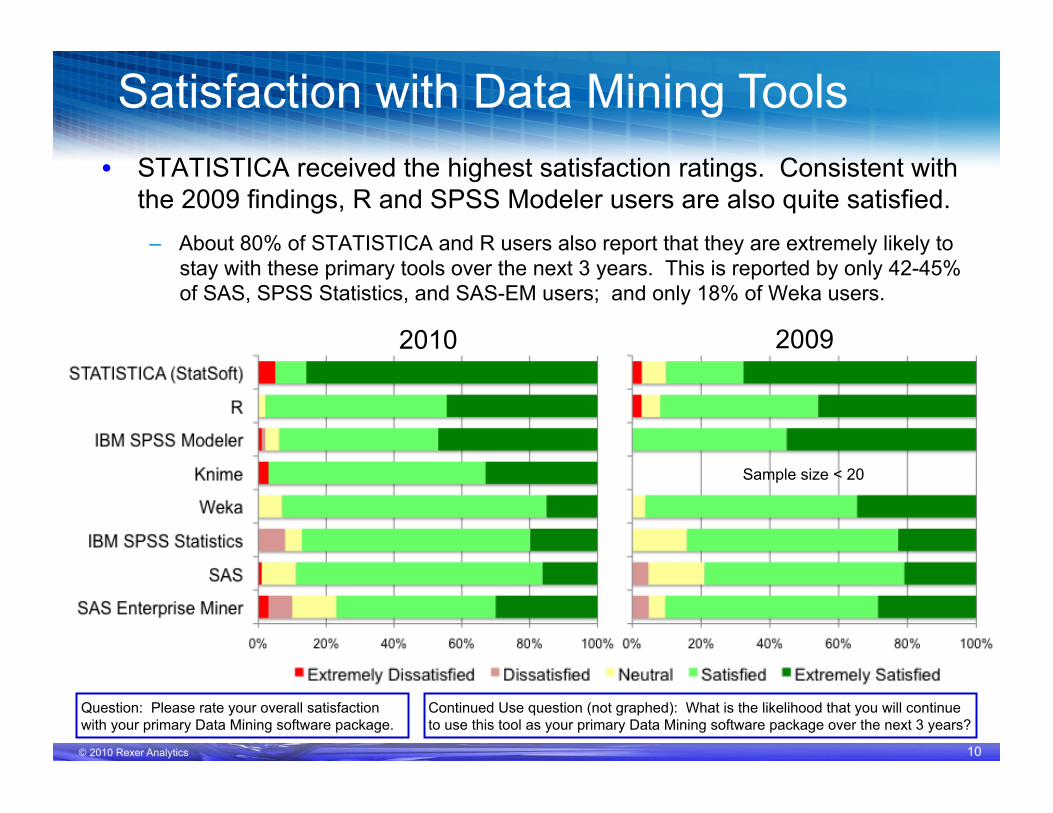
Satisfaction with Data Mining Tools
Question: Please rate your overall satisfaction with your primary Data Mining software package.
2010 2009
Sample size < 20
• STATISTICA received the highest satisfaction ratings. Consistent with the 2009 findings, R and SPSS Modeler users are also quite satisfied.
– About 80% of STATISTICA and R users also report that they are extremely likely to stay with these primary tools over the next 3 years. This is reported by only 42-45% of SAS, SPSS Statistics, and SAS-EM users; and only 18% of Weka users.
Continued Use question (not graphed): What is the likelihood that you will continue to use this tool as your primary Data Mining software package over the next 3 years?

© 2010 Rexer Analytics 11
Data Mining and the Economy
Question: How will the number of data mining projects your organization conducts in 2010 compare to what has been typical in the past few years?
There is a strong market for data mining: • 73% of data miners foresee increases in the number of data mining projects. • Offshoring of data mining is also increasing: It is reported by 14% of data
miners this year (8% last year).
Offshoring Question (not graphed): Has your company moved any data mining or other analytics to another country to take advantage of lower wages in the destination country?
Number of Data Mining Projects in 2010
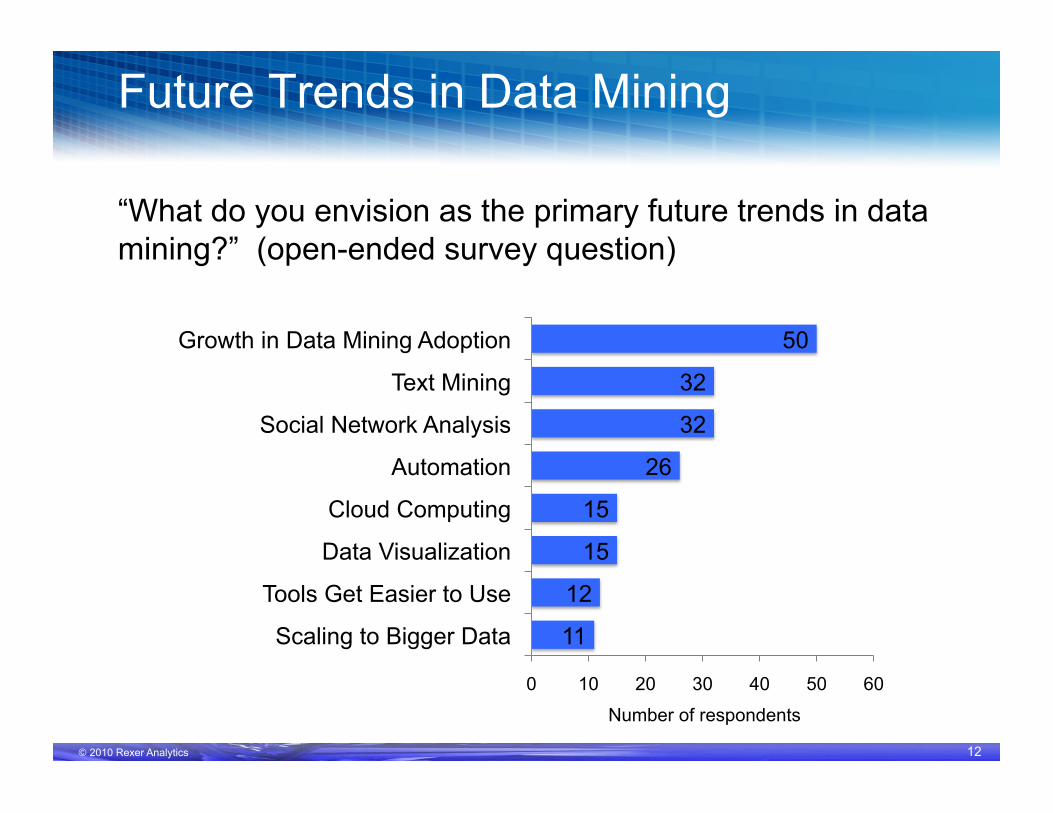
© 2010 Rexer Analytics 12
Number of respondents
“What do you envision as the primary future trends in data mining?” (open-ended survey question)
Future Trends in Data Mining
50
32
32
26
15
15
12
11
0 10 20 30 40 50 60
Growth in Data Mining Adoption
Text Mining
Social Network Analysis
Automation
Cloud Computing
Data Visualization
Tools Get Easier to Use
Scaling to Bigger Data
© 2010 Rexer Analytics 13
How to Get More Information
• Questions? – Talk with me at PAW – Call or email me if you don’t see me in the hallways
• Copy of these slides – Available now
• 2010 Data Miner Survey Summary Report (Free) – Available in early November – Available at PAW website or email me
• Best Practices for overcoming data mining challenges – Available in early November at
www.RexerAnalytics.com Karl Rexer, PhD [email protected] www.RexerAnalytics.com 617-233-8185