Embed Size (px)
DESCRIPTION
Quarterly Report
Citation preview
Third Quarter ResultsSeptember 30, 2010
SUMMARY OFFINANCIAL & OPERATING RESULTS
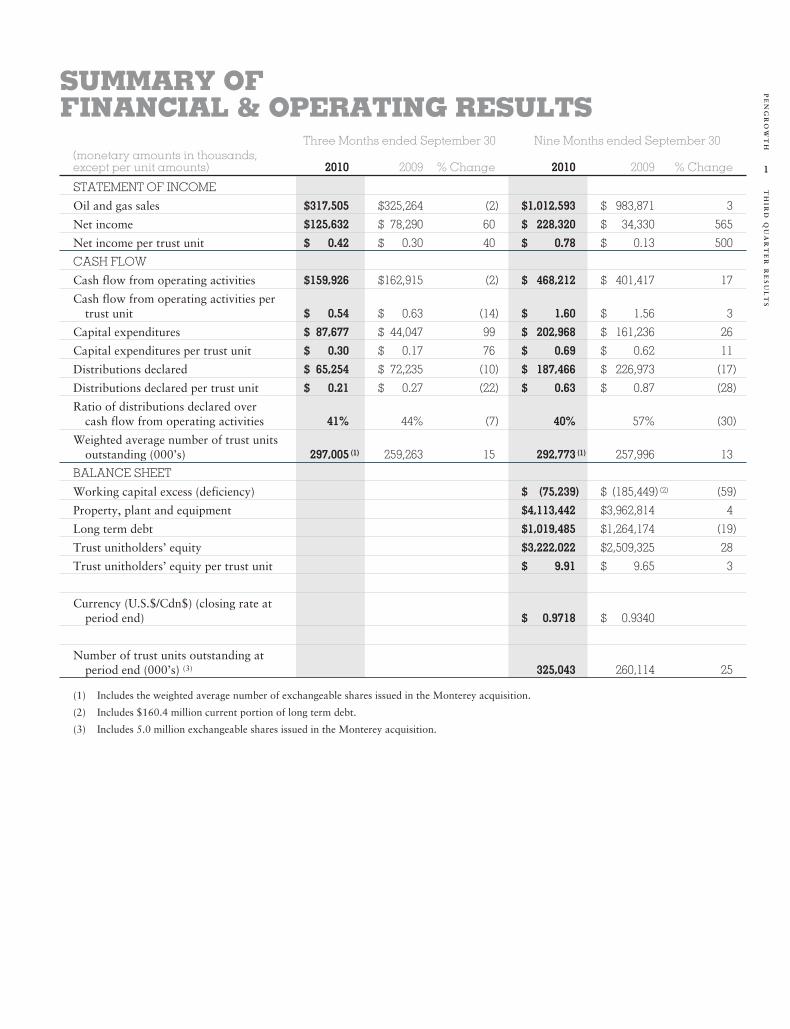
Three Months ended September 30 Nine Months ended September 30(monetary amounts in thousands,except per unit amounts) 2010 2009 % Change 2010 2009 % Change
STATEMENT OF INCOME
Oil and gas sales $317,505 $325,264 (2) $1,012,593 $ 983,871 3
Net income $125,632 $ 78,290 60 $ 228,320 $ 34,330 565
Net income per trust unit $ 0.42 $ 0.30 40 $ 0.78 $ 0.13 500
CASH FLOW
Cash flow from operating activities $159,926 $162,915 (2) $ 468,212 $ 401,417 17
Cash flow from operating activities pertrust unit $ 0.54 $ 0.63 (14) $ 1.60 $ 1.56 3
Capital expenditures $ 87,677 $ 44,047 99 $ 202,968 $ 161,236 26
Capital expenditures per trust unit $ 0.30 $ 0.17 76 $ 0.69 $ 0.62 11
Distributions declared $ 65,254 $ 72,235 (10) $ 187,466 $ 226,973 (17)
Distributions declared per trust unit $ 0.21 $ 0.27 (22) $ 0.63 $ 0.87 (28)
Ratio of distributions declared overcash flow from operating activities 41% 44% (7) 40% 57% (30)
Weighted average number of trust unitsoutstanding (000’s) 297,005 (1) 259,263 15 292,773 (1) 257,996 13
BALANCE SHEET
Working capital excess (deficiency) $ (75,239) $ (185,449) (2) (59)
Property, plant and equipment $4,113,442 $3,962,814 4
Long term debt $1,019,485 $1,264,174 (19)
Trust unitholders’ equity $3,222,022 $2,509,325 28
Trust unitholders’ equity per trust unit $ 9.91 $ 9.65 3
Currency (U.S.$/Cdn$) (closing rate atperiod end) $ 0.9718 $ 0.9340
Number of trust units outstanding atperiod end (000’s) (3) 325,043 260,114 25
(1) Includes the weighted average number of exchangeable shares issued in the Monterey acquisition.
(2) Includes $160.4 million current portion of long term debt.
(3) Includes 5.0 million exchangeable shares issued in the Monterey acquisition.
1
TH
IRD
QU
AR
TE
RR
ES
UL
TS
PE
NG
RO
WT
H

Three Months ended September 30 Nine Months ended September 30(monetary amounts in thousands,except per unit amounts) 2010 2009 % Change 2010 2009 % Change
AVERAGE DAILY PRODUCTION
Crude oil (bbls) 20,967 22,930 (9) 21,736 23,142 (6)
Heavy oil (bbls) 6,585 7,480 (12) 6,828 7,657 (11)
Natural gas (mcf) 217,712 232,444 (6) 219,725 238,746 (8)
Natural gas liquids (bbls) 8,867 8,984 (1) 9,420 9,598 (2)
Total production (boe) 72,704 78,135 (7) 74,605 80,189 (7)
TOTAL PRODUCTION (mboe) 6,689 7,188 (7) 20,367 21,891 (7)
PRODUCTION PROFILE
Crude oil 29% 29% 29% 29%
Heavy oil 9% 10% 9% 9%
Natural gas 50% 50% 49% 50%
Natural gas liquids 12% 11% 13% 12%
AVERAGE REALIZED PRICES(after commodity riskmanagement)
Crude oil (per bbl) $ 73.93 $ 74.40 (1) $ 75.06 $ 71.26 5
Heavy oil (per bbl) $ 57.80 $ 59.21 (2) $ 60.15 $ 49.71 21
Natural gas (per mcf) $ 4.67 $ 4.34 8 $ 5.05 $ 5.03 –
Natural gas liquids (per bbl) $ 53.55 $ 41.86 28 $ 57.08 $ 37.96 50
Average realized price per boe $ 47.07 $ 45.22 4 $ 49.45 $ 44.84 10
Note regarding currency: all figures contained within this report are quoted in Canadian dollars unless otherwise indicated.
2
TH
IRD
QU
AR
TE
RR
ES
UL
TS
PE
NG
RO
WT
H

SUMMARY OFTRUST UNIT TRADING DATA
Three months ended September 30 Nine months ended September 30(thousands, except per trust unit amounts) 2010 2009 2010 2009
TRUST UNIT TRADING
PGH (NYSE)
High $ 11.10 U.S. $ 10.54 U.S. $ 11.97 U.S. $ 10.54 U.S.
Low $ 8.85 U.S. $ 6.43 U.S. $ 7.67 U.S. $ 4.51 U.S.
Close $ 11.06 U.S. $ 10.51 U.S. $ 11.06 U.S. $ 10.51 U.S.
Value $200,035 U.S. $203,052 U.S. $ 687,471 U.S. $604,707 U.S.
Volume 20,153 23,914 66,686 79,757
PGF.UN (TSX)
High $ 11.44 $ 11.33 $ 12.00 $ 12.33
Low $ 9.40 $ 7.49 $ 8.50 $ 5.84
Close $ 11.34 $ 11.33 $ 11.34 $ 11.33
Value $488,789 $268,980 $1,222,491 $755,418
Volume 47,522 28,766 114,935 86,265
3
TH
IRD
QU
AR
TE
RR
ES
UL
TS
PE
NG
RO
WT
H

President’s MessageTo our unitholders,
The third quarter saw continued activity on our dual pronged strategy of unearthing unconventional oil and gas resource plays onour own lands as well as continued execution and evaluation of the acquisition opportunities that fit our value creation model.During the quarter we closed the Monterey acquisition and made significant progress on our proof-of-concept plays in theGarrington (Cardium & Viking) and the Swan Hills area. At Swan Hills alone, we are testing eight separate proof-of-concept playsin the Beaverhill Lake formation.
In addition to an active quarter operationally, Pengrowth continued to strengthen our senior leadership team with the recentappointment of three new Vice-Presidents. Ms. Diane Shirra and Mr. Steve De Maio have embraced leadership roles within two ofPengrowth’s very promising unconventional asset groups. Diane has been appointed to the position of Vice-President, Montney GasDevelopment and Steve has come on-board as Pengrowth’s new Vice-President, In-Situ Development and Operations. Mr. AndrewGrasby also joined Pengrowth as our Vice-President, General Counsel and Corporate Secretary and will be responsible for theadministration of Pengrowth’s legal affairs and corporate compliance. I’d like to take the opportunity to welcome all threeindividuals to Pengrowth and I look forward to the value they will create for our unitholders.
Highlights for the quarter include:
• Continued wet weather and the inability to obtain timely access to frac services delayed capital, completion and tie-in activityduring the quarter. Coupled with planned and unplanned turn-around activity, these circumstances resulted in averageproduction of 72,704 barrels of oil equivalent (boe) per day in the third quarter, a reduction of four percent from the secondquarter production of 75,517 boe per day. Pengrowth has tightened its full year average production guidance to a range of74,000 to 75,000 boe per day. Year-to-date production has averaged 74,605 boe per day.
• Full year operating expense guidance has been revised downward for the second time this year from $14.05 per boe to $13.60per boe.
• At Horn River, the Evie formation was successfully fracture stimulated in a vertical well with final flow rates of approximately0.5 mmcf per day.
• Year-to-date cash flow before working capital changes has exceeded the sum of capital expenditures and distributions. Excesscash flow will be utilized in the fourth quarter with a large portion being directed to drilling and related facility construction inthe Montney Groundbirch area. Pengrowth plans on continuing to live within its means for the remainder of 2010.
• Drilling activity increased in the third quarter with 43 gross (23.7 net) wells being drilled of which 36 gross wells were cased forproduction.
• On September 15, 2010, Pengrowth closed its acquisition of Monterey Exploration Ltd, with the issuance of approximately28 million Trust Units and approximately 5 million exchangeable shares.
• Subsequent to the quarter end, Pengrowth completed the renewal of a $1 billion bank facility for a three year term. Pengrowthhas the ability to expand this facility as needed up to a total of $1.25 billion, giving ample flexibility while minimizing bankcosts.
• At the end of the quarter, Pengrowth had $26 million of short term debt and over $1 billion available on its committed bankfacility.
Corporate Conversion
Subsequent to the quarter end, Pengrowth announced its official intent to convert into a dividend paying corporation. Subject to thereceipt of all necessary approvals, our conversion is expected to be completed on December 31, 2010.
With approximately $2.9 billion of tax pools as of September 30, 2010, our conversion is not expected to immediately result in anynew corporate income taxes that would reduce the amount of cash on hand available for the payment of dividends. We initiallyexpect to pay a monthly dividend of $0.07 per share which is the same amount that we are paying today as a distribution on ourTrust Units. Dividends are expected to continue to be paid monthly on the 15th (or next business day) of each month.
As a corporation, Pengrowth will remain focused on maintaining a diversified asset base balanced between liquids and natural gasproduction and will be committed to maintaining its emphasis on operating high quality, low cost, low risk properties, deliveringsuperior returns to shareholders and continuing to ensure financial strength and flexibility.
4
TH
IRD
QU
AR
TE
RR
ES
UL
TS
PE
NG
RO
WT
H

Opportunities
Our teams have continued to work diligently to peel back the layers of the onion to explore the conventional and unconventionalopportunities that exist on our land base. We are looking forward to presenting a summary of these opportunities at our AnalystDay on November 9, 2010. Unitholders are invited to listen in on this meeting via webcast which will be accessible throughwww.pengrowth.com commencing at 8:00 a.m. MST.
Drilling and completion activity in the quarter has been focused on the Viking and Cardium zones in the Garrington area as well asthe Beaverhill Lake formation in the Swan Hills area, where we have been testing multiple proof-of-concept ideas. We will bereleasing initial production information on these wells in our 2011 guidance and capital program press release on November 8,2010.
Our Business Development team continues to seek acquisition opportunities that fit our resource based value creation model. We arebusy evaluating numerous public and privately marketed acquisition opportunities and continue to be picky, patient and persistentin ensuring that the right acquisition creates maximum value for our unit holders.
Outlook
We continue to make good progress on our resource based value creation strategy. Our drilling, acquisition and evaluation activitiesare all consistent with our goal of finding predictable and repeatable places to put the drill bit to work to create value for ourunitholders.
Pengrowth is in a strong financial position with in excess of $1 billion available on a committed bank facility. We are wellpositioned to execute the acquisition opportunities that currently exist in the market. We have continued to layer in more hedges forthe 2011 calendar year with approximately 50,000 mcf per day of gas hedged at Cdn $5.72 per mcf and 12,000 bbls per day of oilhedged at Cdn $87.87 per bbl. We will continue to pursue opportunities to add to our hedge positions to provide a level of stabilityto cash flow for our capital and distribution programs.
I’d like to take the opportunity to thank all of our unitholders for their continued support. We are excited about the progress we aremaking and the opportunities we are uncovering.
Sincerely
Derek W. EvansPresident and Chief Executive OfficerNovember 4, 2010
5
TH
IRD
QU
AR
TE
RR
ES
UL
TS
PE
NG
RO
WT
H

MANAGEMENT’S DISCUSSION & ANALYSISThe following Management’s Discussion and Analysis (MD&A) of financial results should be read in conjunction with theunaudited consolidated Financial Statements for the nine months ended September 30, 2010 of Pengrowth Energy Trust and is basedon information available to November 4, 2010.
FREQUENTLY RECURRING TERMSFor the purposes of this MD&A, we use certain frequently recurring terms as follows: the “Trust” refers to Pengrowth Energy Trust,the “Corporation” refers to Pengrowth Corporation, and “Pengrowth” refers to the Trust and its subsidiaries and the Corporationon a consolidated basis.
Pengrowth uses the following frequently recurring industry terms in this MD&A: “bbls” refers to barrels, “mbbls” refers tothousands of barrels, “boe” refers to barrels of oil equivalent, “mboe” refers to a thousand barrels of oil equivalent, “mcf” refers tothousand cubic feet, “bcf” refers to billion cubic feet, “gj” refers to gigajoule, “mmbtu” refers to million British thermal units and“mwh” refers to megawatt hour. Disclosure provided herein in respect of a boe may be misleading, particularly if used in isolation.A boe conversion ratio of six mcf of natural gas to one barrel of crude oil equivalent is based on an energy equivalency conversionmethod primarily applicable at the burner tip and does not represent a value equivalency at the wellhead.
ADVISORY REGARDING FORWARD-LOOKING STATEMENTSThis MD&A contains forward-looking statements within the meaning of securities laws, including the “safe harbour” provisions ofCanadian securities legislation and the United States Private Securities Litigation Reform Act of 1995. Forward-looking informationis often, but not always, identified by the use of words such as “anticipate”, “believe”, “expect”, “plan”, “intend”, “forecast”,“target”, “project”, “guidance”, “may”, “will”, “should”, “could”, “estimate”, “predict” or similar words suggesting futureoutcomes or language suggesting an outlook. Forward-looking statements in this MD&A include, but are not limited to, statementswith respect to: reserves, 2010 production, the proportion of 2010 production of each product type, production additions fromPengrowth’s 2010 development program, royalty expenses, 2010 operating expenses, future income taxes, goodwill, asset retirementobligations, taxability of distributions, remediation, reclamation and abandonment expenses, capital expenditures, developmentactivities, general and administration expenses, the portion of our future distributions anticipated to be taxable, the potential impactof the SIFT tax (as defined herein) on Pengrowth and our unitholders, our potential ability to shield our taxable income fromincome tax using our tax pools for a period of time following the implementation of the SIFT tax, our conversion to a dividendpaying entity which will be taxable as a corporation for Canadian federal income tax purposes and the timing thereof, and proceedsfrom the disposal of properties and our expectation that capital spending plus distribution will not exceed cash flow from operatingactivities. Statements relating to “reserves” are forward-looking statements, as they involve the implied assessment, based on certainestimates and assumptions that the reserves described exist in the quantities predicted or estimated and can profitably be producedin the future.
Forward-looking statements and information are based on Pengrowth’s current beliefs as well as assumptions made by, andinformation currently available to, Pengrowth concerning general economic and financial market conditions, anticipated financialperformance, business prospects, strategies, regulatory developments, including in respect of taxation, royalty rates andenvironmental protection, future capital expenditures and the timing thereof, future oil and natural gas commodity prices anddifferentials between light, medium and heavy oil prices, future oil and natural gas production levels, future exchange rates andinterest rates, the proceeds of anticipated divestitures, the amount of future cash distributions paid by Pengrowth, the cost ofexpanding our property holdings, our ability to obtain labour and equipment in a timely manner to carry out development activities,our ability to market our oil and natural gas successfully to current and new customers, the impact of increasing competition, ourability to obtain financing on acceptable terms, our ability to add production and reserves through our development, exploitationand exploration activities and our proposed conversion to a dividend paying corporation. Although management considers theseassumptions to be reasonable based on information currently available to it, they may prove to be incorrect.
By their very nature, forward-looking statements involve inherent risks and uncertainties, both general and specific, and risks thatpredictions, forecasts, projections and other forward-looking statements will not be achieved. We caution readers not to place unduereliance on these statements as a number of important factors could cause the actual results to differ materially from the beliefs,plans, objectives, expectations and anticipations, estimates and intentions expressed in such forward-looking statements. Thesefactors include, but are not limited to: the volatility of oil and gas prices; production and development costs and capitalexpenditures; the imprecision of reserve estimates and estimates of recoverable quantities of oil, natural gas and liquids; Pengrowth’sability to replace and expand oil and gas reserves; environmental claims and liabilities; incorrect assessments of value when makingacquisitions; increases in debt service charges; the loss of key personnel; the marketability of production; defaults by third partyoperators; unforeseen title defects; fluctuations in foreign currency and exchange rates; inadequate insurance coverage; counterpartyrisk; compliance with environmental laws and regulations; changes in tax and royalty laws; the failure to qualify as a mutual fund
6
TH
IRD
QU
AR
TE
RR
ES
UL
TS
PE
NG
RO
WT
H

trust; Pengrowth’s ability to access external sources of debt and equity capital; the implementation of International FinancialReporting Standards; and the implementation of greenhouse gas emissions legislation. Further information regarding these factorsmay be found under the heading “Business Risks” herein and under “Risk Factors” in Pengrowth’s most recent Annual InformationForm (AIF), and in Pengrowth’s most recent consolidated financial statements, management information circular, quarterly reports,material change reports and news releases. Copies of the Trust’s Canadian public filings are available on SEDAR at www.sedar.com.The Trust’s U.S. public filings, including the Trust’s most recent annual report form 40-F as supplemented by its filings on form 6-K,are available at www.sec.gov.
Pengrowth cautions that the foregoing list of factors that may affect future results is not exhaustive. When relying on our forward-looking statements to make decisions with respect to Pengrowth, investors and others should carefully consider the foregoing factorsand other uncertainties and potential events. Furthermore, the forward-looking statements contained in this MD&A are made as ofthe date of this MD&A and Pengrowth does not undertake any obligation to update publicly or to revise any of the includedforward-looking statements, except as required by law. The forward-looking statements in this document are provided for thelimited purpose of enabling current and potential investors to evaluate an investment in Pengrowth. Readers are cautioned that suchstatements may not be appropriate, and should not be used for other purposes.
The forward-looking statements contained in this MD&A are expressly qualified by this cautionary statement.
CRITICAL ACCOUNTING ESTIMATESThe financial statements are prepared in accordance with Canadian Generally Accepted Accounting Principles (GAAP).Management is required to make estimates and assumptions that affect the reported amounts of assets and liabilities at the date ofthe financial statements and revenues and expenses for the period ended. Certain of these estimates may change from period toperiod resulting in a material impact on Pengrowth’s results of operations, financial position, and change in financial position.
The amounts recorded for depletion and depreciation of property, plant and equipment, amortization of injectants, unit basedcompensation, goodwill and future taxes are based on estimates. The ceiling test calculation is based on estimates of proved reserves,production rates, oil and natural gas prices, future costs and other relevant assumptions. Values assigned to the various assets andliabilities of the Monterey Exploration Ltd. (Monterey) business combination were based on internal and third party estimates. Theamounts recorded for the fair value of risk management contracts and the unrealized gains or losses on the change in fair value arebased on estimates. The provision for asset retirement obligations is based on estimates affected by assumptions around timing andcost estimates for the related work activity. These estimates can change significantly from period to period. As required by NationalInstrument 51-101 Standards of Disclosure for Oil and Gas Activities, Pengrowth uses independent qualified reserve evaluators inthe preparation of the annual reserve evaluations. By their nature, these estimates are subject to measurement uncertainty andchanges in these estimates may impact the consolidated financial statements of future periods.
NON-GAAP FINANCIAL MEASURESThis MD&A refers to certain financial measures that are not determined in accordance with GAAP in Canada or the United States.These measures do not have standardized meanings and may not be comparable to similar measures presented by other trusts orcorporations. Measures such as operating netbacks do not have standardized meanings prescribed by GAAP. See the section of thisMD&A entitled Operating Netbacks for a discussion of the calculation.
Distributions can be compared to cash flow from operating activities in order to determine the amount, if any, of distributionsfinanced through debt or short term borrowing. The current level of capital expenditures funded through retained cash, as comparedto debt or equity, can also be determined when it is compared to the difference in cash flow from operating activities anddistributions paid in the financing section of the Statement of Cash Flow.
Management monitors Pengrowth’s capital structure using non-GAAP financial metrics. The two metrics are Total Debt to thetrailing twelve months Earnings Before Interest, Taxes, Depletion, Depreciation, Amortization, Accretion, and other non-cash items(EBITDA) and Total Debt to Total Capitalization. Total Debt is the sum of working capital deficit, long term debt and convertibledebentures as shown on the balance sheet, and Total Capitalization is the sum of Total Debt and Unitholder’s equity.
NON-GAAP OPERATIONAL MEASURESThe reserves and production in this MD&A refer to Company Interest reserves or production that is Pengrowth’s working interestshare of production or reserves prior to the deduction of Crown and other royalties plus any Pengrowth owned royalty interest inproduction or reserves at the wellhead. Company interest is more fully described in Pengrowth’s AIF.
When converting natural gas to equivalent barrels of oil within this MD&A, Pengrowth uses the industry standard of six mcf to one boe.Barrels of oil equivalent may be misleading, particularly if used in isolation; a conversion ratio of six mcf of natural gas to one boe isbased on an energy equivalency conversion primarily and does not represent a value equivalency at the wellhead. Production volumes,revenues and reserves are reported on a company interest gross basis (before royalties) in accordance with Canadian practice.
7
TH
IRD
QU
AR
TE
RR
ES
UL
TS
PE
NG
RO
WT
H

CURRENCYAll amounts are stated in Canadian dollars unless otherwise specified.
VISION AND STRATEGY
Pengrowth Energy Trust is an oil and gas operating company, structured as a trust, with a focus on creating value through the drillbit by drilling and operating, high value, lower risk, and repeatable opportunities primarily in the Western Canadian SedimentaryBasin (“WCSB”). Pengrowth’s operations include production from a number of conventional and unconventional assets and areevenly balanced between liquids and natural gas.
Pengrowth’s vision is to be a leading value creator of unconventional resource plays in the WCSB. The company’s value creationstrategy consists of three core principles of acquiring and developing operated unconventional resource plays in the WCSB,enhancing financial strength and flexibility and becoming the best operator in our sector.
Our value creation strategy moves Pengrowth away from the financial trust model where the focus had been on maximizingdistributions, to an operated oil and gas company focused on re-investing a significant amount of cash flow through the drill bit.
Pengrowth successfully completed the business combination with Monterey Exploration Ltd. (“Monterey”) on September 15, 2010.This acquisition supports the company’s vision and value creation strategy to become a leading unconventional resource player inthe WCSB.
On October 20, 2010, Pengrowth announced it’s intention to convert to a dividend paying corporation on December 31, 2010,subject to receipt of all necessary approvals. A special meeting of security holders to vote on the conversion is scheduled forDecember 16, 2010.
THIRD QUARTER OVERVIEW
This MD&A contains the results of Pengrowth Energy Trust and its subsidiaries.
FINANCIAL HIGHLIGHTS
Three months ended Nine months endedSept 30, 2010 June 30, 2010 Sept 30, 2009 Sept 30, 2010 Sept 30, 2009
Production (boe/d) 72,704 75,517 78,135 74,605 80,189Net capital expenditures ($000’s) 87,677 51,655 44,047 202,968 161,236Cash flow from operating activities
($000’s) 159,926 161,550 162,915 468,212 401,417Netback ($/boe) 26.12 27.16 24.72 26.97 24.96Net income (loss) ($000’s) 125,632 (6,128) 78,290 228,320 34,330Included in net income (loss):Gain on equity investment ($000’s) 73,756 – – 73,756 –Realized gain on commodity risk
management ($000’s) (1) 25,689 23,252 43,406 55,963 143,292Unrealized (loss) gain on commodity risk
management ($000’s) (1) (898) (2,906) (5,609) 59,478 (133,625)Unrealized foreign exchange gain (loss)
($000’s) (1) 30,579 (42,160) 80,535 20,176 131,109Future tax reduction ($000’s) 11,884 7,602 15,055 20,441 75,139
(1) Pre-tax amount
2010 GuidanceThe following table provides a summary of revised 2010 Guidance and a comparison against year to date actual results for 2010.
2010 Actual Full Year 2010Guidance % VarianceQ3 Q2 Q1 YTD
Production (boe/d) 72,704 75,517 75,627 74,605 74,000 - 75,000 –Royalty Expense (% of Sales) (1) 18.9 18.7 22.2 20.1 20.0 –Operating Expense ($/boe) $ 12.69 $ 12.55 $ 13.50 $ 12.91 $ 13.60 (5)G&A Expense (cash & non-cash) ($/boe) $ 1.63 $ 2.13 $ 2.09 $ 1.95 $ 2.23 (12)Abandonment & Reclamation ($millions) $ 3.7 $ 3.7 $ 4.7 $ 12.1 $ 20.0 –Net capital expenditures ($ millions) $ 87.7 $ 51.7 $ 63.6 $ 203.0 $ 350.0 –
(1) Royalty expense as a % of sales excludes the impact of commodity risk management contracts.
8
TH
IRD
QU
AR
TE
RR
ES
UL
TS
PE
NG
RO
WT
H

At this time Pengrowth has reduced its 2010 production guidance to average between 74,000 and 75,000 boepd from between74,000 and 76,000 boepd as provided in the second quarter. The downward revision was necessary to include the impact of weatherrelated delays in the second and third quarter drilling programs, the restricted availability of frac crews and planned and unplannedmaintenance. Pengrowth has also revised its operating expense forecast from $385 million to $370 million resulting in an operatingexpense per boe of $13.60. At the time of the initial announcement of the business combination with Monterey, Pengrowthincreased its capital expenditure guidance by $65 million to $350 million. This increase will be directed to drilling and relatedfacility construction on the Monterey Groundbirch lands, with production not expected until late December 2010. In line with thereduced production guidance and lower pricing forecast for natural gas the 2010 royalty rate has also been revised from 21 to 20percent of sales.
Cash flow from operationsThe following table provides a reconciliation of the change in cash flow from operations from period end 2009 to period end 2010.
($ thousands) Q3 % Change YTD % Change
2009 Cash flow from Operating Activities 162,915 401,417
Volume variance (21,665) (13) (56,396) (14)
Price variance 29,033 18 169,275 42
Lower cash gains on risk management contracts (17,717) (11) (87,329) (22)
Processing income variance 424 – 188 –
Royalties (5,610) (3) (55,223) (14)
Expenses:
Transportation 203 – (2,116) (1)
Operating 8,438 5 27,465 7
Cash G&A and management fee 506 – 7,972 2
Interest and financing expense 2,376 1 11,188 3
Drilling Credits – – 16,727 4
Realized foreign exchange loss (584) – (2,677) (1)
Non-cash and other items 1,607 1 37,721 9
2010 Cash flow from Operating Activities 159,926 (2) 468,212 17
Cash flow from operating activities decreased two percent from the third quarter of 2009 to the third quarter of 2010. The decreasewas mainly attributable to lower production volumes and lower realized commodity risk management gains. The decrease in cashflow was partly offset by higher liquid commodity prices and lower operating expense and interest expenses.
Cash flow from operating activities increased 17 percent on a year over year basis. Higher commodity prices in the first nine monthsof 2010 compared to the first nine months of 2009 largely contributed to higher cash flows in 2010. The increase in cash flow fromhigher commodity prices were partly offset by lower production volumes, higher royalty expenses and lower realized riskmanagement gains.
The following table illustrates the sensitivity of cash flow from operating activities to changes in commodity prices:
Commodity Price Environment (1) Assumption Change
Impact on2010 Annual
Cash Flow ($ ‘000s)
West Texas Intermediate Oil Price (2) (3) US$/bbl $ 78.96 $ 1.00 $ 11,057
Heavy Oil US$/bbl $ 78.96 $ 1.00 $ 1,966
Light Oil US$/bbl $ 78.96 $ 1.00 $ 6,315
NGL US$/bbl $ 78.96 $ 1.00 $ 2,777
AECO Natural Gas Price (2) (3) C$ /mcf $ 4.06 $ 0.10 $ 6,470
(1) Calculations are performed independently and are not indicative of actual results when multiple variables change at the same time.
(2) The calculated impact on revenue/cash flow is only applicable within a limited range of the change indicated.
(3) Does not include the impact of risk management contracts. For 2010, risk management contracts represent approximately 34% of total liquidsproduction and 45% of natural gas production.
9
TH
IRD
QU
AR
TE
RR
ES
UL
TS
PE
NG
RO
WT
H

Net Income or LossFor the third quarter of 2010 a net income of $125.6 million was recorded, a 60 percent increase from net income of $78.3 millionin the same period last year. The increase is largely attributable to certain non-cash items including:
• A non-cash gain of $73.8 million ($73.8 million, net of tax) arising from the difference between the fair value and the bookvalue of the investment in Monterey prior to the acquisition as described in Note 2 to the financial statements.
• Partly offsetting the increase was an unrealized foreign exchange gain of $30.6 million ($26.7 million, net of tax) in the thirdquarter of 2010 compared to an unrealized foreign exchange gain of $80.5 million ($70.2 million, net of tax) in the thirdquarter of 2009.
• Future income tax reductions were lower in the third quarter 2010 compared to the third quarter 2009, primarily from changesin non-cash items affecting net income.
On a year to date basis, net income was $228.3 million, an increase of $194.0 million from the same period last year. Contributingto the increase was a 17 percent increase in cash flow from operations and changes to certain non-cash items including the $73.8million gain referred to above, and others including:
• An unrealized commodity risk management gain of $59.5 million ($42.7 million, net of tax) during the first nine months of2010 compared to an unrealized commodity risk management loss of $133.6 million ($95.5 million, net of tax) in the prioryear.
• Partly offsetting the increase was the impact of the change in the U.S. to Canadian dollar exchange rate which primarily causedan unrealized foreign exchange gain of $20.2 million in the first nine months of 2010 ($17.5 million, net of tax) compared to anunrealized gain of $131.1 million ($115.3 million, net of tax) in the same period last year.
• Future income tax reductions were lower in the first nine months of 2010 compared to the same period last year by $54.7million as a result of lower unitholder distributions and the impact of the change in non-cash items affecting net income.
RESULTS OF OPERATIONS
CAPITAL EXPENDITURESDuring the first nine months of 2010, development capital expenditures, after deducting Alberta Drilling Royalty Credits (drillingcredits), totaled $200.5 million ($220.9 million before drilling credits), with approximately 80 percent spent on drilling, completionsand facilities. Included in the development capital expenditures are land acquisition costs of $5.3 million and drilling credits of$20.4 million.
The 2010 capital program is designed to be flexible, scalable and responsive to uncertain commodity prices and market conditions.Capital amounts may fluctuate and may be reallocated between natural gas and oil opportunities in response to fluctuations incommodity prices. In conjunction with the acquisition of Monterey, management increased the 2010 capital program to $350 millionbefore drilling credits. Approximately $65 million will be directed to development activity on the Groundbirch lands acquired throughMonterey. Management believes that the capital guidance is an appropriate level of capital spending to replace a portion of production.
Three months ended Nine months ended($ millions) Sept 30, 2010 June 30, 2010 Sept 30, 2009 Sept 30, 2010 Sept 30, 2009
Drilling, completions and facilities 79.3 42.7 32.6 181.0 115.1
Drilling Royalty Credits (6.3) (4.1) (4.2) (20.4) (4.2)
Net drilling, completions and facilities 73.0 38.6 28.4 160.6 110.9
Seismic acquisitions (1) 0.3 0.4 – 1.1 4.3
Maintenance capital 12.5 8.6 13.3 33.5 39.7
Land purchases 1.0 3.2 0.2 5.3 2.4
Development capital 86.8 50.8 41.9 200.5 157.3
Other capital 0.9 0.9 2.1 2.5 3.9
Total net capital expenditures 87.7 51.7 44.0 203.0 161.2
Business acquisitions (2) 570.4 – – 570.4 –
Property acquisitions 17.3 1.8 (0.1) 20.0 10.4
Proceeds on property dispositions (0.3) (6.9) 0.4 (48.3) (7.7)
Net capital expenditures and acquisitions 675.1 46.6 44.3 745.1 163.9
(1) Seismic acquisitions are net of seismic sales revenue.
(2) Business acquisitions includes the increase to Property, Plant & Equipment as a result of the acquistion of Monterey.
10
TH
IRD
QU
AR
TE
RR
ES
UL
TS
PE
NG
RO
WT
H

Business AcquisitionPengrowth successfully completed the business combination with Monterey on September 15, 2010 by issuing approximately28 million trust units and 5 million exchangeable shares to the former Monterey securityholders. Details of the business combinationare described in Note 2 of the consolidated financial statements. The fair value attributed to the property, plant and equipmentacquired was $570 million with approximately $49 million of producing assets and $521 million of unproven and developmentproperties. The business combination was accounted for as an acquisition of Monterey by Pengrowth using the purchase method ofaccounting with the allocation of the purchase price and consideration as follows:
($ millions)
Allocation of Purchase Price:
Property, plant and equipment $570.4Goodwill 48.3Bank debt (41.9)Asset retirement obligations (7.9)Working capital deficit (25.7)Future income taxes (98.6)
$444.6Consideration:
Pengrowth trust units issued $307.6Pengrowth exchangeable shares issued 54.9Fair value of previous equity investment 82.1
$444.6
Final determination of the allocation of the purchase cost to the fair values of the assets and liabilities is still pending.
DEVELOPMENT CAPITAL ACTIVITIES(All volumes and amounts stated below are net to Pengrowth unless otherwise stated.)
Development activity during the first nine months of 2010 was focused on existing opportunities operated by Pengrowth.Pengrowth’s capital spending breakdown by resource play to September 30, 2010 is as follows:
($ millions)
Drilling,Completions,
Facilities Drilling Credits MaintenanceLand & Seismic
Acquisitions Total
Unconventional Resource PlaysSwan Hills 85.7 (9.2) 12.8 2.0 91.3Viking & Cardium 15.9 – – 2.5 18.4Heavy Oil & SAGD 9.0 (1.0) 1.3 0.3 9.6Horn River 13.0 – – 0.2 13.2Shallow Gas & Coalbed Methane 21.6 (7.6) 5.6 1.1 20.7Enhanced Oil Recovery 10.7 – 1.3 – 12.0Montney 5.1 – – – 5.1
Conventional Resource Plays 19.9 (2.6) 10.8 0.3 28.4Offshore 0.1 – 1.7 – 1.8Development Capital 181.0 (20.4) 33.5 6.4 200.5
UNCONVENTIONAL RESOURCE PLAYSSwan Hills TrendSince acquiring the Judy Creek asset in 1998, Pengrowth has increased the assets along the Swan Hills Reef trend, including theacquisition of the Carson Creek field in 2006. The Pengrowth operated Carson Creek asset is composed of two units: the CarsonCreek North Beaverhill Lake (BHL) Unit 1, which primarily produces oil and, south of this, the Carson Creek BHL Unit 1, whichprimarily produces liquids-rich gas. Pengrowth has been developing a new BHL gas pool, the Carson C Pool. Current productionfrom the Carson C Pool is approximately 3,800 boe per day.
In the Carson C Pool, six horizontal wells planned for this year were drilled in the third quarter. The first four wells weresuccessfully multi-stage acid fractured and tested in the third quarter and the last two will be completed and tested in the fourthquarter. Total projected cost for this project is estimated at $22 million. All six wells are expected to be on production early in thefourth quarter. Also in the Carson Creek area, Pengrowth is drilling a BHL test on the Alexis Reserve, and is expected to completeand test the well in the fourth quarter.
11
TH
IRD
QU
AR
TE
RR
ES
UL
TS
PE
NG
RO
WT
H

At House Mountain, a second BHL platform horizontal well was drilled in the third quarter, following a well drilled in the secondquarter from the same pad site. The total estimated cost for this well and a well drilled in the second quarter is approximately $8.7million (drilling and completion). Both wells were multi-stage acid fractured and tested in the third quarter and were on productionearly in the fourth quarter. The combined production from the wells is currently 240 bbl per day.
At Deer Mountain Unit No 1, the first of four horizontal wells targeting the BHL formation was spud in the third quarter. All fourDeer Mountain Unit wells will be multi-stage acid fractured. These wells offset successful competitor activity to both the north andsouth of the Unit.
MontneyThe successful acquisition of Monterey has provided Pengrowth with 21.0 gross (19.0 net) sections at Groundbirch in northeastBritish Columbia, a highly prospective Montney focused resource asset located in one of the thickest and most prospective areas ofthe Montney fairway. Current net tested production volumes of 25 mmcf per day from 3 wells at Groundbirch is awaiting tie-in to a28 mmcf per day natural gas processing facility currently being constructed which is expected to be on stream in December 2010.
During the third quarter, 4 wells were drilled by Monterey at Groundbirch. Completion and tie-in of 3 of these wells will becompleted in the fourth quarter.
Viking & Cardium Formations in Central AlbertaDuring the third quarter, Pengrowth continued the Cardium and Viking drilling program in the Harmattan area. Five wells weredrilled, with two coming on production late in the quarter at a combined initial rate of 280 boepd. A third and fourth well were alsosuccessfully drilled and will be completed in the fourth quarter. One 50 percent working interest well was junked and abandoneddue to operational issues. At the end of the quarter, drilling commenced on two additional locations.
Horn RiverDuring the quarter, a 2010 vertical well was completed in the Evie formation and tested with final flow rates of approximately 0.5mmcf per day. The 2010/2011 winter drilling activity has been deferred due to a lack of availability of frac services.
Shallow Gas and Coalbed Methane (“CBM”)During the third quarter, 10 CBM wells were drilled and completed in the Twining and Fenn Big Valley areas to test the viability ofdownspacing from 4 to 8 wells per section. Weather related issues have delayed the tie in of these wells. At Jenner, all 16 wellsdrilled in the first quarter to test the economics of downspacing from 4 to 8 wells per section were tied in.
DRILLING ACTIVITYPengrowth participated in the drilling of 43 wells or 23.7 net wells in the quarter. Out of these 43 wells, 39 wells were cased forproduction, 3 wells are CO2 injection wells and one well was junked and abandoned.
Q3 2010 Q2 2010 Q1 2010 YTD 2010Gross Net Gross Net Gross Net Gross Net
Unconventional Resource PlaysSwan Hills 11 8.1 6 5.1 9 2.8 26 16.0Viking & Cardium 5 2.7 1 0.6 – – 6 3.3Heavy Oil & SAGD – – – – 12 12.0 12 12.0Horn River – – – – 2 2.0 2 2.0Shallow Gas & CBM 13 7.0 – – 58 52.8 71 59.8Montney (1) 4 4.0 – – – – 4 4.0Enhanced Oil Recovery 7 0.7 6 0.6 5 0.5 18 1.8
Conventional Resource Play 3 1.2 2 2.0 28 8.1 33 11.3
Offshore – – – – – – – –
Total wells drilled (2) 43 23.7 15 8.3 114 78.2 172 110.2
(1) Drilled by Monterey
(2) Based on wells rig released in the quarter.
ACQUISITIONS & DISPOSITIONSOn September 15, 2010, Pengrowth successfully completed the acquisition of Monterey which has provided Pengrowth with 21.0gross (19.0 net) sections at Groundbirch in northeast British Columbia, a highly prospective Montney focused resource asset locatedin one of the thickest and most prospective areas of the Montney fairway. Current net tested production volumes of 25 mmcf perday at Groundbirch is awaiting tie-in to a 28 mmcf per day natural gas processing facility currently being constructed which isexpected to be on stream in December 2010.
12
TH
IRD
QU
AR
TE
RR
ES
UL
TS
PE
NG
RO
WT
H

In the third quarter of 2010, Pengrowth completed the acquisition of additional producing assets in the Judy Creek and Swalwellareas for approximately $14.3 million and $3.0 million net of adjustments, respectively.
Completed in the second quarter of 2010 was the disposition of interests in the Twining area with an estimated fair value of $5.7million. Drilling credits of approximately $17.0 million were received as proceeds which resulted in the recognition of $11.3 millionof other income.
During the first quarter of 2010, Pengrowth completed the disposition of various gross overriding royalty interests. Proceeds of thedisposition were approximately $38.4 million net of adjustments. Proceeds from this disposition were used for debt repayment.
PRODUCTIONAverage daily production decreased four percent in the third quarter of 2010 from the second quarter of 2010. Quarterly productionwas negatively impacted by scheduled maintenance shutdowns, particularly at Judy Creek Gas Plant (approximately 725 boepd),one less condensate lift at Sable Offshore Energy Project (SOEP) (approximately 650 boepd), and accessibility to frac equipment(approximately 500 boepd). Also affecting third quarter of 2010 was unplanned production outages in Quirk Creek, Swan Hills andOlds (approximately 300 boepd). In addition, production in the first nine months of 2010 was also impacted by dispositions whichoccurred late in 2009 and slightly higher production declines.
Pengrowth’s 2010 production is currently forecasted to average between 74,000 and 75,000 boe per day and remains balanced atapproximately 50 percent natural gas and 50 percent crude oil and liquids. This revision to the forecasted production is a result ofone time shorfalls in the third quarter of 2010 combined with the ongoing problems of timely access to completion services. Thisestimate excludes production from any potential future acquisitions and dispositions.
DAILY PRODUCTION
Three months ended Nine months endedSept 30,
2010% oftotal
June 30,2010
% oftotal
Sept 30,2009
% oftotal
Sept 30,2010
% oftotal
Sept 30,2009
% oftotal
Light crude oil (bbls) 20,967 29 21,858 29 22,930 29 21,736 29 23,142 29
Heavy oil (bbls) 6,585 9 6,791 9 7,480 10 6,828 9 7,657 9
Natural gas (mcf) 217,712 50 220,856 49 232,444 50 219,725 49 238,746 50
Natural gas liquids (bbls) 8,867 12 10,058 13 8,984 11 9,420 13 9,598 12
Total boe per day 72,704 75,517 78,135 74,605 80,189
Light Crude OilThird quarter light crude oil production decreased approximately four percent from the second quarter of 2010 as a result ofproduction declines and scheduled maintenance outages, particularly a major turnaround at the Judy Creek Gas Conservation Plantthat impacted all operated and partner operated production in the area.
The approximate nine percent decrease in light crude oil in the current quarter and six percent decrease in the first nine months of2010 compared to the same periods of 2009 are also a result of production declines, property dispositions and the schedulemaintenance shutdown work mentioned previously, which were partially offset by the 2009 acquisition of additional workinginterest in House Mountain Unit #1 and additional wells on stream at Deer Mountain.
Heavy OilHeavy oil production decreases of three percent in the third quarter of 2010 compared to the second quarter of 2010 were mainlyattributable to production declines, a third quarter scheduled shutdown at Bodo and additional maintenance work at Tangleflagsoffset partially by additional volumes from successful well optimization at Jenner.
The 12 percent decrease comparing the third quarter of 2010 to the third quarter 2009 and the 11 percent decrease year-over-year isattributable to production declines due to reduced capital investment during 2009 as well as power outages experienced through thesecond quarter of 2010 and increased downtime resulting from additional maintenance work at Tangleflags.
Natural GasNatural gas production decreased approximately one percent in the third quarter compared to the second quarter of 2010. Includedin the third quarter are additional volumes from the September 15, 2010 acquisition of Monterey and increased production at SOEPafter the second quarter maintenance shutdown. These additional volumes partially offset the reduced sales volumes that resultedfrom the turnaround at Judy Creek as well as unscheduled downtime at Quirk Creek, Carson Creek and Harmattan.
Production volumes were lower by approximately six percent comparing the third quarter of 2010 with the same quarter in 2009.The decrease is attributable to non-core asset dispositions in late 2009, scheduled and unscheduled downtime previously mentionedand natural declines, partially offset by additional production from capital investment at Carson Creek during 2009 and 2010.
13
TH
IRD
QU
AR
TE
RR
ES
UL
TS
PE
NG
RO
WT
H

Production volumes decreased approximately eight percent comparing the first nine months of 2010 to the same period of 2009.These decreases are a result of the previously mentioned property divestitures and production declines due to reduced capitalinvestment in 2009. Partially offsetting the decreases are additional production volumes from development activity in Carson Creekand Harmattan
NGLsNGL production decreased approximately 12 percent in the third quarter of 2010 compared to the second quarter of 2010. Thirdquarter volumes decreased as a result of the turnaround at Judy Creek and one partial condensate lift at SOEP in the third quarterversus two shipments in the second quarter.
NGL volumes decreased two percent for the first nine months of 2010 compared to the same period of 2009 due to lower salesvolumes at Judy Creek resulting from the previously mentioned turnaround, reduced third party miscible flood injection demandand production declines partially offset by increased NGL production from Carson Creek.
COMMODITY PRICECommodity MarketsBenchmark crude prices rallied during the quarter, surpassing the US$80 per bbl mark in August, but overall average prices wereslightly weaker compared to the second quarter. Overall WTI prices averaged US$76.21 per bbl in the third quarter, a slightdecrease of approximately two percent from the second quarter’s average of US$78.05 per bbl.
A warmer summer helped support natural gas prices at the beginning of the quarter, but weakened as an abundant inventorycoupled with a continuing over-supply of natural gas contributed to sustained weakness in natural gas prices. Short-term gasfundamentals remain challenged and subsequent to quarter end, NYMEX prices weakened further below the US$4.00 per mmbtumark. NYMEX gas prices averaged US$4.23 per mmbtu in the third quarter, an approximate three percent decline from secondquarter average price of US$4.35 per mmbtu. AECO spot natural gas prices continued to lag and averaged $3.36 per mmbtu duringthe quarter compared to $3.70 per mmbtu last quarter.
The U.S. to Canadian dollar exchange rate had a slight increase from the second quarter averaging $0.96(U.S.$/Cdn$) in the thirdquarter compared to $0.97 (U.S.$/Cdn$).
Average Realized Prices
Three months ended Nine months ended(Cdn$) Sept 30, 2010 June 30, 2010 Sept 30, 2009 Sept 30, 2010 Sept 30, 2009
Light crude oil (per bbl) 72.18 72.62 69.28 74.06 60.61
after realized commodity risk management 73.93 73.84 74.40 75.06 71.26
Heavy oil (per bbl) 57.80 56.49 59.21 60.15 49.71
Natural gas (per mcf) 3.56 3.83 2.82 4.22 3.86
after realized commodity risk management 4.67 4.86 4.34 5.05 5.03
Natural gas liquids (per bbl) 53.55 60.70 41.86 57.08 37.96
Total per boe 43.24 45.37 39.18 46.70 38.29
after realized commodity risk management 47.07 48.75 45.22 49.45 44.84
Other production income 0.40 0.28 0.03 0.27 0.10
Total oil and gas sales per boe 47.47 49.03 45.25 49.72 44.94
Benchmark prices
WTI oil (U.S.$ per bbl) 76.21 78.05 68.24 77.69 57.32
AECO spot gas (Cdn$ per mmbtu) 3.36 3.70 2.83 3.90 3.58
NYMEX gas (U.S.$ per mmbtu) 4.23 4.35 3.44 4.52 3.90
Currency (U.S.$/Cdn$) 0.96 0.97 0.91 0.97 0.85
14
TH
IRD
QU
AR
TE
RR
ES
UL
TS
PE
NG
RO
WT
H

Commodity Risk Management Gains (Losses)
Three months ended Nine months endedSept 30, 2010 June 30, 2010 Sept 30, 2009 Sept 30, 2010 Sept 30, 2009
Realized
Light crude oil ($ millions) 3.4 2.5 10.8 6.0 67.3
Light crude oil ($ per bbl) 1.75 1.22 5.12 1.00 10.65
Natural gas ($ millions) 22.3 20.8 32.6 50.0 76.0
Natural gas ($ per mcf) 1.11 1.03 1.52 0.83 1.17
Combined ($ millions) 25.7 23.3 43.4 56.0 143.3
Combined ($ per boe) 3.83 3.38 6.04 2.75 6.55
Unrealized
Total unrealized risk management (liabilities)assets at period end ($ millions) 50.4 51.3 31.1 50.4 31.1
Less: Unrealized risk management assets(liabilities)at beginning of period ($ millions) 51.3 54.3 36.7 (9.0) 164.7
Unrealized (loss) gain on risk managementcontracts (0.9) (3.0) (5.6) 59.4 (133.6)
Pengrowth’s average realized price was $47.07 per boe in the third quarter 2010, a three percent decrease from the second quarter2010 and a four percent increase over the third quarter of 2009. Lower benchmark natural gas prices contributed to the loweraverage price in the third quarter of 2010 relative to the second quarter. Conversely, higher benchmark crude oil prices contributedto the higher average realized price in the third quarter of 2010 compared to the third quarter of 2009. Despite liquid commodityprices remaining strong through the third quarter 2010, natural gas prices remained lower than the average price achieved throughour commodity risk management activities, resulting in a realized commodity risk management gain of $25.7 million compared togains of $23.3 million and $43.4 million in the second quarter of 2010 and third quarter of 2009, respectively.
On a year over year basis, average realized prices increased approximately 10 percent from the same period last year. Higher crudeoil prices were the main reason for the increase in the average realized price in the first nine months of 2010. Commodity priceswere significantly lower than our risk managed price in the first half of last year compared to the same period this year, whichresulted in significantly higher realized commodity risk management gains of $143.3 million in 2009 compared to $56.0 million forthe first nine months of 2010.
Pricing and Commodity Risk ManagementPengrowth’s commodity price realizations are influenced by benchmark prices. As part of our risk management strategy, Pengrowthuses forward price swaps to manage its exposure to commodity price fluctuations and to provide a measure of stability to cash flow.
The change in the fair value of the forward contracts between periods affects net income through the unrealized amounts recordedduring the period. The fair value of forward contracts is determined by comparing the contracted fixed price to the forward pricecurve at each period end.
The change in the forward price curve at the end of the third quarter of 2010 from the end of the second quarter of 2010 resulted inan unrealized commodity risk management loss of approximately $0.9 million. For the same period last year, the change in theforward price curve resulted in an unrealized risk management loss of $5.6 million.
For the nine months ended September 30, 2010, the unrealized commodity risk management gain of $59.4 million reflects a decreasein the forward price curve from year end 2009, largely for natural gas prices. In contrast, through the nine month period of 2009, anunrealized commodity risk management loss of $133.6 million was recorded as a result of an increase in the forward price curvemainly with respect to crude oil prices.
15
TH
IRD
QU
AR
TE
RR
ES
UL
TS
PE
NG
RO
WT
H

As of September 30, 2010, the following commodity risk management contracts were in place:
Crude Oil:Reference Point Volume (bbl/d) Remaining Term Price per bbl (2)
Financial:
WTI (1) 12,500 Oct 1, 2010 - Dec 31, 2010 $ 82.09WTI (1) 7,000 Jan 1, 2011 - Dec 31, 2011 $ 87.53WTI (1) 2,000 Jan 1, 2012 - Dec 31, 2012 $ 90.33
Natural Gas:Reference Point Volume (mmbtu/d) Remaining Term Price per mmbtu (2)
Financial:
AECO 97,151 Oct 1, 2010 - Dec 31, 2010 $ 6.10Chicago MI (1) 5,000 Oct 1, 2010 - Dec 31, 2010 $ 6.78AECO 45,021 Jan 1, 2011 - Dec 31, 2011 $ 5.60Chicago MI (1) 5,000 Jan 1, 2011 - Dec 31, 2011 $ 6.78
Power:Reference Point Volume (mwh) Remaining Term Price per mwh (2)
Financial:
AESO 20 Oct 1, 2010 - Dec 31, 2010 $ 47.66AESO 20 Jan 1, 2011 - Dec 31, 2011 $ 46.94
(1) Associated Cdn $/U.S. $ foreign exchange rate has been fixed.
(2) All prices are referenced in Canadian dollars
Based on 2010 production estimates, the above contracts in 2010 represent approximately 34 percent of total liquids volumes ataverage realizations of $82.09 per bbl and 45 percent of natural gas volumes at $6.13 per mmbtu. The power contract representsapproximately 20 percent of estimated 2010 consumption.
Each $1 per barrel change in future oil prices would result in approximately $4.4 million pre-tax change in the value of the crudecontracts. Similarly, each $0.25 per mcf change in future natural gas prices would result in approximately $6.9 million pre-taxchange in the value of the natural gas contracts. The changes in the fair value of the forward contracts directly affects reported netincome through the unrealized amounts recorded in the statement of income during the period. The effect on cash flow will berecognized separately only upon realization of the contracts, which could vary significantly from the unrealized amount recordeddue to timing and prices when each contract is settled. However, if each contract were to settle at the contract price in effect atSeptember 30, 2010, future revenue and cash flow would be $50.4 million higher than that otherwise achievable if the contractswere not in place based on the estimated fair value of the risk management asset at period end. The $50.4 million net asset iscomposed of a net asset of $46.1 million relating to contracts expiring within one year and a net asset of $4.3 million relating tocontracts expiring beyond one year. Pengrowth fixes the Canadian dollar exchange rate at the same time that it swaps U.S. dollardenominated commodity in order to protect against changes in the foreign exchange rate.
Each $1 per mwh change in future power prices would result in approximately $0.2 million pre-tax change in the fair value of therisk management contracts.
Pengrowth has not designated any outstanding commodity contracts as hedges for accounting purposes and therefore records thesecontracts on the balance sheet at their fair value and recognizes changes in fair value in the income statement as unrealizedcommodity risk management gains or losses. There will continue to be volatility in earnings to the extent that the fair value ofcommodity contracts fluctuate, however these non-cash amounts do not impact Pengrowth’s operating cash flow. Realizedcommodity risk management gains or losses are recorded in oil and gas sales on the income statement and impacts cash flow at thattime.
In accordance with policies approved by the Board of Directors, Pengrowth may hedge its production by product volume or powerconsumption as follows:
Percent of Monthly Company Interest Production Forward Period
Up to 65% 1 - 12 MonthsUp to 45% 13 - 24 MonthsUp to 30% 25 - 36 Months
16
TH
IRD
QU
AR
TE
RR
ES
UL
TS
PE
NG
RO
WT
H

Each natural gas hedge transaction shall not exceed 20,000 mmbtu per day. Each crude oil hedge transaction shall not exceed 2,500bbls per day. Each power consumption hedge transaction shall not exceed 25 mwh.
OIL AND GAS SALESContribution AnalysisThe following table shows the contribution of each product to the overall sales revenue including the impact of realized commodityrisk management activity.
Three months ended Nine months ended
Sales RevenueSept 30,
2010% oftotal
June 30,2010
% oftotal
Sept 30,2009
% oftotal
Sept 30,2010
% oftotal
Sept 30,2009
% oftotal
Light crude oil 142.6 45 146.9 44 157.0 48 445.4 44 450.2 46Natural gas 93.5 29 97.7 29 92.7 28 302.8 30 328.0 33Natural gas liquids 43.7 14 55.6 16 34.6 11 146.8 14 99.5 10Heavy oil 35.0 11 34.9 10 40.7 13 112.1 11 103.9 11Brokered sales/sulphur 2.7 1 1.9 1 0.3 – 5.5 1 2.3 –Total oil and gas sales 317.5 337.0 325.3 1,012.6 983.9
Price and Volume AnalysisThe following table illustrates the effect of changes in prices and volumes on the components of oil and gas sales including theimpact of realized commodity risk management activity, for the third quarter of 2010 compared to the third quarter of 2009.
($ millions) Light oil Natural gas NGLs Heavy oil Other (1) Total
Quarter ended September 30, 2009 157.0 92.7 34.6 40.7 0.3 325.3Effect of change in product prices 5.6 14.8 9.5 (0.9) – 29.0Effect of change in sales volumes (12.5) (3.8) (0.4) (4.9) – (21.6)Effect of change in realized commodity risk
management activities (7.4) (10.3) – – – (17.7)Other (0.1) 0.1 – 0.1 2.4 2.5Quarter ended September 30, 2010 142.6 93.5 43.7 35.0 2.7 317.5
(1) Primarily sulphur sales
The following table illustrates the effect of changes in prices and volumes on the components of oil and gas sales including theimpact of realized commodity risk management activity, for the first nine months of 2010 compared to same period of 2009.
($ millions) Light oil Natural gas NGLs Heavy oil Other (1) Total
Period ended September 30, 2009 450.2 328.0 99.5 103.9 2.3 983.9Effect of change in product prices 79.8 20.8 49.2 19.5 – 169.3Effect of change in sales volumes (23.3) (20.0) (1.8) (11.3) – (56.4)Effect of change in realized commodity risk
management activities (61.3) (26.0) – – – (87.3)Other – – (0.1) – 3.2 3.1Period ended September 30, 2010 445.4 302.8 146.8 112.1 5.5 1,012.6
(1) Primarily sulphur sales
ROYALTY EXPENSE
Three months ended Nine months ended
($ millions)Sept 30,
2010June 30,
2010Sept 30,
2009Sept 30,
2010Sept 30,
2009
Royalty expense 55.3 58.6 49.7 191.8 136.6$ per boe 8.26 8.53 6.91 9.42 6.24
Royalties as a percent of sales 17.4% 17.4% 15.3% 18.9% 13.9%Royalties as a percent of sales excluding realized risk management
contracts 18.9% 18.7% 17.6% 20.1% 16.3%
17
TH
IRD
QU
AR
TE
RR
ES
UL
TS
PE
NG
RO
WT
H

Royalties include Crown, freehold, overriding royalties and mineral taxes. Royalty payments are based on revenue prior tocommodity risk management activities. Gains or losses from realized commodity risk management activities are reported as part ofsales and therefore affect royalty rates as a percentage of sales. Third quarter royalty rates remained steady compared to the secondquarter of 2010. Higher liquid commodity prices are the main factor for the royalty rate increase in the third quarter and first ninemonths of 2010 compared to the same time periods of 2009 where commodity prices were lower and therefore benefitted fromchanges to the Alberta royalty regime that became effective January 1, 2009.
Royalty expense for 2010 is forecasted to be approximately 20 percent of Pengrowth’s sales excluding the impact of riskmanagement contracts.
OPERATING EXPENSES
Three months ended Nine months ended
($ millions)Sept 30,
2010June 30,
2010Sept 30,
2009Sept 30,
2010Sept 30,
2009
Operating expenses (1) 84.9 86.2 93.3 263.0 290.4
$ per boe 12.69 12.55 12.98 12.91 13.27
(1) Prior period restated to conform to presentation in the current period.
Operating expenses in the third quarter of 2010 were approximately two percent lower than the second quarter of 2010, onepercent higher on a per boe basis, directly attributable to lower production volumes in the current quarter. Lower power costs in thethird quarter 2010 more than offset higher subsurface maintenance and Judy Creek turnaround activity. Third quarter 2010operating costs compared to the third quarter of 2009 decreased nine percent primarily attributable to lower power costs in thecurrent year and the absence of unfavourable prior period adjustments stemming from previous property acquisitions. Continuedeffort in expense reduction initiatives when coupled with the previously mentioned absence of unfavourable prior periodadjustments, resulted in lower operating expenses in the current quarter and on a year-over-year basis.
Operating expense forecast has been reduced from $385 million to $370 million for the full year of 2010. This estimate includes theadditional operating costs resulting from the September 15, 2010 Monterey acquisition. The resulting per boe operating costs areestimated to be $13.60 per boe.
PROCESSING AND OTHER INCOME
Three months ended Nine months ended
($ millions)Sept 30,
2010June 30,
2010Sept 30,
2009Sept 30,
2010Sept 30,
2009
Processing & other income (1) 4.4 3.2 3.9 14.8 14.6
$ per boe 0.65 0.47 0.55 0.73 0.67
(1) Prior period restated to conform to presentation in the current period.
Processing and other income is primarily derived from sales of casinghead gas, fees charged for processing and gathering third partygas, road use, and oil and water processing. Third quarter income increased compared to the second quarter of 2010 due to norecurrence of the unfavorable $1.8 million prior period processing income adjustment at Tangleflags.
This income primarily represents the partial recovery of operating expenses reported separately.
NET OPERATING EXPENSES
Three months ended Nine months ended
($ millions)Sept 30,
2010June 30,
2010Sept 30,
2009Sept 30,
2010Sept 30,
2009
Net operating expenses 80.5 83.0 89.4 248.2 275.8
$ per boe 12.04 12.08 12.43 12.18 12.60
Included in the table above are operating expenses net of processing and other income.
18
TH
IRD
QU
AR
TE
RR
ES
UL
TS
PE
NG
RO
WT
H

TRANSPORTATION COSTS
Three months ended Nine months ended
($ millions)Sept 30,
2010June 30,
2010Sept 30,
2009Sept 30,
2010Sept 30,
2009
Light oil transportation 2.0 2.0 1.6 5.4 3.5
$ per bbl 1.05 1.02 0.78 0.91 0.55
Natural gas transportation 1.5 2.7 2.2 6.1 5.9
$ per mcf 0.08 0.13 0.10 0.10 0.09
Pengrowth incurs transportation costs for its natural gas production once the product enters a pipeline at a title transfer point.Pengrowth also incurs transportation costs on its oil production that includes clean oil trucking charges and pipeline costs up to thecustody transfer point. The transportation cost is dependent upon third party rates and distance the product travels on the pipelineprior to changing ownership or custody. Pengrowth has the option to sell some of its natural gas directly to markets outside ofAlberta by incurring additional transportation costs. Pengrowth sells most of its natural gas without incurring significant additionaltransportation costs. Similarly, Pengrowth has elected to sell approximately 75 percent of its crude oil at market points beyond thewellhead but at the first major trading point, requiring minimal transportation costs.
The increase in light oil transportation comparing the third quarters and first nine months of 2010 and 2009 is mainly attributableto trucking of sales quality product from Carson Creek to the sales point. Impacting natural gas transportation in the third quarterof 2010 is a $0.5 million adjustment relating to a previous quarter.
AMORTIZATION OF INJECTANTS FOR MISCIBLE FLOODS
Three months ended Nine months ended
($ millions)Sept 30,
2010June 30,
2010Sept 30,
2009Sept 30,
2010Sept 30,
2009
Purchased and capitalized 2.1 1.7 1.7 9.0 8.4
Amortization 3.5 4.0 4.8 12.0 15.6
The cost of injectants (primarily natural gas and ethane) purchased for injection in the miscible flood program at Judy Creek andSwan Hills is amortized equally over the period of expected future economic benefit. The costs of injectants purchased are amortizedover a 24 month period. As of September 30, 2010, the balance of unamortized injectant costs was $12.7 million.
The amount of injectants purchased and capitalized in the third quarter of 2010 were higher than the third quarter of 2009 due totiming and the requirements of this program. The value of Pengrowth’s proprietary injectants is not recorded as an asset or a sale;the cost of producing these injectants is included in operating expenses.
OPERATING NETBACKSThere is no standardized measure of operating netbacks and therefore operating netbacks, as presented below, may not becomparable to similar measures presented by other companies. Pengrowth’s operating netbacks have been calculated by takingGAAP balances directly from the income statement and dividing by production. Certain assumptions have been made in allocatingoperating expenses, processing and other income and royalty injection credits between light crude, heavy oil, natural gas and NGLproduction.
Pengrowth recorded an average operating netback of $26.12 per boe in the third quarter of 2010 compared to $27.16 per boe in thesecond quarter of 2010 and $24.72 per boe for the third quarter of 2009. The decrease in the netback in the third quarter of 2010compared to the second quarter of 2010 is primarily due to lower combined commodity prices. For the third quarter and first ninemonths of 2010, operating netbacks were higher than the same periods of 2009 as a result of higher combined commodity pricesoffset by higher royalties.
19
TH
IRD
QU
AR
TE
RR
ES
UL
TS
PE
NG
RO
WT
H

The sales price used in the calculation of operating netbacks is after realized commodity risk management gains or losses.
Three months ended Nine months ended
Combined Netbacks ($ per boe)Sept 30,
2010June 30,
2010Sept 30,
2009Sept 30,
2010Sept 30,
2009
Oil & gas sales 47.47 49.03 45.25 49.72 44.94Processing and other income (1) 0.65 0.47 0.55 0.73 0.67Royalties (8.26) (8.53) (6.91) (9.42) (6.24)Operating expenses (1) (12.69) (12.55) (12.98) (12.91) (13.27)Transportation costs (0.53) (0.68) (0.52) (0.56) (0.43)Amortization of injectants (0.52) (0.58) (0.67) (0.59) (0.71)Operating netback 26.12 27.16 24.72 26.97 24.96
Three months ended Nine months ended
Light Crude Netbacks ($ per bbl)Sept 30,
2010June 30,
2010Sept 30,
2009Sept 30,
2010Sept 30,
2009
Sales price (after commodity risk management) 73.93 73.84 74.40 75.06 71.26Other production income 0.94 0.46 0.43 0.57 0.35Oil & gas sales 74.87 74.30 74.83 75.63 71.61Processing and other income 0.34 0.37 0.34 0.43 0.79Royalties (15.04) (18.81) (15.94) (17.32) (12.47)Operating expenses (1) (14.01) (16.01) (15.69) (15.57) (15.91)Transportation costs (1.05) (1.02) (0.78) (0.91) (0.55)Amortization of injectants (1.81) (1.81) (2.29) (2.02) (2.46)Operating netback (1) 43.30 37.02 40.47 40.24 41.01
Three months ended Nine months ended
Heavy Oil Netbacks ($ per bbl)Sept 30,
2010June 30,
2010Sept 30,
2009Sept 30,
2010Sept 30,
2009
Oil & gas sales 57.80 56.49 59.21 60.15 49.71Processing and other income (2) 1.20 (2.78) 1.05 0.04 0.97Royalties (9.89) (13.31) (6.74) (12.03) (7.67)Operating expenses (1) (3) (17.22) (12.94) (14.46) (15.65) (15.09)Operating netback(1) 31.89 27.46 39.06 32.51 27.92
Three months ended Nine months ended
Natural Gas Netbacks ($ per mcf)Sept 30,
2010June 30,
2010Sept 30,
2009Sept 30,
2010Sept 30,
2009
Sales price (after commodity risk management) 4.67 4.86 4.34 5.05 5.03Other production income 0.04 0.05 (0.03) 0.03 –Oil & gas sales 4.71 4.91 4.31 5.08 5.03Processing and other income (1) 0.15 0.21 0.12 0.20 0.12Royalties (4) (0.45) (0.07) (0.12) (0.46) (0.22)Operating expenses (1) (1.88) (1.84) (1.89) (2.01) (1.93)Transportation costs (0.08) (0.13) (0.10) (0.10) (0.09)Operating netback (1) 2.45 3.08 2.32 2.71 2.91
Three months ended Nine months ended
NGLs Netbacks ($ per bbl)Sept 30,
2010June 30,
2010Sept 30,
2009Sept 30,
2010Sept 30,
2009
Oil & gas sales 53.55 60.70 41.87 57.08 37.96Royalties (13.77) (12.57) (10.70) (15.10) (10.41)Operating expenses (1) (12.02) (10.17) (12.00) (11.66) (12.37)Operating netback (1) 27.76 37.96 19.17 30.32 15.18
(1) Prior period restated to conform to presentation in the current period.
(2) Heavy oil processing and other income includes a prior period adjustment for processing income at Tangleflags.
20
TH
IRD
QU
AR
TE
RR
ES
UL
TS
PE
NG
RO
WT
H
(3) Q2 Operating expenses reflect the change a prior period adjustment to Emulsion Fees at Tangleflags for (2007-2010).
(4) Gas royalties in Q2 decreased due to revisions by the Crown for gas cost allowance and Carson Creek new wells being granted status under theNew Well Royalty Reduction Program.
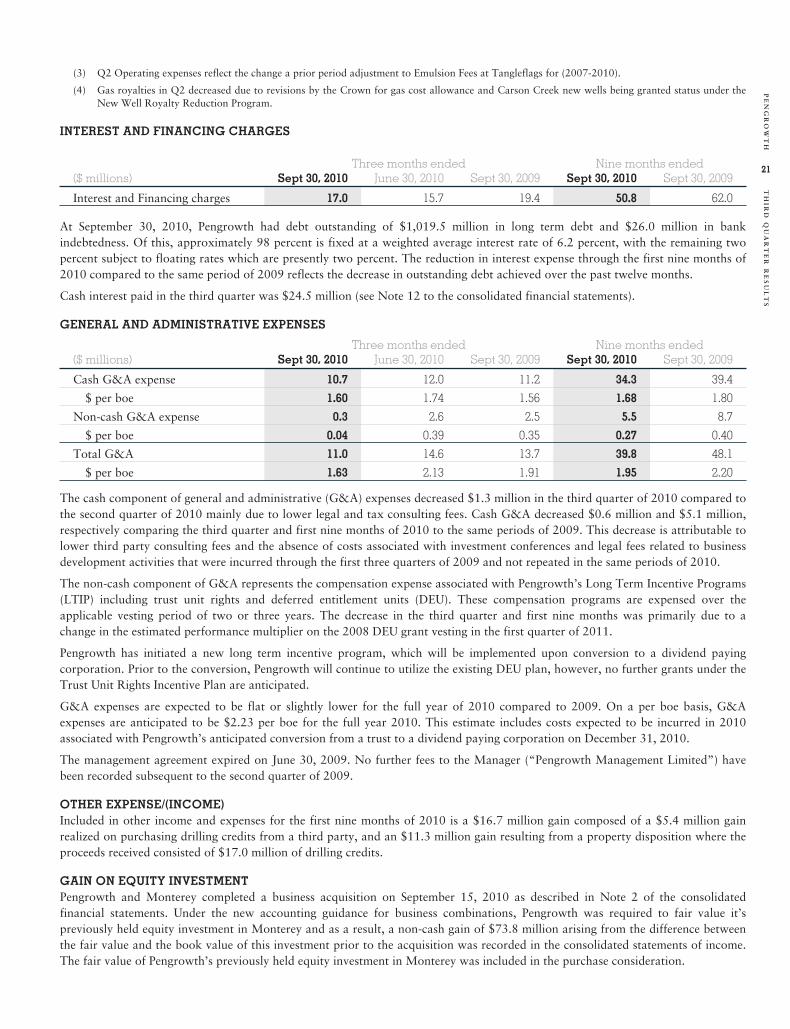
INTEREST AND FINANCING CHARGES
Three months ended Nine months ended($ millions) Sept 30, 2010 June 30, 2010 Sept 30, 2009 Sept 30, 2010 Sept 30, 2009
Interest and Financing charges 17.0 15.7 19.4 50.8 62.0
At September 30, 2010, Pengrowth had debt outstanding of $1,019.5 million in long term debt and $26.0 million in bankindebtedness. Of this, approximately 98 percent is fixed at a weighted average interest rate of 6.2 percent, with the remaining twopercent subject to floating rates which are presently two percent. The reduction in interest expense through the first nine months of2010 compared to the same period of 2009 reflects the decrease in outstanding debt achieved over the past twelve months.
Cash interest paid in the third quarter was $24.5 million (see Note 12 to the consolidated financial statements).
GENERAL AND ADMINISTRATIVE EXPENSES
Three months ended Nine months ended($ millions) Sept 30, 2010 June 30, 2010 Sept 30, 2009 Sept 30, 2010 Sept 30, 2009
Cash G&A expense 10.7 12.0 11.2 34.3 39.4
$ per boe 1.60 1.74 1.56 1.68 1.80
Non-cash G&A expense 0.3 2.6 2.5 5.5 8.7
$ per boe 0.04 0.39 0.35 0.27 0.40
Total G&A 11.0 14.6 13.7 39.8 48.1
$ per boe 1.63 2.13 1.91 1.95 2.20
The cash component of general and administrative (G&A) expenses decreased $1.3 million in the third quarter of 2010 compared tothe second quarter of 2010 mainly due to lower legal and tax consulting fees. Cash G&A decreased $0.6 million and $5.1 million,respectively comparing the third quarter and first nine months of 2010 to the same periods of 2009. This decrease is attributable tolower third party consulting fees and the absence of costs associated with investment conferences and legal fees related to businessdevelopment activities that were incurred through the first three quarters of 2009 and not repeated in the same periods of 2010.
The non-cash component of G&A represents the compensation expense associated with Pengrowth’s Long Term Incentive Programs(LTIP) including trust unit rights and deferred entitlement units (DEU). These compensation programs are expensed over theapplicable vesting period of two or three years. The decrease in the third quarter and first nine months was primarily due to achange in the estimated performance multiplier on the 2008 DEU grant vesting in the first quarter of 2011.
Pengrowth has initiated a new long term incentive program, which will be implemented upon conversion to a dividend payingcorporation. Prior to the conversion, Pengrowth will continue to utilize the existing DEU plan, however, no further grants under theTrust Unit Rights Incentive Plan are anticipated.
G&A expenses are expected to be flat or slightly lower for the full year of 2010 compared to 2009. On a per boe basis, G&Aexpenses are anticipated to be $2.23 per boe for the full year 2010. This estimate includes costs expected to be incurred in 2010associated with Pengrowth’s anticipated conversion from a trust to a dividend paying corporation on December 31, 2010.
The management agreement expired on June 30, 2009. No further fees to the Manager (“Pengrowth Management Limited”) havebeen recorded subsequent to the second quarter of 2009.
OTHER EXPENSE/(INCOME)Included in other income and expenses for the first nine months of 2010 is a $16.7 million gain composed of a $5.4 million gainrealized on purchasing drilling credits from a third party, and an $11.3 million gain resulting from a property disposition where theproceeds received consisted of $17.0 million of drilling credits.
GAIN ON EQUITY INVESTMENTPengrowth and Monterey completed a business acquisition on September 15, 2010 as described in Note 2 of the consolidatedfinancial statements. Under the new accounting guidance for business combinations, Pengrowth was required to fair value it’spreviously held equity investment in Monterey and as a result, a non-cash gain of $73.8 million arising from the difference betweenthe fair value and the book value of this investment prior to the acquisition was recorded in the consolidated statements of income.The fair value of Pengrowth’s previously held equity investment in Monterey was included in the purchase consideration.
21
TH
IRD
QU
AR
TE
RR
ES
UL
TS
PE
NG
RO
WT
H

TAXESIn determining its taxable income, the Corporation deducts payments made to the Trust, effectively transferring the income taxliability to unitholders thus reducing the Corporation’s taxable income to nil. Under the Corporation’s current distribution policy, atthe discretion of the board, funds can be withheld to fund future capital expenditures, repay debt or used for other corporatepurposes. If withholdings increased sufficiently or the Corporation’s tax pool balances were reduced sufficiently, the Corporationcould become subject to taxation on a portion of its income in the future. This can be mitigated through various options includingthe issuance of additional trust units, increased tax pools from additional capital spending, modifications to the distribution policyor potential changes to the corporate structure.
Bill C-52 Budget Implementation Act 2007Bill C-52 modifies the taxation of certain flow-through entities including mutual fund trusts referred to as “specified investmentflow-through” entities or “SIFTS” and the taxation of distributions from such entities (the “SIFT Legislation”). Bill C-52 applies atax at the trust level on distributions of certain income from such a SIFT trust at a rate of tax comparable to the combined federaland provincial corporate tax rate (the “SIFT tax”). These distributions will be treated as dividends to the trust unitholders.
Pengrowth believes that it is characterized as a SIFT trust and, as a result, will be subject to Bill C-52 commencing on January 1,2011 subject to the qualification below regarding the possible loss of the four year grandfathering period in the case of “undueexpansion”. Pengrowth may lose the benefit of the grandfathering period, which ends December 31, 2010, if Pengrowth exceeds thelimits on the issuance of new trust units and convertible debt that constitute normal growth during the grandfathering period(subject to certain exceptions). As of September 30, 2010 Pengrowth may issue an additional $3.4 billion of equity in total for 2010,under the safe harbour provisions. The normal growth restriction on trust unit issuance is monitored by management as part of theoverall capital management objectives. Pengrowth is in compliance with the normal growth restrictions.
Based on existing tax legislation, the SIFT tax rate in 2011 is expected to be 26.5 percent and 25 percent in 2012 and subsequentyears. The payment of this tax would reduce the amount of cash available for distribution to unitholders should Pengrowth remain atrust.
Pengrowth can continue to have the benefit of its tax structure through December 31, 2010. Pengrowth currently anticipatesconverting to a dividend paying corporation on December 31, 2010. Pengrowth has available tax pool balances of approximately$2.9 billion at September 30, 2010, which will be used to reduce any corporate cash taxes otherwise payable.
Future Income TaxesFuture income tax is a non-cash item relating to temporary differences between the accounting and tax basis of Pengrowth’s assetsand liabilities and has no immediate impact on Pengrowth’s cash flows. During the quarter-ended September 30, 2010, Pengrowthrecorded a future tax reduction of $11.9 million. The future income tax reduction includes approximately $17.4 million related tothe taxable income at the trust level where both the income tax and future tax liabilities are currently the responsibility of theunitholders, offset by temporary differences relating to unrealized risk management gains. See Note 7 to the financial statements foradditional information.
FOREIGN CURRENCY GAINS & LOSSES
Three months ended Nine months ended
$ millionsSept 30,
2010June 30,
2010Sept 30,
2009Sept 30,
2010Sept 30,
2009
Unrealized foreign exchange gain (loss) on translation of U.S.dollar denominated debt 32.1 (42.9) 79.8 19.7 127.4
Unrealized foreign exchange (loss) gain on translation of U.K.pound sterling denominated debt (1.3) (2.5) 10.1 4.1 3.2
30.8 (45.4) 89.9 23.8 130.6
Unrealized (loss) gain on foreign exchange risk managementcontract on U.K. pound sterling denominated debt (0.2) 3.2 (9.4) (3.6) 0.5
Total Unrealized foreign exchange gain (loss) 30.6 (42.2) 80.5 20.2 131.1
Realized foreign exchange gain (loss) 0.5 (2.5) 1.1 (2.0) 0.6
The total unrealized foreign exchange gain in the third quarter was $30.6 million compared to an unrealized foreign exchange lossof $42.2 million and an unrealized foreign exchange gain of $80.5 million in the second quarter 2010 and third quarter 2009,respectively. The primary source of Pengrowth’s unrealized foreign exchange gains and losses is attributed to the translation of thecompany’s foreign denominated term debt. The gains or losses are calculated by comparing the translated Canadian dollar balanceof foreign denominated debt from one quarter end to another. The unrealized foreign exchange gain this quarter was mainly theresult of an increase in the closing exchange rate of the Canadian dollar to U.S. dollar since June 30, 2010.
22
TH
IRD
QU
AR
TE
RR
ES
UL
TS
PE
NG
RO
WT
H

As some realized commodity prices are derived from U.S. denominated benchmarks, a weaker U.S. dollar negatively impacts oil andgas revenues. To mitigate this, Pengrowth elects to hold a portion of its long term debt in U.S. dollars as a natural hedge. Therefore,a decline in revenues as a result of foreign exchange fluctuations will be partially offset by a reduction in U.S. dollar interest expense.
DEPLETION, DEPRECIATION AND ACCRETION
Three months ended Nine months ended($ millions) Sept 30, 2010 June 30, 2010 Sept 30, 2009 Sept 30, 2010 Sept 30, 2009
Depletion and depreciation 128.8 134.4 147.2 397.0 447.1
$ per boe 19.25 19.56 20.48 19.49 20.42
Accretion 5.8 5.8 7.0 17.2 20.6
$ per boe 0.87 0.83 0.97 0.84 0.94
Depletion and depreciation of property, plant and equipment is calculated using the unit of production method based on totalproved reserves. The reduced capital program in 2009 which contributed to a declining cost base and lower production volumeswere the main reasons for the decrease in depletion expense period over period. The depletion rate decreased from the secondquarter of 2010 due mainly to reserve additions from the Monterey acquisition which closed late in the quarter.
Pengrowth’s Asset Retirement Obligations (ARO) liability is increased for the passage of time (unwinding of the discount) through acharge to earnings that is referred to as accretion. Accretion is charged to net income over the lifetime of the producing oil and gasassets. Accretion expense decreased comparing the third quarter of 2010 with the third quarter of 2009 primarily as a result of arevision that occurred at the end of the fourth quarter 2009 which reduced the ARO liability.
ASSET RETIREMENT OBLIGATIONSThe total future ARO is based on management’s estimate of costs to remediate, reclaim and abandon wells and facilities havingregard for Pengrowth’s working interest and the estimated timing of the costs to be incurred in future periods. Pengrowth hasdeveloped an internal process to calculate these estimates which considers applicable regulations, actual and anticipated costs, typeand size of well or facility and the geographic location.
In the third quarter of 2010, the inflation rate used to calculate the ARO was reduced from two percent per annum to one and onehalf percent per annum based on historical price inflation. The inflation rate is based on current expectations and experience. Thechange in estimate was made on a prospective basis and resulted in a reduction of $22.5 million to the ARO liability in the period, acorresponding adjustment was made to the related asset. Pengrowth has estimated the net present value of its total ARO to be $283million as at September 30, 2010 (December 31, 2009 – $289 million), based on a total escalated future liability of $1.7 billion(December 31, 2009 – $2.0 billion). These costs are expected to be incurred over 50 years with the majority of the costs incurredbetween 2039 and 2056. A credit adjusted risk free rate of eight percent was used to calculate the net present value of the ARO.
Pengrowth takes a proactive approach to managing its well abandonment and site restoration obligations. There is an on-goingprogram to abandon wells and reclaim well and facility sites. Through September 30, 2010, Pengrowth spent $12.1 million onabandonment and reclamation (September 30, 2009 – $11.1 million). Pengrowth expects to spend approximately $20 million in2010 on reclamation and abandonment, excluding contributions to remediation trust funds.
WORKING CAPITALThe working capital deficiency, including the current portion of long term debt, decreased at September 30, 2010 by $110.2 millioncompared to September 30, 2009. The change in working capital is primarily attributable to the repayment of the US $150 millionterm notes on April 23, 2010. The repayment of the U.S. term notes were financed with the issuance of new U.S. dollar term notes inMay 2010.
23
TH
IRD
QU
AR
TE
RR
ES
UL
TS
PE
NG
RO
WT
H
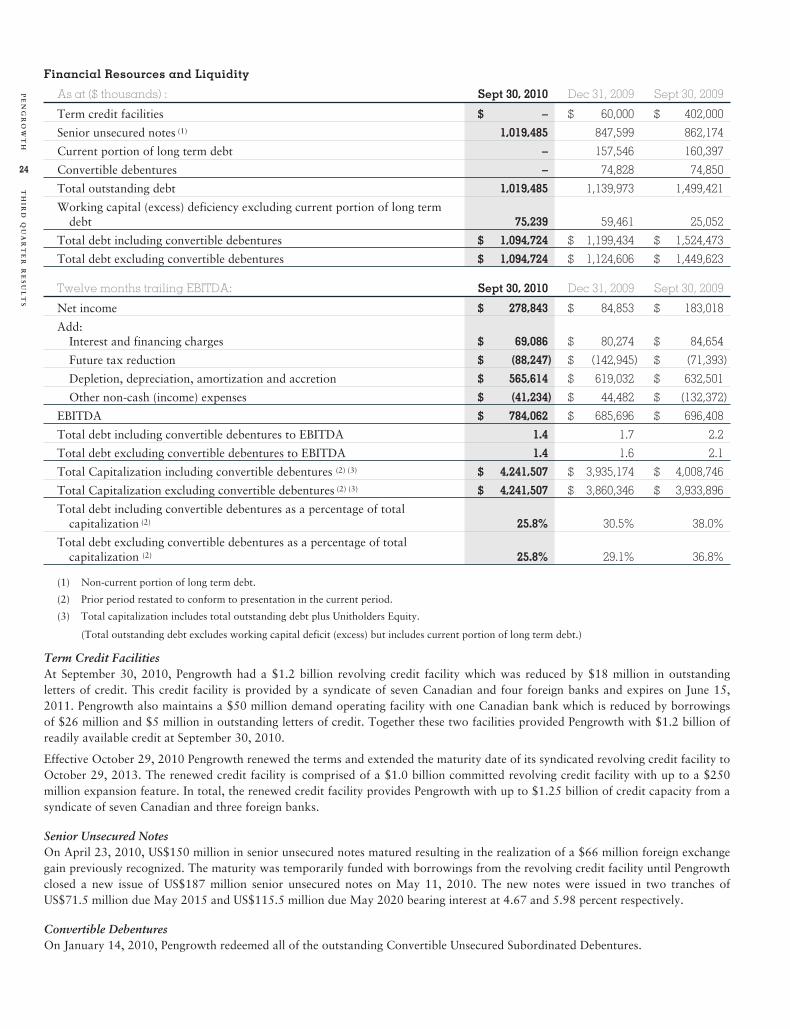
Financial Resources and Liquidity
As at ($ thousands) : Sept 30, 2010 Dec 31, 2009 Sept 30, 2009
Term credit facilities $ – $ 60,000 $ 402,000
Senior unsecured notes (1) 1,019,485 847,599 862,174
Current portion of long term debt – 157,546 160,397
Convertible debentures – 74,828 74,850
Total outstanding debt 1,019,485 1,139,973 1,499,421
Working capital (excess) deficiency excluding current portion of long termdebt 75,239 59,461 25,052
Total debt including convertible debentures $ 1,094,724 $ 1,199,434 $ 1,524,473
Total debt excluding convertible debentures $ 1,094,724 $ 1,124,606 $ 1,449,623
Twelve months trailing EBITDA: Sept 30, 2010 Dec 31, 2009 Sept 30, 2009
Net income $ 278,843 $ 84,853 $ 183,018
Add:Interest and financing charges $ 69,086 $ 80,274 $ 84,654
Future tax reduction $ (88,247) $ (142,945) $ (71,393)
Depletion, depreciation, amortization and accretion $ 565,614 $ 619,032 $ 632,501
Other non-cash (income) expenses $ (41,234) $ 44,482 $ (132,372)
EBITDA $ 784,062 $ 685,696 $ 696,408
Total debt including convertible debentures to EBITDA 1.4 1.7 2.2
Total debt excluding convertible debentures to EBITDA 1.4 1.6 2.1
Total Capitalization including convertible debentures (2) (3) $ 4,241,507 $ 3,935,174 $ 4,008,746
Total Capitalization excluding convertible debentures (2) (3) $ 4,241,507 $ 3,860,346 $ 3,933,896
Total debt including convertible debentures as a percentage of totalcapitalization (2) 25.8% 30.5% 38.0%
Total debt excluding convertible debentures as a percentage of totalcapitalization (2) 25.8% 29.1% 36.8%
(1) Non-current portion of long term debt.
(2) Prior period restated to conform to presentation in the current period.
(3) Total capitalization includes total outstanding debt plus Unitholders Equity.
(Total outstanding debt excludes working capital deficit (excess) but includes current portion of long term debt.)
Term Credit FacilitiesAt September 30, 2010, Pengrowth had a $1.2 billion revolving credit facility which was reduced by $18 million in outstandingletters of credit. This credit facility is provided by a syndicate of seven Canadian and four foreign banks and expires on June 15,2011. Pengrowth also maintains a $50 million demand operating facility with one Canadian bank which is reduced by borrowingsof $26 million and $5 million in outstanding letters of credit. Together these two facilities provided Pengrowth with $1.2 billion ofreadily available credit at September 30, 2010.
Effective October 29, 2010 Pengrowth renewed the terms and extended the maturity date of its syndicated revolving credit facility toOctober 29, 2013. The renewed credit facility is comprised of a $1.0 billion committed revolving credit facility with up to a $250million expansion feature. In total, the renewed credit facility provides Pengrowth with up to $1.25 billion of credit capacity from asyndicate of seven Canadian and three foreign banks.
Senior Unsecured NotesOn April 23, 2010, US$150 million in senior unsecured notes matured resulting in the realization of a $66 million foreign exchangegain previously recognized. The maturity was temporarily funded with borrowings from the revolving credit facility until Pengrowthclosed a new issue of US$187 million senior unsecured notes on May 11, 2010. The new notes were issued in two tranches ofUS$71.5 million due May 2015 and US$115.5 million due May 2020 bearing interest at 4.67 and 5.98 percent respectively.
Convertible DebenturesOn January 14, 2010, Pengrowth redeemed all of the outstanding Convertible Unsecured Subordinated Debentures.
24
TH
IRD
QU
AR
TE
RR
ES
UL
TS
PE
NG
RO
WT
H

Financial CovenantsPengrowth’s senior unsecured notes and credit facilities are subject to a number of covenants, all of which were met at all timesduring the preceding 12 months, and at September 30, 2010. All loan agreements are filed on SEDAR (www.sedar.com) as “Other”or “Material Document”.
The calculation for each financial covenant is based on specific definitions, is not in accordance with GAAP and cannot be readilyreplicated by referring to Pengrowth’s financial statements. The financial covenants are substantially similar between the creditfacilities and the senior unsecured notes.
Key financial covenants are summarized below:
1. Total senior debt must not exceed 3.0 times EBITDA for the last four fiscal quarters;
2. Total debt must not exceed 3.5 times EBITDA for the last four fiscal quarters;
3. Total senior debt must be less than 50 percent of total book capitalization; and
4. EBITDA must not be less than four times interest expense.
There may be instances, such as financing an acquisition, where it would be acceptable for total debt to trailing EBITDA to betemporarily offside. In the event of a significant acquisition, certain credit facility financial covenants are relaxed for two fiscalquarters after the close of the acquisition. Pengrowth may prepare pro forma financial statements for debt covenant purposes andhas additional flexibility under its debt covenants for a set period of time. This would be a strategic decision recommended bymanagement and approved by the Board of Directors with steps taken in the subsequent period to restore Pengrowth’s capitalstructure based on its capital management objectives.
Failing a financial covenant may result in one or more of Pengrowth’s loans being in default. In certain circumstances, being indefault of one loan will, absent a cure, result in other loans also being in default. In the event that non compliance continued,Pengrowth would have to repay the debt, refinance the debt or negotiate new terms with the debt holders and may have to suspenddistributions to unitholders.
If certain financial ratios reach or exceed certain levels, management may consider steps to improve these ratios. These steps mayinclude, but are not limited to, raising equity, property dispositions, reducing capital expenditures or distributions. Details of thesemeasures are included in Note 19 to the December 31, 2009, audited consolidated financial statements.
Distribution Reinvestment PlanUnitholders are eligible to participate in the Distribution Reinvestment Plan (DRIP). DRIP entitles the unitholder to reinvest cashdistributions in additional units of the Trust. The trust units under the plan are issued from treasury at a five percent discount to theweighted average closing price of all trust units traded on the TSX for the 20 trading days preceding a distribution payment date.For the period ended September 30, 2010, 1.5 million trust units were issued for cash proceeds of $15.5 million under the DRIPcompared to 2.5 million trust units for cash proceeds of $21.2 million at September 30, 2009.
Pengrowth does not have any off balance sheet financing arrangements.
FINANCIAL INSTRUMENTSFinancial instruments are utilized by Pengrowth to manage its exposure to commodity price fluctuations, foreign currency andinterest rate exposures. Pengrowth’s policy is not to utilize financial instruments for trading or speculative purposes. Please see Note2 to the audited consolidated financial statements for the year ended December 31, 2009, for a description of the accounting policiesfor financial instruments. Please see Note 15 to the September 30, 2010 financial statements for additional information regardingmarket risk, credit risk, liquidity risk and fair value of Pengrowth’s financial instruments.
25
TH
IRD
QU
AR
TE
RR
ES
UL
TS
PE
NG
RO
WT
H

CASH FLOW AND DISTRIBUTIONSThe following table provides cash flow from operating activities, net income and distributions declared with the excess (shortfall)over distributions and the ratio of distributions declared over cash flow from operating activities:
Three months ended Nine months ended($ thousands, except per trust unitand ratios) Sept 30, 2010 June 30, 2010 Sept 30, 2009 Sept 30, 2010 Sept 30, 2009
Cash flow from operating activities 159,926 161,550 162,915 468,212 401,417
Net (loss) income 125,632 (6,128) 78,290 228,320 34,330
Distributions declared 65,254 61,175 72,235 187,466 226,973
Distributions declared per trust unit 0.21 0.21 0.27 0.63 0.87
Excess of cash flow from operatingactivities over distributionsdeclared 94,672 100,375 90,680 280,746 174,444
Per trust unit 0.32 0.34 0.35 0.96 0.68
Surplus (Shortfall) of net income(loss) over distributions declared 60,378 (67,303) 6,055 40,854 (192,643)
Per trust unit 0.20 (0.23) 0.02 0.14 (0.75)
Ratio of distributions declared overcash flow from operating activities 41% 38% 44% 40% 57%
Distributions typically exceed net income as a result of non-cash expenses which may include unrealized losses on commodity risk;depletion, depreciation, and amortization; future income tax expense; trust unit based compensation; and accretion. These non-cashexpenses result in a reduction to net income, with no impact to cash flow from operating activities. Accordingly, we expect thatdistributions will exceed net income in most periods. In most periods, we would expect distributions plus capital expenditures to notexceed cash flow from operating activities. In the event distributions plus capital expenditures exceed cash flow from operatingactivities, the shortfall would be funded by available bank facilities. The most likely circumstance for this to occur would be wherethere is a significant negative impact to working capital during the reporting period. Pengrowth’s goal over longer periods is tomaintain or modestly grow production and reserves on a debt adjusted per unit basis.
As a result of the depleting nature of Pengrowth’s oil and gas assets, capital expenditures are required to offset production declineswhile other capital is required to maintain facilities, acquire prospective lands and prepare future projects. Capital spending andacquisitions may be funded by the excess of cash flow from operating activities over distributions declared, through additional debtor the issuance of equity. Pengrowth does not deduct capital expenditures when calculating cash flow from operating activities.However, Pengrowth does deduct costs associated with environmental activities when calculating cash flow from operatingactivities.
Notwithstanding the fact that cash flow from operating activities normally exceeds distributions, the difference has historically notbeen sufficient to fund the capital spending required to fully replace production. To fully replace production we would requireadditional capital which would be funded by additional amounts withheld from distributions, equity or a combination of equity anddebt. Accordingly, Pengrowth believes our distributions include a return of capital. Forecasted capital spending in 2010 of $350million, before drilling credits, will not be sufficient to fully replace the oil and gas reserves Pengrowth expects to produce during theyear. If the produced reserves are not replaced in the future by successful capital programs or acquisitions, future distributions couldbe impacted. Pengrowth has historically paid distributions at a level that includes a portion which is a return of capital to itsinvestors. From time to time Pengrowth may issue additional trust units to repay debt, fund capital programs and acquisitions.Investors can elect to participate in the distribution re-investment program.
Cash flow from operating activities is derived from producing and selling oil, natural gas and related products. As such, cash flowfrom operating activities is highly dependent on commodity prices. Pengrowth entered into forward commodity contracts to mitigateprice volatility and to provide a measure of stability to monthly cash flow. Details of commodity contracts are contained in Note 15to the financial statements.
The board of directors and management regularly review the level of distributions. The board considers a number of factors,including expectations of future commodity prices, capital expenditure requirements, and the availability of debt and equity capital.As a result of the volatility in commodity prices, changes in production levels and capital expenditure requirements, there can be nocertainty that Pengrowth will be able to maintain current levels of distributions and distributions can and may fluctuate in thefuture. To maintain its financial flexibility, Pengrowth reduced its monthly distributions in October 2009 to $0.07 per trust unit. Inthe current production and price environment, the possibility of suspending distributions in the near future is unlikely, but theamount of distribution may vary. Pengrowth has no restrictions on the payment of its distributions other than maintaining itsfinancial covenants in its borrowings.
26
TH
IRD
QU
AR
TE
RR
ES
UL
TS
PE
NG
RO
WT
H

Cash distributions are generally paid to unitholders on or about the 15th day of the month. Pengrowth both paid and declared $0.21per trust unit as cash distributions in each of the first, second and third quarters of 2010.
TAXABILITY OF DISTRIBUTIONSIn 2010, 100 percent of Pengrowth’s 2010 distributions are anticipated to be taxable to Canadian residents. Distributions paid toU.S. residents are treated as dividends. Distributions to U.S. residents are currently subject to a 15 percent Canadian withholdingtax. The Canadian withholding tax rate on distributions paid to unitholders in other countries varies based on individual taxtreaties.
SUMMARY OF QUARTERLY RESULTSThe following table is a summary of quarterly information for 2010, 2009 and 2008.
2010 Q1 Q2 Q3
Oil and gas sales ($000’s) 358,131 336,957 317,505
Net income/(loss) ($000’s) 108,816 (6,128) 125,632
Net income/(loss) per trust unit ($) 0.37 (0.02) 0.42
Net income/(loss) per trust unit – diluted ($) 0.37 (0.02) 0.42
Cash flow from operating activities ($000’s) 146,736 161,550 159,926
Distributions declared ($000’s) 61,037 61,175 65,254
Distributions declared per trust unit ($) 0.21 0.21 0.21
Daily production (boe) 75,627 75,517 72,704
Total production (mboe) 6,806 6,872 6,689
Average realized price ($ per boe) 52.49 48.75 47.07
Operating netback ($ per boe) 27.58 27.16 26.12
2009 Q1 Q2 Q3 Q4
Oil and gas sales ($000’s) 322,973 335,634 325,264 359,296
Net income/(loss) ($000’s) (54,232) 10,272 78,290 50,523
Net income/(loss) per trust unit ($) (0.21) 0.04 0.30 0.18
Net income/(loss) per trust unit – diluted ($) (0.21) 0.04 0.30 0.18
Cash flow from operating activities ($000’s) 94,386 144,116 162,915 149,933
Distributions declared ($000’s) 77,212 77,526 72,235 60,880
Distributions declared per trust unit ($) 0.30 0.30 0.27 0.21
Daily production (boe) 80,284 82,171 78,135 77,529
Total production (mboe) 7,226 7,478 7,188 7,133
Average realized price ($ per boe) 44.57 44.74 45.22 50.35
Operating netback ($ per boe) 23.87 26.28 24.72 26.63
2008 Q1 Q2 Q3 Q4
Oil and gas sales ($000’s) 457,606 550,623 518,662 392,158
Net income/(loss) ($000’s) (56,583) (118,650) 422,395 148,688
Net income/(loss) per trust unit ($) (0.23) (0.48) 1.69 0.58
Net income/(loss) per trust unit – diluted ($) (0.23) (0.48) 1.69 0.58
Cash flow from operating activities ($000’s) 216,238 267,874 273,597 154,807
Distributions declared ($000’s) 167,234 168,159 170,959 144,663
Distributions declared per trust unit ($) 0.675 0.675 0.675 0.565
Daily production (boe) 82,711 80,895 80,981 83,373
Total production (mboe) 7,527 7,361 7,450 7,670
Average realized price ($ per boe) 60.30 73.21 67.71 50.34
Operating netback ($ per boe) 33.62 42.15 37.48 26.23
27
TH
IRD
QU
AR
TE
RR
ES
UL
TS
PE
NG
RO
WT
H
In addition to natural decline, production changes over these quarters was a result of non-core property dispositions in the fourthquarter of 2009 and production limitations due to plant turnarounds and unscheduled maintenance in the second and third quartersof both 2009 and 2008 partly offset by a property acquisition in the fourth quarter of 2008. Changes in commodity prices haveaffected oil and gas sales, which have been partially muted by risk management activity to mitigate price volatility and to provide ameasure of stability to monthly cash flow. Quarterly net income (loss) in 2010, 2009 and 2008 has been impacted by non-cashcharges, in particular depletion, depreciation and amortization, accretion of ARO, unrealized mark-to-market gains and losses,unrealized foreign exchange gains and losses, and future taxes. Cash flow has not been impacted by the non-cash charges, however itdoes reflect the impact of changes in operating and general and administrative costs.
BUSINESS RISKSThe amount of distributions available to unitholders and the value of Pengrowth trust units are subject to numerous risk factors. Asthe trust units allow investors to participate in the net cash flow from Pengrowth’s portfolio of producing oil and natural gasproperties, the principal risk factors that are associated with the oil and gas business include, but are not limited to, the followinginfluences:
Risks associated with Commodity Prices• The prices of Pengrowth’s products (crude oil, natural gas, and NGLs) fluctuate due to many factors including local and global
market supply and demand, weather patterns, pipeline transportation and political and economic stability.
• Production could be shut-in at specific wells or fields in low commodity prices.
• Substantial and sustained reductions in commodity prices or equity markets, including Pengrowth’s unit price, in somecircumstances could result in Pengrowth reducing the recorded book value of some of its assets.
Risks associated with Liquidity• Capital markets may restrict Pengrowth’s access to capital and raise its borrowing costs. To the extent that external sources of
capital become limited or cost prohibitive, Pengrowth’s ability to fund future development and acquisition opportunities may beimpaired.
• Pengrowth is exposed to third party credit risk through its oil and gas sales, financial hedging transactions and joint ventureactivities. The failure of any of these counterparties to meet their contractual obligations could adversely impact Pengrowth. Inresponse, Pengrowth has established a credit policy designed to mitigate this risk and monitors its counterparties on a regularbasis.
• Changing interest rates influence borrowing costs and the availability of capital.
• Failing a financial covenant may result in one or more of Pengrowth’s loans being in default. In certain circumstances, being indefault of one loan will result in other loans also being in default. In the event that non compliance continued, Pengrowthwould have to repay the debt, refinance the debt or negotiate new terms with the debt holders and may have to suspenddistributions to unitholders.
Risks associated with Legislation and Regulatory Changes• Government royalties, income taxes, commodity taxes and other taxes, levies and fees have a significant economic impact on
Pengrowth’s financial results. Changes to federal and provincial legislation governing such royalties, taxes and fees, includingimplementation of the SIFT Legislation, could have a material impact on Pengrowth’s financial results and the value ofPengrowth trust units.
• Pengrowth could lose its grandfathered status under the SIFT Legislation and become subject to the SIFT tax prior to January 1,2011 if it exceeds the normal growth guidelines.
• Environmental laws and regulatory initiatives impact Pengrowth financially and operationally. We may incur substantial capitaland operating expenses to comply with increasingly complex laws and regulations covering the protection of the environmentand human health and safety. In particular, we may be required to incur significant costs to comply with future regulations toreduce greenhouse gas and other emissions.
• The value of Pengrowth trust units is impacted directly by the related tax treatment of the trust units and the trust unitdistributions, and indirectly by the tax treatment of alternative equity investments. Changes in Canadian or U.S. tax legislationcould adversely affect the value of our trust units. As 2011 approaches, the expectation of taxability of distributions maynegatively impact the value of trust units.
• Changes to accounting policies, including the implementation of IFRS may result in significant adjustments to equity and/or netincome which could increase the risk of failing a financial covenant contained within Pengrowth’s lending agreements.
Risks associated with Operations• The marketability of our production depends in part upon the availability, proximity and capacity of gathering systems,
pipelines and processing facilities. Operational or economic factors may result in the inability to deliver our products to market.
28
TH
IRD
QU
AR
TE
RR
ES
UL
TS
PE
NG
RO
WT
H

• Increased competition for properties could drive the cost of acquisitions up and expected returns from the properties down.
• Timing of oil and gas operations is dependent on gaining timely access to lands. Consultations, that are mandated by governingauthorities, with all stakeholders (including surface owners, First Nations and all interested parties) are becoming increasinglytime consuming and complex, and are having a direct impact on cycle times.
• A significant portion of Pengrowth’s properties are operated by third parties whereby Pengrowth has less control over the paceof capital and operating expenditures. If these operators fail to perform their duties properly, or become insolvent, we mayexperience interruptions in production and revenues from these properties or incur additional liabilities and expenses as a resultof the default of these third party operators.
• Geological and operational risks affect the quantity and quality of reserves and the costs of recovering those reserves. Ouractual results will vary from our reserve estimates and those variations could be material.
• Oil and gas operations carry the risk of damaging the local environment in the event of equipment or operational failure. Thecost to remediate any environmental damage could be significant.
• Delays in business operations could adversely affect Pengrowth’s distributions to unitholders and the market price of the trustunits.
• During periods of increased activity within the oil and gas sector, the cost of goods and services may increase and it may bemore difficult to hire and retain professional staff.
• Attacks by individuals against facilities and the threat of such attacks may have an adverse impact on Pengrowth and theimplementation of security measures as a precaution against possible attacks would result in increased cost to Pengrowth’sbusiness.
Risks associated with Corporate Structure and Strategy• The value creation strategy announced in 2009, including increasing levels of capital re-investment on our existing assets may
not yield the expected benefits and related value creation. Drilling opportunities may prove to be more costly or less productivethan anticipated. In addition, the dedication of a larger percentage of our cash flow to such opportunities may reduce the fundsavailable for distribution to unitholders. In such an event, the market value of the trust units may be adversely effected.
• Pengrowth’s oil and gas reserves will be depleted over time and our level of cash flow from operations and the value of our trustunits could be reduced if reserves and production are not replaced. The ability to replace production depends on the amount ofcapital invested and success in developing existing reserves, acquiring new reserves and financing this development andacquisition activity within the context of the capital markets.
General Business Risks• Investors’ interest in the oil and gas sector may change over time which would affect the availability of capital and the value of
Pengrowth trust units.
• Inflation may result in escalating costs, which could impact unitholder distributions and the value of Pengrowth trust units.
• Canadian / U.S. exchange rates influence revenues and, to a lesser extent, operating and capital costs. Pengrowth is also exposedto foreign currency fluctuations on the U.S. dollar denominated notes for both interest and principal payments.
These factors should not be considered exhaustive. Additional risks are outlined in the AIF of the Trust available on SEDAR atwww.sedar.com.
SUBSEQUENT EVENTSOn October 20, 2010, Pengrowth announced that the Board of Directors has approved the conversion of Pengrowth Energy Trust toa new dividend paying corporation. Subject to receipt of all necessary approvals, this conversion is expected to be completed onDecember 31, 2010 pursuant to a plan of arrangement under the Business Corporations Act (Alberta).
Effective October 29, 2010 Pengrowth renewed the terms and extended the maturity date of its syndicated revolving credit facility toOctober 29, 2013. The renewed credit facility is comprised of a $1.0 billion committed revolving credit facility with up to a $250million expansion feature. In total the renewed credit facility provides Pengrowth with up to $1.25 billion of credit capacity from asyndicate of seven Canadian and three foreign banks.
Subsequent to September 30, 2010, Pengrowth has entered into additional fixed price commodity sales contracts with third partiessee Note 16 to the financial statements.
INTERNATIONAL FINANCIAL REPORTING STANDARDS (IFRS)What is IFRS?International Financial reporting Standards (“IFRS”) are a set of accounting standards developed by the International AccountingStandards Board. The goal of IFRS is to provide a global framework for how public companies prepare and disclose their financial
29
TH
IRD
QU
AR
TE
RR
ES
UL
TS
PE
NG
RO
WT
H

statements. IFRS provides general guidance for the preparation of financial statements rather than setting rules for industry specificreporting. IFRS is now required or permitted in over 100 countries, including the European Union and much of the Pacific Rim. Inthe United States, the Securities and Exchange Commission has eliminated the IFRS/US GAAP reconciliation requirement for foreignfilers, like Pengrowth, when fully implemented and audited.
IFRS Project PlanPengrowth commenced its IFRS conversion project in 2008 and has established a formal governance structure. This structureincludes a full time IFRS Project Coordinator, a steering committee consisting of senior members of the finance team on an ongoingbasis and includes information technology, treasury and operations personnel as required. Pengrowth has also engaged an externalexpert advisory firm. Regular IFRS project reporting is provided to senior management and to the Audit Committee of the Board ofDirectors. Senior management and the Board of Directors have participated in IFRS sessions to gain an understanding of the relevantaspects of IFRS.
Pengrowth’s project consists of four phases: diagnostic; design and planning; solution development; and implementation.
• Diagnostic – This phase involves performing a high-level review of the major differences between Canadian GAAP and IFRSand to identify information technology and business processes that may be impacted by the transition to IFRS.Status – The diagnostic analysis was completed in mid-2008.
• Design and planning – The results of the diagnostic were ranked according to complexity, time to complete and potentialimpact on the financial position and results of operations. A detailed plan was developed in order to address the issuesidentified and ranked in the diagnostic phase. The planning is updated and progress is reported to the Audit Committee on aregular basis.Status – Pengrowth completed the initial design and planning in mid-2009. The planning is updated and progress is reported tothe Audit Committee of the Board of Directors on a regular basis.
• Solution development – In this phase, items identified in the diagnostic phase are addressed according to the priority assigned.This phase involves detailed analysis of the applicable IFRS standard in relation to current practice and development ofalternative policy choices. In addition, certain potential differences are further investigated to assess whether there may bebroader impact to Pengrowth’s debt agreements, compensation arrangements or management reporting systems. The conclusionof the solution development phase will require the Audit Committee of the Board of Directors to review and approve significantaccounting policy choices as recommended by the IFRS Steering Committee.Status – Solution development began in late 2008 for classification of exploration and evaluation expenditures, depletion, cashgenerating units and impairment of capital assets, share based payments, business combinations, financial instruments, trustunit-holders equity and initial adoption of IFRS. Pengrowth has completed its analysis but not finalized its position regardingprovisions (including ARO), income taxes and risk sharing arrangements (farm-outs, asset swaps, etc).
• Implementation – Involves implementing all of the changes approved in the solution development phase and may includechanges to accounting policies, information systems, business processes, modification to agreements and training of staffimpacted by the conversion.Status – Implementation for information technology changes began in 2009. Training for the IFRS Steering Committeemembers commenced in 2008. Internal education of the Audit Committee and key financial and accounting personnel began inthe fourth quarter of 2009. Detailed implementation meetings involving internal personnel directly affected by IFRS also beganin the fourth quarter of 2009. Continued training and implementation meetings are expected throughout 2010. We arecurrently in the implementation phase, including making systems and procedural changes necessary to produce 2010 IFRScomparative financial statements during 2010. The review of the expected changes in the 2010 IFRS financial statements, bothinternally and by our auditors, began in the second quarter of 2010 and is ongoing. The implementation phase is expected toconclude upon issuance of 2011 audited annual financial statements.
First-Time Adoption of IFRSPublicly accountable enterprises are required to adopt International Financial Reporting Standards (“IFRS”), in full, and withoutmodification, in place of Canadian GAAP for interim and annual periods beginning on or after January 1, 2011. The adoption dateof January 1, 2011 will require the restatement, for comparative purposes, of amounts reported by Pengrowth for the year endedDecember 31, 2010, including the opening IFRS balance sheet as of January 1, 2010.
30
TH
IRD
QU
AR
TE
RR
ES
UL
TS
PE
NG
RO
WT
H

IFRS 1, “First-Adoption of International Financial Reporting Standards” (“IFRS 1”), sets out the procedures that an entity mustfollow when it adopts IFRS for the first time as the basis for preparing its general purpose financial statements. In addition, IFRS 1provides entities adopting IFRS for the first time with a number of optional exemptions and mandatory exceptions in certain areasto the general requirement of full retrospective application of IFRS. Pengrowth continues to review the potential adjustments to theJanuary 1, 2010 opening IFRS balance sheet and the effects of transition to IFRS are subject to change. The most significantaccounting policies that have been identified and the key differences that may impact the January 1, 2010 IFRS opening balancesheet are as follows:
Deemed Cost Exemption – Under Canadian full cost accounting, Pengrowth has historically accounted for exploration anddevelopment costs of oil and gas properties in the development and production phases in a single Canada wide full cost accountingpool. Under IFRS, exploration expenditures will be reclassified as intangible exploration assets. IFRS 1 contains an exemption thatwould allow Pengrowth to measure oil and gas assets at the date of transition as follows:
(i) exploration and evaluation assets are reclassified from the full cost pool to intangible exploration assets at the amount that wasrecorded under Canadian GAAP; and
(ii) the remaining full cost pool is allocated to the producing/development assets and components pro rata using reserve values orreserve volumes.
Pengrowth intends to make use of this exemption. The reclassification of exploration and evaluation assets is expected to result in a$68 million increase in intangible exploration assets with a corresponding decrease in property, plant and equipment at January 1,2010. The remaining full cost pool will be allocated on the basis of total proved plus probable using reserve values and January 1,2010 forecast pricing. The total value of exploration and producing oil and gas assets will remain unchanged.
Impairment of Property, Plant & Equipment (“PP&E”) assets – Pengrowth is required to assess the PP&E assets for impairmentupon transition to IFRS. Currently, impairment of PP&E is assessed at a consolidated level under Canadian GAAP. Under IFRS,impairment of PP&E must be assessed at a more detailed level. Impairment calculations will be performed at the Cash GeneratingUnit (“CGU”) level, using the greater of fair value less costs to sell or the value in use. We do not currently expect to record anyimpairment of oil and gas assets on transition to IFRS.
Impairment of Goodwill – Pengrowth is required to assess goodwill for impairment upon transition to IFRS. Currently impairmentof goodwill is assessed at a consolidated level under Canadian GAAP. Under IFRS, goodwill is identified with specific CGUs orgroup of CGUs and consequently impairment must be assessed at a more detailed level. Impairment testing of goodwill will beperformed in relation to the individual CGU or groups of CGUs that the goodwill relates to. We do not currently expect to recordany impairment of goodwill on transition to IFRS.
Business Combinations – IFRS 1 would allow Pengrowth to adopt the IFRS policies for business combinations on a prospective basisrather than retrospectively restating all prior business combinations. Pengrowth is expecting to use this IFRS 1 exemption and notrestate any business combinations prior to the IFRS transition date of January 1, 2010. The IFRS policies for business combinationsare converged with the new CICA Handbook section 1582 that are effective for business combinations completed on or afterJanuary 1, 2011; however, early adoption under Canadian GAAP is permitted. Early adoption would eliminate the majority ofdifferences between Canadian GAAP, U. S. GAAP and IFRS for business combinations completed prior to December 31, 2010.Pengrowth has adopted CICA 1582, effective January 1, 2010. The acquisition of Monterey in the third quarter of 2010 is the firsttransaction affected by this change.
Provisions – Under IFRS, contract liabilities and decommissioning obligations are classified as provisions. Accounting for contractliabilities remains unchanged under IFRS. Decommissioning obligations, disclosed as asset retirement obligations under CanadianGAAP, are anticipated to be calculated using a risk free discount rate under IFRS, which is currently estimated to be four percent. Inaddition, the timing and cost estimates are being revised to reflect the best estimate of what Pengrowth would rationally pay to settlethe obligation, as permitted under IFRS. The net effect of using a risk free discount rate, partly offset by revised timing and costestimates is expected to result in an approximately $162 million or 56% increase to decommissioning liabilities as presented on theBalance Sheet. Under Canadian GAAP, Pengrowth used a credit adjusted risk free rate of 8%. Due to the use of the aforementionedIFRS 1 election for full cost oil and gas entities, the increase to the decommission liabilities is required to be recognized directly inopening equity, resulting in a corresponding increase to the opening deficit estimated to be approximately $99 million, after tax.Clarification of the requirement to use a risk free discount rate is expected after the date of this MD&A but before the date oftransition to IFRS.
Income Tax – Any changes to income tax reporting are expected to be predominantly caused by changes in the book value of assetsand changes in tax rates applied, not due to the change in income tax accounting methodology. IFRS requires that all future taxes bedisclosed as non-current assets or liabilities and designated as deferred taxes. In addition, as Pengrowth Energy Trust is classified asa mutual fund trust for Canadian tax purposes, the income tax assets and liabilities of the Trust must be tax effected using the topmarginal rate of 39% upon transition to IFRS which is expected to result in a reduction to the future tax liability of $164 million.
31
TH
IRD
QU
AR
TE
RR
ES
UL
TS
PE
NG
RO
WT
H

This adjustment, in addition to the tax affect of other IFRS opening balance sheet adjustments, is expected to result in a totalreduction to future income taxes of approximately $226 million and a decrease to the deficit of approximately $219 million and anincrease to equity of approximately $7 million upon transition. It is also anticipated that a significant portion of this transitionadjustment will reverse through the income statement in the fourth quarter of 2010 as deferred tax expense upon Pengrowth’sconversion to a dividend paying corporation on December 31, 2010 as the Trust will no longer exist.
Financial Instruments – IFRS allows a one-time opportunity to re-examine the designation of financial instruments. Pengrowthexpects to re-designate the Judy Creek Remediation Trust Fund from held-to-maturity to fair-value-through-profit-or-loss and thePrivate Company investment from available-for-sale to fair-value-through-profit-or-loss upon transition to IFRS and thereforerecord these assets at fair value. This would result in a $7.0 million increase to other assets at January 1, 2010 with a correspondingincrease to opening deficit upon transition to IFRS. Future changes in the fair value would be recognized in income.
Trust Unit-Holders Equity – If unable to qualify for classification as equity, Pengrowth trust units would be classified as liabilities onthe balance sheet. After a detailed review of Pengrowth’s trust indenture, we believe that Pengrowth’s equity is correctly classified.The significance of this issue is minimized as Pengrowth has announced its intention to convert to a dividend paying corporation onDecember 31, 2010.
Pengrowth has completed its initial assessment of the adoption of IFRS and anticipates changes to the January 1, 2010 openingbalance sheet as noted below. Management has not yet finalized its accounting policies and as such the expected opening balancesheet may change. In addition, due to potential changes to IFRS prior to Pengrowth’s adoption of IFRS, management’s plan andaccounting policy decisions are subject to change based on new facts and circumstances that arise after the date of this MD&A. Theeffects of transition to IFRS on Provisions and Deferred Income Taxes, in particular, may be subject to change due to uncertaintyover discount rates, future expected costs and treatment of temporary tax differences within Pengrowth Energy Trust.
Preliminary Reconciliation of the Opening Balance Sheet items impacted by IFRS, as of January 1, 2010:
($ thousands) Cdn GAAP
Reclassificationupon transition to
IFRS
Effect oftransition to
IFRS IFRS
FUTURE INCOME TAX ASSETS (d) 969 (969) –
OTHER ASSETS (c) 46,027 6,984 53,011
DEFERRED INCOME TAXES (d) (180,671) 225,991 45,320
PROPERTY, PLANT AND EQUIPMENT (a) 3,789,369 (67,597) 3,721,772
INTANGIBLE EXPLORATION ASSETS (a) 67,597 67,597
CURRENT PORTION OF CONTRACT LIABILITIES (b) 1,728 (1,728) –
CURRENT PORTION OF PROVISIONS (b) 21,227 21,227
CONTRACT LIABILITIES (b) 7,952 (7,952) –
PROVISIONS (b) – 277,249 161,815 439,064
ASSET RETIREMENT OBLIGATIONS (b) 288,796 (288,796) –
FUTURE INCOME TAXES (d) 181,640 (181,640) –
TRUST UNITHOLDERS’ CAPITAL (e) 4,920,945 6,379 4,927,324
DEFICIT (e) (2,144,521) 64,781 (2,079,740)
(a) IFRS 1 election for full cost oil and gas entities
Pengrowth expects to elect an IFRS 1 exemption whereby the Canadian GAAP full cost pool will be measured upon transition toIFRS as follows:
(i) exploration and evaluation assets are reclassified from the full cost pool to intangible exploration assets at the amount that wasrecorded under Canadian GAAP; and
(ii) the remaining full cost pool is allocated to the producing/development assets and components pro rata using total proved plusprobable reserve values and January 1, 2010 forecasted prices.
This would result in a $68 million increase in intangible exploration assets with a corresponding decrease in property, plant andequipment.
(b) ProvisionsUnder IFRS, contract liabilities and decommissioning obligations are classified as provisions.
Accounting for contract liabilities remains unchanged under IFRS.
32
TH
IRD
QU
AR
TE
RR
ES
UL
TS
PE
NG
RO
WT
H

Decommissioning obligations, disclosed as asset retirement obligations under Canadian GAAP, are anticipated to be calculated usinga risk free discount rate under IFRS, which is currently estimated to be four percent. In addition, the timing and cost estimates arebeing revised to reflect the best estimate of what Pengrowth would rationally pay to settle the obligation, as permitted under IFRS.The net effect of using a risk free discount rate, partly offset by revised timing and cost estimates is expected to result in anapproximately $162 million or 56% increase to decommissioning liabilities as presented on the Balance Sheet. Due to the use of theaforementioned IFRS 1 election for full cost oil and gas entities, the increase to the decommission liabilities is required to berecognized directly in opening equity, resulting in a corresponding increase to the opening deficit. In the absence of the use of thisIFRS 1 election for full cost oil and gas entities, the increase in the decommissioning liability would be recognized as an increase tothe net book value of the related assets, resulting in an increase to property, plant and equipment of $162 million. In addition, $19million of these expenditures are expected to be made in 2010 and are thus classified as current liabilities.
Clarification of the requirement to use a risk free discount rate is expected after the date of this MD&A but before the date oftransition to IFRS.
The estimated effect on Provisions of the implementation of IFRS, assuming the use of a four percent discount rate, can bequantified as follows (amounts below in $ thousands):
Increase in Decommissioning Liabilities $161,815
Tax Effect (63,108)
Increase to opening deficit $ 98,707
(c) Other assets
Pengrowth expects to re-designate the Judy Creek Remediation Trust Fund from held-to-maturity to fair-value-through-profit-or-loss and the Private Company Investment from available-for-sale to fair-value-through-profit-or-loss upon transition toIFRS and recorded these assets at fair value. This would result in a $7.0 million increase to other assets at January 1, 2010 with acorresponding decrease to opening deficit upon transition to IFRS. Future changes in the fair value would be recognized in income.
The estimated effect on Other Assets of the implementation of IFRS can be quantified as follows (amounts stated below in$ thousands):
Increase in Other Assets $6,984
Tax Effect (891)
Decrease to opening deficit $6,093
(d) Deferred income taxes
Under IFRS, deferred income taxes are reported as a non-current liability resulting in a reclassification of the $1.0 million deferredtax asset to long term deferred tax liabilities at January 1, 2010.
The change in the net present value of the decommissioning liability is expected to result in a $63 million decrease in the deferredtax liability. The change in the carrying value of the Judy Creek remediation fund and Private Company investment is expected toresult in a $1 million increase in the deferred tax liability. As Pengrowth Energy Trust is a flow-through entity that pays all of itstaxable income to the unit-holders, the temporary tax difference of Pengrowth Energy Trust under IFRS must be tax affected at thetop marginal tax rate in Canada resulting in a reduction of the deferred tax liability of $164 million and a resulting decrease in theopening deficit of $157 million and an increase to trust unitholders capital of $7 million. A significant portion of this tax recovery isexpected to reverse through the income statement as deferred tax expenses in the fourth quarter of 2010 upon conversion to adividend paying corporation which is currently expected to occur on December 31, 2010.
The estimated effect on Deferred Income Taxes of the implementation of IFRS can be quantified as follows (amounts stated below in$ thousands):
Decrease in tax liability due to increase in provisions $ 63,108
Increase in tax liability due to increase in other assets (891)
Decrease in tax liability due to changes to book value of net assets $ 62,217
Decrease in tax liability due to changes in effective tax rate 163,774
Decrease in opening deferred tax liability $ 225,991
Cdn GAAP Future Tax Liability $(180,671)
Decrease in opening deferred tax liability 225,991
IFRS Deferred Tax Asset $ 45,320
33
TH
IRD
QU
AR
TE
RR
ES
UL
TS
PE
NG
RO
WT
H

(e) Opening Deficit
Under IFRS 1 – First Time Adoption of International Financial Reporting Standards (“IFRS 1”) most changes to the January 1, 2010opening balance sheet are applied retrospectively through opening deficit. This includes changes to Provisions, Other Assets andDeferred Taxes as described above.
The estimated effect on the Opening Deficit of the implementation of IFRS can be quantifies as follows (amounts stated below in$ thousands):
Increase due to increase to provisions $ 98,707
Decrease due to increase to other assets (6,093)
Decrease in tax liability due to changes in effective tax rate (157,395)
Decrease to opening deficit $ (64,781)
Increase to trust unitholders’ capital due to change in effective tax rate $ 6,379
Ongoing IFRS differences post first time adoptionIn addition to the IFRS differences affecting the January 1, 2010 opening balance sheet, Pengrowth continues to review the potentialadjustments to ongoing application of IFRS after the initial transition. Due to potential changes to IFRS prior to Pengrowth’sadoption of IFRS, management’s plan and accounting policy decisions are subject to change based on new facts and circumstancesthat arise after the date of this MD&A. The most significant ongoing accounting policies that have been identified and the keydifferences that may impact the financial statements as follows:
• Accounting for Exploration and Evaluations (“E&E”) expenditures – Upon transition to IFRS, Pengrowth will reclassify E&Eexpenditures that are currently included in the PP&E balance on the Consolidated Balance Sheet. This will be comprised of thebook value of Pengrowth’s unproven properties of approximately $68 million that was excluded from Depletion atDecember 31, 2009 (see note 6 to the audited annual financial statements) and is expected to increase through 2010 due toexpenditures on exploration and evaluation activities and the acquisition of additional exploration and evaluation properties.E&E assets will not be depleted but must be assessed for impairment when there are indicators for possible impairment, such asallowing the mineral rights lease to expire or a decision to no longer pursue exploration and evaluation of a specific E&E asset.The majority of the property, plant and equipment acquired in the Monterey acquisition is allocated to unproven anddevelopment properties, which is expected to significantly increase the net book value of E&E assets as of September 30, 2010.
• Impairment of PP&E assets – Impairment of PP&E is currently assessed at a single consolidated level using an annual ceilingtest. Under IFRS, impairment of PP&E must be assessed at a more detailed level whenever there is an indication of impairmentsuch as changes in commodity prices or operational performance. Under IFRS, impairment calculations will be performed at theCash Generating Unit level, using the greater of fair value less costs to sell or the value in use. This may result in more frequentimpairments of assets under IFRS given the smaller size of the entity or CGU being evaluated.
• Calculation of Depletion Expense – Pengrowth currently calculates depletion of oil and gas assets on a consolidated basis basedon total production and total proved reserves. Under IFRS, depletion will be calculated at a more detailed level and at least atthe level of cash generating units. In addition, under IFRS Pengrowth has chosen to use total proven plus probable reserves forits depletion calculation. The use of total proven plus probable reserve base for calculating depletion would be expected toresult in a decrease to the consolidated depletion expense of approximately $4.25 to $4.75 per boe of production or $28 millionto $33 million per quarter.
• Risk Sharing Arrangements and Dispositions – Risk sharing arrangements where Pengrowth cedes a portion of its workinginterest to a partner are generally considered disposals of property, plant and equipment under IFRS. Canadian full costaccounting guidelines require that no gain or loss be recorded on these or other dispositions where the change in consolidateddepletion is less than 20 percent. No such guidance exists under IFRS. As a result, it is expected that Pengrowth will recordgains or losses on these transactions under IFRS. The significance of these gains or losses will be dependant on the details ofspecific transactions and cannot be reasonably quantified. The first transaction identified, the previously disclosed GORR salein Q1 2010, is expected to result in a gain of approximately $8 million as compared to no gain under current GAAP.
• Financial Covenants – Pengrowth has analyzed the impact of IFRS on financial covenants and financing relationships. Theprimary impact will be an increase in the debt-to-equity ratio as a result of the IFRS opening balance sheet adjustments to thedeficit. Pengrowth nonetheless expects to be fully compliant with all financial debt covenants upon transition to IFRS.
• Compensation Arrangements – Pengrowth does not expect any material changes to compensation arrangements due to thetransition to IFRS. Pengrowth has reviewed internal compensation arrangements and determined that the anticipated changes tofinancial measures as a result of IFRS will not directly affect any of these compensation arrangements.
34
TH
IRD
QU
AR
TE
RR
ES
UL
TS
PE
NG
RO
WT
H

In addition to the accounting policy differences, Pengrowth’s transition to IFRS will impact the internal controls over financialreporting, the disclosure controls and procedures and IT systems as follows:
• Internal controls over financial reporting – As the review of Pengrowth’s accounting policies is completed, an assessment will bemade to determine changes required for internal controls over financial reporting. For example, additional controls will beimplemented for the IFRS 1 changes and preparation of comparative information. This will be an ongoing process in 2010 toensure that changes in accounting policies include the appropriate additional controls and procedures for future IFRS reportingrequirements.
• Disclosure controls and procedures – Throughout the transition process, Pengrowth will be assessing stakeholders’ informationrequirements and will ensure that adequate and timely information is provided so that stakeholders are kept apprised.
• IT Systems – Pengrowth has completed most of the system modifications required for IFRS reporting. Pengrowth’s IT systemsdid not require significant modifications to track PP&E and E&E at a more detailed level within the financial reporting systems.Pengrowth’s IFRS staff continues to work with IT and operational staff to ensure all costs are captured and recorded in amanner consistent with IFRS depletion, impairment cost center groupings and accounting for asset retirement obligations.Insignificant changes to procedures and systems outside the accounting and finance department have been made. Changes werealso made to allow Pengrowth to account for certain transactions and prepare Canadian GAAP and IFRS financial statementsin 2010. Additional systems modifications may be required.
Pengrowth continues to make progress on its IFRS convergence plan and management believes that Pengrowth will be in a positionto prepare IFRS financial statements in the first quarter of 2011. Pengrowth has not made any final determination as to whatoptions it may select upon conversion to IFRS. Changes in financial reporting under some options may be significantly different. Thefinal decisions are subject to the approval of Pengrowth’s Audit Committee and Board of Directors and the concurrence ofPengrowth’s auditors. Pengrowth continues to monitor the IFRS adoption efforts of many of its peers and participates in relatedprocesses, as appropriate. Pengrowth is currently involved in an IFRS working group composed of intermediate to large oil and gasproducers and an IFRS and Financial Reporting group consisting of a peer group of income trusts.
RECENT ACCOUNTING PRONOUNCEMENTSAs of January 1, 2010, Pengrowth adopted the following new Canadian standards:
CICA 1582 “Business Combinations”, which replaces the previous business combinations standard. The standard requires assetsand liabilities acquired in a business combination, consideration paid, contingent consideration and certain acquired contingencies tobe measured at fair value on the date of acquisition. In addition, acquisition related and restructuring costs are recognized separatelyfrom the business combination and are included in the statement of income. The adoption of this standard impacts the accountingtreatment of business combinations entered into or after January 1, 2010.
CICA 1601 “Consolidated Financial Statements”, which together with Section 1602 below, replace the former consolidatedfinancial statements standard. Section 1601 establishes the requirements for the preparation of consolidated financial statements.The adoption of this standard had no material impact on Pengrowth’s financial statements.
CICA 1602 “Non-controlling Interests” establishes the accounting for a non-controlling interest in a subsidiary in consolidatedfinancial statements subsequent to a business combination. The standard requires a non-controlling interest in a subsidiary to beclassified as a separate component of equity. In addition, net earnings and components of other comprehensive income are attributedto both the parent and non-controlling interest. The adoption of this standard had no impact on the consolidated financialstatements.
DISCLOSURE AND INTERNAL CONTROLSAs a Canadian reporting issuer with securities listed on both the TSX and the NYSE, Pengrowth is required to comply withMultilateral Instrument 52-109 – Certification of Disclosure in Issuers’ Annual and Interim Filings, as well as the Sarbanes OxleyAct enacted in the United States.
At the end of the interim period ended September 30, 2010, Pengrowth did not have any material weakness relating to design of itsinternal control over financial reporting. Pengrowth has not limited the scope of its design of disclosure controls and procedures andinternal control over financial reporting to exclude controls, policies and procedures of (i) a proportionately consolidated entity inwhich Pengrowth has an interest; (ii) a variable interest entity in which Pengrowth has an interest; or (iii) a business that Pengrowthacquired not more than 365 days before September 30, 2010, and summary financial information about these items has beenproportionately consolidated or consolidated in Pengrowth’s financial statements. During the interim period ended September 30,2010, no change occurred to Pengrowth’s internal control over financial reporting that has materially affected, or is reasonablylikely to materially affect, Pengrowth’s internal control over financial reporting.
35
TH
IRD
QU
AR
TE
RR
ES
UL
TS
PE
NG
RO
WT
H

CONSOLIDATED BALANCE SHEETS(Stated in thousands of dollars)(unaudited)
As atSeptember 30, 2010
As atDecember 31, 2009
ASSETS
CURRENT ASSETS
Cash and term deposits $ 1,255 $ –
Accounts receivable 159,245 182,342
Fair value of risk management contracts (Note 15) 47,084 14,001
Future income taxes (Note 7) – 969
207,584 197,312
FAIR VALUE OF RISK MANAGEMENT CONTRACTS (Note 15) 4,780 –
OTHER ASSETS (Note 3) 45,737 46,027
PROPERTY, PLANT AND EQUIPMENT 4,113,442 3,789,369
GOODWILL 709,212 660,896
TOTAL ASSETS $ 5,080,755 $ 4,693,604
LIABILITIES AND UNITHOLDERS’ EQUITY
CURRENT LIABILITIES
Bank indebtedness $ 26,000 $ 11,563
Accounts payable and accrued liabilities 195,230 185,337
Distributions payable to unitholders 44,829 40,590
Fair value of risk management contracts (Note 15) 2,534 17,555
Future income taxes (Note 7) 12,540 –
Contract liabilities 1,690 1,728
Current portion of long-term debt (Note 5) – 157,546
282,823 414,319
FAIR VALUE OF RISK MANAGEMENT CONTRACTS (Note 15) 20,850 23,269
CONTRACT LIABILITIES 6,694 7,952
CONVERTIBLE DEBENTURES (Note 4) – 74,828
LONG TERM DEBT (Note 5) 1,019,485 907,599
ASSET RETIREMENT OBLIGATIONS (Note 6) 282,597 288,796
FUTURE INCOME TAXES (Note 7) 246,284 181,640
TRUST UNITHOLDERS’ EQUITY
Trust unitholders’ capital (Note 8) 5,250,112 4,920,945
Exchangeable Shares (Note 8) 54,845 –
Equity portion of convertible debentures (Note 4) – 160
Contributed surplus (Note 8) 20,732 18,617
Deficit (Note 10) (2,103,667) (2,144,521)
3,222,022 2,795,201
TOTAL LIABILITIES AND UNITHOLDERS’ EQUITY $ 5,080,755 $ 4,693,604
SUBSEQUENT EVENTS (Notes 5 and 16)
See accompanying notes to the consolidated financial statements.
36
TH
IRD
QU
AR
TE
RR
ES
UL
TS
PE
NG
RO
WT
H

CONSOLIDATED STATEMENTS OF INCOMEAND DEFICIT(Stated in thousands of dollars, except per trust unit amounts)(unaudited)
Three months endedSeptember 30
Nine months endedSeptember 30
2010 2009 2010 2009
REVENUES
Oil and gas sales $ 317,505 $ 325,264 $ 1,012,593 $ 983,871
Unrealized (loss) gain on commodity risk management (Note 15) (898) (5,609) 59,478 (133,625)
Processing and other income 4,377 3,953 14,795 14,607
Royalties, net of incentives (55,281) (49,671) (191,831) (136,608)
NET REVENUE 265,703 273,937 895,035 728,245
EXPENSES
Operating 84,881 93,319 262,963 290,428
Transportation 3,537 3,740 11,485 9,369
Amortization of injectants for miscible floods 3,492 4,839 12,011 15,557
Interest and financing charges 17,061 19,437 50,848 62,036
General and administrative 10,923 13,693 39,770 48,095
Management fee – – – 2,793
Realized foreign exchange (gain) loss (Note 11) (489) (1,073) 2,039 (638)
Unrealized foreign exchange gain (Note 11) (30,579) (80,535) (20,176) (131,109)
Depletion, depreciation and amortization 128,771 147,181 396,980 447,081
Accretion (Note 6) 5,894 6,989 17,245 20,563
Gain on equity investment (Note 2) (73,756) – (73,756) –
Other expenses (income) 2,220 3,112 (12,253) 4,879
151,955 210,702 687,156 769,054
INCOME (LOSS) BEFORE TAXES 113,748 63,235 207,879 (40,809)
Future income tax reduction (Note 7) (11,884) (15,055) (20,441) (75,139)
NET INCOME AND COMPREHENSIVE INCOME $ 125,632 $ 78,290 $ 228,320 $ 34,330
Deficit, beginning of period (2,164,045) (2,140,219) (2,144,521) (1,941,521)
Distributions declared (65,254) (72,235) (187,466) (226,973)
DEFICIT, END OF PERIOD (Note 10) $ (2,103,667) $ (2,134,164) $ (2,103,667) $ (2,134,164)
NET INCOME PER TRUST UNIT (Note 13)
Basic $ 0.42 $ 0.30 $ 0.78 $ 0.13
Diluted $ 0.42 $ 0.30 $ 0.77 $ 0.13
See accompanying notes to the consolidated financial statements.
37
TH
IRD
QU
AR
TE
RR
ES
UL
TS
PE
NG
RO
WT
H

CONSOLIDATED STATEMENTS OF CASH FLOW(Stated in thousands of dollars)(unaudited)
Three months endedSeptember 30
Nine months endedSeptember 30
2010 2009 2010 2009
CASH PROVIDED BY (USED FOR):
OPERATING
Net income and comprehensive income $ 125,632 $ 78,290 $ 228,320 $ 34,330
Depletion, depreciation and accretion 134,665 154,170 414,225 467,644
Future income tax reduction (Note 7) (11,884) (15,055) (20,441) (75,139)
Contract liability amortization (432) (619) (1,296) (1,862)
Amortization of injectants 3,492 4,839 12,011 15,557
Purchase of injectants (2,103) (1,671) (8,971) (8,351)
Expenditures on remediation (Note 6) (3,712) (3,832) (12,103) (11,056)
Unrealized foreign exchange gain (Note 11) (30,579) (80,535) (20,176) (131,109)
Unrealized loss (gain) on commodity risk management (Note 15) 898 5,609 (59,478) 133,625
Trust unit based compensation (Note 9) 248 2,513 5,552 8,698
Non-cash gain on equity investment (Note 2) (73,756) – (73,756) –
Other items 1,014 978 1,344 2,801
Changes in non-cash operating working capital (Note 12) 16,443 18,228 2,981 (33,721)
159,926 162,915 468,212 401,417
FINANCING
Distributions paid (Note 10) (61,217) (77,687) (183,227) (267,857)
Bank indebtedness (repayment) 26,000 (2,242) 14,437 (266)
Repayment of Monterey bank debt (Note 2) (41,883) – (41,883) –
Repayment of long term debt (Note 5) – (48,000) (211,600) 30,000
Private placement of term notes, net (Note 5) (18) – 189,902 –
Redemption of convertible debentures (Note 4) – – (76,610) –
Proceeds from issue of trust units 7,046 13,256 17,989 29,465
(70,072) (114,673) (290,992) (208,658)
INVESTING
Expenditures on property, plant and equipment (87,677) (44,047) (202,968) (161,236)
Other property acquisitions (17,352) 137 (20,043) (10,376)
Proceeds on property dispositions 273 (356) 48,312 7,730
Other investments – – (2,906) –
Change in remediation trust funds (770) (1,626) (4,445) (5,451)
Change in non-cash investing working capital (Note 12) 12,147 (2,350) 6,085 (23,426)
(93,379) (48,242) (175,965) (192,759)
CHANGE IN CASH AND TERM DEPOSITS (3,525) – 1,255 –
CASH AND TERM DEPOSITS AT BEGINNING OF PERIOD 4,780 – – –
CASH AND TERM DEPOSITS AT END OF PERIOD $ 1,255 $ – $ 1,255 $ –
See accompanying notes to the consolidated financial statements.
38
TH
IRD
QU
AR
TE
RR
ES
UL
TS
PE
NG
RO
WT
H

NOTES TOCONSOLIDATED FINANCIAL STATEMENTSSEPTEMBER 30, 2010
(Tabular amounts are stated in thousands of dollars except per trust unit amounts and as otherwise stated)(Unaudited)
1. SIGNIFICANT ACCOUNTING POLICIES
The interim consolidated financial statements of Pengrowth Energy Trust (the “Trust”) have been prepared by management inaccordance with generally accepted accounting principles in Canada. These interim financial statements included the accounts of theTrust and its subsidiary Pengrowth Corporation (the “Corporation”), collectively referred to as “Pengrowth”, and have beenprepared following the same accounting policies and methods of computation as the consolidated financial statements for the fiscalyear ended December 31, 2009 except as noted below. The disclosures provided below are incremental to those included with theannual consolidated financial statements. The interim consolidated financial statements should be read in conjunction with theconsolidated financial statements and the notes thereto in Pengrowth’s annual report for the year ended December 31, 2009.
Certain comparative figures have been reclassified to conform to the presentation adopted in the current period.
CHANGE IN ACCOUNTING POLICIESAs of January 1, 2010, Pengrowth adopted the following new Canadian standards:
CICA 1582 “Business Combinations”, which replaces the previous business combinations standard. The standard requires assetsand liabilities acquired in a business combination, consideration paid, contingent consideration and certain acquired contingencies tobe measured at fair value on the date of acquisition. In addition, acquisition related and restructuring costs are recognized separatelyfrom the business combination and are included in the statement of income. The adoption of this standard impacts the accountingtreatment of business combinations entered into or after January 1, 2010.
CICA 1601 “Consolidated Financial Statements”, which together with Section 1602 below, replace the former consolidatedfinancial statements standard. Section 1601 establishes the requirements for the preparation of consolidated financial statements.The adoption of this standard had no material impact on Pengrowth’s financial statements.
CICA 1602 “Non-controlling Interests” establishes the accounting for a non-controlling interest in a subsidiary in consolidatedfinancial statements subsequent to a business combination. The standard requires a non-controlling interest in a subsidiary to beclassified as a separate component of equity. In addition, net earnings and components of other comprehensive income are attributedto both the parent and non-controlling interest. The adoption of this standard had no impact on the consolidated financialstatements.
2. MONTEREY ACQUISITION
Pengrowth and Monterey Exploration Ltd. (“Monterey”) completed a business combination (the “Combination”) whereby eachMonterey securityholder elected to receive either: (i) 0.8298 of a Pengrowth trust unit or (ii) 0.8298 of an exchangeable share of theCorporation with each exchangeable share being exchangeable to a Pengrowth trust unit. The Combination closed on September 15,2010 with Pengrowth acquiring 100% of the voting interest in Monterey and resulted in the issuance of 27,967,959 trust units ofPengrowth and 4,994,426 exchangeable shares of the Corporation to the former Monterey securityholders.
The trust units and exchangeable shares issued in the Combination were valued at $11.00 per trust unit/exchangeable share basedon the closing trading price of the trust units on the date of the Combination. Prior to the Combination, Pengrowth heldapproximately nine million common shares or approximately 20 percent of the outstanding common shares of Monterey. Under thenew Canadian accounting standards for business combinations adopted on January 1, 2010, Pengrowth was required to fair valueits previously held equity investment in Monterey and, as a result, recorded a gain of $73.8 million arising from the differencebetween the fair value and the book value of the investment prior to the Combination. The fair value of Pengrowth’s previously heldequity investment in Monterey was included in the purchase consideration.
39
TH
IRD
QU
AR
TE
RR
ES
UL
TS
PE
NG
RO
WT
H

The Combination was accounted for as an acquisition of Monterey by Pengrowth using the purchase method of accounting with theallocation of the purchase price and consideration as follows:
Allocation of Purchase Price:
Property, plant and equipment $570,367
Goodwill 48,316
Bank debt (41,883)
Asset retirement obligations (7,888)
Working capital deficit (25,667)
Future income taxes (98,594)
$444,651
Consideration:
Pengrowth trust units issued $307,648
Pengrowth exchangeable shares issued 54,939
Fair value of previous equity investment 82,064
$444,651
The estimated fair value of property, plant and equipment was determined using both internal estimates and an independent reserveevaluation. The property, plant and equipment acquired in the Combination includes approximately $49 million of producing assetsand $521 million of unproven and development properties. The amount of the unproven and development properties have beenexcluded from the depletion calculation. The future income tax liability was determined based on applying Pengrowth’s effectivefuture income tax rate of approximately 26 percent to the difference between the book and tax basis of the assets acquired. Theasset retirement obligations were determined using Pengrowth’s estimated costs to remediate, reclaim and abandon the wells andfacilities, the estimated timing of the costs to be incurred in future periods, an inflation rate of 1.5 percent, and a discount rate ofeight percent. Transaction costs relating to legal and advisory fees incurred in the Combination of approximately $1.0 million wereexpensed in the period and included in Other Expenses (Income).
The acquisition of Monterey is consistent with Pengrowth’s strategic focus of acquiring and developing operated unconventionalresource plays in the Western Canadian Sedimentary Basin. Pengrowth recognized goodwill of approximately $48 million in theCombination representing, in part, the value of establishing a new core area with resource assets in the Montney play. Pengrowth’sability to increase this value beyond what Monterey could realize is partially a result of Pengrowth’s ability to fund the developmentof the necessary capital infrastructure with a lower cost of capital. Goodwill is also impacted by recognizing a future tax liability onthe acquisition at an undiscounted amount as required under Canadian accounting standards. Goodwill is not deductible for taxpurposes.
The consolidated financial statements include the results of operations and cash flows from Monterey subsequent to the closing dateof September 15, 2010. The impact of the Combination on revenue and net income is not material for pro-forma disclosures. Finaldetermination of the allocation of the purchase cost to the fair values of the assets and liabilities is still pending.
3. OTHER ASSETSAs at
September 30, 2010As at
December 31, 2009
Remediation trust funds $ 40,737 $ 34,837
Equity investment in Monterey Exploration Ltd. (Note 2) – 5,039
Other investments 5,000 6,151
$ 45,737 $ 46,027
REMEDIATION TRUST FUNDSThe Sable Offshore Energy Project (SOEP) remediation trust fund as at September 30, 2010 was $32.4 million (December 31, 2009– $26.0 million). The investments in the fund have been designated as held for trading and are recorded at fair value each periodend. For the nine months ended September 30, 2010, the amount of unrealized gain related to the SOEP remediation trust fund was$1.5 million (September 30, 2009 – gain of $0.7 million), which was included in other expenses (income). As at September 30, 2010,the $8.3 million (December 31, 2009 – $8.8 million) in the Judy Creek remediation trust fund is classified as held to maturity andinterest income is recognized when earned and included in other expenses (income).
OTHER INVESTMENTSPengrowth sold the remaining shares it held of a public corporation in January 2010 for proceeds of $1.1 million. Pengrowthcontinues to hold an investment in a private company.
40
TH
IRD
QU
AR
TE
RR
ES
UL
TS
PE
NG
RO
WT
H

4. CONVERTIBLE DEBENTURES
On January 14, 2010, Pengrowth redeemed all of the outstanding Convertible Unsecured Subordinated Debentures. The cashredemption amount was approximately $76.8 million, including accrued interest to the redemption date.
5. LONG TERM DEBT
As atSeptember 30, 2010
As atDecember 31, 2009
U.S. dollar denominated senior unsecured notes:
150 million at 4.93 percent due April 2010 $ – $ 157,546
50 million at 5.47 percent due April 2013 51,348 52,417
71.5 million at 4.67 percent due May 2015 73,169 –
400 million at 6.35 percent due July 2017 409,917 418,530
265 million at 6.98 percent due August 2018 271,429 277,138
115.5 million at 5.98 percent due May 2020 118,161 –
$ 924,024 $ 905,631
U.K. Pound Sterling denominated 50 million unsecured notes at 5.46 percentdue December 2015 80,461 84,514
Canadian dollar 15 million senior unsecured notes at 6.61 percent dueAugust 2018 15,000 15,000
Canadian dollar revolving credit facility borrowings – 60,000
Total long term debt $ 1,019,485 $ 1,065,145
Current portion of long term debt due April 2010 – (157,546)
Non-current portion of long term debt $ 1,019,485 $ 907,599
SENIOR UNSECURED NOTESOn April 23, 2010, U.S. $150 million in senior unsecured notes matured resulting in the realization of a $66 million foreignexchange gain, previously recognized.
On May 11, 2010, Pengrowth closed a U.S. $187 million private placement of senior unsecured notes. The notes were offered in twotranches of U.S. $71.5 million at 4.67 percent due May 2015 and U.S. $115.5 million at 5.98 percent due May 2020. The notescontain certain financial maintenance covenants and interest is paid semi-annually. Costs incurred in connection with issuing thenotes, in the amount of $1.2 million, were deducted from the carrying amount of the debt and are amortized to income over theexpected term of the notes.
As of September 30, 2010, an unrealized cumulative foreign exchange gain of $31.9 million (September 30, 2009 – gain of $60.5million) has been recognized on the U.S. dollar term notes since the date of issuance. As of September 30, 2010, an unrealizedcumulative foreign exchange gain of $33.3 million (September 30, 2009 – gain of $28.6 million) has been recognized on the U.K.Pound Sterling denominated term notes since Pengrowth ceased to designate existing foreign exchange swaps as a hedge onJanuary 1, 2007.
TERM CREDIT FACILITIESPengrowth has a committed unsecured $1.2 billion syndicated extendible revolving credit facility. The facility is covenant based andmatures on June 15, 2011. Pengrowth has the option to extend this facility annually subject to lender approval or repay the entirebalance upon maturity. Various borrowing options are available under the facility including prime rate based advances and bankersacceptance loans. This facility carries floating interest rates that are expected to range between 0.60 percent and 1.15 percent overbankers’ acceptance rates, depending on Pengrowth’s consolidated ratio of senior debt to earnings before interest, taxes andnon-cash items. The revolving facility was reduced by outstanding letters of credit in the amount of $17.9 million at September 30,2010.
Effective October 29, 2010, Pengrowth renewed the terms and extended the maturity date of its syndicated revolving credit facilityto October 29, 2013. The renewed credit facility is comprised of a $1.0 billion committed revolving credit facility with up to a$250 million expansion feature. In total, the renewed credit facility provides Pengrowth up to $1.25 billion of credit capacity from asyndicate of seven Canadian and three foreign banks. This facility carries floating interest rates that are expected to range between2.00 percent and 3.25 percent over bankers’ acceptance rates, depending on Pengrowth’s consolidated ratio of senior debt toearnings before interest, taxes and non-cash items.
41
TH
IRD
QU
AR
TE
RR
ES
UL
TS
PE
NG
RO
WT
H

Pengrowth also maintains a $50 million demand operating facility. This facility was reduced by borrowings of $26 million andoutstanding letters of credit of $5.4 million at September 30, 2010. Borrowings under this facility are included in bank indebtednesson the balance sheet.
6. ASSET RETIREMENT OBLIGATIONS (“ARO”)
In the third quarter of 2010, the estimated inflation rate used to calculate the ARO was reduced from two percent per annum to oneand one half percent per annum based on historical price inflation. The change in estimate was made on a prospective basis andresulted in a reduction of $22.5 million to the ARO liability in the period with a corresponding adjustment made to the related asset.
Nine months endedSeptember 30, 2010
Year EndedDecember 31, 2009
ARO, beginning of period $ 288,796 $ 344,345
Increase (decrease) in liabilities during the period related to:
Acquisitions 10,282 365
Dispositions (171) (2,195)
Additions 1,045 3,146
Revisions (1) (22,497) (66,500)
Accretion expense 17,245 27,677
Liabilities settled in the period (12,103) (18,042)
ARO, end of period $ 282,597 $ 288,796
7. INCOME TAXES
The Trust is a mutual fund trust as defined under the Income Tax Act (Canada). All taxable income earned by the Trust has beenallocated to unitholders and such allocations are deducted for income tax purposes.
On June 22, 2007, the Canadian government implemented a new tax (the “SIFT tax”) on publicly traded income trusts and limitedpartnerships (Bill C-52 Budget Implementation Act). For existing income trusts and limited partnerships, the SIFT tax will beeffective in 2011 unless certain rules related to “undue expansion” are not adhered to. As such, the Trust would not be subject tothe new measures until the 2011 taxation year provided the Trust continues to meet certain requirements.
By applying the combined Canadian, Federal and Provincial statutory income tax rates, the following table reconciles the expectedincome tax reduction to the future income tax reduction:
Nine months endedSeptember 30, 2010
Nine months endedSeptember 30, 2009
Income (loss) before taxes $ 207,879 $ (40,809)
Combined federal and provincial tax rate 28.40% 29.50%
Expected income tax expense (reduction) 59,038 (12,039)
Net income of the Trust (1) (52,042) (67,096)
Changes in estimated pool balances 4,265 11,769
Unrealized gain on foreign exchange (2) (3,532) (19,307)
Effect of differences between statutory tax rate and future tax rate (8,582) 5,744
Gain on equity investment (20,949) –
Other including stock based compensation (3) 1,361 5,790
Future income tax reduction $ (20,441) $ (75,139)
(1) Relates to distributions of taxable income at the trust level for the nine months ended September 30, 2010 of $183.2 million x 28.40%(September 30, 2009 – $227.0 million x 29.56%) where the income tax liability is currently the responsibility of the unitholder.
(2) Reflects the 50% non-taxable portion of unrealized foreign exchange gains.(3) Primarily expenses that are non-deductible for tax purposes and other adjustments.
42
TH
IRD
QU
AR
TE
RR
ES
UL
TS
PE
NG
RO
WT
H

8. TRUST UNITS
TOTAL TRUST UNITSPengrowth is authorized to issue an unlimited number of trust units.
Nine months endedSeptember 30, 2010
Year EndedDecember 31, 2009
Trust Units IssuedNumber of
Trust Units AmountNumber ofTrust Units Amount
Balance, beginning of period 289,834,790 $4,920,945 256,075,997 $4,588,587
Issued on redemption of Deferred Entitlement Units (DEUs) (non-cash) 257,607 2,966 416,043 5,741
Issued for cash on exercise of trust unit rights 444,138 2,767 299,684 1,918
Issued for cash under Distribution Reinvestment Plan (DRIP) 1,543,539 15,491 3,026,166 26,319
Issued for the Monterey business combination (Note 2) 27,967,959 307,648 – –
Issued on redemption of Exchangeable shares 8,502 94 – –
Issued for cash under At The Market (ATM) Plan – – 1,169,900 10,723
Issued for cash on equity issue – – 28,847,000 300,009
Trust unit rights incentive plan (non-cash exercised) – 471 – 346
Issue costs net of tax – (270) – (12,698)
Balance, end of period 320,056,535 $5,250,112 289,834,790 $4,920,945
EXCHANGEABLE SHARESPengrowth issued exchangeable shares in the Monterey acquisition described in Note 2. The exchangeable shares are exchangeableinto Pengrowth trust units based on the exchange ratio in effect at the time of conversion. The exchange ratio increases with eachcash distribution. The increase is calculated by multiplying the distribution per trust unit by the opening exchange ratio and dividingby the ten day weighted average trading price of the trust units on the Toronto Stock Exchange prior to the distribution record date.As of September 30, 2010, the exchange ratio was 1.00000.
Pengrowth has included the exchangeable shares in equity based on Canadian accounting standards that permit the inclusion ofcertain exchangeable shares in equity issued by income trusts.
Nine months endedSeptember 30, 2010
Year EndedDecember 31, 2009
Exchangeable Shares Issued
Number ofExchangeable
Shares Amount
Number ofExchangeable
Shares Amount
Balance, beginning of period – $ – – $ –
Issued for the Monterey business combination (Note 2) 4,994,426 54,939 – –
Redeemed for trust units (8,502) (94) – –
Balance, end of period 4,985,924 $ 54,845 – $ –
CONTRIBUTED SURPLUS
Nine months endedSeptember 30, 2010
Year EndedDecember 31, 2009
Balance, beginning of period $ 18,617 $ 16,579
Trust unit rights incentive plan (non-cash expensed) 921 2,953
Deferred entitlement trust units (non-cash expensed) 4,631 5,172
Trust unit rights incentive plan (non-cash exercised) (471) (346)
Deferred entitlement trust units (non-cash exercised) (2,966) (5,741)
Balance, end of period $ 20,732 $ 18,617
9. TRUST UNIT BASED COMPENSATION PLANS
Pengrowth has in place several stock based compensation plans, some of which are in anticipation of its transition to a dividendpaying corporation. Each plan has certain impacts on the reported unit based compensation expense.
43
TH
IRD
QU
AR
TE
RR
ES
UL
TS
PE
NG
RO
WT
H
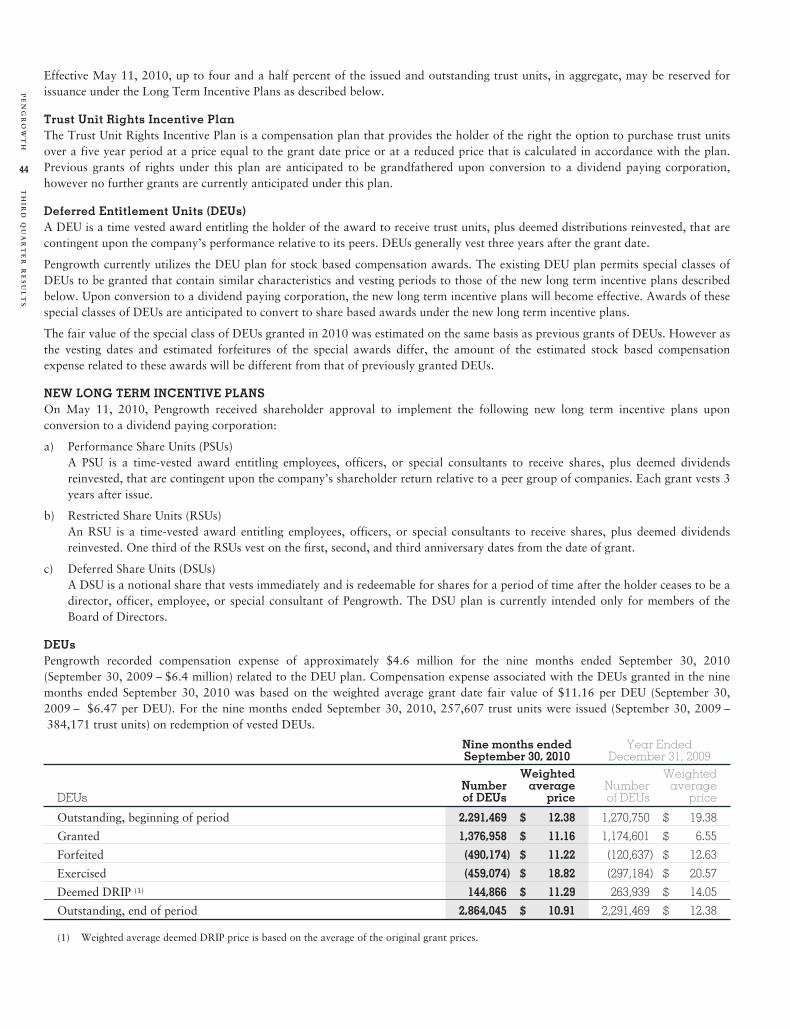
Effective May 11, 2010, up to four and a half percent of the issued and outstanding trust units, in aggregate, may be reserved forissuance under the Long Term Incentive Plans as described below.
Trust Unit Rights Incentive PlanThe Trust Unit Rights Incentive Plan is a compensation plan that provides the holder of the right the option to purchase trust unitsover a five year period at a price equal to the grant date price or at a reduced price that is calculated in accordance with the plan.Previous grants of rights under this plan are anticipated to be grandfathered upon conversion to a dividend paying corporation,however no further grants are currently anticipated under this plan.
Deferred Entitlement Units (DEUs)A DEU is a time vested award entitling the holder of the award to receive trust units, plus deemed distributions reinvested, that arecontingent upon the company’s performance relative to its peers. DEUs generally vest three years after the grant date.
Pengrowth currently utilizes the DEU plan for stock based compensation awards. The existing DEU plan permits special classes ofDEUs to be granted that contain similar characteristics and vesting periods to those of the new long term incentive plans describedbelow. Upon conversion to a dividend paying corporation, the new long term incentive plans will become effective. Awards of thesespecial classes of DEUs are anticipated to convert to share based awards under the new long term incentive plans.
The fair value of the special class of DEUs granted in 2010 was estimated on the same basis as previous grants of DEUs. However asthe vesting dates and estimated forfeitures of the special awards differ, the amount of the estimated stock based compensationexpense related to these awards will be different from that of previously granted DEUs.
NEW LONG TERM INCENTIVE PLANSOn May 11, 2010, Pengrowth received shareholder approval to implement the following new long term incentive plans uponconversion to a dividend paying corporation:
a) Performance Share Units (PSUs)A PSU is a time-vested award entitling employees, officers, or special consultants to receive shares, plus deemed dividendsreinvested, that are contingent upon the company’s shareholder return relative to a peer group of companies. Each grant vests 3years after issue.
b) Restricted Share Units (RSUs)An RSU is a time-vested award entitling employees, officers, or special consultants to receive shares, plus deemed dividendsreinvested. One third of the RSUs vest on the first, second, and third anniversary dates from the date of grant.
c) Deferred Share Units (DSUs)A DSU is a notional share that vests immediately and is redeemable for shares for a period of time after the holder ceases to be adirector, officer, employee, or special consultant of Pengrowth. The DSU plan is currently intended only for members of theBoard of Directors.
DEUsPengrowth recorded compensation expense of approximately $4.6 million for the nine months ended September 30, 2010(September 30, 2009 – $6.4 million) related to the DEU plan. Compensation expense associated with the DEUs granted in the ninemonths ended September 30, 2010 was based on the weighted average grant date fair value of $11.16 per DEU (September 30,2009 – $6.47 per DEU). For the nine months ended September 30, 2010, 257,607 trust units were issued (September 30, 2009 –384,171 trust units) on redemption of vested DEUs.
Nine months endedSeptember 30, 2010
Year EndedDecember 31, 2009
DEUsNumberof DEUs
Weightedaverage
priceNumberof DEUs
Weightedaverage
price
Outstanding, beginning of period 2,291,469 $ 12.38 1,270,750 $ 19.38
Granted 1,376,958 $ 11.16 1,174,601 $ 6.55
Forfeited (490,174) $ 11.22 (120,637) $ 12.63
Exercised (459,074) $ 18.82 (297,184) $ 20.57
Deemed DRIP (1) 144,866 $ 11.29 263,939 $ 14.05
Outstanding, end of period 2,864,045 $ 10.91 2,291,469 $ 12.38
(1) Weighted average deemed DRIP price is based on the average of the original grant prices.
44
TH
IRD
QU
AR
TE
RR
ES
UL
TS
PE
NG
RO
WT
H

TRUST UNIT RIGHTSAs at September 30, 2010, rights to purchase 4,018,868 trust units were outstanding (December 31, 2009 – 5,455,598) that expireat various dates to March 18, 2015.
Nine months endedSeptember 30, 2010
Year EndedDecember 31, 2009
Trust Unit RightsNumberof rights
Weightedaverage
priceNumberof rights
Weightedaverage
price
Outstanding, beginning of period 5,455,598 $ 12.23 3,292,622 $ 16.78
Granted (1) 30,144 $ 11.22 2,958,378 $ 6.63
Forfeited (1,022,736) $ 12.67 (495,718) $ 12.25
Exercised (444,138) $ 6.23 (299,684) $ 6.40
Outstanding, end of period 4,018,868 $ 12.77 5,455,598 $ 12.23
Exercisable, end of period 3,357,714 $ 13.83 3,087,494 $ 14.95
(1) Weighted average exercise price of rights granted are based on the exercise price at the date of grant.
Compensation expense relating to the rights was approximately $0.9 million for the nine months ended September 30, 2010(September 30, 2009 – $2.3 million). Compensation expense associated with the trust unit rights granted in the nine months endedSeptember 30, 2010 was based on the estimated fair value of $1.67 per trust unit right (September 30, 2009 – $1.11). The fair valueof trust unit rights granted in the period was estimated at 15 percent of the exercise price at the date of grant using a binomial latticeoption pricing model with the following assumptions: risk-free rate of 2.8 percent, volatility of 47 percent, expected distributionyield of 19 percent per trust unit at time of issue and reductions in the exercise price over the life of the trust unit rights. The amountof compensation expense is reduced by the estimated forfeitures at the date of grant which has been estimated at five percent fordirectors and officers and ten percent for employees.
10. DEFICITAs at
September 30, 2010As at
December 31, 2009
Accumulated earnings $ 2,384,361 $ 2,156,041
Accumulated distributions declared (4,488,028) (4,300,562)
$ (2,103,667) $ (2,144,521)
Historically, under its Royalty and Trust Indentures, Pengrowth distributed to unitholders a significant portion of its cash flow fromoperations. Cash flow from operations typically exceeds net income or loss as a result of non-cash expenses such as unrealized gains(losses) on commodity contracts, unrealized foreign exchange gains (losses), depletion, depreciation and accretion. These non-cashexpenses result in a deficit being recorded despite Pengrowth distributing less than its cash flow from operations.
DISTRIBUTIONS PAIDActual cash distributions paid for the nine months ended September 30, 2010 were $183.2 million (September 30, 2009 – $267.9million). Distributions declared have been determined in accordance with the Trust Indenture. Distributions are declared payable inthe following month after the distributions were earned. The amount of cash not distributed to unitholders is at the discretion of theBoard of Directors.
45
TH
IRD
QU
AR
TE
RR
ES
UL
TS
PE
NG
RO
WT
H

11. FOREIGN EXCHANGE (GAIN) LOSSThree months ended Nine months ended
September 30,2010
September 30,2009
September 30,2010
September 30,2009
Unrealized foreign exchange gain on translationof U.S. dollar denominated debt $ (32,111) $ (79,840) $ (19,664) $ (127,415)
Unrealized foreign exchange loss (gain) ontranslation of U.K. Pound Sterlingdenominated debt 1,300 (10,120) (4,105) (3,220)
(30,811) (89,960) (23,769) (130,635)
Unrealized loss (gain) on foreign exchange riskmanagement contracts on U.K. Pound Sterlingdenominated debt 232 9,425 3,593 (474)
Unrealized foreign exchange gain $ (30,579) $ (80,535) $ (20,176) $ (131,109)
Realized foreign exchange (gain) loss $ (489) $ (1,073) $ 2,039 $ (638)
$ (31,068) $ (81,608) $ (18,137) $ (131,747)
12. OTHER CASH FLOW DISCLOSURES
CHANGE IN NON-CASH OPERATING WORKING CAPITAL
Three months ended Nine months ended
Cash provided by (used for):September 30,
2010September 30,
2009September 30,
2010September 30,
2009
Accounts receivable $ 18,965 $ 1,974 $ 36,551 $ 20,165
Accounts payable and accrued liabilities (2,522) 16,458 (33,570) (53,864)
Due from Pengrowth Management Limited – (204) – (22)
$ 16,443 $ 18,228 $ 2,981 $ (33,721)
CHANGE IN NON-CASH INVESTING WORKING CAPITAL
Three months ended Nine months ended
Cash provided by (used for):September 30,
2010September 30,
2009September 30,
2010September 30,
2009
Accounts receivable $ – $ – $ (5,205) $ –
Accounts payable and capital accruals 12,147 (2,350) 11,290 (23,426)
$ 12,147 $ (2,350) $ 6,085 $ (23,426)
CASH INTEREST AND FINANCING PAYMENTS
Three months ended Nine months endedSeptember 30,
2010September 30,
2009September 30,
2010September 30,
2009
Interest and financing charges $ 24,520 $ 27,941 $ 58,396 $ 74,197
13. AMOUNTS PER TRUST UNIT
The following reconciles the weighted average number of trust units used in the basic and diluted net income per unit calculations:
Three months ended Nine months endedSeptember 30,
2010September 30,
2009September 30,
2010September 30,
2009
Weighted average number of trust units – basic 297,005,109 259,262,540 292,773,395 257,995,930
Dilutive effect of trust unit rights and DEUs 1,960,501 2,083,756 2,018,287 1,535,645
Weighted average number of trust units – diluted 298,965,610 261,346,296 294,791,682 259,531,575
The weighted average number of exchangeable shares has been included in the basic weighted average number of trust unitsoutstanding using the if converted method. For the three months ended September 30, 2010, 2.7 million trust units (September 30,
46
TH
IRD
QU
AR
TE
RR
ES
UL
TS
PE
NG
RO
WT
H
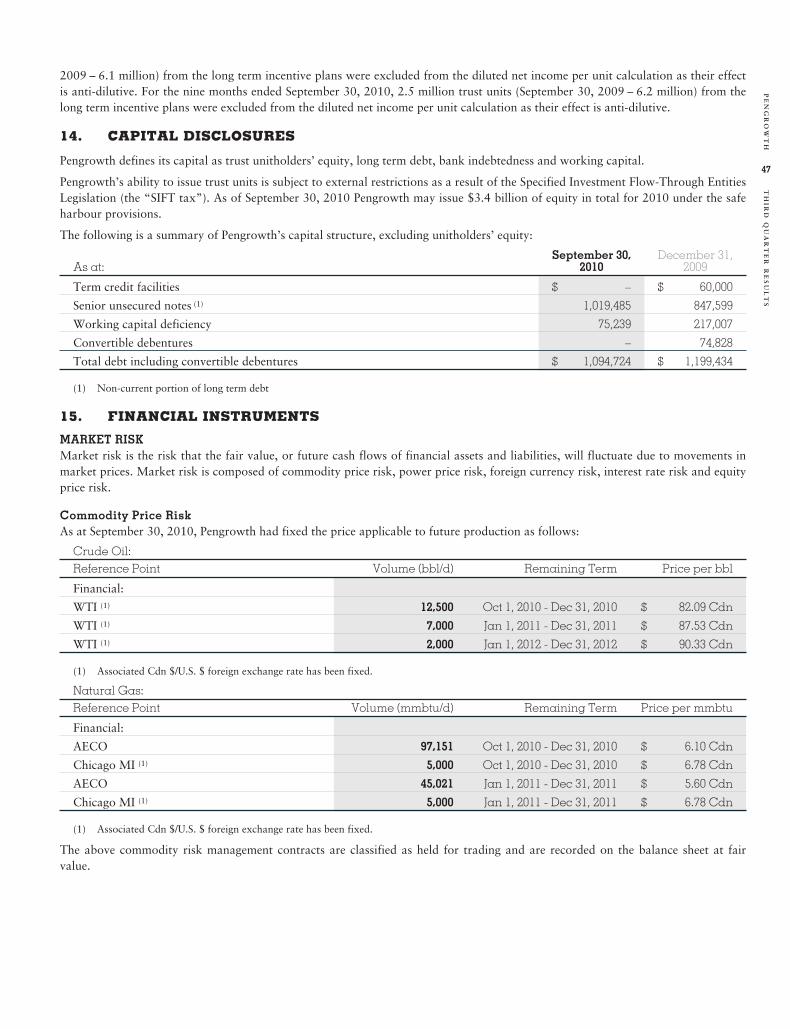
2009 – 6.1 million) from the long term incentive plans were excluded from the diluted net income per unit calculation as their effectis anti-dilutive. For the nine months ended September 30, 2010, 2.5 million trust units (September 30, 2009 – 6.2 million) from thelong term incentive plans were excluded from the diluted net income per unit calculation as their effect is anti-dilutive.
14. CAPITAL DISCLOSURES
Pengrowth defines its capital as trust unitholders’ equity, long term debt, bank indebtedness and working capital.
Pengrowth’s ability to issue trust units is subject to external restrictions as a result of the Specified Investment Flow-Through EntitiesLegislation (the “SIFT tax”). As of September 30, 2010 Pengrowth may issue $3.4 billion of equity in total for 2010 under the safeharbour provisions.
The following is a summary of Pengrowth’s capital structure, excluding unitholders’ equity:
As at:September 30,
2010December 31,
2009
Term credit facilities $ – $ 60,000
Senior unsecured notes (1) 1,019,485 847,599
Working capital deficiency 75,239 217,007
Convertible debentures – 74,828
Total debt including convertible debentures $ 1,094,724 $ 1,199,434
(1) Non-current portion of long term debt
15. FINANCIAL INSTRUMENTS
MARKET RISKMarket risk is the risk that the fair value, or future cash flows of financial assets and liabilities, will fluctuate due to movements inmarket prices. Market risk is composed of commodity price risk, power price risk, foreign currency risk, interest rate risk and equityprice risk.
Commodity Price RiskAs at September 30, 2010, Pengrowth had fixed the price applicable to future production as follows:
Crude Oil:Reference Point Volume (bbl/d) Remaining Term Price per bbl
Financial:
WTI (1) 12,500 Oct 1, 2010 - Dec 31, 2010 $ 82.09 Cdn
WTI (1) 7,000 Jan 1, 2011 - Dec 31, 2011 $ 87.53 Cdn
WTI (1) 2,000 Jan 1, 2012 - Dec 31, 2012 $ 90.33 Cdn
(1) Associated Cdn $/U.S. $ foreign exchange rate has been fixed.
Natural Gas:Reference Point Volume (mmbtu/d) Remaining Term Price per mmbtu
Financial:
AECO 97,151 Oct 1, 2010 - Dec 31, 2010 $ 6.10 Cdn
Chicago MI (1) 5,000 Oct 1, 2010 - Dec 31, 2010 $ 6.78 Cdn
AECO 45,021 Jan 1, 2011 - Dec 31, 2011 $ 5.60 Cdn
Chicago MI (1) 5,000 Jan 1, 2011 - Dec 31, 2011 $ 6.78 Cdn
(1) Associated Cdn $/U.S. $ foreign exchange rate has been fixed.
The above commodity risk management contracts are classified as held for trading and are recorded on the balance sheet at fairvalue.
47
TH
IRD
QU
AR
TE
RR
ES
UL
TS
PE
NG
RO
WT
H

The fair value of the commodity risk management contracts are recorded as current and non-current assets and liabilities on acontract by contract basis. The change in the fair value of the commodity risk management contracts during the period is recognizedas an unrealized gain or loss on the statement of income as follows:
Commodity Risk Management ContractsAs at
September 30, 2010As at
September 30, 2009
Current portion of unrealized risk management assets $ 47,084 $ 52,471
Non-current portion of unrealized risk management assets 4,780 1,332
Current portion of unrealized risk management liabilities (906) (5,571)
Non-current portion of unrealized risk management liabilities (514) (17,165)
Total unrealized risk management assets at period end $ 50,444 $ 31,067
Three months endedSeptember 30, 2010
Three months endedSeptember 30, 2009
Total unrealized risk management assets at period end $ 50,444 $ 31,067
Less: Unrealized risk management assets at beginning of period 51,342 36,676
Unrealized loss on risk management contracts for the period $ (898) $ (5,609)
Nine months endedSeptember 30, 2010
Nine months endedSeptember 30, 2009
Total unrealized risk management assets at period end $ 50,444 $ 31,067
Less: Unrealized risk management (liabilities) assets at beginning of period (9,034) 164,692
Unrealized gain (loss) on risk management contracts for the period $ 59,478 $ (133,625)
Commodity Price Sensitivity – Risk Management ContractsEach Cdn $1 per barrel change in future oil prices would result in approximately $4.4 million pre-tax change in the unrealized gain(loss) on commodity risk management contracts as at September 30, 2010 (September 30, 2009 – $6.2 million). Similarly, each Cdn$0.25 per mcf change in future natural gas prices would result in approximately $6.9 million pre-tax change in the unrealized gain(loss) on commodity risk management contracts (September 30, 2009 – $14.5 million).
As of close September 30, 2010, the AECO spot price gas price was approximately $3.57 per mcf (September 30, 2009 – $3.75 permcf), and the WTI prompt month price was U.S. $79.97 per barrel (September 30, 2009 – U.S. $70.61 per barrel).
Power Price RiskAs at September 30, 2010, Pengrowth had fixed the price applicable to future power costs as follows:
Power:Reference Point Volume (mwh) Remaining Term Price per mwh
Financial:
AESO 20 Oct 1, 2010 - Dec 31, 2010 $ 47.66 Cdn
AESO 20 Jan 1, 2011 - Dec 31, 2011 $ 46.94 Cdn
The above power risk management contracts are classified as held for trading and are recorded on the balance sheet at fair value.
48
TH
IRD
QU
AR
TE
RR
ES
UL
TS
PE
NG
RO
WT
H

The fair value of the power risk management contracts are recorded as current and non-current assets and liabilities on a contract bycontract basis. The change in the fair value of the power risk management contracts during the period is recognized as otherexpenses (income) on the statement of income as follows:
Power Risk Management ContractsAs at
September 30, 2010As at
September 30, 2009
Current portion of unrealized risk management liabilities (540) –
Non-current portion of unrealized risk management liabilities (42) –
Total unrealized risk management liabilities at period end $ (582) $ –
Three months endedSeptember 30, 2010
Three months endedSeptember 30, 2009
Total unrealized risk management liabilities at period end $ (582) $ –
Less: Unrealized risk management assets at beginning of period 1,216 –
Unrealized loss on risk management contracts for the period $ (1,798) $ –
Nine months endedSeptember 30, 2010
Nine months endedSeptember 30, 2009
Total unrealized risk management liabilities at period end $ (582) $ –
Less: Unrealized risk management (liabilities) assets at beginning of period – –
Unrealized loss on risk management contracts for the period $ (582) $ –
Power Price Sensitivity – Risk Management ContractsEach Cdn $1 per mwh change in future power prices would result in approximately $0.2 million pre-tax change in the fair value ofthe risk management contracts recorded in other expenses (income) on the statement of income.
Foreign Exchange RiskPengrowth entered into foreign exchange risk management contracts in conjunction with issuing U.K. Pounds Sterling 50 million tenyear term notes which fixed the Canadian dollar to U.K. Pound Sterling exchange rate on the interest and principal of the U.K.Pound Sterling denominated debt at approximately 0.4976 U.K. Pounds Sterling per Canadian dollar. The estimated fair value of theforeign exchange risk management contracts at September 30, 2010 was a liability of approximately $21.4 million.
The foreign exchange risk management contracts are classified as held for trading and are recorded on the balance sheet at fairvalue. The fair value of the foreign exchange risk management contracts are allocated to current and non-current assets andliabilities on a contract by contract basis. The change in the fair value of the foreign exchange risk management contracts during theperiod is recognized as an unrealized gain or loss on the statement of income as follows:
Foreign Exchange Risk Management ContractsAs at
September 30, 2010As at
September 30, 2009
Current portion of unrealized risk management liabilities $ (1,088) $ (2,957)
Non-current portion of unrealized risk management liabilities (20,294) (15,296)
Total unrealized risk management liabilities at period end $ (21,382) $ (18,253)
Three months endedSeptember 30, 2010
Three months endedSeptember 30, 2009
Total unrealized risk management liabilities at period end $ (21,382) $ (18,253)
Less: Unrealized risk management liabilities at beginning of period (21,150) (8,828)
Unrealized loss on risk management contracts for the period $ (232) $ (9,425)
Nine months endedSeptember 30, 2010
Nine months endedSeptember 30, 2009
Total unrealized risk management liabilities at period end $ (21,382) $ (18,253)
Less: Unrealized risk management liabilities at beginning of period (17,789) (18,727)
Unrealized (loss) gain on risk management contracts for the period $ (3,593) $ 474
49
TH
IRD
QU
AR
TE
RR
ES
UL
TS
PE
NG
RO
WT
H

Foreign Exchange Rate SensitivityThe following summarizes the sensitivity on a pre-tax basis of a change in the foreign exchange rate on unrealized foreign exchangegains (losses) related to the translation of the foreign denominated term debt and on unrealized gains (losses) related to the change inthe fair value of the foreign exchange risk management contracts, holding all other variables constant:
Cdn $0.01 Exchange Rate ChangeForeign Exchange Sensitivity as at September 30, 2010 Cdn - U.S. Cdn - U.K.
Unrealized foreign exchange gain or loss on foreign denominated debt $ 9,020 $ 500
Unrealized foreign exchange risk management gain or loss – 606
Cdn $0.01 Exchange Rate ChangeForeign Exchange Sensitivity as at September 30, 2009 Cdn - U.S. Cdn - U.K.
Unrealized foreign exchange gain or loss on foreign denominated debt $ 8,650 $ 500
Unrealized foreign exchange risk management gain or loss – 587
Interest Rate RiskPengrowth is exposed to interest rate risk on the Canadian dollar revolving credit facility as the interest is based on floating interestrates. Pengrowth mitigates some of its exposure to interest rate risk by issuing fixed rate term notes.
Interest Rate SensitivityAs at September 30, 2010, Pengrowth had no significant interest rate risk as all of the outstanding long term debt is based on fixedinterest rates.
Summary of Risk Management ContractsThe following table provides the allocation between current and non-current assets and liabilities for all risk management contracts:
Balance Sheet as at September 30, 2010
Commodity riskmanagement
contracts
Power riskmanagement
contracts
Foreignexchange riskmanagement
contracts Total
Current portion of unrealized risk management assets $ 47,084 $ – $ – $ 47,084
Non-current portion of unrealized risk management assets 4,780 – – 4,780
Current portion of unrealized risk management liabilities (906) (540) (1,088) (2,534)
Non-current portion of unrealized risk managementliabilities (514) (42) (20,294) (20,850)
Total unrealized risk management assets (liabilities) as atSeptember 30, 2010 $ 50,444 $ (582) $ (21,382) $ 28,480
Balance Sheet as at September 31, 2009
Commodity riskmanagement
contracts
Power riskmanagement
contracts
Foreignexchange riskmanagement
contracts Total
Current portion of unrealized risk management assets $ 14,001 $ – $ – $ 14,001
Current portion of unrealized risk management liabilities (16,661) – (894) (17,555)
Non-current portion of unrealized risk managementliabilities (6,374) – (16,895) (23,269)
Total unrealized risk management assets (liabilities) as atSeptember 30, 2009 $ (9,034) $ – $ (17,789) $(26,823)
50
TH
IRD
QU
AR
TE
RR
ES
UL
TS
PE
NG
RO
WT
H

FAIR VALUEThe following tables provide fair value measurement information for financial assets and liabilities:
Fair Value Measurements Using:
As at September 30, 2010Carrying
AmountFair
Value
QuotedPrices in
ActiveMarkets(Level 1)
SignificantOther
ObservableInputs
(Level 2)
SignificantUnobservable
Inputs(Level 3)
Financial Assets
Remediation trust funds $ 40,737 $ 40,739 $ 40,739 $ – $ –
Fair value of risk management contracts 51,864 51,864 – 51,864 –
Financial Liabilities
U.S. dollar denominated senior unsecured notes 924,024 1,066,164 – 1,066,164 –
Cdn dollar senior unsecured notes 15,000 16,109 – 16,109 –
U.K. Pound Sterling denominated unsecured notes 80,461 90,329 – 90,329 –
Fair value of risk management contracts 23,384 23,384 – 23,384 –
Fair Value Measurements Using:
As at December 31, 2009CarryingAmount
FairValue
QuotedPrices in
ActiveMarkets(Level 1)
SignificantOther
ObservableInputs
(Level 2)
SignificantUnobservable
Inputs(Level 3)
Financial Assets
Remediation trust funds $ 34,837 $ 34,821 $ 34,821 $ – $ –
Fair value of risk management contracts 14,001 14,001 – 14,001 –
Other Assets – investment in public company 1,151 1,151 1,151 – –
Financial Liabilities
U.S. dollar denominated senior unsecured notes 905,631 963,136 – 963,136 –
Cdn dollar senior unsecured notes 15,000 15,164 – 15,164 –
U.K. Pound Sterling denominated unsecured notes 84,514 89,724 – 89,724 –
Convertible debentures 74,828 76,423 76,423 – –
Fair value of risk management contracts 40,824 40,824 – 40,824 –
CREDIT RISKPengrowth considers amounts over 90 days as past due. As at September 30, 2010, the amount of accounts receivable that were pastdue was not significant. Pengrowth has not recorded a significant allowance for doubtful accounts as no significant impairmentissues exist at September 30, 2010. Pengrowth’s objectives, processes and policies for managing credit risk have not changed fromthe previous year.
LIQUIDITY RISKAll of Pengrowth’s financial liabilities are current and due within one year, except as follows:
As at September 30, 2010Carrying
AmountContractualCash Flows
Within1 year 1-2 years 2-5 years
More than5 years
Cdn dollar senior unsecured notes (1) $ 15,000 $ 22,830 $ 992 $ 994 $ 2,975 $ 17,869
U.S. dollar denominated senior unsecured notes (1) 924,024 1,348,253 58,527 58,689 218,834 1,012,203
U.K. Pound Sterling denominated unsecured notes (1) 80,461 103,651 4,413 4,424 13,239 81,575
Remediation trust fund payments – 12,500 250 250 750 11,250
Commodity risk management contracts 514 526 – 367 159 –
Power risk management contracts 42 43 – 43 – –
Foreign exchange risk management contracts 20,294 165 30 30 90 15
(1) Contractual cash flows include future interest payments calculated at period end exchange rates and interest rates.
51
TH
IRD
QU
AR
TE
RR
ES
UL
TS
PE
NG
RO
WT
H

As at December 31, 2009CarryingAmount
ContractualCash Flows
Within1 year 1-2 years 2-5 years
More than5 years
Cdn dollar revolving credit facility(1) $ 60,000 $ 60,892 $ 613 $ 60,279 $ – $ –
Cdn dollar senior unsecured notes (1) 15,000 23,571 992 992 2,977 18,610
U.S. dollar denominated senior unsecured notes (1) 748,085 1,131,180 49,009 49,009 194,858 838,304
U.K. Pound Sterling denominated unsecured notes (1) 84,514 112,384 4,637 4,637 13,923 89,187
Convertible debentures (1) (2) 74,828 79,599 – 79,599 – –
Remediation trust fund payments – 12,500 250 250 750 11,250
Commodity risk management contracts 6,374 6,517 – 6,517 – –
Foreign exchange risk management contracts 16,895 180 30 30 90 30
(1) Contractual cash flows include future interest payments calculated at period end exchange rates and interest rates.(2) Convertible debentures were redeemed on January 14, 2010 using proceeds from the revolving credit facility. The repayment of the convertible
debentures has been shown in the above table as due in 1-2 years with the revolving credit facility.
16. SUBSEQUENT EVENTS
CONVERSION TO A CORPORATIONOn October 20, 2010, Pengrowth announced that the Board of Directors has approved the conversion of Pengrowth Energy Trust toa new dividend paying corporation. Subject to receipt of all necessary approvals, this conversion is expected to be completed onDecember 31, 2010 pursuant to a plan of arrangement under the Business Corporations Act (Alberta).
TERM CREDIT FACILITIESEffective October 29, 2010, Pengrowth renewed the terms and extended the maturity date of its syndicated revolving credit facilityto October 29, 2013. The renewed credit facility is comprised of a $1.0 billion committed revolving credit facility with up to a $250million expansion feature. In total, the renewed credit facility provides Pengrowth up to $1.25 billion of credit capacity from asyndicate of seven Canadian and three foreign banks. This facility carries floating interest rates that are expected to range between2.00 percent and 3.25 percent over bankers’ acceptance rates, depending on Pengrowth’s consolidated ratio of senior debt toearnings before interest, taxes and non-cash items.
COMMODITY RISK MANAGEMENTSubsequent to September 30, 2010, Pengrowth has entered into fixed price commodity sales contracts with third parties as follows:
Crude Oil:Reference Point Volume (bbl/d) Remaining Term Price per bbl
Financial:WTI (1) 5,000 Jan 1, 2011 - Dec 31, 2011 $ 88.33CdnWTI (1) 2,500 Jan 1, 2012 - Dec 31, 2012 $ 91.40Cdn
(1) Associated Cdn $/U.S. $ foreign exchange rate has been fixed.
As at November 4, 2010, Pengrowth had fixed the price applicable to future production as follows:
Crude Oil:Reference Point Volume (bbl/d) Remaining Term Price per bbl
Financial:WTI (1) 12,500 Oct 1, 2010 - Dec 31, 2010 $ 82.09CdnWTI (1) 12,000 Jan 1, 2011 - Dec 31, 2011 $ 87.87CdnWTI (1) 4,500 Jan 1, 2012 - Dec 31, 2012 $ 90.92Cdn
(1) Associated Cdn $/U.S. $ foreign exchange rate has been fixed.
52
TH
IRD
QU
AR
TE
RR
ES
UL
TS
PE
NG
RO
WT
H

POWER RISK MANAGEMENTSubsequent to September 30, 2010, Pengrowth has fixed the price applicable to future power costs as follows:
Power:Reference Point Volume (mwh) Remaining Term Price per mwh
Financial:
AESO 5 Jan 1, 2011 - Dec 31, 2011 $ 43.95Cdn
As at November 4, 2010, Pengrowth had fixed the price applicable to future power costs as follows:
Power:Reference Point Volume (mwh) Remaining Term Price per mwh
Financial:
AESO 20 Oct 1, 2010 - Dec 31, 2010 $ 47.66Cdn
AESO 25 Jan 1, 2011 - Dec 31, 2011 $ 46.34Cdn
53
TH
IRD
QU
AR
TE
RR
ES
UL
TS
PE
NG
RO
WT
H

CORPORATE PROFILEDIRECTORS OF PENGROWTHCORPORATIONJohn B. Zaozirny;Chairman,Vice Chairman CanaccordCapital Corporation
Thomas A. CummingBusiness Consultant
Derek Evans,President and CEO
Wayne K. FooPresident & CEO,Petro Andina Resources Inc.
James S. Kinnear;Chairman Emeritus
James D. McFarland;President and CEO,PanWestern Energy Inc.
Michael S. ParrettBusiness Consultant
A. Terence PooleBusiness Consultant
D. Michael G. StewartCorporate Director
Nicholas C. H. VilliersBusiness Consultant
Director EmeritusThomas S. Dobson
Francis G. Vetsch
Stanley H. Wong
OFFICERS OF PENGROWTHCORPORATIONDerek W. EvansPresident and Chief Executive Officer
Christopher WebsterChief Financial Officer
Andrew GrasbyVice President, General Counsel &Corporate Secretary
Doug C. BowlesVice President and Controller
James CausgroveVice President, Production andOperations
William ChristensenVice President, Strategic Planningand Reservoir Exploitation
TRUSTEEComputershare Trust Company of Canada
BANKERSBank Syndicate Agent: Royal Bank of Canada
AUDITORSKPMG LLP
ENGINEERING CONSULTANTSGLJ Petroleum Consultants Ltd.
ABBREVIATIONSbbl barrel
bcf billion cubic feet
boe* barrels of oil equivalent
gj gigajoule
mbbls thousand barrels
mmbbls million barrels
mboe* thousand barrels of oilequivalent
mmboe* million barrels of oilequivalent
mmbtu million British thermal units
mcf thousand cubic feet
mmcf million cubic feet
mwh mega watt hour*6 mcf of gas =1 barrel of oil equivalent
STOCK EXCHANGE LISTINGSThe Toronto Stock Exchange:Symbol: PGF.UN
The New York Stock Exchange:Symbol: PGH
PENGROWTH ENERGY TRUSTHead Office2100, 222 Third Avenue SW Calgary,AB T2P 0B4 CanadaTelephone: (403) 233-0224Toll-Free: (800) 223-4122Facsimile: (403) 265-6251
Email: [email protected]: www.pengrowth.com
Halifax OfficePurdy’s Tower 1 – Suite 17001959 Upper Water StreetHalifax, Nova Scotia B3J 2N2 CanadaTelephone: (902) 425-8778Facsimile: (902) 425-7887
INVESTOR RELATIONSFor investor relations enquiries, please contact:
Investor Relations, CalgaryTelephone: (403) 233-0224Toll-Free: (888) 744-1111Facsimile:(403) 693-8889Email: [email protected]
54
TH
IRD
QU
AR
TE
RR
ES
UL
TS
PE
NG
RO
WT
H

2100, 222 Third Avenue SWCalgary AlbertaT2P 0B4 Canada
T 403.233.0224F 403.265.6251
www.pengrowth.com