Embed Size (px)
Citation preview

2010 Sales Compensation & Performance Management – Key Trends Analysis
2010 Sales Compensation &
Performance Management
Key Trends Analysis
Compliments of:
Barry Trailer
Partner, CSO Insights
Corte Madera, CA
Jim Dickie Partner, CSO Insights
Boulder, CO
♦
2010 Sales Compensation & Performance Management – Key Trends Analysis
Terms and Conditions
Printed in the United States of America. Except as permitted under the United States Copyright Act of 1976, no part of this publication may be produced or distributed in any form or by any means, or stored in a database or retrieval system, without the prior written permission of the publisher. For additional information, contact CSO Insights, 4524 Northfield Court, Boulder, CO 80301, Phone: (303) 521 4410, e-mail: [email protected]. The reader understands that the information and data used in preparation of this report were as accurate as possible at the time of preparation by the publisher. The publisher assumes no responsibility to update the
information or publication. The publisher assumes that the readers will use the information contained in this publication for the purpose of informing themselves on the matters that form the subject of this publication. It is sold with the understanding that neither the authors nor those individuals interviewed are engaged in rendering legal, accounting, or other professional service. If legal or other expert advice is required, the services of a competent professional should be sought. The publisher assumes no responsibility for any use to which the purchaser puts this information. All views expressed in this report are those of the individuals interviewed and do not necessarily reflect those of the companies or organizations they may be affiliated with, CSO Insights, Insight Technology Group, or Sales Mastery. All trademarks are trademarks of their respective companies.
Copyright © 2010 CSO Insights
All Rights Reserved.
2010 Sales Compensation & Performance Management – Key Trends Analysis
Acknowledgements
For 16 years we have realized that our ability to gather, analyze and present our analysis of various sales effectiveness topics is dependent on the support of subject matter experts providing insights on the right questions to ask and then sales executives taking the time to share their metrics with us. This has again proven true for us in preparing this report on Sales Compensation & Performance Management. So once again, we say a sincere “Thank You” to all of the far-sighted industry executives who unselfishly contributed their time to the development of the research knowledge base used in the creation of this publication. Next, we would like to thank the following sales performance management and compensation companies and those individuals who supported this project: Merced Systems, Synygy, Varicent Software, Xactly Corporation and Colletti-Fiss. Finally, we want to thank our research and editing team including: Kim Cameron, Diane Hodges and Andy Jesmok.
Compliments of:
To receive complimentary issues of CSO Insights’ newsletter, go to CSO Insights Newsletter Publications
2010 Sales Compensation & Performance Management – Key Trends Analysis
Table of Contents
Introduction ................................................................................................................... 1 Percentage of Reps Expected to Make Quota in Comp Plan Design ......................... 7 Percentage of Sales Force on Track to Achieve Quota .............................................. 8 Average Annual Quota Assignment per Rep .............................................................. 9 Sales Compensation Spend as a Percentage of Annual Revenues ......................... 10 Utilize Accelerators in Compensation Plans ............................................................. 11 Impact of Compensation Plans in Driving Selling Behaviors .................................. 12 Selling Behaviors Impacted by Compensation Plans ............................................... 13 Compensation Plan Design Includes Sales Rep Retention Strategy………………..14 Elements Used in Sales Rep Compensation Plans……………………………………..15 Variable Compensation Payment Error Rate ............................................................. 16 Recommendations Going Forward ............................................................................ 17
2010 Sales Compensation & Performance Management – Key Trends Analysis
© CSO Insights 1
No portion of this report may be reproduced or distributed in any form or by any means without the prior written permission of the authors.
“It is a riddle, wrapped in a mystery, inside an enigma; but perhaps there is a key.”
—Winston Churchill
INTRODUCTION
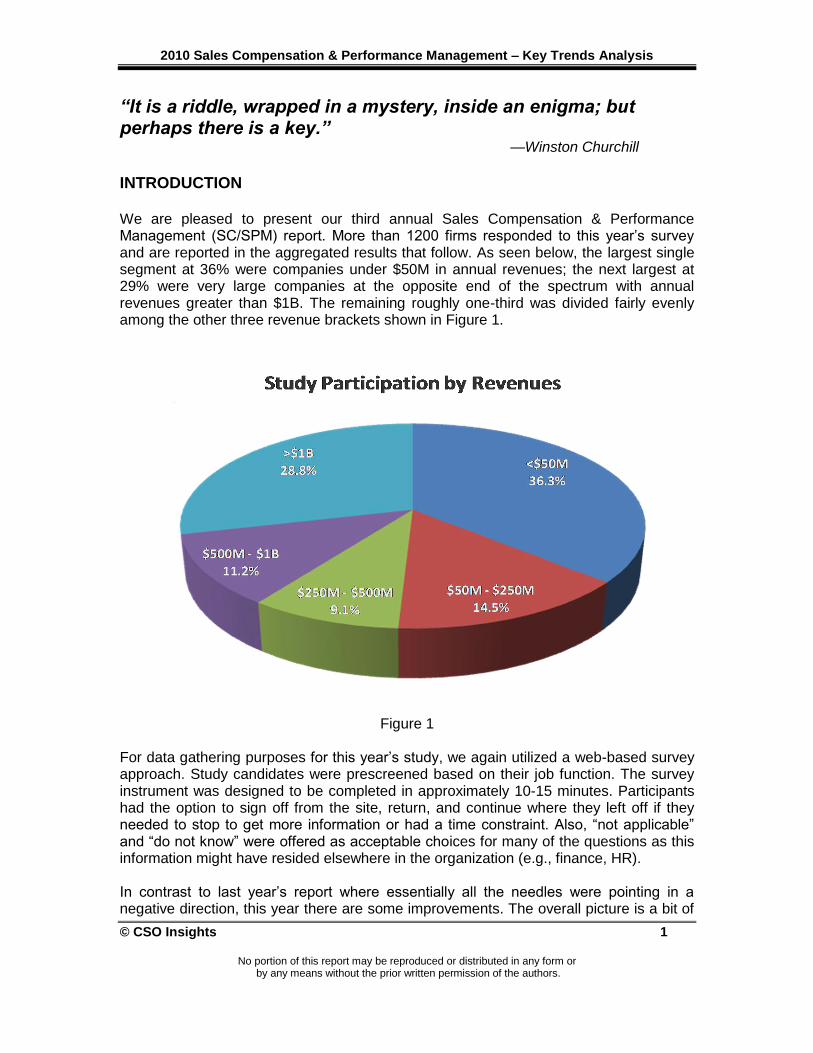
We are pleased to present our third annual Sales Compensation & Performance Management (SC/SPM) report. More than 1200 firms responded to this year‟s survey and are reported in the aggregated results that follow. As seen below, the largest single segment at 36% were companies under $50M in annual revenues; the next largest at 29% were very large companies at the opposite end of the spectrum with annual revenues greater than $1B. The remaining roughly one-third was divided fairly evenly among the other three revenue brackets shown in Figure 1.
Figure 1 For data gathering purposes for this year‟s study, we again utilized a web-based survey approach. Study candidates were prescreened based on their job function. The survey instrument was designed to be completed in approximately 10-15 minutes. Participants had the option to sign off from the site, return, and continue where they left off if they needed to stop to get more information or had a time constraint. Also, “not applicable” and “do not know” were offered as acceptable choices for many of the questions as this information might have resided elsewhere in the organization (e.g., finance, HR). In contrast to last year‟s report where essentially all the needles were pointing in a negative direction, this year there are some improvements. The overall picture is a bit of
2010 Sales Compensation & Performance Management – Key Trends Analysis
© CSO Insights 2
No portion of this report may be reproduced or distributed in any form or by any means without the prior written permission of the authors.
a mixed bag, reflecting the general state of the economy. Companies have enjoyed a fairly robust recovery and are sitting on more cash (about $2T) than at any time during this decade. But they remain tentative, holding off on hiring, and remaining slow to pull out their checkbooks, reflected in persistent protracted sales cycles. Some key indicators that reflect this hopeful, but uncertain time include: Sales Quotas are Up; Sales Spend Up as Percentage of Revenue…individual
rep quotas (weighted average across all participants) jumped up $180K this year to $1.76M. At the same time, sales compensation spend as a percentage of annual revenues is up to 11.5% from 10.7% last year.
…but Quota Achievement and Targeted Compensation at Quota are Both
Down. Way down. The percentage of reps meeting or exceeding their assigned quota dropped to 51%, down from 53% last year and 59% in 2007. And targeted comp at quota (weighted average) is also down 4.7%—from $127,560 to $121,625.
Use of Accelerators is Up…which is good news for those reps that actually hit
their accelerators. Slight increase in overall percentage of reps hitting accelerators this past year and a surprising increase in reps hitting accelerators at the top end of the scale (>40% of reps).
…but Minimal/No Impact on Selling Behaviors is Also Up. What‟s up with
that? Aren‟t compensation and, even more specifically, accelerators supposed to channel sales rep behaviors in desired ways? Why are a higher percentage of respondents this year (15% versus 11% last year) saying these programs are having less impact on what reps are doing?
Positive Selling and Management Behaviors are Both Up…which again
should be good news. From proactively identifying which reps need extra coaching (51%) to fostering a positive sales team culture (48%) down through accurately forecasting business (33%) all point to a more informed and involved sales manager.
…but Number of Metrics Tracked is Down. Consistent with incentive plan
design, more than half (51%) of firms track only one to three metrics in their compensation plans. However, without additional performance management “hurdles” and timely access to the data needed to reinforce desired behaviors it is difficult to see performance and/or compliance improving.
These mixed signals confirm the uncertainty and opportunity of the road behind and the road ahead. There can be no question that buying behaviors have changed. Thanks to the Internet, the amount and detail of information with which buyers are now armed upon entering a purchase decision are unprecedented. In turn, selling behaviors can and should be changing as well. Sellers are expected to know more about their prospects‟ business situation, the issues they are confronting, and be able to address how their solution (a combination of product, service and experience) will address each buyer‟s needs.
2010 Sales Compensation & Performance Management – Key Trends Analysis
© CSO Insights 3
No portion of this report may be reproduced or distributed in any form or by any means without the prior written permission of the authors.
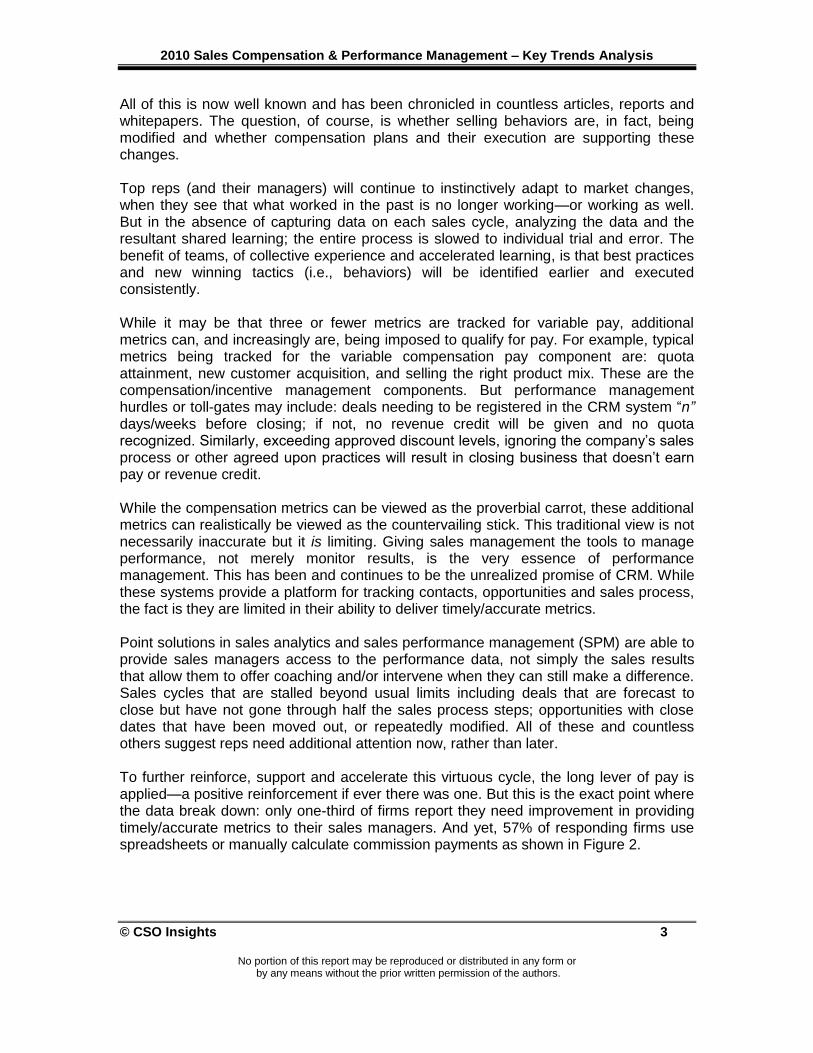
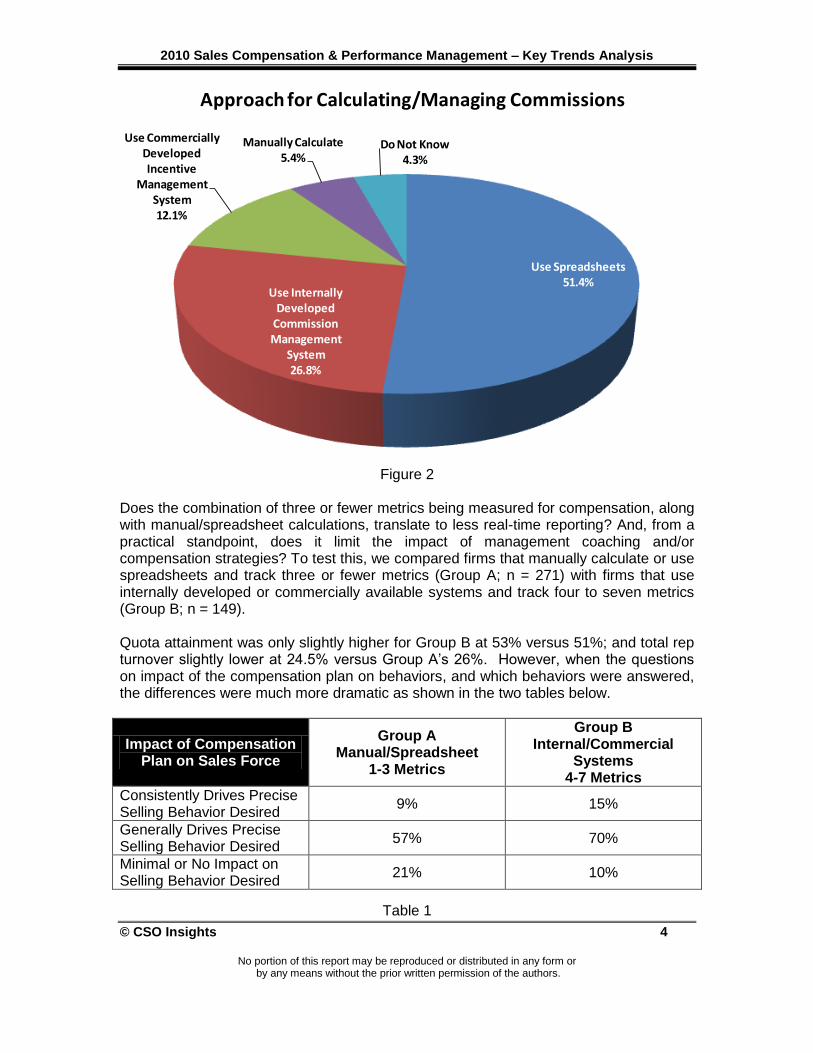
All of this is now well known and has been chronicled in countless articles, reports and whitepapers. The question, of course, is whether selling behaviors are, in fact, being modified and whether compensation plans and their execution are supporting these changes. Top reps (and their managers) will continue to instinctively adapt to market changes, when they see that what worked in the past is no longer working—or working as well. But in the absence of capturing data on each sales cycle, analyzing the data and the resultant shared learning; the entire process is slowed to individual trial and error. The benefit of teams, of collective experience and accelerated learning, is that best practices and new winning tactics (i.e., behaviors) will be identified earlier and executed consistently. While it may be that three or fewer metrics are tracked for variable pay, additional metrics can, and increasingly are, being imposed to qualify for pay. For example, typical metrics being tracked for the variable compensation pay component are: quota attainment, new customer acquisition, and selling the right product mix. These are the compensation/incentive management components. But performance management hurdles or toll-gates may include: deals needing to be registered in the CRM system “n” days/weeks before closing; if not, no revenue credit will be given and no quota recognized. Similarly, exceeding approved discount levels, ignoring the company‟s sales process or other agreed upon practices will result in closing business that doesn‟t earn pay or revenue credit. While the compensation metrics can be viewed as the proverbial carrot, these additional metrics can realistically be viewed as the countervailing stick. This traditional view is not necessarily inaccurate but it is limiting. Giving sales management the tools to manage performance, not merely monitor results, is the very essence of performance management. This has been and continues to be the unrealized promise of CRM. While these systems provide a platform for tracking contacts, opportunities and sales process, the fact is they are limited in their ability to deliver timely/accurate metrics. Point solutions in sales analytics and sales performance management (SPM) are able to provide sales managers access to the performance data, not simply the sales results that allow them to offer coaching and/or intervene when they can still make a difference. Sales cycles that are stalled beyond usual limits including deals that are forecast to close but have not gone through half the sales process steps; opportunities with close dates that have been moved out, or repeatedly modified. All of these and countless others suggest reps need additional attention now, rather than later. To further reinforce, support and accelerate this virtuous cycle, the long lever of pay is applied—a positive reinforcement if ever there was one. But this is the exact point where the data break down: only one-third of firms report they need improvement in providing timely/accurate metrics to their sales managers. And yet, 57% of responding firms use spreadsheets or manually calculate commission payments as shown in Figure 2.
2010 Sales Compensation & Performance Management – Key Trends Analysis
© CSO Insights 4
No portion of this report may be reproduced or distributed in any form or by any means without the prior written permission of the authors.
Use Spreadsheets51.4%
Use Internally Developed
Commission Management
System26.8%
Use Commercially Developed Incentive
Management System12.1%
Manually Calculate5.4%
Do Not Know4.3%
Approach for Calculating/Managing Commissions
Figure 2 Does the combination of three or fewer metrics being measured for compensation, along with manual/spreadsheet calculations, translate to less real-time reporting? And, from a practical standpoint, does it limit the impact of management coaching and/or compensation strategies? To test this, we compared firms that manually calculate or use spreadsheets and track three or fewer metrics (Group A; n = 271) with firms that use internally developed or commercially available systems and track four to seven metrics (Group B; n = 149). Quota attainment was only slightly higher for Group B at 53% versus 51%; and total rep turnover slightly lower at 24.5% versus Group A‟s 26%. However, when the questions on impact of the compensation plan on behaviors, and which behaviors were answered, the differences were much more dramatic as shown in the two tables below.
Impact of Compensation Plan on Sales Force
Group A Manual/Spreadsheet
1-3 Metrics
Group B Internal/Commercial
Systems 4-7 Metrics
Consistently Drives Precise Selling Behavior Desired
9% 15%
Generally Drives Precise Selling Behavior Desired
57% 70%
Minimal or No Impact on Selling Behavior Desired
21% 10%
Table 1
2010 Sales Compensation & Performance Management – Key Trends Analysis
© CSO Insights 5
No portion of this report may be reproduced or distributed in any form or by any means without the prior written permission of the authors.
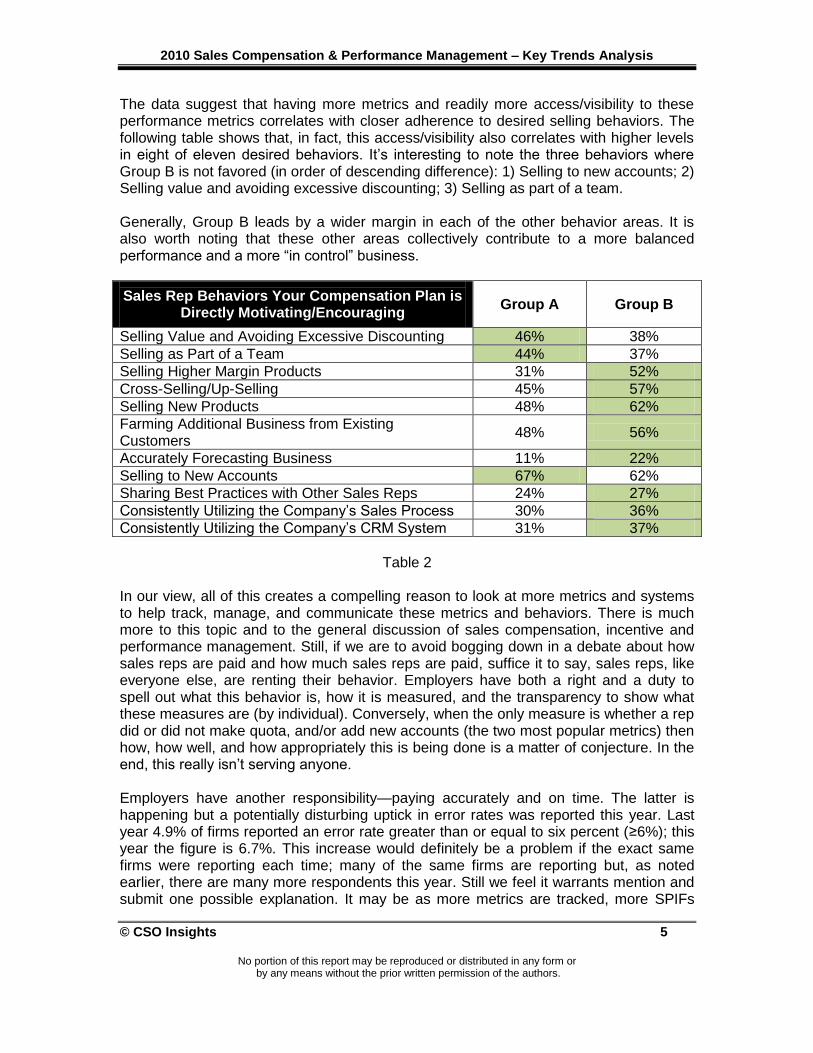
The data suggest that having more metrics and readily more access/visibility to these performance metrics correlates with closer adherence to desired selling behaviors. The following table shows that, in fact, this access/visibility also correlates with higher levels in eight of eleven desired behaviors. It‟s interesting to note the three behaviors where Group B is not favored (in order of descending difference): 1) Selling to new accounts; 2) Selling value and avoiding excessive discounting; 3) Selling as part of a team. Generally, Group B leads by a wider margin in each of the other behavior areas. It is also worth noting that these other areas collectively contribute to a more balanced performance and a more “in control” business.
Sales Rep Behaviors Your Compensation Plan is Directly Motivating/Encouraging
Group A Group B
Selling Value and Avoiding Excessive Discounting 46% 38%
Selling as Part of a Team 44% 37%
Selling Higher Margin Products 31% 52%
Cross-Selling/Up-Selling 45% 57%
Selling New Products 48% 62%
Farming Additional Business from Existing Customers
48% 56%
Accurately Forecasting Business 11% 22%
Selling to New Accounts 67% 62%
Sharing Best Practices with Other Sales Reps 24% 27%
Consistently Utilizing the Company‟s Sales Process 30% 36%
Consistently Utilizing the Company‟s CRM System 31% 37%
Table 2
In our view, all of this creates a compelling reason to look at more metrics and systems to help track, manage, and communicate these metrics and behaviors. There is much more to this topic and to the general discussion of sales compensation, incentive and performance management. Still, if we are to avoid bogging down in a debate about how sales reps are paid and how much sales reps are paid, suffice it to say, sales reps, like everyone else, are renting their behavior. Employers have both a right and a duty to spell out what this behavior is, how it is measured, and the transparency to show what these measures are (by individual). Conversely, when the only measure is whether a rep did or did not make quota, and/or add new accounts (the two most popular metrics) then how, how well, and how appropriately this is being done is a matter of conjecture. In the end, this really isn‟t serving anyone. Employers have another responsibility—paying accurately and on time. The latter is happening but a potentially disturbing uptick in error rates was reported this year. Last year 4.9% of firms reported an error rate greater than or equal to six percent (≥6%); this year the figure is 6.7%. This increase would definitely be a problem if the exact same firms were reporting each time; many of the same firms are reporting but, as noted earlier, there are many more respondents this year. Still we feel it warrants mention and submit one possible explanation. It may be as more metrics are tracked, more SPIFs

2010 Sales Compensation & Performance Management – Key Trends Analysis
© CSO Insights 6
No portion of this report may be reproduced or distributed in any form or by any means without the prior written permission of the authors.
and accelerators offered, and, in general, more complexity added to compensation schemes, variable compensation error rates will climb. But this is hardly an acceptable trade-off. Companies need to continually work to identify causes of calculation errors, root them out, and correct them. The result will be a sales force clear on what is expected of them in behavior and performance, how these are measured by receiving timely, individualized, and consistent feedback and pay, commensurate to and accurate for the performance delivered. We hope the information presented in this analysis will help you to more effectively optimize your organization‟s sales compensation and performance management efforts. While we believe the issues raised have broad applicability, we encourage you to use this information only as the basis for brainstorming and goal planning sessions for identifying and prioritizing your organization‟s lead generation objectives. Everyone can benefit from understanding the strategies and tactics other companies are using, but in the end, you must implement solutions that fit your specific business needs and not those of other firms.
Jim Dickie Barry Trailer Managing Partner Managing Partner (303) 521 4410 (415) 924 3500
[email protected] [email protected]
For a complete list of the survey questions, e-mail [email protected].
2010 Sales Compensation & Performance Management – Key Trends Analysis
© CSO Insights 7
No portion of this report may be reproduced or distributed in any form or by any means without the prior written permission of the authors.
Key Findings Commentary
Plan designs this
year are more optimistic for rep quota attainment.
Mid-range targets gained from both ends of the design spectrum.
Average target is
lower than one year ago.
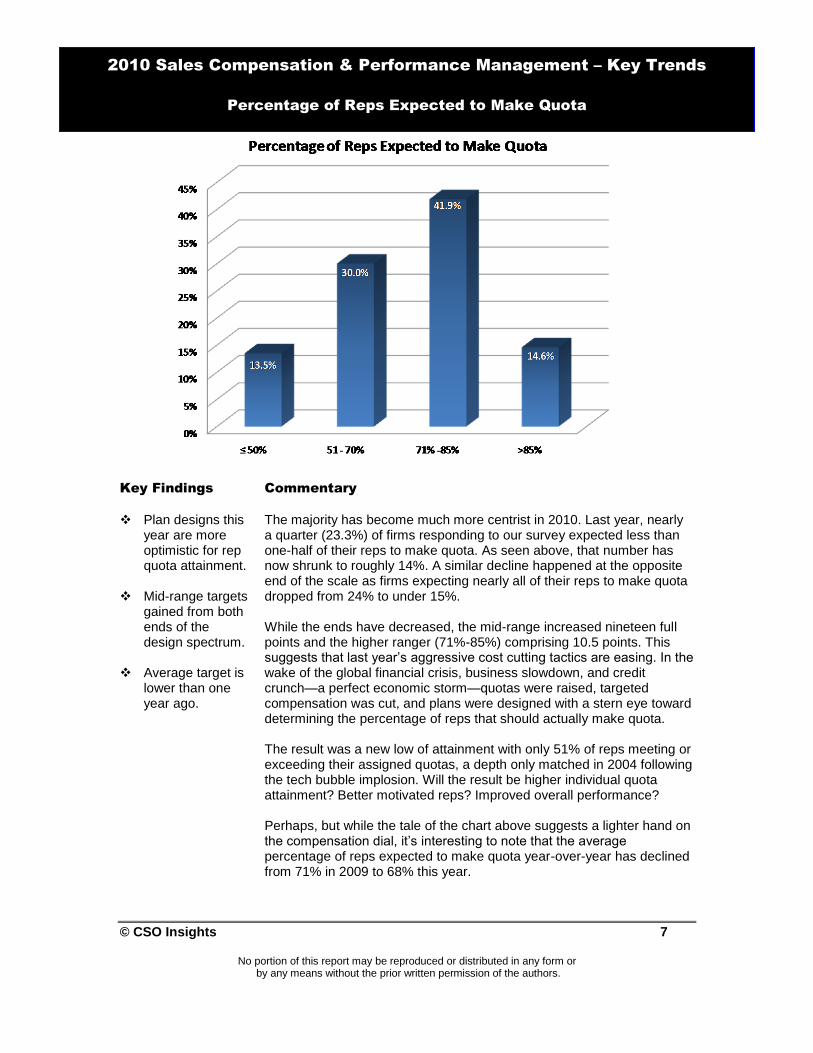
The majority has become much more centrist in 2010. Last year, nearly a quarter (23.3%) of firms responding to our survey expected less than one-half of their reps to make quota. As seen above, that number has now shrunk to roughly 14%. A similar decline happened at the opposite end of the scale as firms expecting nearly all of their reps to make quota dropped from 24% to under 15%. While the ends have decreased, the mid-range increased nineteen full points and the higher ranger (71%-85%) comprising 10.5 points. This suggests that last year‟s aggressive cost cutting tactics are easing. In the wake of the global financial crisis, business slowdown, and credit crunch—a perfect economic storm—quotas were raised, targeted compensation was cut, and plans were designed with a stern eye toward determining the percentage of reps that should actually make quota. The result was a new low of attainment with only 51% of reps meeting or exceeding their assigned quotas, a depth only matched in 2004 following the tech bubble implosion. Will the result be higher individual quota attainment? Better motivated reps? Improved overall performance? Perhaps, but while the tale of the chart above suggests a lighter hand on the compensation dial, it‟s interesting to note that the average percentage of reps expected to make quota year-over-year has declined from 71% in 2009 to 68% this year.
2010 Sales Compensation & Performance Management – Key Trends
Percentage of Reps Expected to Make Quota
2010 Sales Compensation & Performance Management – Key Trends Analysis
© CSO Insights 8
No portion of this report may be reproduced or distributed in any form or by any means without the prior written permission of the authors.
Key Findings Commentary
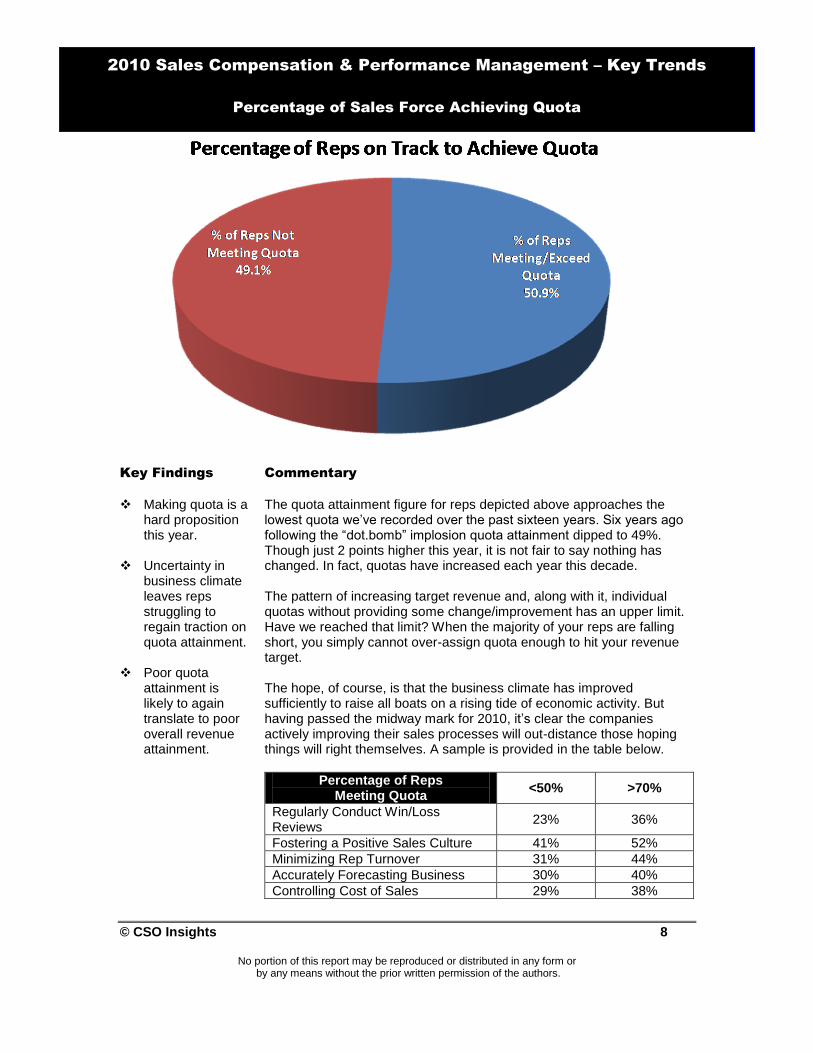
Making quota is a
hard proposition this year.
Uncertainty in business climate leaves reps struggling to regain traction on quota attainment.
Poor quota
attainment is likely to again translate to poor overall revenue attainment.
The quota attainment figure for reps depicted above approaches the lowest quota we‟ve recorded over the past sixteen years. Six years ago following the “dot.bomb” implosion quota attainment dipped to 49%. Though just 2 points higher this year, it is not fair to say nothing has changed. In fact, quotas have increased each year this decade. The pattern of increasing target revenue and, along with it, individual quotas without providing some change/improvement has an upper limit. Have we reached that limit? When the majority of your reps are falling short, you simply cannot over-assign quota enough to hit your revenue target. The hope, of course, is that the business climate has improved sufficiently to raise all boats on a rising tide of economic activity. But having passed the midway mark for 2010, it‟s clear the companies actively improving their sales processes will out-distance those hoping things will right themselves. A sample is provided in the table below.
Percentage of Reps Meeting Quota
<50% >70%
Regularly Conduct Win/Loss Reviews
23% 36%
Fostering a Positive Sales Culture 41% 52%
Minimizing Rep Turnover 31% 44%
Accurately Forecasting Business 30% 40%
Controlling Cost of Sales 29% 38%
2010 Sales Compensation & Performance Management – Key Trends
Percentage of Sales Force Achieving Quota
2010 Sales Compensation & Performance Management – Key Trends Analysis
© CSO Insights 9
No portion of this report may be reproduced or distributed in any form or by any means without the prior written permission of the authors.
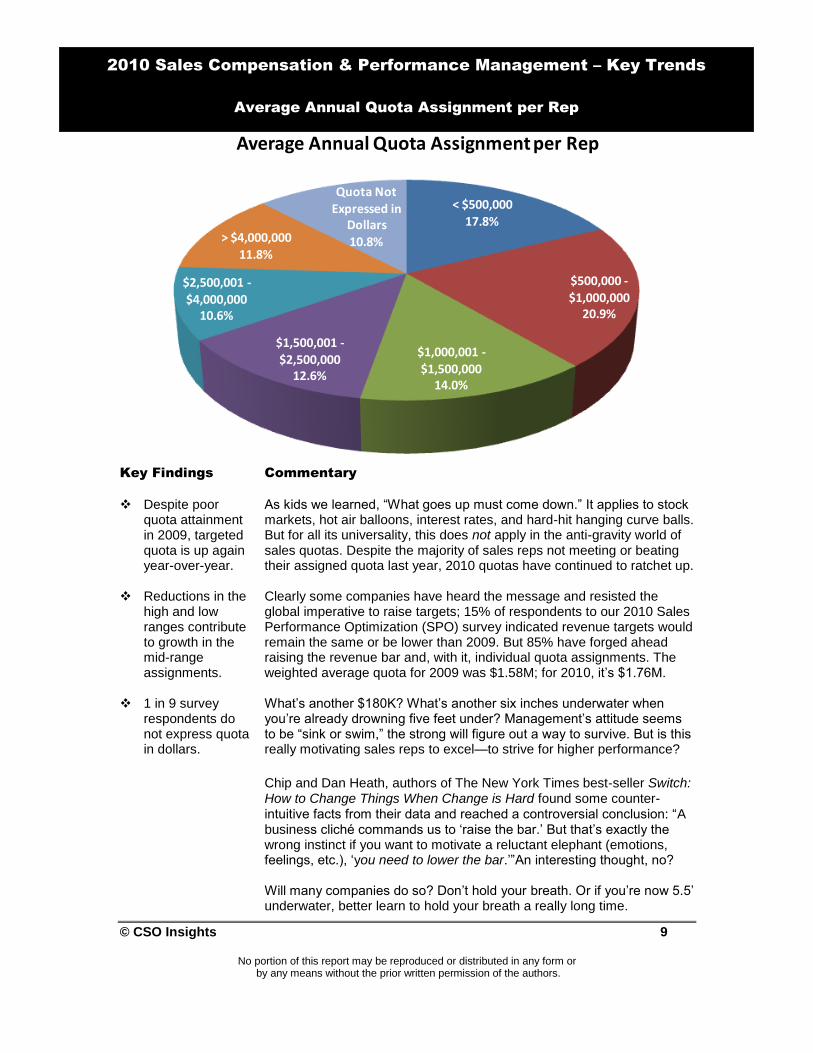
< $500,00017.8%
$500,000 -$1,000,000
20.9%
$1,000,001 -$1,500,000
14.0%
$1,500,001 -$2,500,000
12.6%
$2,500,001 -$4,000,000
10.6%
> $4,000,00011.8%
Quota Not Expressed in
Dollars10.8%
Average Annual Quota Assignment per Rep
Key Findings Commentary
Despite poor
quota attainment in 2009, targeted quota is up again year-over-year.
Reductions in the
high and low ranges contribute to growth in the mid-range assignments.
1 in 9 survey
respondents do not express quota in dollars.
As kids we learned, “What goes up must come down.” It applies to stock markets, hot air balloons, interest rates, and hard-hit hanging curve balls. But for all its universality, this does not apply in the anti-gravity world of sales quotas. Despite the majority of sales reps not meeting or beating their assigned quota last year, 2010 quotas have continued to ratchet up. Clearly some companies have heard the message and resisted the global imperative to raise targets; 15% of respondents to our 2010 Sales Performance Optimization (SPO) survey indicated revenue targets would remain the same or be lower than 2009. But 85% have forged ahead raising the revenue bar and, with it, individual quota assignments. The weighted average quota for 2009 was $1.58M; for 2010, it‟s $1.76M. What‟s another $180K? What‟s another six inches underwater when you‟re already drowning five feet under? Management‟s attitude seems to be “sink or swim,” the strong will figure out a way to survive. But is this really motivating sales reps to excel—to strive for higher performance?
Chip and Dan Heath, authors of The New York Times best-seller Switch: How to Change Things When Change is Hard found some counter-intuitive facts from their data and reached a controversial conclusion: “A business cliché commands us to „raise the bar.‟ But that‟s exactly the wrong instinct if you want to motivate a reluctant elephant (emotions, feelings, etc.), „you need to lower the bar.‟”An interesting thought, no? Will many companies do so? Don‟t hold your breath. Or if you‟re now 5.5‟ underwater, better learn to hold your breath a really long time.
2010 Sales Compensation & Performance Management – Key Trends
Average Annual Quota Assignment per Rep

2010 Sales Compensation & Performance Management – Key Trends Analysis
© CSO Insights 10
No portion of this report may be reproduced or distributed in any form or by any means without the prior written permission of the authors.
<5%
18.1%
5-10%
20.5%
11-15%13.3%
16-20%9.2%
>20%
10.5%
Do Not Know28.4%
Sales Compensation Spend as Percent of Revenues
Key Findings Commentary
Compensation as
a percentage of revenues at the highest ranges is back up this year.
Lowest ranges as a percentage of revenue shrunk slightly this year.
“Do Not Know”
continues to be the biggest segment and biggest surprise.
Firms where managers are motivated/compensated for controlling cost of sales (COS) correlate with a higher percentage of reps meeting/beating quota (>70%) than those that did not (<50%). It may be that the nearly 3 of 10 firms reporting they do not know the percent of revenue dedicated to sales compensation are carefully tracking/controlling their COS via other metrics. But it does raise a question as to whether they might want to get a handle on this key measure. Each of the segments on the right half of the pie chart above gave up 1.5 to 2.5 points from last year. Each of the segments on the left half grew by this amount, including Do Not Know, up 1.7 points. Is there a right answer or a sweet spot at which to aim? The following table suggests there is no simple answer, but not knowing does not seem to be particularly useful.
Sales Comp as Percentage of
Revenue
Percentage of Reps Meeting
Quota
Total Sales Rep Turnover
Leading Quota Range
for Reps
≤5% 47.7% 23.3% >$4.0M
6%-10% 51.3% 23.0% $1.0M-1.5M
11%-15% 48.6% 28.7% $500K-$1.0M
16%-20% 54.9% 26.6% $500K-$1.0M
>20% 53.5% 25.3% <$500K
Do Not Know 51.4% 29.4% $500K-$1.0M
2010 Sales Compensation & Performance Management – Key Trends
Morgan Creek's Quarterly Update Conference Calls
Sales Compensation Spend as a Percentage of Annual Revenues
2010 Sales Compensation & Performance Management – Key Trends Analysis
© CSO Insights 11
No portion of this report may be reproduced or distributed in any form or by any means without the prior written permission of the authors.
Key Findings Commentary
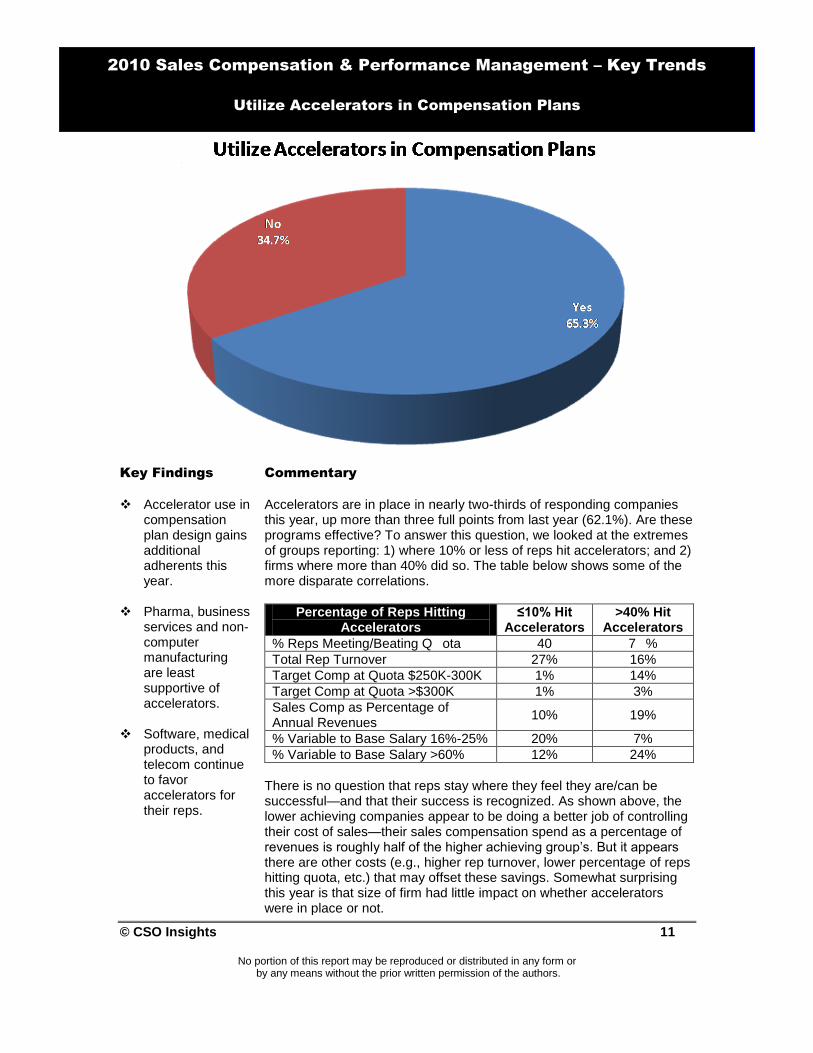
Accelerator use in
compensation plan design gains additional adherents this year.
Pharma, business services and non-computer manufacturing are least supportive of accelerators.
Software, medical
products, and telecom continue to favor accelerators for their reps.
Accelerators are in place in nearly two-thirds of responding companies this year, up more than three full points from last year (62.1%). Are these programs effective? To answer this question, we looked at the extremes of groups reporting: 1) where 10% or less of reps hit accelerators; and 2) firms where more than 40% did so. The table below shows some of the more disparate correlations.
Percentage of Reps Hitting Accelerators
≤10% Hit Accelerators
>40% Hit Accelerators
% Reps Meeting/Beating Q ota 40 7 %
Total Rep Turnover 27% 16%
Target Comp at Quota $250K-300K 1% 14%
Target Comp at Quota >$300K 1% 3%
Sales Comp as Percentage of Annual Revenues
10% 19%
% Variable to Base Salary 16%-25% 20% 7%
% Variable to Base Salary >60% 12% 24%
There is no question that reps stay where they feel they are/can be successful—and that their success is recognized. As shown above, the lower achieving companies appear to be doing a better job of controlling their cost of sales—their sales compensation spend as a percentage of revenues is roughly half of the higher achieving group‟s. But it appears there are other costs (e.g., higher rep turnover, lower percentage of reps hitting quota, etc.) that may offset these savings. Somewhat surprising this year is that size of firm had little impact on whether accelerators were in place or not.
2010 Sales Compensation & Performance Management – Key Trends
Utilize Accelerators in Compensation Plans

2010 Sales Compensation & Performance Management – Key Trends Analysis
© CSO Insights 12
No portion of this report may be reproduced or distributed in any form or by any means without the prior written permission of the authors.
Consistently Drives Precise Selling
Behavior10.6%
Generally Drives Precise Selling
Behavior63.3%
Minimal or No Impact on Selling
Behavior15.3%
Do Not Know
10.8%
Impact of Compensation Plans on Selling Behaviors
Key Findings Commentary
Firms generally
feel their compensation plans drive desired selling behavior.
Contra-indicator in those reporting minimal/no impact on behavior gained this year.
Manual
calculators least happy, while those using commercial systems are most happy in this regard.
Firms that feel their compensation plan consistently drives the precise selling behaviors desired remains unchanged this year—and is only true for one in nine firms. Those feeling their plans generally drive desired behavior gave up three points, and Do Not Know is down 1.5 points, all of which accrued to minimal or no impact. Now, one in seven firms feels its plan is not helping. Are these feelings justified one way or the other? Short answer: yes.
Compensation Plan Drives Rep Behavior
Min/None Generally Consistent
% Reps Meeting Quota 43% 52% 61%
Total Rep Turnover 38% 25% 21%
Use Spreadsheets 16% 62% 9%
Use Commercial System 4% 15% 10%
In the next metric we look at specific rep behaviors, but it appears that where the impact of the compensation plan is seen to be minimal, rep quota attainment is low and turnover is high. The converse is true when the plan is felt to consistently drive rep behavior. It should be noted that these two groups only comprise one-quarter of all respondents. The significant majority in the middle is the place for real gains. This group has the most aggressively implemented commercial compensation and performance management systems. The test will be if they can leverage these systems to provide improved coaching and performance.
2010 Sales Compensation and Performance Management – Key Trends
Impact of Compensation Plans in Driving Selling Behaviors
2010 Sales Compensation & Performance Management – Key Trends Analysis
© CSO Insights 13
No portion of this report may be reproduced or distributed in any form or by any means without the prior written permission of the authors.
Key Findings Commentary
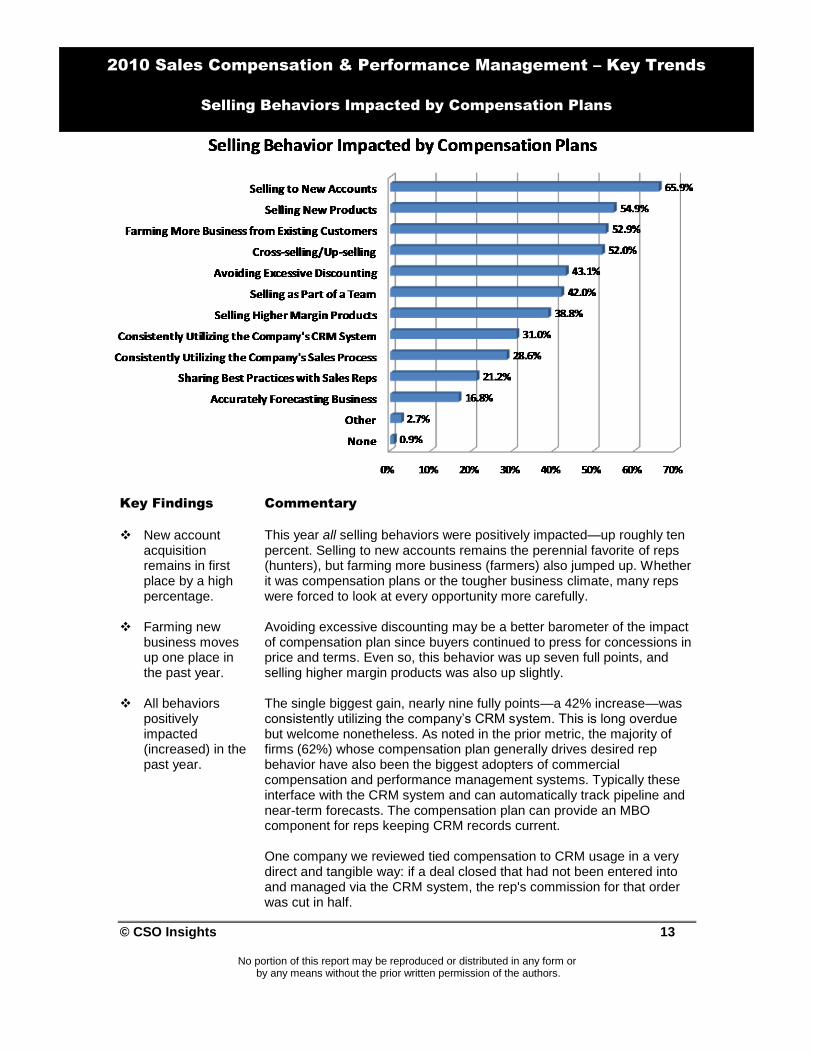
New account
acquisition remains in first place by a high percentage.
Farming new business moves up one place in the past year.
All behaviors
positively impacted (increased) in the past year.
This year all selling behaviors were positively impacted—up roughly ten percent. Selling to new accounts remains the perennial favorite of reps (hunters), but farming more business (farmers) also jumped up. Whether it was compensation plans or the tougher business climate, many reps were forced to look at every opportunity more carefully. Avoiding excessive discounting may be a better barometer of the impact of compensation plan since buyers continued to press for concessions in price and terms. Even so, this behavior was up seven full points, and selling higher margin products was also up slightly. The single biggest gain, nearly nine fully points—a 42% increase—was consistently utilizing the company‟s CRM system. This is long overdue but welcome nonetheless. As noted in the prior metric, the majority of firms (62%) whose compensation plan generally drives desired rep behavior have also been the biggest adopters of commercial compensation and performance management systems. Typically these interface with the CRM system and can automatically track pipeline and near-term forecasts. The compensation plan can provide an MBO component for reps keeping CRM records current. One company we reviewed tied compensation to CRM usage in a very direct and tangible way: if a deal closed that had not been entered into and managed via the CRM system, the rep's commission for that order was cut in half.
2010 Sales Compensation & Performance Management – Key Trends
Selling Behaviors Impacted by Compensation Plans

2010 Sales Compensation & Performance Management – Key Trends Analysis
© CSO Insights 14
No portion of this report may be reproduced or distributed in any form or by any means without the prior written permission of the authors.
Key Findings Commentary
New Metric:
Nearly one-half of firms responding have no rep retention strategy built into their compensation plans.
Having a formal plan in place appears to pay some small dividend.
Not knowing or
thinking it is not applicable correlates with higher turnover and deserves a closer look.
This is a new metric and, given that the largest single segment is No Retention Strategy, perhaps a relatively new concept. In our 2010 Sales Performance Optimization (SPO) report, we said that when the current recession abates, voluntary rep turnover will spike. The jobs reports of the last several months do not show any major increase in hiring. It could be argued the recovery is still ongoing, while others label it “fragile.” Regardless, implementing a retention strategy has definite appeal. If you are considering implementing a retention strategy, there are some questions to consider: does greater stability translate into higher performance? Does having a retention strategy equate to greater stability (i.e., lower turnover)? And, if so, are there certain strategy elements that seem to work better than others? Question: if all reps stay in their jobs and all high performing reps have a job, then do all stable sales forces have high performing reps? No. But the reverse is true: high performing reps‟ forces tend to remain stable. When the condition of >60% reps meet/beat quota, 82% of reps met their quota and total turnover was 23%. Given the condition of voluntary turnover <10%, 53% of reps made quota. Percentages for having, not having, or not knowing about a retention strategy mirrored the chart above in each case. However, the top three elements of retention strategies were multiple levels of sales roles for greater opportunity, merit pay, and quota tiers.
2010 Sales Compensation & Performance Management – Key Trends
Compensation Plan Design Includes Sales Rep Retention Strategy
2010 Sales Compensation & Performance Management – Key Trends Analysis
© CSO Insights 15
No portion of this report may be reproduced or distributed in any form or by any means without the prior written permission of the authors.
Key Findings Commentary
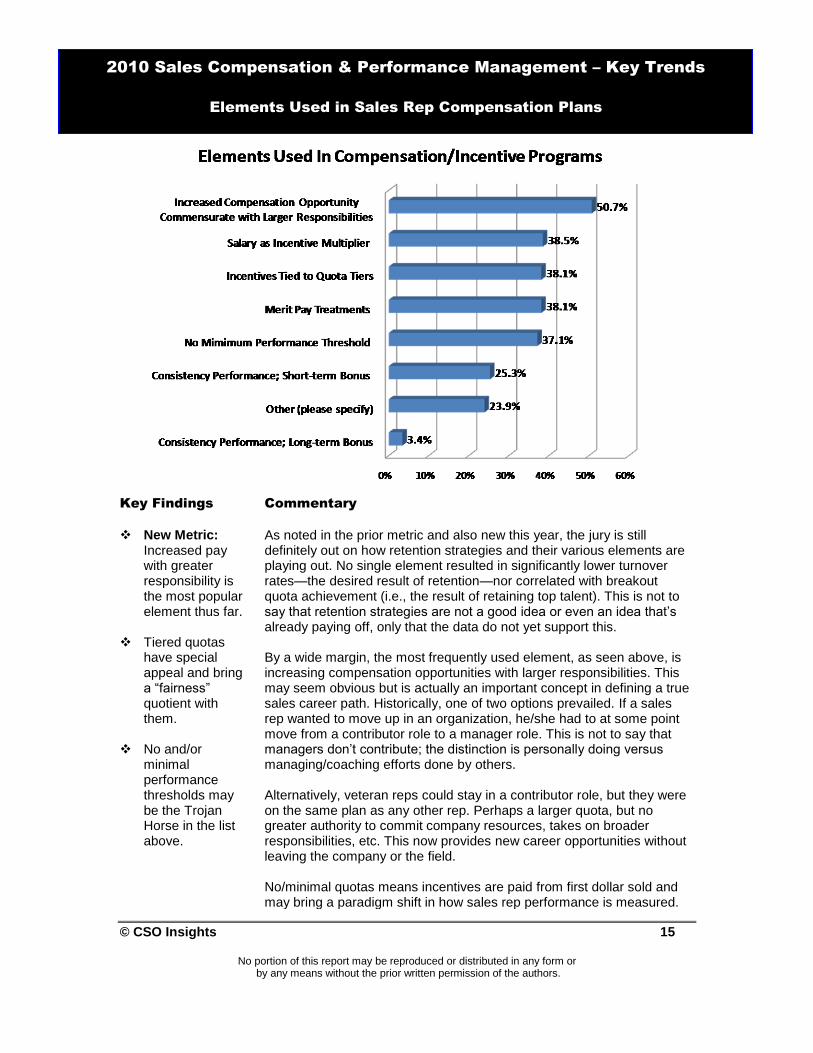
New Metric:
Increased pay with greater responsibility is the most popular element thus far.
Tiered quotas have special appeal and bring a “fairness” quotient with them.
No and/or
minimal performance thresholds may be the Trojan Horse in the list above.
As noted in the prior metric and also new this year, the jury is still definitely out on how retention strategies and their various elements are playing out. No single element resulted in significantly lower turnover rates—the desired result of retention—nor correlated with breakout quota achievement (i.e., the result of retaining top talent). This is not to say that retention strategies are not a good idea or even an idea that‟s already paying off, only that the data do not yet support this. By a wide margin, the most frequently used element, as seen above, is increasing compensation opportunities with larger responsibilities. This may seem obvious but is actually an important concept in defining a true sales career path. Historically, one of two options prevailed. If a sales rep wanted to move up in an organization, he/she had to at some point move from a contributor role to a manager role. This is not to say that managers don‟t contribute; the distinction is personally doing versus managing/coaching efforts done by others. Alternatively, veteran reps could stay in a contributor role, but they were on the same plan as any other rep. Perhaps a larger quota, but no greater authority to commit company resources, takes on broader responsibilities, etc. This now provides new career opportunities without leaving the company or the field. No/minimal quotas means incentives are paid from first dollar sold and may bring a paradigm shift in how sales rep performance is measured.
2010 Sales Compensation & Performance Management – Key Trends
Elements Used in Sales Rep Compensation Plans
2010 Sales Compensation & Performance Management – Key Trends Analysis
© CSO Insights 16
No portion of this report may be reproduced or distributed in any form or by any means without the prior written permission of the authors.
<1%28.8%
1% - 2%17.3%
3% - 5%14.3%
6% - 8%3.9%
>8%2.8%
Do Not Know32.8%
Variable Compensation Error Rate
Key Findings Commentary
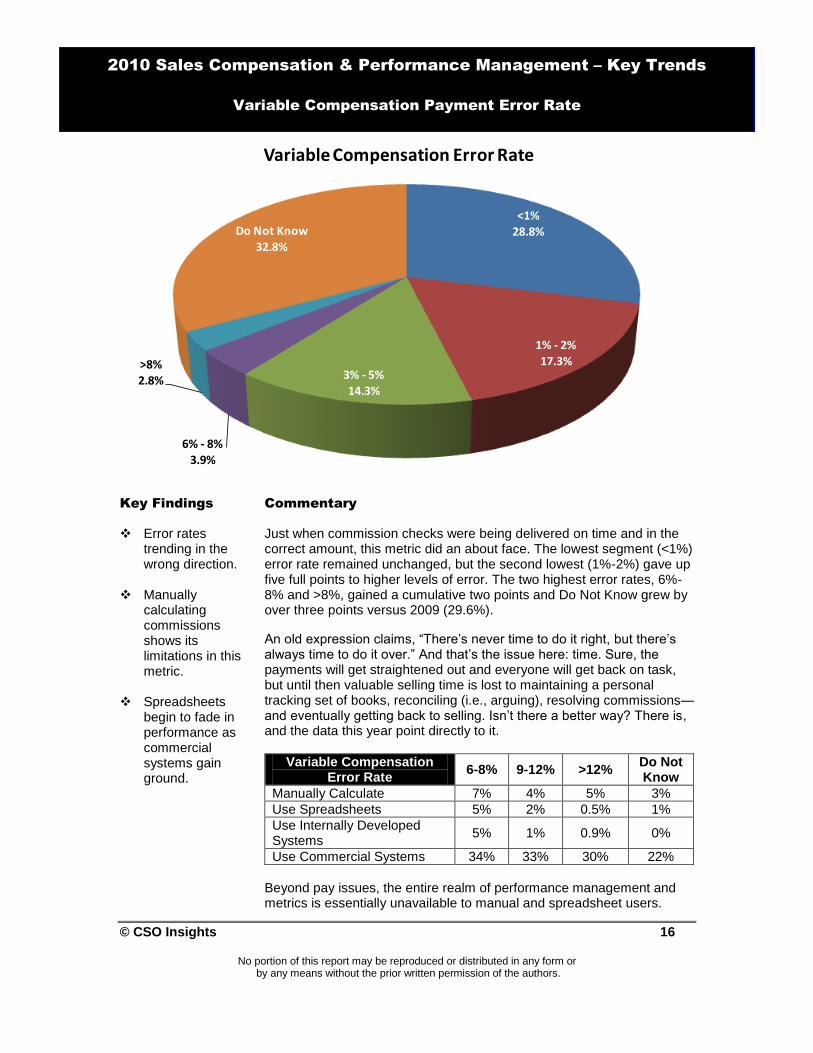
Error rates trending in the wrong direction.
Manually calculating commissions shows its limitations in this metric.
Spreadsheets
begin to fade in performance as commercial systems gain ground.
Just when commission checks were being delivered on time and in the correct amount, this metric did an about face. The lowest segment (<1%) error rate remained unchanged, but the second lowest (1%-2%) gave up five full points to higher levels of error. The two highest error rates, 6%-8% and >8%, gained a cumulative two points and Do Not Know grew by over three points versus 2009 (29.6%).
An old expression claims, “There‟s never time to do it right, but there‟s always time to do it over.” And that‟s the issue here: time. Sure, the payments will get straightened out and everyone will get back on task, but until then valuable selling time is lost to maintaining a personal tracking set of books, reconciling (i.e., arguing), resolving commissions—and eventually getting back to selling. Isn‟t there a better way? There is, and the data this year point directly to it.
Variable Compensation Error Rate
6-8% 9-12% >12% Do Not Know
Manually Calculate 7% 4% 5% 3%
Use Spreadsheets 5% 2% 0.5% 1%
Use Internally Developed Systems
5% 1% 0.9% 0%
Use Commercial Systems 34% 33% 30% 22%
Beyond pay issues, the entire realm of performance management and metrics is essentially unavailable to manual and spreadsheet users.
2010 Sales Compensation & Performance Management – Key Trends
Variable Compensation Payment Error Rate
2010 Sales Compensation & Performance Management – Key Trends Analysis
© CSO Insights 17
No portion of this report may be reproduced or distributed in any form or by any means without the prior written permission of the authors.
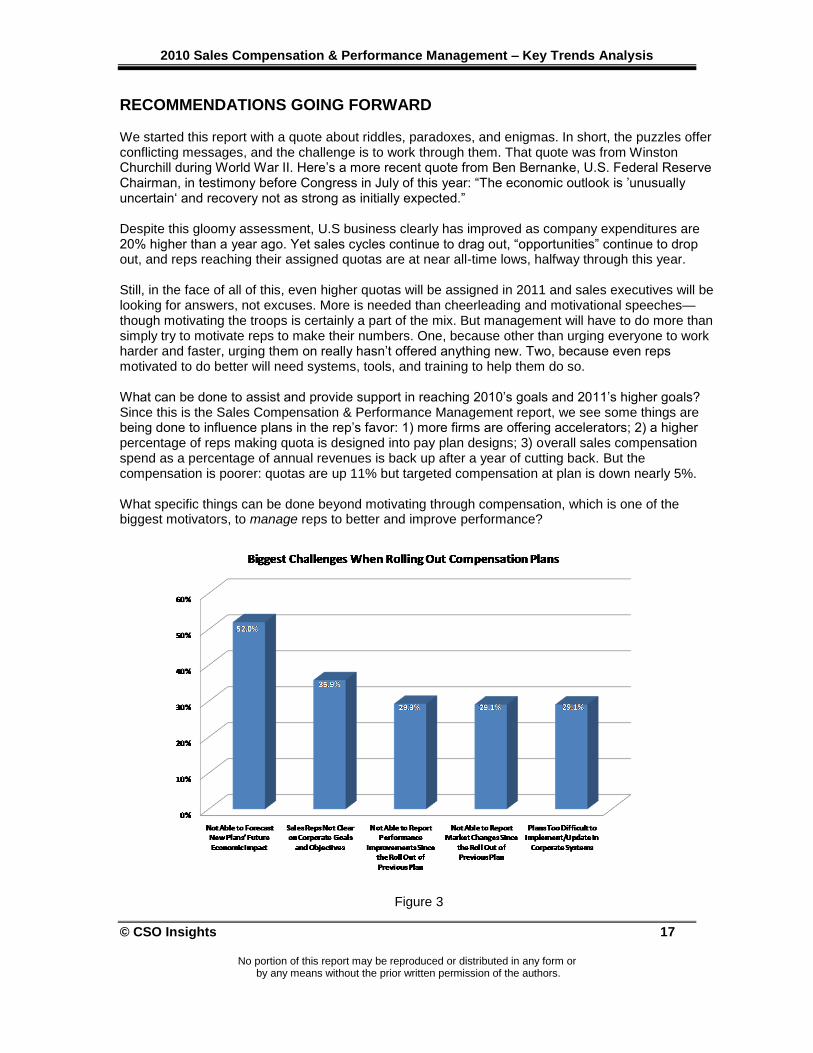
RECOMMENDATIONS GOING FORWARD We started this report with a quote about riddles, paradoxes, and enigmas. In short, the puzzles offer conflicting messages, and the challenge is to work through them. That quote was from Winston Churchill during World War II. Here‟s a more recent quote from Ben Bernanke, U.S. Federal Reserve Chairman, in testimony before Congress in July of this year: “The economic outlook is ‟unusually uncertain„ and recovery not as strong as initially expected.” Despite this gloomy assessment, U.S business clearly has improved as company expenditures are 20% higher than a year ago. Yet sales cycles continue to drag out, “opportunities” continue to drop out, and reps reaching their assigned quotas are at near all-time lows, halfway through this year. Still, in the face of all of this, even higher quotas will be assigned in 2011 and sales executives will be looking for answers, not excuses. More is needed than cheerleading and motivational speeches—though motivating the troops is certainly a part of the mix. But management will have to do more than simply try to motivate reps to make their numbers. One, because other than urging everyone to work harder and faster, urging them on really hasn‟t offered anything new. Two, because even reps motivated to do better will need systems, tools, and training to help them do so. What can be done to assist and provide support in reaching 2010‟s goals and 2011‟s higher goals? Since this is the Sales Compensation & Performance Management report, we see some things are being done to influence plans in the rep‟s favor: 1) more firms are offering accelerators; 2) a higher percentage of reps making quota is designed into pay plan designs; 3) overall sales compensation spend as a percentage of annual revenues is back up after a year of cutting back. But the compensation is poorer: quotas are up 11% but targeted compensation at plan is down nearly 5%. What specific things can be done beyond motivating through compensation, which is one of the biggest motivators, to manage reps to better and improve performance?
Figure 3

2010 Sales Compensation & Performance Management – Key Trends Analysis
© CSO Insights 18
No portion of this report may be reproduced or distributed in any form or by any means without the prior written permission of the authors.
There are a couple of internal sales that need to be made. The chart shows the single biggest difficulty of rolling out a new compensation plan each year is forecasting its impact. Judging how much tuning the knobs on the pay plan will impact the bottom line is reported by a majority of firms (52%) as the single biggest challenge. Second in difficulty is making the sale to the sales force: clearly tying sales goals to corporate goals and objectives. As in, “You‟re not a lone wolf— you‟re part of something bigger”— whatever that means, and whatever a rep is supposed to do with it. These two difficult sides of the compensation coin are not simply inconveniences. To the extent that you can‟t forecast the plan‟s impact and your reps don‟t get the connection, then two of your most important constituencies will be less than fully bought in—less than fully engaged. Once again, manual and spreadsheet calculators are at a slight disadvantage (4%) in these two categories versus those using commercial systems. We would expect this difference to grow over time as the information streaming back from these systems becomes richer. Which brings us once again back to the sales performance management aspect of this survey and, increasingly, to these systems. The old adage is that, “Sales reps are coin operated.” Or, “Talk to the wallet; the wallet talks to the sales rep.” These and other similarly clever and dismissive statements perpetuate the theory that delivering the number is all that matters to either sales reps or sales management and that in doing so, no matter how it is accomplished, is all that matters. While this may have been historically true, and many firms may have reverted to this type of thinking during the tough times immediately behind and possibly ahead, others are taking a different view. As an alternative, firms are saying that delivering revenues is vital to ongoing business and doing so in a more consistent, transparent, and accountable way is equally vital.
If you want to do more (and our view is that you are and will be required to do much more) than motivate your sales reps to meet or beat quota, then things such as building customer loyalty, adherence to the company‟s sales process, using the adopted CRM system, and maintaining current and accurate information all become part of the job description.
Figure 4
2010 Sales Compensation & Performance Management – Key Trends Analysis
© CSO Insights 19
No portion of this report may be reproduced or distributed in any form or by any means without the prior written permission of the authors.
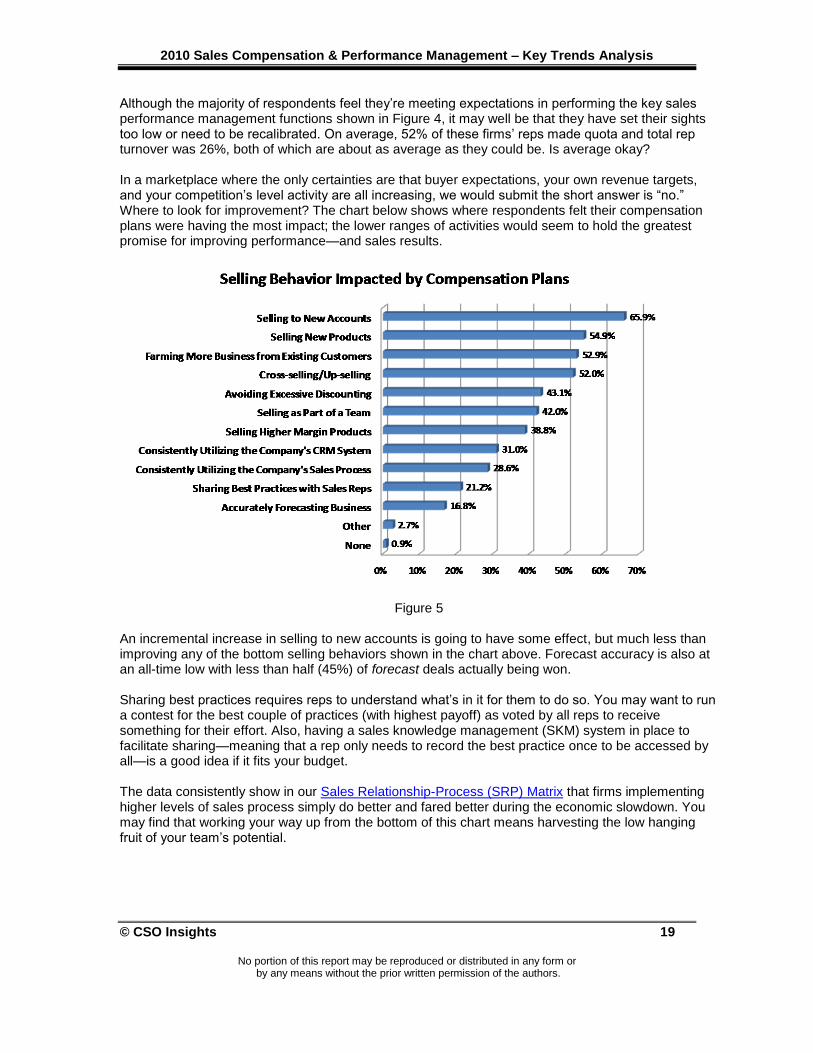
Although the majority of respondents feel they‟re meeting expectations in performing the key sales performance management functions shown in Figure 4, it may well be that they have set their sights too low or need to be recalibrated. On average, 52% of these firms‟ reps made quota and total rep turnover was 26%, both of which are about as average as they could be. Is average okay? In a marketplace where the only certainties are that buyer expectations, your own revenue targets, and your competition‟s level activity are all increasing, we would submit the short answer is “no.” Where to look for improvement? The chart below shows where respondents felt their compensation plans were having the most impact; the lower ranges of activities would seem to hold the greatest promise for improving performance—and sales results.
Figure 5 An incremental increase in selling to new accounts is going to have some effect, but much less than improving any of the bottom selling behaviors shown in the chart above. Forecast accuracy is also at an all-time low with less than half (45%) of forecast deals actually being won. Sharing best practices requires reps to understand what‟s in it for them to do so. You may want to run a contest for the best couple of practices (with highest payoff) as voted by all reps to receive something for their effort. Also, having a sales knowledge management (SKM) system in place to facilitate sharing—meaning that a rep only needs to record the best practice once to be accessed by all—is a good idea if it fits your budget. The data consistently show in our Sales Relationship-Process (SRP) Matrix that firms implementing higher levels of sales process simply do better and fared better during the economic slowdown. You may find that working your way up from the bottom of this chart means harvesting the low hanging fruit of your team‟s potential.
2010 Sales Compensation & Performance Management – Key Trends Analysis
© CSO Insights 20
No portion of this report may be reproduced or distributed in any form or by any means without the prior written permission of the authors.
Mine the Gold Another place to look for ways to improve and behaviors to coach is in the sales data you‟ve already collected—and likely not looked at. Which reps are selling deals with the highest margins? Have the highest average deal sizes? Receive the most customer referrals? Are the most accurate in forecasting the deals that actually close (and are not closing deals that never appeared in the CRM system before the contract/close step)? These folks are all doing something right, but do you know what it is? You don‟t need an SPM system to identify these winning reps and tactics but, as seen in the Groups A/B comparison, it helps. One reason is that the best tactics and subsequent results may be neither obvious nor intuitively straightforward. Some best practices may be counterintuitive…they just work. These are the golden tactics that you want to mine from your existing reps and database. A rep for a major supplier of electrical generation equipment had several larger deals than his peers. When asked why, he said that occasionally when he received an RFP for a generator replacement (think several tons and millions of dollars), he would send an unsolicited proposal for redoing all of the ancillary systems in the power station that would be scheduled for shutdown and repair. When asked why he only occasionally submitted these unsolicited proposals, his reply was, “Because it‟s hard.” Putting a complete proposal together was a big, time-consuming process; not something he could do on short notice. But power plants aren‟t shut down on a whim unless there‟s a catastrophic failure. Normally shutdowns are scheduled months in advance; but the rep usually didn‟t know about them months in advance. Well, someone there knows because they scheduled it. If you were notified well in advance, then would you do it every time? “No, I would not, because it‟s hard.” Figuring out the age of the equipment in the station is a major undertaking. But others in the company had this information which could be supplied—they just didn‟t know why reps would want the information or how they would use it. As the hurdles to producing these unsolicited proposals were identified and addressed (i.e., removed), submitting them became a routine practice—from a little known best practice as other sales reps started to implement this process they started generating unforecast revenue over 25% of the time. These are the kinds of opportunities that reside within your sales force right now. Freeing your managers from bird-dogging significant opportunities so they can identify and coach reps that need it and remove obstacles that get in the way of productive tactics will help everyone get further faster. Conclusion Yes, these are “unusually uncertain times.” Change is afoot in the marketplace and seems to be increasing. Focusing on results (i.e., making the number) and holding up the one or two reps that cashed big checks for big deals will provide motivation for your other reps but not the support required to adapt to the change they confront. Yes, you need to offer competitive pay to attract talent. But it‟s also true that reps go to and stay where they feel they can be successful—where their success is supported. You can‟t anticipate everything, but you can look for patterns and identify where improvements will have the highest return. Borrow a page from the Marines: improvise, adapt, and overcome.
2010 Sales Compensation & Performance Management – Key Trends Analysis
© CSO Insights 21
No portion of this report may be reproduced or distributed in any form or by any means without the prior written permission of the authors.
It‟s a good plan when you‟re in an uncertain situation. Since you are not literally dodging bullets, go ahead and write down the process improvements so that the entire team can raise their performance. It is the key to helping solve the riddle (how do we sell more?), wrapped in a mystery (what do customers really want?), inside an enigma (what will motivate my reps to excel?). If you would like insights into how other companies are successfully dealing with this issue, please contact us or visit our web site: www.csoinsights.com.
Again, research clients desiring to have a deeper dive into the study findings, by company size, industry, level of budget, etc. should contact their CSO Insights analysts to set up a one-on-one briefing.
Jim Dickie Barry Trailer Managing Partner Managing Partner (303) 521 4410 (415) 924 3500
[email protected] [email protected]
About CSO Insights
CSO Insights benchmarks the challenges faced by today's sales and marketing organizations, tracking trends in the use of people, process, technology and knowledge to improve sales effectiveness. Each year, CSO Insights surveys thousands of Chief Sales Officers (CSO) to learn the challenges they see as most critical. They also review offerings from solution providers to retain the position of the experts on options for CSOs.