Embed Size (px)
Citation preview

2010Washington State
Labor Market and Economic ReportThis report has been prepared in accordance with the Revised Code of Washington (RCW) 50.38.040.
Washington State Employment Security DepartmentPaul Trause, Commissioner
Labor Market and Economic AnalysisGreg Weeks, Ph.D., Director
Labor Market and Economic AnalysisDave Wallace, Acting Chief Economist
360-438-4800
Published December 2010
(Content based on data available up to November 18, 2010.)
Acknowledgements: The Labor Market and Economic Report was produced through the collaboration of Regional Economists, members of the Economic and Policy Analysis Unit, and other Labor Market and Economic Analysis branch staff:
This report can be viewed and downloaded at www.workforceexplorer.com. Further analysis and detailed statistics are available through the Employment Security Department upon request. For more information, including to request copies of this report in alternate formats, please call 360-438-4800 or the Labor Market Information Center at 1-800-215-1617.
The Employment Security Department is an equal-opportunity employer and provider of programs and services. Auxiliary aids and services are available upon request to people with disabilities.
Report Authors
Fast Facts: Greg Morgan, EconomistChapter One: Dave Wallace, Acting Chief EconomistChapter Two: Dave Wallace, Acting Chief EconomistChapter Three: Keyi Lu, EconomistChapter Four: Michele Petritz, Economist Chris Thomas, Economist Chapter Five: Greg Morgan, EconomistChapter Six: Alex Roubinchtein, Ph.D., EconomistChapter Seven: Scott Bailey, Regional EconomistChapter Eight: Alex Roubinchtein, Ph.D., Economist
2010 Washington State Labor Market and Economic Report i
CONTENTS
Executive Summary .............................................................................................................. iii
Fast Facts .............................................................................................................................. v
Chapter One – The National Labor Market .......................................................................... 1
Chapter Two – Washington State .......................................................................................... 5
Chapter Three – Seasonal, Structural and Cyclical Industry Employment........................... 9
Chapter Four – Unemployment ............................................................................................ 13
Chapter Five – Occupations After the Recession ................................................................. 21
Chapter Six – Washington Industry and Employment Projections 2008 to 2018 ................. 27
Chapter Seven – Washington Wages and Income, 2009 ....................................................... 35
Chapter Eight – Economic Comparisons with Other States ................................................. 47
Washington State Workforce Development Areas ................................................................ 51

ii 2010 Washington State Labor Market and Economic Report
2010 Washington State Labor Market and Economic Report iii
Executive Summary
The National Labor Market
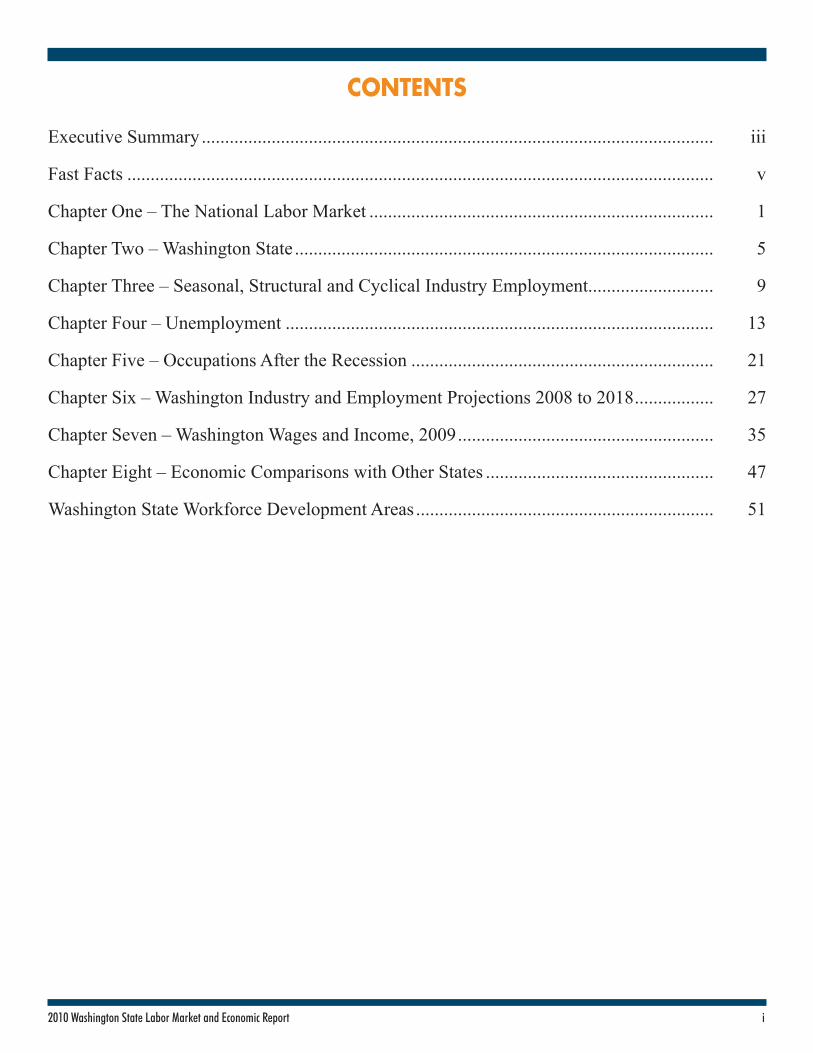
The post-recession period, which officially began in June 2009, has been worse than most post-recession periods, primarily because of the effects of the financial crisis. Most forecasts see the economy in a slow growth pattern until 2012.
As of fall 2010, much of the U.S. economy seems poised for recovery as company profits are high, stocks have risen for the most part, interest rates are near historic lows, Federal Reserve policies are accommodative, production indexes have surprised on the positive side, retail sales have been up and personal savings rates are the highest since the mid-1990s. The final piece of this recovery puzzle yet to fall into place is jobs, as firms have remained reluctant to increase hiring at a significant level.
Washington State
Washington state fared about average in terms of employment loss during the recent recession, but fared somewhat worse than average over the past year. Employment began to rise in the second quarter of 2010, in large part due to public-sector hiring. The growth slowed in the third quarter as declining public-sector employment more than offset employment growth in the private sector.
Construction and financial activities lost more jobs than any other sector between September 2009 and September 2010. Five sectors expanded during this period: professional and business services, education and health services, retail trade, information and wholesale trade.
Tri-Cities is the only region in the state to show growth. The rest of the state stalled, particularly in the northeast and southwest corners of the state. The southwest and northeast corners also had consistently high unemployment rates.
2010 Washington State Labor Market and Economic Report
Seasonal, Structural and Cyclical Industry Employment
Washington industries experience short-term employment fluctuations and long-term employment changes due to seasonal, structural and cyclical factors. Chapter 3 of this report defines these three factors and identifies Washington industries subject to employment changes in each category.
Unemployment
Virtually all of the standard unemployment measures reflect the very difficult experience of job seekers in Washington over the past year. The number of unemployment recipients using all of their benefits (exhaustees) rose in every region of the state, an indication that Washington’s jobless are struggling to find work. The unemployment rate peaked in spring 2010 and then moderated in the summer and fall.
Occupations After the Recession
Occupations related to the health care industry are doing reasonably well, while the construction and extraction and production industries have been hardest hit by the recent recession.
Only six of the 49 occupations that make up the construction and extraction occupational group are expected to grow over the next 10 years, while 27 of the 49 occupations are expected to decline. Based on occupational projections, 22 of the 82 occupations in the production occupational group are expected to grow over the next 10 years, while 43 of the 82 are expected to decline.

iv 2010 Washington State Labor Market and Economic Report
Executive Summary (Continued)
Washington Industry and Employment Projections 2008 to 2018
Washington state is projected to add 278,700 nonfarm jobs between 2008 and 2018, with an average annual growth rate of 0.9 percent. By 2018, significant increases in employment are expected in education and health services, and professional and business services. The largest decreases in employment are projected for manufacturing. From 2008 to 2018, occupations requiring the most education and the least education are projected to grow faster than the state average of 0.9 percent. Over the projection period, occupations requiring a bachelor’s degree or higher are expected to grow by more than 90,000 jobs and occupations requiring short-term on-the-job training are expected to grow by more than 119,000 jobs.
Washington Wages and Income, 2009
In the midst of the recession, the standard measures of wages – average annual wage, average hourly wage, median wage – all increased in 2009. Wage progression, the median increase in hourly wages for full-time workers, improved slightly in the 2004 to 2009 period, but was smaller than any five-year period in the 1990s. Unfortunately, these increases were probably due to lower-wage workers who lost their jobs. Per capita income in 2009 declined by 2 percent, the largest drop since 1970. Earned income (income from owning a business or holding a job) accounted for just 64 percent of total income in 2009, the lowest percentage on record.
Economic Comparisons with Other States
Economic data presented in Chapter 8 of this report show how Washington ranks relative to other states in the nation.

2010 Washington State Labor Market and Economic Report v
20
10 W
ash
ingto
n S
tate
Labor
Mark
et F
ast
Fact
sYE
ARLA
BOR F
ORCE
EMPL
OYME
NTUN
EMPL
OYME
NTUN
EMPL
OYME
NT RA
TE19
801,9
72,37
31,8
15,71
715
6,656
7.9%
1985
2,102
,321
1,926
,816
175,5
058.3
%19
902,5
37,03
72,4
06,44
413
0,594
5.2%
1995
2,812
,611
2,636
,011
176,6
006.3
%20
003,0
50,02
12,8
98,67
715
1,344
5.0%
2001
3,052
,714
2,863
,705
189,0
096.2
%20
023,1
04,69
82,8
77,02
222
7,676
7.4%
2003
3,146
,154
2,913
,230
232,9
247.4
%20
043,1
99,23
42,9
99,52
619
9,708
6.2%
2005
3,255
,527
3,075
,972
179,5
555.5
%20
063,3
17,39
03,1
54,42
316
2,967
4.9%
2007
3,390
,413
3,235
,963
154,4
504.6
%20
083,4
76,37
13,2
90,08
718
6,284
5.4%
2009
3,528
,707
3,214
,500
314,2
078.9
%20
10*
3,534
,902
3,207
,605
327,2
979.3
%So
urce:
Emp
loyme
nt Se
curity
Dep
artme
nt/LM
EA, L
ocal
Area
Une
mploy
ment
Statis
tics (
LAUS
), Hav
er An
alytic
s
LABO
R FOR
CE AN
D UN
EMPL
OYME
NT, W
ASHI
NGTO
N, 19
80 TO
2010
Note
: *Ye
ar-to-
Date
Avera
ges a
s of S
eptem
ber 2
010,
Not S
easo
nally
Adjus
ted
METR
O ARE
ALA
BOR F
ORCE
EMPL
OYME
NTUN
EMPL
OYME
NTUN
EMPL
OYME
NT RA
TEWa
shing
ton St
ate3,5
33,96
33,2
03,66
333
0,313
9.4%
Bellin
gham
107,1
3897
,925
9,225
8.6%
Breme
rton
125,7
5011
5,963
9,763
7.8%
Long
view-K
elso
44,17
538
,450
5,725
12.9%
Moun
t Vern
on-An
acorte
s57
,900
51,83
86,0
3810
.4%Oly
mpia
132,9
8812
2,325
10,65
08.0
%Ric
hland
-Kenn
ewick
-Pasco
134,5
2512
4,638
9,900
7.4%
Seatt
le-Be
llvue-E
verett
**1,4
95,32
51,3
66,46
312
8,838
8.6%
Seatt
le-Ta
coma-B
ellevue
1,890
,763
1,723
,225
167,5
888.9
%Sp
okane
237,7
7521
5,050
22,76
39.6
%We
natch
ee64
,600
59,17
55,4
138.5
%Ya
kima
129,3
1311
7,075
12,23
89.5
%
LABO
R FOR
CE AN
D UNE
MPLO
YMEN
T, WA
SHING
TON M
ETRO
AREA
S, 20
10*
Sourc
e: E
mploy
ment
Secur
ity De
partm
ent/L
MEA,
Local
Area
Unem
ploym
ent S
tatisti
cs (LA
US), H
aver A
nalyti
cs N
ote: *
Year-
to-Da
te Av
erage
s as o
f Aug
ust 20
10, N
ot Se
asona
lly Ad
justed
**
Metro
polita
n Divis
ion
INDU
STRY
2009
Q2 T
O 20
11 Q
2 20
08 TO
2013
2013
TO 20
18To
tal N
onfar
m0.5
%0.4
%1.4
%Co
nstru
ction
-4.5%
-3.5%
2.1%
Educ
ation
and H
ealth
Servi
ces
2.3%
2.5%
2.6%
Finan
cial A
ctivit
ies-0.
6%-0.
5%0.1
%Go
vernm
ent
-0.3%
0.5%
0.9%
Inform
ation
0.3%
1.0%
2.2%
Leisu
re an
d Hos
pitali
ty1.4
%0.5
%1.4
%Ma
nufac
turing
-0.6%
-1.4%
-0.1%
Profe
ssion
al an
d Bus
iness
Servi
ces
3.5%
2.0%
2.9%
Retai
l Trad
e0.6
%0.0
%0.8
%Tra
nspo
rtatio
n, Wa
rehou
sing a
nd U
tilities
0.8%
-0.1%
0.9%
Whole
sale
Trade
-0.2%
0.4%
1.7%
AVER
AGE A
NNUA
L GRO
WTH
RATE
PR
OJEC
TED
GROW
TH RA
TES,
WASH
INGT
ON, 2
008 T
O 20
18
Sou
rce:
Emplo
ymen
t Sec
urity
Depa
rtmen
t/LME
A, Ind
ustry
Proje
ction
s
INDU
STRY
DES
CRIP
TION
FIRM
SW
AGES
PAI
D
4TH
QUAR
TER
2009
AVER
AGE
E MPL
OYME
NTAV
ERAG
E
W
EEKL
Y WAG
ETo
tal
202,3
23$3
1,956
,489,0
972,7
34,86
289
9Go
vern
ment
2,083
$6,45
4,624
,733
525,4
8394
5Ma
nufac
turing
6,803
$3,92
6,134
,588
250,0
761,2
08He
alth C
are a
nd S
ocial
Ass
istan
ce13
,987
$3,29
8,183
,074
318,1
4779
7Pr
ofess
ional,
Scie
ntific
and T
echn
ical S
ervic
es17
,907
$2,73
3,097
,034
155,2
941,3
54Inf
orma
tion
2,373
$2,44
7,836
,241
101,3
951,8
57Re
tail T
rade
13,82
5$2
,133,0
21,45
329
6,088
554
Who
lesale
Tra
de12
,605
$1,78
2,018
,323
115,8
791,1
83Fin
ance
and I
nsur
ance
5,550
$1,70
0,388
,622
88,59
01,4
76Co
nstru
ction
21,27
6$1
,505,9
97,71
312
4,402
931
Admi
n., S
uppo
rt, W
aste
Mgmt
. and
Rem
ediat
ion S
vcs.
9,097
$1,22
4,214
,805
121,5
1477
5Tr
ansp
ortat
ion an
d War
ehou
sing
3,883
$898
,669,1
6876
,622
902
Acco
mmod
ation
and F
ood S
ervic
es12
,432
$876
,464,0
4320
7,721
325
Othe
r Ser
vices
(exc
ept P
ublic
Adm
inistr
ation
)61
,448
$751
,409,0
5312
7,912
452
Mana
geme
nt of
Comp
anies
and E
nterp
rises
605
$730
,345,9
0531
,754
1,769
Real
Estat
e, Re
ntal a
nd Le
asing
6,229
$415
,823,6
9243
,349
738
Agric
ultur
e, Fo
restr
y, Fis
hing a
nd H
untin
g7,1
60$4
11,94
6,142
67,09
847
2Ed
ucati
onal
Servi
ces
2,292
$282
,157,6
5734
,230
634
Arts,
Ente
rtainm
ent a
nd R
ecre
ation
2,375
$265
,141,6
2942
,519
480
Utilit
ies23
1$9
2,483
,534
4,800
1,482
Minin
g16
2$2
6,531
,688
1,990
1,026
COVE
RED
EMPL
OYME
NT CL
ASSI
FIED
BY I
NDUS
TRY,
FIRS
T QUA
RTER
2010
(PRE
LIMI
NARY
)
So
urce
: Emp
loyme
nt Se
curity
Dep
artm
ent/L
MEA,
Qua
rterly
Cen
sus o
f Emp
loyme
nt an
d Wag
es N
ote:
Pub
lic E
duca
tion i
s Inc
luded
in G
over
nmen
t
Sour
ce:
Emplo
ymen
t Sec
urity
Dep
artm
ent/L
MEA,
Loca
l Are
a Une
mploy
ment
Stati
stics
(LAU
S), H
aver
Ana
lytics
No
te:
*Yea
r-to-
Date
Aver
ages
as of
Sep
tembe
r 201
0, No
t Sea
sona
lly A
djuste
d
Sour
ce:
Emplo
ymen
t Sec
urity
Dep
artm
ent/L
MEA,
Loca
l Are
a Une
mploy
ment
Stati
stics
(LAU
S), H
aver
Ana
lytics
No
te:
*Yea
r-to-
Date
Aver
ages
as of
Sep
tembe
r 201
0, No
t Sea
sona
lly A
djuste
d
**Metr
opoli
tan D
ivisio
n
Sour
ce:
Emplo
ymen
t Sec
urity
Dep
artm
ent/L
MEA,
Indu
stry P
rojec
tions
Sour
ce:
Emplo
ymen
t Sec
urity
Dep
artm
ent/L
MEA,
Qua
rterly
Cen
sus o
f Emp
loyme
nt an
d Wag
es
Note
: Pu
blic e
duca
tion i
s inc
luded
in go
vern
ment

vi 2010 Washington State Labor Market and Economic Report
Total Unemployment Claims by Occupational Groups, Washington, October 2009 to September 2010 Beneficiaries* Percent Change from Estimated EmploymentOccupational Groups (Oct. 2009 - Sept. 2010) Previous 1-Year Period 2nd Quarter 2009**
Total 401,451 3.2% 3,248,935 Architecture and Engineering 10,077 -0.6% 84,231Arts, Design, Entertainment, Sports and Media 6,676 -0.9% 64,874Building and Grounds Cleaning and Maintenance 9,058 15.5% 120,159Business and Financial Operations 11,764 -4.7% 151,928Community and Social Services 2,937 21.0% 56,123Computer and Mathematical 9,979 -3.2% 118,987Construction and Extraction 72,011 -3.4% 184,853Education, Training and Library 5,632 23.3% 199,815Farming, Fishing and Forestry 14,377 10.7% 90,708Food Preparation and Serving Related 17,162 30.9% 249,483Health Care Practitioners and Technical 5,521 42.9% 151,847Health Care Support 5,655 40.5% 79,370Installation, Maintenance and Repair 20,718 8.1% 117,837Legal 1,776 2.6% 26,944Life, Physical and Social Science 3,392 16.0% 49,270Management 36,027 2.0% 145,773Military Specific 2,903 142.7% - Office and Administrative Support 46,681 2.9% 463,517Personal Care and Service 9,589 44.3% 142,694Production 46,357 -13.3% 160,614Protective Service 4,585 27.6% 59,445Sales and Related 24,837 6.9% 325,141Transportation and Material Moving 32,725 -2.7% 205,322Information Not Available 1,012 - -
Source: *Unemployment Insurance Data Warehouse, Continued Claims Database **Employment Security Department/LMEA, Occupational Projections
Washington = 9.3% United States = 9.7%
Source: Household Employment, Bureau of Labor Statistics, Haver Analytics
Unemployment Rate Increased From 2009
Unemployment Rate Decreased From 2009
Unemployment Rate Same as 2009
Average Unemployment Rates by County – Not Seasonally AdjustedJanuary 2010 to September 2010
Snohomish9.7%
Clallam10.1%
Jefferson9.4%
GraysHarbor13.0%
Pacific12.5%
Wahkiakum13.5% Cowlitz
12.8%
Lewis13.1%
Thurston7.9%
Mason11.0%
Pierce9.8%
King8.3%
Skagit10.3%
Whatcom8.5%
Okanogan10.3
Chelan8.4%
Kittitas9.1%
Yakima9.3%
Clark13.6%
Skamania13.0%
Klickitat10.7%
Benton6.9%
Franklin8.1%
Walla Walla7.4%
Columbia12.8%
Garfield8.0%
Asotin8.7%
Whitman6.3%
Adams9.2%
Lincoln8.6%
Grant10.1%
Douglas8.0%
Ferry14.2%
Stevens12.4%
PendOreille13.6%
Spokane9.5%
San Juan6.8%
Island9.2%
Kitsap7.7%

12010 Washington State Labor Market and Economic Report
Chapter One The National Labor Market
The National Labor MarketIn September 2010, the official end of the recession was announced, followed in October by the official expiration of the Troubled Asset Relief Program (TARP). At the time of this writing, there is a sense that a major crisis has been avoided, but at an extremely high cost – and it is unclear when the country will be on track for solid economic growth. The cost can be measured both in terms of much higher national debt and large number of persons who remain unable to find work.
Much of the economy seems poised for recovery as profits are high, stocks have for the most part increased, interest rates are near historic lows, Federal Reserve policies are very accommodative, production indexes have surprised on the positive side, retail sales this year have been up, and personal savings rates are the highest since the mid-1990s. The final piece of this recovery puzzle yet to fall into place has been jobs, as firms have remained reluctant to increase hiring at a significant level. There has been a further concern that many have been unemployed so long that they are becoming potentially unemployable, especially older workers and those left behind by structural changes caused, in part, by dramatic changes in the world economy.
The recent recession easily had the largest net job loss since 1929, partly due to the much larger work force that exists today.
Photo by ©iStock/Erick Hood
End of the Recession In the fall of 2009, economists were engaged in pinpointing the official end of the recession and in estimating how quickly the national economy would recover from the worst recession in a generation. A year later we finally have the official end of the recession as of June 2009, but the recovery has for the most part been underwhelming.
Having time-stamped the most recent recession, we can now look at it in historical context. The recent recession easily had the largest net job loss since 1929, but that is in part due to the much larger work force that exists today. In percentage terms, the job losses in the 1945 recession were worse and the 1948 to 1949 recession was roughly comparable. In terms of length, the recent recession at 18 months, was the longest since the Great Depression (Exhibit 1-1). However, the causes of the recent recession are much different from the causes of earlier recessions. Many earlier recessions were induced by monetary policies, which did not affect the basic health of the banking and financial system. In contrast, the most recent recession and the Great Depression put our nation’s entire banking and financial system at risk of complete meltdown.
Exhibit 1-1Recessions Since 1929United StatesSource: U.S. Bureau of Labor Statistics
PERCENTAGE EMPLOYMENT CHANGE MONTHS NET 14 MONTHS IN JOB AFTER
PEAK TROUGH RECESSION LOSS RECESSION RECESSIONAugust 1929 March 1933 43 NA NA NAMay 1937 June 1938 13 NA NA NAFebruary 1945 October 1945 8 -3,305,000 -7.9% 12.4%November 1948 October 1949 11 -2,244,000 -5.0% 9.1%July 1953 May 1954 10 -1,571,000 -3.1% 4.1%August 1957 April 1958 8 -2,102,000 -4.0% 5.2%April 1960 February 1961 10 -1,256,000 -2.3% 3.8%December 1969 November 1970 11 -831,000 -1.2% 2.9%November 1973 March 1975 16 -1,260,000 -1.6% 3.5%January 1980 July 1980 6 -968,000 -1.1% 1.8%July 1981 November 1982 16 -2,824,000 -3.1% 4.4%July 1990 March 1991 8 -1,240,000 -1.1% 0.0%March 2001 November 2001 8 -1,599,000 -1.2% -0.5%December 2007 June 2009 18 -7,311,000 -5.3% -0.3%

2 2010 Washington State Labor Market and Economic Report
The National Labor Market Chapter One
U-Rate
0.0
2.0
4.0
6.0
8.0
10.0
12.0
$0
$2,000
$4,000
$6,000
$8,000
$10,000
$12,000
$14,000
$16,000
1980 1985 1990 1995 2000 2005 2010GDP Unemployment Rate
Billi
ons
Unem
ploy
men
t Rat
e
1 Kannan, Prakash (2010), “Credit Conditions and Recoveries Associated with Financial Crisis,” IMF Working Paper, page 4.
Exhibit 1-2 depicts gross domestic product (GDP) and the unemployment rate since the 1980s with recession periods shaded. Taken from the longer-term perspective, GDP (which is the broadest measure of economic activity) was only moderately affected during the three preceding recessions and was strongly affected in the recent one. Unemployment rates have also risen dramatically since 2007, but have as yet to reach the highs of the early 1980s.
Exhibit 1-2Gross Domestic Product and Unemployment RateUnited States, 1980 to 2010Source: U.S. Bureau of Economic Analysis, U.S. Bureau of Labor Statistics, Haver Analytics
Note: Shaded areas indicate recessions.
Recovery?Even more visibly affected than GDP by the economic cycles is the velocity of money (Exhibit 1-3), which is the ratio of the money supply to goods production. Conceptually, the velocity of money is how often a given unit of currency changes hands as goods and services are purchased. As such, this measure reflects economic activity. The big fall-off in velocity occurred from October 2008 to December 2008, and it has remained at low levels since. Another way to view the recovery process is that the injection of money into the system by the Fed has staved off disaster, but it hasn’t been generating the desired increase in economic activity.
Exhibit 1-3Velocity of Money: Ratio of Nominal GDP to Money SupplyUnited States, 1992 to 2010Source: Macroeconomic Advisers, Federal Reserve Board, Haver Analytics
Note: Shaded areas indicate recessions.
The far right column in Exhibit 1-1 identifies percentage job growth in the 14 months following the end of each of the past recessions since 1945. For the most recent recession, this period is from June 2009 to August 2010. Over this “recovery” period, employment in the United States fell by 0.3 percent. Employment tends to be a lagging indicator, but this recent employment contraction following the end of the recession does sharply contrast with recessions prior to 1990. For all three recessions since 1990, employment actually fell in the first 14 months of the recovery period, most notably the 2001 recession with a 0.5 percent decline.
Traditionally in the United States, deeper recessions have led to stronger recoveries. For example, the four recessions that occurred in the 1940s and 1950s all had job losses of 3 percent or more, and all had job growth of 4 percent or more in the 14 months following the trough. The current recovery goes against this historical experience as the nation experienced a deep recession followed by an anemic recovery. However, according to a study published by the International Monetary Fund,1 recessions that are associated with a financial crisis typically take five and a half quarters to recover compared to an average of three quarters to recover from recessions not associated with a financial crisis. Restrictive
7,000
8,000
9,000
10,000
11,000
12,000
13,000
14,000
5.0
6.0
7.0
8.0
9.0
10.0
11.0
1992
1993
1994
1995
1996
1997
1998
1999
2000
2001
2002
2003
2004
2005
2006
2007
2008
2009
2010
Velocity of Money GDP
Ratio
Mon
thly
GDP
7,000
8,000
9,000
10,000
11,000
12,000
13,000
14,000
5.0
6.0
7.0
8.0
9.0
10.0
11.0
1992
1993
1994
1995
1996
1997
1998
1999
2000
2001
2002
2003
2004
2005
2006
2007
2008
2009
2010
Velocity of Money GDP
Ratio
Mon
thly
GDP
32010 Washington State Labor Market and Economic Report
Chapter One The National Labor Market
banking standards for awarding credit and a lack of available credit have presumably acted as a brake on economic recovery.
Sources of Growth and StagnationWe know the financial crisis played a critical role leading to the recession and has continued to shape the recovery. It is also clear that some sectors have played a positive role in economic growth, while others have continued to be a drag on growth.
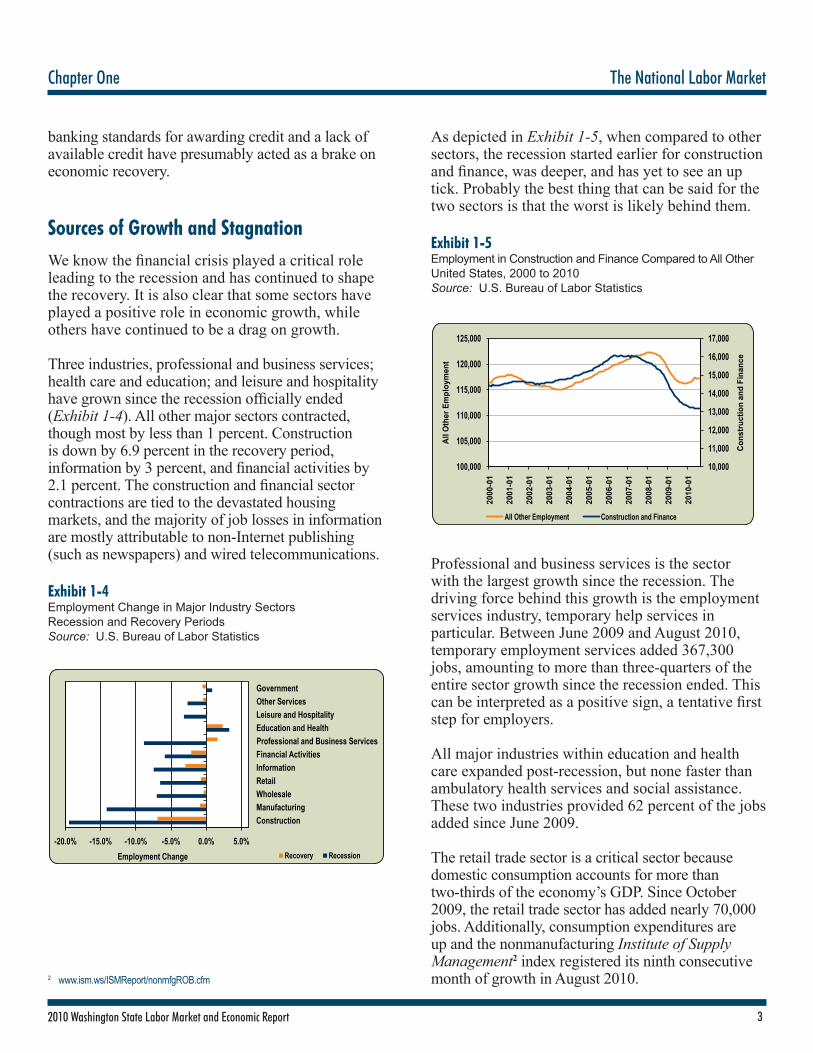
Three industries, professional and business services; health care and education; and leisure and hospitality have grown since the recession officially ended (Exhibit 1-4). All other major sectors contracted, though most by less than 1 percent. Construction is down by 6.9 percent in the recovery period, information by 3 percent, and financial activities by 2.1 percent. The construction and financial sector contractions are tied to the devastated housing markets, and the majority of job losses in information are mostly attributable to non-Internet publishing (such as newspapers) and wired telecommunications.
Exhibit 1-4Employment Change in Major Industry SectorsRecession and Recovery PeriodsSource: U.S. Bureau of Labor Statistics
As depicted in Exhibit 1-5, when compared to other sectors, the recession started earlier for construction and finance, was deeper, and has yet to see an up tick. Probably the best thing that can be said for the two sectors is that the worst is likely behind them.
Exhibit 1-5Employment in Construction and Finance Compared to All OtherUnited States, 2000 to 2010Source: U.S. Bureau of Labor Statistics
Professional and business services is the sector with the largest growth since the recession. The driving force behind this growth is the employment services industry, temporary help services in particular. Between June 2009 and August 2010, temporary employment services added 367,300 jobs, amounting to more than three-quarters of the entire sector growth since the recession ended. This can be interpreted as a positive sign, a tentative first step for employers.
All major industries within education and health care expanded post-recession, but none faster than ambulatory health services and social assistance. These two industries provided 62 percent of the jobs added since June 2009.
The retail trade sector is a critical sector because domestic consumption accounts for more than two-thirds of the economy’s GDP. Since October 2009, the retail trade sector has added nearly 70,000 jobs. Additionally, consumption expenditures are up and the nonmanufacturing Institute of Supply Management2 index registered its ninth consecutive month of growth in August 2010.
-20.0% -15.0% -10.0% -5.0% 0.0% 5.0%
ConstructionManufacturingWholesaleRetailInformationFinancial ActivitiesProfessional and Business ServicesEducation and HealthLeisure and HospitalityOther ServicesGovernment
Recovery RecessionEmployment Change
10,000
11,000
12,000
13,000
14,000
15,000
16,000
17,000
100,000
105,000
110,000
115,000
120,000
125,000
2000
-01
2001
-01
2002
-01
2003
-01
2004
-01
2005
-01
2006
-01
2007
-01
2008
-01
2009
-01
2010
-01
Cons
truct
ion
and
Fina
nce
All O
ther
Em
ploy
men
t
All Other Employment Construction and Finance
2 www.ism.ws/ISMReport/nonmfgROB.cfm

4 2010 Washington State Labor Market and Economic Report
The National Labor Market Chapter One
Exhibit 1-6Personal Consumption Expenditures and Retail Trade Employment, Seasonally AdjustedUnited States, 2000 to 2010Source: U.S. Bureau of Labor Statistics
OutlookAfter a decline in inflation adjusted GDP in 2009, the forecasting firm Global Insights expects the output measure to return to moderate growth (2.8 percent annualized growth) in 2010. However, employment is projected to have net declines for 2010, followed by very slow growth (0.9 percent annually) in 2011. According to Global Insights’ projections, the country won’t return to typical employment growth patterns until 2012. The Congressional Budget Office projects more positive GDP numbers than Global Insights, but still lower than normal growth through 2011.
13,60013,80014,00014,20014,40014,60014,80015,00015,20015,40015,60015,800
$5,000$5,500$6,000$6,500$7,000$7,500$8,000$8,500$9,000$9,500
$10,000
2000
2001
2002
2003
2004
2005
2006
2007
2008
2009
2010
Reta
il Em
ploy
men
t (Th
ousa
nds)
Cons
umpt
ion
(Bill
ions
of $
)
Personal Consumption ExpendituresRetail Employment
ConclusionIn conclusion, we can say that the United States successfully managed to avoid a more serious recession or depression, but the expectations raised by this success were not met in the recovery period. The post-recession period has been by most economic metrics worse than most post-recession periods, primarily because of the lingering effects of the financial crisis. Many of the recessions between the Great Depression and the most recent recession were caused by restrictive monetary policy. Once those conditions were removed, pent-up demand typically led to accelerated growth rate. The current conditions are much more problematic and will take much longer to sort through. Most forecasts see the economy in a slow growth pattern until 2012.
Most forecasts see the economy in a slow growth pattern until 2012.
Photo by ©iStock/Mark Stahl

52010 Washington State Labor Market and Economic Report
Chapter Two Washington State
Washington State
Washington State Compared to the Nation
Washington state suffered during the recession, but not disproportionately. When compared to all states in terms of percentage employment change during the official recession period, Washington ranked 25th – right in the middle. Washington state hit its employment peak and employment low point exactly two months later than the nation, and the period between the points lasted exactly two years. At the national level, employment reached its peak in December 2007, while Washington peaked in February 2008. Nationally, employment reached its low point in December 2009, while Washington bottomed out in February 2010.
Exhibit 2-1Nonfarm Employment, Seasonally Adjusted, ThousandsWashington and United States, 2000 to 2010Source: U.S. Bureau of Labor Statistics, Haver Analytics
Note: Shaded areas indicate recessions.
Washington state performed about average in terms of employment over the course of the recession, but over the past year it has fared worse than average. When compared against all other states from August 2009 to August 2010, Washington ranked 38th. In the third quarter of 2009, the first post-recession quarter, Washington averaged monthly losses of 8,467 jobs. The 2009 fourth quarter averaged monthly job losses of 6,300, followed by average monthly job losses of 1,800 in the first quarter of
2010. The first positive quarter of 2010 was quarter two, when the state added jobs at an average of 4,600 per month.
In the third quarter of 2010, this promising growth was reversed and employment began to contract, averaging net losses of 2,400. The third quarter losses were largely due to cuts in the public sector. The private sector experienced job losses in 22 of the 24 months between March 2008 and February 2010. This pattern then reversed, as the private sector did not experience a month of net job losses between February and September 2010. Exhibit 2-2 compares employment patterns over the past year for the public and private sectors.
The overall impact has been small private-sector gains outweighed by public-sector job losses. Employment with the Federal Census Bureau boosted payroll employment in the middle part of the year, but since then Census layoffs have contributed to the trend of public-sector job losses.
Exhibit 2-2Private- and Public-Sector Employment, Seasonally AdjustedWashington State, September 2009 to September 2010Source: Employment Security Department/LMEA
530,000
535,000
540,000
545,000
550,000
555,000
560,000
2,210,0002,215,0002,220,0002,225,0002,230,0002,235,0002,240,0002,245,0002,250,0002,255,0002,260,000
2009
-10
2009
-11
2009
-12
2010
-01
2010
-02
2010
-03
2010
-04
2010
-05
2010
-06
2010
-07
2010
-08
2010
-09
Publ
ic-S
ecto
r Em
ploy
men
t
Priv
ate-
Sect
or E
mpl
oym
ent
Year/Month
Private SectorPublic Sector
2,400
2,500
2,600
2,700
2,800
2,900
3,000
124,000
126,000
128,000
130,000
132,000
134,000
136,000
138,000
140,000
2000
-01
2000
-07
2001
-01
2001
-07
2002
-01
2002
-07
2003
-01
2003
-07
2004
-01
2004
-07
2005
-01
2005
-07
2006
-01
2006
-07
2007
-01
2007
-07
2008
-01
2008
-07
2009
-01
2009
-07
2010
-01
2010
-07
U.S. Washington
U.S.
Non
farm
Empl
oym
ent
Was
hing
ton
Nonf
arm
Em
ploy
men
t

6 2010 Washington State Labor Market and Economic Report
Washington State Chapter Two
Washington Industries
It is clear that the recent recession had a much deeper impact than the 2001 recession. We can compare how industries fared in the recent recession versus its predecessor and how statewide industries fared in comparison with national industries. To do this, an index of employment decline was created, looking at how a given industry’s employment high and low points varied from its pre-recession level. The results are shown in Exhibit 2-3. A high positive percent is indicative of an industry that lost a significant percentage of its employment during the recessionary period. So for example, the mining and logging industry had a very high index of 20 percent for the state during the 2001 recession. This implies that this industry lost a large portion of its employment base during that recessionary period. A negative number, such as the national education and health services for the 2001 recession, indicates that the industry gained jobs during the recession period.
Exhibit 2-3Industry Index of Employment DeclineWashington and United States, 2001 and Recent RecessionsSource: Employment Security Department/LMEA
2001 RECENT RECESSION RECESSIONNAICS INDUSTRY STATE NATION STATE NATION
Total Nonfarm 3.1% 2.1% 7.0% 6.1%Mining and Logging 20.0% 7.3% 27.0% 13.5%Construction 7.5% 3.1% 32.3% 25.0%Manufacturing 20.1% 16.7% 14.2% 15.8%Trade, Transportation and Utilities 5.3% 4.3% 7.9% 7.7%Wholesale Trade 6.4% 5.0% 8.6% 8.0%Retail Trade 3.7% 3.2% 8.1% 7.8%Transportation and Warehousing 9.7% 7.0% 9.1% 9.3%Utilities 12.3% 5.1% 2.1% 1.3%Information 10.8% 15.6% 3.8% 10.3%Financial Activities 0.1% 0.2% 14.7% 7.8%Professional and Business Services 7.7% 5.8% 9.4% 9.5%Education and Health Services 0.4% -0.4% -0.7% -0.3%Leisure and Hospitality 4.8% 1.4% 7.8% 4.1%Other Services 10.0% -0.3% 2.1% 4.2%Government 0.0% -0.2% 0.8% 1.3%
The starkest numbers in the table are for the construction industry in the recent recession. The national construction index is 25 percent, while the state is 32.3 percent, indicating an extremely high loss of jobs in the sector during the downturn. As mentioned, the relatively small mining and logging sector contracted significantly, as did manufacturing and financial activities. The only sector to expand during the recent recession period was education and health services. This seemingly recession-proof group of industries also expanded for the nation in both recessionary periods.
There were some sectors that did somewhat better in the recent recession than in 2001 – manufacturing, utilities, information and other services. The manufacturing losses during that earlier recession were mostly due to a downturn in aerospace, which saw employment drop from 90,700 at the beginning of 2000 to 61,000 by March 2004. Some of the job losses in information were associated with the dot-com bust, but others were part of the move away from wired telecommunication.
In the period from September 2009 to September 2010, construction, financial activities and manufacturing continued to struggle (Exhibit 2-4), but other sectors managed a degree of recovery. Of particular note in terms of recovery are the professional and business services and retail trade sectors. Both added nearly 3,000 jobs over the year indicating returned demand for goods and services.
The only sector to expand during the recent recession period was education and health services.
Photo by ©iStock/Neustockimages

72010 Washington State Labor Market and Economic Report
Chapter Two Washington State
250,000
270,000
290,000
310,000
330,000
350,000
370,000
390,000
2,400,000
2,450,000
2,500,000
2,550,000
2,600,000
2,650,000
2007
-01
2007
-04
2007
-07
2007
-10
2008
-01
2008
-04
2008
-07
2008
-10
2009
-01
2009
-04
2009
-07
2009
-10
2010
-01
2010
-04
2010
-07
All Other SectorsConstruction and Financial Employment
All O
ther
Sec
tors
Cons
truct
ion
and
Fina
ncia
l
Year/Month
Exhibit 2-4Year-Over-Year Employment Change by Industry, Seasonally Adjusted Data SeriesWashington State, September 2009 to September 2010Source: Employment Security Department/LMEA
SEPTEMBER 2009 TO SEPTEMBER 2010 JOBS
Total Nonfarm -17,700Professional and Business Services 3,100Education and Health Services 2,800Retail Trade 1,800Information 1,400Wholesale Trade 700Transportation, Warehousing and Utilities 0Mining and Logging 0Other Services -100Leisure and Hospitality -1,100Manufacturing -2,700 Aerospace Product and Parts Manufacturing -800Government -5,900Financial Activities -6,900Construction -10,800
Annual job losses in the construction and financial activities sectors stand out. Combined employment for the two sectors fell from December 2007 to February 2010 by 83,700 jobs (Exhibit 2-5). This represents a loss of nearly 25 percent of their collective employment base. Since February 2010, employment growth has been marginal (+2,800 for both sectors).
Exhibit 2-5Employment for Sum of Construction and Financial Activities Sectors Compared to Employment for All Other SectorsWashington State, January 2007 to September 2010Source: Employment Security Department/LMEA
Washington Regions During and After the Recession
All metropolitan statistical areas (MSA) within the state lost employment during the recession with the exception of the Tri-Cities. From December 2007 to June 2009, this area added 2,800 jobs, amounting to a growth rate of 3 percent. The area benefited from the federal hiring for the cleanup at the Hanford Nuclear Reservation. The Seattle area lost more net jobs than any other Washington area, but on a percentage basis the Portland-Vancouver MSA lost the most (-6.7 percent) during the official recession period. The Longview and Bellingham MSAs also lost more than 6 percent of their employment base during the recession.
In the post-recession period, June 2009 to September 2010, only two areas added to employment payrolls – the Tri-Cities and Longview MSAs. All other areas contracted, but at a slower pace than during the recession. The Olympia area was the only MSA to have very close percentage losses during the recession and post-recession periods. Olympia is heavily reliant on state employment, which played a stabilizing role during the recession, but in recent months has been a drag on employment growth.
Washington’s cities, suburbs and rural communities were all hard hit by the great recession.
Photo by ©Ron-Adcock/Dreamstime.com
8 2010 Washington State Labor Market and Economic Report
Washington State Chapter Two
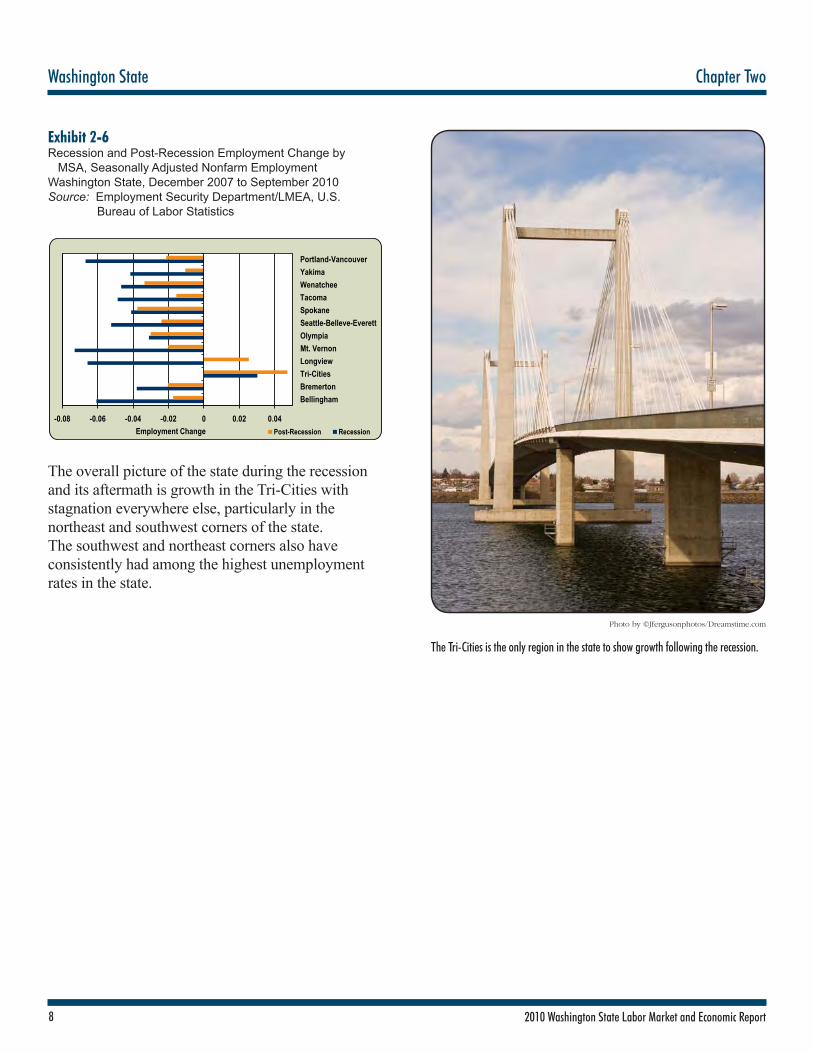
Exhibit 2-6Recession and Post-Recession Employment Change by MSA, Seasonally Adjusted Nonfarm EmploymentWashington State, December 2007 to September 2010Source: Employment Security Department/LMEA, U.S. Bureau of Labor Statistics
The overall picture of the state during the recession and its aftermath is growth in the Tri-Cities with stagnation everywhere else, particularly in the northeast and southwest corners of the state. The southwest and northeast corners also have consistently had among the highest unemployment rates in the state.
-0.08 -0.06 -0.04 -0.02 0 0.02 0.04
BellinghamBremertonTri-CitiesLongviewMt. VernonOlympiaSeattle-Belleve-EverettSpokaneTacomaWenatcheeYakimaPortland-Vancouver
Post-Recession RecessionEmployment Change
The Tri-Cities is the only region in the state to show growth following the recession.
Photo by ©Jfergusonphotos/Dreamstime.com

92010 Washington State Labor Market and Economic Report
Chapter Three Seasonal, Structural and Cyclical Industry Employment
Seasonal, Structural and Cyclical Industry EmploymentThis chapter discusses three factors that significantly impact monthly changes in employment and unemployment: seasonality, cyclicality and structural change. In Washington state, there are a number of industries that are influenced by seasonal and cyclical factors. Structural changes have driven long-term growth patterns. Over time, these trends alter the mix of industry in the state.
Seasonal Employment Change
Seasonal employment refers to periodic fluctuations in employment that tend to occur at the same time each year. Possible reasons for seasonal changes include natural factors such as changing weather patterns, administrative measures such as the start and end of the school year and social, cultural, religious or traditions such as holidays.
Retail trade is an example of an industry subject to seasonality. Retail trade tends to peak in the Christmas season and then decline after the holidays. Therefore, time series of retail sales typically show increasing sales from October through January, and declining sales in February and March. As a result, clothing and clothing accessories stores and general merchandise stores show predictable patterns of employment change. Exhibit 3-1 displays highly seasonal industries in Washington. Based on analysis of 97 industries in Washington state, there are 16 industries with a high level of seasonality, 25 industries with a moderate level of seasonality, 27 industries with a low level of seasonality and 29 other industries were categorized as nonseasonal.
Exhibit 3-1Industries Showing the Highest Degree of SeasonalityWashington State, January 1990 to December 2009Source: Employment Security Department/LMEA
NAICS SEASONAL CODES INDUSTRY TITLE FACTOR
111 Crop Production 34.7%487 Scenic and Sightseeing Transportation 14.8%115 Support Activities for Agriculture and Forestry 13.9%213 Support Activities for Mining 9.1%237 Heavy and Civil Engineering Construction 9.1%114 Fishing, Hunting and Trapping 8.7%711 Performing Arts, Spectator Sports and Related Industries 8.2%721 Accommodation 5.9%611 Educational Services 4.9%311 Food Manufacturing 4.7%448 Clothing and Clothing Accessories Stores 4.7%512 Motion Picture and Sound Recording Industries 4.5%713 Amusement, Gambling and Recreation Industries 4.5%312 Beverage and Tobacco Product Manufacturing 4.2%452 General Merchandise Stores 4.2%492 Couriers and Messengers 4.1%
At the other end of the spectrum are industries with relatively insignificant seasonal factors. Employment in these industries does not tend to have periodic fluctuations that occur at the same time each year. Health care, finance and high-tech related industries are all examples of nonseasonal industries. Exhibit 3-2 displays industries in Washington with low seasonality. Hospitals and credit intermediation and related activities top the list. Health care-related industries include hospitals; ambulatory health care services; and nursing and residential care facilities. Finance-related industries include credit intermediation and related activities; insurance carriers and related activities; and monetary authorities-central bank. High-tech related industries include professional, scientific and technical services; computer and electronic product manufacturing; aerospace product and parts manufacturing; chemical manufacturing; machinery manufacturing; and software publishers.

10 2010 Washington State Labor Market and Economic Report
Seasonal, Structural and Cyclical Industry Employment Chapter Three
Exhibit 3-2Nonseasonal IndustriesWashington State, January 1990 to December 2009Source: Employment Security Department/LMEA
NAICS SEASONAL CODES INDUSTRY TITLE FACTOR
622 Hospitals 0.3%522 Credit Intermediation and Related Activities 0.3%621 Ambulatory Health Care Services 0.4%524 Insurance Carriers and Related Activities 0.4%541 Professional, Scientific and Technical Services 0.4%623 Nursing and Residential Care Facilities 0.4%334 Computer and Electronic Product Manufacturing 0.4%551 Management of Companies and Enterprises 0.4%523 Securities, Commodity Contracts and Other Financial 0.5% Investments and Related Accounts 511* Other Publishers 0.5%423 Merchant Wholesalers, Durable Goods 0.6%331 Primary Metal Manufacturing 0.6%3366 Ship and Boat Building 0.6%3364 Aerospace Product and Parts Manufacturing 0.6%335 Electrical Equip. Appliance and Component Manuf. 0.7%325 Chemical Manufacturing 0.7%518 Data Processing, Hosting and Related Services 0.7%333 Machinery Manufacturing 0.7%521 Monetary Authorities-Central Bank 0.7%5112 Software Publishers 0.8%562 Waste Management and Remediation Services 0.8%515 Broadcasting (except Internet) 0.8%323 Printing and Related Support Activities 0.8%624 Social Assistance 0.9%5171 Wired Telecommunications Carriers 0.9%486 Pipeline Transportation 0.9%481 Air Transportation 0.9%488 Support Activities for Transportation 1.0%336* Other Transportation Equipment Manufacturing 1.0%Note: *Indicates an aggregated code.
Structural Employment Change
Structural change in employment results from long-term widespread change in the fundamental structure of an industry, rather than microscopic or short-term employment change. Structural change in employment can be initiated by technology progress or policy changes, or by permanent changes in resources, population or society. In recent years, structural changes have become more important to our employment and economic growth. A good example of structural change is the shift of farmworkers to manufacturing and then to service workers. In the early part of the 20th century, a
majority of American workers were engaged with farm work. Currently, agriculture makes up less than 5 percent of the workforce. Another example of structural change is the change in U.S. industry due to the rise of China as a manufacturing powerhouse.
An important driver of structural change is technology. Technology has reshaped the entire labor market through increased efficiencies. Efficiencies such as automated manufacturing, data collection and analysis, and communications have led to a fast growth of new types of businesses and employment in Washington state. Long-term demographic changes also strongly influence structural factors, especially in the ambulatory health care services, hospitals, social assistance, and educational services industries.
Exhibit 3-3 lists the industries that are most influenced by structural factors. The percentages of relative contributions by structural components are presented in the third column. According to our analysis, the industry with the highest contribution toward the structural component (69.4 percent) is software publishers, while scenic and sightseeing transportation and crop production have the lowest contributions to the structural component (16.6 percent). On average, for all industries (based on absolute contributions), the relative contribution of a structural component to monthly employment changes is 42.44 percent.
The industry with the highest contribution toward the structural component is software publishers.
Photo by ©iStock/alxpin
112010 Washington State Labor Market and Economic Report
Chapter Three Seasonal, Structural and Cyclical Industry Employment
Cyclical Employment Change
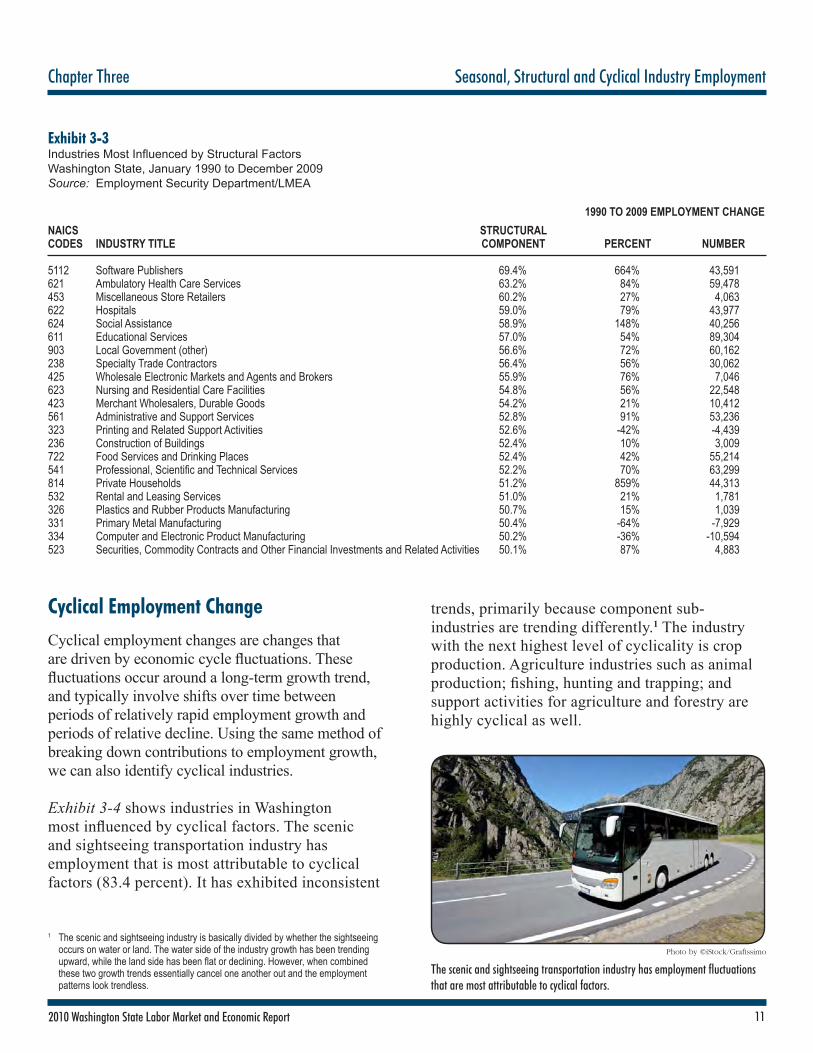
Cyclical employment changes are changes that are driven by economic cycle fluctuations. These fluctuations occur around a long-term growth trend, and typically involve shifts over time between periods of relatively rapid employment growth and periods of relative decline. Using the same method of breaking down contributions to employment growth, we can also identify cyclical industries. Exhibit 3-4 shows industries in Washington most influenced by cyclical factors. The scenic and sightseeing transportation industry has employment that is most attributable to cyclical factors (83.4 percent). It has exhibited inconsistent
trends, primarily because component sub-industries are trending differently.1 The industry with the next highest level of cyclicality is crop production. Agriculture industries such as animal production; fishing, hunting and trapping; and support activities for agriculture and forestry are highly cyclical as well.
1 The scenic and sightseeing industry is basically divided by whether the sightseeing occurs on water or land. The water side of the industry growth has been trending upward, while the land side has been flat or declining. However, when combined these two growth trends essentially cancel one another out and the employment patterns look trendless.
The scenic and sightseeing transportation industry has employment fluctuations that are most attributable to cyclical factors.
Photo by ©iStock/Grafissimo
Exhibit 3-3Industries Most Influenced by Structural FactorsWashington State, January 1990 to December 2009Source: Employment Security Department/LMEA
1990 TO 2009 EMPLOYMENT CHANGENAICS STRUCTURAL CODES INDUSTRY TITLE COMPONENT PERCENT NUMBER
5112 Software Publishers 69.4% 664% 43,591621 Ambulatory Health Care Services 63.2% 84% 59,478453 Miscellaneous Store Retailers 60.2% 27% 4,063622 Hospitals 59.0% 79% 43,977624 Social Assistance 58.9% 148% 40,256611 Educational Services 57.0% 54% 89,304903 Local Government (other) 56.6% 72% 60,162238 Specialty Trade Contractors 56.4% 56% 30,062425 Wholesale Electronic Markets and Agents and Brokers 55.9% 76% 7,046623 Nursing and Residential Care Facilities 54.8% 56% 22,548423 Merchant Wholesalers, Durable Goods 54.2% 21% 10,412561 Administrative and Support Services 52.8% 91% 53,236323 Printing and Related Support Activities 52.6% -42% -4,439236 Construction of Buildings 52.4% 10% 3,009722 Food Services and Drinking Places 52.4% 42% 55,214541 Professional, Scientific and Technical Services 52.2% 70% 63,299814 Private Households 51.2% 859% 44,313532 Rental and Leasing Services 51.0% 21% 1,781326 Plastics and Rubber Products Manufacturing 50.7% 15% 1,039331 Primary Metal Manufacturing 50.4% -64% -7,929334 Computer and Electronic Product Manufacturing 50.2% -36% -10,594523 Securities, Commodity Contracts and Other Financial Investments and Related Activities 50.1% 87% 4,883

12 2010 Washington State Labor Market and Economic Report
Seasonal, Structural and Cyclical Industry Employment Chapter Three
Exhibit 3-4Industries Most Influenced by Cyclical FactorsWashington State, January 1990 to December 2009Source: Employment Security Department/LMEA
NAICS CYCLICAL CODES INDUSTRY TITLE COMPONENT
487 Scenic and Sightseeing Transportation 83.4%111 Crop Production 81.5%213 Support Activities for Mining 79.9%112 Animal Production 79.5%483 Water Transportation 78.1%316 Leather and Allied Product Manufacturing 77.4%486 Pipeline Transportation 73.7%711 Performing Arts, Spectator Sports and Related Industries 72.6%512 Motion Picture and Sound Recording Industries 72.5%324 Petroleum and Coal Products Manufacturing 71.7%446 Health and Personal Care Stores 71.4%114 Fishing, Hunting and Trapping 71.2%115 Support Activities for Agriculture and Forestry 70.3%221 Utilities 70.1%
The fourth column of Exhibit 3-5 gives us the correlation of industry growth and overall economic growth. Monthly employment in the food services and drinking places industry shows the strongest relationship to the state’s growth pattern, with a correlation of 98.5 percent. Employment in software publishers, educational services and hospitals are also highly correlated with overall economic growth.
Notably, there are some industries that have almost no correlation with state’s overall economic growth, or their growth pattern changes in the opposite direction of the overall economic growth. For example, employment in performing arts, spectator sports and related industries shows relatively no correlation with the state pattern (-0.2 percent), and in the fishing, hunting and trapping industry employment is negatively correlated to overall economic growth (-94 percent).
Exhibit 3-5Industries Most Influenced by Overall Economic GrowthWashington State, January 1990 to December 2009Source: Employment Security Department/LMEA
CORRELATIONNAICS CYCLICAL WITH TOTAL CODES INDUSTRY TITLE COMPONENT EMPLOYMENT
722 Food Svcs. and Drinking Places 47.6% 98.5%541 Professional, Scientific and Tech. Svcs. 47.8% 97.9%561 Administrative and Support Services 47.2% 97.8%485 Transit and Ground Passenger Trans. 59.6% 97.4%5112 Software Publishers 30.6% 97.3%611 Educational Services 43.0% 97.2%713 Amusement, Gambling and 52.4% 96.9% Recreation Industries 335 Electrical Equipment, Appliance and 58.6% 96.6% Component Manufacturing 444 Building Materials and Garden Equip. 57.2% 96.4% and Supplies Dealers 622 Hospitals 41.0% 96.1%812 Personal and Laundry Services 51.5% 96.1%813 Religious, Grantmaking, Civic, 52.2% 96.0% Professional and Similar Orgs.
In Washington state, there are a number of industries that are influenced by seasonal and cyclical factors. Structural changes have driven long-term growth. These trends have, in turn, brought high-paying jobs and important tax revenue to the state.
Structural changes have driven long-term growth. These trends have, in turn, brought high-paying jobs and important tax revenue to the state.
Photo by ©iStock/Alex Slobodkin

132010 Washington State Labor Market and Economic Report
Chapter Four Unemployment
UnemploymentThis chapter discusses various measures of unemployment. The first section covers the insured unemployment rate, and the second section reports on the total unemployment rate, other labor force data, and data from the Mass Layoffs Statistics program.
The Insured Unemployment Rate
The insured unemployment rate, calculated only from unemployment insurance program data, is a ratio of the insured unemployed (those drawing unemployment benefits) divded by the number of employees (working and not working) covered by unemployment insurance.
The total unemployment rate is a ratio of the estimated number of unemployed individuals actively looking for work divided by the labor force. Total unemployment includes both workers covered by unemployment insurance and those not covered by unemployment insurance. The labor force includes both those working and those who are looking for work.
Exhibit 4-1 compares the insured and total unemployment rates for Washington. The rates move in tandem, with the insured rate being about half the total unemployment rate. In late 2008, both measures of unemployment began a dramatic rise followed by another upward spike in late 2009 and early 2010.
Exhibit 4-1Monthly Unemployment Rate - Total Unemployment Rate Seasonally and Nonseasonally Adjusted and Insured Unemployment RateWashington State, January 2000 to September 2010Source: Haver Analytics
Unemployment Beneficiaries
A new unemployment beneficiary is an individual who received the first payment on a new unemployment claim. Rising first payments are associated with increasing joblessness.
Exhibit 4-2 presents industries that are experiencing major job losses. In the October 2009 to September 2010 period, the construction industry, for example, had 21.3 percent of all new unemployment beneficiaries. In contrast, construction’s share of total covered employment was only 5.2 percent. The ratio of these two percentage shares (21.3 percent divided by 5.2 percent) yields a factor of 4.1, meaning that construction had a much higher share of unemployment beneficiaries than employment. Mining, administrative support and waste management, and educational services also had high ratios.
0123456789
1011
2000 2001 2002 2003 2004 2005 2006 2007 2008 2009 2010
Perc
ent
Washington Insured Unemployment RateWashington Total Unemployment RateWashington Total Unemployment Rate, Seasonally Adjusted
Construction had a much higher share of employment beneficiaries than employment.
Photo by ©Monkey Business Images/Dreamstime.com

14 2010 Washington State Labor Market and Economic Report
Unemployment Chapter Four
10121416182022242628303234363840
Wee
ks
Regular Benefits All Benefit Entitlements2000 2001 2002 2003 2004 2005 2006 2007 2008 20102009
Exhibit 4-2New Unemployment Beneficiaries Relative to Covered Employment, Regular BenefitsWashington State, October 2009 to September 2010Source: Unemployment Insurance Data Warehouse, Continued Claims Database and QCEW 2009 Average Annual (6-Month Lag)
NEW SHARE BENEFICIARIES OF TOTAL SHARE OF TO EMPLOYMENT COVERED TOTAL NEWINDUSTRY RATIO EMPLOYMENT BENEFICIARIES
Construction 4.1 5.2% 21.3%Mining 3.8 0.1% 0.3%Admin. Support and 1.7 4.5% 7.7% Waste Management Educational Services 1.6 1.2% 1.9%Agriculture, Forestry, 1.5 3.2% 4.8% Fishing and Hunting Manufacturing 1.3 9.3% 12.5%Transp. and Warehousing 1.3 2.8% 3.7%Utilities 1.2 0.2% 0.2%Arts, Entertain. and Rec. 1.2 1.6% 1.9%Real Estate and 1.1 1.6% 1.8% Rental Leasing Wholesale Trade 1.0 4.2% 4.3%Prof. and Tech. Services 0.9 5.5% 5.1%Finance and Insurance 0.9 3.3% 2.9%Retail Trade 0.8 10.7% 8.7%Other Services 0.8 4.3% 3.3%Accom. and Food Svcs. 0.7 7.8% 5.8%Information 0.6 3.6% 2.2%Health Care and Social Asst. 0.6 11.3% 6.8%Government 0.1 18.5% 2.6% (excl. Education Svcs.) Mgmt. of Companies 0.1 1.1% 0.1% and Enterprises Information Not Available - - 2.0%TOTAL 100.0% 100.0%
Duration of Unemployment Benefits
Typically, individuals can receive regular1 benefits for up to 26 weeks in any 52-week benefit year. The 52-week benefit year begins upon application for unemployment benefits, and a person may have one or more episodes of unemployment during a single benefit year. When the year is up, the claim expires. However, because of the unusually steep labor market decline in the latest recession, additional weeks of unemployment benefits were made available to workers without a job after
using up their regular benefits. These claimants could receive an additional 53 weeks of emergency unemployment compensation and 20 weeks of extended benefits.
Duration of benefits refers to the number of weeks that benefits are paid. Exhibit 4-3 compares the duration of benefits in Washington state for those who were only receiving regular benefits (26 weeks) against the duration of all benefit entitlements (including the emergency and extended benefits). Duration for regular benefits reached a peak of 20.7 weeks in May 2010. The previous high of 19.5 weeks was recorded in December 2002. For all entitlements, a new high of 39.5 weeks was reached in August of 2010. The previous high of 27.8 weeks was in March 2003. Note that during times when extended or emergency benefits were available, the average duration for all entitlements peaked at a much higher level than for regular benefits.
Exhibit 4-3Duration of Unemployment Benefits by Month, Regular Benefits Compared to All Benefit EntitlementsWashington State, January 2000 to September 2010Source: ETA Monthly Program and Financial Data
Note: Shaded areas indicate recessions.
Long-Term Unemployment
Unemployed individuals exhaust their benefits when they have received all of their regular, emergency and extended unemployment payments. Exhibit 4-4 1 Because extended and emergency benefits are not ordinarily available, regular benefits
data are used to compare time periods. For this reason and because of the complexity associated with data based on changing policy and variable program entry and exit, the regular benefits data are commonly used.

152010 Washington State Labor Market and Economic Report
Chapter Four Unemployment
shows the number of regular benefits exhaustees by month for the past four years. Because extended and emergency benefits have not been consistently available, to allow for comparison over time, only regular benefits exhaustees are shown in Exhibit 4-4.
Reflecting the recent recession’s onset in December 2007, the level of regular benefits exhaustees began to inch up in late 2008 and remained at an elevated level in 2009. The downward trend of exhaustees in the second half of 2010 indicates a slowly-improving job market.
Exhibit 4-4Number of Regular Benefits Recipients Who Exhausted Their Unemployment Benefits, by MonthWashington State, January 2007 to September 2010Source: Unemployment Insurance Data Warehouse, Continued Claims Database
Exhibit 4-5 shows the 2010 monthly and cumulative total of exhaustions for Washington state since the implementation of emergency unemployment compensation in July 2008. Through October 2010, 25,041 people have used all of their unemployment benefits – regular, emergency and extended.
Exhibit 4-5Number of All Benefit Exhaustees Since Implementation of Emergency Unemployment CompensationWashington State, 2010Source: Unemployment Insurance Data Warehouse
MONTH MONTHLY TOTAL CUMULATIVE TOTAL
January 29 32February 1,403 1,435March 4,649 6,084April 2,755 8,839May 2,165 11,004June 2,078 13,082July 2,080 15,162August 3,158 18,320September 2,864 21,184October 3,857 25,041
Regular Benefits Exhaustions by Region, Industry and Occupation
In some cases, higher regular benefits exhaustion rates are associated with long-term unemployment conditions. Further analyzing the information presented in Exhibit 4-4 by area, industry and occupation can help to provide more information on those potentially facing long-term joblessness. Note that the data in this section are only available for regular unemployment beneficiaries.
0
5,000
10,000
15,000
20,000
Jan Feb Mar Apr May Jun Jul Aug Sep Oct Nov Dec
2007 2008 2009 2010
Regu
lar B
enef
its E
xhau
stee
s
Further analyzing information by area, industry and occupation can help to provide more information on those potentially facing long-term joblessness.
Pen by ©Janis Ozols/Dreamstime.com
16 2010 Washington State Labor Market and Economic Report
Unemployment Chapter Four
Using workforce development areas (WDA) as the geographic basis, Exhibit 4-6 shows that the exhaustion rate varied from a low of 34.6 percent in the North Central Washington WDA to a high of 50.7 percent in the Snohomish County WDA during the 2009 to 2010 period. Compared to last year, exhaustion rates rose in all WDAs. Exhibit 4-6Unemployment Exhaustions by Workforce Development Area, Regular BenefitsWashington State, October 2009 to September 2010Source: Unemployment Insurance Data Warehouse, Continued Claims Database
ANNUALWORKFORCE ANNUAL EXHAUSTIONS EXHAUSTIONDEVELOPMENT AREA (REGULAR BENEFITS) RATE
Benton-Franklin 3,667 35.1%Eastern Washington 2,627 42.9%North Central Washington/CB 5,286 34.6%Northwest Washington 8,205 45.2%Olympic Consortium 5,637 47.2%Pacific Mountain 9,847 45.4%Pierce County 18,464 49.9%Seattle-King County 42,119 50.5%Snohomish County 18,256 50.7%South Central Washington 6,408 35.5%Southwest Washington 9,610 48.9%Spokane County 9,926 46.9%Information Not Available 1 0.0%TOTAL 140,052 46.9%
Exhibit 4-7 reports the exhaustion rate by industry for the period between October 2009 and September 2010. Individuals in utilities had a particularly high exhaustion rate, and two-thirds of these beneficiaries used up all of their regular unemployment benefits. Most industries showed substantial increases in their exhaustion rate from last year.
Exhibit 4-7Unemployment Insurance Exhaustions by Industry, Regular ProgramWashington State, October 2009 to September 2010Source: Unemployment Insurance Data Warehouse, Continued Claims Database
ANNUALINDUSTRY ANNUAL EXHAUSTIONS EXHAUSTION(TWO-DIGIT NAICS) (REGULAR BENEFITS) RATE
Accom. and Food Services 6,609 42.3%Admin. Support and Waste Management 11,423 49.0%Agriculture, Forestry, Fishing and Hunting 3,570 28.2%Arts, Entertainment and Recreation 2,392 46.9%Construction 29,665 46.3%Educational Services 2,298 38.9%Finance and Insurance 5,542 58.9%Government (excl. Education Services) 3,498 49.0%Health Care and Social Assistance 8,405 47.9%Information 4,081 52.2%Manufacturing 19,135 44.8%Mgmt. of Companies and Enterprises 298 51.9%Mining 300 33.7%Other Services 4,870 54.8%Professional and Technical Services 8,391 50.9%Real Estate and Rental Leasing 2,930 57.8%Retail Trade 12,211 49.4%Transportation and Warehousing 4,245 38.4%Utilities 379 65.5%Wholesale Trade 6,868 51.5%Information Not Available 2,943 46.7%TOTAL 140,053 46.9%
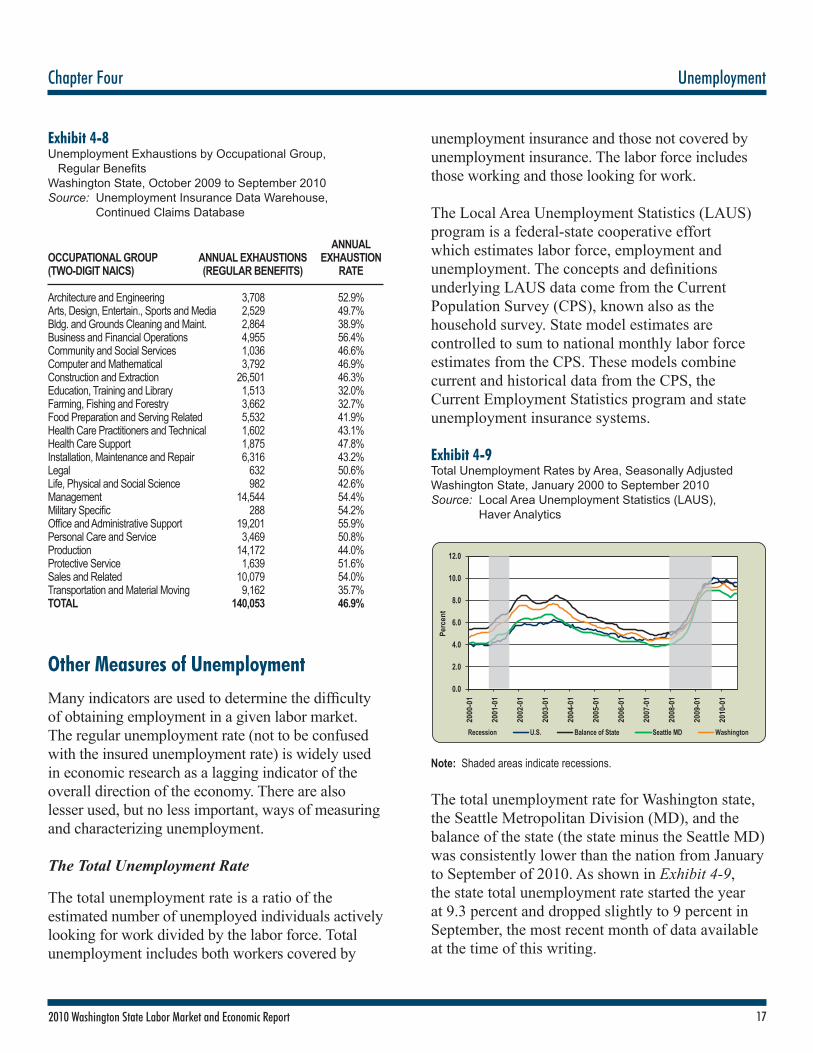
Exhibit 4-8 examines regular benefits exhaustions by occupation. It shows that there are nine occupations with exhaustion rates of more than 50 percent, meaning that persons in these occupations may be facing potentially long-term unemployment. Individuals in business and financial operations and in office and administrative support have particularly high exhaustion rates. Compared to a year ago, all of the occupational groups had higher exhaustion rates except for legal, and arts, design, entertainment, sports and media.
172010 Washington State Labor Market and Economic Report
Chapter Four Unemployment
Exhibit 4-8Unemployment Exhaustions by Occupational Group, Regular BenefitsWashington State, October 2009 to September 2010Source: Unemployment Insurance Data Warehouse, Continued Claims Database
ANNUALOCCUPATIONAL GROUP ANNUAL EXHAUSTIONS EXHAUSTION(TWO-DIGIT NAICS) (REGULAR BENEFITS) RATE
Architecture and Engineering 3,708 52.9%Arts, Design, Entertain., Sports and Media 2,529 49.7%Bldg. and Grounds Cleaning and Maint. 2,864 38.9%Business and Financial Operations 4,955 56.4%Community and Social Services 1,036 46.6%Computer and Mathematical 3,792 46.9%Construction and Extraction 26,501 46.3%Education, Training and Library 1,513 32.0%Farming, Fishing and Forestry 3,662 32.7%Food Preparation and Serving Related 5,532 41.9%Health Care Practitioners and Technical 1,602 43.1%Health Care Support 1,875 47.8%Installation, Maintenance and Repair 6,316 43.2%Legal 632 50.6%Life, Physical and Social Science 982 42.6%Management 14,544 54.4%Military Specific 288 54.2%Office and Administrative Support 19,201 55.9%Personal Care and Service 3,469 50.8%Production 14,172 44.0%Protective Service 1,639 51.6%Sales and Related 10,079 54.0%Transportation and Material Moving 9,162 35.7%TOTAL 140,053 46.9%
Other Measures of Unemployment
Many indicators are used to determine the difficulty of obtaining employment in a given labor market. The regular unemployment rate (not to be confused with the insured unemployment rate) is widely used in economic research as a lagging indicator of the overall direction of the economy. There are also lesser used, but no less important, ways of measuring and characterizing unemployment.
The Total Unemployment Rate
The total unemployment rate is a ratio of the estimated number of unemployed individuals actively looking for work divided by the labor force. Total unemployment includes both workers covered by
unemployment insurance and those not covered by unemployment insurance. The labor force includes those working and those looking for work.
The Local Area Unemployment Statistics (LAUS) program is a federal-state cooperative effort which estimates labor force, employment and unemployment. The concepts and definitions underlying LAUS data come from the Current Population Survey (CPS), known also as the household survey. State model estimates are controlled to sum to national monthly labor force estimates from the CPS. These models combine current and historical data from the CPS, the Current Employment Statistics program and state unemployment insurance systems.
Exhibit 4-9Total Unemployment Rates by Area, Seasonally AdjustedWashington State, January 2000 to September 2010Source: Local Area Unemployment Statistics (LAUS), Haver Analytics
Note: Shaded areas indicate recessions.
The total unemployment rate for Washington state, the Seattle Metropolitan Division (MD), and the balance of the state (the state minus the Seattle MD) was consistently lower than the nation from January to September of 2010. As shown in Exhibit 4-9, the state total unemployment rate started the year at 9.3 percent and dropped slightly to 9 percent in September, the most recent month of data available at the time of this writing.
0.0
2.0
4.0
6.0
8.0
10.0
12.0
2000
-01
2001
-01
2002
-01
2003
-01
2004
-01
2005
-01
2006
-01
2007
-01
2008
-01
2009
-01
2010
-01
Perc
ent
Recession U.S. Balance of State Seattle MD Washington

18 2010 Washington State Labor Market and Economic Report
Unemployment Chapter Four
The Seattle MD, which makes up about 40 percent of the state labor force, showed a decline in the total unemployment rate from 8.9 percent in January to 8.4 percent in May before rising again to 8.6 percent in September 2010. The statewide total unemployment rate and the balance of the state both show a gradual trend of lower rates for the last two quarters of 2010.
Labor Force Participation Rate
The labor force participation rate is the ratio of the labor force divided by the total population age 16 and older. A higher participation rate means that a higher percent of the population is either working or seeking work.
The Seattle MD posted a higher labor force participation rate compared to the state and balance of the state, estimated at 70.9 percent in September 2010 (Exhibit 4-10). The overall Washington participation rate in September was 67.3 percent, and the balance of the state was 65.2 percent.
The United States labor force participation rate (not shown) has mirrored the balance of state regarding trends through much of the year. The general trend saw both Seattle and the state’s labor participation rates rise, then decline toward the end of the year. However, the balance of state shows a rising trend, before a plateau in labor force participations after June 2010.
Exhibit 4-10Labor Force Participation Rate Over Time, Seasonally AdjustedWashington State, January 2000 to September 2009Source: Local Area Unemployment Statistics (LAUS), Haver Analytics
Note: Shaded areas indicate recessions.
Discouraged Workers
Discouraged workers are unemployed workers who have given up looking for work because they believe that they will not find a job. The term discouraged worker is often confused with the terms dislocated or displaced worker. The most important distinction is that the dislocated or displaced worker is considered part of the labor force because they are actively looking for work, while the discouraged worker is generally not. The Bureau of Labor Statistics provides data on Alternative Measures of Labor Underutilization for states, which measures total unemployment plus discouraged workers as part of the civilian labor force.
Washington has had a greater relative rise in the number of persons that have given up looking for work. This can be seen by comparing the four-quarter rolling averages for the period from the second quarter of 2009 to the first quarter of 2010 versus the third quarter of 2009 to the second quarter of 2010. Washington’s unemployment rate including discouraged workers has risen at a much higher rate compared to the nation (Exhibit 4-11).
58.060.062.064.066.068.070.072.074.0
Jan-
00Ju
l-00
Jan-
01Ju
l-01
Jan-
02Ju
l-02
Jan-
03Ju
l-03
Jan-
04Ju
l-04
Jan-
05Ju
l-05
Jan-
06Ju
l-06
Jan-
07Ju
l-07
Jan-
08Ju
l-08
Jan-
09Ju
l-09
Jan-
10Ju
l-10
Perc
ent
Balance of State Seattle MD Washington
Discouraged workers are unemployed workers who have given up looking for work because they believe that they will not find a job.
Photo by ©iStock/Sean Locke
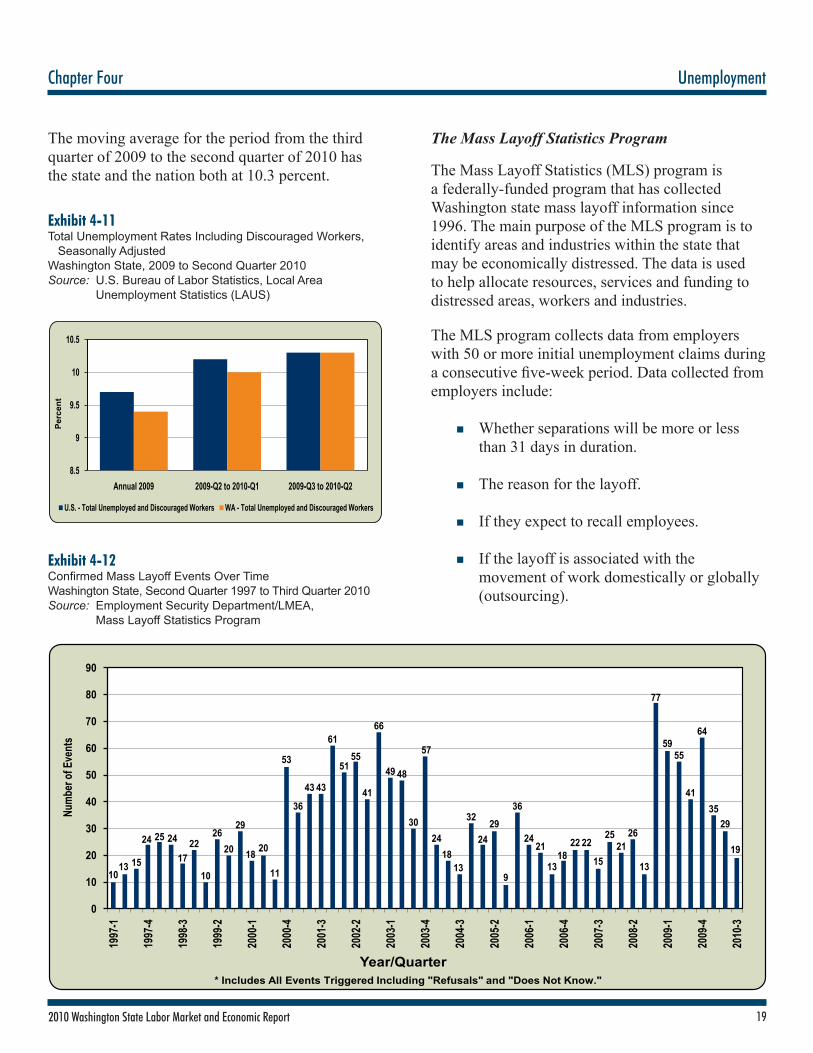
192010 Washington State Labor Market and Economic Report
Chapter Four Unemployment
8.5
9
9.5
10
10.5
Annual 2009 2009-Q2 to 2010-Q1 2009-Q3 to 2010-Q2
Perc
ent
U.S. - Total Unemployed and Discouraged Workers WA - Total Unemployed and Discouraged Workers
The moving average for the period from the third quarter of 2009 to the second quarter of 2010 has the state and the nation both at 10.3 percent.
Exhibit 4-11Total Unemployment Rates Including Discouraged Workers, Seasonally AdjustedWashington State, 2009 to Second Quarter 2010Source: U.S. Bureau of Labor Statistics, Local Area Unemployment Statistics (LAUS)
The Mass Layoff Statistics Program
The Mass Layoff Statistics (MLS) program is a federally-funded program that has collected Washington state mass layoff information since 1996. The main purpose of the MLS program is to identify areas and industries within the state that may be economically distressed. The data is used to help allocate resources, services and funding to distressed areas, workers and industries.
The MLS program collects data from employers with 50 or more initial unemployment claims during a consecutive five-week period. Data collected from employers include:
n Whether separations will be more or less than 31 days in duration.
n The reason for the layoff.
n If they expect to recall employees.
n If the layoff is associated with the
movement of work domestically or globally (outsourcing).
Exhibit 4-12Confirmed Mass Layoff Events Over TimeWashington State, Second Quarter 1997 to Third Quarter 2010Source: Employment Security Department/LMEA, Mass Layoff Statistics Program
Figure 20
1013 15
24 25 24
1722
10
2620
29
18 20
11
53
36
43 43
61
5155
41
66
49 48
30
57
2418
13
32
2429
9
36
2421
1318
22 22
15
2521
26
13
77
5955
41
64
3529
19
0
10
20
30
40
50
60
70
80
90
1997
-1
1997
-4
1998
-3
1999
-2
2000
-1
2000
-4
2001
-3
2002
-2
2003
-1
2003
-4
2004
-3
2005
-2
2006
-1
2006
-4
2007
-3
2008
-2
2009
-1
2009
-4
2010
-3
Numb
er of
Eve
nts
Year/Quarter* Includes All Events Triggered Including "Refusals" and "Does Not Know."

20 2010 Washington State Labor Market and Economic Report
Unemployment Chapter Four
Mass Layoffs in 2010
Mass layoff events have declined in the last year compared to the previous period, but are still about double what they were pre-recession. The number of separations associated with these events declined at a similar rate, but still are about 40 percent higher than what they were before the recession.
In the four most recent quarters, fourth quarter 2009 to third quarter 2010,2 Washington employers reported 147 mass layoff events that resulted in the separation of 14,078 workers from their jobs for at least 31 days. Compared to the previous year, there were 85 fewer mass layoff events, a 37 percent decline. Separations decreased by 41 percent over the same period (Exhibit 4-12).
Mass Layoffs by Industry
The data for the fourth quarter of 2008 to the third quarter of 2009 show the top industries reporting mass layoff events are in the manufacturing, construction, retail trade, and administrative and waste services industries. These industries ranked in the same order in terms of reported highest layoff events in the four previous quarters as well (Exhibit 4-13).
Exhibit 4-13Confirmed Mass Layoff Events by IndustryWashington State, Fourth Quarter 2009 to Third Quarter 2010Source: Employment Security Department/LMEA, Mass Layoff Statistics Program
The top industries reporting mass layoff events are in the manufacturing, construction, retail trade, and administrative and waste services industries.
Other Mass Layoff Trends
Between the fourth quarter of 2009 and the third quarter of 2010, there were 88 mass layoff events in which employers expected to recall some or all of their workers. In the same period last year, there were 29 mass layoff events in which employers expected to recall some or all of their workers.
From the fourth quarter of 2009 to the third quarter of 2010, there was one reported mass layoff that involved the movement of work within the same company or to a different company, whether domestic or outside of the United States. This was a marked decrease from the same period last year when six were reported.
Between the fourth quarter of 2009 and the third quarter of 2010, permanent worksite closures were reported in six mass layoff events. This is a decline from fourth quarter 2008 to third quarter 2009, when there were closures reported in 18 mass layoff events.
2 MLS data for third quarter of 2010 includes only July and August at the time of this report.
32%
21%14%
12%
5%
5%3%
2% 2% 2% 3% Industry
Manufacturing
Construction
Retail Trade
Administrative and Waste Services
Accommodation and Food Services
Transportation and Warehousing
Finance and Insurance
Information
Professional and Technical Services
Health Care and Social Assistance
All Other Industries
Photo by ©iStock/WendellandCarolyn

212010 Washington State Labor Market and Economic Report
Chapter Five Occupations After the Recession
Occupations After the RecessionThe labor market in recent years has become very dynamic, and with that has brought pressure from both the private and public sectors to track as accurately as possible occupational information in real time. Until a few years ago, the primary source of occupational data has been the Occupational Employment Statistics (OES) data series. The OES data series is collected twice each year and provides estimates of current and projected employment, openings and wages. Recently another source of occupational information has become available: Help Wanted OnLine1 (HWOL) advertisements. HWOL, in part, represents the labor market. Unemployment claims data2 can be seen as a partial measure reflecting the labor supply. Using these two sources together, unemployment claims data and HWOL, we can study the supply and demand in the labor market for a specific occupation in real time.
Both unemployment claims data and HWOL data have their weaknesses. For example, unemployment claims data do not represent total labor supply and HWOL data do not represent total labor demand. Some job seekers do not qualify for unemployment benefits (such as new employees or persons that have run out of benefits) and some may look for jobs in occupations different from the ones they claimed. At the same time, online job advertisers may not necessarily represent job openings (demand) for several reasons:
n Some advertisements are used for marketing purposes.
n Occasionally there is a need to fill a position, but inadequate resources to fill the position.
n Some jobs are not advertised online.
1 Background information and technical notes on this new data series are available online at: www.conference-board.org/economics/helpwantedonline.cfm. The underlying data for this series are provided by Wanted Technologies Corporation.
2 Unemployment claims data do not include emergency unemployment compensation or extended benefits. This exclusion allows for use of the unemployment claims data as a time series.
3 Continued claims data are completely additive between different levels of occupational and geographical aggregation. However, HWOL data are not additive between different occupational and area levels of aggregation. For occupational hierarchies, differences are relatively small for the two- and three-digit SOC levels. However, this difference is very large at the six-digit level. The sum of the six-digit occupational data are significantly larger than independently estimated totals and subtotals for two- and three-digit levels of aggregation. For example, the sum for counties could differ from the state total, and the sum for six-digit SOC occupations may not equal the sum for three-digit SOC occupations.
Developers of HWOL attempt to eliminate duplicate job announcements, but it is possible that some duplication remains. Occupational coding for HWOL is computer coded, while unemployment claimants are manually coded. There are probably a small number of advertisements and claims that would be mismatched in coding. An additional problem is that HWOL data are not additive between the detailed occupation level and the occupational group level.3
Despite the limitations, the unemployment claims data and HWOL data remain our best source for analyzing occupational supply and demand in real time. Exhibit 5-1 shows HWOL advertisements and unemployment claims data between May 2005 and September 2010. Notice that between May 2005 and December 2008 HWOL advertisements (demand) remained larger than unemployment claims (supply). Then in December of 2008, a year after the recession officially started, unemployment claims nudged ahead of HWOL advertisements. In March 2009 claims peaked at 171,982, while advertisements fell to a low of 73,736 creating a supply-demand spread of 98,246.
By October 2009, unemployment claims had dropped to 136,113 from what partially appears due to seasonal factors. Then claims rose again and by January 2010 reached 174,195. Since then, unemployment claims have fallen steadily and in June 2010 finally fell below HWOL advertisements. By September 2010 there were 95,379 unemployment claims and 118,804 HWOL advertisements.
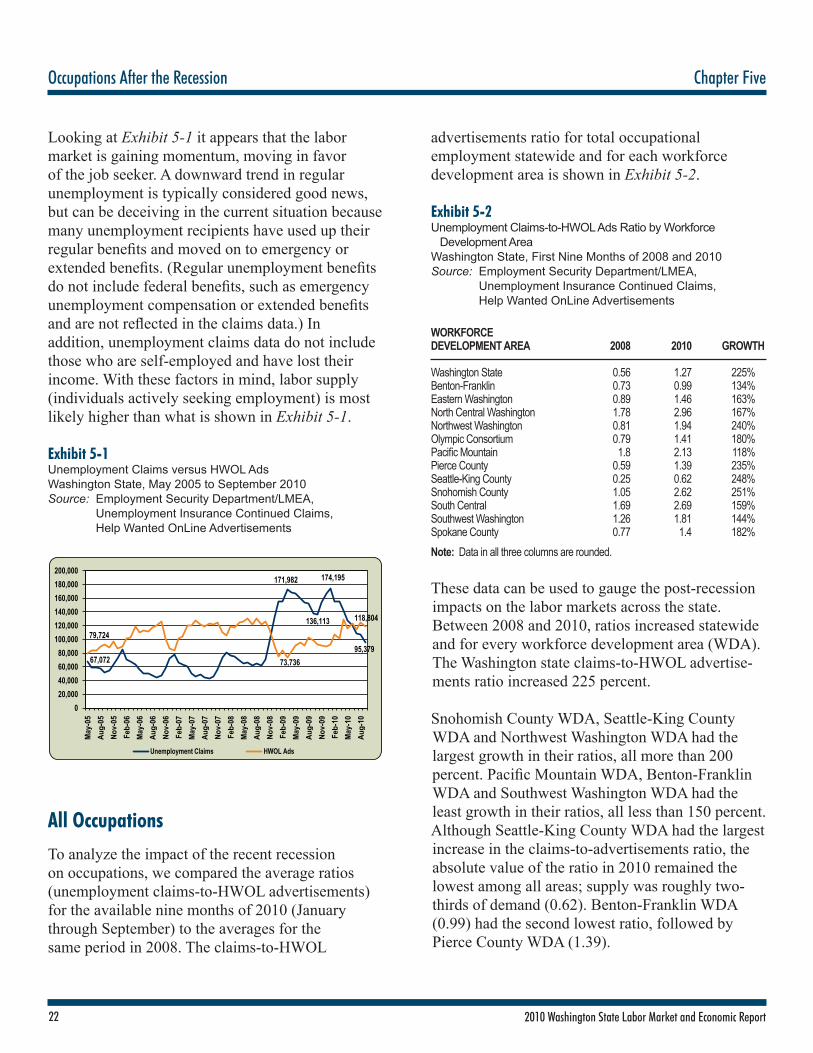
22 2010 Washington State Labor Market and Economic Report
Occupations After the Recession Chapter Five
Looking at Exhibit 5-1 it appears that the labor market is gaining momentum, moving in favor of the job seeker. A downward trend in regular unemployment is typically considered good news, but can be deceiving in the current situation because many unemployment recipients have used up their regular benefits and moved on to emergency or extended benefits. (Regular unemployment benefits do not include federal benefits, such as emergency unemployment compensation or extended benefits and are not reflected in the claims data.) In addition, unemployment claims data do not include those who are self-employed and have lost their income. With these factors in mind, labor supply (individuals actively seeking employment) is most likely higher than what is shown in Exhibit 5-1.
Exhibit 5-1Unemployment Claims versus HWOL AdsWashington State, May 2005 to September 2010Source: Employment Security Department/LMEA, Unemployment Insurance Continued Claims, Help Wanted OnLine Advertisements
All Occupations
To analyze the impact of the recent recession on occupations, we compared the average ratios (unemployment claims-to-HWOL advertisements) for the available nine months of 2010 (January through September) to the averages for the same period in 2008. The claims-to-HWOL
advertisements ratio for total occupational employment statewide and for each workforce development area is shown in Exhibit 5-2.
Exhibit 5-2Unemployment Claims-to-HWOL Ads Ratio by Workforce Development AreaWashington State, First Nine Months of 2008 and 2010Source: Employment Security Department/LMEA, Unemployment Insurance Continued Claims, Help Wanted OnLine Advertisements
WORKFORCE DEVELOPMENT AREA 2008 2010 GROWTH
Washington State 0.56 1.27 225%Benton-Franklin 0.73 0.99 134%Eastern Washington 0.89 1.46 163%North Central Washington 1.78 2.96 167%Northwest Washington 0.81 1.94 240%Olympic Consortium 0.79 1.41 180%Pacific Mountain 1.8 2.13 118%Pierce County 0.59 1.39 235%Seattle-King County 0.25 0.62 248%Snohomish County 1.05 2.62 251%South Central 1.69 2.69 159%Southwest Washington 1.26 1.81 144%Spokane County 0.77 1.4 182%Note: Data in all three columns are rounded.
These data can be used to gauge the post-recession impacts on the labor markets across the state. Between 2008 and 2010, ratios increased statewide and for every workforce development area (WDA). The Washington state claims-to-HWOL advertise-ments ratio increased 225 percent.
Snohomish County WDA, Seattle-King County WDA and Northwest Washington WDA had the largest growth in their ratios, all more than 200 percent. Pacific Mountain WDA, Benton-Franklin WDA and Southwest Washington WDA had the least growth in their ratios, all less than 150 percent.Although Seattle-King County WDA had the largest increase in the claims-to-advertisements ratio, the absolute value of the ratio in 2010 remained the lowest among all areas; supply was roughly two-thirds of demand (0.62). Benton-Franklin WDA (0.99) had the second lowest ratio, followed by Pierce County WDA (1.39).
67,072
171,982
136,113
174,195
95,37979,724
73,736
118,804
020,00040,00060,00080,000
100,000120,000140,000160,000180,000200,000
May
-05
Aug-
05No
v-05
Feb-
06M
ay-0
6Au
g-06
Nov-
06Fe
b-07
May
-07
Aug-
07No
v-07
Feb-
08M
ay-0
8Au
g-08
Nov-
08Fe
b-09
May
-09
Aug-
09No
v-09
Feb-
10M
ay-1
0Au
g-10
Unemployment Claims HWOL Ads

232010 Washington State Labor Market and Economic Report
Chapter Five Occupations After the Recession
Two-Digit SOC (Occupational Groups)
At the state two-digit level of occupational aggregation, the average claims-to-HWOL advertisements ratio grew for all occupational groups between 2008 and 2010 (Exhibit 5-3). Architecture and engineering had the most growth (439 percent) and sales and related had the least growth (140 percent). Looking at the absolute value of the ratio in 2010, farming, fishing and forestry had the largest value (28.65), and health care practitioners and technical had the smallest value (0.08).
Exhibit 5-3Unemployment Claims-to-HWOL Ads Ratio and Growth by Two-Digit Occupational GroupWashington State, First Nine Months of 2008 and 2010Source: Employment Security Department/LMEA, Unemployment Insurance Continued Claims, Help Wanted OnLine Advertisements
TWO-DIGIT 2001 2010SOC TWO-DIGIT TITLE RATIO RATIO GROWTH
11 Management 0.38 0.72 189%13 Business and Financial Operations 0.36 0.81 226%15 Computer and Mathematical 0.08 0.16 211%17 Architecture and Engineering 0.2 0.89 439%19 Life, Physical and Social Science 0.27 0.44 160%21 Community and Social Services 0.28 0.64 228%23 Legal 0.6 0.88 146%25 Education, Training and Library 0.52 0.82 158%27 Arts, Design, Entert., Sports and Media 0.4 0.74 187%29 Health Care Practitioners and Technical 0.03 0.08 255%31 Health Care Support 0.18 0.35 198%33 Protective Service 0.99 2.12 214%35 Food Preparation and Serving Related 0.75 1.83 243%37 Bldg. and Grounds Cleaning and Maint. 0.99 2.2 223%39 Personal Care and Service 0.75 1.57 208%41 Sales and Related 0.45 0.63 140%43 Office and Administrative Support 0.54 1.36 251%45 Farming, Fishing and Forestry 20.14 28.65 142%47 Construction and Extraction 7.2 17.92 249%49 Installation, Maintenance and Repair 1.13 2.72 241%51 Production 2.45 7.47 304%53 Transportation and Material Moving 1.77 3.82 215%
Based on employment size, construction and extraction and production occupations have been hardest hit by the latest recession. Exhibits 5-4 and 5-5 measure unemployment claims and HWOL advertisements for both occupations. Recently, unemployment claims have been falling
for both occupational groups while HWOL advertisements remain flat. Keep in mind, however, that unemployment claims data do not represent total labor supply and HWOL does not represent total labor demand. Despite these limitations, the unemployment claims data and HWOL data remain our best source for analyzing occupational supply and demand in real time.
Exhibit 5-4Unemployment Claims versus HWOL Ads for Construction and ExtractionWashington State, May 2005 to September 2010Source: Employment Security Department/LMEA, Unemployment Insurance Continued Claims, Help Wanted OnLine Advertisements
Exhibit 5-5Unemployment Claims versus HWOL Ads for ProductionWashington State, May 2005 to September 2010Source: Employment Security Department/LMEA, Unemployment Insurance Continued Claims, Help Wanted OnLine Advertisements
-5,000
10,000 15,000 20,000 25,000 30,000 35,000 40,000
May
-05
Aug-
05No
v-05
Feb-
06M
ay-0
6Au
g-06
Nov-
06Fe
b-07
May
-07
Aug-
07No
v-07
Feb-
08M
ay-0
8Au
g-08
Nov-
08Fe
b-09
May
-09
Aug-
09No
v-09
Feb-
10M
ay-1
0Au
g-10
Unemployment Claims HWOL Ads
-
5,000
10,000
15,000
20,000
25,000
30,000
May
-05
Aug-
05No
v-05
Feb-
06M
ay-0
6Au
g-06
Nov-
06Fe
b-07
May
-07
Aug-
07No
v-07
Feb-
08M
ay-0
8Au
g-08
Nov-
08Fe
b-09
May
-09
Aug-
09No
v-09
Feb-
10M
ay-1
0Au
g-10
Unemployment Claims HWOL Ads

24 2010 Washington State Labor Market and Economic Report
Occupations After the Recession Chapter Five
Six-Digit SOC (Detailed Occupations)
Every year, Employment Security’s Labor Market and Economic Analysis (LMEA) branch produces a Demand-Decline List for each of the state’s Workforce Development Councils. The councils own and maintain this list throughout the year. Knowing which occupations are in demand, and which are not, helps councils determine applicant eligibility for the state’s training benefits program. These lists can be found at: www.wilma.org/wdclists/.
To build the Demand-Decline List, LMEA uses six different occupational variables that are individually ranked and weighted:
n Occupational projections (40 percent weight)
n Results of the job vacancy survey (15 percent)
n Ratio of HWOL advertisements to estimated employment (15 percent)
n Ratio of unemployment claims to estimated employment (10 percent)
n Ratio of change in unemployment claims to estimated employment over the most recent five-year span (10 percent)
n Applicant placement ratio (10 percent)
Exhibits 5-6 and 5-7 show the state’s top 10 occupations and bottom 10 occupations from the 2010 Demand-Decline List. Almost all of the top 10 occupations are health care related, with the exception of computer software engineers, applications. Most of the demand occupations require some formal level of education with the exception of home health aides, which only requires short-term on-the-job training. The bottom 10 occupations all require short-, moderate- or long-term on-the-job training.
Exhibit 5-6Top Ten Occupations for 2010Washington State, 2010Source: Employment Security Department/LMEA, 2010 Demand-Decline List
SOC EDUCATIONCODE TITLE PREPARATION
291123 Physical Therapists Master’s Degree291111 Registered Nurses Associate Degree292011 Med. and Clinical Lab. Tech. Bachelor’s Degree292061 Lic. Practical and Lic. Voc. Nurses Postsecondary Voc. Trng.291051 Pharmacists First Professional Degree311011 Home Health Aides Short-Term On-the-Job Trng.191042 Med. Scientists, exc. Epidemiologists Doctoral Degree151031 Computer Software Eng., Apps. Bachelor’s Degree311012 Nursing Aides, Orderlies and Attends. Postsecondary Voc. Trng.291071 Physician Assistants Master’s Degree
Exhibit 5-7Bottom Ten Occupations for 2010Washington State, 2010Source: Employment Security Department/LMEA, 2010 Demand-Decline List
SOC EDUCATIONCODE TITLE PREPARATION
333011 Bailiffs Moderate-Term On-the-Job Trng.514071 Foundry Mold and Coremakers Moderate-Term On-the-Job Trng.532022 Airfield Operations Specialists Long-Term On-the-Job Trng.536011 Bridge and Lock Tenders Short-Term On-the-Job Trng.474021 Elevator Installers and Repairers Long-Term On-the-Job Trng.395093 Shampooers Short-Term On-the-Job Trng.516092 Fabric and Apparel Patternmakers Long-Term On-the-Job Trng.434021 Correspondence Clerks Short-Term On-the-Job Trng.514191 Heat Treating Equip. Setters, Oprs. Moderate-Term On-the-Job Trng. and Tenders, Metal and Plastic 514052 Pourers and Casters, Metal Moderate-Term On-the-Job Trng.
Using data pulled from the 2010 Demand-Decline list, Exhibit 5-8 compares HWOL advertisements and unemployment claims with educational preparation. Generally, the more education one has the more insulated one is from being laid off, with the exception of a bachelor’s degree. However, having a bachelor’s degree provides more job opportunities.

252010 Washington State Labor Market and Economic Report
Chapter Five Occupations After the Recession
Exhibit 5-8Unemployment Claims and HWOL Ads by Education LevelWashington State, October 2009 to September 2010Source: Employment Security Department/LMEA, Unemployment Insurance Continued Claims, Help Wanted OnLine Advertisements
Trends
For the most part, trends seen in unemployment claims-to-HWOL advertisements ratios are consistent with estimated industry employment trends. Occupations related to the health care industry are doing reasonably well. Based on occupational projections, all occupations in both the health care support and health care practitioners and technical occupational groups are expected to grow over the next 10 years,
except dentists, all other specialists. The computer and software development industry is another industry that is holding relatively strong. Based on projections, all the occupations in the computer and mathematical occupational group are expected to grow in the next 10 years, with the exception of actuaries, who are expected to remain stable.
In contrast, occupations related to both the construction and extraction and production (manufacturing) industries have been hit very hard by the recent recession. Only six of the 49 occupations that make up the construction and extraction occupational group are expected to grow over the next 10 years, while 27 of the 49 occupations are expected to decline. Based on occupational projections, 22 of the 82 occupations in the production occupational group are expected to grow over the next 10 years, while 43 of the 82 are expected to decline.
0 100,
000
200,
000
300,
000
400,
000
500,
000
600,
000
700,
000
Short-Term On-the-Job TrainingModerate-Term On-the-Job Training
Long-Term On-the-Job TrainingWork Experience in a Related Occupation
Postsecondary Vocational AwardAssociate Degree
Bachelor's DegreeBachelor's or Higher Degree, Plus Work Experience
Master's DegreeDoctoral Degree
First Professional Degree
Unemployment Claims HWOL Ads
Occupations related to the health care industry are doing reasonably well and expected to grow over the next 10 years.
Photo by ©iStock/Joshua Hodge

26 2010 Washington State Labor Market and Economic Report
Occupations After the Recession Chapter Five

272010 Washington State Labor Market and Economic Report
Chapter Six Washington Industry and Employment Projections 2008 to 2018
Washington Industry and Employment Projections 2008 to 2018Industry and occupational employment projections are used by policy makers, business planners, job seekers and economic analysts. Producing accurate employment projections at the state and regional levels in a rapidly changing economy is a challenging task.
Currently, industry forecasts are produced for two, five and 10 years into the future. The occupational staffing pattern for each industry is used to convert the industry projections into occupational projections.
Occupational projections show how many job openings are expected due to occupational employment changes and replacement needs.1 Replacement includes openings created by retirement and separation for other reasons. It does not include the normal turnover in each occupation as workers go from one employer to another or from one area to another without changing their occupations. Total openings from occupational projections do not represent the total demand, but can be used as an indicator of the demand. Data are presented for occupations with an estimated 10 or more jobs for all workforce development areas.
Industry Projections Results
Washington state is projected to add 278,700 nonfarm jobs between 2008 and 2018, with an average annual growth rate of 0.9 percent. At this growth rate, Washington total nonfarm industry employment is projected to reach 3,237,300 jobs in 2018 (Exhibit 6-1).
To accurately compare national and statewide structural changes in long-term industry employment projections, we removed logging employment from nonfarm employment for Washington. Logging is not part of total nonfarm employment in national projections, but is typically included in Washington projections.
2,958,6003,013,500
3,237,300
2,800,0002,850,0002,900,0002,950,0003,000,0003,050,0003,100,0003,150,0003,200,0003,250,0003,300,000
2008 2013 2018
Non
farm
Empl
oym
ent
Exhibit 6-1Nonfarm Industry Employment Projections 2008 to 2018Washington State, 2008 to 2018Source: Employment Security Department/LMEA
Exhibit 6-2 shows the statewide employment estimations for 2008, and base and projected industry structure for the state and the nation. Industry structure is a way of breaking down total employment proportionately for each industry.
By 2018, significant increases in both state and national employment shares are expected to be in education and health services, and for professional and business services. The largest decreases in employment shares are projected for manufacturing.
Except for construction, changes in industry structure for the state and the nation are quite similar. National projections anticipate slight decreases in employment share for information, while state projections call for an increase.
Employment in the construction industry for the state is expected to drop by 1.1 percent, while it is expected to increase by 0.4 percent for the nation. However, the statewide employment share for construction in 2008 was significantly higher in the state than it was for the nation. Even after these projected changes, the employment share of
1 The calculated number of total openings for aggregated occupations represents the totals for detailed occupations. As a result, the aggregated level of total openings might not equal the total of growth plus replacement.

28 2010 Washington State Labor Market and Economic Report
Washington Industry and Employment Projections 2008 to 2018 Chapter Six
the state’s construction industry is expected to be slightly larger than for the nation. Also, it should be noted that according to preliminary estimations for 2009, the national employment share for the construction industry dropped by 0.6 percent to 4.6 percent. The drop for the state was about two times larger, 1.1 percent, to 5.7 percent.2
The recent recession had a significant impact on long-term growth rates and, generally speaking, put growth rates below historical levels. This is true for all areas except the South Central Workforce Development Area (WDA), which projects a modest annual average growth rate of 0.9 percent; 0.2 percent larger than the average rate for the previous 10 years. A map of Washington’s workforce development areas is on page 51.
Employment in the Benton-Franklin WDA is expected to grow at a rate of 1.8 percent, more than any other area in the state. Benton-Franklin WDA had the highest growth rate in the previous 10 years and projected growth is 1.1 percent less than its historical rate.
Snohomish County WDA, Seattle-King County WDA and North Central Washington WDA, each have projected growth rates of about 0.8 percent. The Pacific Mountain WDA is projected to have the slowest employment growth rate at 0.6 percent.
Forecasted growth rates for all of these workforce development areas are significantly lower than comparable rates for the previous 10 years, except for the Seattle-King County WDA, which is about the same as the historical rate. The forecasted average annual growth rate for Washington state of 0.9 percent is about 0.4 percent lower than the estimated growth rate for the previous 10 years.
Occupational Projections Results
Exhibit 6-3 compares occupational employment estimates and long-term projections at the state and national levels.
Structural changes in occupational employment are expected to be consistent between the state and the nation. The largest increases in employment shares are expected to be in health care practitioners and technical occupations for both the state and the nation. 2 National employment projections use historical data up to the year 2008, while state
projections use three quarters of reported covered employment for the year 2009.
Exhibit 6-2Base and Projected Statewide and National Structure of Industry EmploymentUnited States and Washington State, 2008 to 2018Source: Employment Security Department/LMEA, U.S. Bureau of Labor Statistics
WASHINGTON STATE UNITED STATES PERCENT OF PERCENT OF PERCENT OF PERCENT OF PERCENT OF ESTIMATED TOTAL TOTAL TOTAL TOTAL EMPLOYMENT EMPLOYMENT EMPLOYMENT EMPLOYMENT EMPLOYMENTSECTORS 2008 (SHARES) IN 2008 (SHARES) IN 2018 (SHARES) IN 2008 (SHARES) IN 2018
Mining 2,900 0.1% 0.1% 0.5% 0.4%Construction 200,300 6.8% 5.7% 5.2% 5.6%Manufacturing 291,100 9.9% 8.4% 9.7% 8.0%Wholesale Trade 130,100 4.4% 4.5% 4.3% 4.1%Retail Trade 327,400 11.1% 10.5% 11.1% 10.5%Transporation, Warehousing and Utilities 95,900 3.2% 3.1% 3.7% 3.6%Information 105,500 3.6% 3.8% 2.2% 2.0%Financial Activities 152,100 5.1% 4.6% 5.9% 5.7%Professional and Business Services 348,800 11.8% 13.7% 12.9% 14.4%Education and Health Services 362,300 12.3% 14.4% 13.7% 15.5%Leisure and Hospitality 283,600 9.6% 9.7% 9.8% 9.6%Other Services 107,500 3.6% 3.4% 4.6% 4.7%Government 546,500 18.5% 18.1% 16.3% 15.9%
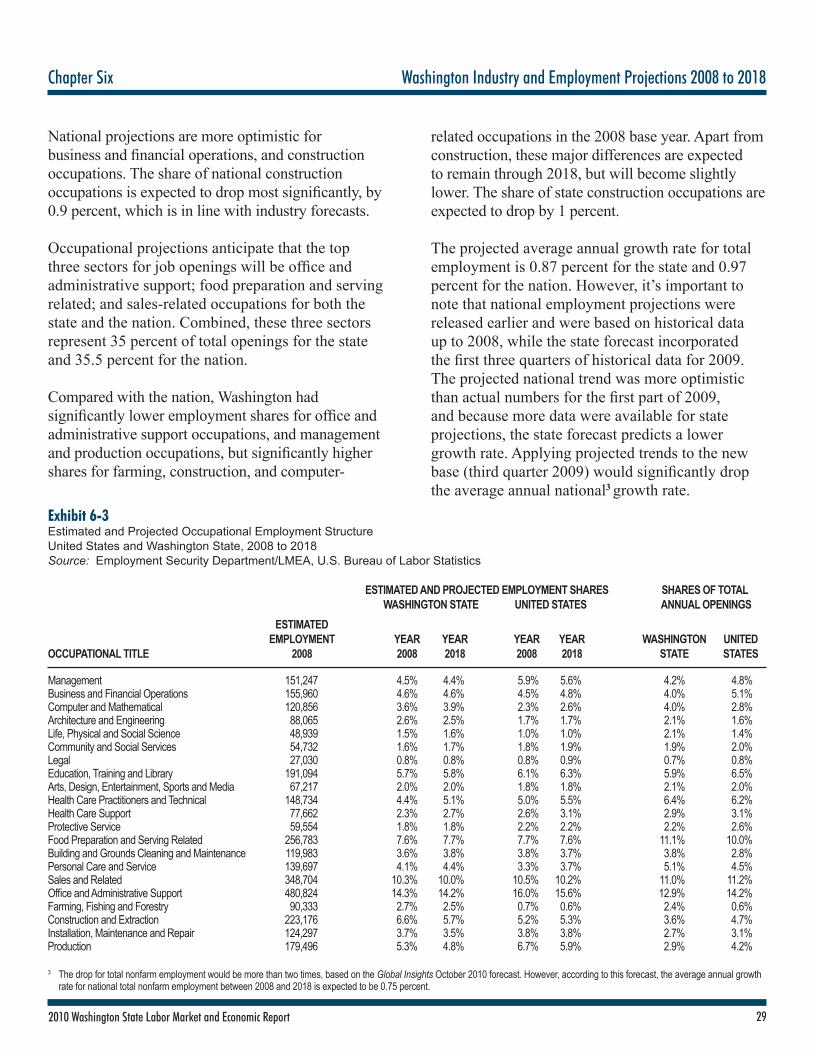
292010 Washington State Labor Market and Economic Report
Chapter Six Washington Industry and Employment Projections 2008 to 2018
National projections are more optimistic for business and financial operations, and construction occupations. The share of national construction occupations is expected to drop most significantly, by 0.9 percent, which is in line with industry forecasts.
Occupational projections anticipate that the top three sectors for job openings will be office and administrative support; food preparation and serving related; and sales-related occupations for both the state and the nation. Combined, these three sectors represent 35 percent of total openings for the state and 35.5 percent for the nation.
Compared with the nation, Washington had significantly lower employment shares for office and administrative support occupations, and management and production occupations, but significantly higher shares for farming, construction, and computer-
Exhibit 6-3Estimated and Projected Occupational Employment StructureUnited States and Washington State, 2008 to 2018Source: Employment Security Department/LMEA, U.S. Bureau of Labor Statistics
ESTIMATED AND PROJECTED EMPLOYMENT SHARES SHARES OF TOTAL WASHINGTON STATE UNITED STATES ANNUAL OPENINGS ESTIMATED EMPLOYMENT YEAR YEAR YEAR YEAR WASHINGTON UNITEDOCCUPATIONAL TITLE 2008 2008 2018 2008 2018 STATE STATES
Management 151,247 4.5% 4.4% 5.9% 5.6% 4.2% 4.8%Business and Financial Operations 155,960 4.6% 4.6% 4.5% 4.8% 4.0% 5.1%Computer and Mathematical 120,856 3.6% 3.9% 2.3% 2.6% 4.0% 2.8%Architecture and Engineering 88,065 2.6% 2.5% 1.7% 1.7% 2.1% 1.6%Life, Physical and Social Science 48,939 1.5% 1.6% 1.0% 1.0% 2.1% 1.4%Community and Social Services 54,732 1.6% 1.7% 1.8% 1.9% 1.9% 2.0%Legal 27,030 0.8% 0.8% 0.8% 0.9% 0.7% 0.8%Education, Training and Library 191,094 5.7% 5.8% 6.1% 6.3% 5.9% 6.5%Arts, Design, Entertainment, Sports and Media 67,217 2.0% 2.0% 1.8% 1.8% 2.1% 2.0%Health Care Practitioners and Technical 148,734 4.4% 5.1% 5.0% 5.5% 6.4% 6.2%Health Care Support 77,662 2.3% 2.7% 2.6% 3.1% 2.9% 3.1%Protective Service 59,554 1.8% 1.8% 2.2% 2.2% 2.2% 2.6%Food Preparation and Serving Related 256,783 7.6% 7.7% 7.7% 7.6% 11.1% 10.0%Building and Grounds Cleaning and Maintenance 119,983 3.6% 3.8% 3.8% 3.7% 3.8% 2.8%Personal Care and Service 139,697 4.1% 4.4% 3.3% 3.7% 5.1% 4.5%Sales and Related 348,704 10.3% 10.0% 10.5% 10.2% 11.0% 11.2%Office and Administrative Support 480,824 14.3% 14.2% 16.0% 15.6% 12.9% 14.2%Farming, Fishing and Forestry 90,333 2.7% 2.5% 0.7% 0.6% 2.4% 0.6%Construction and Extraction 223,176 6.6% 5.7% 5.2% 5.3% 3.6% 4.7%Installation, Maintenance and Repair 124,297 3.7% 3.5% 3.8% 3.8% 2.7% 3.1%Production 179,496 5.3% 4.8% 6.7% 5.9% 2.9% 4.2%
related occupations in the 2008 base year. Apart from construction, these major differences are expected to remain through 2018, but will become slightly lower. The share of state construction occupations are expected to drop by 1 percent.
The projected average annual growth rate for total employment is 0.87 percent for the state and 0.97 percent for the nation. However, it’s important to note that national employment projections were released earlier and were based on historical data up to 2008, while the state forecast incorporated the first three quarters of historical data for 2009. The projected national trend was more optimistic than actual numbers for the first part of 2009, and because more data were available for state projections, the state forecast predicts a lower growth rate. Applying projected trends to the new base (third quarter 2009) would significantly drop the average annual national3 growth rate.
3 The drop for total nonfarm employment would be more than two times, based on the Global Insights October 2010 forecast. However, according to this forecast, the average annual growth rate for national total nonfarm employment between 2008 and 2018 is expected to be 0.75 percent.

30 2010 Washington State Labor Market and Economic Report
Washington Industry and Employment Projections 2008 to 2018 Chapter Six
Twelve of the 22 state occupational groups have projected growth rates higher than the average, and 10 have lower than average projected growth rates. The projected fastest growing groups are in the two health-related occupational groups, and computer and mathematical occupations. The two slowest-growth occupational groups are expected to be construction and production.
The projected average annual growth rates for the major occupational groups in Washington are presented in Exhibit 6-4.
Detailed Occupations
The top 20 occupations by total average annual openings are presented in Exhibit 6-5.
Exhibit 6-4Average Annual Projected Growth Rates for Occupational GroupsWashington State, 2008 to 2018Source: Employment Security Department/LMEA
-1.0% -0.5% 0.0% 0.5% 1.0% 1.5% 2.0% 2.5% 3.0%
Construction and ExtractionProduction
Farming, Fishing and Forestry Installation, Maintenance and Repair
Architecture and Engineering Sales and Related
Transportation and Material Moving Management
Business and Financial Operations Office and Administrative Support
Total of All Occupational Groups Arts, Design, Entertainment, Sports and Media
Legal Food Preparation and Serving Related
Protective Service Education, Training and Library
Personal Care and Service Community and Social Services
Life, Physical and Social Science Building and Grounds Cleaning and Maintenance
Computer and Mathematical Health Care Practitioners and Technical
Health Care Support
4 Due to the reason explained in the technical appendix of our article www.workforceexplorer.com/admin/uploadedPublications/10516_Projections_
June_10.pdf, the numbers of openings due to replacement are not additive between different levels of aggregation.
Retail salespersons and cashiers are the top two occupations by total openings. Projections for 2018 show 73 percent of openings are due to replacement and 27 percent due to growth.4 The number of openings due to growth is larger than the number of openings due to replacement for only two occupations: registered nurses, and landscaping and groundskeeping workers. For all other occupations shown, the number of openings due to replacement is greater than the number of openings due to growth.
Occupations with the largest projected increase in employment are presented in Exhibit 6-6. The 20 occupations in Exhibit 6-6 represent more than 40 percent of all projected growth to 2018. Registered nurses are projected to have the largest increase in employment, adding 16,659 jobs by 2018.

312010 Washington State Labor Market and Economic Report
Chapter Six Washington Industry and Employment Projections 2008 to 2018
Exhibit 6-6Occupations with the Largest Projected Increases in EmploymentWashington State, 2008 to 2018Source: Employment Security Department/LMEA
0 500 1,000 1,500 2,000 2,500 3,000 3,500 4,000
Landscaping and Groundskeeping WorkersElementary School Teachers, exc. Special Education
Sales Rep., Whsl. and Manuf., exc. Tech. and Scient. Prods.Receptionists and Information Clerks
Stock Clerks and Order FillersTeacher Assistants
Maids and Housekeeping CleanersPersonal and Home Care Aides
Customer Service RepresentativesOffice Clerks, General
Child Care WorkersJanitors/Cleaners, exc. Maids and Housekeeping Cleaners
Counter Attend., Cafeteria, Food Conc. and Coffee ShopLaborers and Freight, Stock and Material Movers, Hand
Agricultural Workers, All OtherCombined Food Prep. and Serving Workers, incl. Fast Food
Registered NursesWaiters and Waitresses
CashiersRetail Salespersons
Openings due to Growth Openings due to Replacements
3,9003,9113,9254,0574,2944,4794,5194,8154,8984,9835,236
5,7525,898
6,4646,815
7,3557,4347,730
9,12516,659
0 5,000 10,000 15,000 20,000
Receptionists and Information ClerksComputer Software Engineers, Systems Software
Customer Service RepresentativesTeacher Assistants
Network Systems and Data Communications AnalystsMedical Secretaries
Maids and Housekeeping CleanersNursing Aides, Orderlies and Attendants
Waiters and WaitressesChild Care Workers
Computer Software Engineers, ApplicationsLaborers and Freight, Stock and Material Movers, Hand
Office Clerks, GeneralHome Health Aides
Landscaping and Groundskeeping WorkersRetail Salespersons
Janitors and Cleaners, exc. Maids and Housekeeping CleanersCombined Food Prep. and Serving Workers, incl. Fast Food
Personal and Home Care AidesRegistered Nurses
Exhibit 6-5Top 20 Occupations by Total OpeningsWashington State, 2008 to 2018Source: Employment Security Department/LMEA

32 2010 Washington State Labor Market and Economic Report
Washington Industry and Employment Projections 2008 to 2018 Chapter Six
Education and Wages
All occupations were divided into four educational categories:
n Bachelor’s degree or higher
n AA degree, postsecondary training, or long-term on-the-job training
n Moderate on-the-job training
n Short-term on-the-job training (short demonstration up to one month)
For all areas, higher education levels5 are associated with higher wages.6 Exhibit 6-7 shows average employment and wage estimations for the state by education level. The largest increase is expected for occupations requiring a bachelor’s degree or higher, which is projected to increase about 11.9 percent, or about 90,500 jobs, from 2008 to 2018.
In 2008, more than half of the jobs in Washington were in occupations that did not require formal education beyond high school. While workers in these occupations held the largest share of jobs in 2008, their share of jobs is expected to slightly decline from 51.8 percent in 2008 to 51.5 percent in 2018 (Exhibit 6-8).
Occupations requiring an associate degree made up 25.7 percent of occupational employment in 2008 and are expected to remain stable, dropping by only 0.3 percent by 2018.
23.1%
25.4%16.3%
35.2%
2018
Bachelor's Degree or HigherAA Degree, Postsecondary Training, or Long-Term On-the-Job TrainingModerate On-the-Job Training (1-12 Months)Short-Term On-the-Job Training (Short Demonstration up to One Month)
22.5%
25.7%16.9%
34.9%
2008
Occupations requiring short-term on-the-job training are projected to account for the largest portion of 2008 to 2018 total job growth. However, this group is projected to have lower growth rates than occupations which require a bachelor’s degree or higher.
Exhibit 6-8Employment Share by Educational LevelWashington State, 2008 and 2018Source: Employment Security Department/LMEA
5 The education categories for specific occupations are an aggregated version of education clusters from the Occupational Outlook Handbook, Bureau of Labor Statistics. They are estimates of typical preparation levels required for the occupation. Only occupations for which educational codes and wages are identified are included in the calculations.
6 Wages are not part of the occupational projections. Source data for wages come from the Occupational Employment Statistics (OES) survey and are subject to restrictions and limitations of the survey. Agricultural employment is excluded except for agricultural services. Self-employment and private households are not included in the survey. All wage estimations are adjusted as of March 2010. More information regarding OES programs can be found online at: www.workforceexplorer.com/cgi/databrowsing/?PAGEID=164.
Exhibit 6-7Employment and Wages by Educational LevelWashington State, 2008 to 2018Source: Employment Security Department/LMEA, U.S. Bureau of Labor Statistics
AVERAGE AVERAGE AVERAGE ANNUAL ESTIMATED ANNUAL ANNUAL WAGESEDUCATION LEVEL EMPLOYMENT GROWTH RATE TOTAL OPENINGS (ESTIMATED FOR 2008 2008 TO 2018 2008 TO 2018 MARCH 2010)
Bachelor’s Degree or Higher 758,248 1.13% 25,626 $79,785AA Degree, Postsecondary Training or Long-Term On-the-Job Training 866,362 0.73% 25,451 $54,175Moderate On-the-Job Training (1-12 months) 569,902 0.50% 14,493 $38,869Short-Term On-the-Job Training (Short Demonstration up to One Month) 1,174,949 0.97% 45,877 $27,901

332010 Washington State Labor Market and Economic Report
Chapter Six Washington Industry and Employment Projections 2008 to 2018
90,493
65,170
29,153
119,591 11.9%
7.5%
5.1%
10.2%
0%2%4%6%8%10%12%14%
-20,000 40,000 60,000 80,000
100,000 120,000 140,000
Bachelor's Degree or Higher
AA Degree, Postsecondary
Training, or Long-Term On-the-Job
Training
Moderate On-the-Job
Training (1-12 Months)
Short-Term On-the-Job
Training (Short Demonstration up
to One Month)
2008 to 2018 Employment Growth Growth Rate
Grow
th R
ate
2008
to20
18 E
mpl
oym
ent G
rowt
h
$79,785
$54,175
$38,869 $27,901
1.1%
0.7%
0.5%
1.0%
0.0%
0.2%
0.4%
0.6%
0.8%
1.0%
1.2%
$-$10,000 $20,000 $30,000 $40,000 $50,000 $60,000 $70,000 $80,000 $90,000
Bachelor's Degree or Higher
AA Degree, Postsecondary
Training, or Long-Term On-the-Job
Training
Moderate On-the-Job
Training (1-12 Months)
Short-Term On-the-Job
Training (Short Demonstration up
to One Month)Average Annual Wage Average Annual Growth Rate
Aver
age
Annu
al W
age
Aver
age
Annu
al G
rowt
h Ra
te
As shown in Exhibit 6-9, occupations requiring the most education and the least education are projected to grow faster than the state average of 9 percent over the projection period. They will also have the largest increase in the numbers of new jobs (90,493 for a bachelor’s degree or higher and 119,591 for short-term on-the-job training).
Exhibit 6-9Employment Growth by Educational LevelWashington State, 2008 to 2018Source: Employment Security Department/LMEA
Estimated wages and average annual growth rates by education level are presented in Exhibit 6-10.
At the state level, wages increase the most with the transition from an associate degree to a bachelor’s degree, from $54,175 annually to $79,785 annually, a gain of $25,610. The same is true for all WDAs with an average gain of $21,407. The wage gain from moderate on-the-job training to an associate degree for the state is $15,306 and averages $13,009 for all WDAs. The wage gain from short-term on-the-job training to moderate on-the-job training is $10,968 for the state and $10,137 on average for all WDAs.
Exhibit 6-10Average Annual Growth Rates by Education LevelWashington State, 2008 to 2018Source: Employment Security Department/LMEA
Uses and Limitations of Occupational Projections
Employment growth and indicators should be used cautiously in developing long-term education programs. As educators target occupations showing a shortage, there is a higher probability that this will cause an oversupply of workers in those occupations. For long-term planning, a general education with transferable knowledge and skills may be more beneficial than training for a specific occupation.
Our projections provide a general outlook for industries and occupations in Washington. While not the whole employment picture, our projections do provide helpful information about Washington’s industry and occupational future. When making decisions about future employment, you should not limit your research to one information source.
The details of methods and the data used to produce industry and occupational projections can be found online at: www.workforceexplorer.com/article.asp?PAGEID=94&SUBID=149&ARTICLEID=10335
34 2010 Washington State Labor Market and Economic Report
Washington Industry and Employment Projections 2008 to 2018 Chapter Six
Detailed Employment Projections can be Found Online:
Medium- and long-term industry projections:www.workforceexplorer.com/admin/uploadedPublications/5004_indlongp.xls
Short-term industry projections:www.workforceexplorer.com/admin/uploadedPublications/5003_indshortp.xls
Industry control total files:www.workforceexplorer.com/admin/uploadedPublications/4957_ictall.xls
Medium- and long-term industry control totals:www.workforceexplorer.com/admin/uploadedPublications/1608_long.xls
Short-term industry control totals:www.workforceexplorer.com/admin/uploadedPublications/1609_short.xls
Combined occupational projections:www.workforceexplorer.com/admin/uploadedPublications/4960_alloccupproj.xls
Medium- and long-term occupational projections:www.workforceexplorer.com/admin/uploadedPublications/1647_longoccupt.xls
Short-term occupational projections:www.workforceexplorer.com/admin/uploadedPublications/1646_shortoccupt.xls
Staffing patterns used for employment estimates and projections:www.workforceexplorer.com/admin/uploadedPublications/10336_occup-indmatrix10.xls
Full report on employment projections, methodology and results:www.workforceexplorer.com/admin/uploadedPublications/10516_Projections_June_10.pdf
Due to confidentiality requirements, staffing patterns for some industries are not published.

352010 Washington State Labor Market and Economic Report
Chapter Seven Washington Wages and Income, 2009
Washington Wages and Income, 2009
Highlights
n As the recession deepened in 2009, it took its toll on Washington households. Median incomes declined, poverty rates rose, and the number of low-income households increased by 7 percent. More families turned to public assistance to make ends meet, and nearly half of all households met the housing stress definition of 30 percent or more of income used for housing costs.
n Most families rely on wages from a job for their income. Job losses and cutbacks in the workweek predominantly affected low-wage jobs and thus lower-income families. More than half of the jobs that disappeared paid less than $14 per hour, well below the median wage. There was a small increase in the number of jobs paying more than $40 per hour.
n The unexpected outcome of the loss of low-wage jobs was an increase in the median and average wage, as the jobs that were remaining had a higher average. The job losses in 2009 wiped out most of the jobs created in the 2002 to 2008 recovery that paid less than $30 per hour. As a result, job growth over the decade was concentrated in higher-wage jobs, and wage inequality increased.
n Wage progression – the median increase in hourly wages for full-time workers – was somewhat more robust in the 2004 to 2009 period compared with 2003 to 2008, but smaller than any five-year period in the 1990s. Unfortunately, the increase was probably due to lower-wage workers who lost their jobs.
n A high percentage of workers suffered a decline in wages over the 2004 to 2009 time span, but not as many as in 2003 to 2008.
n Per capita income in 2009 declined by 2 percent, the largest drop since 1970. Earned income and investment income fell, but transfer payments, especially unemployment benefits and food stamps, grew dramatically.
All data in this chapter have been adjusted for inflation to 2009 constant dollars, with the exception of personal income data at the county level, where the latest year of data is for 2008.1
Household and Family Income
Most households rely on wages for their income, though some also depend on Social Security and other government payments, and some receive income from investments.
Not surprisingly, household and family incomes did not hold up well in the recession. Median household income in the state fell 2.8 percent, while median family income dropped by 3.2 percent – not as much as the nation2 but that was small comfort. The poverty rate increased a full point to 12.3 percent. The percentage of children in poverty rose even more, climbing to 16.2 percent. The poverty rate for children under the age of five was even greater at 18.1 percent. There were fewer households with earnings from a job, more relying on food stamps and welfare (Exhibit 7-1).
1 The U.S. Implicit Price Deflator for Personal Consumption Expenditures was used to adjust for inflation. Other sources sometimes use the Consumer Price Index (CPI), but many economists believe that in the past, the CPI overstated inflation. Using different deflators can lead to different conclusions about wage trends.
2 As measured by the American Community Survey (ACS), which is a rolling survey throughout the year. The annual Current Population Survey from March 2009 showed a smaller decline (-0.7 percent) than the ACS.

36 2010 Washington State Labor Market and Economic Report
Washington Wages and Income, 2009 Chapter Seven
Exhibit 7-1The Recession Takes its TollWashington State, 2008 to 2009Source: American Community Survey
CHANGEHOUSEHOLDS AND INCOME 2008 2009 FROM 2008
Median household income $56,548 $56,548 -3%Median family income $70,638 $68,360 -3%Households with income 153,277 163,435 7% less than $10,000 Poverty rate 11.3% 12.3% +1 pointPoverty rate, children under 5 17.1% 18.1% +1 pointPercent of households receiving 8.7% 11.1% +2.4 points food stamps Residents without health insurance NA 13.4% NARenters paying more than 30 percent 48.0% 50.1% +2.1 points of their income for housing Homeowners paying more than 30 33.6% 24.7% +0.4 points percent of their income for housing
Exhibit 7-2Change in Households by Income RangeWashington State, 2008 to 2009Source: American Community Survey
INCOME 2008 2009 CHANGE FROM 2008
Less than $10,000 153,277 163,435 10,158 7%$10,000 to $14,999 108,448 113,886 5,438 5%$15,000 to $24,999 225,392 245,047 19,655 9%$25,000 to $34,999 246,304 250,550 4,246 2%$35,000 to $49,999 358,542 362,401 3,859 1%$50,000 to $74,999 500,847 492,340 -8,507 -2%$75,000 to $99,999 356,549 348,523 -8,026 -2%$100,000 to $149,999 363,632 359,576 -4,056 -1%$150,000 to $199,999 122,138 124,468 2,330 2%$200,000 or more 112,534 99,062 -13,472 -12%
The economic situation for people of color is often much worse than for the general population. To take just one dimension, the median income for Latino families is barely half (56 percent) of that of white non-Latino families, while the median for African American families is 62 percent of that of white non-Latino families. American Indians and Alaskan Natives averaged 69 percent of white non-Latino families.
Housing experts consider a household to be under economic stress if housing-related costs3 take up 30 percent or more of household income. By that measure, 50 percent of renters were feeling the squeeze, up from 48 percent in 2008 and 42 percent in 1999. They were joined by 34 percent of homeowners, only slightly higher than in 2008, but up from 26 percent in 1999. Nearly 1 million homeowners and renters, comprising 39 percent of all households, were in financial distress due to high housing costs.
Average Annual Wages
Most jobs in the state of Washington are covered by unemployment insurance. In 2009, monthly covered employment averaged over 2.8 million jobs, with a total payroll of $135 billion, both lower than the 2008 figures. The average annual wage, derived by dividing payroll by employment, was $47,458, up 1.7 percent from 2008 and the highest on record. Annual wages were relatively flat from 1999 to 2005, rose over the next two years, leveled off as the recession took hold in 2008 before jumping again in 2009, as shown in Exhibits 7-3 and 7-4.
Exhibit 7-3Average Annual Wage, Adjusted for InflationWashington State, 1987 to 2009Source: Employment Security Department/LMEA
3 Housing costs for homeowners include mortgages, real estate taxes, various insurances, utilities, fuels, mobile home costs, and condominium fees. For renters, they include rent, utilities, and heating fuel costs.
$0$5,000
$10,000$15,000$20,000$25,000$30,000$35,000$40,000$45,000$50,000
1987 1989 1991 1993 1995 1997 1999 2001 2003 2005 2007 2009
Average Annual Wage Increases in 2009
All Counties Excluding King
Aver
age A
nnua
l Wag
e
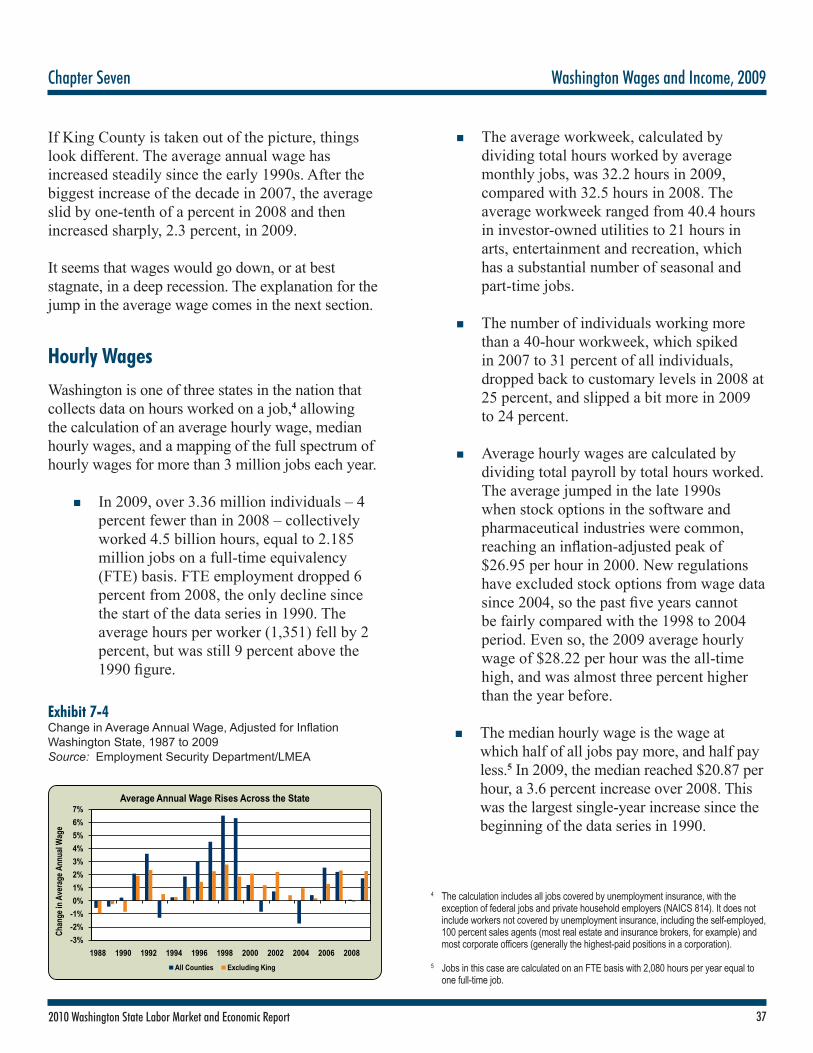
372010 Washington State Labor Market and Economic Report
Chapter Seven Washington Wages and Income, 2009
If King County is taken out of the picture, things look different. The average annual wage has increased steadily since the early 1990s. After the biggest increase of the decade in 2007, the average slid by one-tenth of a percent in 2008 and then increased sharply, 2.3 percent, in 2009.
It seems that wages would go down, or at best stagnate, in a deep recession. The explanation for the jump in the average wage comes in the next section.
Hourly Wages
Washington is one of three states in the nation that collects data on hours worked on a job,4 allowing the calculation of an average hourly wage, median hourly wages, and a mapping of the full spectrum of hourly wages for more than 3 million jobs each year.
n In 2009, over 3.36 million individuals – 4 percent fewer than in 2008 – collectively worked 4.5 billion hours, equal to 2.185 million jobs on a full-time equivalency (FTE) basis. FTE employment dropped 6 percent from 2008, the only decline since the start of the data series in 1990. The average hours per worker (1,351) fell by 2 percent, but was still 9 percent above the 1990 figure.
Exhibit 7-4Change in Average Annual Wage, Adjusted for InflationWashington State, 1987 to 2009Source: Employment Security Department/LMEA
n The average workweek, calculated by dividing total hours worked by average monthly jobs, was 32.2 hours in 2009, compared with 32.5 hours in 2008. The average workweek ranged from 40.4 hours in investor-owned utilities to 21 hours in arts, entertainment and recreation, which has a substantial number of seasonal and part-time jobs.
n The number of individuals working more than a 40-hour workweek, which spiked in 2007 to 31 percent of all individuals, dropped back to customary levels in 2008 at 25 percent, and slipped a bit more in 2009 to 24 percent.
n Average hourly wages are calculated by dividing total payroll by total hours worked. The average jumped in the late 1990s when stock options in the software and pharmaceutical industries were common, reaching an inflation-adjusted peak of $26.95 per hour in 2000. New regulations have excluded stock options from wage data since 2004, so the past five years cannot be fairly compared with the 1998 to 2004 period. Even so, the 2009 average hourly wage of $28.22 per hour was the all-time high, and was almost three percent higher than the year before.
n The median hourly wage is the wage at
which half of all jobs pay more, and half pay less.5 In 2009, the median reached $20.87 per hour, a 3.6 percent increase over 2008. This was the largest single-year increase since the beginning of the data series in 1990.
4 The calculation includes all jobs covered by unemployment insurance, with the exception of federal jobs and private household employers (NAICS 814). It does not include workers not covered by unemployment insurance, including the self-employed, 100 percent sales agents (most real estate and insurance brokers, for example) and most corporate officers (generally the highest-paid positions in a corporation).
5 Jobs in this case are calculated on an FTE basis with 2,080 hours per year equal to one full-time job.
-3%-2%-1%0%1%2%3%4%5%6%7%
1988 1990 1992 1994 1996 1998 2000 2002 2004 2006 2008
Chan
ge in
Ave
rage
Ann
ual W
age
Average Annual Wage Rises Across the State
All Counties Excluding King

38 2010 Washington State Labor Market and Economic Report
Washington Wages and Income, 2009 Chapter Seven
n The median wage increased by 22 percent from 1990 to 2009, considerably less than the average wage (35 percent) over that same period, reflecting the growing inequity in wages.
n The average hourly wage was 23 percent above the median in 1990, before rising to 42 percent in 2000 (when stock options were included in wages), and has been close to 35 percent higher than the median for the past seven years.
Exhibit 7-5Average Hourly Wage and Median Hourly Wage, Adjusted for InflationWashington State, 1990 to 2009Source: Employment Security Department/LMEA
Wage Distribution
Wage records include all jobs covered by unemployment insurance. Most corporate officers (usually the best-compensated employees) opt out of coverage, so the data on wage distribution presented here do not include the highest wage earners. Stock options were excluded from the reporting system after 2004; the 1998 to 2001 period was especially influenced by their inclusion, as wages at the top ballooned with the stock market bubble.
In 2009, the lowest-paid 10 percent of jobs averaged $8.89 per hour, 33 cents (3.8 percent) above the 2008 average after adjustment for inflation (Exhibit 7-6). The best-paid 10 percent of jobs averaged $86.14 per hour, $1.38 per hour more than in the previous year. This amounted to a 1.6 percent increase. For the deciles in between the top and bottom, the average wage increased between 2.4 percent (for the second-lowest decile) and 4 percent for the deciles above the median. Clearly, the increase in the minimum wage provided a supporting floor at the bottom of the wage spectrum.
Since 1990, the state has gone through three recessions, with two intervening periods of relatively low unemployment. As a result, wage growth has gone through three distinct periods, and a fourth may have started in 2009, as shown in Exhibit 7-7.
n In the 1990 to 1996 period, wages for the bottom 70 percent of jobs grew slowly
(1 to 3 percent), with the exception of the bottom 10 percent of jobs, which suffered a 3 percent decline. Wages in the second and third deciles from the top grew a bit more rapidly, while the average wage for the top decile of jobs rose by 20 percent. Outside of King County, the same pattern held but was muted somewhat at the top, with the average for the top 10 percent increasing by 11 percent.
n After 1996, there were broad-based wage gains through 2001 that tapered off over the next two years. Wages for the middle 80 percent of jobs climbed by about
15 percent. At the bottom, average hourly pay surged by 24 percent but not as much as the top tier, where the average jumped by 29 percent. Outside of King County, the pattern was similar but wage hikes were generally smaller. The middle 80 percent of jobs was up by about 10 percent, and the top decile by 15 percent. Only the jobs at the bottom, boosted initially by tight labor markets
$0.00
$5.00
$10.00
$15.00
$20.00
$25.00
$30.00
1990 1992 1994 1996 1998 2000 2002 2004 2006 2008
Hour
ly W
age
Median and Average Hourly Wages Rise During Recession
Average Median
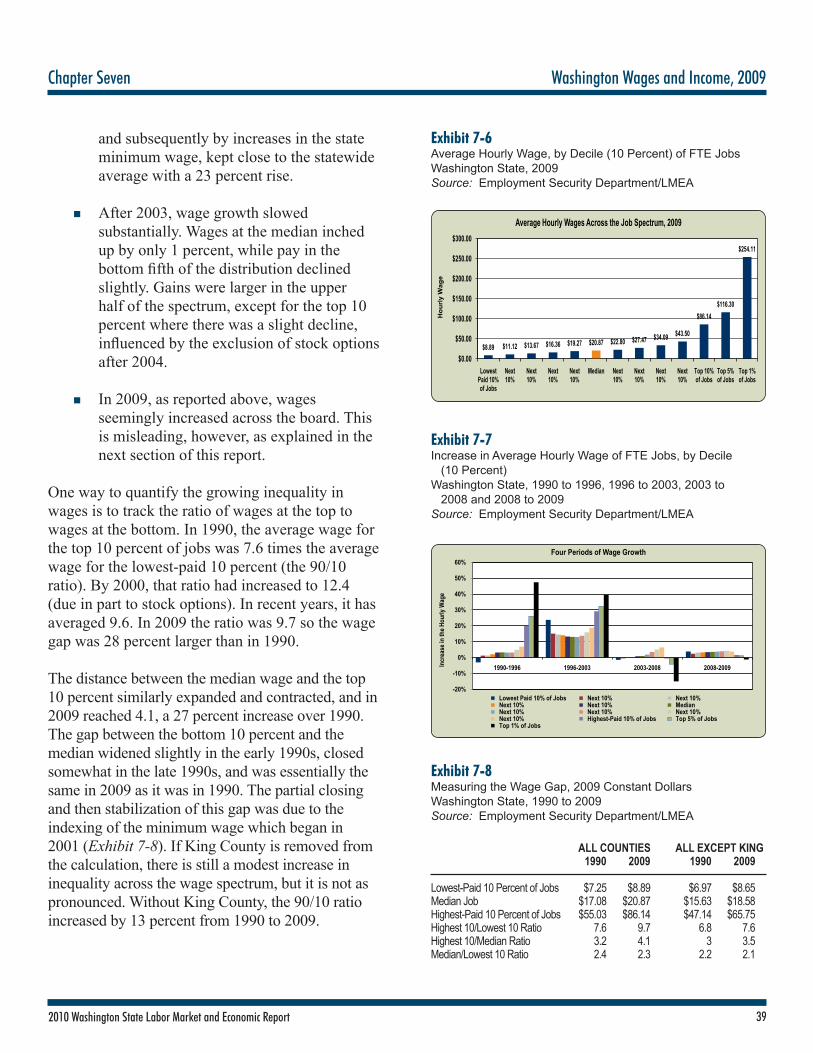
392010 Washington State Labor Market and Economic Report
Chapter Seven Washington Wages and Income, 2009
and subsequently by increases in the state minimum wage, kept close to the statewide average with a 23 percent rise.
n After 2003, wage growth slowed substantially. Wages at the median inched up by only 1 percent, while pay in the bottom fifth of the distribution declined slightly. Gains were larger in the upper half of the spectrum, except for the top 10 percent where there was a slight decline, influenced by the exclusion of stock options after 2004.
n In 2009, as reported above, wages seemingly increased across the board. This is misleading, however, as explained in the next section of this report.
One way to quantify the growing inequality in wages is to track the ratio of wages at the top to wages at the bottom. In 1990, the average wage for the top 10 percent of jobs was 7.6 times the average wage for the lowest-paid 10 percent (the 90/10 ratio). By 2000, that ratio had increased to 12.4 (due in part to stock options). In recent years, it has averaged 9.6. In 2009 the ratio was 9.7 so the wage gap was 28 percent larger than in 1990.
The distance between the median wage and the top 10 percent similarly expanded and contracted, and in 2009 reached 4.1, a 27 percent increase over 1990. The gap between the bottom 10 percent and the median widened slightly in the early 1990s, closed somewhat in the late 1990s, and was essentially the same in 2009 as it was in 1990. The partial closing and then stabilization of this gap was due to the indexing of the minimum wage which began in 2001 (Exhibit 7-8). If King County is removed from the calculation, there is still a modest increase in inequality across the wage spectrum, but it is not as pronounced. Without King County, the 90/10 ratio increased by 13 percent from 1990 to 2009.
Exhibit 7-6Average Hourly Wage, by Decile (10 Percent) of FTE JobsWashington State, 2009Source: Employment Security Department/LMEA
Exhibit 7-7Increase in Average Hourly Wage of FTE Jobs, by Decile (10 Percent) Washington State, 1990 to 1996, 1996 to 2003, 2003 to 2008 and 2008 to 2009Source: Employment Security Department/LMEA
Exhibit 7-8Measuring the Wage Gap, 2009 Constant DollarsWashington State, 1990 to 2009Source: Employment Security Department/LMEA
ALL COUNTIES ALL EXCEPT KING 1990 2009 1990 2009
Lowest-Paid 10 Percent of Jobs $7.25 $8.89 $6.97 $8.65 Median Job $17.08 $20.87 $15.63 $18.58 Highest-Paid 10 Percent of Jobs $55.03 $86.14 $47.14 $65.75 Highest 10/Lowest 10 Ratio 7.6 9.7 6.8 7.6Highest 10/Median Ratio 3.2 4.1 3 3.5Median/Lowest 10 Ratio 2.4 2.3 2.2 2.1
$8.89 $11.12 $13.67 $16.36 $19.27 $20.87 $22.80 $27.47 $34.09 $43.50
$86.14$116.30
$254.11
$0.00
$50.00
$100.00
$150.00
$200.00
$250.00
$300.00
Lowest Paid 10% of Jobs
Next 10%
Next 10%
Next 10%
Next 10%
Median Next 10%
Next 10%
Next 10%
Next 10%
Top 10% of Jobs
Top 5% of Jobs
Top 1% of Jobs
Hou
rly W
age
Average Hourly Wages Across the Job Spectrum, 2009
-20%
-10%
0%
10%
20%
30%
40%
50%
60%
1990-1996 1996-2003 2003-2008 2008-2009Incr
ease
in th
e Hou
rly W
age
Four Periods of Wage Growth
Lowest Paid 10% of Jobs Next 10% Next 10%Next 10% Next 10% MedianNext 10% Next 10% Next 10%Next 10% Highest-Paid 10% of Jobs Top 5% of JobsTop 1% of Jobs

40 2010 Washington State Labor Market and Economic Report
Washington Wages and Income, 2009 Chapter Seven
The Impact of the Great Recession
The standard measures of wages – average annual wage, average hourly wage, median hourly wage – all increased in 2009. The median hourly wage had its biggest jump in the past two decades. The average annual wage outside of King County rose at the fourth-fastest rate in the past 25 years. Why did these measures all go up in the middle of the worst recession of our lifetime? The next section explains.
Wages by Wage Range
The answer comes if we look at the number of jobs within a range of hourly wages. In 2009, almost 216,000 jobs (10 percent of the total) paid less than $10 per hour. Another 190,000 jobs (9 percent) paid between $10 and $11.99 per hour. Exhibit 7-9 shows the full distribution of jobs for 2002, 2008 and 2009, with the last three ranges having a wider span ($30 to $39.99, $40 to $49.99 and $50 per hour and above).
Exhibit 7-9Full-time Equivalent Jobs by Hourly Wage Washington State, 2002, 2008 and 2009Source: Employment Security Department/LMEA
From 2002 to 2008, the number of jobs increased in every wage range, but the change was smaller in the middle of the wage span. As Exhibit 7-10 shows, net new jobs were mostly at the upper end and lower end. FTE employment as a whole grew by 15 percent over the six-year period. The number
of jobs paying less than $30 per hour grew by only 9 percent, however, and jobs in the middle of the spectrum (around $20 per hour) grew by 8 percent. Meanwhile the number of jobs paying $50 or more per hour grew by 39 percent.
Exhibit 7-10Change in FTE Jobs by Hourly Wage Washington State, 2002 to 2008 and 2008 to 2009Source: Employment Security Department/LMEA
The recession wreaked havoc on lower-wage jobs, wiping out most of the job growth in the 2002 to 2008 period for jobs paying less than $30 per hour. Twenty-three percent of the job loss was in jobs paying less than $10 per hour, 14 percent paid between $10 and $12, another 14 percent between $12 and $14. More than half of the lost jobs, then, paid less than $14. Collectively, these jobs made up only 28 percent of the 2008 jobs base. On the other end of the spectrum, the number of jobs paying $40 per hour or more increased in 2009.
Ironically, the heavy loss of low-wage jobs pushed up the median and average hourly wage. It wasn’t that there was a wealth of new high-wage jobs; it was that the jobs remaining had a higher average wage.
These findings dovetail with research from the Center for Labor Market Studies at Northeastern University, which found that unemployment fell disproportionately on lower-income households.6
0
50,000
100,000
150,000
200,000
250,000
300,000
Less Than $10
$10to
$12
$12to
$14
$14to
$16
$16to
$18
$18to
$20
$20to
$22
$22to
$24
$24to
$26
$26to
$28
$28to
$30
$30to
$40
$40to
$50
$50and
Above
Num
ber o
f FTE
Job
s
Hourly Wage Range
FTE Jobs by Wage Range
2002 2008 2009
6 www.clms.neu.edu/publication/documents/Labor_Underutilization_Problems_of_U.pdf, page 13b.
-40,000
-20,000
0
20,000
40,000
60,000
80,000
Less Than $10
$10 to
$12
$12 to
$14
$14 to
$16
$16 to
$18
$18 to
$20
$20 to
$22
$22 to
$24
$24 to
$26
$26 to
$28
$28 to
$30
$30 to
$40
$40 to
$50
$50 and
Above
Chan
ge in
Num
ber o
f FTE
Job
s
Hourly Wage Range
Recession Wipes Out Jobs on Lower End, Leaving Net New Jobs Mostly on the Upper End
2002-08 2008-09

412010 Washington State Labor Market and Economic Report
Chapter Seven Washington Wages and Income, 2009
The report’s subtitle says it all, “A truly great depression among the nation’s low income workers amidst full employment among the most affluent.”
Wages by Area
Hourly wages vary widely across the state. In 2009, King County once again had the highest median wage in the state at $25.08. Only two other counties, Snohomish and Benton, were above the state median. Excluding King County, the rest of the state had a median hourly wage of $18.58. Okanogan had by far the lowest median hourly wage at $12.27. Of the 18 lowest-wage counties, 17 were located east of the Cascades.
Median wages rose in all but three of Washington’s 39 counties in 2009. Benton County had the largest increase (+$1.46, 7.2 percent), while Pend Oreille had the largest decline (-27 cents, -1.4 percent).
Since 1990, the state median hourly wage has increased by 22 percent after adjustment for inflation. Some observations:
n Columbia County’s median increased by 61 percent due to the loss of low-wage agricultural processing jobs following the closure of a large packing operation several years ago.
n King County’s median hourly wage has increased by 32 percent, driven by wage
increases in software and aerospace industries. n Ferry County was the only county with a
lower median wage in 2009 ($16.42) than 1990 ($16.76).
Exhibit 7-11Median Hourly Wage by CountyWashington State, 2009Source: Employment Security Department/LMEA
Wage Progression for Full-Time Workers
The preceding sections looked at jobs; this section looks at individual workers. Of the 3.4 million individuals who were employed in the state at some point in 2009, 31 percent worked at least 2,000 hours, the equivalent of working full time for 50 weeks. Half worked at least 1,560 hours, the equivalent of working full time for nine months of the year. About 22 percent worked fewer than 520 hours, the equivalent of working full time for three months of the year.
For the purpose of this report anyone who worked at least 1,560 hours or more in a year, or an average of 30 hours per week, is considered a full-time worker. A comparison of 2004 and 2009 shows that 21 percent
$0.00 $5.00 $10.00 $15.00 $20.00 $25.00 $30.00
OkanoganYakima
DouglasChelan
GrantAdams
FranklinPacificAsotin
GarfieldWalla Walla
FerryKittitasLincoln
SkamaniaKlickitat
ColumbiaClallamMasonLewis
StevensGrays Harbor
IslandSpokane
JeffersonWhatcom
SkagitWahkiakum
State except KingKitsap
WhitmanCowlitz
Pend OreilleClark
San JuanPierce
ThurstonState
BentonSnohomish
King
Median Hourly Wage, 2009
From Okanogan to King County

42 2010 Washington State Labor Market and Economic Report
Washington Wages and Income, 2009 Chapter Seven
of the full-time workers in 2009 were not in the 2004 database (the same as for the 2003 to 2008 time span). Similarly, 19 percent of the full-time workers from 2004 were not employed in Washington in 2009. Just short of one million workers were full time in both 2004 and 2009. Half of these workers had a pay increase of $2.38 or more per hour. Seventy-four percent of full-time workers had higher wages in 2009, while 26 percent suffered a decline in hourly pay.
The median pay increase over the five-year period could be thought of as a measure of the “wage ladder” for the average worker. The percentage of workers whose hourly pay declined encountered a broken rung on the ladder and slipped downward.
How does the 2004 to 2009 wage ladder compare with the past? To add some context, the median hourly earnings and full-time workers were calculated for each five-year time span starting in 1990. The results are shown in Exhibit 7-12.
Exhibit 7-12Median Increase in Hourly Wage for Full-Time Workers Washington State, Over Five-Year SpansSource: Employment Security Department/LMEA
Exhibit 7-12 shows that the median wage increase for full-time workers in the 2004 to 2009 time span was higher than in the past three five-year spans, but lower than any time period before that. In other words, the 2004 to 2009 wage ladder was shorter than most years in the past, but slightly taller than in the past three years. This small increase, as Exhibit 7-13
shows, can be attributed to the disproportionate loss of lower-wage jobs, which have smaller wage increases. The wage ladder shrunk for all wage groups after the 1997 to 2002 period, until the latest period in which it increased for those earning $24 or more per hour. But a comparison of 1990 to 1995 with 2004 to 2009 shows that the wage ladder was shorter for workers earning less than $24 per hour, and was taller for those earning more than $24 per hour.
The percentage of full-time workers with a lower hourly wage in 2009 than in 2004 was 26 percent, 2 percent below the 2003 to 2008 figure. The percentage of workers earning $24 per hour or more in the base year who suffered a decline in wages was about the same for 2003 to 2008 and 2004 to 2009. The percentage of workers earning less than $24 per hour in the base year that suffered a decline in hourly wages was 3 percent lower in 2004 to 2009 than 2003 to 2008. A possible explanation is that lower-wage workers who would have suffered a cut in pay instead lost their job – pushing a measure in the opposite direction than expected during a recession.
In 2004, there were more than 40,000 individuals working full time who earned less than $10 per hour. Five years later, three-fourths of those individuals were earning less than $14 per hour and a little less than one quarter, 23 percent, earned more than $14 per hour (Exhibits 7-13 and 7-14).
Exhibit 7-13Median Increase in Hourly Wages by Wage Range in Base YearWashington State, Over Five-Year SpansSource: Employment Security Department/LMEA
$0.00$0.50$1.00$1.50$2.00$2.50$3.00$3.50$4.00$4.50
1990 to
1995
1991 to
1996
1992 to
1997
1993 to
1998
1994 to
1999
1995 to
2000
1996 to
2001
1997 to
2002
1998 to
2003
1999 to
2004
2000 to
2005
2001 to
2006
2002 to
2007
2003 to
2008
2004 to
2009
Med
ian
Incr
ease
in H
ourly
Wag
e fo
r Fu
ll-Ti
me
Wor
kers
The Shrinking Wage Ladder
$0.00
$1.00
$2.00
$3.00
$4.00
$5.00
$6.00
1990 to
1995
1991 to
1996
1992 to
1997
1993 to
1998
1994 to
1999
1995 to
2000
1996 to
2001
1997 to
2002
1998 to
2003
1999 to
2004
2000 to
2005
2001 to
2006
2002 to
2007
2003 to
2008
2004 to
2009
Med
ian
Incr
ease
in H
ourly
Wag
e fo
r Fu
ll-Ti
me
Wor
kers
Hourly Wage Increase by Wage Range
All Workers Less Than $12 in Base Year More Than $24 in Base Year
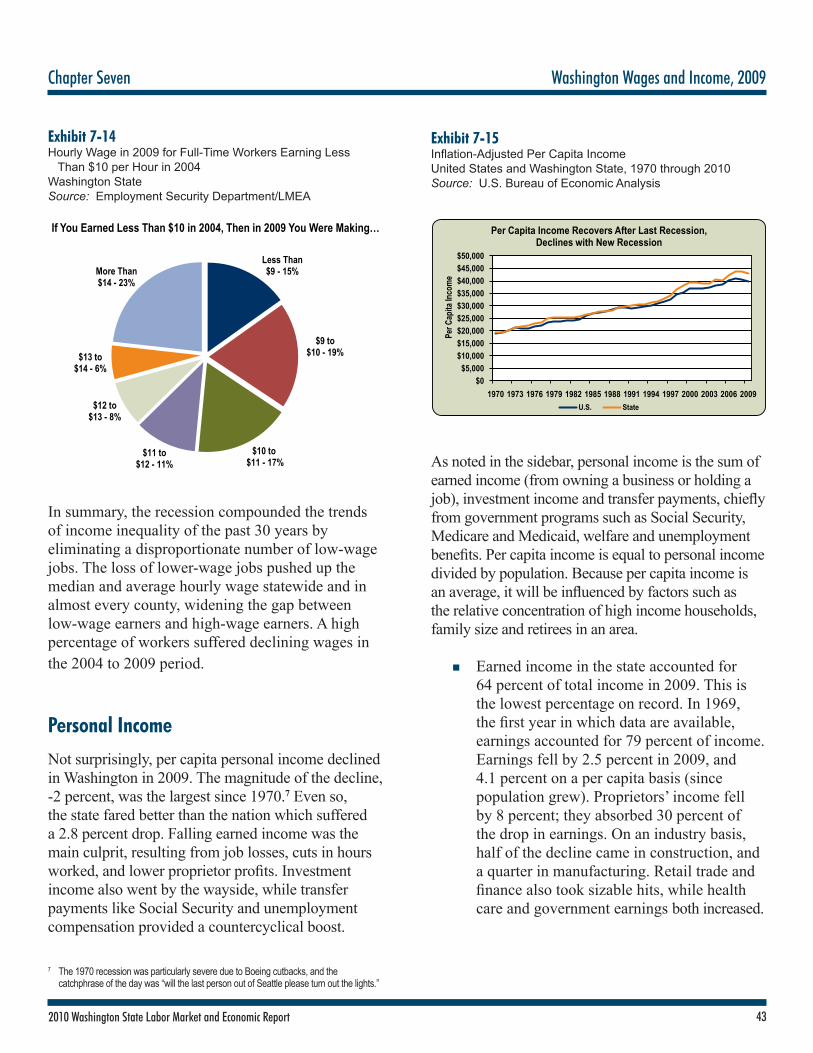
432010 Washington State Labor Market and Economic Report
Chapter Seven Washington Wages and Income, 2009
Exhibit 7-14Hourly Wage in 2009 for Full-Time Workers Earning Less Than $10 per Hour in 2004Washington StateSource: Employment Security Department/LMEA
In summary, the recession compounded the trends of income inequality of the past 30 years by eliminating a disproportionate number of low-wage jobs. The loss of lower-wage jobs pushed up the median and average hourly wage statewide and in almost every county, widening the gap between low-wage earners and high-wage earners. A high percentage of workers suffered declining wages in the 2004 to 2009 period.
Personal Income
Not surprisingly, per capita personal income declined in Washington in 2009. The magnitude of the decline, -2 percent, was the largest since 1970.7 Even so, the state fared better than the nation which suffered a 2.8 percent drop. Falling earned income was the main culprit, resulting from job losses, cuts in hours worked, and lower proprietor profits. Investment income also went by the wayside, while transfer payments like Social Security and unemployment compensation provided a countercyclical boost.
Exhibit 7-15Inflation-Adjusted Per Capita Income United States and Washington State, 1970 through 2010Source: U.S. Bureau of Economic Analysis
As noted in the sidebar, personal income is the sum of earned income (from owning a business or holding a job), investment income and transfer payments, chiefly from government programs such as Social Security, Medicare and Medicaid, welfare and unemployment benefits. Per capita income is equal to personal income divided by population. Because per capita income is an average, it will be influenced by factors such as the relative concentration of high income households, family size and retirees in an area.
n Earned income in the state accounted for 64 percent of total income in 2009. This is the lowest percentage on record. In 1969, the first year in which data are available, earnings accounted for 79 percent of income. Earnings fell by 2.5 percent in 2009, and 4.1 percent on a per capita basis (since population grew). Proprietors’ income fell by 8 percent; they absorbed 30 percent of the drop in earnings. On an industry basis, half of the decline came in construction, and a quarter in manufacturing. Retail trade and finance also took sizable hits, while health care and government earnings both increased.
Less Than$9 - 15%
$9 to $10 - 19%
$10 to$11 - 17%
$11 to $12 - 11%
$12 to $13 - 8%
$13 to$14 - 6%
More Than $14 - 23%
If You Earned Less Than $10 in 2004, Then in 2009 You Were Making…
7 The 1970 recession was particularly severe due to Boeing cutbacks, and the catchphrase of the day was “will the last person out of Seattle please turn out the lights.”
$0$5,000
$10,000$15,000$20,000$25,000$30,000$35,000$40,000$45,000$50,000
1970 1973 1976 1979 1982 1985 1988 1991 1994 1997 2000 2003 2006 2009
Per Capita Income Recovers After Last Recession,Declines with New Recession
U.S. State
Per C
apita
Inco
me

44 2010 Washington State Labor Market and Economic Report
Washington Wages and Income, 2009 Chapter Seven
n The investment income contribution dropped by 5.1 percent.
n Transfer payments played a countercyclical role, expanding by 17 percent. Unemployment payments tripled. Welfare payments more than doubled, and food stamps were up 60 percent. Social Security and Medicare payments rose by 9 percent.
Regions and Counties, 2008
Personal income data at the county level become available a year later than the state due to the enormous amount of source data that are analyzed (for example, all Schedule C tax returns from the IRS).
Thirteen counties reached their all-time high for per capita income in 2008. All were either east of the Cascades or were non-metro counties west of the Cascades. Despite a sizable 2 percent decline, King County again had the highest per capita income in the state at $58,141. Ferry County again had the lowest per capita income in the state at $23,241.
WHAT IS PERSONAL INCOME?
Personal income data are compiled by the U.S. Bureau of Economic Analysis. Personal income reflects pre-tax income received by or on behalf of individuals from all sources:
1) Earned income, including:
a. Wages and salaries, b. Proprietors’ income, and c. Employer payments for employee insurance (“other labor income”)
2) Investment income, and
3) Government transfer payments
Adjustments are made for contributions to Social Security and for cross-border commuters, so that income is measured on a residency basis.
Pension checks are not tracked in personal income; instead, the net earnings of pension funds are allotted to counties and states in proportion to actual payments of interest and dividends.
The most commonly used datum from personal income is per capita income, which equals total personal income divided by population. The advantages of using per capita income as an economic measure include its broad definition (more than wages) and its comparability across all geographic areas. The main disadvantage is that it is an average, and income is highly skewed.
All personal income data have been adjusted for inflation using the U.S. Implicit Price Deflator for Personal Consumption.
Rural counties ($33,111) and counties east of the Cascades ($32,107) had their highest per capita income on record in 2008, but continued to lag metropolitan areas ($44,360) and counties west of the Cascades ($45,751, and if King County is excluded, $38,537). Micropolitan counties averaged $31,236.
Exhibit 7-16Per Capita Income for Selected Sub-State AreasWashington State, 2008Source: U.S. Bureau of Economic Analysis
$0
$10,000
$20,000
$30,000
$40,000
$50,000
$60,000
$70,000
King County
All Counties Except King
All Urban
Micropolitan Rural East of Cascades
West Except King
Regional Comparisons in 2008 Per Capita Income
Per C
apita
Inco
me

452010 Washington State Labor Market and Economic Report
Chapter Seven Washington Wages and Income, 2009
WHAT DO WE MEAN BY A JOB?
In economic terms, the word job can take on different meanings in different contexts. We use “job” in three ways:
In the most common use, a job is a relationship between a particular employer and a particular employee. At any point in time, we can tally the number of jobs within an industry or a geographic area.
But things get a little complicated when we compare jobs over time. For instance, when we say that the number of aerospace jobs went up this year, we’re really talking about the net number of jobs in the industry. Some aerospace jobs that existed a year ago don’t exist today due to turnover. Some aerospace firms have expanded, others have contracted, some may have closed, others may be brand new, and some may have restructured. They may have the same number of employees, but the occupational and wage distribution may be substantially different.
So, when we talk about industry employment over time, we’re using a different definition of jobs, where the actual individuals and the actual employers don’t factor in.
Full-time equivalent (FTE) jobs involve another definition. Instead of a count of individual employees, they are a count of hours worked, with one FTE job defined as 2,080 hours worked in a year’s time. The concept of an individual worker is even more abstracted here, because one FTE job may be filled by several different workers. The advantage of using FTE employment is that it adjusts for turnover and part-time jobs.
A potential pitfall comes into play when we compare two different periods and start drawing conclusions based on an analysis of net new jobs. If the economy grows from 2 million jobs to 2.2 million, it is tempting to focus on the net new 0.2 million jobs and assume that the 2 million jobs are unchanged; we might even harbor the assumption that it’s the same 2 million individuals working at the same jobs at the same employer. In fact, many of those 2 million jobs are different – different individuals at different employers with different job titles and responsibilities, with different work schedules (part time vs. full time) and with different wages – even if, by industry, the job count hasn’t changed.

46 2010 Washington State Labor Market and Economic Report
Washington Wages and Income, 2009 Chapter Seven

472010 Washington State Labor Market and Economic Report
Chapter Eight Economic Comparisons with Other States
Economic Comparisons with Other StatesHow does Washington rank relative to other states in the nation? This chapter presents data that show how Washington ranks relative to other states in terms of:
n State Minimum Wage (Dollars)n Unemployment Rate (Percent)n Nonfarm Employment – Average Annual Job
Growth and Share of U.S. Totaln Real GDP – Average Annual Job Growthn Real GDP/Job – Average Annual Job Growth n Per Capita Personal Income (Dollars) n Exports (Dollars)n New Privately-Owned Building Permits Average Annual Growthn Existing House Sales (Level)n Median House Prices (Dollars)n Population (Level and Share of U.S.) n High School Completion Rates (Percent of Per-
sons 25 Years and Older)n Bachelor’s Degree Completion Rates (Percent of
Persons 25 Years and Older)
Exhibit 8-1 States with Higher than Federal Minimum WageUnited States and Washington State, July 2010Source: U.S. Department of Labor (DOL)
Exhibit 8-2Ten Highest/Lowest Unemployment RatesUnited States and Washington State, 2009Source: U.S. Bureau of Labor Statistics
1 Washington $8.552 Oregon $8.403 District of Columbia $8.253 Connecticut $8.253 Illinois $8.253 Nevada* $8.257 Vermont $8.068 California $8.008 Massachusetts $8.0010 Alaska $7.7511 New Mexico $7.5011 Maine $7.5013 Michigan $7.4013 Rhode Island $7.4015 Ohio $7.30
STATERANK
*With no health insurance benefits provided by employer
MINIMUM WAGE (EFFECTIVE JULY 1, 2010)
RANK STATE UNEMPLOYMENT RATEU.S. 9.3%
1 North Dakota 4.3%2 Nebraska 4.6%3 South Dakota 4.8%4 Iowa 6.0%5 Montana 6.2%6 New Hampshire 6.3%7 Oklahoma 6.4%7 Wyoming 6.4%9 Utah 6.6%10 Kansas 6.7%31 Washington 8.9%42 Florida 10.5%42 Kentucky 10.5%42 Tennessee 10.5%45 North Carolina 10.6%46 Oregon 11.1%47 Rhode Island 11.2%48 California 11.4%49 South Carolina 11.7%50 Nevada 11.8%51 Michigan 13.6%
RANK STATE GROWTH RATEU.S. 0.1%
1 Wyoming 2.1%2 Nevada 1.6%3 Alaska 1.5%4 Utah 1.3%5 Idaho 1.2%6 North Dakota 1.2%7 Texas 1.2%8 Arizona 1.2%9 District of Columbia 1.1%10 Montana 1.1%14 Washington 0.6%42 Alabama -0.1%43 Missouri -0.2%44 Connecticut -0.2%45 Massachusetts -0.3%46 Louisiana -0.3%47 Indiana -0.5%48 Mississippi -0.5%49 Illinois -0.6%50 Ohio -0.9%51 Michigan -1.7%
Exhibit 8-3Ten Highest/Lowest States: Nonfarm Employment Average Annual Job GrowthUnited States and Washington State, 1999 to 2009 Source: U.S. Bureau of Labor Statistics, Haver Analytics

48 2010 Washington State Labor Market and Economic Report
Economic Comparisons with Other States Chapter Eight
Exhibit 8-4Ten Highest/Lowest States: Real GDP Average Annual Job Growth United States and Washington State, 1999 to 2009Source: Bureau of Economic Analysis
RANK STATE GROWTH RATEU.S. 1.8%
1 Wyoming 3.8%2 North Dakota 3.7%3 Oregon 3.7%4 South Dakota 3.6%5 Idaho 3.5%6 Arizona 3.3%7 Utah 3.0%8 Nevada 2.9%9 Oklahoma 2.9%10 Iowa 2.8%28 Washington 1.8%42 South Carolina 1.3%43 Pennsylvania 1.2%44 Indiana 1.2%45 Illinois 1.0%46 West Virginia 0.9%47 Missouri 0.9%48 Kentucky 0.8%49 Louisiana 0.8%50 Ohio 0.3%
RANK STATE GROWTH RATEU.S. 1.1%
1 Oregon 2.9%2 South Dakota 2.6%3 North Dakota 2.5%4 Iowa 2.5%5 Oklahoma 1.9%6 Idaho 1.9%7 Nebraska 1.9%8 California 1.9%9 Wyoming 1.7%10 Virginia 1.5%37 Washington 0.8%42 Nevada 0.6%43 Texas 0.5%44 Kentucky 0.5%45 West Virginia 0.5%46 South Carolina 0.4%47 New Mexico 0.4%48 Georgia 0.3%49 Michigan 0.2%50 Alaska 0.1%51 Louisiana 0.0%
*GDP/Job – indicator of labor productivity
RANK STATE PERSONAL INCOMEU.S. $39,626
1 District of Columbia $68,0132 Connecticut $55,0633 New Jersey $50,0094 Massachusetts $49,6435 Maryland $48,2756 Wyoming $48,1787 New York $46,4598 Virginia $44,1299 Alaska $43,20910 Washington $42,93342 Alabama $33,36043 Arizona $33,24444 New Mexico $33,21245 Arkansas $32,42346 South Carolina $32,33847 Kentucky $32,30648 West Virginia $32,06749 Idaho $31,66250 Utah $31,61251 Mississippi $30,426
1 Texas $162,994,5202 California $120,142,2193 New York $57,320,6174 Washington $51,739,3945 Florida $46,919,5556 Illinois $41,513,5547 Ohio $34,083,6988 Michigan $32,553,9429 Louisiana $32,714,79710 Pennsylvania $28,253,14642 New Hampshire $3,061,60443 Maine $2,276,29144 North Dakota $2,177,79245 Rhode Island $1,495,22246 New Mexico $1,269,48347 District of Columbia $1,096,69648 Montana $1,030,11849 South Dakota $1,011,77850 Wyoming $926,09151 Hawaii $562,164
RANK STATESTATE EXPORTS
(IN THOUSANDS)
Exhibit 8-5 Ten Highest/Lowest States: Real GDP/Job* Average Annual Job GrowthUnited States and Washington State, 1999 to 2009Source: Bureau of Economic Analysis
Exhibit 8-6Ten Highest/Lowest Per Capita Personal IncomeUnited States and Washington State, 2009Source: Bureau of Economic Analysis
Exhibit 8-7Top/Bottom Ten States: Exports United States and Washington State, 2009 Source: WISER, Haver Analytics
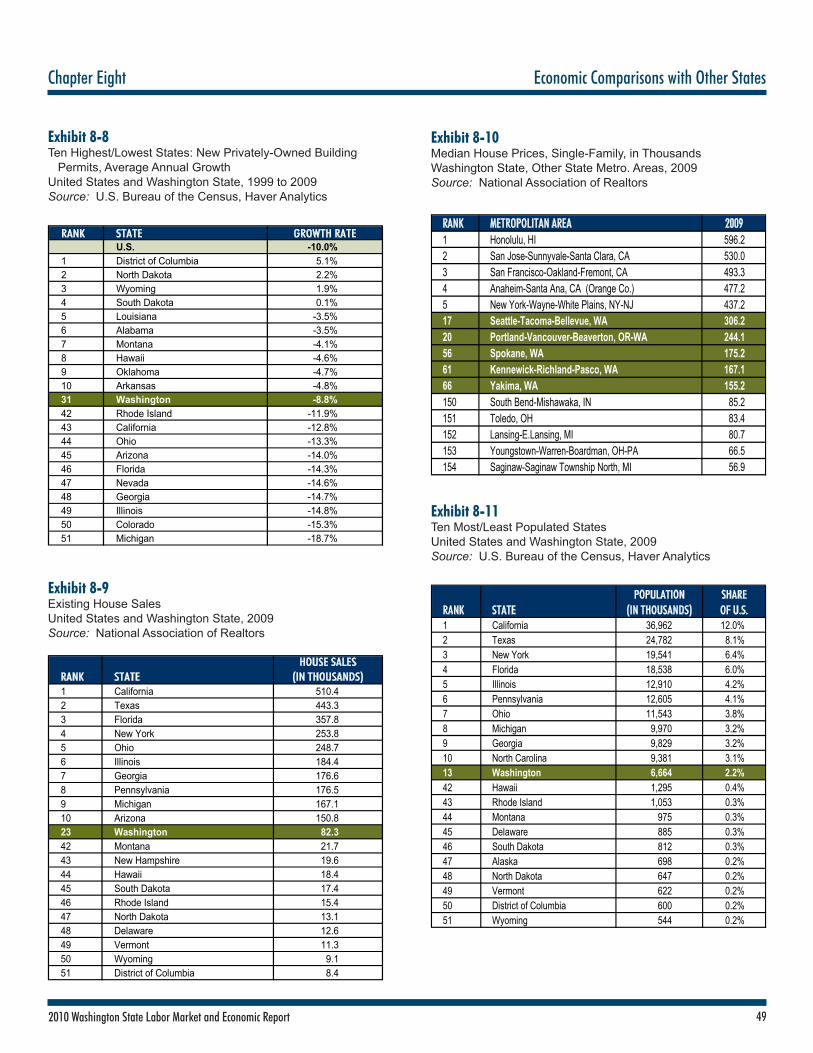
492010 Washington State Labor Market and Economic Report
Chapter Eight Economic Comparisons with Other States
RANK METROPOLITAN AREA 20091 Honolulu, HI 596.22 San Jose-Sunnyvale-Santa Clara, CA 530.03 San Francisco-Oakland-Fremont, CA 493.34 Anaheim-Santa Ana, CA (Orange Co.) 477.25 New York-Wayne-White Plains, NY-NJ 437.217 Seattle-Tacoma-Bellevue, WA 306.220 Portland-Vancouver-Beaverton, OR-WA 244.156 Spokane, WA 175.261 Kennewick-Richland-Pasco, WA 167.166 Yakima, WA 155.2150 South Bend-Mishawaka, IN 85.2151 Toledo, OH 83.4152 Lansing-E.Lansing, MI 80.7153 Youngstown-Warren-Boardman, OH-PA 66.5154 Saginaw-Saginaw Township North, MI 56.9
Exhibit 8-8Ten Highest/Lowest States: New Privately-Owned Building Permits, Average Annual GrowthUnited States and Washington State, 1999 to 2009Source: U.S. Bureau of the Census, Haver Analytics
Exhibit 8-9Existing House SalesUnited States and Washington State, 2009Source: National Association of Realtors
RANK STATE GROWTH RATEU.S. -10.0%
1 District of Columbia 5.1%2 North Dakota 2.2%3 Wyoming 1.9%4 South Dakota 0.1%5 Louisiana -3.5%6 Alabama -3.5%7 Montana -4.1%8 Hawaii -4.6%9 Oklahoma -4.7%10 Arkansas -4.8%31 Washington -8.8%42 Rhode Island -11.9%43 California -12.8%44 Ohio -13.3%45 Arizona -14.0%46 Florida -14.3%47 Nevada -14.6%48 Georgia -14.7%49 Illinois -14.8%50 Colorado -15.3%51 Michigan -18.7%
1 California 510.42 Texas 443.33 Florida 357.84 New York 253.85 Ohio 248.76 Illinois 184.47 Georgia 176.68 Pennsylvania 176.59 Michigan 167.110 Arizona 150.823 Washington 82.342 Montana 21.743 New Hampshire 19.644 Hawaii 18.445 South Dakota 17.446 Rhode Island 15.447 North Dakota 13.148 Delaware 12.649 Vermont 11.350 Wyoming 9.151 District of Columbia 8.4
RANK STATEHOUSE SALES
(IN THOUSANDS)
Exhibit 8-10Median House Prices, Single-Family, in ThousandsWashington State, Other State Metro. Areas, 2009Source: National Association of Realtors
Exhibit 8-11Ten Most/Least Populated StatesUnited States and Washington State, 2009Source: U.S. Bureau of the Census, Haver Analytics
RANK STATEPOPULATION
(IN THOUSANDS)SHARE OF U.S.
1 California 36,962 12.0%2 Texas 24,782 8.1%3 New York 19,541 6.4%4 Florida 18,538 6.0%5 Illinois 12,910 4.2%6 Pennsylvania 12,605 4.1%7 Ohio 11,543 3.8%8 Michigan 9,970 3.2%9 Georgia 9,829 3.2%10 North Carolina 9,381 3.1%13 Washington 6,664 2.2%42 Hawaii 1,295 0.4%43 Rhode Island 1,053 0.3%44 Montana 975 0.3%45 Delaware 885 0.3%46 South Dakota 812 0.3%47 Alaska 698 0.2%48 North Dakota 647 0.2%49 Vermont 622 0.2%50 District of Columbia 600 0.2%51 Wyoming 544 0.2%

50 2010 Washington State Labor Market and Economic Report
Economic Comparisons with Other States Chapter Eight
Exhibit 8-12High School Completion Rates – Percent of People 25 Years and Over (Includes Equivalency)United States and Washington State, 2009Source: U.S. Bureau of the Census – 2009 American Community Survey
Exhibit 8-13Bachelor’s Degree Completion Rates – Percent of People 25 Years and OverUnited States and Washington State, 2009Source: U.S. Bureau of the Census – 2009 American Community Survey
U.S. 85.31 Wyoming 91.82 Minnesota 91.52 Alaska 91.44 New Hampshire 91.34 Vermont 91.06 Montana 90.87 Iowa 90.58 Hawaii 90.48 Utah 90.48 Maine 90.216 Washington 89.742 Tennessee 83.143 New Mexico 82.844 West Virginia 82.845 Arkansas 82.446 Louisiana 82.247 Alabama 82.148 Kentucky 81.749 California 80.650 Mississippi 80.451 Texas 79.9
STATERANKPERCENT
(25 YEARS AND OVER)U.S. 27.7
1 District of Columbia 48.22 Massachusetts 38.13 Colorado 35.64 Connecticut 35.65 Maryland 35.25 New Jersey 34.47 Virginia 33.78 New Hampshire 33.39 Vermont 32.110 New York 31.912 Washington 30.742 Indiana 22.943 Tennessee 22.944 Oklahoma 22.244 Alabama 22.046 Nevada 21.947 Louisiana 20.348 Kentucky 19.749 Mississippi 19.450 Arkansas 18.851 West Virginia 17.1
RANK STATEPERCENT
(25 YEARS AND OVER)

512010 Washington State Labor Market and Economic Report
WASHINGTON STATE WORKFORCE DEVELOPMENT AREAS
Franklin
Benton Walla Walla Yakima
Klickitat
Skamania
Cowlitz
Clark
Wahkiakum
Lewis Pacific
Thurston
Grays Harbor
Mason
Pierce
King Kitsap
Jefferson
Clallam
Island
San Juan
Snohomish
Skagit
Whatcom
Chelan
Okanogan
Douglas
Ferry Stevens
Pend Oreille
Lincoln Spokane
Adams
Grant Whitman
Columbia
Garfield
Asotin
Kittitas
09
11
08
12
10
03
04
05
06 02
01
07
WASHINGTON STATE WORKFORCE DEVELOPMENT AREAS
WDA 1 — Olympic Consortium (Clallam, Jefferson, and Kitsap)
WDA 2 — Pacific Mountain (Grays Harbor, Lewis, Mason, Pacific, and Thurston)
WDA 3 — Northwest Washington (Island, San Juan, Skagit, and Whatcom)
WDA 4 — Snohomish County
WDA 5 — Seattle-King County
WDA 6 — Pierce County
WDA 7 — Southwest Washington (Clark, Cowlitz, and Wahkiakum)
WDA 8 — North Central Washington/Columbia Basin (Adams, Chelan, Douglas, Grant and Okanogan)
WDA 9 — South Central (Kittitas, Klickitat, Skamania, and Yakima)
WDA 10 — Eastern Washington (Asotin, Columbia, Ferry, Garfield, Lincoln, Pend Oreille, Stevens, Walla Walla, and Whitman)
WDA 11 — Benton-Franklin
WDA 12 — Spokane County