Embed Size (px)
Citation preview

1
ColorColor--DopplerDoppler imagingimaging
MEDT8002 MEDT8002 lecturelectureLasse Løvstakken and Hans TorpDept. Circulation and Medical Imaging10.09.2010

2
Background / A brief history lesson

3
Ultrasound imaging of blood and tissue movement
One of the main advantages of ultrasound imaging is the ability to measure and visualize the movement of tissue and blood
Velocity mapping of carotid bifurcation flow Velocity mapping of cardiac contractions
4
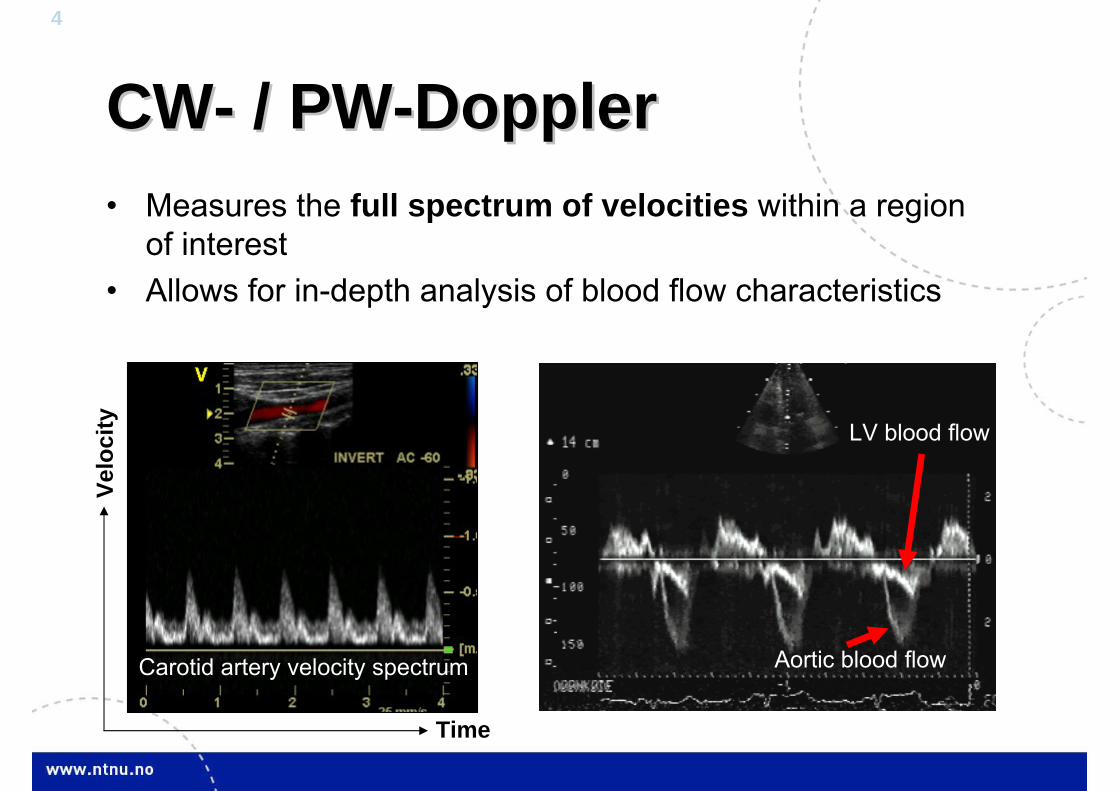
CWCW-- / PW/ PW--DopplerDoppler• Measures the full spectrum of velocities within a region
of interest• Allows for in-depth analysis of blood flow characteristics
LV blood flow
Aortic blood flowCarotid artery velocity spectrum
Time
Velo
city

5
ColorColor--Doppler imagingDoppler imaging• Measures the mean velocity and direction along the
beam in a 2 or 3-dimensional region of interest• Allows for easier detection of abnormalities manifested in
blood flow patterns
3-D CDI of a mitral regurgitation jet2-D CDI of a carotid bifurcation

6
Clinical examplesMitral valve regurgitation jet Atrial septum defect shunt flow

7
More clinical examples
Thyroid nodule vascularizationCarotid artery stenosis

8
Doppler imaging history at NTNU• Successful Doppler imaging
instruments and its clinical usewas developed in Trondheim in the late-seventies
1976: PEDOF Doppler instrumentBjørn Angelsen and Kjell Kristoffersen
Liv Hatle pioneered the useof Doppler ultrasound in theclinic

9
A brief history lesson• Technology and research progressed from
single-range gate to multi-range gated Doppler, and further to 2-D Doppler imaging
Image source: J. Woo, A short History of the development of Ultrasound in Obstetrics and Gynecology, http://www.ob-ultrasound.net/history.html
Single-range gate Multi-range gate 2-D Doppler
1 2 3
1
2
3

10
Doppler imaging history at NTNU• The company formed based on this research, now called GE
Vingmed Ultrasound, is currently one of the world’s leadingmanufacturers of cardiovascular ultrasound imaging systems
1986: Vingmed CFM 700
2009: GE Vingmed Vivid E9

11
A brief history lesson• Real-time CFI was first commercially available in the mid-eighties
– Aloka (1985, Japan), Toshiba (1985, Japan), Quantum (1986, US), Vingmed (1986, Norway)
Aloka SSD-880CW Vingmed CFM-700Quantum QAD-1
Source: J. Woo, A short History of the development of Ultrasound in Obstetrics and Gynecology, http://www.ob-ultrasound.net/history.html

12
A brief history lesson• However, real-time processing and display of color-Doppler
images in weather RADAR was available ten years earlier (!)
Source: G. R. Gray et al, Real-time color-Doppler RADAR display, Bulletin of the American Meteorological Society, vol. 56(6), 1975
Storm signs Insect signs

13
Color-Doppler processing

14
CDI processing blocks
Data acquisition Clutter filtering Parameterestimation Display
• CDI data acquisition– Scanning operation and pulse sequence
• Clutter filtering (wall filtering)– Attenuating interfering signal from (near) stationary tissue
• Doppler parameter estimation– Estimation of Doppler power, mean-velocity, and velocity spread
• Display– Color encoding of Doppler parameters

15
What do we need to acquire in order to measure velocities in CFI?• Color-Doppler is acquired
using a multi-pulse scheme– Signal changes between pulses allows
us to compute the scatterer movement
• The number of samples availablefor processing (packet size)– Cardiac imaging: 8-10– Vascular imaging: 10-16– Abdominal imaging:10-12
Scan sequence in CDI acquisition(PRF = Pulse repetition frequency)
scanning direction
Tim
e
Packet
Interleave group
1/PRF

16
Mechanical scanning+ No settling time for clutter filter - Low frame rate
scanning direction
time
Electronic packet scanning- Settling time for clutter filter+ Flexible PRF without loss in frame rate
Data acquisition in CDI
Electronic continuous scanning+ No settling time for clutter filter- High frame rate, but low PRF
scanning direction
time
scanning direction
time
Packet

17
Extracting the blood signal Clutter filtering
0
Doppler velocity spectrum [m/s]
Pow
er [
dB]
Clutter
Blood
Noise floor
• The Doppler spectrum may consists of three components, clutter c, blood b, and random noise n
• The clutter is much stronger than blood and must be attenuated• Blood typically has a higher velocity than tissue, i.e. higher Doppler
shifts Attenuate lower velocities
Clutter filter

18
General clutter filter design
• Clutter filters should have a high stop-band attenuation(60-80 dB) to sufficiently attenuate clutter
• Clutter filters should have a short transition region to avoid removing signal from blood
Velocity
Stop-band
Transition region
Pass-band
Pow
er [d
B]

19
Clutter filtering challenge
• If we had an infinite amount of samples available and a stationaryprocess, close to ideal filter could be designed
• Due to 1) flow dynamics, and 2) the limited acquisition rate in ultrasound, the number of samples available for filtering is verylimited
• Only 8-16 samples => nonideal filters!– False coloring of tissue regions– Flow signal is also attenuated

20
Estimating blood velocity
• The parameters mean power P, mean velocity v, and velocity spread B are estimated
• Both temporal and spatial smoothing is used to achieve robust measurements
0
Doppler velocity spectrum [m/s]
Pow
er [
dB]
Mean velocity
Mean Power Velocity spread

21
Pulsed Doppler signal model

22
Doppler parameter estimation
P G( )d
G( )d
G( )d
22rms
( ) G( )dB
G( )d
Time (phase) domain approaches has several qualities– Less computationally expensive– Robust in low signal-to-noise ratios– Velocity range covering the full Nyquist spectrum width
Doppler parameter estimation in CFI has focused on the first three moments of the Doppler spectrum, which equals the mean power, mean frequency, and bandwidth (rms):
However: estimating the Doppler power spectrum and integrating is not a practical solution.

23
Time domain formulation
j1R( ) G( )e d2
jjR( ) G( )e d2
2 j1R( ) G( )e d
2
Derivatives with respect to tau gives:
Yields time-domain expressions for power, mean frequency, and bandwidth (rms):
R(0)jR(0)
2
2 R(0) R(0)BR(0) R(0)
The Wiener-Khinchin formula relates the autocorrelation function and the power spectral density function:
P R(0)

24
The autocorrelation method
PRFPRF
PRF PRF
(T ) (0) 1 arg R(T )T T
R( ) A( )exp j ( )
R(0)j (0)R(0)
Correlation function in polar form:
Yields the following mean frequency and bandwidth estimate:
However: Accurate estimates of the derivatives of the autocorrelation function can be difficult to achieve. Therefore an alternative formulation is used:
PRF2 PRF2 2
PRF PRF
R(T )A(T )A(0) 2 2B 1 1A(0) T A(0) T R(0)
In other words: The power, mean frequency and bandwidth of the Doppler spectrum can be found using magnitude and phase estimates of the correlation function at lags 0 and 1 (TPRF)
Reference: C. Kasai, Real-Time Two-Dimensional Blood Flow Imaging Using an Autocorrelation Technique, IEEE Transactions on Sonics and Ultrasonics, vol. 32 pp. 458-464, 1985

25
Autocorrelation estimator properties
• Robust in low signal-to-noise environments– Superior to FFT-based method below ~15 dB, similar above ~15dB
• Computationally inexpensive– Ideally, in a noise free environment only two complex samples are
needed to estimate the mean frequency– In practice more samples are needed to 1) attenuate clutter, and 2)
reduce the variance of the correlation estimates

26
Cross-correlation method
• The velocity is proportional to the RF time shift between successive pulses
Received pulse 1Received pulse 2
Time
Am
plitu
de
PRI2vcos( )T2 zc c
max 12 sˆˆ arg max R (m) / F
SN 1
12 0 1 0 2 0k 0S
1R̂ (m,m ) r (m k)r (m k m)N
maxz
PRI
ˆcv̂2 T
Reference: O. Bonnefous and P. Pesque, Time domain formulation of pulse-Doppler ultrasound and blood velocity estimation by cross correlation, Ultrasonic imaging vol. 8, pp. 73-85, 1986.

27
Narrow band Wide band
Autocorr.No averaging
Auto corr.1.6us averaging
Cross corr.1.6us averaging
Reference: Torp & al: Ultrasonic Symp. 93
Auto correlation vs. Cross correlation method
Example:In vivo Comparison of autocorrelation and cross-correlation for data from thehuman subclavian artery
The two methods areapproximatively equal for narrow-band pulses and withradial averaging

28
Power Doppler (Angio)Brightness ~ mean power
Color flowBrightness ~ mean powerHue ~ Velocity
Color flow ”Variance map”Hue & Brightness ~ VelocityGreen ~ velocity spread
Image example : Aortic regurgitation
Color mapping types

29
Tissue / flow arbitration
• B-mode and CFI image acquired separately due to differerentresolution and penetration requirements in CFI and B-mode
• The two images are typically combined through a hard decision ofwhether to display a B-mode or color pixel Arbitration
• Post-processing is also needed in order to reduce the amount of flashing artifacts due to insufficient clutter attenuationThis decision is typically based on:
– Mean frequency and power before and after filtering– High power / low frequency (below filter cut-off) => tissue

30
Tissue / flow arbitration
Power-Doppler: Hard arbitration Power-Doppler: Soft arbitrationExample: Thyroid nodule vascularization
• B-mode and color-Doppler images are acquired separately due to different sensitivity requirements
• The two images are combined through a hard decision of whether to display a B-mode or color pixel Arbitration

31
B-Flow imaging• A power-Doppler variant• B-mode and flow map from same
data set, no arbitration• Coded-excitation techniques to avoid
loosing sensitivity• No color blooming
Dialysis Graft PseudoaneurysmsCommon carotid ulcerationInternal carotid stenosis

32
Contrast enhanced ultrasound
• Microbubbles with a radius of 1 to 5 m• Stay in the blood pool• Superior tissue signal separation• Also suitable for perfusion imaging
Movies: Erasmus, Rotterdam
33
Limitations of Doppler methods

34
Maximum measurable velocity
• The maximum measurable velocity is given by the temporal sampling frequency, i.e. the pulse repetition frequency (PRF), and the center frequency (f0), as:
• Cardiac imaging example: – PRF = 5kHz, f0=2.5MHz vmax = 0.77m/s– Covers normal flow velocities, but not high velocity jets
• Vascular imaging example:– PRF = 12kHz, f0=5MHz 0.92 m/s– Still not covering high velocity jets due to stenosis
max0
c PRFv4f

35
Minimum measurable velocity
• The minimum measurable velocity is in theory given by the requirement that at least one period of the carrier frequency needs to be observed:
• However, in practise the cut-off frequency of the clutterfilter will determine the minimum velocity
min0
c PRFv8 N f cos

36
Aliasing and angle-dependency
• Aliasing is a sampling phenomenon that occurswhen the velocity exceedsthe maximum value:
• Angle-dependencies occuras only the axial velocitycomponent is measured
Aliasing
Angle-dependency
max0
c PRFv4f
37
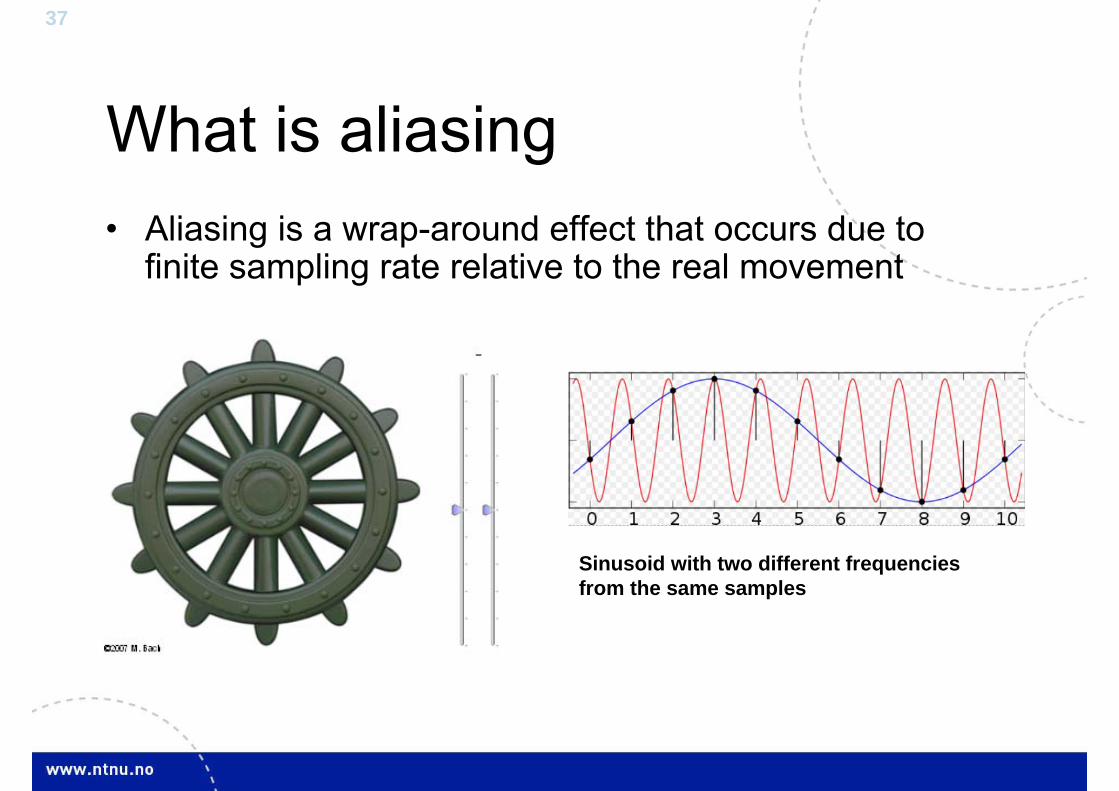
What is aliasing• Aliasing is a wrap-around effect that occurs due to
finite sampling rate relative to the real movement
Sinusoid with two different frequenciesfrom the same samples

38
Range-velocity limit
• The pulse repetition frequency (PRF) determines themaximum measurable velocity, but also the maximumimaging depth
• This imposes a range-velocity limit:
• Cardiac imaging example : – PRF = 5kHz, f0=2.5MHz, vmax = 0.77m/s, theta=0 => zmax = 11.8cm– Imaging of the heart can go deeper than 20 cm…
2
max max0
cz v8f cos

39
Range ambiguity
• It is possible to fire with a higherPRF than given by the range-velocity contraints
• If the PRF is higher than c/2z, then several range gates withinthe imaging field will be interrogated
• However, as long as the (high) velocity components of intereststands out in the spectrum, it canbe of clinical value

40
Angle dependency in spectralDoppler• The Doppler shift is
dependent on the angle between the beam and flow
• Angle-correction can be done manually, by indicating the direction ofthe vessel flow– Works to sufficient accuracy
as long as the angle of thebeam is less then 60 deg compared to the flow

41
Flashing artifacts
• Flashing artifacts are false coloring of tissue regions
• Due to insufficient separation(filtering) of the blood
• In general a problem whenthe velocity of tissue and flowbecome comparable– Physiological movements– Probe movement during imaging
Example: Thyroid imaging
Flashing artifact

42
OtherOther limitationslimitations• Sensitivity vs. spatial resolution
– Seperate acquisition needed for flowimaging
– Leads to color blooming artifactswhere color covers the tissue
• Frame rate vs. image quality– Frame rate requirements reduce the
image quality, leads to more smoothedimages
• Accuracy of velocity measurements– A high variance and velocity dependent
bias
=> CDI is mainly used qualitatively
Example: Carotid imaging using a broad image sector

43
Patient safety in Doppler imaging

44
Patient safety in Doppler imaging• Potential hazardous heating and mechanical effects restrict the
allowed acoustic output of ultrasonic imaging equipment
• Acoustic output is restricted by one of the following:– Mechanical index (MI), a measure of mechanical effects (cavitation)– Spatial peak temporal average intensity (Ispta), output power, or
thermal index (TI)– Transducer surface temperature
• Heating effects are averaged for combinations of modes. Mechanical index is determined by the modality with the highestvalue.
The outcome: The sensitivity / penetration in Doppler modes may be severly punished from these restractions
45
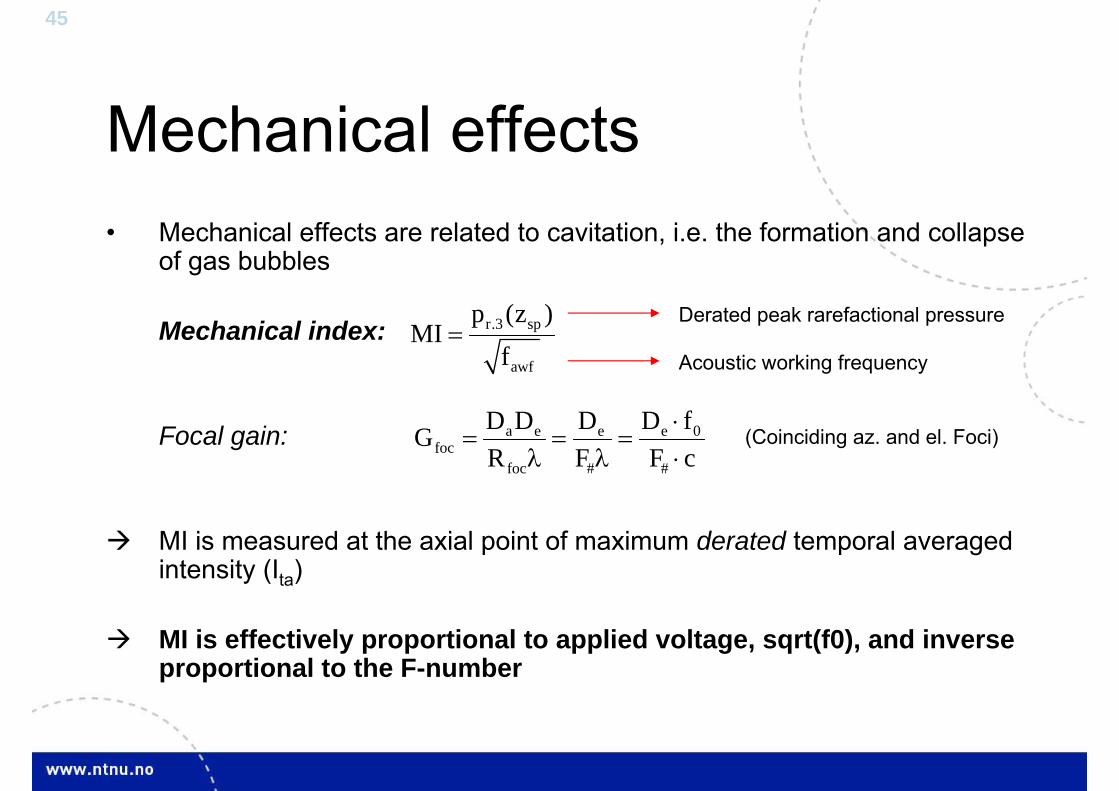
Mechanical effects• Mechanical effects are related to cavitation, i.e. the formation and collapse
of gas bubbles
Mechanical index:
Focal gain:
MI is measured at the axial point of maximum derated temporal averagedintensity (Ita)
MI is effectively proportional to applied voltage, sqrt(f0), and inverse proportional to the F-number
r.3 sp
awf
p (z )MI
f
a e e e 0foc
foc # #
D D D D fGR F F c
(Coinciding az. and el. Foci)
Derated peak rarefactional pressure
Acoustic working frequency

46
Tissue heating• Heating occur in the tissue due to absorption, at a rate much
lower (~seconds) than the ultrasound frame rate• Spatial-peak temporal average intensity (Ispta):
• Proportional to the transmitted pulse energy• Proportional to the squared focal gain, Gfoc
2
• For scanned modes, the intensity contributions for overlapping beams are averaged
PRRT 2z
spta z0
p (t)I max PRR dtc

47
Transducer surface heating• FDA regulations: The transducer surface may not exeed 43
deg. held towards the skin, or 50 deg. towards air
• For current transducer technology, surface heating is almostalways higher than at the geometric focus1
It is typically the most limiting factor with regards to voltage / PRF / apertures
• The temperature rise for duplex and triplex modes (B-mode+CFI+PW-Doppler) is an average over a common time constant (frame rate / PRF)
Reference: 1 M. Curley, Soft Tissue Temperature Rise Caused by Scanned, Diagnostic Ultrasound, IEEE Trans., Ultrason., Ferroelect., and Freq. Contr., vol. 40(1), Jan 1993
48
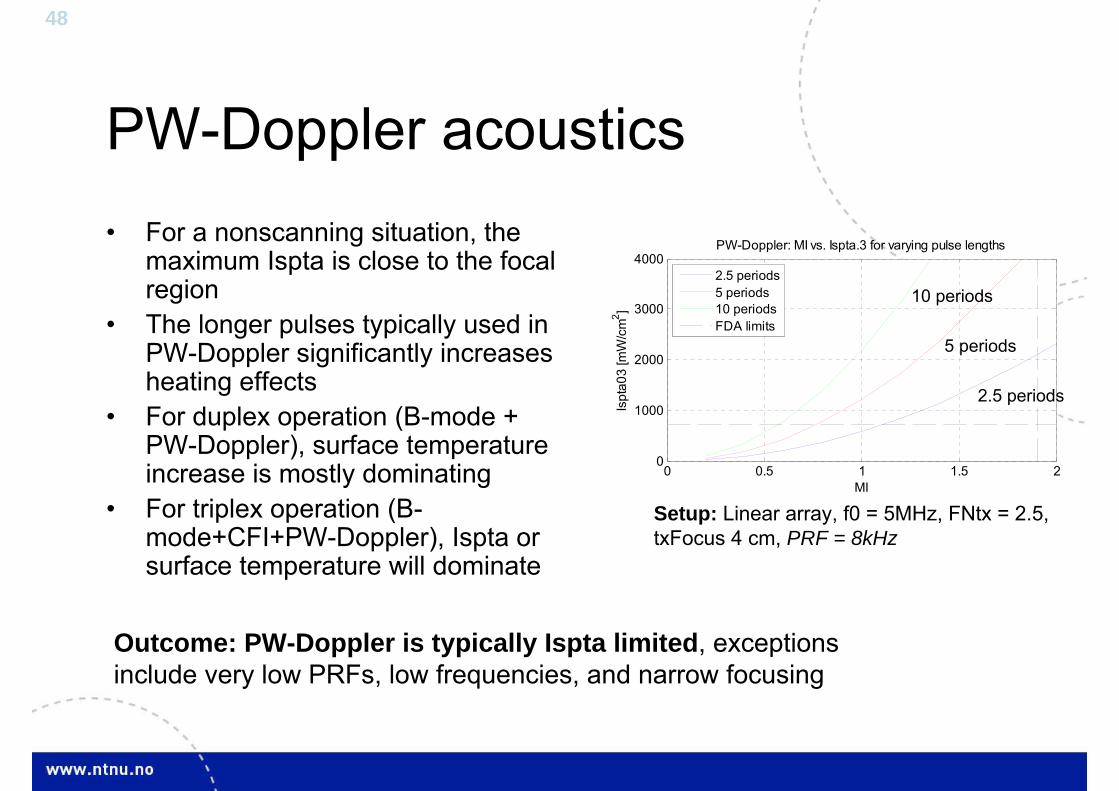
PW-Doppler acoustics• For a nonscanning situation, the
maximum Ispta is close to the focalregion
• The longer pulses typically used in PW-Doppler significantly increasesheating effects
• For duplex operation (B-mode + PW-Doppler), surface temperatureincrease is mostly dominating
• For triplex operation (B-mode+CFI+PW-Doppler), Ispta or surface temperature will dominate
0 0.5 1 1.5 20
1000
2000
3000
4000
MI
Ispt
a03
[mW
/cm
2 ]
PW-Doppler: MI vs. Ispta.3 for varying pulse lengths
2.5 periods5 periods10 periodsFDA limits
Outcome: PW-Doppler is typically Ispta limited, exceptionsinclude very low PRFs, low frequencies, and narrow focusing
Setup: Linear array, f0 = 5MHz, FNtx = 2.5, txFocus 4 cm, PRF = 8kHz
2.5 periods
5 periods
10 periods

49
Color-Doppler Imaging acoustics
• For a scanning situation, themaximum Ispta is close to the surface
• Similar characteristics for phased-array (cardiac) probes as for linear array (vascular) probes
• Duplex operation adds heating effectsfrom B-mode
• Generally surface temperature limited• MI limited only for short pulses, low
frequencies and PRFs, narrowfocusing
Setup: Linear array, f0 = 5MHz, FNtx = 2.5, txFocus 4 cm, PRF = 4kHz, 2 cm ROI width, 50 beams. NB: B-mode values not added
CDI is typically transducer surface temperature limited. Exceptionsinclude very low PRFs, low frequencies, and narrow focusing
0 0.5 1 1.5 20
500
1000
1500
2000
MI
Ispt
a03
[mW
/cm
2 ]
CFI: MI vs. Ispta.3 for varying pulse lengths
2.5 periods5 periods10 periodsFDA limits
2.5 periods
5 periods
10 periods

50
Surface temperature comparison
• An example of surface temperatureprediction for PW vs. CDI for thesame aperture / tx-focus
• CDI generates a higher surfacetemperature then PW-Doppler due to:
– Aperture overlap during scanning, i.e. individual elements are excitedmore often,
– The imaging PRF is often higher in CDI than for PW-Doppler
0 0.5 1 1.5 20
5
10
15
20
25
30
MI
Tem
pera
ture
incr
ease
[deg
]
CFI: 2.5 periodsCFI: 5 periodsCFI: 10 periodsPW: 2.5 periodsPW: 5 periodsPW: 10 periods
Common setup: Linear array, f0 = 5MHz, FNtx = 2.5, txFocus 4 cm
CDI: PRF_img = 16kHz, PRF=4kHz, Np=12, 2 cm ROI width, 50 beams.
PW: PRF_PW = 8kHz, Np=64
NB: B-mode values not added

51
Patient safety summary• Transducer surface heating is currently the main limitation in CDI and B-
mode+PW-Doppler, – Ispta is the main limitation in CW- and PW-Doppler (without B-mode)– MI limitations might occur for low PRFs, short pulses, and narrow focusing
• For an equal PRF, the temporally average transmitted energy is distributed over a larger spatial region for scanned modes than for PW-Doppler:
– Lowering overall tissue heating effects for scanned modes– Bringing the maximum temperature close to the transducer for scanned modes– Especially the case for 3-D imaging
• These rules of thumb apply to both linear array (vascular) as well as phased array (cardiac) imaging

52
Recent advances

53
Higher acquisition rates

54
Background: Frame rate vs. image quality
In Color-Doppler Imaging a sufficient frame rate is often achieved on theexpence of reduced image quality and / or reducedimage width
Example: Carotid artery bifurcationimaging using a broad image sector. Notice the temporal acquisition lag from right to left in image due to thelow frame rate (6 fps).

55
Ultrasound image formationConventional vs. parallel receive beamforming
Animations by S. A. Aase
Conventional image formation:An image is built line by line, onefor each ultrasound transmission
Parallell receive beamforming:N image lines are generated per ultrasound transmissionFrame rate increased by N times

56
Plane-wave imagingWhat’s up with that?
Plane-waves are unfocused ultrasound beams, and therefore without curvatureover a large field of depth
One transmitted plane-wave can illuminate a large spatial region so that a high numberof parallel receive beams can be utilized
Due to the flat curvature, image artifactsnormally associated with parallel receivebeamforming for curved beams are avoided
Unfocused pulse
Focused pulse
depth
depth

57
What is the difference?An illustration of the frame rate difference for the same amountof image lines (fully sampled). Playback is at 20% of real-time.
Plane wave imaging, 16x parallelbeams (both B-mode and CFI)
Example:
Neonate heartwith an atrioventricularseptum defect(AVSD).
Parasternalimage cross-section using a linear arraytransducer
Roughly equivalent to currenthigh-end acquisition, using 2x parallel beams

58
Stenosed carotid bifurcation of elderly male subject, an example of bothhigher frame rate and quality (2x lateral sampling) using plane-waves
Example: Vascular imaging
• Plane-wave CDI acquisition, 16xPRB• 2 flow images per B-mode image• Conventional B-mode acquisitionNo. of beams = 192, frame rate = 54 Hz
25% playback speed 25% playback speed
• Conventional CDI acquisition, 2xPRB• 2 flow images per B-mode image• NB: 2 B-mode fociNo. of beams = 82, frame rate = 15 Hz

59
Angle-independent imaging

60
AliasingAliasing--freefree and angleand angle--independent independent DopplerDoppler imagingimaging –– whywhy??• General improvements
– In general less interpretation of color images, i.e. increaseddiagnostic certainty
– No need for angle-correction, i.e. more accurate quantitativemeasurements
• New clinical information?– Improved volume flow quantification– Improved detection of shunt flow– Detection of circulatory / oscillatory flow, flow vorticity– Wall shear rate / shear stress estimation

61
BloodBlood specklespeckle imagingimaging• The speckle pattern from blood flow signal is isolated
by high-pass filtering the Doppler signal• The movement of this speckle pattern is correlated to
the movement of blood
Figure: B-mode image of carotis artery and corresponding filtered image showing the blood flow speckle pattern utilized in BFI
Blood flow echospeckle pattern
Tissue echospeckle pattern

62
Blood Flow Imaging (BFI) Angle independent flow imaging• An angle-independent blood pattern visualization has
been developed, compatible with existing methods
Regular Color Flow Imaging Speckle + Color Flow Imaging

63
IntraoperativeIntraoperative bloodblood flowflow imagingimagingin in neurosurgeryneurosurgery
Combination of real-time ultrasound imaging and navigationbased on preoperative MRI during neurosurgery

64
IntraoperativeIntraoperativeimagingimaging in in coronarycoronarybypassbypass surgerysurgery
65
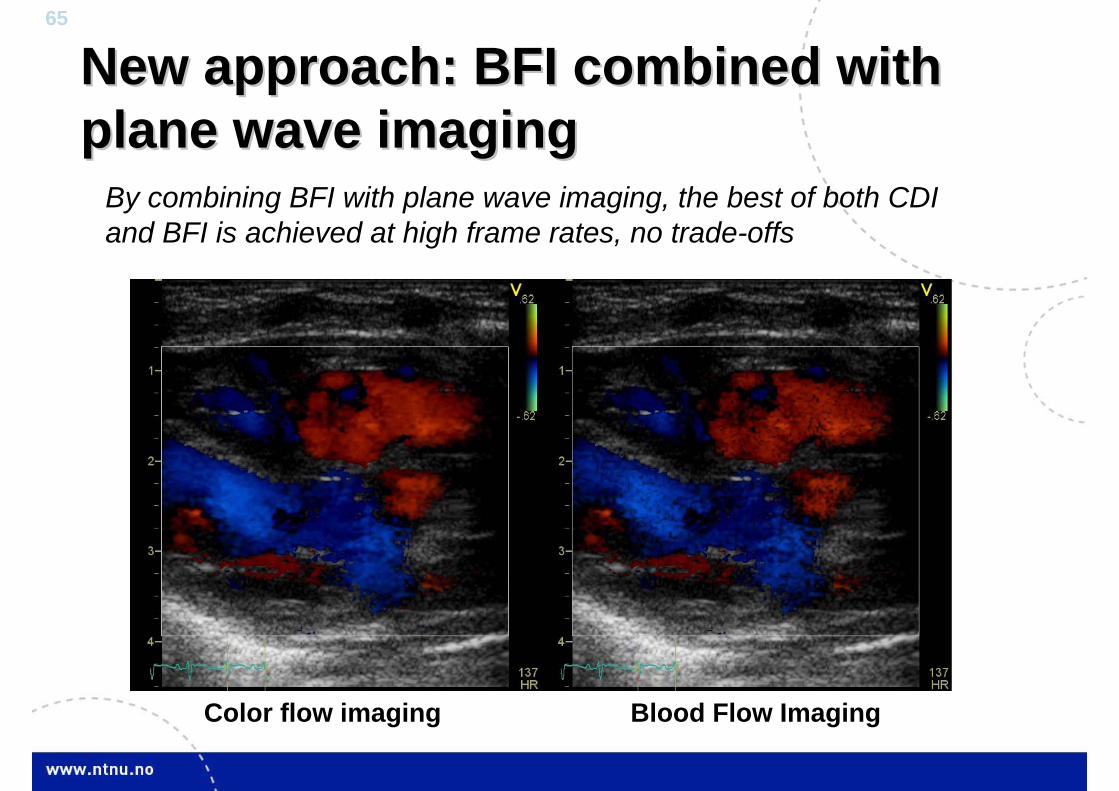
New New approachapproach: BFI : BFI combinedcombined withwithplane plane wavewave imagingimaging
By combining BFI with plane wave imaging, the best of both CDI and BFI is achieved at high frame rates, no trade-offs
Color flow imaging Blood Flow Imaging

66
Speckle tracking of blood• Tracking speckle pattern between subsequent frames, speckle
displacement is given by best match
l
i
k
jn jiXjiXn
1 10 ),(),(),,(
nTzx
V mmn
22 )()(
zx
m
mn
arctan
(,)
X0
Xn
G. E. Trahey et al. Angle Independent Ultrasonic Detection of Blood Flow. IEEE Trans., Biomed. Eng., vol. 34(12), pp. 965-967, Dec 1987

67
Compound vector-Doppler
Using parallelacquisition, thecompounded framesare acquired at a veryhigh speed
• no loss in frame rate
• Near instantaneousacquitision of flowconditions

68
22--D D velocityvelocity vectorvector imagingimaging
LA
LVOT
LV
RA
No speckle trackingWith speckle tracking
Speckle tracking
Quantifying the blood specklemovement using image pattern matching
Utilizing plane wave image acquisition, the accuracy canbe substantially increased
Example: Vector velocityimaging of cardiac flow(systole) in a newborn

69
LVOTLV
RV
LA
LVOTLV
RV
LA
ExampleExample: : BidirectionalBidirectionalventricularventricular septumseptum defectdefect (VSD)(VSD)

70
LA
Example:
Imaging of a ventricularseptum defect (VSD) in a newborn baby
The VSD in this case leads to bidirectional flow betweenthe ventricles
Speckle tracking used to quantify the blood movement
Streamlines used to visualizethe velocity vector field
BidirectionalBidirectional VSD VSD moviemovie

71
Low flow imaging
72
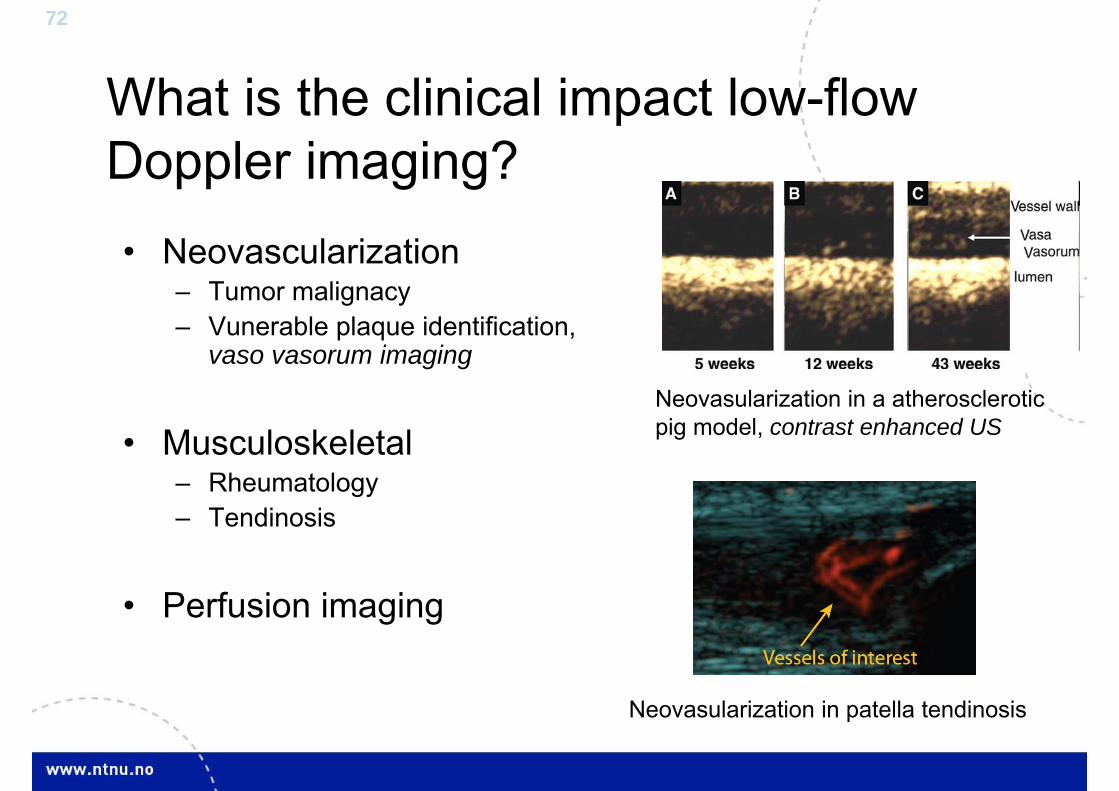
What is the clinical impact low-flowDoppler imaging?• Neovascularization
– Tumor malignacy– Vunerable plaque identification,
vaso vasorum imaging
• Musculoskeletal– Rheumatology– Tendinosis
• Perfusion imaging
Neovasularization in a atheroscleroticpig model, contrast enhanced US
Neovasularization in patella tendinosis

73
Minimum measurable velocity
• The minimum measurable velocity is in theory given by
• Example:PRF=1kHz, N=12, f0=10MHz, θ=0, c=1540 m/s=> vmin = 0.16 cm/s
min0
c PRFv8 N f cos
However, in practise the wall filter will determine theminimum velocity that can be measured

74
High-frequency imaging• Commercial systems and transducer technology are currently
available which allow for imaging at very high frequencies and at a high frame rate
Examples: Imaging of venous flow in a healthy volunteer using a 16 MHz linear array transducer prototype. At high frequencies blood scattering may be visible in the B-mode images.
1cm

75
High frequency imaging• Very high-frequency array transducers are
now available for animal imaging– Examples: Visualsonics Vevo 2100, 9 - 70 MHz
array transducers available
Figure: Imaging of mouse carotidat 40MHz, vessel size < 1 mm
Figure: Imaging of a mouse kidney at 33 MHz

76
Plane wave advantage for low flowImproved clutter filtering
• By increasing both the packet size and PRF we can:– Achieve a high Nyquist limit avoiding aliasing– Keep the low velocities (same filter limits as before)
-30 -20 -10 0 10 20 30-60
-50
-40
-30
-20
-10
0
10
Velocity [cm/s]
Clutter filter frequency response - order 3
N=60, PRF=8kHzN=12, PRF=1.6kHzN=12, PRF=8kHz
5x velocity range
Keep low velocities

77
Extended Nyquist - Thyroid imaging
Healthy thyroidPRF = 4 kHzPacket size = 60High gain
Sufficient signalNo aliasingLess flashing
Healthy thyroidPRF = 4 kHzPacket size = 60
Sufficient signalNo aliasingLess flashing
Healthy thyroidPRF = 4 kHzPacket size = 12
Insufficient signalNo aliasingNo flashing
Healthy thyroidPRF = 0.8 kHzPacket size = 12
Sufficient signalAliasingFlashing
78
Real-time 3-D flow imaging

79
3D color flow imaging with 2-D matrixarray probe
Azimuth
Elevation
64 – 128 array elements
From 1D Array… to 2D Array…
2000 – 3000 array elements

80
Real-time 3-D CFI example
Example:
Mitral valve insufficiency
Real-time CFI without ECG triggering and volume stitching
Main challenge is frame rate

81
Real-time 3-D CFI example
Example:
Mitral valve insufficiency
Real-time CFI without ECG triggering and volume stitching
6-slice view – notice the banana shaped leakage in the mitral valve indicated by the green color (increased Doppler bandwidth)
New information!

82
EstimationEstimation ofof ValvularValvular regurgitationregurgitationArea by 3D HPRF Area by 3D HPRF DopplerDoppler
T. Hergum, T. Skaug
Mitral valve 3-D beam pattern
Mitral valve insufficiency
Valvular regurgitant jet area can be quantified by isolating the Dopper signal power from the jet over the whole leakage area relative to a knownreference signal from the center of the jet (vena contracta)
83
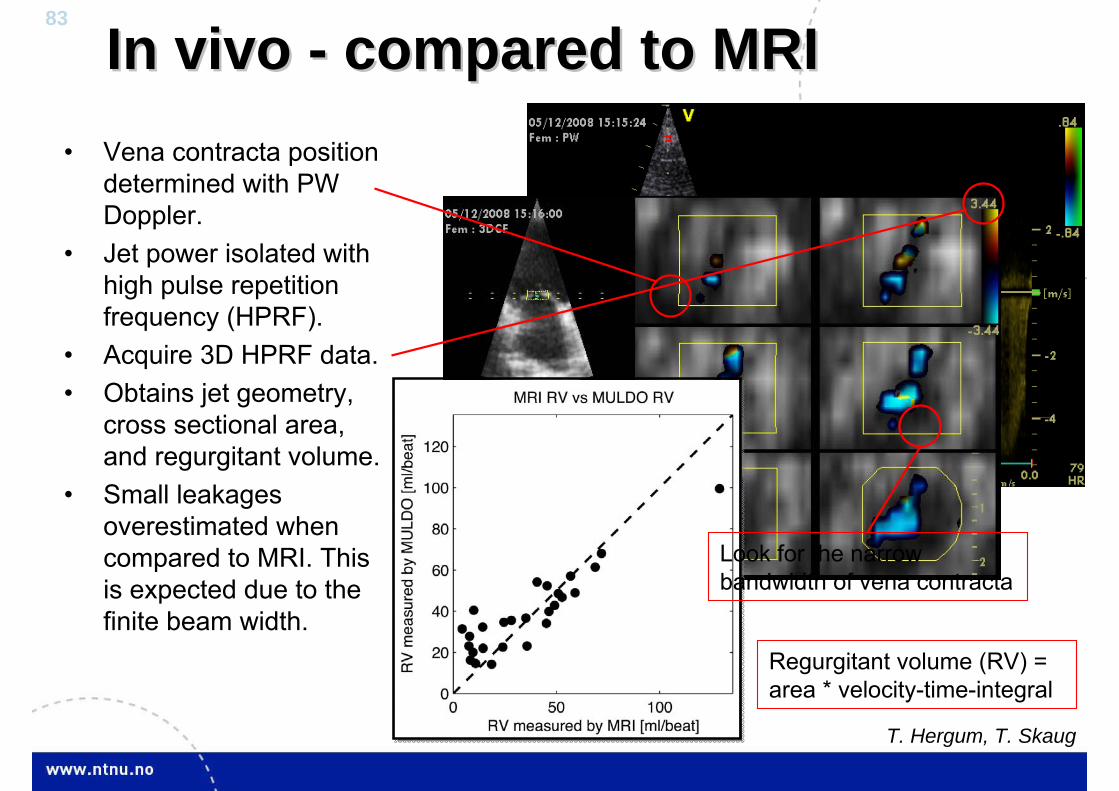
In vivo In vivo -- compared to MRIcompared to MRI
Regurgitant volume (RV) = area * velocity-time-integral
• Vena contracta positiondetermined with PW Doppler.
• Jet power isolated withhigh pulse repetitionfrequency (HPRF).
• Acquire 3D HPRF data.• Obtains jet geometry,
cross sectional area,and regurgitant volume.
• Small leakagesoverestimated whencompared to MRI. This is expected due to thefinite beam width.
Look for the narrow bandwidth of vena contracta
T. Hergum, T. Skaug

84
Emerging ultrasound transducertechnology• Higher frequency 2-D matrix
phased-array transducers arecurrently on the marked– Phillips X7-2 (2-7 MHz)
• 2-D matrix linear arraytransducers will be availablein the coming years– High frequency 3-D imaging

85
Miniaturization: From high-end to hand-heldA dramatic reduction in the scanner footprint has become
feasible through miniaturization of the electroniccomponents
1985 2000 2009 - 2015
Logic 9
SSD-880CW
The high-endultrasound future?Vivid E
2008