Embed Size (px)
Citation preview
MEDT8002
Blood flow measurement by Doppler technique
Hans Torp
Institutt for sirkulasjon og medisinsk bildediagnostikk
Hans TorpNTNU, Norway
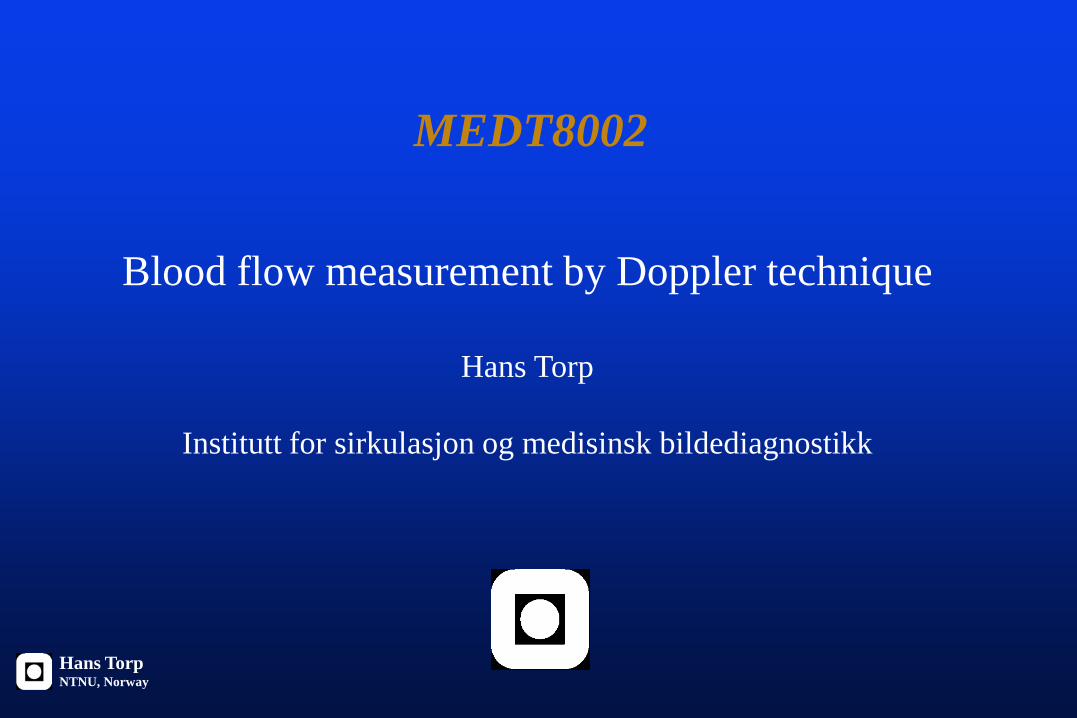
Ultrasound Doppler
• Dopplershift from moving scatterers• Clutter filtering• Spectrum analysis• PW versus CW Doppler• Aliasing• Range ambiguity• Transit time broadning
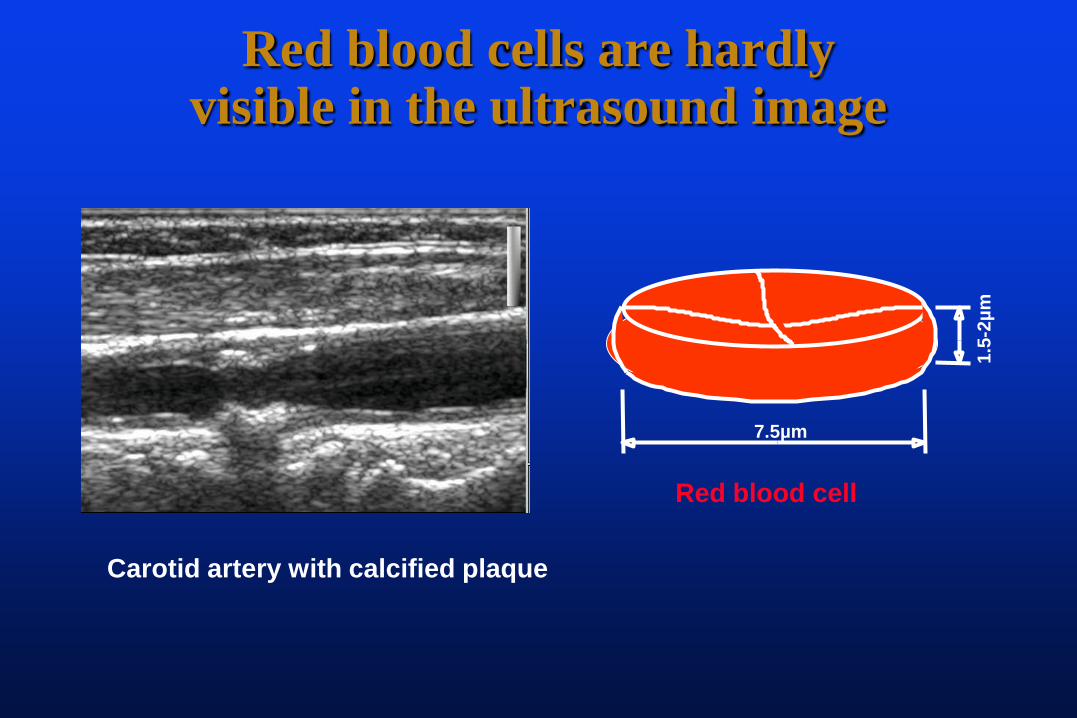
Red blood cells are hardly visible in the ultrasound image
Carotid artery with calcified plaque
Red blood cell
1.5-
2µm
7.5µm
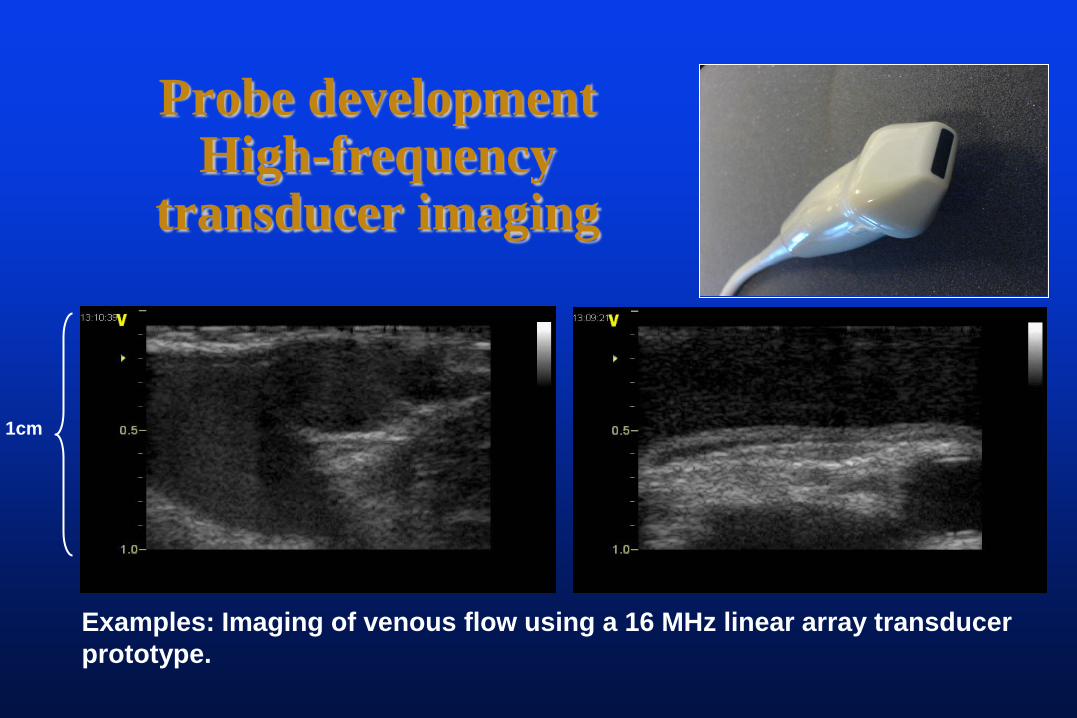
Probe developmentHigh-frequency
transducer imaging
Examples: Imaging of venous flow using a 16 MHz linear array transducer prototype.
1cm
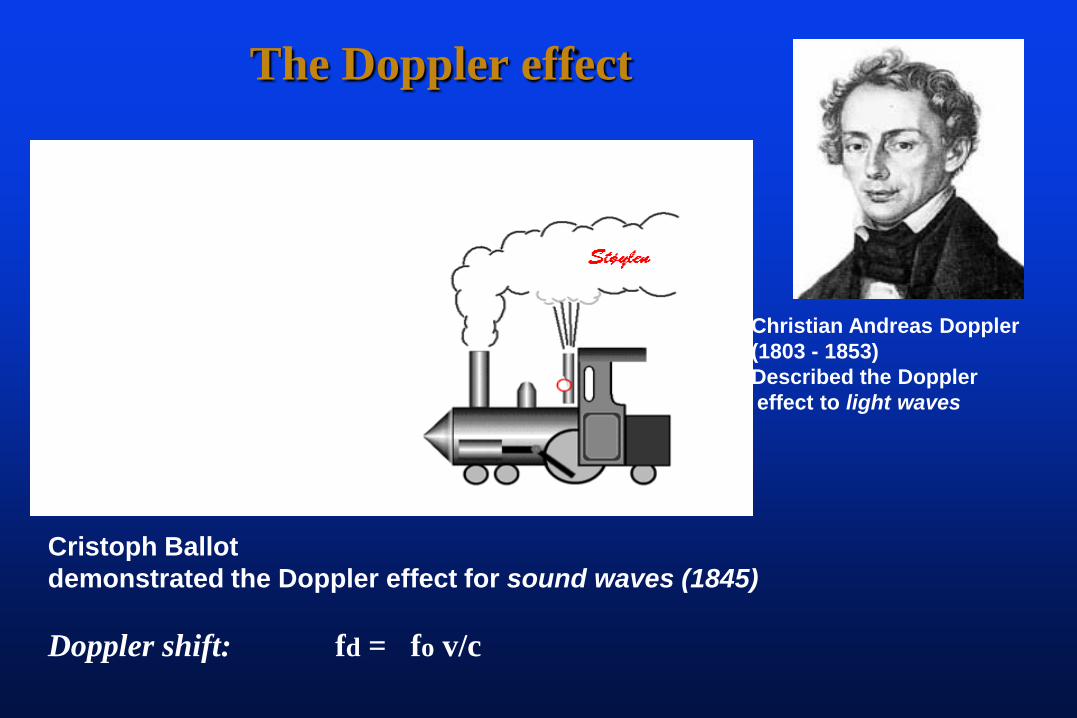
Cristoph Ballot demonstrated the Doppler effect for sound waves (1845)
Doppler shift: fd = fo v/c
The Doppler effect
Christian Andreas Doppler (1803 - 1853)Described the Dopplereffect to light waves
k
bkj
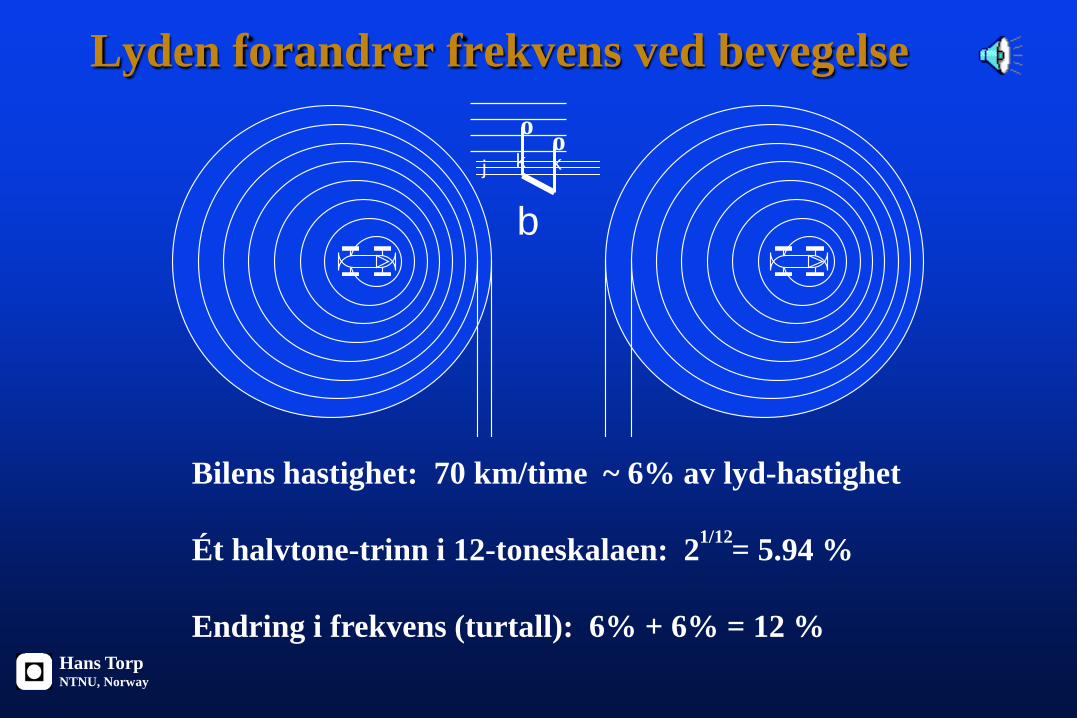
Lyden forandrer frekvens ved bevegelseo o
Bilens hastighet: 70 km/time ~ 6% av lyd-hastighet
Ét halvtone-trinn i 12-toneskalaen: 2 = 5.94 %
Endring i frekvens (turtall): 6% + 6% = 12 %
1/12
Hans TorpNTNU, Norway
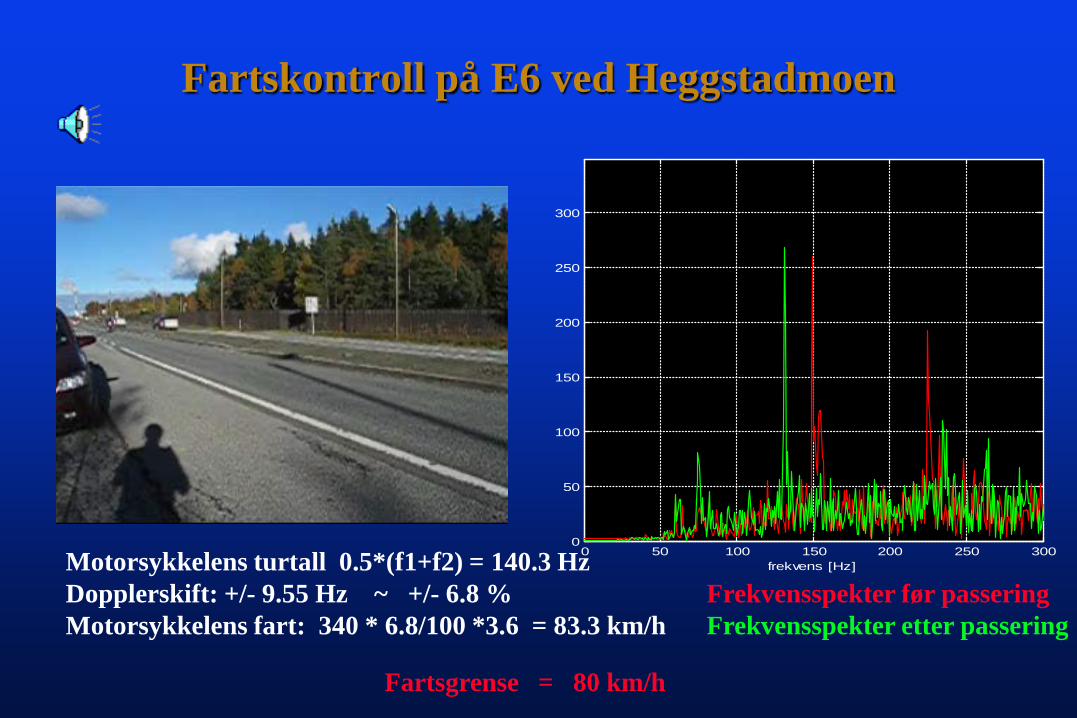
Fartskontroll på E6 ved Heggstadmoen
0 50 100 150 200 250 3000
50
100
150
200
250
300
frekvens [Hz]Motorsykkelens turtall 0.5*(f1+f2) = 140.3 HzDopplerskift: +/- 9.55 Hz ~ +/- 6.8 %Motorsykkelens fart: 340 * 6.8/100 *3.6 = 83.3 km/h
Fartsgrense = 80 km/h
Frekvensspekter før passeringFrekvensspekter etter passering
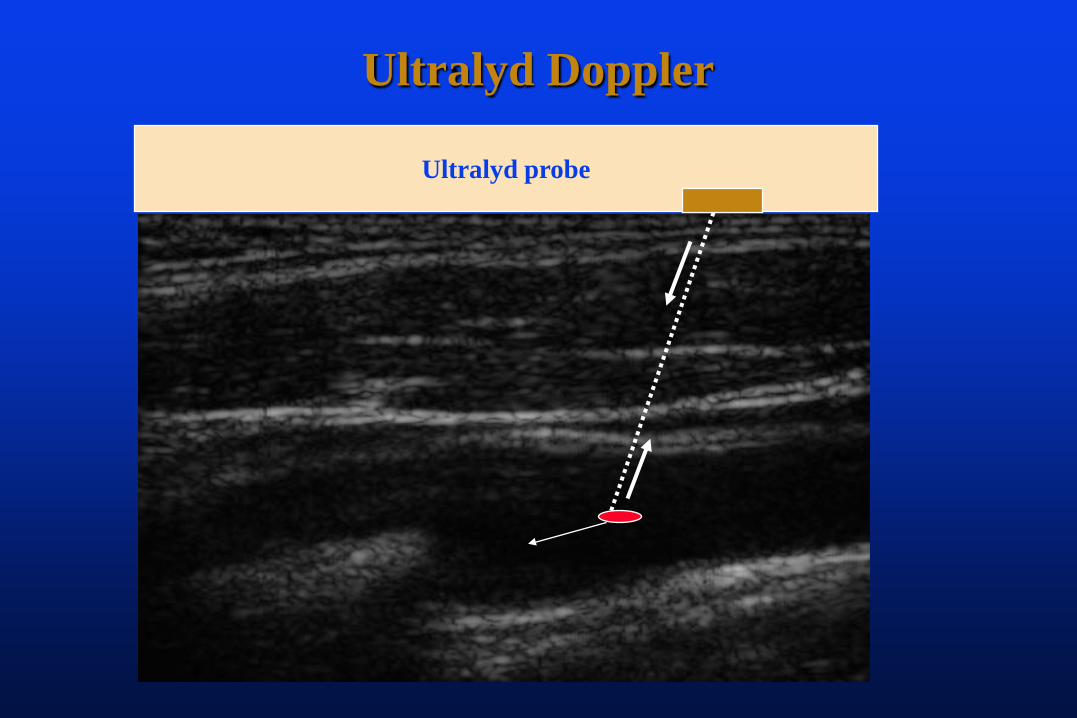
Ultralyd Doppler
Ultralyd probe
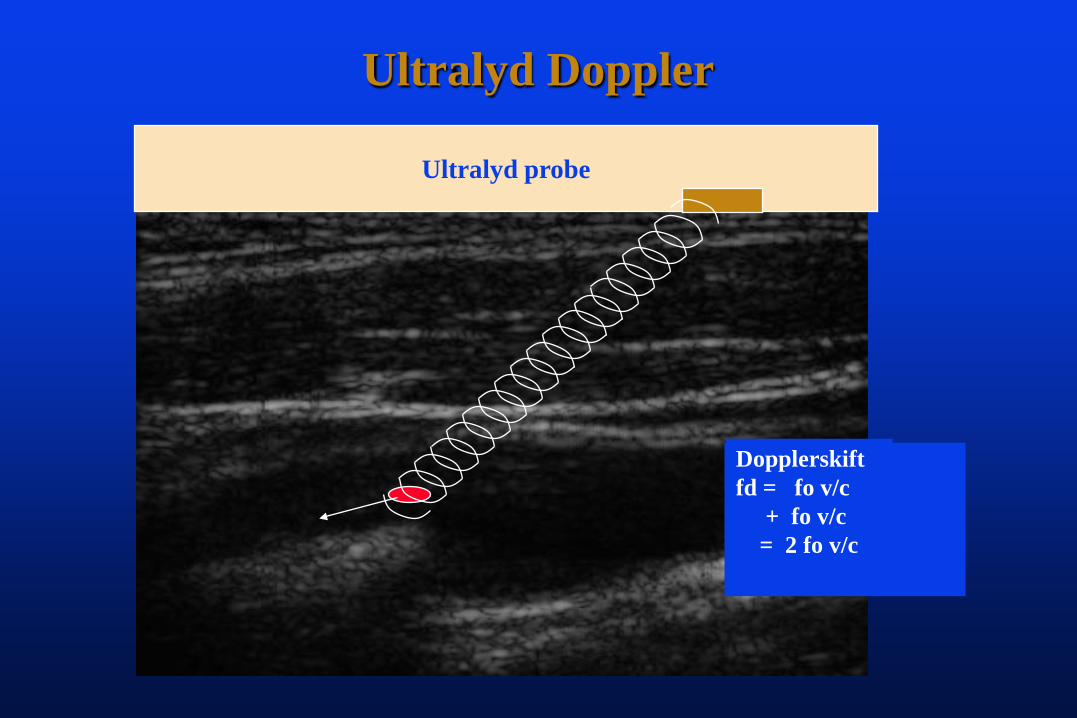
Ultralyd Doppler
Ultralyd probe
Dopplerskift fd = fo v/cDopplerskift fd = fo v/c
+ fo v/c= 2 fo v/c
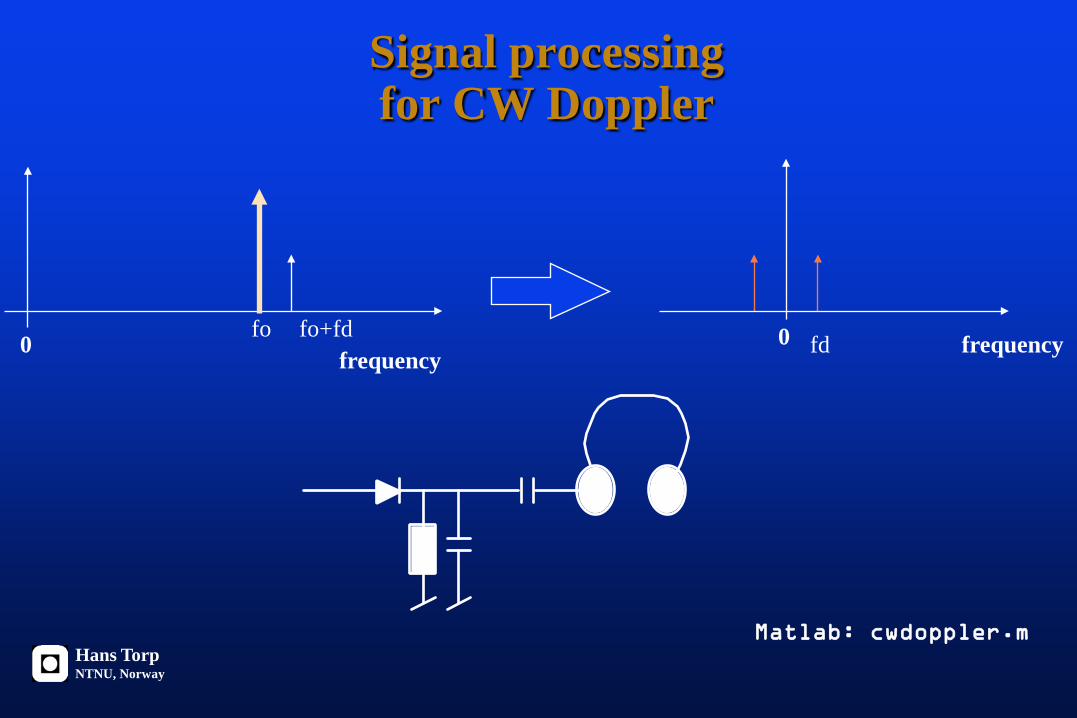
Signal processing for CW Doppler
fofrequency
fo+fd0 frequencyfd0
Hans TorpNTNU, Norway
Matlab: cwdoppler.m
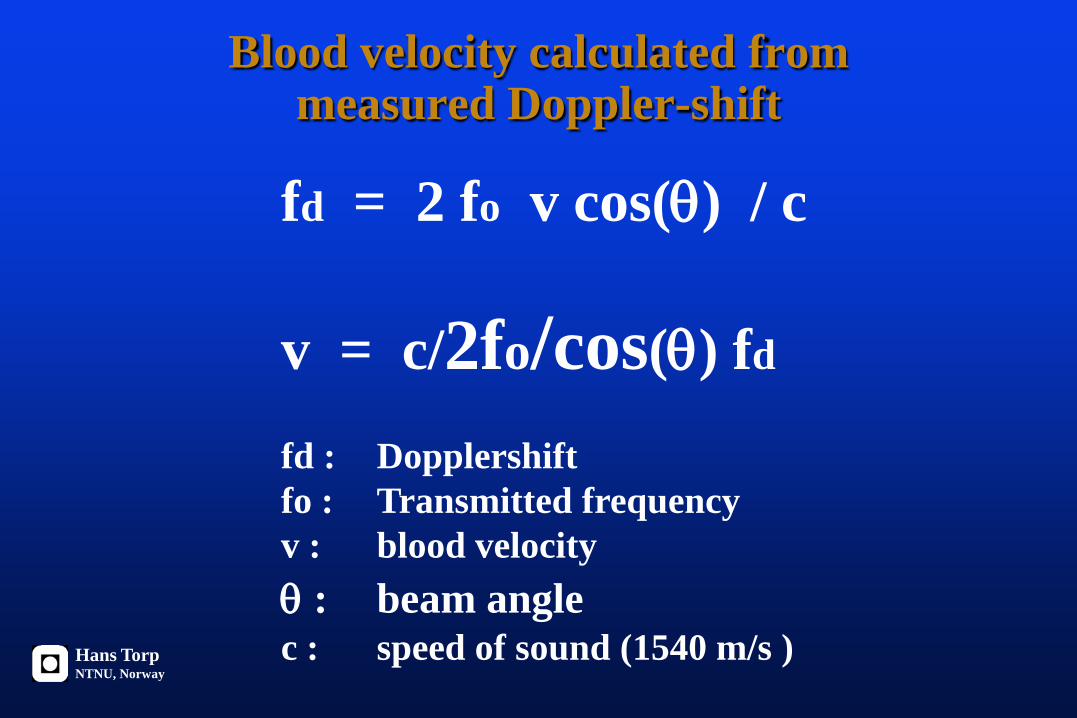
Blood velocity calculated from measured Doppler-shift
fd = 2 fo v cos(θ) / c
v = c/2fo/cos(θ) fd
fd : Dopplershiftfo : Transmitted frequencyv : blood velocity θ : beam anglec : speed of sound (1540 m/s )Hans Torp
NTNU, Norway
time
Velocity
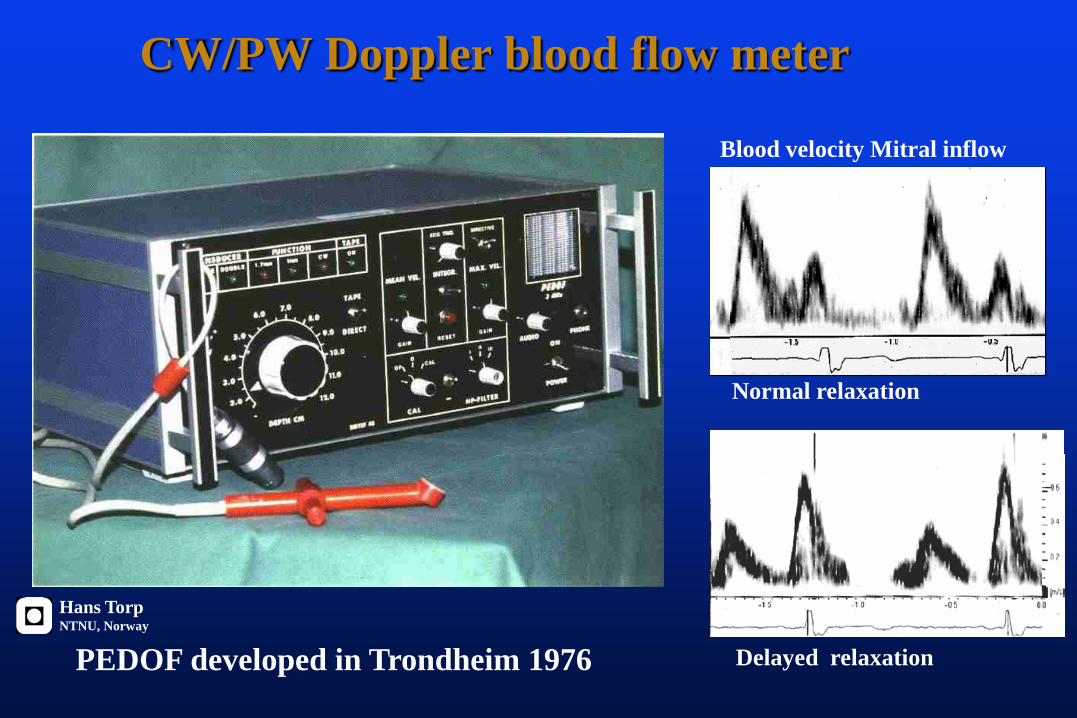
CW/PW Doppler blood flow meter
PEDOF developed in Trondheim 1976
Blood velocity Mitral inflow
Normal relaxation
Delayed relaxation
Hans TorpNTNU, Norway
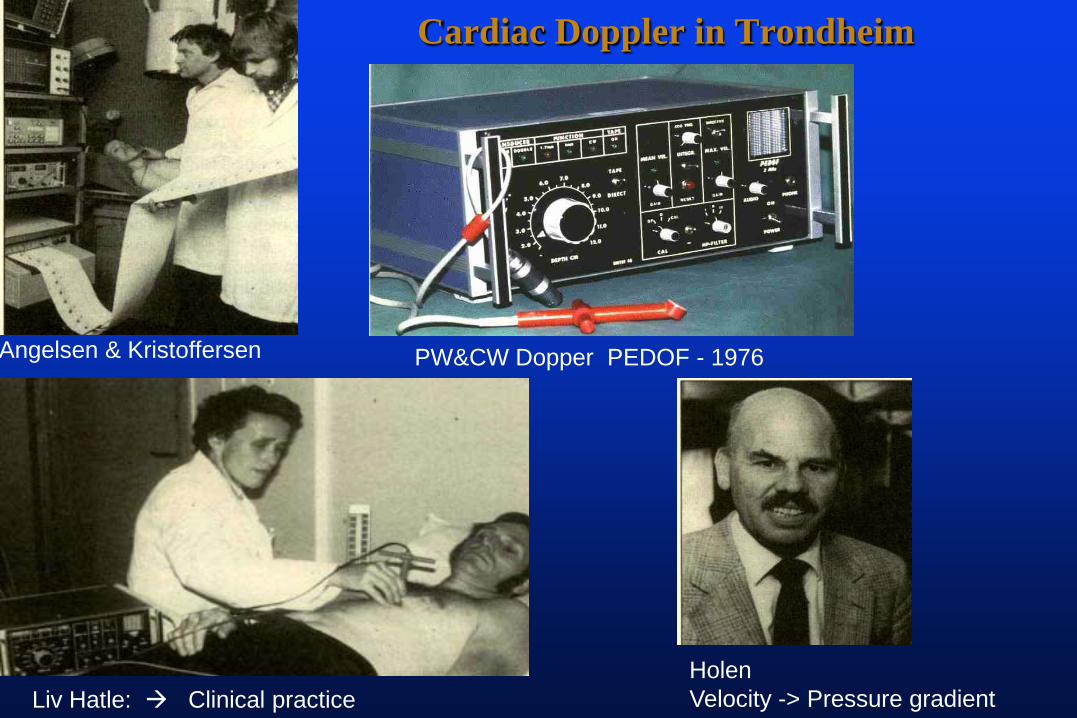
Angelsen & Kristoffersen PW&CW Dopper PEDOF - 1976
HolenVelocity -> Pressure gradientLiv Hatle: Clinical practice
Cardiac Doppler in Trondheim
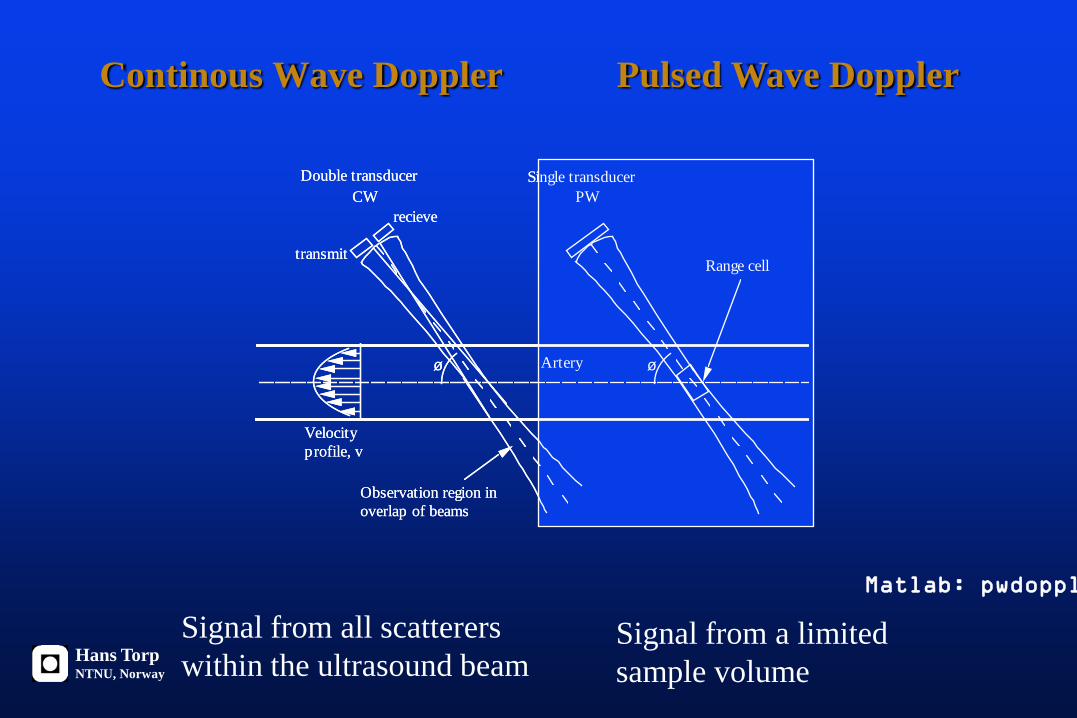
Continous Wave Doppler
ø
Single transducerPW
Double transducerCW
ø
transmit
recieve
Velocity profile, v
Artery
Range cell
Observation region in overlap of beams
Signal from all scattererswithin the ultrasound beam
Pulsed Wave Doppler
Signal from a limited sample volume
ø
Single transducerPW
Double transducerCW
ø
transmit
recieve
Velocity profile, v
Artery
Range cell
Observation region in overlap of beams
Hans TorpNTNU, Norway
Matlab: pwdoppl
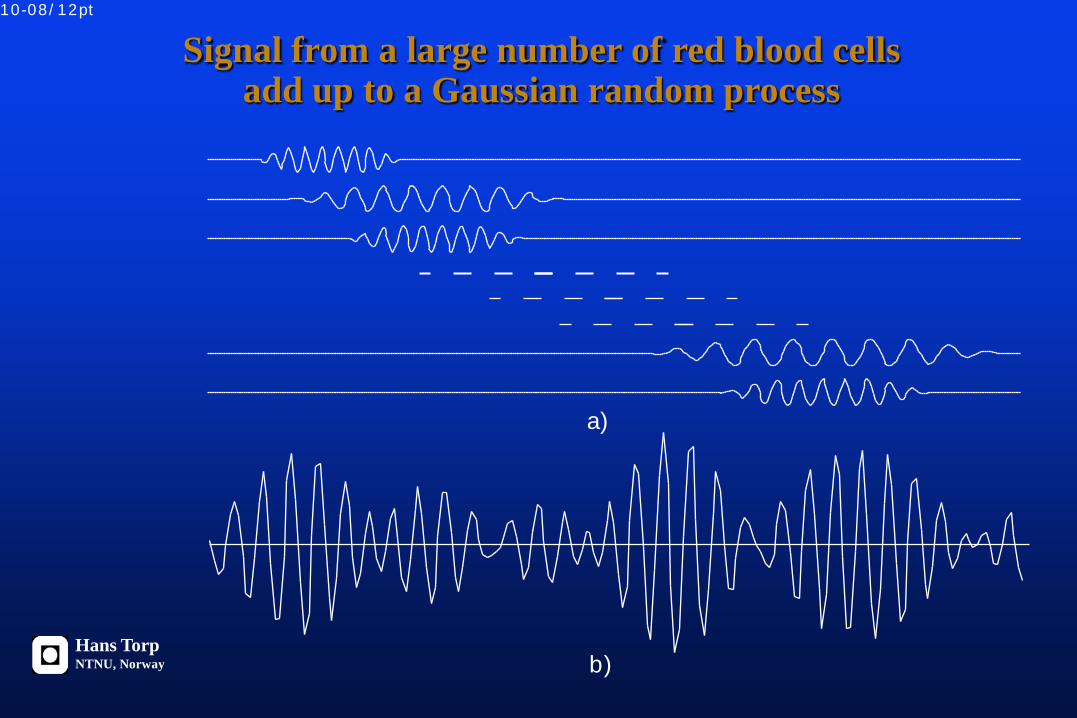
a)
b)
10-08/ 12pt
Hans TorpNTNU, Norway
Signal from a large number of red blood cellsadd up to a Gaussian random process
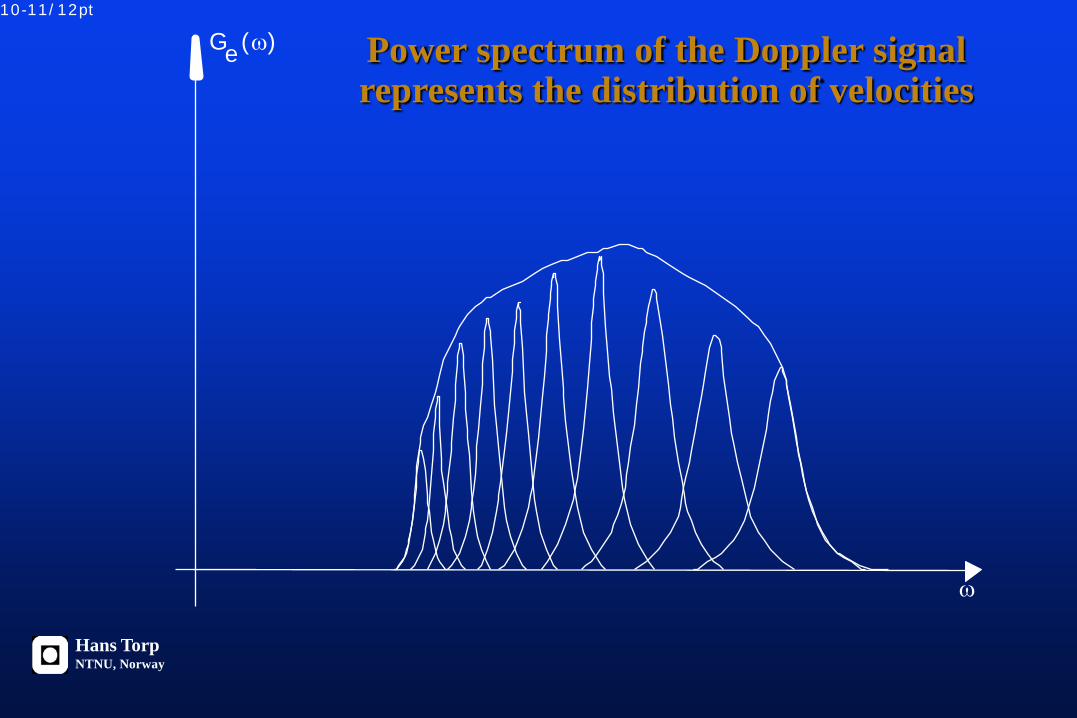
ω
G (ω)e
10-11/ 12pt
Hans TorpNTNU, Norway
Power spectrum of the Doppler signal represents the distribution of velocities
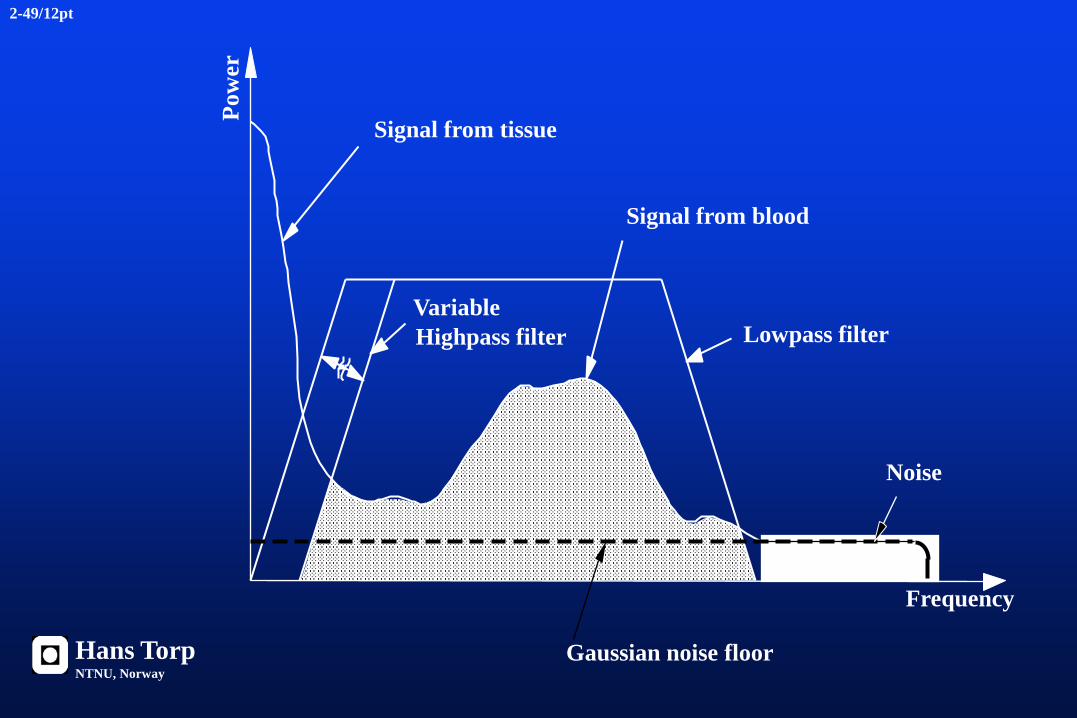
Variable Highpass filter
Signal from tissue
Pow
er
Frequency
Noise
Signal from blood
Lowpass filter
Gaussian noise floor
2-49/12pt
Hans TorpNTNU, Norway
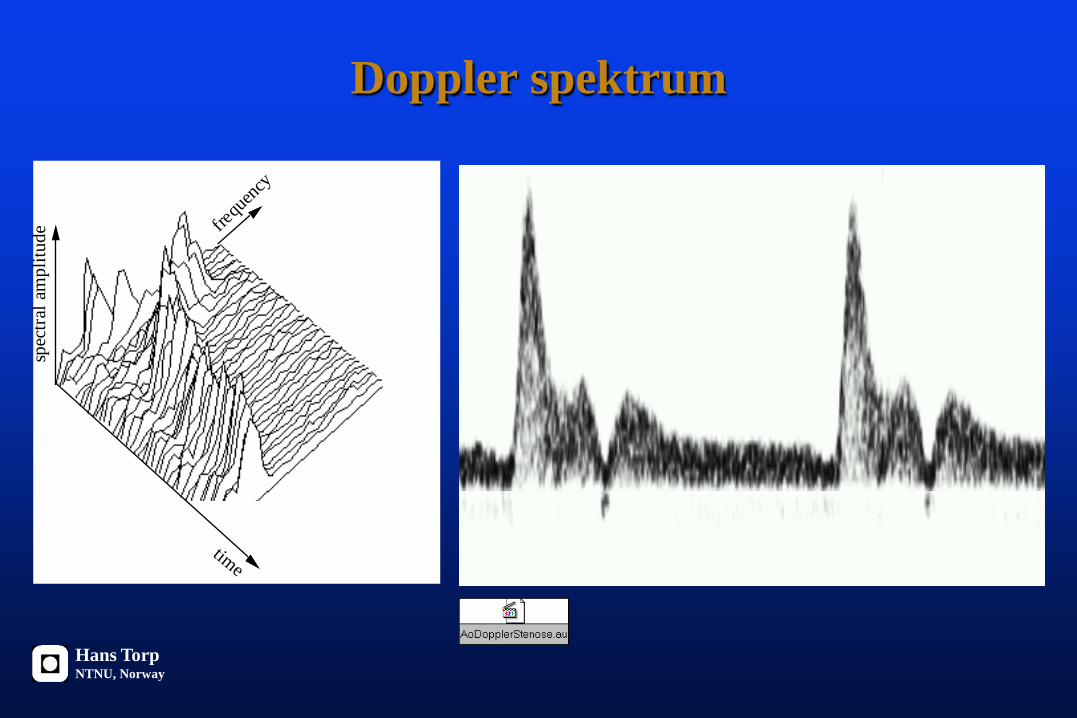
Doppler spektrum
frequ
ency
time
spec
tral a
mpl
itude
Hans TorpNTNU, Norway
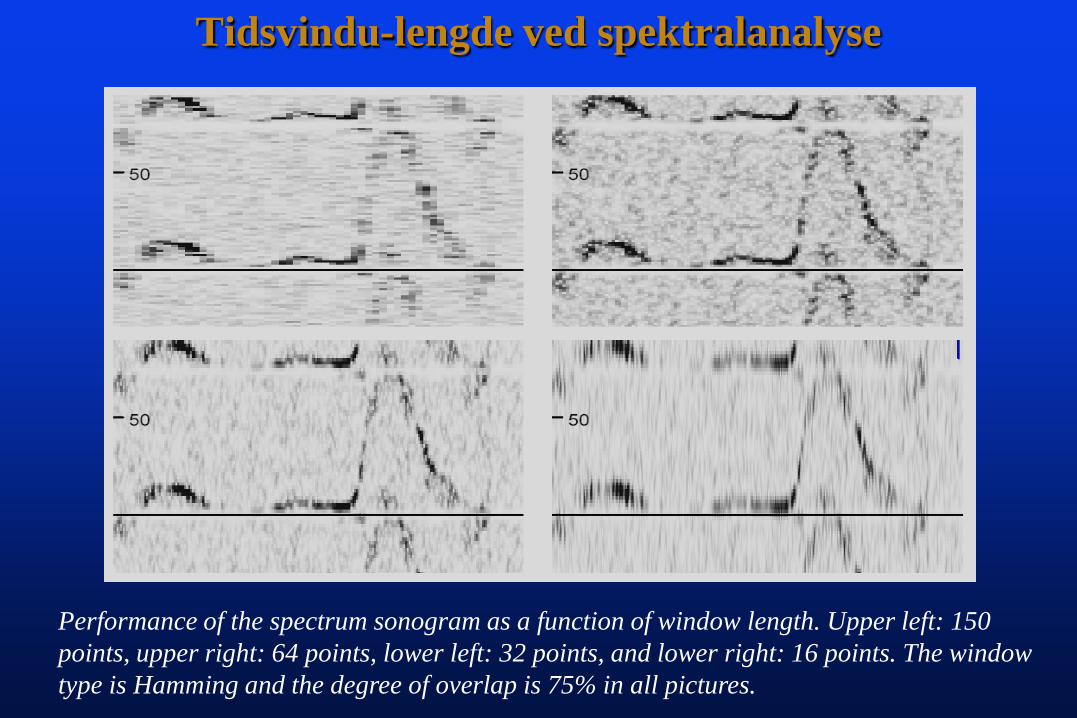
Tidsvindu-lengde ved spektralanalyse
Performance of the spectrum sonogram as a function of window length. Upper left: 150 points, upper right: 64 points, lower left: 32 points, and lower right: 16 points. The window type is Hamming and the degree of overlap is 75% in all pictures.
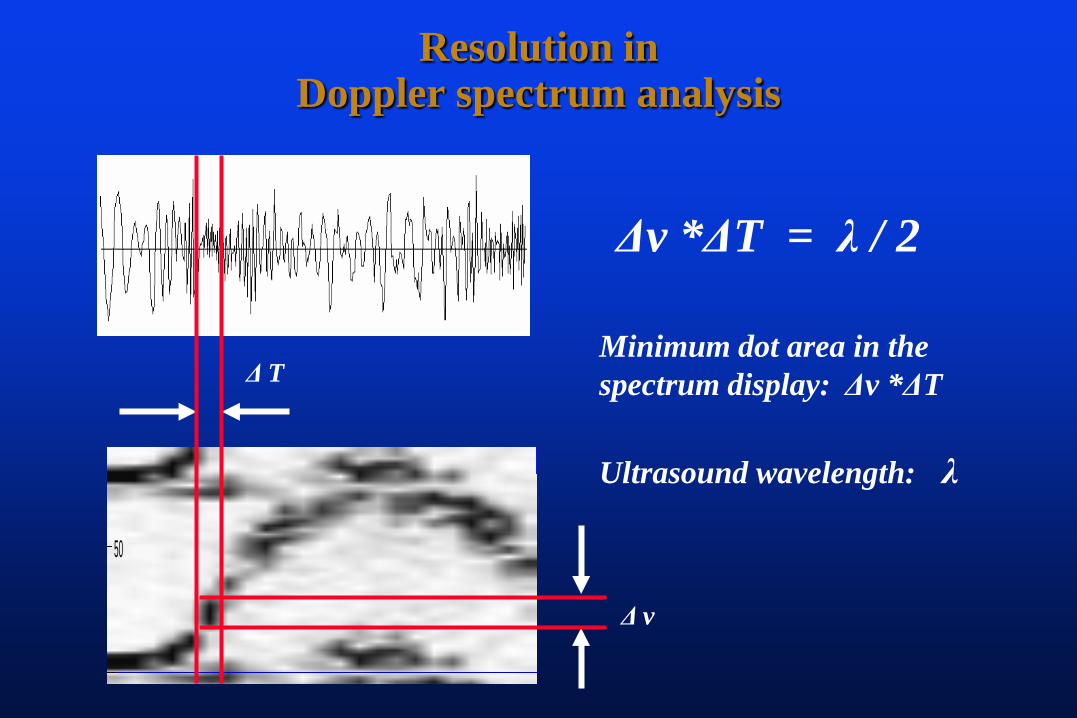
Resolution in Doppler spectrum analysis
50
Δ T
Δ v
Δv *ΔT = λ / 2
Minimum dot area in the spectrum display: Δv *ΔT
Ultrasound wavelength: λ
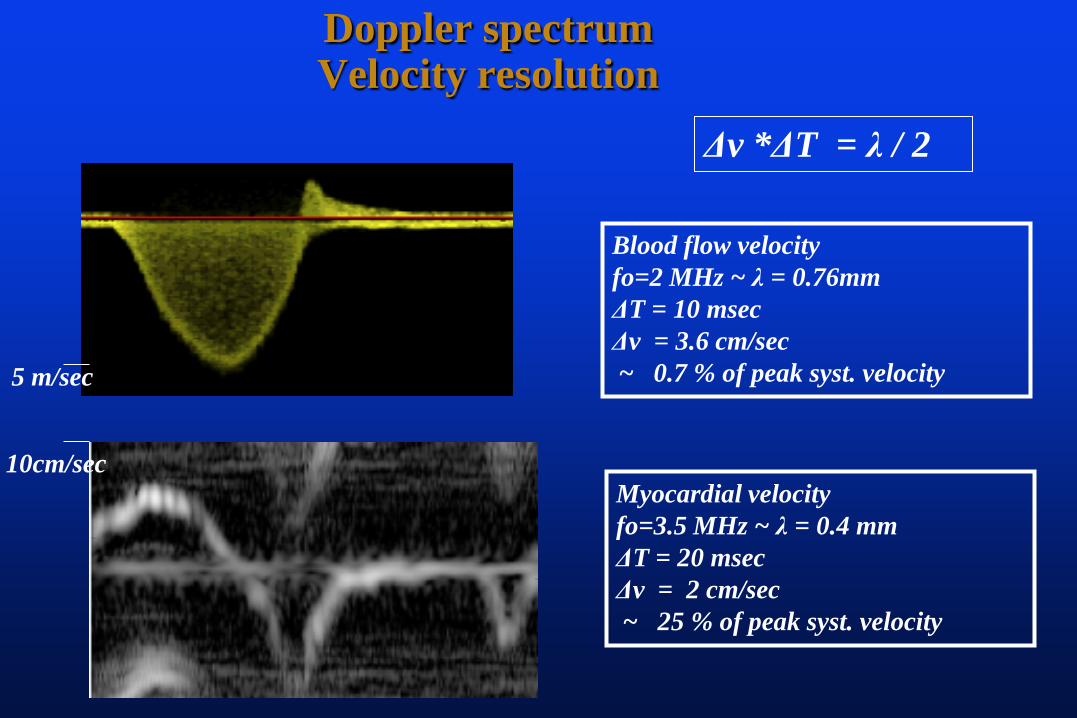
Doppler spectrumVelocity resolution
Blood flow velocityfo=2 MHz ~ λ = 0.76mmΔT = 10 msecΔv = 3.6 cm/sec ~ 0.7 % of peak syst. velocity
Myocardial velocityfo=3.5 MHz ~ λ = 0.4 mmΔT = 20 msecΔv = 2 cm/sec ~ 25 % of peak syst. velocity
Δv *ΔT = λ / 2
5 m/sec
10cm/sec
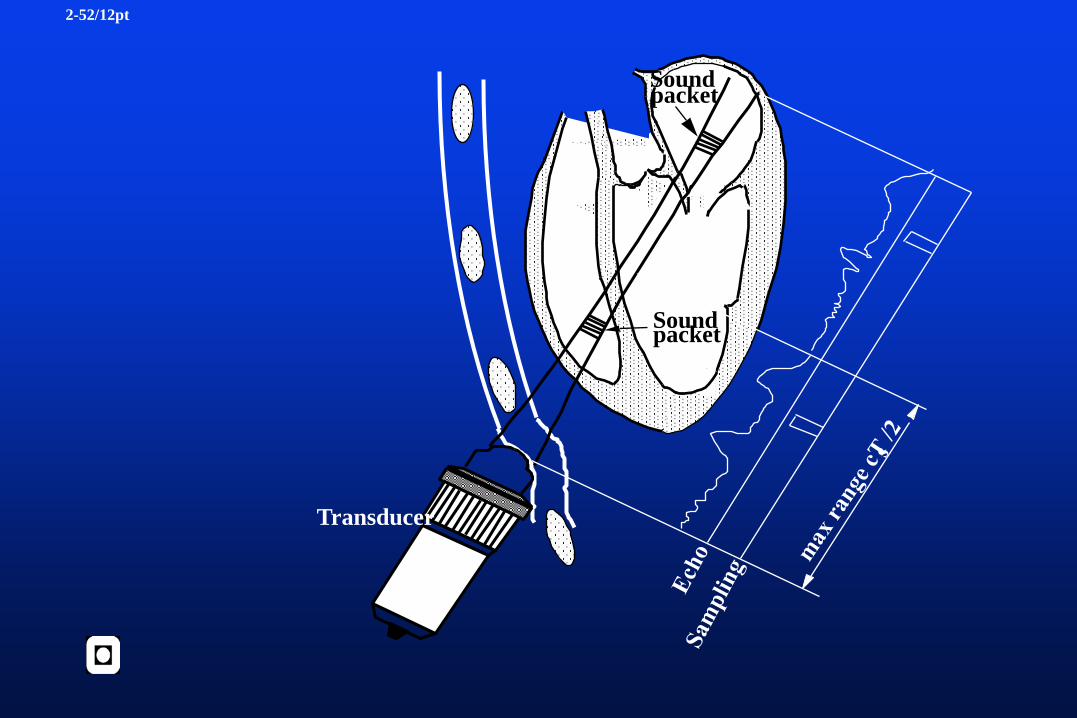
Sound packet
Transducer
Sound packet
2-52/12pt
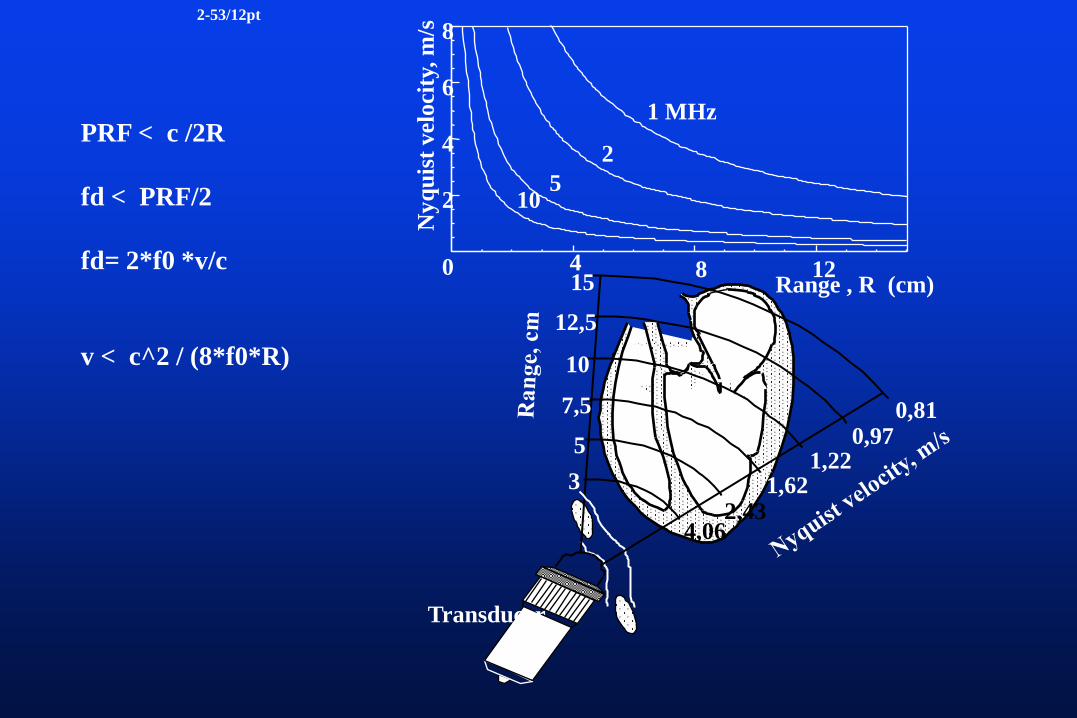
4 8 120
2
4
6
8
Range , R (cm)
Transducer
35
7,5
10
12,5
15
4,062,43
1,621,22
0,970,81
1 MHz
25
10
Nyq
uist
vel
ocity
, m/s
2-53/12pt
PRF < c /2R
fd < PRF/2
fd= 2*f0 *v/c
v < c^2 / (8*f0*R)
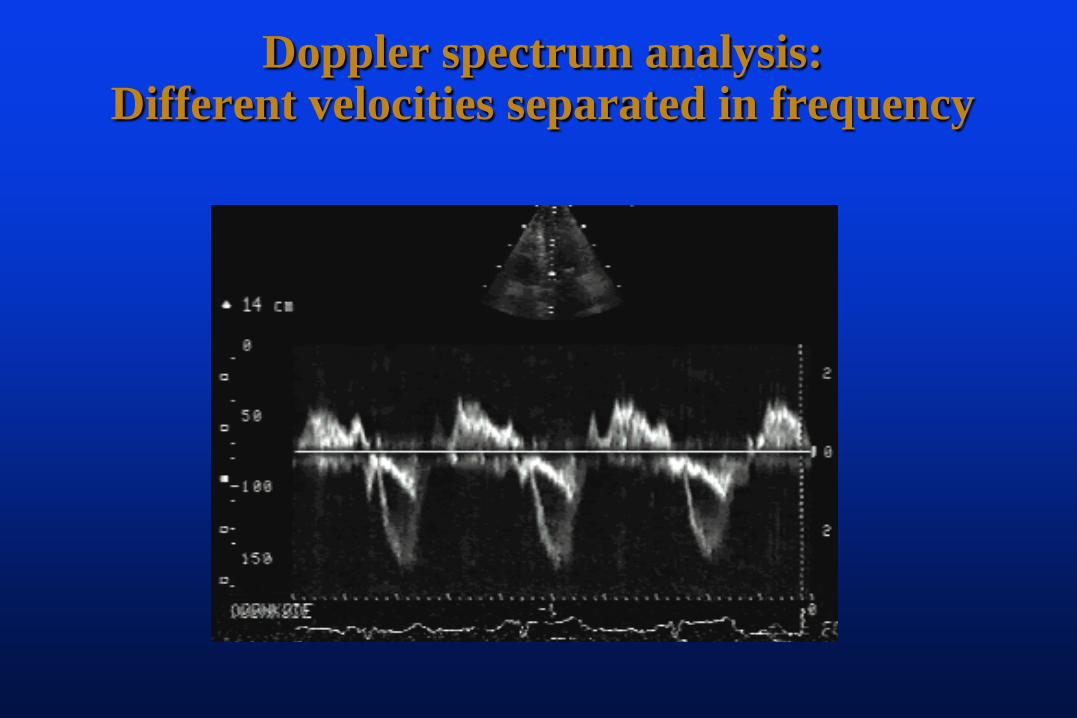
Doppler spectrum analysis:Different velocities separated in frequency
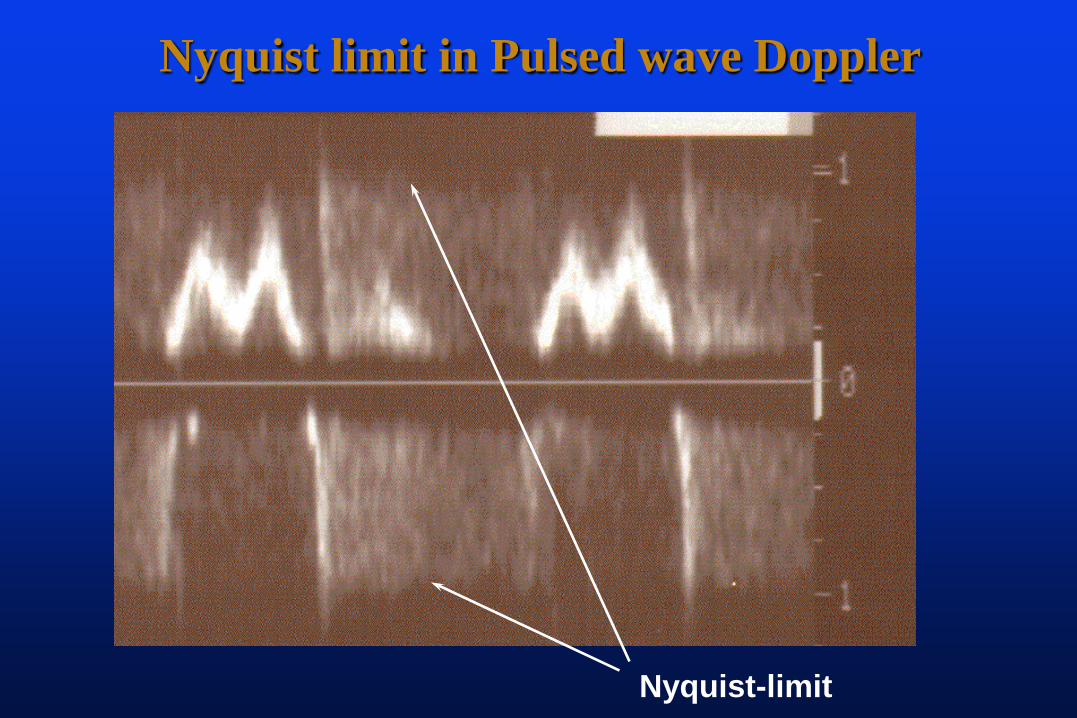
Nyquist limit in Pulsed wave Doppler
Nyquist-limit
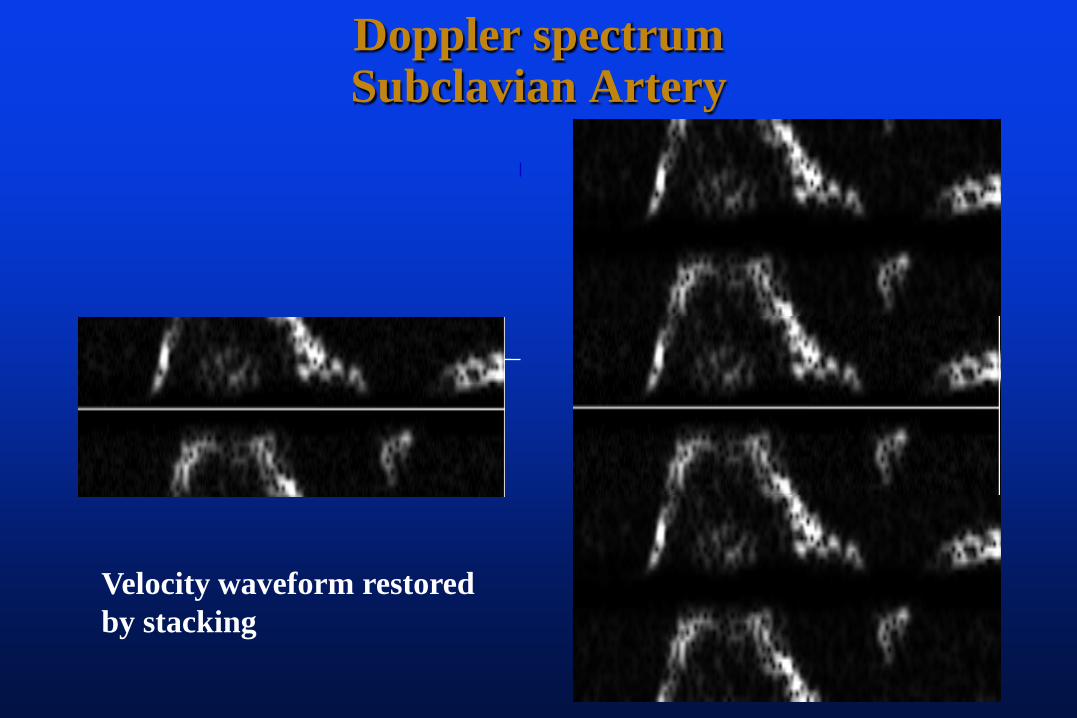
Doppler spectrumSubclavian Artery
Velocity waveform restoredby stacking