Embed Size (px)
Citation preview
2011 Kentucky
County Health Rankings 2011: Kentucky
1 www.countyhealthrankings.org/kentucky
Introduction Where we live matters to our health. The health of a
community depends on many different factors, including
quality of health care, individual behavior, education and
jobs, and the environment. We can improve a
community’s health through programs and policies. For
example, people who live in communities with ample
park and recreation space are more likely to exercise,
which reduces heart disease risk. People who live in
communities with smoke-free laws are less likely to
smoke or to be exposed to second-hand smoke, which
reduces lung cancer risk.
The problem is that there are big differences in health
across communities, with some places being much
healthier than others. And up to now, it has been hard to
get a standard way to measure how healthy a county is
and see where they can improve.
The Robert Wood Johnson Foundation and the
University of Wisconsin Population Health Institute are
pleased to present the 2011 County Health Rankings, a
collection of 50 reports that reflect the overall health of
counties in every state across the country. For the
second year in a row, counties can get a snapshot of
how healthy their residents are by comparing their overall
health and the factors that influence their health with
other counties in their state. This allows communities to
see county-to-county where they are doing well and
where they need to improve.
Everyone has a stake in community health. We all need
to work together to find solutions. The County Health
Rankings serve as both a call to action and a needed tool
in this effort.
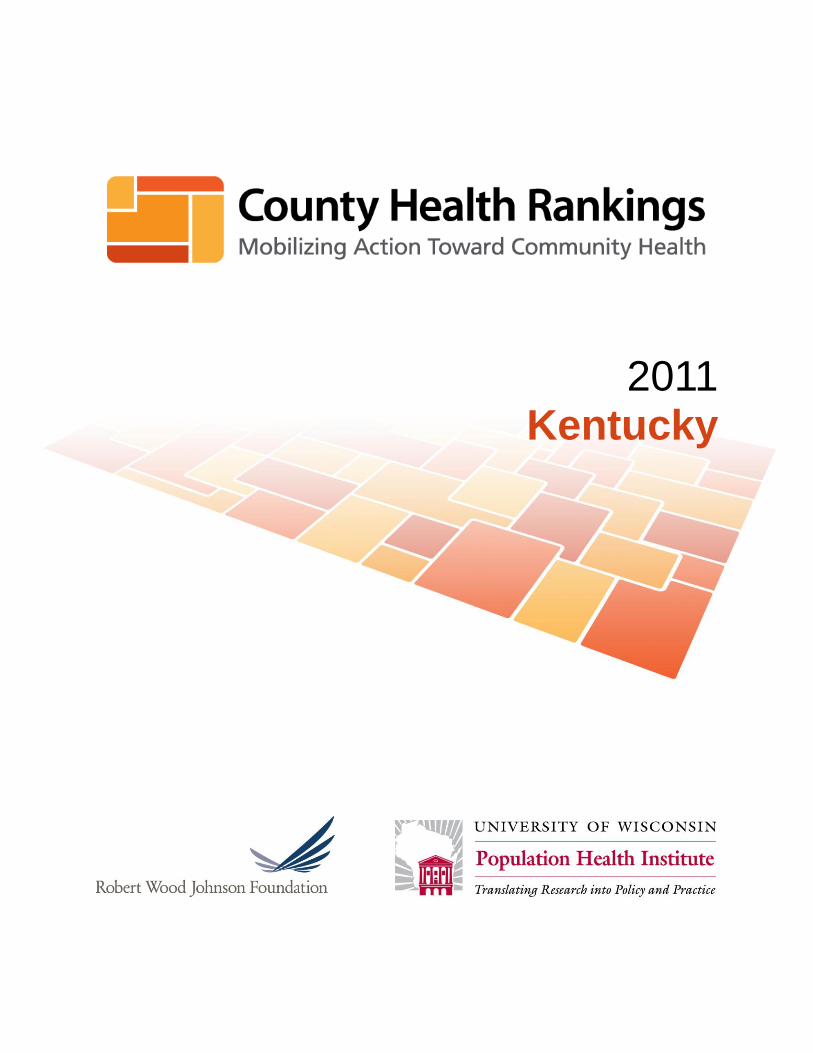
All of the County Health Rankings are based upon this
model of population health improvement:
In this model, health outcomes are measures that
describe the current health status of a county. These
health outcomes are influenced by a set of health factors.
These health factors and their outcomes may also be
affected by community-based programs and policies
designed to alter their distribution in the community.
Counties can improve health outcomes by addressing all
health factors with effective, evidence-based programs
and policies.
To compile the Rankings, we built on our prior work in
Wisconsin, obtained input from a team of expert
advisors, and worked closely with staff from the National
Center for Health Statistics. Together we selected a
number of population health measures based on
scientific relevance, importance, and availability of data
at the county level.
For a more detailed explanation of our approach, the
methods used to compile the Rankings, information on
the action steps communities can take to improve their
health, and examples of communities in action, see
www.countyhealthrankings.org
County Health Rankings 2011: Kentucky
www.countyhealthrankings.org/kentucky 2
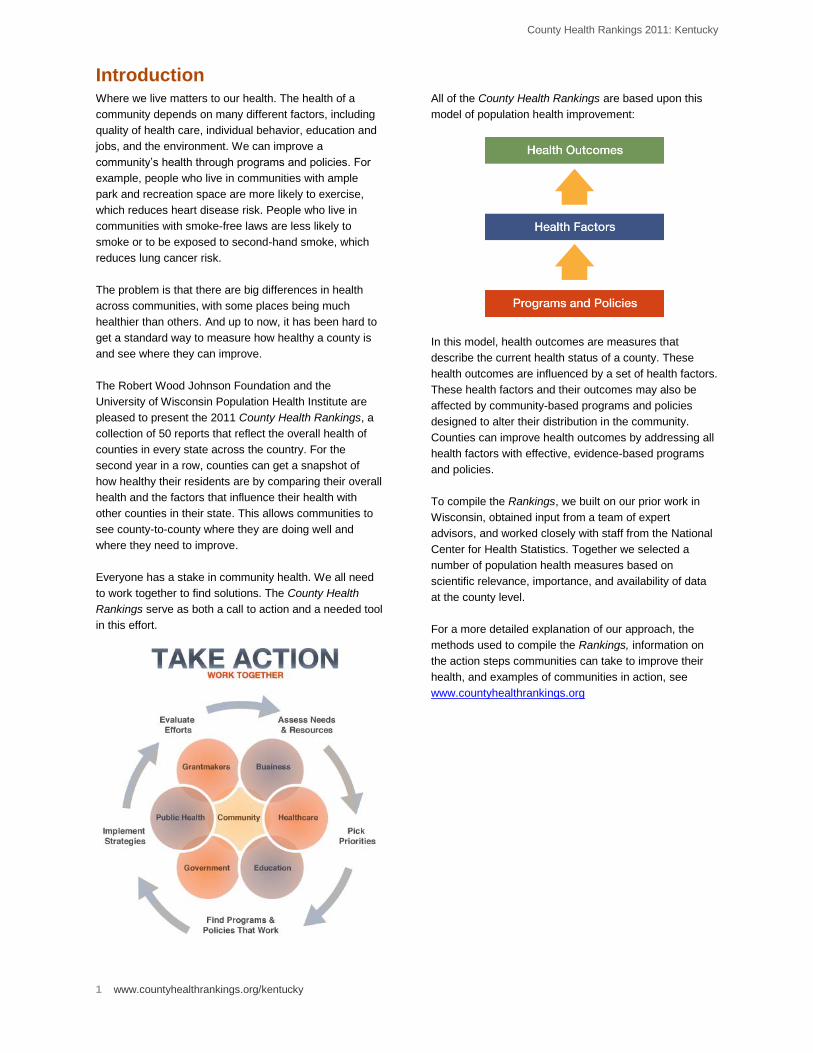
The Rankings This report ranks Kentucky counties according to their
summary measures of health outcomes and health
factors, as well as the components used to create each
summary measure. The figure below depicts the
structure of the Rankings model. Counties receive a rank
for each population health component; those having high
ranks (e.g., 1 or 2) are estimated to be the “healthiest.”
Our summary health outcomes rankings are based on
an equal weighting of mortality and morbidity measures.
The summary health factors rankings are based on
weighted scores of four types of factors: behavioral,
clinical, social and economic, and environmental. The
weights for the factors (shown in parentheses in the
figure) are based upon a review of the literature and
expert input, but represent just one way of combining
these factors.
County Health Rankings 2011: Kentucky
3 www.countyhealthrankings.org/kentucky
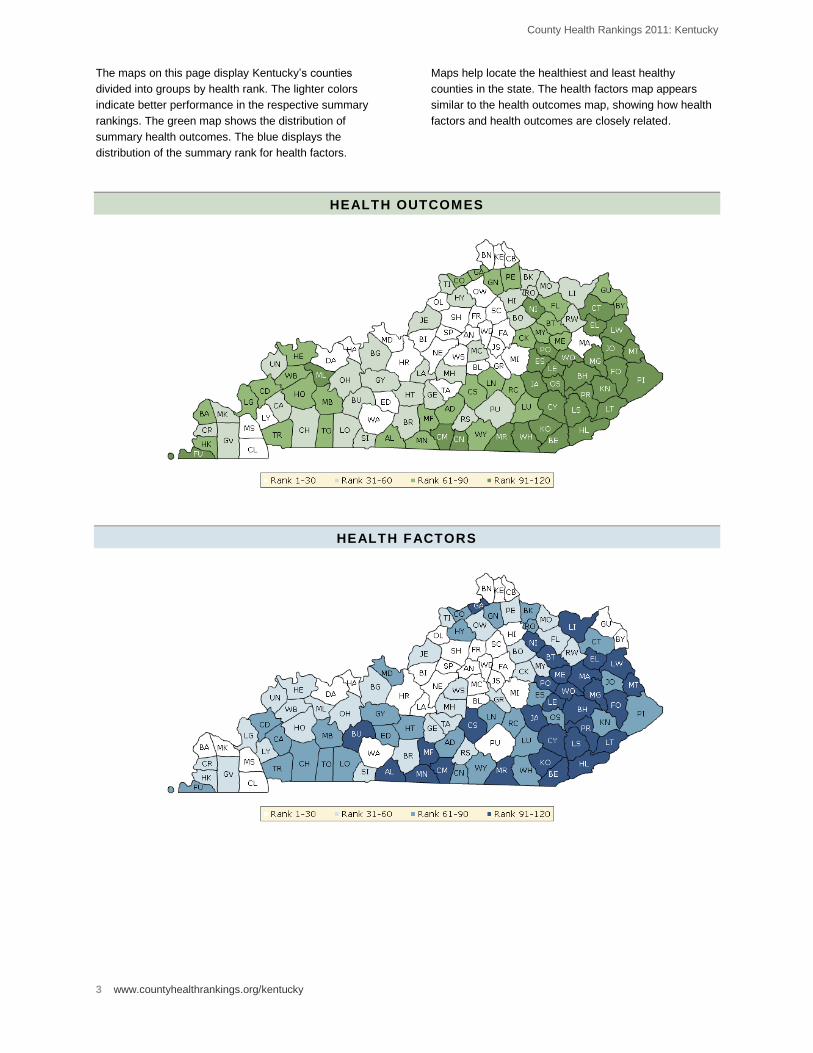
The maps on this page display Kentucky’s counties
divided into groups by health rank. The lighter colors
indicate better performance in the respective summary
rankings. The green map shows the distribution of
summary health outcomes. The blue displays the
distribution of the summary rank for health factors.
Maps help locate the healthiest and least healthy
counties in the state. The health factors map appears
similar to the health outcomes map, showing how health
factors and health outcomes are closely related.
HEALTH OUTCOMES
HEALTH FACTORS
County Health Rankings 2011: Kentucky
www.countyhealthrankings.org/kentucky 4
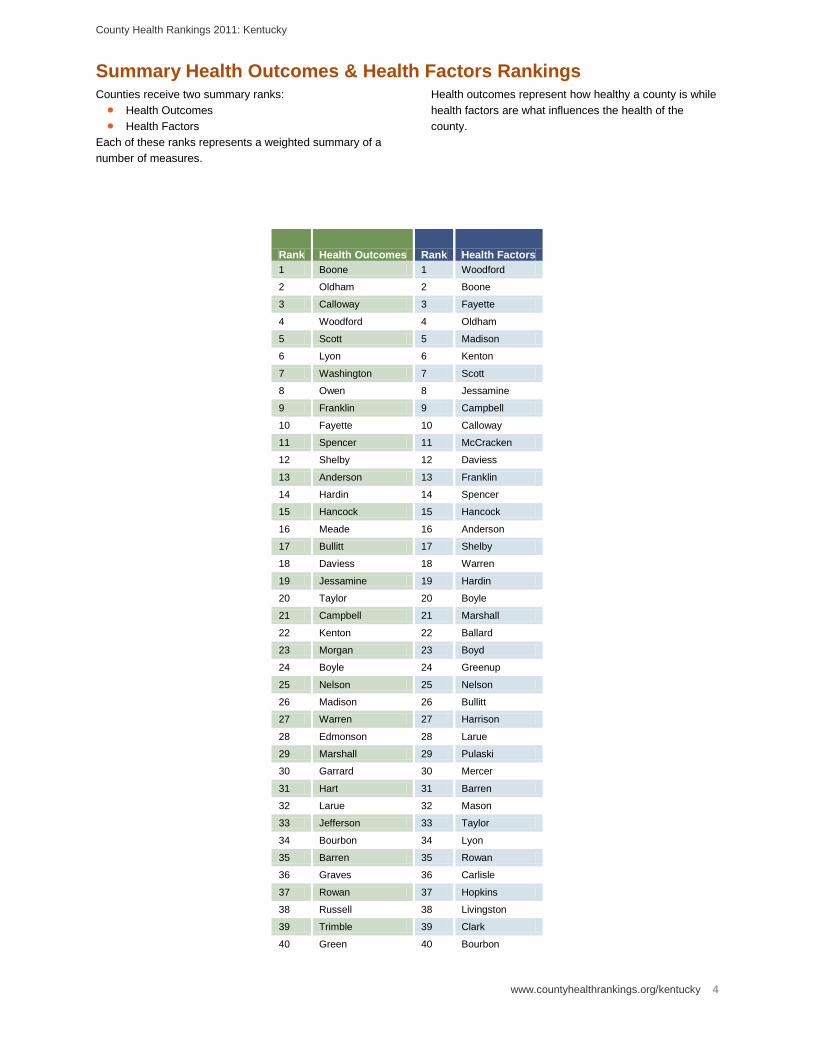
Summary Health Outcomes & Health Factors Rankings Counties receive two summary ranks:
Health Outcomes
Health Factors
Each of these ranks represents a weighted summary of a
number of measures.
Health outcomes represent how healthy a county is while
health factors are what influences the health of the
county.
Rank Health Outcomes Rank Health Factors
1 Boone 1 Woodford
2 Oldham 2 Boone
3 Calloway 3 Fayette
4 Woodford 4 Oldham
5 Scott 5 Madison
6 Lyon 6 Kenton
7 Washington 7 Scott
8 Owen 8 Jessamine
9 Franklin 9 Campbell
10 Fayette 10 Calloway
11 Spencer 11 McCracken
12 Shelby 12 Daviess
13 Anderson 13 Franklin
14 Hardin 14 Spencer
15 Hancock 15 Hancock
16 Meade 16 Anderson
17 Bullitt 17 Shelby
18 Daviess 18 Warren
19 Jessamine 19 Hardin
20 Taylor 20 Boyle
21 Campbell 21 Marshall
22 Kenton 22 Ballard
23 Morgan 23 Boyd
24 Boyle 24 Greenup
25 Nelson 25 Nelson
26 Madison 26 Bullitt
27 Warren 27 Harrison
28 Edmonson 28 Larue
29 Marshall 29 Pulaski
30 Garrard 30 Mercer
31 Hart 31 Barren
32 Larue 32 Mason
33 Jefferson 33 Taylor
34 Bourbon 34 Lyon
35 Barren 35 Rowan
36 Graves 36 Carlisle
37 Rowan 37 Hopkins
38 Russell 38 Livingston
39 Trimble 39 Clark
40 Green 40 Bourbon
County Health Rankings 2011: Kentucky
5 www.countyhealthrankings.org/kentucky
Rank Health Outcomes Rank Health Factors
41 Harrison 41 Garrard
42 Simpson 42 Green
43 Henry 43 Washington
44 Mercer 44 McLean
45 McCracken 45 Ohio
46 Christian 46 Marion
47 Logan 47 Montgomery
48 Caldwell 48 Simpson
49 Union 49 Graves
50 Mason 50 Trimble
51 Carlisle 51 Henderson
52 Bracken 52 Owen
53 Marion 53 Fleming
54 Butler 54 Union
55 Lewis 55 Russell
56 Grayson 56 Webster
57 Breckinridge 57 Jefferson
58 Pulaski 58 Hickman
59 Ohio 59 Pendleton
60 Robertson 60 Breckinridge
61 Allen 61 Whitley
62 Wayne 62 Robertson
63 Adair 63 Logan
64 Rockcastle 64 Clinton
65 Carroll 65 Laurel
66 Fleming 66 Caldwell
67 Webster 67 Muhlenberg
68 Muhlenberg 68 Meade
69 Monroe 69 Fulton
70 Trigg 70 Trigg
71 Hopkins 71 Grant
72 Montgomery 72 Henry
73 Greenup 73 Todd
74 Henderson 74 Johnson
75 Gallatin 75 Wayne
76 Hickman 76 Crittenden
77 Laurel 77 Rockcastle
78 Bath 78 Grayson
79 Menifee 79 Carroll
80 Boyd 80 Estill
81 Lincoln 81 Lincoln
82 Todd 82 Hart
83 Ballard 83 Bracken
84 Grant 84 Carter
85 Pendleton 85 Knott
86 Livingston 86 Pike
87 Clark 87 Edmonson
88 Casey 88 Owsley
County Health Rankings 2011: Kentucky
www.countyhealthrankings.org/kentucky 6
Rank Health Outcomes Rank Health Factors
89 Crittenden 89 Christian
90 Metcalfe 90 Adair
91 Carter 91 Casey
92 Estill 92 Butler
93 Clinton 93 Perry
94 McLean 94 Harlan
95 McCreary 95 Nicholas
96 Leslie 96 Gallatin
97 Cumberland 97 Floyd
98 Powell 98 Allen
99 Johnson 99 Letcher
100 Whitley 100 Bell
101 Lee 101 Lawrence
102 Bell 102 Cumberland
103 Elliott 103 Monroe
104 Breathitt 104 Metcalfe
105 Lawrence 105 Elliott
106 Nicholas 106 Morgan
107 Knox 107 Lee
108 Jackson 108 Lewis
109 Clay 109 Knox
110 Floyd 110 Powell
111 Knott 111 Martin
112 Letcher 112 Bath
113 Harlan 113 Wolfe
114 Pike 114 Leslie
115 Perry 115 Menifee
116 Magoffin 116 Magoffin
117 Fulton 117 Breathitt
118 Wolfe 118 Jackson
119 Martin 119 Clay
120 Owsley 120 McCreary
County Health Rankings 2011: Kentucky
7 www.countyhealthrankings.org/kentucky
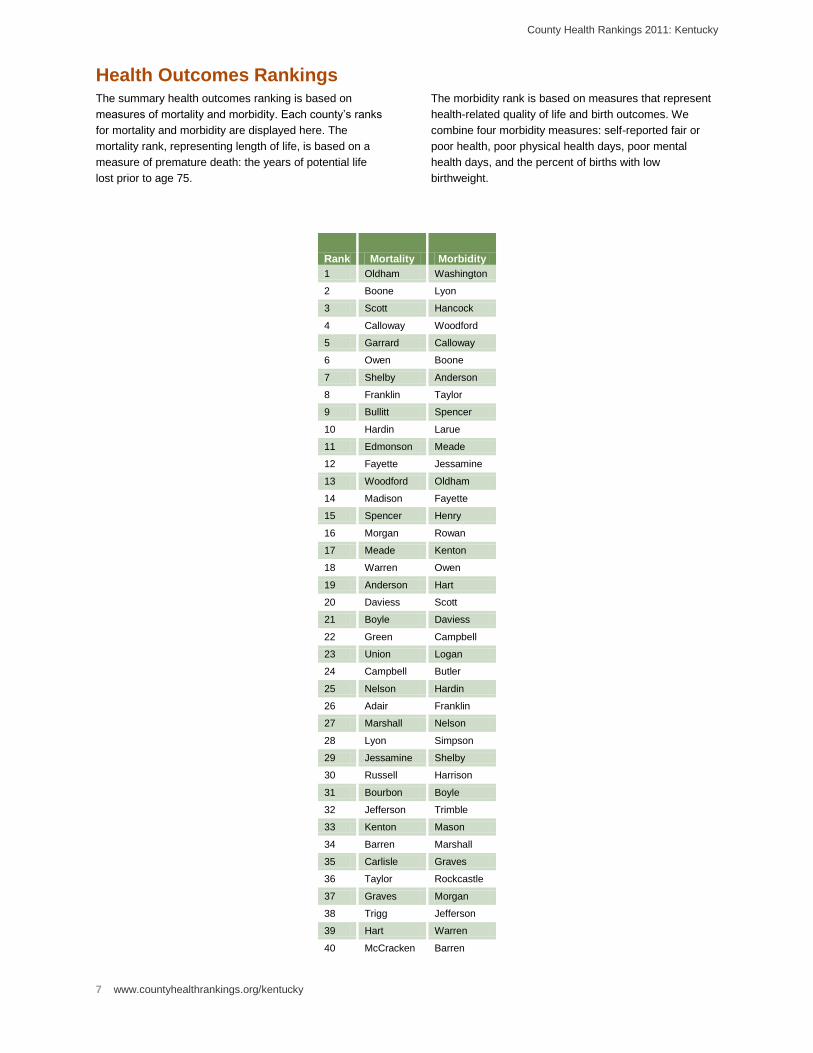
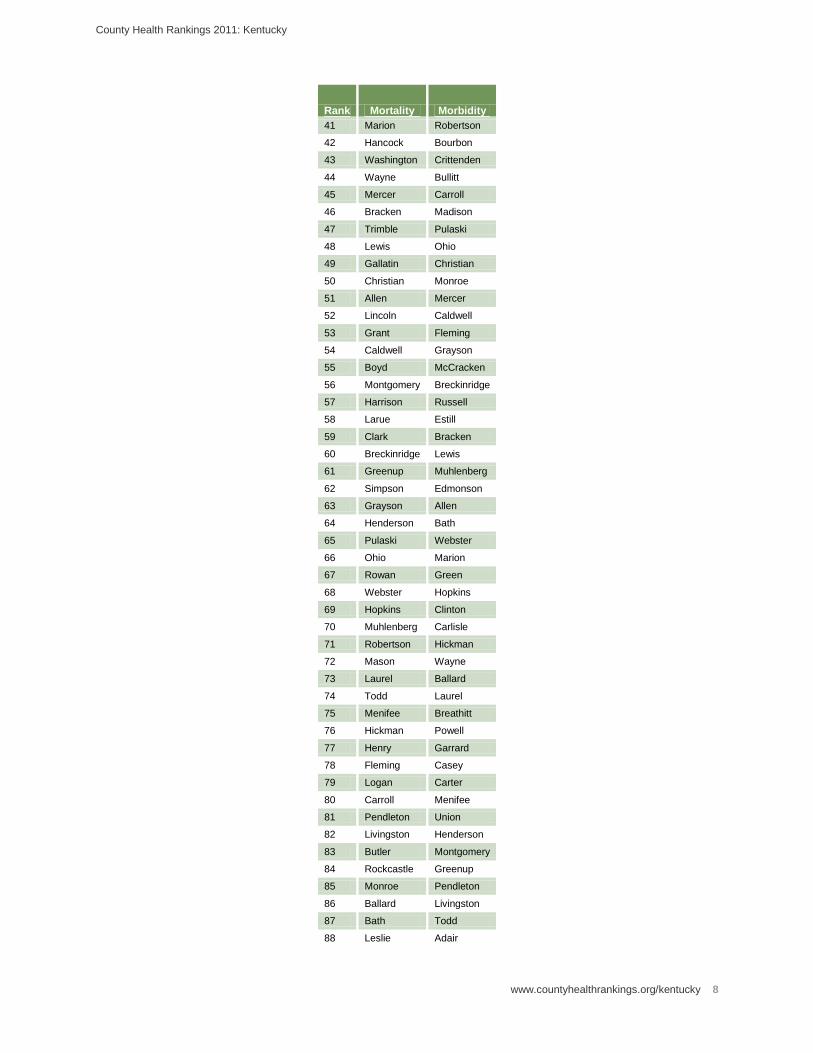
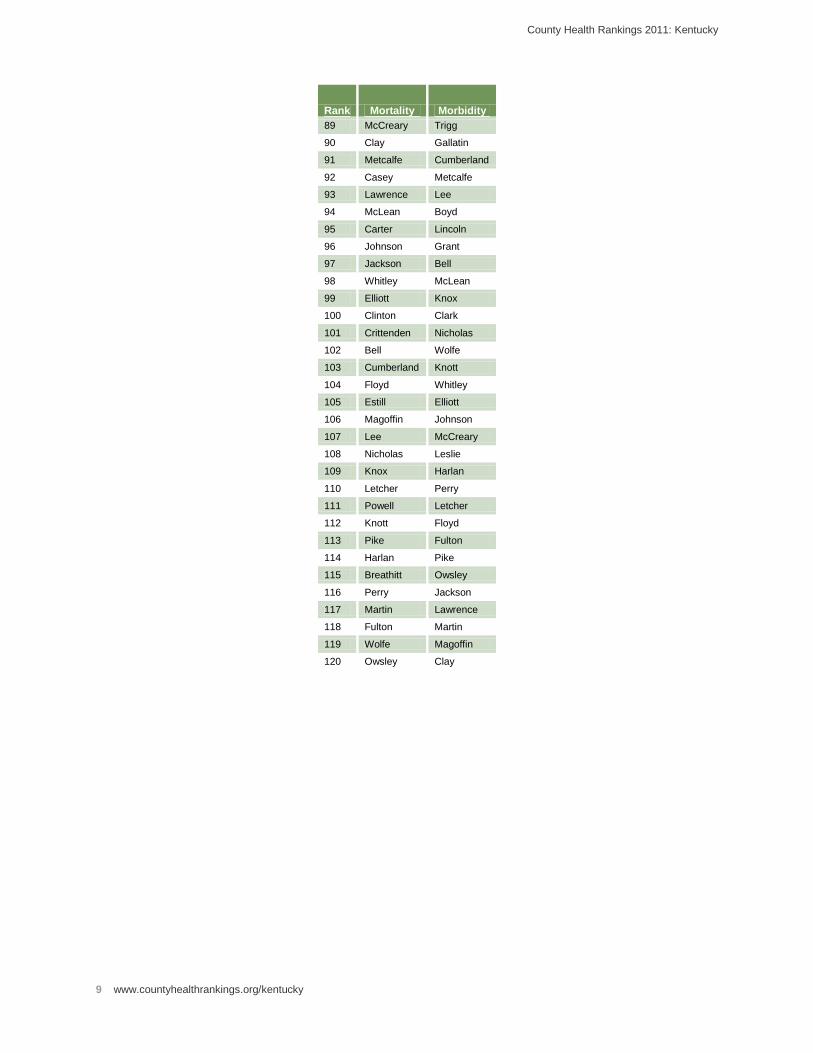
Health Outcomes Rankings The summary health outcomes ranking is based on
measures of mortality and morbidity. Each county’s ranks
for mortality and morbidity are displayed here. The
mortality rank, representing length of life, is based on a
measure of premature death: the years of potential life
lost prior to age 75.
The morbidity rank is based on measures that represent
health-related quality of life and birth outcomes. We
combine four morbidity measures: self-reported fair or
poor health, poor physical health days, poor mental
health days, and the percent of births with low
birthweight.
Rank Mortality Morbidity
1 Oldham Washington
2 Boone Lyon
3 Scott Hancock
4 Calloway Woodford
5 Garrard Calloway
6 Owen Boone
7 Shelby Anderson
8 Franklin Taylor
9 Bullitt Spencer
10 Hardin Larue
11 Edmonson Meade
12 Fayette Jessamine
13 Woodford Oldham
14 Madison Fayette
15 Spencer Henry
16 Morgan Rowan
17 Meade Kenton
18 Warren Owen
19 Anderson Hart
20 Daviess Scott
21 Boyle Daviess
22 Green Campbell
23 Union Logan
24 Campbell Butler
25 Nelson Hardin
26 Adair Franklin
27 Marshall Nelson
28 Lyon Simpson
29 Jessamine Shelby
30 Russell Harrison
31 Bourbon Boyle
32 Jefferson Trimble
33 Kenton Mason
34 Barren Marshall
35 Carlisle Graves
36 Taylor Rockcastle
37 Graves Morgan
38 Trigg Jefferson
39 Hart Warren
40 McCracken Barren
County Health Rankings 2011: Kentucky
www.countyhealthrankings.org/kentucky 8
Rank Mortality Morbidity
41 Marion Robertson
42 Hancock Bourbon
43 Washington Crittenden
44 Wayne Bullitt
45 Mercer Carroll
46 Bracken Madison
47 Trimble Pulaski
48 Lewis Ohio
49 Gallatin Christian
50 Christian Monroe
51 Allen Mercer
52 Lincoln Caldwell
53 Grant Fleming
54 Caldwell Grayson
55 Boyd McCracken
56 Montgomery Breckinridge
57 Harrison Russell
58 Larue Estill
59 Clark Bracken
60 Breckinridge Lewis
61 Greenup Muhlenberg
62 Simpson Edmonson
63 Grayson Allen
64 Henderson Bath
65 Pulaski Webster
66 Ohio Marion
67 Rowan Green
68 Webster Hopkins
69 Hopkins Clinton
70 Muhlenberg Carlisle
71 Robertson Hickman
72 Mason Wayne
73 Laurel Ballard
74 Todd Laurel
75 Menifee Breathitt
76 Hickman Powell
77 Henry Garrard
78 Fleming Casey
79 Logan Carter
80 Carroll Menifee
81 Pendleton Union
82 Livingston Henderson
83 Butler Montgomery
84 Rockcastle Greenup
85 Monroe Pendleton
86 Ballard Livingston
87 Bath Todd
88 Leslie Adair
County Health Rankings 2011: Kentucky
9 www.countyhealthrankings.org/kentucky
Rank Mortality Morbidity
89 McCreary Trigg
90 Clay Gallatin
91 Metcalfe Cumberland
92 Casey Metcalfe
93 Lawrence Lee
94 McLean Boyd
95 Carter Lincoln
96 Johnson Grant
97 Jackson Bell
98 Whitley McLean
99 Elliott Knox
100 Clinton Clark
101 Crittenden Nicholas
102 Bell Wolfe
103 Cumberland Knott
104 Floyd Whitley
105 Estill Elliott
106 Magoffin Johnson
107 Lee McCreary
108 Nicholas Leslie
109 Knox Harlan
110 Letcher Perry
111 Powell Letcher
112 Knott Floyd
113 Pike Fulton
114 Harlan Pike
115 Breathitt Owsley
116 Perry Jackson
117 Martin Lawrence
118 Fulton Martin
119 Wolfe Magoffin
120 Owsley Clay
County Health Rankings 2011: Kentucky
www.countyhealthrankings.org/kentucky 10
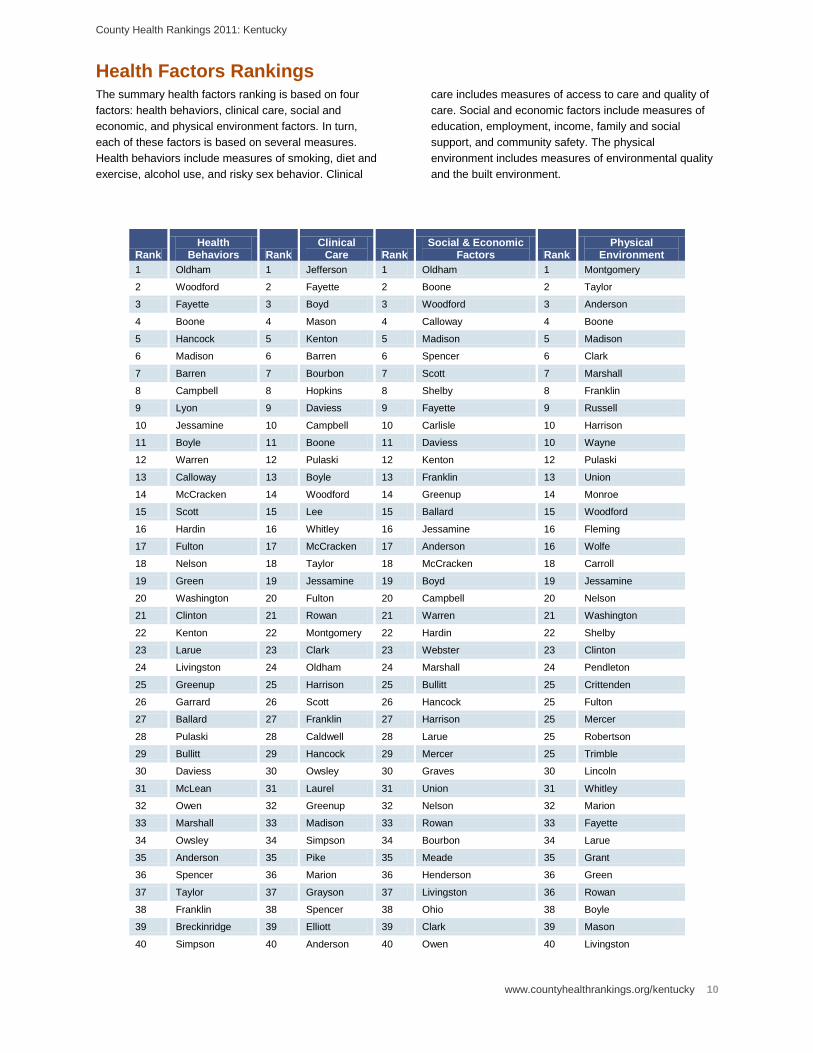
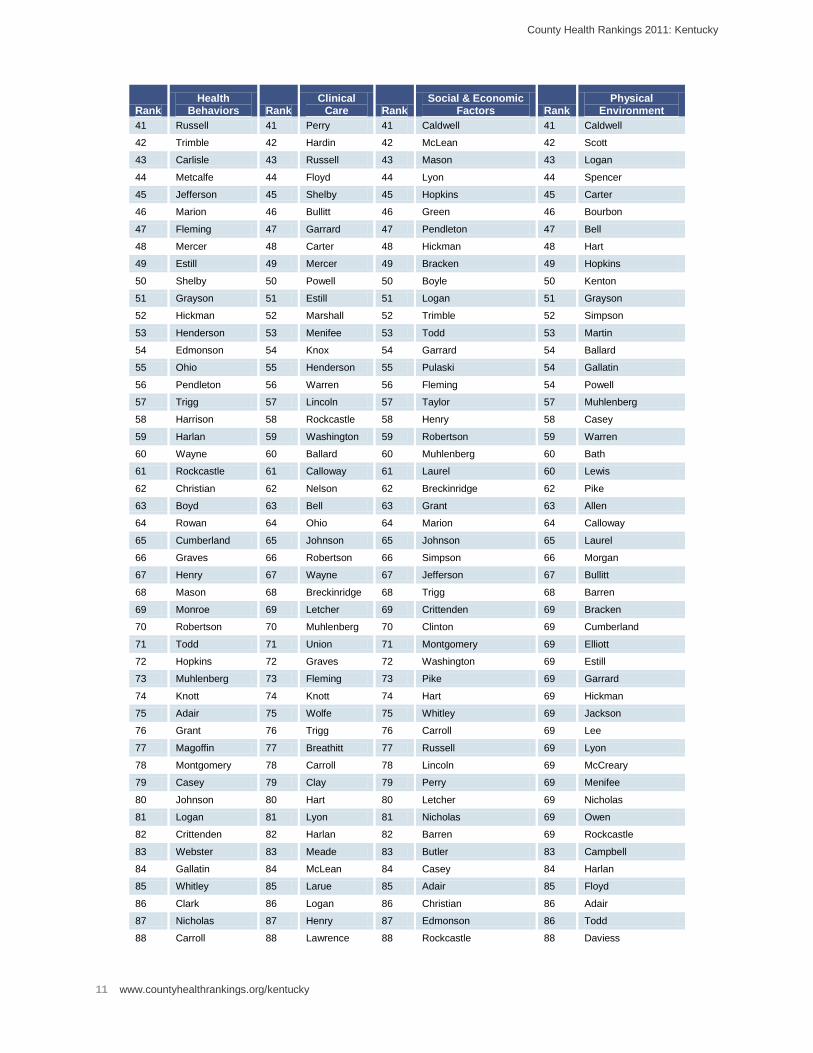
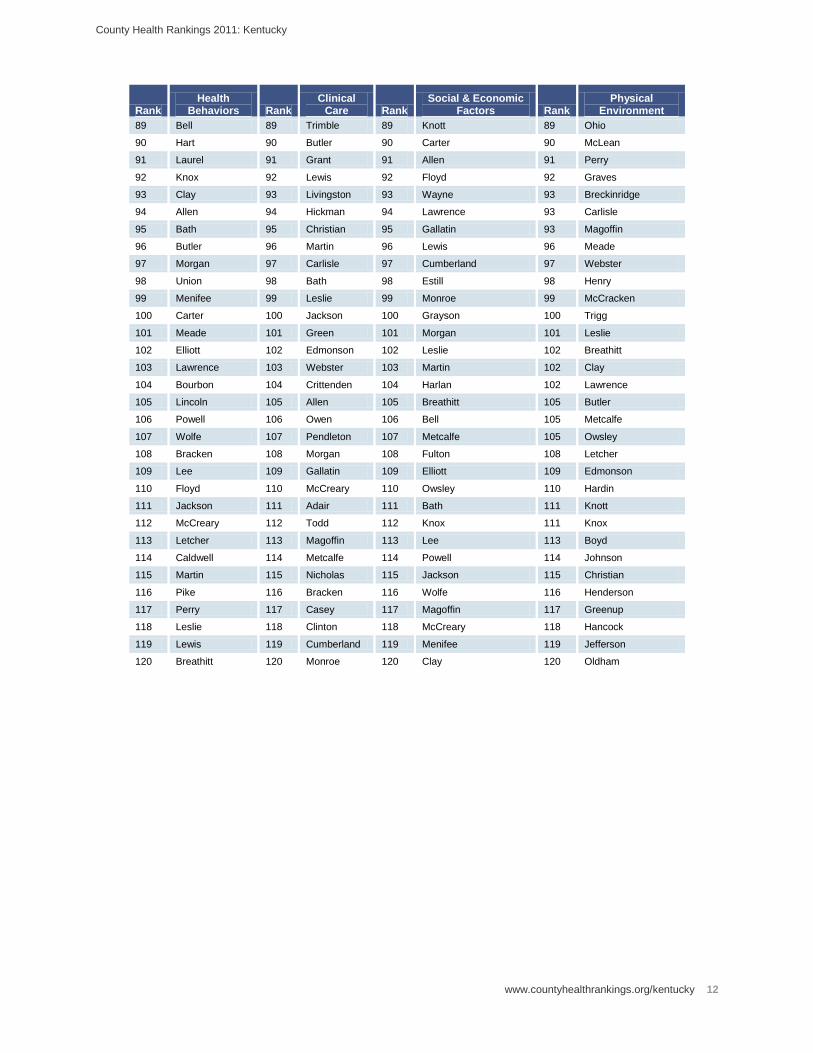
Health Factors Rankings The summary health factors ranking is based on four
factors: health behaviors, clinical care, social and
economic, and physical environment factors. In turn,
each of these factors is based on several measures.
Health behaviors include measures of smoking, diet and
exercise, alcohol use, and risky sex behavior. Clinical
care includes measures of access to care and quality of
care. Social and economic factors include measures of
education, employment, income, family and social
support, and community safety. The physical
environment includes measures of environmental quality
and the built environment.
Rank Health
Behaviors Rank Clinical
Care Rank Social & Economic
Factors Rank Physical
Environment
1 Oldham 1 Jefferson 1 Oldham 1 Montgomery
2 Woodford 2 Fayette 2 Boone 2 Taylor
3 Fayette 3 Boyd 3 Woodford 3 Anderson
4 Boone 4 Mason 4 Calloway 4 Boone
5 Hancock 5 Kenton 5 Madison 5 Madison
6 Madison 6 Barren 6 Spencer 6 Clark
7 Barren 7 Bourbon 7 Scott 7 Marshall
8 Campbell 8 Hopkins 8 Shelby 8 Franklin
9 Lyon 9 Daviess 9 Fayette 9 Russell
10 Jessamine 10 Campbell 10 Carlisle 10 Harrison
11 Boyle 11 Boone 11 Daviess 10 Wayne
12 Warren 12 Pulaski 12 Kenton 12 Pulaski
13 Calloway 13 Boyle 13 Franklin 13 Union
14 McCracken 14 Woodford 14 Greenup 14 Monroe
15 Scott 15 Lee 15 Ballard 15 Woodford
16 Hardin 16 Whitley 16 Jessamine 16 Fleming
17 Fulton 17 McCracken 17 Anderson 16 Wolfe
18 Nelson 18 Taylor 18 McCracken 18 Carroll
19 Green 19 Jessamine 19 Boyd 19 Jessamine
20 Washington 20 Fulton 20 Campbell 20 Nelson
21 Clinton 21 Rowan 21 Warren 21 Washington
22 Kenton 22 Montgomery 22 Hardin 22 Shelby
23 Larue 23 Clark 23 Webster 23 Clinton
24 Livingston 24 Oldham 24 Marshall 24 Pendleton
25 Greenup 25 Harrison 25 Bullitt 25 Crittenden
26 Garrard 26 Scott 26 Hancock 25 Fulton
27 Ballard 27 Franklin 27 Harrison 25 Mercer
28 Pulaski 28 Caldwell 28 Larue 25 Robertson
29 Bullitt 29 Hancock 29 Mercer 25 Trimble
30 Daviess 30 Owsley 30 Graves 30 Lincoln
31 McLean 31 Laurel 31 Union 31 Whitley
32 Owen 32 Greenup 32 Nelson 32 Marion
33 Marshall 33 Madison 33 Rowan 33 Fayette
34 Owsley 34 Simpson 34 Bourbon 34 Larue
35 Anderson 35 Pike 35 Meade 35 Grant
36 Spencer 36 Marion 36 Henderson 36 Green
37 Taylor 37 Grayson 37 Livingston 36 Rowan
38 Franklin 38 Spencer 38 Ohio 38 Boyle
39 Breckinridge 39 Elliott 39 Clark 39 Mason
40 Simpson 40 Anderson 40 Owen 40 Livingston
County Health Rankings 2011: Kentucky
11 www.countyhealthrankings.org/kentucky
Rank Health
Behaviors Rank Clinical
Care Rank Social & Economic
Factors Rank Physical
Environment
41 Russell 41 Perry 41 Caldwell 41 Caldwell
42 Trimble 42 Hardin 42 McLean 42 Scott
43 Carlisle 43 Russell 43 Mason 43 Logan
44 Metcalfe 44 Floyd 44 Lyon 44 Spencer
45 Jefferson 45 Shelby 45 Hopkins 45 Carter
46 Marion 46 Bullitt 46 Green 46 Bourbon
47 Fleming 47 Garrard 47 Pendleton 47 Bell
48 Mercer 48 Carter 48 Hickman 48 Hart
49 Estill 49 Mercer 49 Bracken 49 Hopkins
50 Shelby 50 Powell 50 Boyle 50 Kenton
51 Grayson 51 Estill 51 Logan 51 Grayson
52 Hickman 52 Marshall 52 Trimble 52 Simpson
53 Henderson 53 Menifee 53 Todd 53 Martin
54 Edmonson 54 Knox 54 Garrard 54 Ballard
55 Ohio 55 Henderson 55 Pulaski 54 Gallatin
56 Pendleton 56 Warren 56 Fleming 54 Powell
57 Trigg 57 Lincoln 57 Taylor 57 Muhlenberg
58 Harrison 58 Rockcastle 58 Henry 58 Casey
59 Harlan 59 Washington 59 Robertson 59 Warren
60 Wayne 60 Ballard 60 Muhlenberg 60 Bath
61 Rockcastle 61 Calloway 61 Laurel 60 Lewis
62 Christian 62 Nelson 62 Breckinridge 62 Pike
63 Boyd 63 Bell 63 Grant 63 Allen
64 Rowan 64 Ohio 64 Marion 64 Calloway
65 Cumberland 65 Johnson 65 Johnson 65 Laurel
66 Graves 66 Robertson 66 Simpson 66 Morgan
67 Henry 67 Wayne 67 Jefferson 67 Bullitt
68 Mason 68 Breckinridge 68 Trigg 68 Barren
69 Monroe 69 Letcher 69 Crittenden 69 Bracken
70 Robertson 70 Muhlenberg 70 Clinton 69 Cumberland
71 Todd 71 Union 71 Montgomery 69 Elliott
72 Hopkins 72 Graves 72 Washington 69 Estill
73 Muhlenberg 73 Fleming 73 Pike 69 Garrard
74 Knott 74 Knott 74 Hart 69 Hickman
75 Adair 75 Wolfe 75 Whitley 69 Jackson
76 Grant 76 Trigg 76 Carroll 69 Lee
77 Magoffin 77 Breathitt 77 Russell 69 Lyon
78 Montgomery 78 Carroll 78 Lincoln 69 McCreary
79 Casey 79 Clay 79 Perry 69 Menifee
80 Johnson 80 Hart 80 Letcher 69 Nicholas
81 Logan 81 Lyon 81 Nicholas 69 Owen
82 Crittenden 82 Harlan 82 Barren 69 Rockcastle
83 Webster 83 Meade 83 Butler 83 Campbell
84 Gallatin 84 McLean 84 Casey 84 Harlan
85 Whitley 85 Larue 85 Adair 85 Floyd
86 Clark 86 Logan 86 Christian 86 Adair
87 Nicholas 87 Henry 87 Edmonson 86 Todd
88 Carroll 88 Lawrence 88 Rockcastle 88 Daviess
County Health Rankings 2011: Kentucky
www.countyhealthrankings.org/kentucky 12
Rank Health
Behaviors Rank Clinical
Care Rank Social & Economic
Factors Rank Physical
Environment
89 Bell 89 Trimble 89 Knott 89 Ohio
90 Hart 90 Butler 90 Carter 90 McLean
91 Laurel 91 Grant 91 Allen 91 Perry
92 Knox 92 Lewis 92 Floyd 92 Graves
93 Clay 93 Livingston 93 Wayne 93 Breckinridge
94 Allen 94 Hickman 94 Lawrence 93 Carlisle
95 Bath 95 Christian 95 Gallatin 93 Magoffin
96 Butler 96 Martin 96 Lewis 96 Meade
97 Morgan 97 Carlisle 97 Cumberland 97 Webster
98 Union 98 Bath 98 Estill 98 Henry
99 Menifee 99 Leslie 99 Monroe 99 McCracken
100 Carter 100 Jackson 100 Grayson 100 Trigg
101 Meade 101 Green 101 Morgan 101 Leslie
102 Elliott 102 Edmonson 102 Leslie 102 Breathitt
103 Lawrence 103 Webster 103 Martin 102 Clay
104 Bourbon 104 Crittenden 104 Harlan 102 Lawrence
105 Lincoln 105 Allen 105 Breathitt 105 Butler
106 Powell 106 Owen 106 Bell 105 Metcalfe
107 Wolfe 107 Pendleton 107 Metcalfe 105 Owsley
108 Bracken 108 Morgan 108 Fulton 108 Letcher
109 Lee 109 Gallatin 109 Elliott 109 Edmonson
110 Floyd 110 McCreary 110 Owsley 110 Hardin
111 Jackson 111 Adair 111 Bath 111 Knott
112 McCreary 112 Todd 112 Knox 111 Knox
113 Letcher 113 Magoffin 113 Lee 113 Boyd
114 Caldwell 114 Metcalfe 114 Powell 114 Johnson
115 Martin 115 Nicholas 115 Jackson 115 Christian
116 Pike 116 Bracken 116 Wolfe 116 Henderson
117 Perry 117 Casey 117 Magoffin 117 Greenup
118 Leslie 118 Clinton 118 McCreary 118 Hancock
119 Lewis 119 Cumberland 119 Menifee 119 Jefferson
120 Breathitt 120 Monroe 120 Clay 120 Oldham
County Health Rankings 2011: {State Name
13 www.countyhealthrankings.org/kentucky
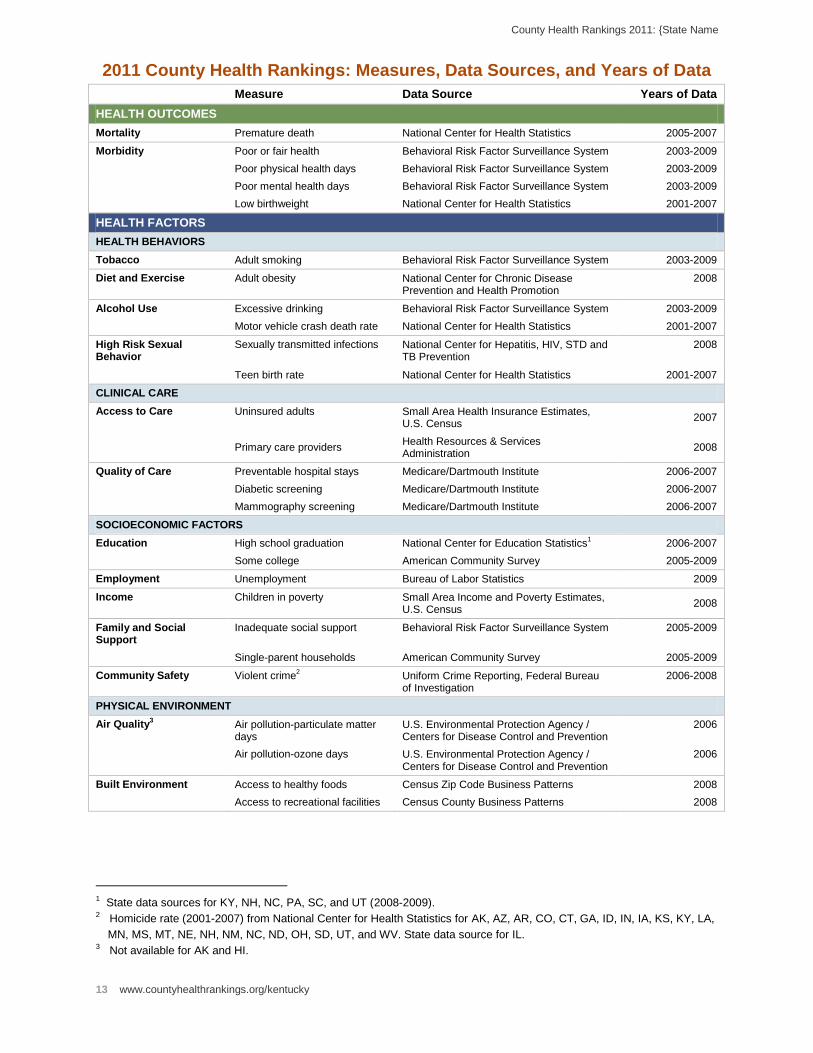
2011 County Health Rankings: Measures, Data Sources, and Years of Data
Measure Data Source Years of Data
HEALTH OUTCOMES
Mortality Premature death National Center for Health Statistics 2005-2007
Morbidity Poor or fair health Behavioral Risk Factor Surveillance System 2003-2009
Poor physical health days Behavioral Risk Factor Surveillance System 2003-2009
Poor mental health days Behavioral Risk Factor Surveillance System 2003-2009
Low birthweight National Center for Health Statistics 2001-2007
HEALTH FACTORS
HEALTH BEHAVIORS
Tobacco Adult smoking Behavioral Risk Factor Surveillance System 2003-2009
Diet and Exercise Adult obesity National Center for Chronic Disease Prevention and Health Promotion
2008
Alcohol Use Excessive drinking Behavioral Risk Factor Surveillance System 2003-2009
Motor vehicle crash death rate National Center for Health Statistics 2001-2007
High Risk Sexual Behavior
Sexually transmitted infections National Center for Hepatitis, HIV, STD and TB Prevention
2008
Teen birth rate National Center for Health Statistics 2001-2007
CLINICAL CARE
Access to Care Uninsured adults Small Area Health Insurance Estimates, U.S. Census
2007
Primary care providers
Health Resources & Services Administration
2008
Quality of Care Preventable hospital stays Medicare/Dartmouth Institute 2006-2007
Diabetic screening Medicare/Dartmouth Institute 2006-2007
Mammography screening Medicare/Dartmouth Institute 2006-2007
SOCIOECONOMIC FACTORS
Education High school graduation National Center for Education Statistics1 2006-2007
Some college American Community Survey 2005-2009
Employment Unemployment Bureau of Labor Statistics 2009
Income Children in poverty Small Area Income and Poverty Estimates, U.S. Census
2008
Family and Social Support
Inadequate social support Behavioral Risk Factor Surveillance System 2005-2009
Single-parent households American Community Survey 2005-2009
Community Safety Violent crime2 Uniform Crime Reporting, Federal Bureau
of Investigation 2006-2008
PHYSICAL ENVIRONMENT
Air Quality3 Air pollution-particulate matter
days U.S. Environmental Protection Agency / Centers for Disease Control and Prevention
2006
Air pollution-ozone days U.S. Environmental Protection Agency / Centers for Disease Control and Prevention
2006
Built Environment Access to healthy foods Census Zip Code Business Patterns 2008
Access to recreational facilities Census County Business Patterns 2008
1 State data sources for KY, NH, NC, PA, SC, and UT (2008-2009). 2 Homicide rate (2001-2007) from National Center for Health Statistics for AK, AZ, AR, CO, CT, GA, ID, IN, IA, KS, KY, LA,
MN, MS, MT, NE, NH, NM, NC, ND, OH, SD, UT, and WV. State data source for IL. 3 Not available for AK and HI.
County Health Rankings 2011: Kentucky
www.countyhealthrankings.org/kentucky 14
CREDITS
Report Authors University of Wisconsin-Madison School of Medicine and Public Health Department of Population Health Sciences Population Health Institute Bridget Booske, PhD, MHSA Jessica Athens, MS Patrick Remington, MD, MPH This publication would not have been possible without the following contributions: Technical Advisors Amy Bernstein, ScD, Centers for Disease Control and Prevention Michele Bohm, MPH, Centers for Disease Control and Prevention Research Assistance Jennifer Buechner Hyojun Park, MA Seth Prins, MPH Jennifer Robinson Matthew Rodock Anne Roubal Communications and Outreach Burness Communications Ivan Cherniack Nathan Jones, PhD Kate Konkle, MPH Angela Russell Julie Willems Van Dijk, PhD, RN Design Forum One, Alexandria, VA Media Solutions, UW School of Medicine and Public Health
Robert Wood Johnson Foundation Brenda L. Henry, PhD, MPH – Program Officer Michelle Larkin, JD, MS, RN – Team Director and Senior Program Officer James S. Marks, MD, MPH – Senior Vice President and Group Director, Health Group Joe Marx – Senior Communications Officer
Suggested citation: University of Wisconsin Population Health Institute. County Health Rankings 2011.
University of Wisconsin Population Health Institute 610 Walnut St, #524, Madison, WI 53726 (608) 265-6370 / [email protected]