Embed Size (px)
Citation preview
2012Aviation
Compensation Survey
Data Effective: February 1, 2012
Published: June 2012
Gallagher Surveys • Two Liberty Square • Boston, MA 02109617-227-1642
www.gallaghersurveys.com

2012 Aviation Compensation Survey
Table of Contents Page Introduction ............................................................................ 1 Effective Date .................................................................... 1 Survey Methodology.......................................................... 1 Definitions............................................................................... 2 Calculations and Interpretations .......................................... 7 Organization Data .................................................................. 8 Revenue ............................................................................ 8 Type of Organization ......................................................... 8 Type of Industry................................................................. 8 Type of Service.................................................................. 9 Number of Full-time (FTE) Employees in United States ... 10 Number of Full-time (FTE) Employees in the Aviation Operation ........................................................ 10 Number of Companies and Employees by Region ........... 11 General Policy Data .............................................................. 12 Salary Structure Adjustments............................................ 12 General Increases ............................................................. 14 Merit Increases .................................................................. 15 Total Increases .................................................................. 17
Special Salary Actions....................................................... 18 Overtime Payments ........................................................... 20
Shift Differentials ............................................................... 23 Sign-On Bonuses .............................................................. 24 Annual Bonus/Short-Term Incentive Plan ......................... 25
Page General Policy Data (continued) ........................................... 27 Long-term Incentives ........................................................ 27 Work Schedules................................................................ 28 Overseas Flight Data ........................................................ 32 Loss of License Insurance/Disability Income Benefits for Pilots ......................................................... 33 Vacation / Holiday / Perquisites........................................ 36 Retirement ........................................................................ 39 Drug Testing ..................................................................... 41 Per Diem........................................................................... 42 Aircraft Operated .............................................................. 43 Exempt / Nonexempt Classification by Position ............... 44 Job Index ............................................................................... 45 Job Descriptions and Compensation Data......................... 46 Statistical Summary of Salary Ranges ............................... 118 Participant List ...................................................................... 119
2012 Aviation Compensation Survey
Introduction
Any questions related to this report should be directed to:
Gallagher SurveysTwo Liberty SquareBoston, MA 02109Phone: 617-227-1642Email: [email protected]: www.gallaghersurveys.com
Effective Date
The effective date of the data in this survey is February 1, 2012.
Survey Methodology
Survey participants submitted data online through Gallagher Surveys secure website. All forms/spreadsheets were reviewed for completeness and reasonableness of the data prior to data analysis. Phone calls and/or emails were made to verify reporting.
The objective of the review process is to ensure that reported rates reflect the actual pay practices of each participant. Decisions regarding inclusion or deletion of data are based on discussions with participants and the underlying causes for unusual data. Testing of data is done with a combination ofcomputer applications, designed to spot unusual data, and careful review by senior staff.
Participant cooperation and careful preparation of data contributes greatly to the quality, reliability and timeliness of our surveys.
Gallagher Surveys is pleased to present the annual Aviation Compensation Survey. The 2012 Aviation Compensation Survey includes data on 21 positions from 133 organizations across the United States. Data for a total of 4,769 employees were reported on these jobs. We appreciate all participants' cooperation and time.
1
2012 Aviation Compensation Survey
Organizational Data
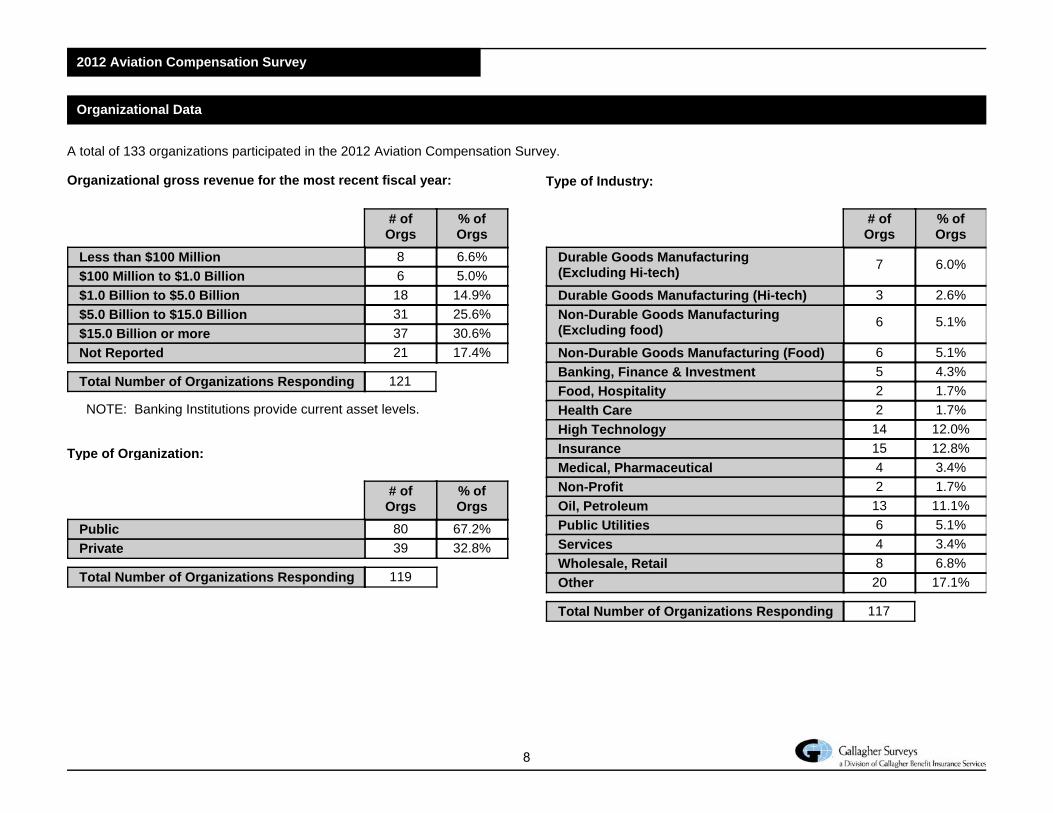
A total of 133 organizations participated in the 2012 Aviation Compensation Survey.
Organizational gross revenue for the most recent fiscal year:
% ofOrgs
# ofOrgs
6.6%86 5.0%
14.9%18$1.0 Billion to $5.0 Billion$100 Million to $1.0 BillionLess than $100 Million
Total Number of Organizations Responding 121
$5.0 Billion to $15.0 Billion 25.6%30.6%17.4%
313721
$15.0 Billion or moreNot Reported
NOTE: Banking Institutions provide current asset levels.
Type of Organization:
% ofOrgs
# ofOrgs
67.2%8039 32.8%Private
Public
Total Number of Organizations Responding 119
Type of Industry:
% ofOrgs
# ofOrgs
6.0%7
3 2.6%
5.1%6Non-Durable Goods Manufacturing (Excluding food)
Durable Goods Manufacturing (Hi-tech)
Durable Goods Manufacturing (Excluding Hi-tech)
Non-Durable Goods Manufacturing (Food)
Total Number of Organizations Responding
5.1%6
117
Banking, Finance & InvestmentFood, HospitalityHealth CareHigh TechnologyInsuranceMedical, PharmaceuticalNon-ProfitOil, PetroleumPublic UtilitiesServicesWholesale, RetailOther
5 4.3%1.7%2
2 1.7%12.0%14
15 12.8%3.4%4
2 1.7%11.1%13
6 5.1%3.4%4
8 6.8%17.1%20
8

2012 Aviation Compensation Survey
Job Index Survey Survey Job No. Survey Job Title Job No. Survey Job Title 1 Manager of Aviation (Flying) 47 Flight Attendant -Senior
6 Manager of Aviation (Non-Flying) 49 Office Manager/Coordinator 8 Chief Pilot 50 Flight Coordinator/Scheduler 13 Captain 51 Materials Coordinator 18 Captain - Senior 52 Training Coordinator 23 Co-Pilot 28 Director/Manager of Maintenance 30 Chief Aircraft Inspector 32 Aircraft Inspector 34 Senior Mechanic II 36 Senior Mechanic 38 Mechanic 40 Maintenance Assistant 42 Flight Mechanic 44 Avionics Technician 46 Flight Attendant
45
Co-Pilot 23
# ofOrgs 75th
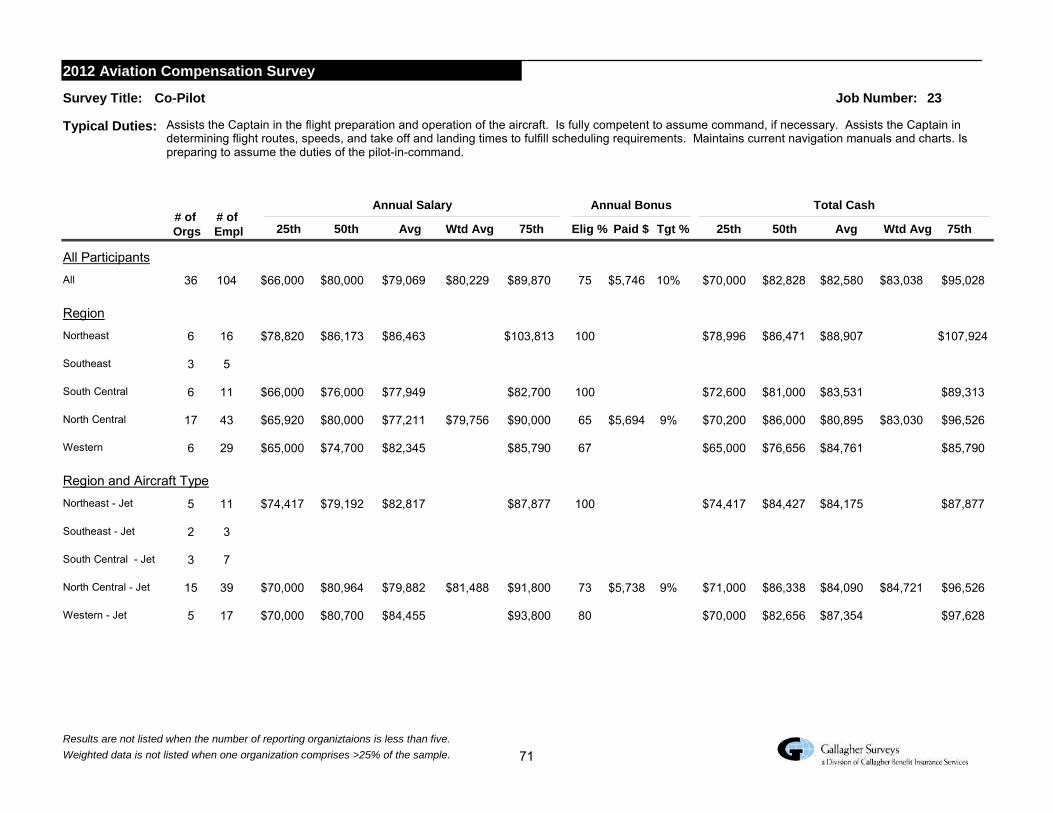
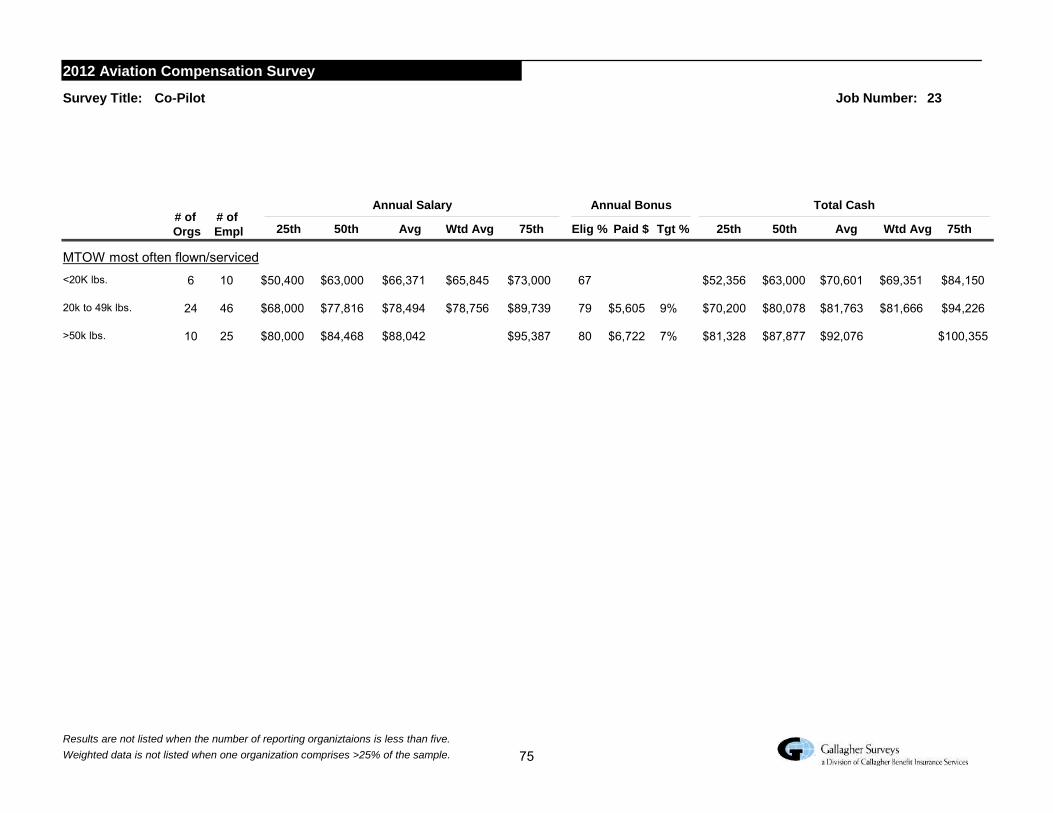
Assists the Captain in the flight preparation and operation of the aircraft. Is fully competent to assume command, if necessary. Assists the Captain indetermining flight routes, speeds, and take off and landing times to fulfill scheduling requirements. Maintains current navigation manuals and charts. Ispreparing to assume the duties of the pilot-in-command.
2012 Aviation Compensation Survey
Survey Title:
Typical Duties:
Job Number:
# ofEmpl Wtd Avg
Annual Salary
Elig % Tgt %Paid $
Annual Bonus
Avg50th25th 75thWtd Avg
Total Cash
Avg50th25th
All ParticipantsAll 36 $66,000 $80,000 $79,069 $89,870$80,229 10%$5,746104 75 $70,000 $82,828 $82,580 $95,028$83,038
RegionNortheast 6 $78,820 $86,173 $86,463 $103,81316 100 $78,996 $86,471 $88,907 $107,924
Southeast 3 5
South Central 6 $66,000 $76,000 $77,949 $82,70011 100 $72,600 $81,000 $83,531 $89,313
North Central 17 $65,920 $80,000 $77,211 $90,000$79,756 9%$5,69443 65 $70,200 $86,000 $80,895 $96,526$83,030
Western 6 $65,000 $74,700 $82,345 $85,79029 67 $65,000 $76,656 $84,761 $85,790
Region and Aircraft TypeNortheast - Jet 5 $74,417 $79,192 $82,817 $87,87711 100 $74,417 $84,427 $84,175 $87,877
Southeast - Jet 2 3
South Central - Jet 3 7
North Central - Jet 15 $70,000 $80,964 $79,882 $91,800$81,488 9%$5,73839 73 $71,000 $86,338 $84,090 $96,526$84,721
Western - Jet 5 $70,000 $80,700 $84,455 $93,80017 80 $70,000 $82,656 $87,354 $97,628
Results are not listed when the number of reporting organiztaions is less than five.
Weighted data is not listed when one organization comprises >25% of the sample. 71

Co-Pilot 23
# ofOrgs 75th
2012 Aviation Compensation Survey
Survey Title: Job Number:
# ofEmpl Wtd Avg
Annual Salary
Elig % Tgt %Paid $
Annual Bonus
Avg50th25th 75thWtd Avg
Total Cash
Avg50th25th
Aircraft TypeHelicopter 3 5
Jet 29 $70,000 $80,000 $79,846 $89,870$80,630 9%$5,65577 79 $72,030 $82,656 $83,356 $94,459$83,442
Turbo Prop 3 3
Number of Aircraft1 3 5
2 6 $77,420 $79,784 $78,058 $82,700$78,808 11%$7,6088 100 $82,714 $87,189 $85,666 $93,970$86,570
3 8 $73,000 $80,964 $83,105 $90,563$83,655 11%$2,81516 100 $73,603 $83,415 $84,864 $97,997$85,963
4 5 $60,275 $86,572 $79,489 $90,770$79,95813 60 $62,875 $90,901 $81,670 $94,226$82,730
5-9 6 $79,596 $92,150 $88,871 $103,81322 67 $80,000 $92,346 $93,060 $107,708
Over 9 Aircraft 7 $65,000 $71,900 $73,895 $85,010$74,52639 57 $65,000 $73,856 $77,349 $86,570$76,806
Organization TypeOther 3 26
Part 135 4 10
Part 91 29 $66,000 $80,000 $77,134 $89,739$79,466 10%$5,54468 76 $70,600 $82,500 $80,575 $95,196$82,652
Results are not listed when the number of reporting organiztaions is less than five.
Weighted data is not listed when one organization comprises >25% of the sample. 72

Co-Pilot 23
# ofOrgs 75th
2012 Aviation Compensation Survey
Survey Title: Job Number:
# ofEmpl Wtd Avg
Annual Salary
Elig % Tgt %Paid $
Annual Bonus
Avg50th25th 75thWtd Avg
Total Cash
Avg50th25th
Position Works With:Fixed Wing 34 $66,000 $80,000 $78,502 $89,870$80,070 10%$5,47298 76 $70,000 $82,656 $81,882 $94,746$82,809
Helicopter 2 2
Aircraft MakeFalcon – 900 DX/EX 5 $64,060 $76,102 $83,559 $106,788$83,5595 80 $64,794 $78,494 $84,331 $106,788$84,331
Gulfstream – V 7 $80,000 $86,173 $88,968 $107,59510 86 $81,328 $92,202 $92,534 $110,385
Years in Current Job - Jet0-5 Years 23 $70,000 $80,000 $79,408 $87,061$78,986 9%$5,07457 78 $70,200 $80,964 $82,276 $93,591$81,425
6-15 Years 8 $81,990 $91,870 $91,585 $113,905$93,45710 63 $83,185 $97,943 $94,957 $113,905$97,345
Years in Current Job0-5 Years 26 $65,460 $80,000 $80,195 $89,870$79,834 10%$4,96578 77 $70,000 $82,656 $83,059 $94,746$82,237
6-15 Years 9 $76,102 $89,739 $87,853 $108,700$90,23311 56 $78,494 $94,226 $90,851 $108,700$93,768
Years in Company - Jet0-5 Years 27 $68,000 $79,568 $78,181 $86,286$78,456 9%$5,45565 78 $70,600 $80,000 $81,414 $92,688$81,159
6-15 Years 10 $84,421 $91,520 $90,694 $101,500$92,403 9%$4,82312 70 $84,421 $94,741 $93,588 $107,695$95,806
Results are not listed when the number of reporting organiztaions is less than five.
Weighted data is not listed when one organization comprises >25% of the sample. 73
Co-Pilot 23
# ofOrgs 75th
2012 Aviation Compensation Survey
Survey Title: Job Number:
# ofEmpl Wtd Avg
Annual Salary
Elig % Tgt %Paid $
Annual Bonus
Avg50th25th 75thWtd Avg
Total Cash
Avg50th25th
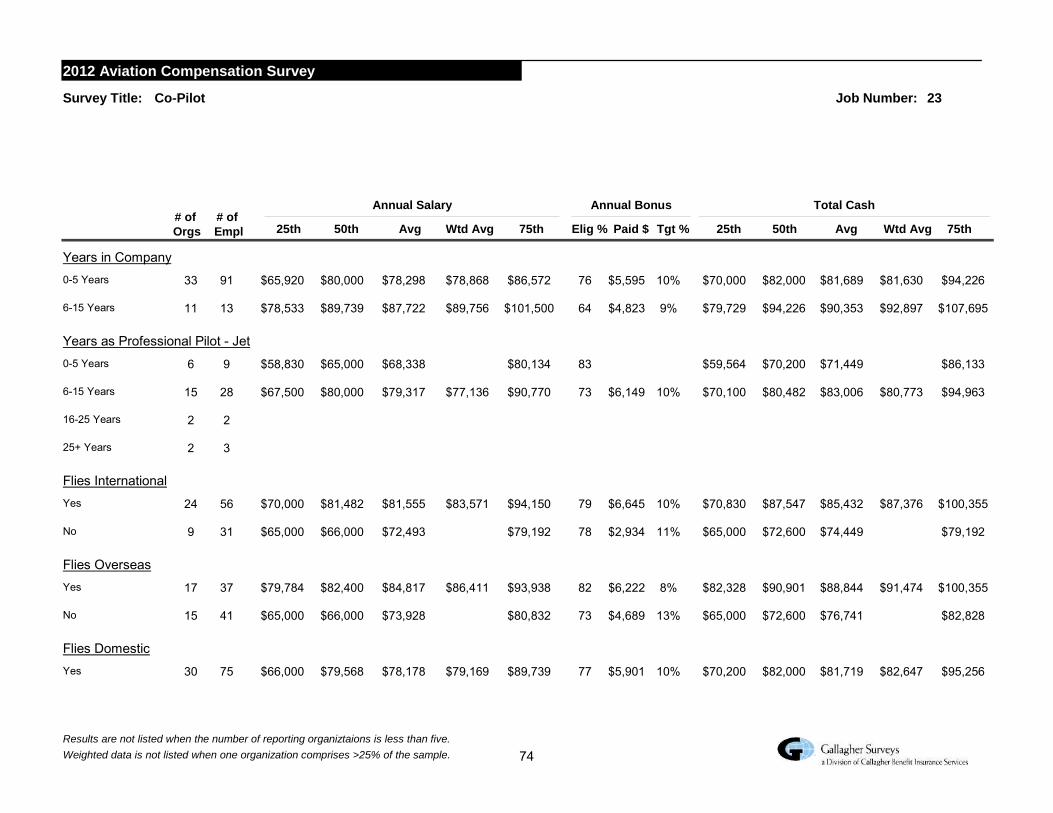
Years in Company0-5 Years 33 $65,920 $80,000 $78,298 $86,572$78,868 10%$5,59591 76 $70,000 $82,000 $81,689 $94,226$81,630
6-15 Years 11 $78,533 $89,739 $87,722 $101,500$89,756 9%$4,82313 64 $79,729 $94,226 $90,353 $107,695$92,897
Years as Professional Pilot - Jet0-5 Years 6 $58,830 $65,000 $68,338 $80,1349 83 $59,564 $70,200 $71,449 $86,133
6-15 Years 15 $67,500 $80,000 $79,317 $90,770$77,136 10%$6,14928 73 $70,100 $80,482 $83,006 $94,963$80,773
16-25 Years 2 2
25+ Years 2 3
Flies InternationalYes 24 $70,000 $81,482 $81,555 $94,150$83,571 10%$6,64556 79 $70,830 $87,547 $85,432 $100,355$87,376
No 9 $65,000 $66,000 $72,493 $79,192 11%$2,93431 78 $65,000 $72,600 $74,449 $79,192
Flies OverseasYes 17 $79,784 $82,400 $84,817 $93,938$86,411 8%$6,22237 82 $82,328 $90,901 $88,844 $100,355$91,474
No 15 $65,000 $66,000 $73,928 $80,832 13%$4,68941 73 $65,000 $72,600 $76,741 $82,828
Flies DomesticYes 30 $66,000 $79,568 $78,178 $89,739$79,169 10%$5,90175 77 $70,200 $82,000 $81,719 $95,256$82,647
Results are not listed when the number of reporting organiztaions is less than five.
Weighted data is not listed when one organization comprises >25% of the sample. 74
Co-Pilot 23
# ofOrgs 75th
2012 Aviation Compensation Survey
Survey Title: Job Number:
# ofEmpl Wtd Avg
Annual Salary
Elig % Tgt %Paid $
Annual Bonus
Avg50th25th 75thWtd Avg
Total Cash
Avg50th25th
MTOW most often flown/serviced<20K lbs. 6 $50,400 $63,000 $66,371 $73,000$65,84510 67 $52,356 $63,000 $70,601 $84,150$69,351
20k to 49k lbs. 24 $68,000 $77,816 $78,494 $89,739$78,756 9%$5,60546 79 $70,200 $80,078 $81,763 $94,226$81,666
>50k lbs. 10 $80,000 $84,468 $88,042 $95,387 7%$6,72225 80 $81,328 $87,877 $92,076 $100,355
Results are not listed when the number of reporting organiztaions is less than five.
Weighted data is not listed when one organization comprises >25% of the sample. 75

2012 Aviation Compensation Survey
Participant List Abbott Laboratories Air Products and Chemicals, Inc. Allstate Insurance Company American Century Investments American Family Insurance Ameriprise Financial Amway Anadarko Petroleum Corporation Apache Corporation Baxter International Bombardier Aerospace Bristow Group, Inc. Caesars Entertainment Corporation Cardinal Health CareFusion Cargill, Inc Caris Air Services Caterpillar CenturyLink Cessna Aircraft Company CIGNA Cimarex Energy Co CNH America LLC Coca Cola Bottling Co. Consolidated ConocoPhillips Constellation Brands, Inc. Corporate Flight Alternatives Cox Enterprises Cretex Companies, Inc.
Cummins Inc. Dassault Falcon Jet Deere and Company Devon Energy Corp Dominion Resources, Inc. Dow Corning Duke Energy Eaton Corporation Embraer Aircraft Emerson Electric Co. Exelis, Inc. FBL Financial Group, Inc. FirstEnergy Corp Flight Management Corporation General Dynamics General Mills, Inc. Harley‐Davidson Motor Company Hess Corporation Hewlett Packard HMC Interests, LLC Humana, Inc. Hunt Consolidated IMS J.R. Simplot Company Jackson National Life Insurance Company JC Penney Jet Aviation Johnson & Johnson
119
2012 Aviation Compensation Survey
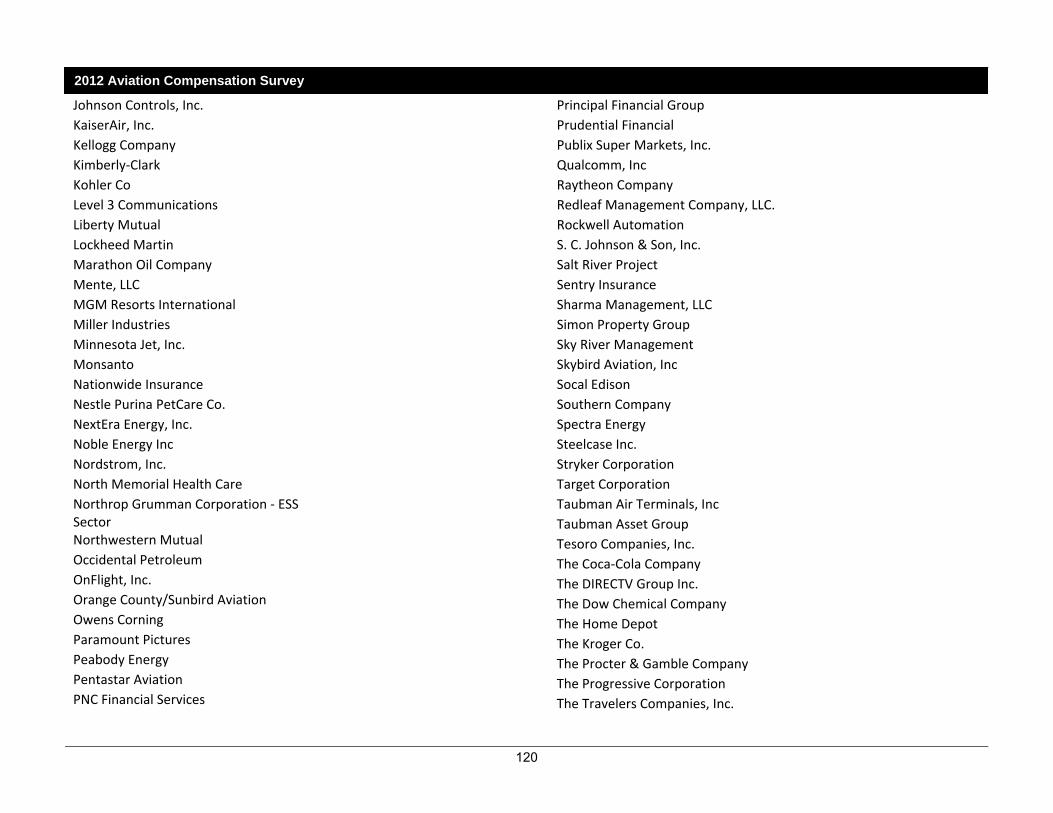
Johnson Controls, Inc. KaiserAir, Inc. Kellogg Company Kimberly‐Clark Kohler Co Level 3 Communications Liberty Mutual Lockheed Martin Marathon Oil Company Mente, LLC MGM Resorts International Miller Industries Minnesota Jet, Inc. Monsanto Nationwide Insurance Nestle Purina PetCare Co. NextEra Energy, Inc. Noble Energy Inc Nordstrom, Inc. North Memorial Health Care Northrop Grumman Corporation ‐ ESS Sector Northwestern Mutual Occidental Petroleum OnFlight, Inc. Orange County/Sunbird Aviation Owens Corning Paramount Pictures Peabody Energy Pentastar Aviation PNC Financial Services
Principal Financial Group Prudential Financial Publix Super Markets, Inc. Qualcomm, Inc Raytheon Company Redleaf Management Company, LLC. Rockwell Automation S. C. Johnson & Son, Inc. Salt River Project Sentry Insurance Sharma Management, LLC Simon Property Group Sky River Management Skybird Aviation, Inc Socal Edison Southern Company Spectra Energy Steelcase Inc. Stryker Corporation Target Corporation Taubman Air Terminals, Inc Taubman Asset Group Tesoro Companies, Inc. The Coca‐Cola Company The DIRECTV Group Inc. The Dow Chemical Company The Home Depot The Kroger Co. The Procter & Gamble Company The Progressive Corporation The Travelers Companies, Inc.
120

2012 Aviation Compensation Survey
The Williams Companies Time Warner Cable U. S. Steel Corporation Unit Corporation UnitedHealth Group University of Kansas Airplane Unum URS Federal Services Valero Energy Verizon Communications VT Industries Inc. Walmart Stores, Inc. Waste Management Aviation Williams‐Sonoma, Inc. Zachry Industrial
121


![California Judicial Council Executive Summary Compensation ... · Council Executive Summary Compensation Study Report [Agreement No. 1027484] Gallagher Benefits Services, Inc.](https://img.pdfslide.net/doc/110x75/5f0f169f7e708231d4426e9f/california-judicial-council-executive-summary-compensation-council-executive.jpg)