Embed Size (px)
Citation preview

©2012 CliftonLarsonAllen LLP1 111
©20
12 C
lifto
nLar
sonA
llen
LLP
ASAE Foundation’s Association 990: A Powerful Tool for
Benchmarking
John N. Dripps, CPANational Association of
Secondary School Principals
Nat Bartholomew, CPACliftonLarsonAllen LLP

©2012 CliftonLarsonAllen LLP2
Agenda
• Define benchmarking and trendanalyses
• Why benchmark (quick summary)• What tools are available (benefits / limitations)• ASAE Foundation’s Association 990• Identifying key metrics• Utilizing ratio analyses• Case study – NASSP

©2012 CliftonLarsonAllen LLP3
Benchmarking – Internal and External
• Internal = Trend Analyses
Utilizing historical financial and non-financila information from your organization to spot trends
• External = Benchmarking
Utilizing financial and non-financial information from peer organizations to evaluate performance, financial condition, etc.
©2012 CliftonLarsonAllen LLP4
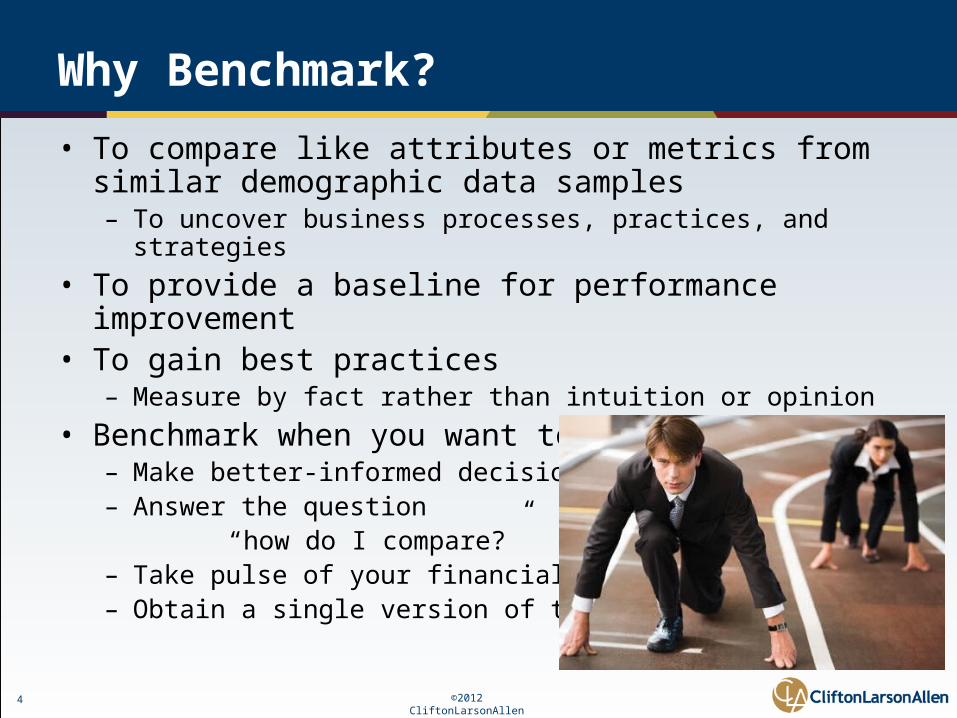
Why Benchmark?
• To compare like attributes or metrics from similar demographic data samples– To uncover business processes, practices, and strategies
• To provide a baseline for performance improvement• To gain best practices
– Measure by fact rather than intuition or opinion• Benchmark when you want to …
– Make better-informed decisions– Answer the question “how do I compare?”– Take pulse of your financial health– Obtain a single version of the truth

©2012 CliftonLarsonAllen LLP5
Why Benchmark?
As a way to share and collaborate, stimulate conversation and reflection, advocate for yourself, and take pulse of environmental trends.

©2012 CliftonLarsonAllen LLP6
What Tools Are Available – Benefits/Limitations
– Similar organization Federal Form 990 (public document)
– Annual reports or published financials– GuideStar – Lots of information stemming
from filed Federal Form 990s– ASAE’s Operating Ratio Report (ORR) or
Association 990– NTEN – IT statistics– NCCS – Operating reserves

©2012 CliftonLarsonAllen LLP7
What is ASAE’s ORR
• Compilation of financial data from participating associations
• First published in 1953• Collected via Federal Forms
990 and survey supplements
• 660 valid surveys utilized in 13th Edition – 5% more than prior ORR – and 8¼% response rate
• Compiled ’07 issued ’08• Next edition due out 2012!

©2012 CliftonLarsonAllen LLP8
ORR – Respondent Profile
• 67% were 501(c)(6) / 28% (c)(3)
• 47% reported total gross revenue > $5M
• Typical or median organization was $3.8M
• Largest concentrations - DC 27% / Chicago 10% / NY 3%

©2012 CliftonLarsonAllen LLP9
Extracting Relevant Data
ORR Cuts Data By Several Categories• Total Revenue (Six Tiers)• Membership Type – Trade vs. Professional• IRS Tax Status (c)(6) vs. (c)(3)• Geog. Scope (Int’l/Nat’l or Regional/State/Local)• Metropolitan Area (e.g., DC, NY, etc.)• Industry Sector/Interest Area (e.g., Bus/Industrial,
Education, or Healthcare/Medical – Each Separated by Membership Type)
ORR Interactive

©2012 CliftonLarsonAllen LLP10
Trend Analyses - Investment Composition(as a percentage of total assets)
35.4 31.2 27.7 26.2 24.8
14.4 19.4 23.1 27.434.3
0
10
20
30
40
1993 1996 1999 2003 2007
Invested Securities Invested Cash

©2012 CliftonLarsonAllen LLP11
Trend Analyses – Dues as a Percentage of Revenue (Dues Reliance)

©2012 CliftonLarsonAllen LLP12
ASAE Foundation’s “Association 990”

©2012 CliftonLarsonAllen LLP13
ASAE Foundation’s “Association 990”• Federal Form 990 – core form only• 18,952 ’08, 19,693 ‘09 and 23,339 ‘10 990s thus far• Functionality allows data sorts on the year and …
– 501(c) class (9 choices)– Number of employees (6 tiers)– Total revenue (8 tiers) and total expense (8 tiers)– Membership revenue (8 tiers)– Investment asset balance (8 tiers)– Unrelated business income (7 tiers)– Accounting method (accrual, cash or other)– ASAE member (yes/no)– State (52, includes DC and PR)– Metropolitan area (36 different areas)

©2012 CliftonLarsonAllen LLP14
ASAE Foundation’s “Association 990”Suite of Tools
• Association 990 - Key Ratios– Predefined reports – key ratios, revenue and expense detail, and balance sheet detail– Generated online– Sort functionality enumerated on the prior slide– Ability to export to Excel, Word or Adobe– Ability to print PDF copies of any Assn’s 990
• Association 990 - Agenda Items– Drawn from the aggregate data, these slides (PDF and PPT)
provide comparative data on policy, procedure and certain organizational measures

©2012 CliftonLarsonAllen LLP15
Example Queries - Various
Demographic 2008 2009 2010
All Associations 18,952 19,693 23,339
501(c)(3) 6,830 7,779 8,342
501(c)(6) 4,992 4,971 6,158
DC Area 1,164 1,188 1,288
New York Area 604 561 567
Chicago Area 562 600 598
LA Area 349 402 368
Dallas Area 146 153 170

©2012 CliftonLarsonAllen LLP16
Example Queries – Number of Employees
Employees 2008 2009 2010
All 18,952 19,693 23,339
</= 5 5,417 5,939 8,457
6 – 10 3,038 3,442 4,351
11 – 20 3,237 3,206 3,760
21 – 50 3,120 3,195 3,384
51 – 100 1,673 1,621 1,532
100+ 2,467 2,290 1,855

©2012 CliftonLarsonAllen LLP17
Example Queries – Size (Revenue)
Total Revenue 2008 2009 2010
All 18,952 19,693 23,339
</= $1M 9,398 10,931 15,408
$1 - $2M 3,814 3,428 3,271
$2 - $5M 3,256 2,982 2,700
$5 - $10M 1,356 1,259 1,057
$10 - $20M 605 580 485
$20 - $30M 199 170 144
$30 - $50M 138 146 114
Over $50M 186 197 160

©2012 CliftonLarsonAllen LLP18
Best “Average” Measure
Median – ½ respondents above; ½ below
Mean – sum of all cases / total # of respondents
Median is a better measure for average when the upper limit is theoretically infinite (e.g., number of members in reporting associations, annual budget for reporting associations), as the mean can be strongly affected by very high values.
2010 # Employees (Mean = 79.8 / Median = 9.0)
2010 Total Rev. (Mean = $3.5M / Median = $563K)

©2012 CliftonLarsonAllen LLP19
Compensation GeographicallyMedian / Mean (Total Revenue >/= $1M)
Demographic Chicago NYC DC
# Associations 289 318 838
Median Revenue $3.5M $3.2M $3.8M
Average Revenue $10.5M $11.0M $14.6M
Median Compensation $52,462 $51,953 $69,131
Average Compensation $53,484 $63,544 $79,415

©2012 CliftonLarsonAllen LLP20
Dues / Total Revenue = Dues Reliance
Gross Revenue 2008 2009 2010
< $1M 35.9% 36.1% 36.8%
$1 - $2M 40.8% 40.3% 40.9%
$2 - $5M 43.9% 43.4% 43.4%
$5 - $10M 41.5% 41.0% 42.5%
$10 - $20M 36.0% 34.8% 35.6%
$20 - $30M 29.0% 32.1% 31.5%
$30 - $50M 32.1% 28.4% 33.6%
Over $50M 28.4% 28.1% 28.8%

©2012 CliftonLarsonAllen LLP21
2010 Average Compensation Geographically

©2012 CliftonLarsonAllen LLP22
2010 Average Benefits by Size(based upon total revenue)
Average Size (Revenue) Pension Benefits
</= $1M $766 $1,801
$1 – $2M $2,194 $3,726
$2 - $5M $2,585 $4,520
$5 - $10M $2,599 $4,920
$10 - $20M $3,321 $6,881
$20 - $30M $4,522 $6,672
$30 – $50M $5,381 $7,143
>$50M $6,762 $14,156
All $1,399 $2,773

©2012 CliftonLarsonAllen LLP23
2010 Average Pension and Benefits by Size (based upon total revenue)

©2012 CliftonLarsonAllen LLP24
Median Number of FTEs (Full-Time Employees)
Year 5M 10M 20M 30M 50M
2009 32 89 108 149 199
2010 29 62 96 137 226

©2012 CliftonLarsonAllen LLP25
2010 Revenue Growth(expressed as a percentage of revenue)

©2012 CliftonLarsonAllen LLP26
Unrelated Business Income – 2008/09/10
Classification Percentage Number of Records
All Organizations 2.7% 18,952
2.5% 19,693
2.5% 23,339
501(c)(3) 0.9% 6,830
0.8% 7,779
0.8% 8,342
501(c)(6) 3.8% 4,992
3.6% 4,971
3.3% 6,158

©2012 CliftonLarsonAllen LLP27
Unrelated Business Income – 2008/09/10
Total Revenue All Associations 501(c)(3) 501(c)(6)
$0 - $5M 2.8% 0.8% 3.8%
2.5% 0.8% 3.7%
2.6% 0.7% 3.3%
$5 - $20M 2.7% 0.9% 3.7%
2.4% 1.0% 3.2%
2.3% 1.0% 3.3%
$20M+ 2.0% 1.5% 3.5%
1.7% 1.1% 3.1%
1.6% 1.3% 2.6%

©2012 CliftonLarsonAllen LLP28
2010 Investments as a % of Total Assets

©2012 CliftonLarsonAllen LLP29
After Login – 1St Page – Association 990

©2012 CliftonLarsonAllen LLP30
Building Your Report

©2012 CliftonLarsonAllen LLP31
Selecting One or More Categories

©2012 CliftonLarsonAllen LLP32
Generate the Report

©2012 CliftonLarsonAllen LLP33
Four Tabs

©2012 CliftonLarsonAllen LLP34
Tab 1 - Key Performance Ratios

©2012 CliftonLarsonAllen LLP35
Exporting to Excel

©2012 CliftonLarsonAllen LLP36
Tab 2 – Revenue and Expense

©2012 CliftonLarsonAllen LLP37
Tab 3 – Balance Sheet

©2012 CliftonLarsonAllen LLP38
Tab 4 – Ratio Definitions

©2012 CliftonLarsonAllen LLP39
Horizon Upgrades Contemplated
• Access to filed Federal Forms 990, similar to GuideStar• Quartile results• Association segments by industry/interest area (e.g.,
business/industrial, education, healthcare/medical, etc.)• Ability to create comparison groups• Drill-down functionality• Slide generator• Trend analyses functionality when multiple years of data are
available• Addition of Federal Form 990 Schedules to the database
(e.g., Schedule J)

©2012 CliftonLarsonAllen LLP40
Identification of Critical Indicators(Key Metrics)
• Financial Metrics
• Non-Financial Metrics

©2012 CliftonLarsonAllen LLP41
What Are Your Key Financial Metrics
Unrelated Business Income
Investment Income
Total Membership
Dues / Non-Dues Revenue
For-Profit Subsidiary Dividends
Total Contributions /
Total Unrestricted Contributions
Exposition $Certification $Publication $

©2012 CliftonLarsonAllen LLP42
What Are Your Key Non-Financial Metrics
Number of Attendees
Number of Members
Number of CE Hours Delivered
Number of Certificants
Number of Donors
Number of Clients Served

©2012 CliftonLarsonAllen LLP43
Basic Ratios
• Current = Current Assets (CA) / Cur. Liabilities
• Quick = CA Less Inventory / Current Liabilities
• Leverage = Total Liabilities / Total Net Assets
• Dues Reliance = Member Dues / Total Revenue
• Inventory Turnover = Sales / Inventory
• Avg. Collection Pd. = AR / Sales Per Day
• ROI = Income / Avg. Investment Balance

©2012 CliftonLarsonAllen LLP44444444
©20
12 C
lifto
nLar
sonA
llen
LLP
The NASSP Story
Using Financial Metrics -Information is Power

©2012 CliftonLarsonAllen LLP45
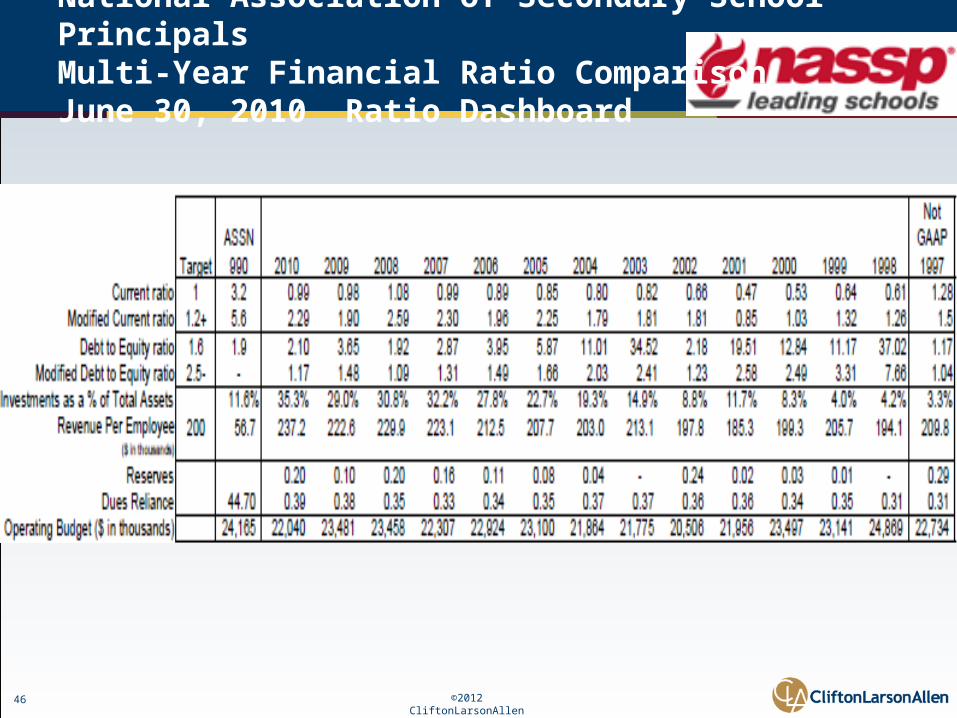
National Association of Secondary School Principals
• 25,000 individual members• 97 staff (92 FTE)• $23M budget• 501(c)(3)• Student programs serve over 30,000 schools and
more than 1 million students• Own HQ building w/35,000+ sq. ft. – Reston, VA
©2012 CliftonLarsonAllen LLP46
National Association of Secondary School PrincipalsMulti-Year Financial Ratio ComparisonJune 30, 2010 Ratio Dashboard

©2012 CliftonLarsonAllen LLP47474747
©20
12 C
lifto
nLar
sonA
llen
LLP
2010
National Associationof
Secondary School Principals

©2012 CliftonLarsonAllen LLP48
Total LiabilitiesTotal Net Assets
Statement of Financial PositionLiabilities and Net Assets

©2012 CliftonLarsonAllen LLP49
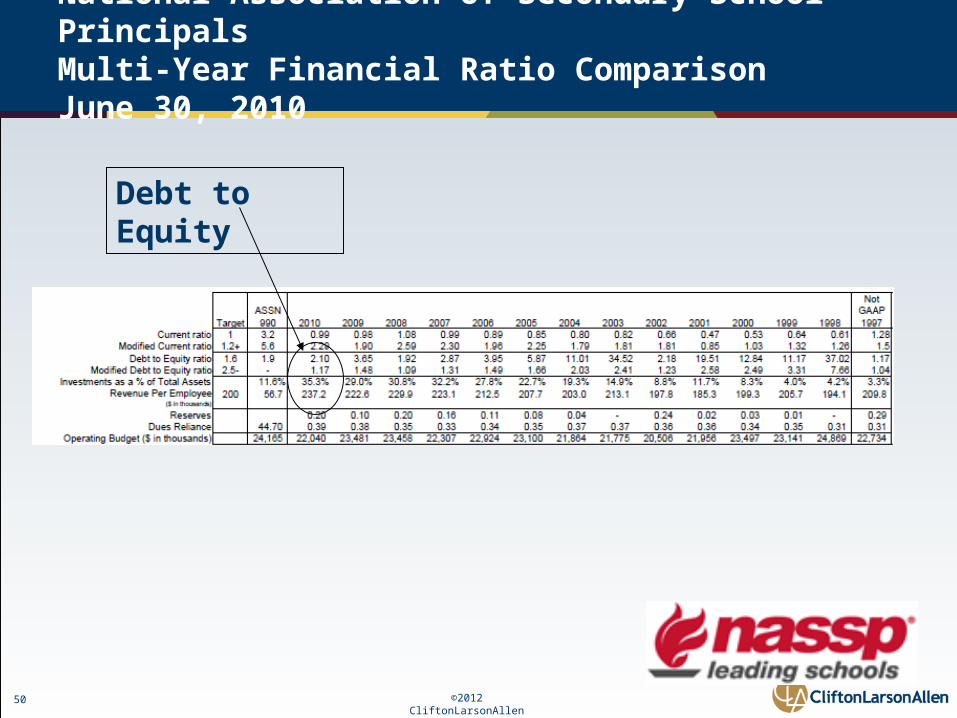
Total Liabilities -- $11,713,093
Total Net Assets – $5,582,436
2.10
Displays on the Dashboard
Current Ratio
©2012 CliftonLarsonAllen LLP50
National Association of Secondary School PrincipalsMulti-Year Financial Ratio ComparisonJune 30, 2010
Debt to Equity

©2012 CliftonLarsonAllen LLP51
National Association of Secondary School PrincipalsMulti-Year Financial Ratio ComparisonJune 30, 2010

©2012 CliftonLarsonAllen LLP52
National Association of Secondary School PrincipalsMulti-Year Financial Ratio ComparisonJune 30, 2010

©2012 CliftonLarsonAllen LLP53
That’s a Wrap!