Embed Size (px)
Citation preview

2012 LONG TERMDISABILITY CLAIMS REVIEW

The 2012 Council for Disability Awareness Long Term Disability Claims Review
Since 2005, the Council for Disability Awareness (CDA) has conducted
a proprietary annual review of long term disability claims among the
U.S. working population. The 2012 CDA Long Term Disability Claims
Review summarizes quantitative and qualitative long term disability
insurance claims data from 2007 to 2011, gathered from the annual
CDA member Long Term Disability Claims Survey. The report identifies
continuing or emerging trends for the purposes of education,
evaluation and use by interested audiences. Also included is selected
worker disability data from the Social Security Disability Insurance
(SSDI) program. Seventeen CDA member companies, representing over
75 percent of the commercial disability insurance marketplace,
contributed disability claim data for this 2012 survey.
About the Council for Disability Awareness (CDA)
The Council for Disability Awareness (CDA) is a nonprofit group
dedicated to helping the American workforce become aware of the
likelihood of disability and its financial consequences. The CDA
engages in communications, research and educational activities that
provide information and helpful resources to wage earners, their
families, the media, employers, financial advisors, consultants and
others who are concerned about disability and the impact it can have
on wage earners and their families.
If you have comments or questions about this report, or suggestions
for future studies, please contact the Council for Disability Awareness
at: www.disabilitycanhappen.org.
12012 CDA LONG TERM DISABILITY CLAIMS REVIEW
CDA Survey Findings: Summary of Key Findings fromProprietary CDA Member Company Data
• $9.3 billion in long term disability insurance claim payments were made in 2011 by CDAmember companies that participated in this year’s study. This represents a 2 percentincrease over payments made in 2010.
• Impact of the economic downturn on disability claims: Forty-three percent ofparticipating companies reported increased claim incidence from 2010 to 2011, with 38 percent reporting incidence as flat from 2010, and 19 percent reporting loweredincidence. In 2010, 56 percent of participating companies reported increased claimincidence. Most, but not all, companies continue to believe the economic environment is a factor.
• Impact of the economic downturn on employers providing group long term disabilityprograms: Participating companies reported a very slight increase in the number ofemployers offering group long term disability insurance programs in 2011 compared tothe prior year. 2011 was the first year since 2008 when the number of employers withlong term disability insurance plans increased over the year prior.
• Impact of the economic downturn on insured lives: Participating companies reportedinsured lives declined by 0.5 percent from 2010 to 2011, reflecting the third straight yearthat the number of wage earners insured for long term disability insurance has declined.The number of employees insured in employer sponsored plans has declined in eachyear since 2008.
• Impact of the economic downturn on wage earner financial security and confidence:While many news outlets acknowledge some improvement, ongoing somber economicreports continue to weigh heavily on U.S. workers. The recovery has been erratic, andunemployment remains high. Media coverage about out-of-work Americans,Congressional gridlock and negative campaigning, low home prices and high foreclosurerates, the national debt, and fear of other economic “shoes to drop” have helped raiseawareness of the importance of every worker’s income. A persistent sense of economicvulnerability has elevated worker recognition of financial risk and the importance oftaking personal responsibility for planning for the potential of an income-limitingdisability.
• Challenges faced by the Social Security Disability Insurance program (SSDI): Thesehave become more evident to the public at large. The total number of disabled workerscurrently receiving SSDI payments continues to escalate while the growth in coveredworkers (which is the source of SSDI’s revenue) remains modest. On a positive note, newSSDI benefit applications and new SSDI benefit awards declined modestly in 2011 afterexpanding rapidly from 2008 through 2010. Several recent reports predict the SSDIprogram will run out of money by 2016, meaning that without reforms, benefits todisabled workers will have to be reduced.
22012 CDA LONG TERM DISABILITY CLAIMS REVIEW
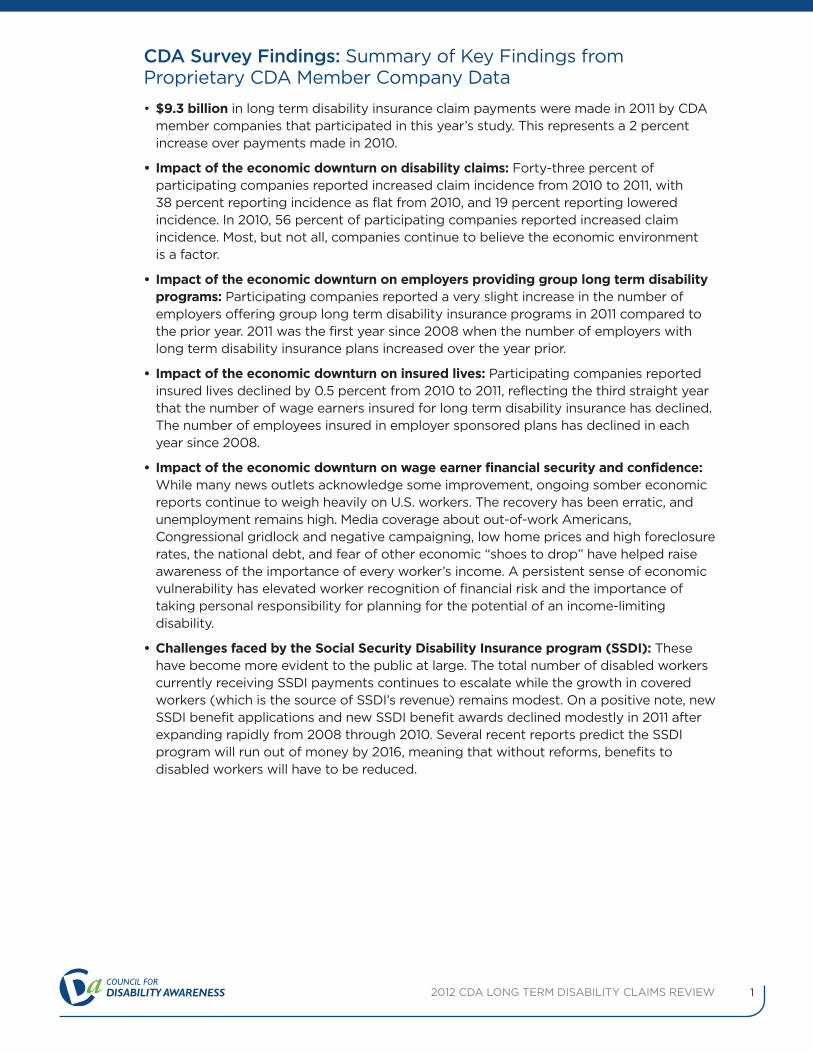
Other CDA Survey Findings• 662,000 disabled individuals received long term disability insurance payments from
CDA member companies that participated in the 2011 study, which is about a 1 percentincrease over 2010. The number of long term disability claims has increased in each ofthe past four years.
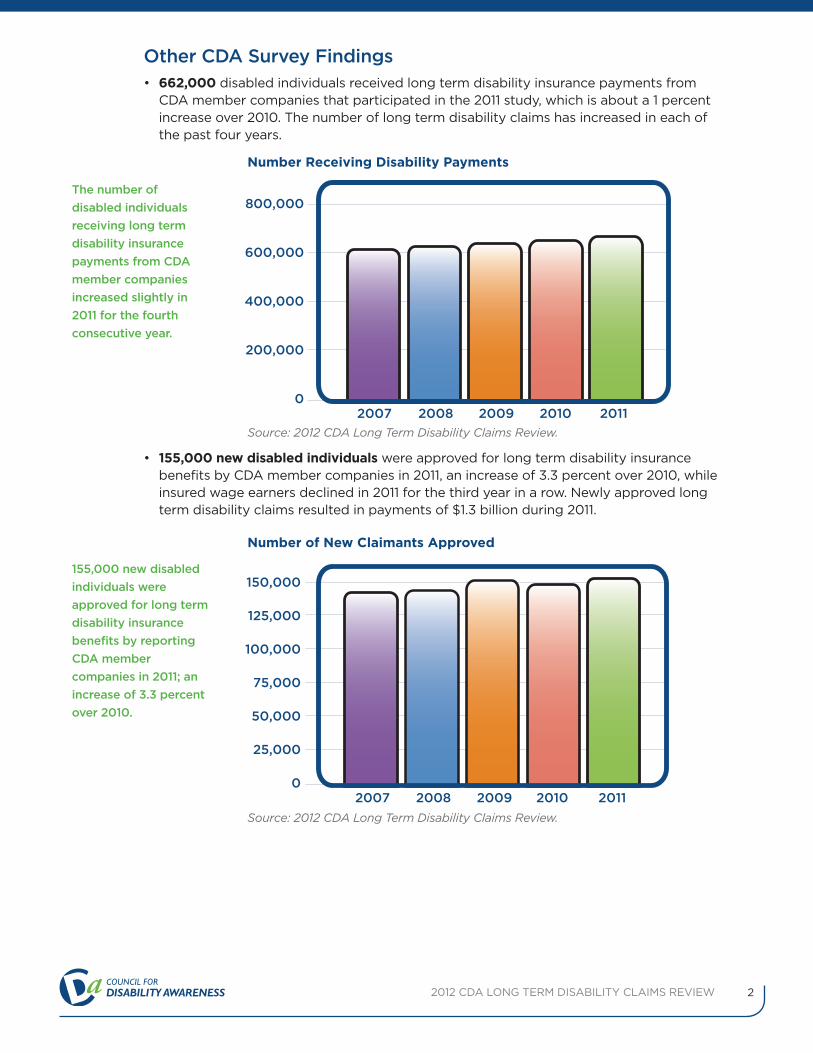
• 155,000 new disabled individuals were approved for long term disability insurancebenefits by CDA member companies in 2011, an increase of 3.3 percent over 2010, whileinsured wage earners declined in 2011 for the third year in a row. Newly approved longterm disability claims resulted in payments of $1.3 billion during 2011.
Number Receiving Disability Payments
The number of
disabled individuals
receiving long term
disability insurance
payments from CDA
member companies
increased slightly in
2011 for the fourth
consecutive year.
20070
200,000
400,000
600,000
800,000
2008 2009 2010 2011
Number of New Claimants Approved
155,000 new disabled
individuals were
approved for long term
disability insurance
benefits by reporting
CDA member
companies in 2011; an
increase of 3.3 percent
over 2010.
Source: 2012 CDA Long Term Disability Claims Review.
20070
25,000
50,000
75,000
100,000
125,000
150,000
2008 2009 2010 2011
Source: 2012 CDA Long Term Disability Claims Review.
32012 CDA LONG TERM DISABILITY CLAIMS REVIEW
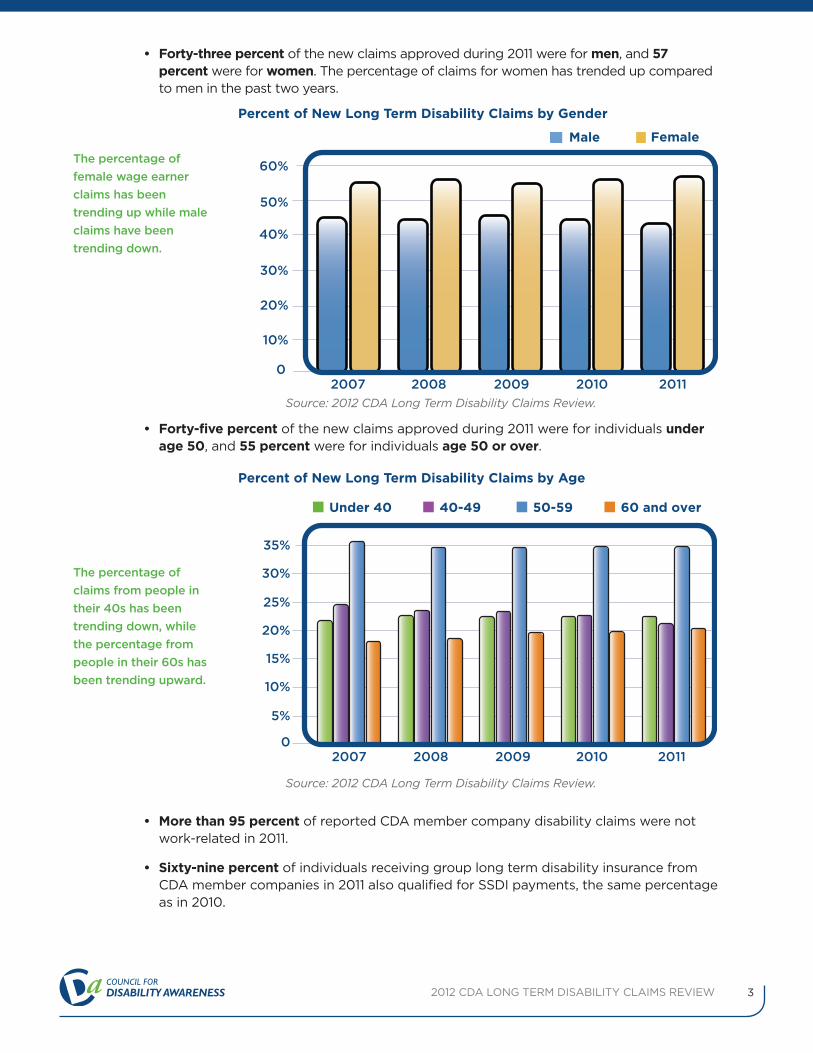
• Forty-three percent of the new claims approved during 2011 were for men, and 57percentwere for women. The percentage of claims for women has trended up comparedto men in the past two years.
• Forty-five percent of the new claims approved during 2011 were for individuals underage 50, and 55 percent were for individuals age 50 or over.
• More than 95 percent of reported CDA member company disability claims were notwork-related in 2011.
• Sixty-nine percent of individuals receiving group long term disability insurance fromCDA member companies in 2011 also qualified for SSDI payments, the same percentageas in 2010.
The percentage of
female wage earner
claims has been
trending up while male
claims have been
trending down.
0
10%
20%
30%
40%
50%
60%
FemaleMale
2007 2008 2009 2010 2011
Percent of New Long Term Disability Claims by Gender
Source: 2012 CDA Long Term Disability Claims Review.
20070
10%
5%
15%
20%
25%
30%
35%
Under 40
2008 2009 2010 2011
40-49 50-59 60 and over
Percent of New Long Term Disability Claims by Age
Source: 2012 CDA Long Term Disability Claims Review.
The percentage of
claims from people in
their 40s has been
trending down, while
the percentage from
people in their 60s has
been trending upward.
42012 CDA LONG TERM DISABILITY CLAIMS REVIEW
Causes of Disability Claims
The CDA Long Term Disability Claim Study examines and reports causes of long termdisability claims—including causes of new claims approved during the current year as wellas existing or ongoing disability claims that were approved in prior years.
Some Key Findings about the Causes of Long Term Disability Claims
• Diseases of the musculoskeletal system and connective tissue, by a large margin,continue to be the leading cause of new disability claims approved in 2011. Nearly threein 10 new disability claims were caused by musculoskeletal system and connectivetissue disorders. The percentage of new disability claims caused by musculoskeletalimpairments increased in 2011 over 2010. Several of the surveyed companies observedincreased claims resulting from musculoskeletal disorders.
• Cancer claims were lower as a percentage of new disability claims in 2011, althoughcancer remains the second leading cause of new disability claims and the fourthleading cause of ongoing claims.
• New disability claims caused by injuries trended up in 2011 after two years of decline.
• New disability claims resulting from complications of pregnancy and childbirthincreased in 2011, and now cause over 9 percent of new long term disability claims forfemale wage earners.
• New long term disability claims caused by infections and parasitic diseases declinedfrom 2.6 percent to 2.0 percent of new claims from 2010 to 2011. While a smallpercentage of the total, claims caused by this diagnosis had more than doubled from2009 to 2010.
• Disabling mental disorders increased from 2010 to 2011, the second year of increase ina row. Several companies reported an increase in long term disability claim activityresulting from this diagnosis.
• The most common causes of existing long term disability claims in 2011 included:diseases of the musculoskeletal system and connective tissue (30.5% of all existingclaims), diseases of the nervous system and sense organs (13.9%), diseases of thecirculatory system (12.3%) and cancer (8.9%). These are the same top four causes as in 2010.
52012 CDA LONG TERM DISABILITY CLAIMS REVIEW
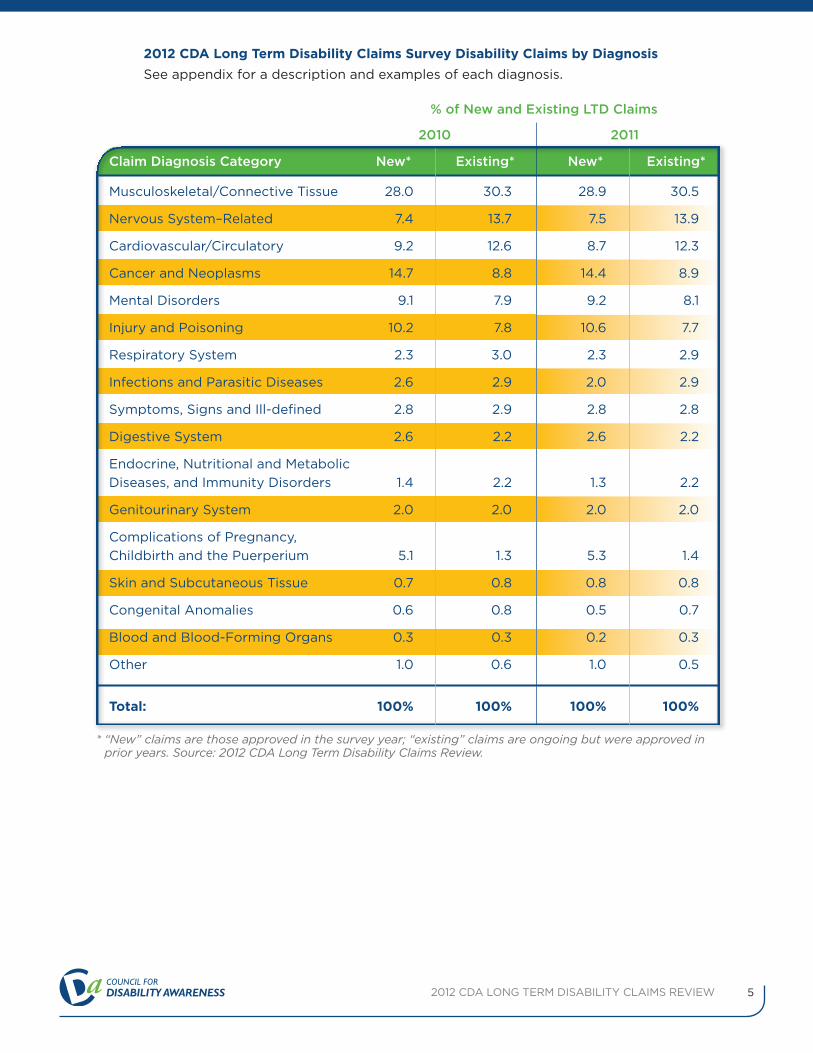
2012 CDA Long Term Disability Claims Survey Disability Claims by Diagnosis
See appendix for a description and examples of each diagnosis.
% of New and Existing LTD Claims
2010 2011
Claim Diagnosis Category New* Existing* New* Existing*
Musculoskeletal/Connective Tissue 28.0 30.3 28.9 30.5
Nervous System–Related 7.4 13.7 7.5 13.9
Cardiovascular/Circulatory 9.2 12.6 8.7 12.3
Cancer and Neoplasms 14.7 8.8 14.4 8.9
Mental Disorders 9.1 7.9 9.2 8.1
Injury and Poisoning 10.2 7.8 10.6 7.7
Respiratory System 2.3 3.0 2.3 2.9
Infections and Parasitic Diseases 2.6 2.9 2.0 2.9
Symptoms, Signs and Ill-defined 2.8 2.9 2.8 2.8
Digestive System 2.6 2.2 2.6 2.2
Endocrine, Nutritional and Metabolic
Diseases, and Immunity Disorders 1.4 2.2 1.3 2.2
Genitourinary System 2.0 2.0 2.0 2.0
Complications of Pregnancy,
Childbirth and the Puerperium 5.1 1.3 5.3 1.4
Skin and Subcutaneous Tissue 0.7 0.8 0.8 0.8
Congenital Anomalies 0.6 0.8 0.5 0.7
Blood and Blood-Forming Organs 0.3 0.3 0.2 0.3
Other 1.0 0.6 1.0 0.5
Total: 100% 100% 100% 100%
* “New” claims are those approved in the survey year; “existing” claims are ongoing but were approved inprior years. Source: 2012 CDA Long Term Disability Claims Review.
62012 CDA LONG TERM DISABILITY CLAIMS REVIEW
CDA Survey Findings: Observations from CDA MemberCompany Responses to Qualitative Questions
As part of the 2012 CDA Claims Survey, member company experts were asked a seriesof qualitative questions about long term disability insurance claim trends over the pastseveral years, and were asked for observations and predictions for the future. Here ishow the experts responded:
• Forty-three percent of participating companies noted an increase in overall claimincidence in 2011, 19 percent reported incidence decreases, and 38 percent noted newclaim incidence rates were flat from 2010. This compares to CDA’s 2010 study when 56percent of companies reported increased claim incidence, 25 percent reporteddecreased incidence, and 19 percent reported no change.
• Most companies report little change in the diagnoses causing new or existing claims.
• Musculoskeletal and mental disorders were the diagnoses most commonly mentionedby participating companies as rising in 2011. Twenty-nine percent of participatingcompanies reported increased musculoskeletal claims, and 29 percent reportedincreased mental disorder claims. Paradoxically, two companies reported seeing fewerclaims from mental disorders.
• Thirty-three percent of companies reported no change in claim termination rates, 24percent reported increases and 38 percent reported decreases.
• Regarding predictions for the future, there is more consensus among participatingcompanies this year than last. About 70 percent of the participating companies expectto see no significant changes in claim trends in the year to come. Opinions among theremaining companies are split; some expect an increase, some a decrease and othersare not sure.
• The most frequently mentioned concerns for the future were:
– Increased long term disability claim incidence.
– Worries over Social Security Disability Insurance delays and financial challenges.
– Finding and developing disability claim professionals to handle increasing claim levelsand to fill future roles.
– The impact of the low interest rate environment.
– Low claim recovery rates, in part related to the difficulty workers have finding jobs asthey recover from a period of disability.
– With many qualified applicants to choose from, employers may be less likely toemploy a worker who is returning from a disability.
– The overall economic uncertainty, lack of job growth, and the impact of both ondisability claims.
– The residual impact of health care reform on health care occupations and thedisability insurance marketplace.
72012 CDA LONG TERM DISABILITY CLAIMS REVIEW
Social Security Disability Insurance (SSDI) Data and Trends2011 Data
• 152 million workers were covered for disability insurance under the SSDI program atthe conclusion of 2011; a 0.8 percent increase over 2010.
• Covered male workers (52 percent of total) outnumber covered females (48 percentof total) although the covered female worker population continues to grow faster.Female workers grew 0.8 percent over 2010 compared to males at +0.2 percent.
• A record 8.6 million workers—over 5 percent of the U.S. workforce—were receivingSSDI benefits at the conclusion of 2011.
• The Social Security Administration paid a record $120 billion to disabled workers in2011, up 4 percent from 2010.
• The disabled worker population continues to steadily grow: the number of disabledworkers receiving SSDI claim payments increased by 4.5 percent from year end 2010 toyear end 2011, continuing to outpace growth in the overall covered worker population,which grew at just 0.8 percent. The aging population, growing female workerpopulation, limited job growth and continued economic uncertainty are factors thathave impacted the growth in SSDI claimants.
• Over 2.5 million workers in their 20s, 30s and 40s were receiving SSDI payments atthe end of 2011. This is about 30 percent of all workers receiving SSDI payments.
• Musculoskeletal and connective tissue disorders such as back pain, degenerated disk,arthritis, osteoporosis and rheumatism are the most frequent diagnoses for new SSDIawards followed by mental disorders, circulatory system disorders, cancers and tumors,and nervous system and sense organ disorders.
• New SSDI benefit applications decreased in 2011: Applications for SSDI benefitsdeclined by 1.9 percent from 2010 to 2011, to just under 2.9 million after new SSDIapplications had reached their highest level ever in 2010.
• New SSDI benefit awards in 2011 exceeded one million for the second year in a row,but were 2.6 percent below 2010.
• New SSDI awards exceeded terminations by 56 percent: New disabled workersreceiving benefits are exceeding SSDI beneficiaries who leave the rolls for any reason,resulting in continued growth in the ranks of disabled employees in “current pay status”(i.e. on SSDI claim).
• The SSDI disability rate decreased during 2011: 6.8 SSDI awards per 1,000 coveredworkers were approved in 2011, following the 7.0 awards per 1,000 covered workers in2010, which was the highest rate in history. In 2009, 6.6 awards per 1,000 coveredworkers were granted.
• The ratio of new SSDI awards to applications received decreased slightly from 35.9percent in 2010 to 35.6 percent in 2011. This ratio has hovered near its 25-year low forthe past three years.
• The average SSDI monthly benefit at the end of 2011 was $1,111. The average for malerecipients was $1,237 and for females was $972.

82012 CDA LONG TERM DISABILITY CLAIMS REVIEW
• Approximately 37 percent of disabled men and 60 percent of disabled women in2011 received SSDI benefits of less than $1,000 per month. Only 9.1 percent ofdisabled men and 2.1 percent of disabled women workers received $2,000 or more in SSDI monthly benefits in 2011.
• Older workers’ SSDI benefits are higher on average.
Workers’ Average Monthly SSDI Benefit by Recipient Age
$1,400
$1,200
$1,000
$800
$600
$400
$200
$0
<25 25-29 30-34 35-39 40-44 45-49 50-54 55-59 60+
<25 25-29 30-34 35-39 40-44 45-49 50-54 55-59 60+
Source: U.S. Social Security Administration.
The average SSDI
monthly benefit at
the end of 2011 was
$1,111. The average
was $1,237 for male
recipients and $972
for female recipients.
Average Benefit—Males
Average Benefit—Females
Average Benefit—All Workers
Recipient Age
Disabled Workers’ Average Monthly SSDI Benefit
$2,500 or more
50%
40%
30%
20%
10%
0%
$500<$1,000
$1,000<$1,500
$1,500<$2,000
$2,000<$2,500
$2,500$500 $1,000 $1,500 $2,000less than$500
Source: U.S. Social Security Administration.
Nearly all disabled
workers who have
qualified for SSDI
receive less than
$1,500 per month.
Average Benefit—All Workers
Average Benefit—Males
Average Benefit—Females
Monthly Benefit Amount
Pe
rce
nt
of
SS
DI
Dis
ab
led
Wo
rke
rs

92012 CDA LONG TERM DISABILITY CLAIMS REVIEW
Ten-Year Social Security Disability Insurance Trends
• The 152 million covered workers in 2011 is an 8 percent increase over the 140 millionworkers covered a decade ago.
• The population of female covered workers has grown faster than males over the pastdecade; females grew by 11 percent compared to 6 percent growth in covered males.
• The SSDI-covered worker population has aged significantly. In 2001, 24.2 percent ofcovered workers were age 50 and over. In 2011, 32.9 percent were 50 and over. The tablebelow illustrates this trend:
• Over the past 10 years, the number of applications for new SSDI benefits rose by 92percent, from 1.5 million in 2001 to 2.9 million in 2011.
• The 1,025,003 workers approved for SSDI payments in 2011 are 48 percent more thanthe 691,309 workers approved in 2001. The 2.6 percent decrease in new awards in 2011reversed three straight years of rapid growth in new awards. The slowly improving jobpicture seems to be having a positive impact.
• The total number of disabled workers receiving SSDI claim payments grew by 63percent, from 5.3 million to 8.6 million, during the period from 2001 to 2011. The rate ofincrease of workers in “current pay status” should slow in future years, reflecting thedecreasing number of new applications and new awards in 2011.
• The ratio of new SSDI awards to new SSDI applications has been trending downwardsince the late 1990s. The ratio was 46 percent in 2001 and 36 percent in 2011.
• According to the Social Security Administration, the final award rate for disabled-worker applicants has varied over time, averaging nearly 45 percent for claims filedfrom 2001 through 2010 (As of the date of this report, this is the last year for which datais available.) The percentage of applicants awarded benefits at the initial claims levelaveraged 28 percent over the same period and ranged from a high of 37 percent to alow of 26 percent. The percentage of applicants awarded at the reconsideration andhearing levels averaged 3 percent and 13 percent, respectively. Denied disability claimshave averaged nearly 53 percent.
20112001
0
10%
5%
15%
20%
25%
30%
Under 30 30–39 40–49 50–59 60 and over
Percentage of Covered Workers by Age
Source: U.S. Social Security Administration
The covered
workforce is aging.

102012 CDA LONG TERM DISABILITY CLAIMS REVIEW
• From 2001 to 2011, the number of women receiving SSDI payments increased by 76percent compared to a 52 percent increase among males.
• The average monthly SSDI benefit amount has increased by 36 percent in the past 10years; the average for females has increased faster than for males; up 41 percent forfemales; 35 percent for males.
• The overall rate of disability is increasing among both men and women workers. In2001, the ratio of disabled workers to covered workers was 3.8 percent; in 2010, thatratio was 5.7 percent. Factors behind this dramatic rise include the aging of the U.S.workforce, and the poor economic conditions since the end of 2007.
• The disability rate is increasing more rapidly for women than men: The percentage ofcovered female workers receiving SSDI payments in 2011 (5.6 percent) was 58 percenthigher than 10 years earlier (3.6 percent in 2001), while the percentage of covered maleworkers receiving SSDI grew by 44 percent during the same period, from 4 percent to5.7 percent.
• The $120 billion paid in SSDI benefits in 2011 is more than twice the $54 billion ofdisability payments to beneficiaries in 2001.
• New SSDI awards for musculoskeletal and connective tissue disorders have beenincreasing over time, while awards for circulatory system disorders such as heartdisease and stroke have been decreasing.
• Injuries, typically perceived as the cause of many disabilities, represent less than 5percent of diagnoses for new SSDI Awards.
• Over the very long term, since 1960, circulatory and respiratory system diagnoseshave been reduced by more than half as a percentage of all new SSDI claim awards.During the same time horizon, musculoskeletal and mental disorder-caused awardshave more than doubled.
Diagnostic Causes of New SSDI Awards
Mental Disorders
Cancers and Tumors
Circulatory System Disorders
Musculoskeletal and Connective Tissue
Nervous System and Sense Organs
Injuries
Respiratory System
35%
30%
25%
20%
15%
10%
5%
0%
1996 2001 2006 2011
Pe
rce
nt
of
Ne
w S
SD
I A
wa
rds
Source: U.S. Social Security Administration

Claim Diagnosis Category
Diseases of theMusculoskeletal Systemand Connective Tissue
Diseases of the NervousSystem and Sense Organs
Diseases of theCirculatory System
Cancer and Neoplasms
Mental Disorders
Injuries and Poisonings
Diseases of the Respiratory System
Infections and ParasiticDiseases
Symptoms, Signs and Ill-Defined Conditions
Diseases of the DigestiveSystem
Endocrine, Nutritional andMetabolic Diseases andImmunity Disorders
Diseases of theGenitourinary System
Complications ofPregnancy, Childbirth and the Puerperium
Diseases of the Skin andSubcutaneous Tissue
Congenital Anomalies
Diseases of the Blood andBlood-Forming Organs
Other
Lay Language Description
Muscle, Back and JointDisorders
Spine and Nervous System-Related Disorders
Cardiovascular andCirculatory Diseases
Cancer and Tumors
Mental Illness and BehavioralDisorders
Accidents, Injuries andPoisonings
Respiratory System Disorders
Infectious and ParasiticDiseases
Ill-Defined or SubjectiveConditions
Digestive System Disorders
Nutritional, Metabolic,Regulatory and ImmunityDisorders
Genital and Waste RemovalDisorders
Pregnancy and Complicationsof Pregnancy
Skin Conditions andDisorders
Inherited Conditions
Blood-Related Disorders
Other Disorders
Appendix
Specific Examples
Arthritis, Herniated or Degenerated Disk, Back Pain,Spine/Joint Disorders, Cartilage Sprain, Tendonitis,Fibromyitis, Osteoporosis, Rheumatism, Scoliosis,Sciatica
Multiple Sclerosis, Epilepsy, Paralysis, Alzheimer’s,Parkinson’s Disease, Amyotrophic Lateral Sclerosis(ALS), Bell’s Palsy, Guillain-Barré Syndrome, EyeDisorders including Diabetic Retinopathy and MacularDegeneration, Ear Disorders including Balance-Related Disorders like Ménière’s Disease
Hypertension, Heart Disease, Heart Attack, Stroke,Aneurysm, Coronary Artery Disease, Phlebitis
Breast Cancer, Prostate Cancer, Lymphoma, Hodgkin’sDisease, Leukemia, Tumors
Depression, Schizophrenia, Drug/Alcohol/SubstanceAbuse, Bipolar Disorder, Anxiety, Obsessive-Compulsive Disorder
Fractures, Sprains and Strains, Dislocations,Contusions, Burns, Poisoning, Allergic Reactions
Influenza, Pneumonia, Asthma, Bronchitis,Emphysema, Pulmonary Fibrosis, Cystic Fibrosis,Chronic Obstructive Pulmonary Disorder (COPD)
Food Poisoning, HIV/AIDS, Hepatitis, Meningitis,Salmonella, Tuberculosis, Polio
Headache, Insomnia, Coma, Chronic FatigueSyndrome, Sleep Apnea, Seasonal Affective Disorder,Anorexia, other symptoms without a diagnosis
Gastric Ulcers, Gastritis, Appendicitis, Hernia, IrritableBowel Syndrome, Cirrhosis of the Liver, Crohn’sDisease, Diverticulitis, Ulcerative Colitis, DentalDisorders, Temporomandibular Joint (TMJ) Disorders
Diabetes, Malnutrition, Obesity, Gout, Cystic Fibrosis,Thyroid Disorders
Uterine Prolapse, Cervicitis, Menopausal Symptoms,Kidney and Bladder Disorders, Genital OrganDisorders, Kidney Failure, Enlarged Prostate,Prostatitis, Urinary Tract Infections, Endometriosis
Normal Delivery, Caesarean Section, Complications of Pregnancy, Toxemia, Ectopic Pregnancy, Pre-TermComplications
Eczema, Dermatitis, Cellulitis, Psoriasis, Sebaceous Cyst
Congenital Anomalies, Spina tend, Down’s Syndrome,Inherited Heart Valve Malfunction
Anemia, Hemophilia, Sickle-Cell Disease, Diseases of the Spleen
Other disorders not captured in categories above
112012 CDA LONG TERM DISABILITY CLAIMS REVIEW
* 2012 survey participants included:
Aetna
AIG Benefit Solutions
Ameritas
Assurant Employee Benefits
Guardian
The Hartford
Illinois Mutual
Lincoln Financial Group
MassMutual Financial Group
MetLife
OneAmerica
Principal Financial
Prudential
The Standard
Sun Life Financial
UnitedHealthcare
Unum
CDA member companies represent over 75 percent of the commercial disability insurance
marketplace. Companies participating in this 2012 study provide long term disability insurance
coverage to more than 32 million workers, 30.3 million of whom are covered through more than
200,000 employer-sponsored benefit plans, and 1.7 million of whom are insured through individually
purchased disability policies. Fourteen of the participating companies are among the leading group
long term disability companies, and eight are among the leading individual disability insurance
companies. Berkshire Life has reported under the Guardian name in the 2012 study.
Please note: The companies participating in CDA claim studies may vary from year to year. Some
companies may adjust prior years’ data when reporting their results. For this reason, year-over-year
comparisons within this 2012 claim review are valid; however, comparing some data within the 2012
report to data in prior years’ reports may not be valid. Please contact CDA for questions or
clarifications. CDA thanks the member companies named above for their contributions of proprietary
data, which have made this survey possible.
75 Pearl Street, Suite 205Portland, Maine 04101
207-774-2634www.disabilitycanhappen.org
References• The 2012 CDA Long Term Disability Claims Survey*
• Social Security Administration Disability Insurance Fact Sheets andActuarial Publications; www.socialsecurity.gov