Embed Size (px)
Citation preview

This report was commissioned by
GOLF 20/20 for the
New Hampshire Golf Alliance
and prepared by SRI International.
THE NEW HAMPSHIRE GOLF ECONOMY FULL REPORT

2
The New Hampshire
Golf Economy
Published April 2012 through an agreement with
ii
CONTENTS
STUDY OVERVIEW ......................................................................................................................................... 1
ANALYTICAL FRAMEWORK ............................................................................................................................ 2
A. Golf Industry Cluster Definition ............................................................................................................ 2
B. Data Sources ......................................................................................................................................... 3
THE SIZE OF NEW HAMPSHIRE’S GOLF ECONOMY ....................................................................................... 6
A. Core Industries ...................................................................................................................................... 6
Golf Facility Operations ........................................................................................................................ 6
Golf Facility Capital Investments .......................................................................................................... 7
Golf-Related Supplies............................................................................................................................ 7
Associations, Tournaments & Charitable Giving .................................................................................. 7
B. Enabled Industries ................................................................................................................................ 8
Real Estate .......................................................................................................................................... 10
Hospitality/Tourism ............................................................................................................................ 10
GOLF’S ECONOMIC IMPACT IN NEW HAMPSHIRE ...................................................................................... 10
DETAILED METHODOLOGY & DATA SOURCES ............................................................................................ 13
A. Golf Facility Operations ...................................................................................................................... 13
B. Golf Course Capital Investment .......................................................................................................... 16
C. Golf-Related Supplies.......................................................................................................................... 18
D. State Golf Associations, Tournaments & Charitable Events ............................................................... 21
E. Real Estate .......................................................................................................................................... 21
F. Hospitality/Tourism ............................................................................................................................ 23
G. Golf’s Economic Impact ...................................................................................................................... 24
BIBLIOGRAPHY ............................................................................................................................................ 28
Acknowledgements This report was prepared by SRI in agreement with GOLF 20/20, the New Hampshire Golf Association, The First Tee of New Hampshire, the McDonough Scholarship Foundation, the New England Club Managers Association, the New Hampshire Chapter of the New England Section of The PGA of America, the New Hampshire Golf Course Superintendents Association, and the New Hampshire Women’s Golf Association. In addition, support for this report comes from the following national allied organizations: CMAA, GCSAA, LPGA, NGCOA, The PGA of America, PGA TOUR and USGA. The New Hampshire Golf Economy study was conducted by Nancy Chan, Elizabeth Tennant, Jennifer Ozawa, and Peter Ryan at SRI International with contributions from individuals representing the following allied golf association in New Hampshire (in alphabetical order): Jerry Gouveia (NHGA), Joy Jaworski (NHGCSA), Mitchell Jean (McDonough Scholarship Foundation), Alex Kirk (NHCPGA), Peter Lojko (The First Tee of New Hampshire), Dave Ousterhout (NHGCSA), David Przybylski (NECMA), Jeremy Sprince (NHGA), George Sargent (NHGCSA), Nancy Stewart (NHWGA), Glenn Walton (NHGA), and Randy Weeks (NHGCSA).

iii
ACRONYMS
CMAA Club Managers Association of America
GCBAA Golf Course Builders Association of America
GCSAA Golf Course Superintendents Association of America
GRAA Golf Range Association of America
LPGA Ladies Professional Golf Association
NECMA New England Club Managers Association
NGCOA National Golf Course Owners Association
NHGCSA New Hampshire Golf Course Superintendents Association
NHCPGA New Hampshire Chapter of the New England Section of The PGA of America
NHGA New Hampshire Golf Association
NHWGA New Hampshire Women’s Golf Association
PGA The Professional Golfers’ Association of America
USGA United States Golf Association
WGF World Golf Foundation
1
STUDY OVERVIEW
Best known for its spectacular fall foliage, New Hampshire is the idyllic golf destination with its
temperate summers and natural beauty, including its many golf courses that edge the White Mountains,
numerous lakes and seaside. Beyond its recreational value, however, golf is a key industry contributing
to the vitality of New Hampshire’s economy. In 2010, the size of New Hampshire’s direct golf economy
was approximately $289.8 million. Golf brings visitors to the state, drives new construction and
residential development, generates retail sales, and creates demand for a myriad of goods and services.
When the total economic impact of New Hampshire’s golf-related activities is considered, the golf
industry generated approximately $525.1 million of direct, indirect and induced economic output,
$151.2 million of wage income, and nearly 6,200 jobs in 2010.
The golf industry’s $289.8 million in direct revenues supports economic activity comparable to several
other important industries in the state: boating ($296.2 million) and skiing facilities ($317.5 million).1
Historically, many state-level economic studies surrounding the game of golf have been conducted
across the country. However, no comprehensive, standardized framework was employed in these prior
studies. This made it difficult to monitor a state’s industry growth over time and to make state-to-state
or regional comparisons. To ameliorate this problem, SRI International and GOLF 20/20 are currently
working with key golf stakeholders in several states, including New Hampshire, to bring consistency to
the industry measurement and reporting process. This report describes and analyzes New Hampshire’s
golf industry including the revenues and economic impact generated by the industry. Such analysis will
assist New Hampshire’s industry stakeholders2 in raising awareness of the impact of golf to state and
local policymakers.
There are many potential uses for such an analysis:
Defining the range of core and enabled industries associated with the game of golf;
Clearly articulating, for policymakers and regulatory agencies, the employment and revenue-
generating contributions of the golf industry to the state economy; and
1 New Hampshire Lakes Association (prepared by Gallagher, Callahan & Gartrell) (2003), Estimates of Select
Economic Values of New Hampshire Lakes, Rivers, Streams and Ponds: Phase II Report, p. 5. 2002 revenues
adjusted to 2010 dollars using the GDP deflator. Plymouth State University Institute of New Hampshire Studies
(2011), The New Hampshire Ski Industry, 2009-2010: Its Contribution to the State Economy, p. 2. 2 Key industry stakeholders comprising the New Hampshire Golf Alliance include representatives from the New
Hampshire Golf Association, The First Tee of New Hampshire, the McDonough Scholarship Foundation, the New
England Club Managers Association, the New Hampshire Chapter of the New England Section of The PGA of
America, the New Hampshire Golf Course Superintendents Association, and the New Hampshire Women’s Golf
Association.
2
Building credibility and recognition of the golf industry as a significant business sector and a
driver of economic activity in the state.
ANALYTICAL FRAMEWORK
Current economic studies of the golf industry in different states emphasize various factors and
outcomes. For example, one may focus largely on the turf industry, while another might examine the
impact of sports and recreation-related tourism more broadly. Ideally, one would want to include all the
key activities and industries that are enabled by and benefit from the game of golf. To meet this goal,
SRI has developed a standardized, economic impact framework that can be employed to measure a
comprehensive set of golf-driven industry components. This state-level framework draws on the
conceptual model of the golf economy developed in SRI’s 2000 national-level The Golf Economy Report
and the 2005 state-level The Virginia Golf Economy Report.
A. GOLF INDUSTRY CLUSTER DEFINITION
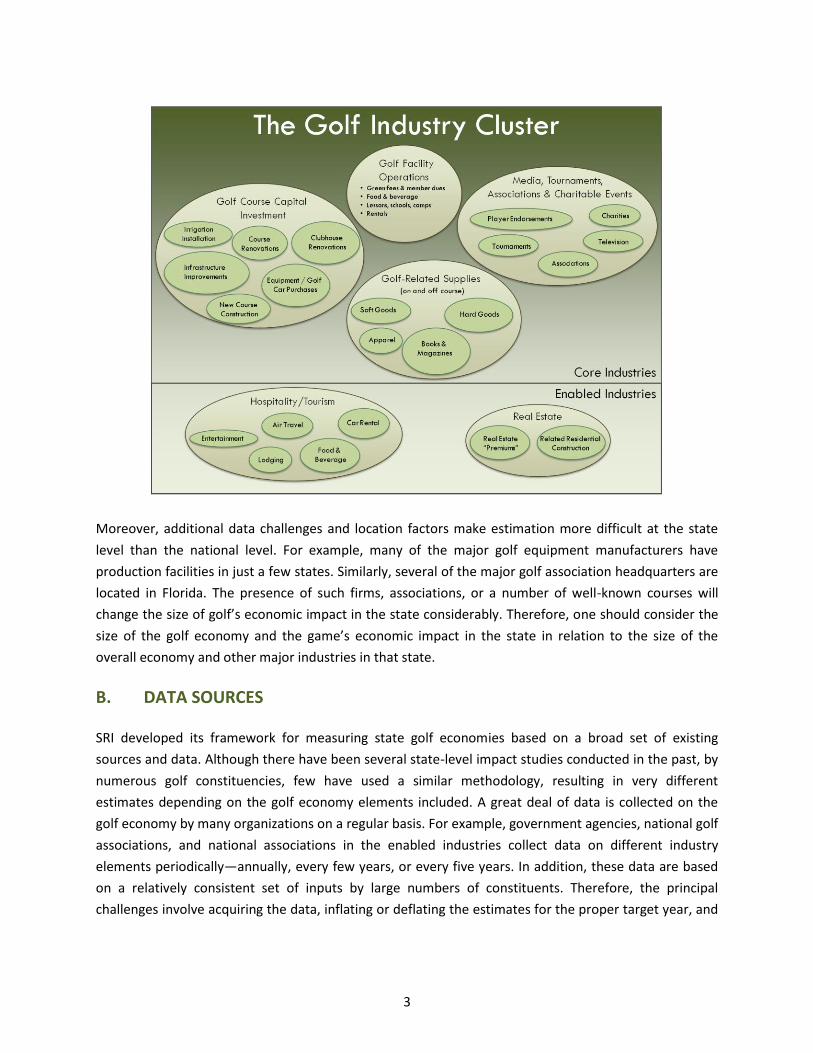
To arrive at economic impact, one must first estimate the size of the golf economy in the state. This
entails mapping out where the golf industry begins and ends, and then estimating the size of each of
these industry segments. We divide the golf industry cluster into two main categories: (1) core
industries and (2) enabled industries (see figure on next page). The golf industry cluster begins with the
golf facilities themselves and with those other core industries that produce goods and services used to
operate facilities and to play the game: golf equipment and golf apparel manufacturers, golf course
architects and course builders, turf maintenance equipment and service providers, and club
management services. The game of golf further enables a number of other industries, such as golf-
related tourism and real estate development.
We detail these industry segments and estimate their size in the following section. Having defined the
core and enabled golf industries, it is possible to estimate the size of each industry segment and to total
them for an overall estimate of the size of the golf economy. Multipliers can then be applied to calculate
the ripple effects of these economic activities in terms of: (1) impact on total state economic output and
(2) impact on total state employment. However, this process is complicated by the fact that, while most
of these industries produce golf-related goods and services, the firms themselves may not limit their
activities exclusively to the golf industry. For example, Nike produces golf shoes, but also running, tennis,
basketball, and other shoes. Therefore, in general, our approach is to include only those firms and sales
that are directly attributable to the game of golf. In so doing, we use a number of different estimation
techniques to ensure that our final estimates are reasonable and robust.
3
Moreover, additional data challenges and location factors make estimation more difficult at the state
level than the national level. For example, many of the major golf equipment manufacturers have
production facilities in just a few states. Similarly, several of the major golf association headquarters are
located in Florida. The presence of such firms, associations, or a number of well-known courses will
change the size of golf’s economic impact in the state considerably. Therefore, one should consider the
size of the golf economy and the game’s economic impact in the state in relation to the size of the
overall economy and other major industries in that state.
B. DATA SOURCES
SRI developed its framework for measuring state golf economies based on a broad set of existing
sources and data. Although there have been several state-level impact studies conducted in the past, by
numerous golf constituencies, few have used a similar methodology, resulting in very different
estimates depending on the golf economy elements included. A great deal of data is collected on the
golf economy by many organizations on a regular basis. For example, government agencies, national golf
associations, and national associations in the enabled industries collect data on different industry
elements periodically—annually, every few years, or every five years. In addition, these data are based
on a relatively consistent set of inputs by large numbers of constituents. Therefore, the principal
challenges involve acquiring the data, inflating or deflating the estimates for the proper target year, and
4
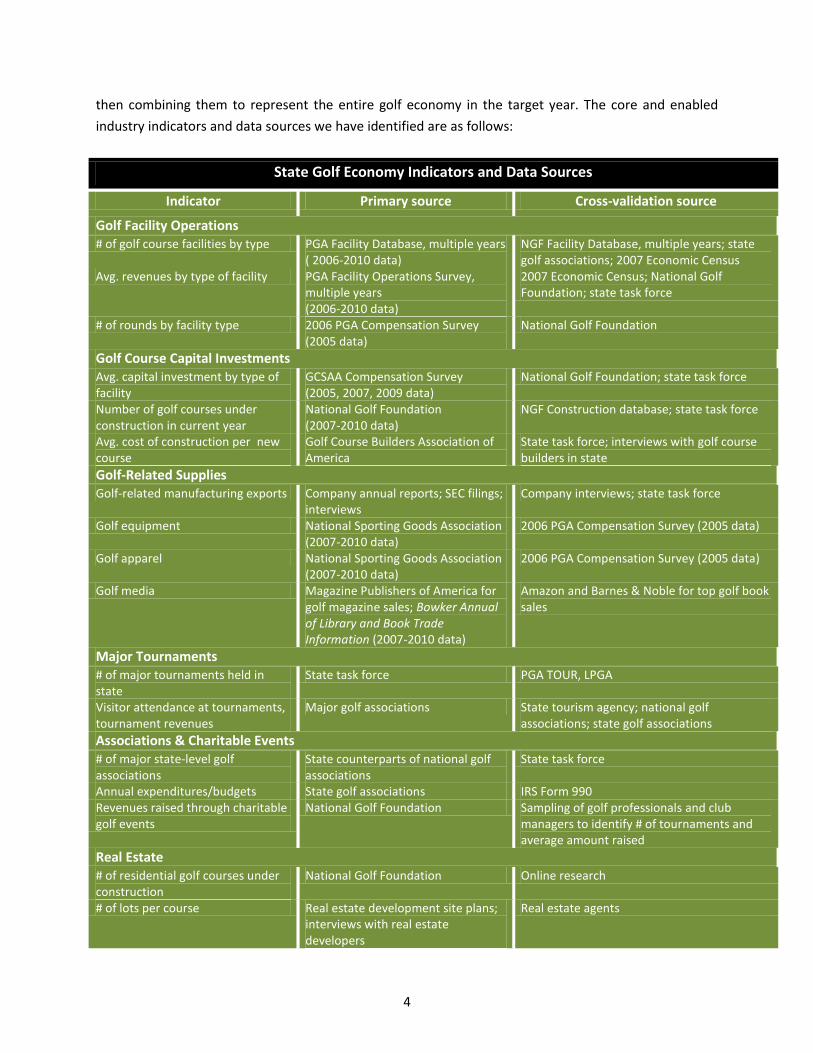
then combining them to represent the entire golf economy in the target year. The core and enabled
industry indicators and data sources we have identified are as follows:
State Golf Economy Indicators and Data Sources
Indicator Primary source Cross-validation source
Golf Facility Operations # of golf course facilities by type PGA Facility Database, multiple years
( 2006-2010 data) NGF Facility Database, multiple years; state golf associations; 2007 Economic Census
Avg. revenues by type of facility PGA Facility Operations Survey, multiple years (2006-2010 data)
2007 Economic Census; National Golf Foundation; state task force
# of rounds by facility type 2006 PGA Compensation Survey (2005 data)
National Golf Foundation
Golf Course Capital Investments Avg. capital investment by type of facility
GCSAA Compensation Survey (2005, 2007, 2009 data)
National Golf Foundation; state task force
Number of golf courses under construction in current year
National Golf Foundation (2007-2010 data)
NGF Construction database; state task force
Avg. cost of construction per new course
Golf Course Builders Association of America
State task force; interviews with golf course builders in state
Golf-Related Supplies Golf-related manufacturing exports Company annual reports; SEC filings;
interviews Company interviews; state task force
Golf equipment National Sporting Goods Association (2007-2010 data)
2006 PGA Compensation Survey (2005 data)
Golf apparel National Sporting Goods Association (2007-2010 data)
2006 PGA Compensation Survey (2005 data)
Golf media Magazine Publishers of America for golf magazine sales; Bowker Annual of Library and Book Trade Information (2007-2010 data)
Amazon and Barnes & Noble for top golf book sales
Major Tournaments # of major tournaments held in state
State task force PGA TOUR, LPGA
Visitor attendance at tournaments, tournament revenues
Major golf associations State tourism agency; national golf associations; state golf associations
Associations & Charitable Events # of major state-level golf associations
State counterparts of national golf associations
State task force
Annual expenditures/budgets State golf associations IRS Form 990 Revenues raised through charitable golf events
National Golf Foundation Sampling of golf professionals and club managers to identify # of tournaments and average amount raised
Real Estate # of residential golf courses under construction
National Golf Foundation Online research
# of lots per course Real estate development site plans; interviews with real estate developers
Real estate agents

5
Avg. construction costs per home and real estate premium
Interviews with real estate developers
Real estate agents
Hospitality/Tourism # of golf travelers or # of golf-related trips to the state
TNS Travel America or TIA/D.K. Shifflet & Associates
State department of tourism/recent surveys/studies
Avg. spending per traveler or per trip
TNS Travel America or TIA/D.K. Shifflet & Associates
State department of tourism/recent surveys/studies; National Golf Foundation
6
THE SIZE OF NEW HAMPSHIRE’S GOLF ECONOMY
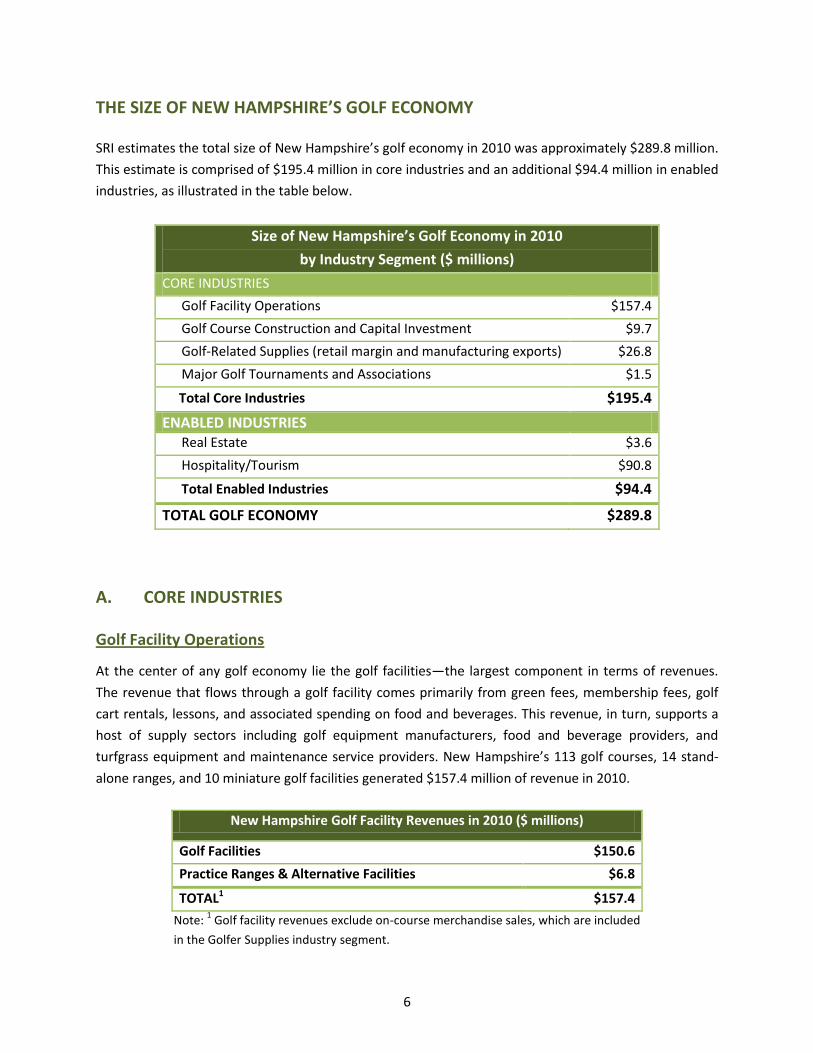
SRI estimates the total size of New Hampshire’s golf economy in 2010 was approximately $289.8 million.
This estimate is comprised of $195.4 million in core industries and an additional $94.4 million in enabled
industries, as illustrated in the table below.
Size of New Hampshire’s Golf Economy in 2010
by Industry Segment ($ millions)
CORE INDUSTRIES
Golf Facility Operations $157.4
Golf Course Construction and Capital Investment $9.7
Golf-Related Supplies (retail margin and manufacturing exports) $26.8
Major Golf Tournaments and Associations $1.5
Total Core Industries $195.4
ENABLED INDUSTRIES Real Estate $3.6
Hospitality/Tourism $90.8
Total Enabled Industries $94.4
TOTAL GOLF ECONOMY $289.8
A. CORE INDUSTRIES
Golf Facility Operations
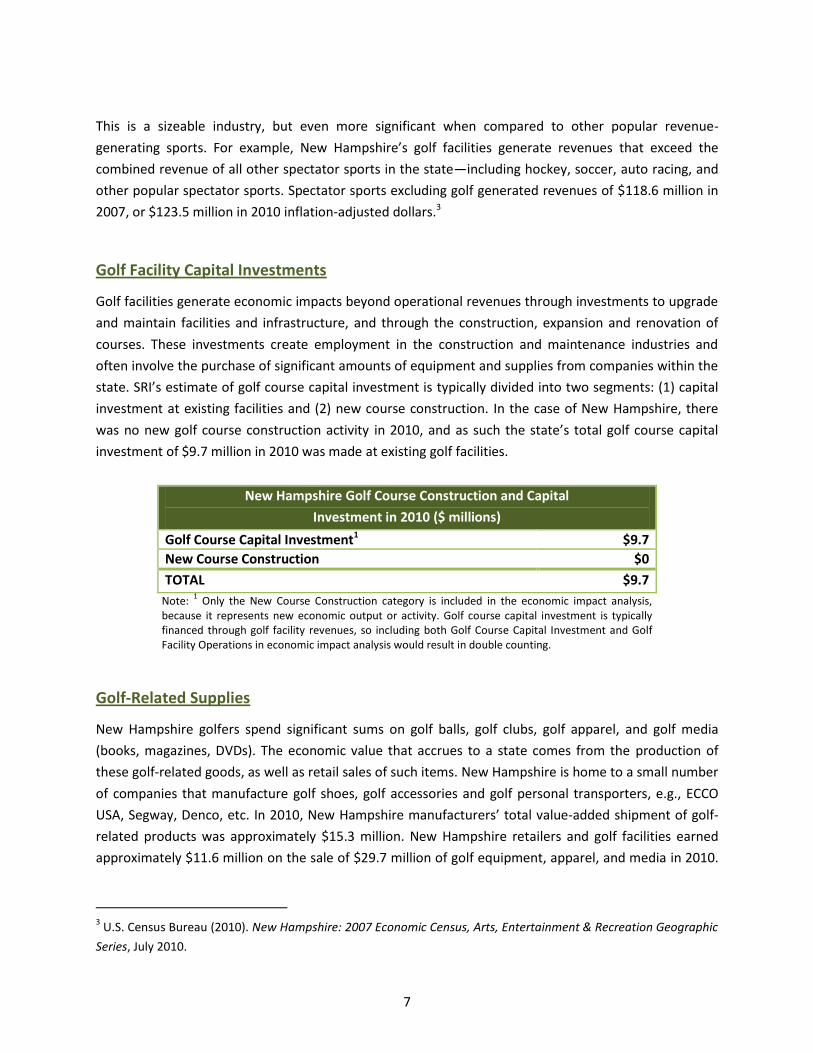
At the center of any golf economy lie the golf facilities—the largest component in terms of revenues.
The revenue that flows through a golf facility comes primarily from green fees, membership fees, golf
cart rentals, lessons, and associated spending on food and beverages. This revenue, in turn, supports a
host of supply sectors including golf equipment manufacturers, food and beverage providers, and
turfgrass equipment and maintenance service providers. New Hampshire’s 113 golf courses, 14 stand-
alone ranges, and 10 miniature golf facilities generated $157.4 million of revenue in 2010.
New Hampshire Golf Facility Revenues in 2010 ($ millions)
Golf Facilities $150.6
Practice Ranges & Alternative Facilities $6.8
TOTAL1 $157.4
Note: 1 Golf facility revenues exclude on-course merchandise sales, which are included
in the Golfer Supplies industry segment.
7
This is a sizeable industry, but even more significant when compared to other popular revenue-
generating sports. For example, New Hampshire’s golf facilities generate revenues that exceed the
combined revenue of all other spectator sports in the state—including hockey, soccer, auto racing, and
other popular spectator sports. Spectator sports excluding golf generated revenues of $118.6 million in
2007, or $123.5 million in 2010 inflation-adjusted dollars.3
Golf Facility Capital Investments
Golf facilities generate economic impacts beyond operational revenues through investments to upgrade
and maintain facilities and infrastructure, and through the construction, expansion and renovation of
courses. These investments create employment in the construction and maintenance industries and
often involve the purchase of significant amounts of equipment and supplies from companies within the
state. SRI’s estimate of golf course capital investment is typically divided into two segments: (1) capital
investment at existing facilities and (2) new course construction. In the case of New Hampshire, there
was no new golf course construction activity in 2010, and as such the state’s total golf course capital
investment of $9.7 million in 2010 was made at existing golf facilities.
New Hampshire Golf Course Construction and Capital
Investment in 2010 ($ millions)
Golf Course Capital Investment1 $9.7
New Course Construction $0
TOTAL $9.7
Note: 1 Only the New Course Construction category is included in the economic impact analysis,
because it represents new economic output or activity. Golf course capital investment is typically financed through golf facility revenues, so including both Golf Course Capital Investment and Golf Facility Operations in economic impact analysis would result in double counting.
Golf-Related Supplies
New Hampshire golfers spend significant sums on golf balls, golf clubs, golf apparel, and golf media
(books, magazines, DVDs). The economic value that accrues to a state comes from the production of
these golf-related goods, as well as retail sales of such items. New Hampshire is home to a small number
of companies that manufacture golf shoes, golf accessories and golf personal transporters, e.g., ECCO
USA, Segway, Denco, etc. In 2010, New Hampshire manufacturers’ total value-added shipment of golf-
related products was approximately $15.3 million. New Hampshire retailers and golf facilities earned
approximately $11.6 million on the sale of $29.7 million of golf equipment, apparel, and media in 2010.
3 U.S. Census Bureau (2010). New Hampshire: 2007 Economic Census, Arts, Entertainment & Recreation Geographic
Series, July 2010.
8
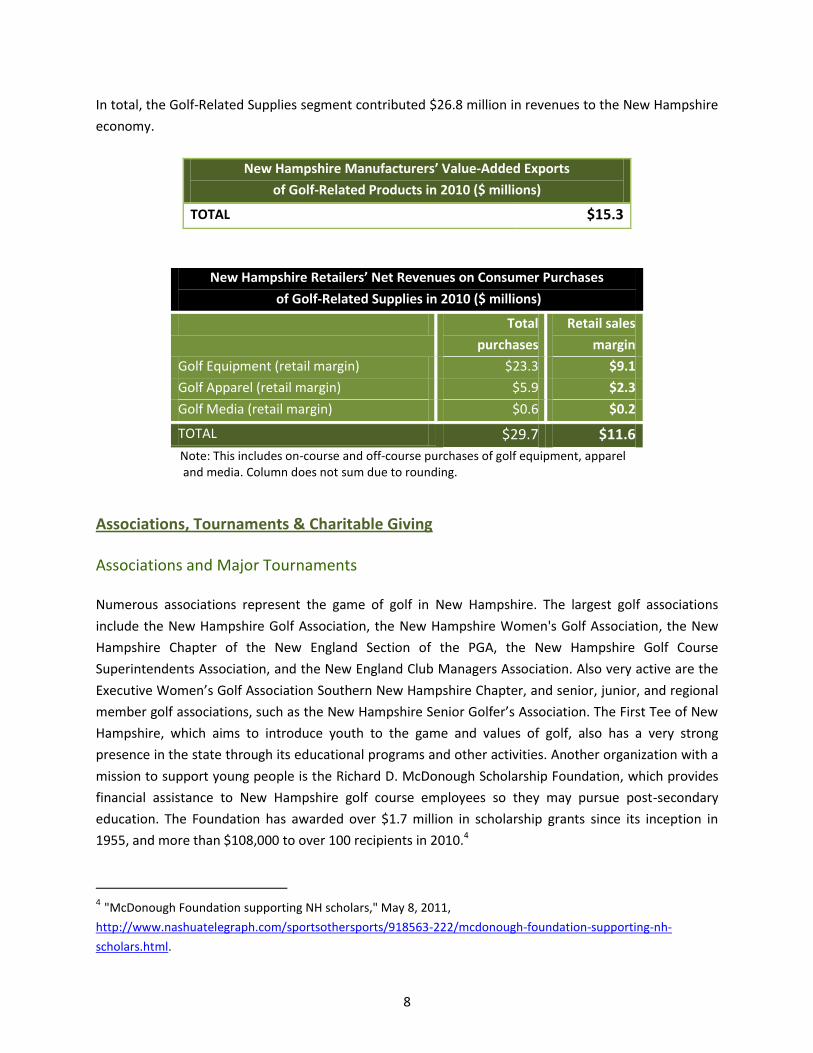
In total, the Golf-Related Supplies segment contributed $26.8 million in revenues to the New Hampshire
economy.
New Hampshire Manufacturers’ Value-Added Exports
of Golf-Related Products in 2010 ($ millions)
TOTAL $15.3
New Hampshire Retailers’ Net Revenues on Consumer Purchases
of Golf-Related Supplies in 2010 ($ millions)
Total
purchases
Retail sales
margin
Golf Equipment (retail margin) $23.3 $9.1
Golf Apparel (retail margin) $5.9 $2.3
Golf Media (retail margin) $0.6 $0.2
TOTAL $29.7 $11.6
Note: This includes on-course and off-course purchases of golf equipment, apparel and media. Column does not sum due to rounding.
Associations, Tournaments & Charitable Giving
Associations and Major Tournaments
Numerous associations represent the game of golf in New Hampshire. The largest golf associations
include the New Hampshire Golf Association, the New Hampshire Women's Golf Association, the New
Hampshire Chapter of the New England Section of the PGA, the New Hampshire Golf Course
Superintendents Association, and the New England Club Managers Association. Also very active are the
Executive Women’s Golf Association Southern New Hampshire Chapter, and senior, junior, and regional
member golf associations, such as the New Hampshire Senior Golfer’s Association. The First Tee of New
Hampshire, which aims to introduce youth to the game and values of golf, also has a very strong
presence in the state through its educational programs and other activities. Another organization with a
mission to support young people is the Richard D. McDonough Scholarship Foundation, which provides
financial assistance to New Hampshire golf course employees so they may pursue post-secondary
education. The Foundation has awarded over $1.7 million in scholarship grants since its inception in
1955, and more than $108,000 to over 100 recipients in 2010.4
4 "McDonough Foundation supporting NH scholars," May 8, 2011,
http://www.nashuatelegraph.com/sportsothersports/918563-222/mcdonough-foundation-supporting-nh-
scholars.html.
9
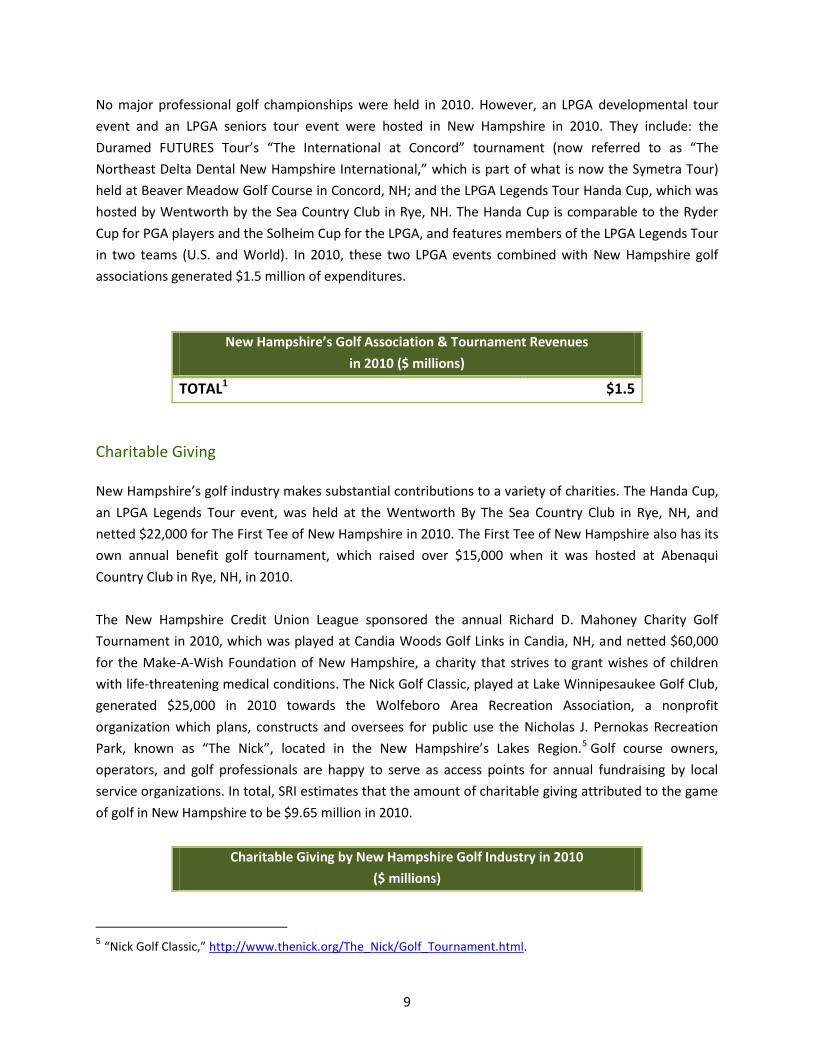
No major professional golf championships were held in 2010. However, an LPGA developmental tour
event and an LPGA seniors tour event were hosted in New Hampshire in 2010. They include: the
Duramed FUTURES Tour’s “The International at Concord” tournament (now referred to as “The
Northeast Delta Dental New Hampshire International,” which is part of what is now the Symetra Tour)
held at Beaver Meadow Golf Course in Concord, NH; and the LPGA Legends Tour Handa Cup, which was
hosted by Wentworth by the Sea Country Club in Rye, NH. The Handa Cup is comparable to the Ryder
Cup for PGA players and the Solheim Cup for the LPGA, and features members of the LPGA Legends Tour
in two teams (U.S. and World). In 2010, these two LPGA events combined with New Hampshire golf
associations generated $1.5 million of expenditures.
New Hampshire’s Golf Association & Tournament Revenues
in 2010 ($ millions)
TOTAL1 $1.5
Charitable Giving
New Hampshire’s golf industry makes substantial contributions to a variety of charities. The Handa Cup,
an LPGA Legends Tour event, was held at the Wentworth By The Sea Country Club in Rye, NH, and
netted $22,000 for The First Tee of New Hampshire in 2010. The First Tee of New Hampshire also has its
own annual benefit golf tournament, which raised over $15,000 when it was hosted at Abenaqui
Country Club in Rye, NH, in 2010.
The New Hampshire Credit Union League sponsored the annual Richard D. Mahoney Charity Golf
Tournament in 2010, which was played at Candia Woods Golf Links in Candia, NH, and netted $60,000
for the Make-A-Wish Foundation of New Hampshire, a charity that strives to grant wishes of children
with life-threatening medical conditions. The Nick Golf Classic, played at Lake Winnipesaukee Golf Club,
generated $25,000 in 2010 towards the Wolfeboro Area Recreation Association, a nonprofit
organization which plans, constructs and oversees for public use the Nicholas J. Pernokas Recreation
Park, known as “The Nick”, located in the New Hampshire’s Lakes Region.5 Golf course owners,
operators, and golf professionals are happy to serve as access points for annual fundraising by local
service organizations. In total, SRI estimates that the amount of charitable giving attributed to the game
of golf in New Hampshire to be $9.65 million in 2010.
Charitable Giving by New Hampshire Golf Industry in 2010
($ millions)
5 “Nick Golf Classic,” http://www.thenick.org/The_Nick/Golf_Tournament.html.
10
TOTAL $9.65
B. ENABLED INDUSTRIES
Real Estate
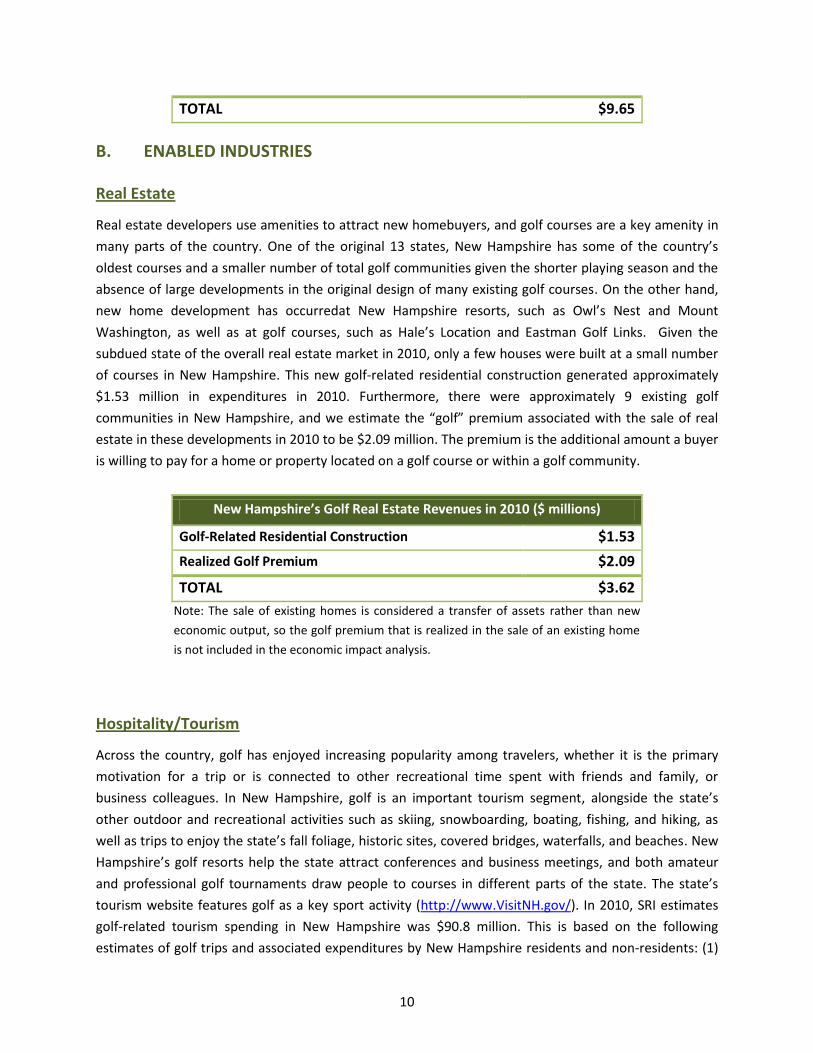
Real estate developers use amenities to attract new homebuyers, and golf courses are a key amenity in
many parts of the country. One of the original 13 states, New Hampshire has some of the country’s
oldest courses and a smaller number of total golf communities given the shorter playing season and the
absence of large developments in the original design of many existing golf courses. On the other hand,
new home development has occurredat New Hampshire resorts, such as Owl’s Nest and Mount
Washington, as well as at golf courses, such as Hale’s Location and Eastman Golf Links. Given the
subdued state of the overall real estate market in 2010, only a few houses were built at a small number
of courses in New Hampshire. This new golf-related residential construction generated approximately
$1.53 million in expenditures in 2010. Furthermore, there were approximately 9 existing golf
communities in New Hampshire, and we estimate the “golf” premium associated with the sale of real
estate in these developments in 2010 to be $2.09 million. The premium is the additional amount a buyer
is willing to pay for a home or property located on a golf course or within a golf community.
New Hampshire’s Golf Real Estate Revenues in 2010 ($ millions)
Golf-Related Residential Construction $1.53
Realized Golf Premium $2.09
TOTAL $3.62
Note: The sale of existing homes is considered a transfer of assets rather than new
economic output, so the golf premium that is realized in the sale of an existing home
is not included in the economic impact analysis.
Hospitality/Tourism
Across the country, golf has enjoyed increasing popularity among travelers, whether it is the primary
motivation for a trip or is connected to other recreational time spent with friends and family, or
business colleagues. In New Hampshire, golf is an important tourism segment, alongside the state’s
other outdoor and recreational activities such as skiing, snowboarding, boating, fishing, and hiking, as
well as trips to enjoy the state’s fall foliage, historic sites, covered bridges, waterfalls, and beaches. New
Hampshire’s golf resorts help the state attract conferences and business meetings, and both amateur
and professional golf tournaments draw people to courses in different parts of the state. The state’s
tourism website features golf as a key sport activity (http://www.VisitNH.gov/). In 2010, SRI estimates
golf-related tourism spending in New Hampshire was $90.8 million. This is based on the following
estimates of golf trips and associated expenditures by New Hampshire residents and non-residents: (1)
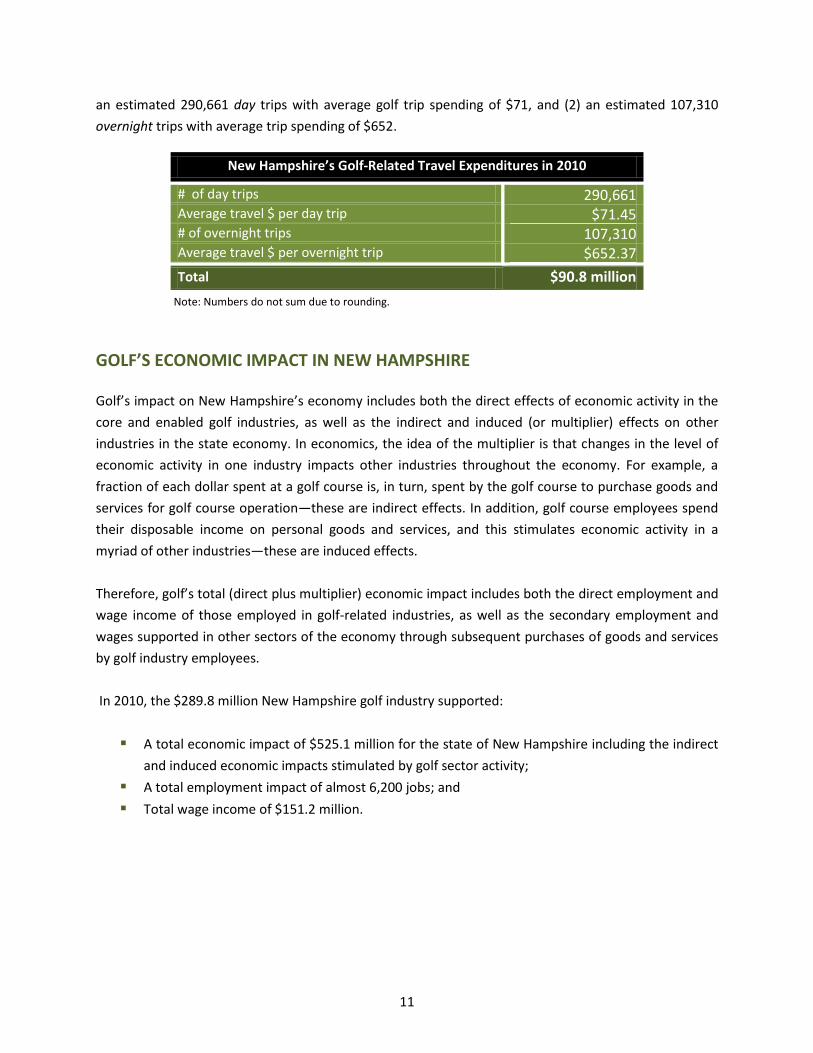
11
an estimated 290,661 day trips with average golf trip spending of $71, and (2) an estimated 107,310
overnight trips with average trip spending of $652.
Note: Numbers do not sum due to rounding.
GOLF’S ECONOMIC IMPACT IN NEW HAMPSHIRE
Golf’s impact on New Hampshire’s economy includes both the direct effects of economic activity in the
core and enabled golf industries, as well as the indirect and induced (or multiplier) effects on other
industries in the state economy. In economics, the idea of the multiplier is that changes in the level of
economic activity in one industry impacts other industries throughout the economy. For example, a
fraction of each dollar spent at a golf course is, in turn, spent by the golf course to purchase goods and
services for golf course operation—these are indirect effects. In addition, golf course employees spend
their disposable income on personal goods and services, and this stimulates economic activity in a
myriad of other industries—these are induced effects.
Therefore, golf’s total (direct plus multiplier) economic impact includes both the direct employment and
wage income of those employed in golf-related industries, as well as the secondary employment and
wages supported in other sectors of the economy through subsequent purchases of goods and services
by golf industry employees.
In 2010, the $289.8 million New Hampshire golf industry supported:
A total economic impact of $525.1 million for the state of New Hampshire including the indirect
and induced economic impacts stimulated by golf sector activity;
A total employment impact of almost 6,200 jobs; and
Total wage income of $151.2 million.
New Hampshire’s Golf-Related Travel Expenditures in 2010
# of day trips 290,661 Average travel $ per day trip $71.45 # of overnight trips 107,310 Average travel $ per overnight trip $652.37
Total $90.8 million

12
Golf’s Impact on New Hampshire’s Economy (2010)
INDUSTRY DIRECT INDIRECT INDUCED TOTAL OUTPUT
($ millions)
TOTAL JOBS
TOTAL WAGE
INCOME ($ millions)
Golf Facility
Operations
$157.4 $295.9 3,879 $87.8
Golf Course Capital
Investment*
$9.7 $0 0 $0
Golf-Related
Supplies
$26.8 $49.8 384 $12.7
Tournaments &
Associations
$1.5 $3.2 32 $0.9
Real Estate ** $3.6 $3.2 25 $1.0
Hospitality/Tourism $90.8 $172.9 1,867 $48.7
TOTAL $289.8 $525.1 6,187 $151.2
Note: Columns may not sum due to rounding. To calculate golf’s total economic impact, SRI subtracted from the
direct golf economy impact of $289.8 million the portion of capital investment that is investment in existing facilities
(in this case the entire $9.7 million because there was no new course construction in 2010) and the portion of real
estate that is the realized golf premium associated with the sale of real estate in existing developments ($2.1 million
of $3.6 million). This is because:
*Golf course capital investments—Only new course construction has an indirect and induced economic impact.
Other types of facility capital investment are typically financed through facility revenues and, therefore, are omitted
to avoid double-counting.
**Real Estate—Only golf residential construction has an indirect and induced impact. The golf premium associated
with golf real estate is considered a transfer of assets rather than new economic activity.
Numbers in columns may not sum due to rounding.
13
DETAILED METHODOLOGY & DATA SOURCES
A key challenge in this study was to identify reliable state-level data sources and to develop
methodologies for measuring the size of industry components for which cross-state estimates do not
exist in straightforward metrics, e.g., golf real estate and off-course purchases of golf apparel and
equipment. This section describes each of the core and enabled industries included in the golf economy
and SRI’s approach to measuring each of these segments.
A. GOLF FACILITY OPERATIONS
For this industry segment, we analyzed the number of golf facilities and average facility revenue data to
derive a total facility operations estimate. Revenues for this segment include: annual or monthly
membership fees, green fees, range fees, and cart rental fees; purchases of golf apparel and equipment
in pro shops; golf lessons; tournament entry fees; consumption of food and beverages; etc.
Number of golf course facilities. Many golf organizations track the number of golf facilities in a state:
the National Golf Foundation (NGF), The PGA of America, and state/regional golf associations, among
others. The U.S. Census Bureau also surveys golf course facilities as business establishments in its
Economic Census every five years. However, these organizations’ calculations of the total numbers of
golf courses in each state, by type of facility, are not always consistent with each other due to: (1)
absence of data for courses which are not members (e.g., The PGA tracks those courses with a PGA
member) or for particular subsets of courses (e.g., municipal facilities and golf resorts are not tracked by
the Census), (2) facility closures and openings, and (3) inconsistency in the classification of courses,
especially resorts.
In some surveys, golf facilities are allowed to self-classify themselves. In others, the surveying
organization classifies the facility based on specific criteria. This can mean the difference between a
small number of resorts (e.g., a figure that includes five-star accommodation located on or adjacent to
an 18-hole course) or a much larger number of resorts (e.g., three-star hotel accommodation located
near a daily fee golf course). Similarly, a resort with two 18-hole golf courses could be counted as two
golf facilities or as one depending on the reporting organization. Fortunately, the variances caused by
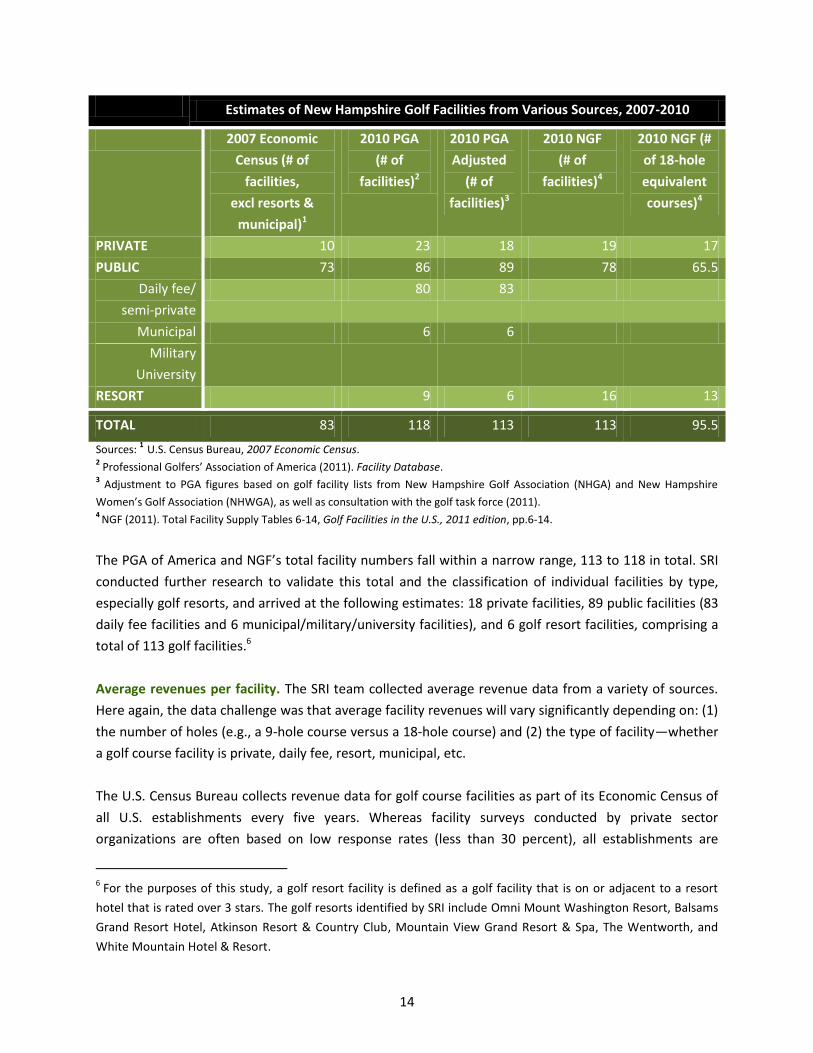
these data collection issues are very small, and thus do not materially impact the overall analysis. The
table below presents slightly differing estimates for the number of golf course facilities in New
Hampshire in 2010 or the latest available year.
14
Estimates of New Hampshire Golf Facilities from Various Sources, 2007-2010
2007 Economic
Census (# of
facilities,
excl resorts &
municipal)1
2010 PGA
(# of
facilities)2
2010 PGA
Adjusted
(# of
facilities)3
2010 NGF
(# of
facilities)4
2010 NGF (#
of 18-hole
equivalent
courses)4
PRIVATE 10 23 18 19 17
PUBLIC 73 86 89 78 65.5
Daily fee/
semi-private
80 83
Municipal 6 6
Military
University
RESORT 9 6 16 13
TOTAL 83 118 113 113 95.5
Sources: 1
U.S. Census Bureau, 2007 Economic Census. 2 Professional Golfers’ Association of America (2011). Facility Database.
3 Adjustment to PGA figures based on golf facility lists from New Hampshire Golf Association (NHGA) and New Hampshire
Women’s Golf Association (NHWGA), as well as consultation with the golf task force (2011). 4
NGF (2011). Total Facility Supply Tables 6-14, Golf Facilities in the U.S., 2011 edition, pp.6-14.
The PGA of America and NGF’s total facility numbers fall within a narrow range, 113 to 118 in total. SRI
conducted further research to validate this total and the classification of individual facilities by type,
especially golf resorts, and arrived at the following estimates: 18 private facilities, 89 public facilities (83
daily fee facilities and 6 municipal/military/university facilities), and 6 golf resort facilities, comprising a
total of 113 golf facilities.6
Average revenues per facility. The SRI team collected average revenue data from a variety of sources.
Here again, the data challenge was that average facility revenues will vary significantly depending on: (1)
the number of holes (e.g., a 9-hole course versus a 18-hole course) and (2) the type of facility—whether
a golf course facility is private, daily fee, resort, municipal, etc.
The U.S. Census Bureau collects revenue data for golf course facilities as part of its Economic Census of
all U.S. establishments every five years. Whereas facility surveys conducted by private sector
organizations are often based on low response rates (less than 30 percent), all establishments are
6 For the purposes of this study, a golf resort facility is defined as a golf facility that is on or adjacent to a resort
hotel that is rated over 3 stars. The golf resorts identified by SRI include Omni Mount Washington Resort, Balsams
Grand Resort Hotel, Atkinson Resort & Country Club, Mountain View Grand Resort & Spa, The Wentworth, and
White Mountain Hotel & Resort.
15
required by law to respond to the Census Bureau survey. However, the Census Bureau data has several
limitations. Many types of facilities are not included in the survey: (1) resort facilities, (2) municipal and
military facilities, (3) stand-alone driving ranges and (4) golf course facilities without payroll. In addition,
in 2002 the national economy was just emerging from an economic recession, which is likely to have
negatively impacted the golf industry. The latest 2007 Economic Census contains revenue, payroll, and
employment data on 12,193 golf facilities broken down by state. This provides a robust estimate with
which to compare other available golf facility revenue data.
The PGA recently began collecting revenue data for all 50 states on an annual basis through its Annual
Operations Survey. The latest available data are from 2010, but the PGA has annual data going back to
2005. In addition, PGA revenue data are broken down by type of facility for categories for which Census
data are not available—resorts, municipal courses, and military courses.
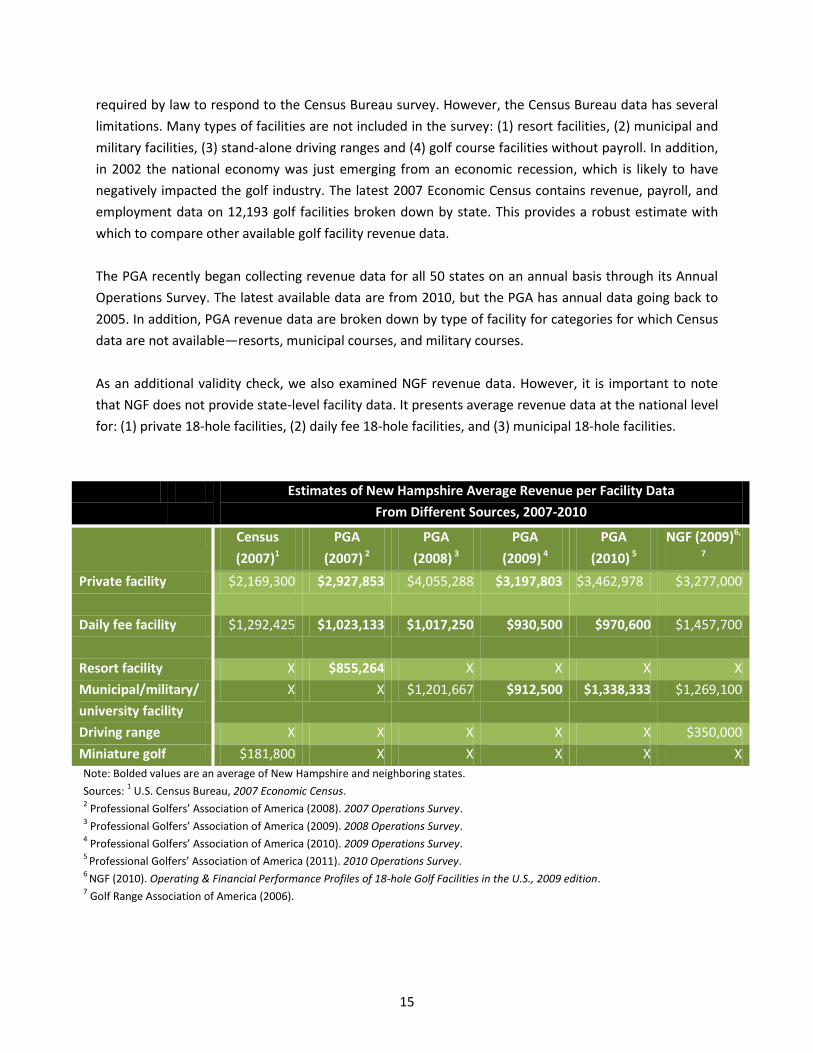
As an additional validity check, we also examined NGF revenue data. However, it is important to note
that NGF does not provide state-level facility data. It presents average revenue data at the national level
for: (1) private 18-hole facilities, (2) daily fee 18-hole facilities, and (3) municipal 18-hole facilities.
Estimates of New Hampshire Average Revenue per Facility Data
From Different Sources, 2007-2010
Census
(2007)1
PGA
(2007) 2
PGA
(2008) 3
PGA
(2009) 4
PGA
(2010) 5
NGF (2009)6,
7
Private facility $2,169,300 $2,927,853 $4,055,288 $3,197,803 $3,462,978 $3,277,000
Daily fee facility $1,292,425 $1,023,133 $1,017,250 $930,500 $970,600 $1,457,700
Resort facility X $855,264 X X X X
Municipal/military/
university facility
X X $1,201,667 $912,500 $1,338,333 $1,269,100
Driving range X X X X X $350,000
Miniature golf $181,800 X X X X X
Note: Bolded values are an average of New Hampshire and neighboring states.
Sources: 1 U.S. Census Bureau, 2007 Economic Census.
2 Professional Golfers’ Association of America (2008). 2007 Operations Survey.
3 Professional Golfers’ Association of America (2009). 2008 Operations Survey.
4 Professional Golfers’ Association of America (2010). 2009 Operations Survey.
5 Professional Golfers’ Association of America (2011). 2010 Operations Survey.
6 NGF (2010). Operating & Financial Performance Profiles of 18-hole Golf Facilities in the U.S., 2009 edition.
7 Golf Range Association of America (2006).
16
Average revenue data from the Census (2007), The PGA (2007-2010) and NGF (2009) are presented in
the table above. For the private facilities, the revenue estimates varied widely. Through primary
research of golf facilities, as well as through viewing private facility tax returns on Guidestar, SRI
determined that the average private golf facility revenue was $2.838M in 2010. In consultation with the
golf task force, SRI used the average daily fee facility revenue estimate of $1.292M ($1.345M when
adjusted for inflation) from the 2007 Economic Census, which was based on a high number of responses
(73). The 2007-2010 PGA daily fee estimates (in bold) are regional averages, rather than New Hampshire
averages because the response rates were too low to yield valid state estimates. For golf resorts, the
golf resort response rate to the PGA survey data was also very low. Therefore, SRI conducted primary
research, resulting in a revised average golf resort facility revenue figure of $650K (largely due to the
very short playing season). For the municipal/military/university facilities, SRI used the 2008 PGA
average revenue estimate of $1.202M ($1.251M when adjusted for inflation); this was the only year
where the response rate was high enough to report a New Hampshire average, instead of a regional
average. Driving range revenues were calculated using the Golf Range Association of America’s estimate
of average revenue figure for golf ranges in 2006 (the latest available data), and average miniature golf
facility revenue was calculated using the 2007 Census data.
To calculate golf facility operations revenues, SRI subtracted on-course merchandise sales from the
average golf facility revenue estimates, because on-course merchandise sales are included in the Golf-
Related Supplies industry segment. SRI then multiplied these adjusted average golf facility operations
revenue estimates by the respective number of golf facilities. Overall, SRI estimates that New
Hampshire’s 113 golf courses, 14 stand-alone ranges, and 10 miniature golf facilities generated $157.4
million of revenue in 2010.
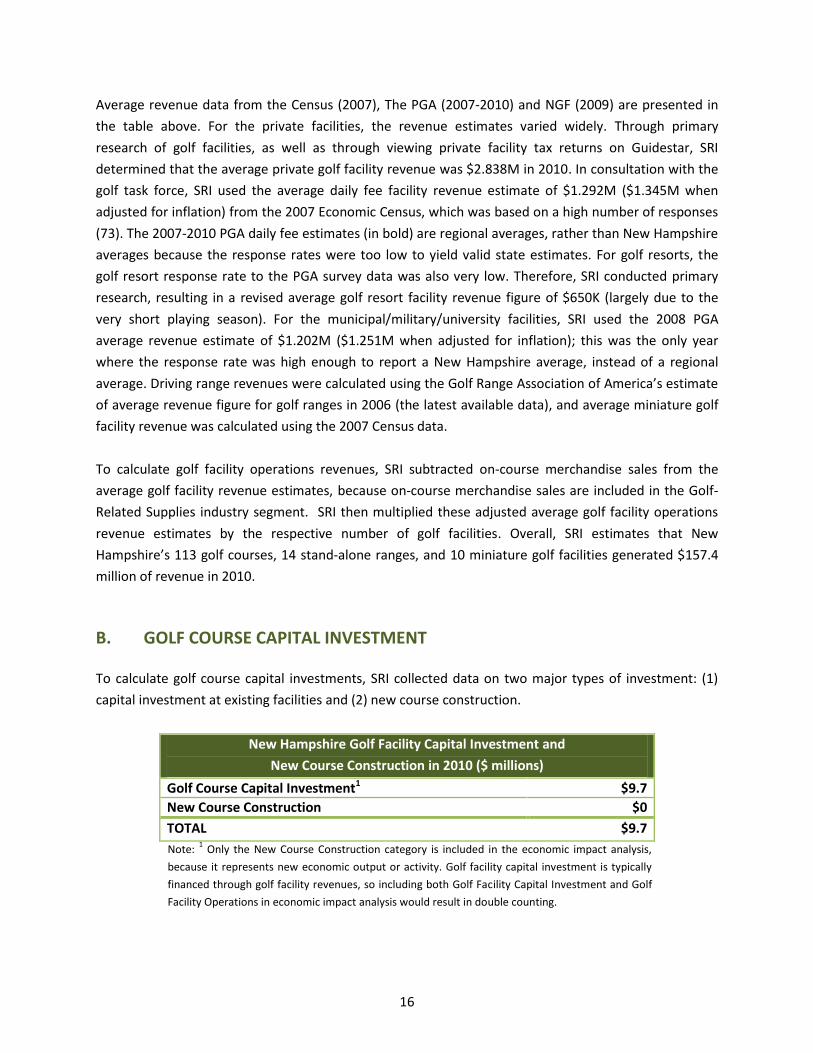
B. GOLF COURSE CAPITAL INVESTMENT
To calculate golf course capital investments, SRI collected data on two major types of investment: (1)
capital investment at existing facilities and (2) new course construction.
New Hampshire Golf Facility Capital Investment and
New Course Construction in 2010 ($ millions)
Golf Course Capital Investment1 $9.7
New Course Construction $0
TOTAL $9.7
Note: 1 Only the New Course Construction category is included in the economic impact analysis,
because it represents new economic output or activity. Golf facility capital investment is typically
financed through golf facility revenues, so including both Golf Facility Capital Investment and Golf
Facility Operations in economic impact analysis would result in double counting.
17
Investment at existing courses. Golf facility capital investment includes improvements to greens and
tees, repaving of cart paths, purchases of new turf maintenance equipment and irrigations systems, and
renovations of the clubhouse, proshop and maintenance buildings. Ordinary maintenance expenses are
not included. SRI examined golf facility capital investment data from two sources: NGF and the GCSAA.
The GCSAA data comes from golf facility capital budget questions included in its 2009 Compensation
Survey. The data is state-level and includes the mean, median and standard deviation of capital
expenditures (not maintenance expenses). The NGF’s 2010 Operating and Financial Performance Profile
presents national estimates of capital expenditures (and also breaks out maintenance expenses
separately) at: (1) daily fee facilities (average revenue of $1.458M, with 69.6% of daily fee facilities
making average capital improvement investments of $131,700); (2) municipal facilities (average
revenues of $1.269M, with 70.2% of municipal facilities making average capital investments of
$189,300); and (3) private facilities (average revenues of $3.277M, with 82% of private facilities making
capital investments of $410,400).
After review of both the state-level and national data sets, SRI used the GCSAA’s data for New
Hampshire in our capital investment calculations. The data indicate that, on average, a New Hampshire
golf facility invested approximately $67,914, for a total capital investment of $8.0 million. Both data sets
indicate that capital investments were down significantly from 2006 (the year preceding the economic
recession that began in 2007 and ended in 2009). The GCSAA data indicate a large standard deviation
($52,114) reflecting the fact that some facilities undertook no capital investments, others scaled back
investment, and some continued to make large investments, taking advantage of market conditions to
undertake big projects at a lower cost than before the recession.
In addition, Manchester Country Club in Bedford underwent a major $1 million two-year renovation
from 2010 to 2011,7 and Pease Golf Course in Portsmouth invested $2.3 million in the construction of a
new clubhouse which began in 2009 and opened in 2010. 8 SRI added half of the total
renovation/construction costs of these two projects ($1.7 million) to its estimate of golf course capital
investment in New Hampshire in 2010, resulting in a total of $9.7 million.
New course construction. The NGF’s Golf Facilities in the U.S. series is the only national source for
estimates of the number of new golf courses under construction in each state. In 2010, NGF estimated
that there were no new 18-hole equivalent golf course openings in New Hampshire and that none were
under construction. Therefore, in 2010, there was no investment in new course construction in New
Hampshire.
7 Bedford Journal, “Manchester Country Club to invest in renovations,” April 23, 2010.
http://www.cabinet.com/bedfordjournal/bedfordnews/713883-308/manchester-country-club-to-invest-in-
renovations.html 8 Pease Development Authority, FY 2009 Annual Report.
http://www.peasedev.org/documents/FY09AnnualReport.pdf
18
C. GOLF-RELATED SUPPLIES
This section explains our methodology for calculating New Hampshire manufacturers’ exports (out-of-
state and overseas shipments) of golf apparel, golf equipment, and accessories. We also detail our
methodology for calculating the retail margin for on-course and off-course purchases of golf equipment,
golf apparel, and golf media.
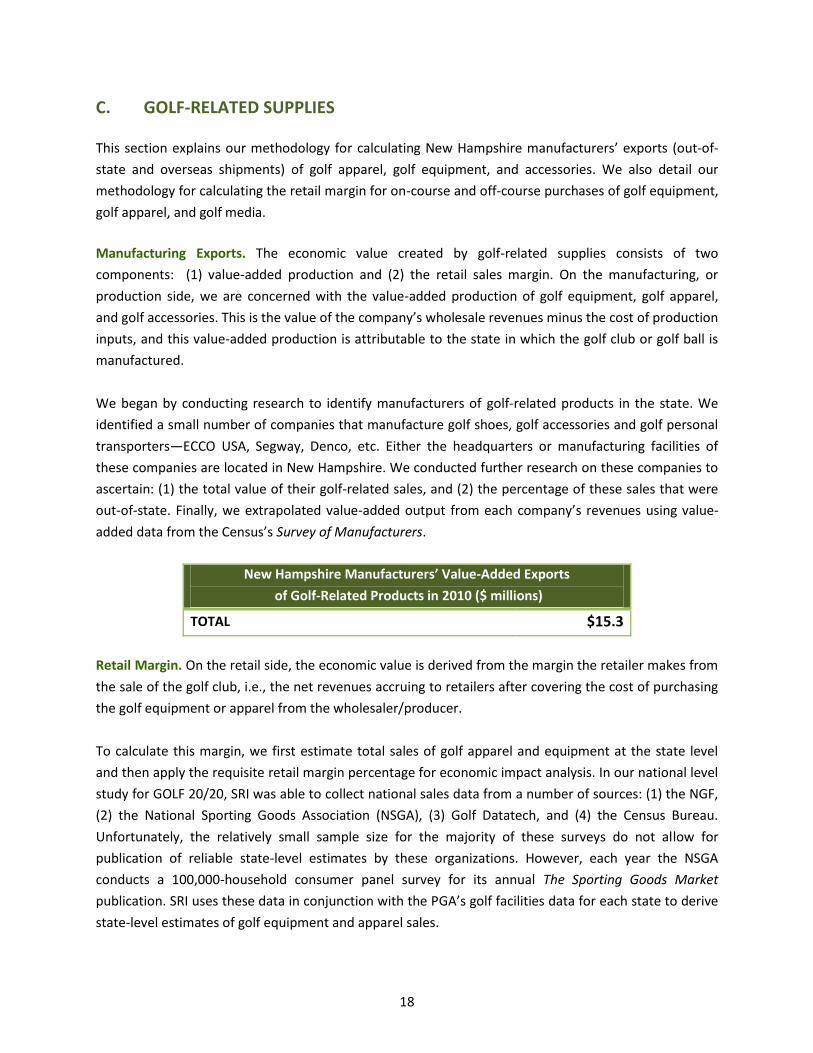
Manufacturing Exports. The economic value created by golf-related supplies consists of two
components: (1) value-added production and (2) the retail sales margin. On the manufacturing, or
production side, we are concerned with the value-added production of golf equipment, golf apparel,
and golf accessories. This is the value of the company’s wholesale revenues minus the cost of production
inputs, and this value-added production is attributable to the state in which the golf club or golf ball is
manufactured.
We began by conducting research to identify manufacturers of golf-related products in the state. We
identified a small number of companies that manufacture golf shoes, golf accessories and golf personal
transporters—ECCO USA, Segway, Denco, etc. Either the headquarters or manufacturing facilities of
these companies are located in New Hampshire. We conducted further research on these companies to
ascertain: (1) the total value of their golf-related sales, and (2) the percentage of these sales that were
out-of-state. Finally, we extrapolated value-added output from each company’s revenues using value-
added data from the Census’s Survey of Manufacturers.
New Hampshire Manufacturers’ Value-Added Exports
of Golf-Related Products in 2010 ($ millions)
TOTAL $15.3
Retail Margin. On the retail side, the economic value is derived from the margin the retailer makes from
the sale of the golf club, i.e., the net revenues accruing to retailers after covering the cost of purchasing
the golf equipment or apparel from the wholesaler/producer.
To calculate this margin, we first estimate total sales of golf apparel and equipment at the state level
and then apply the requisite retail margin percentage for economic impact analysis. In our national level
study for GOLF 20/20, SRI was able to collect national sales data from a number of sources: (1) the NGF,
(2) the National Sporting Goods Association (NSGA), (3) Golf Datatech, and (4) the Census Bureau.
Unfortunately, the relatively small sample size for the majority of these surveys do not allow for
publication of reliable state-level estimates by these organizations. However, each year the NSGA
conducts a 100,000-household consumer panel survey for its annual The Sporting Goods Market
publication. SRI uses these data in conjunction with the PGA’s golf facilities data for each state to derive
state-level estimates of golf equipment and apparel sales.
19
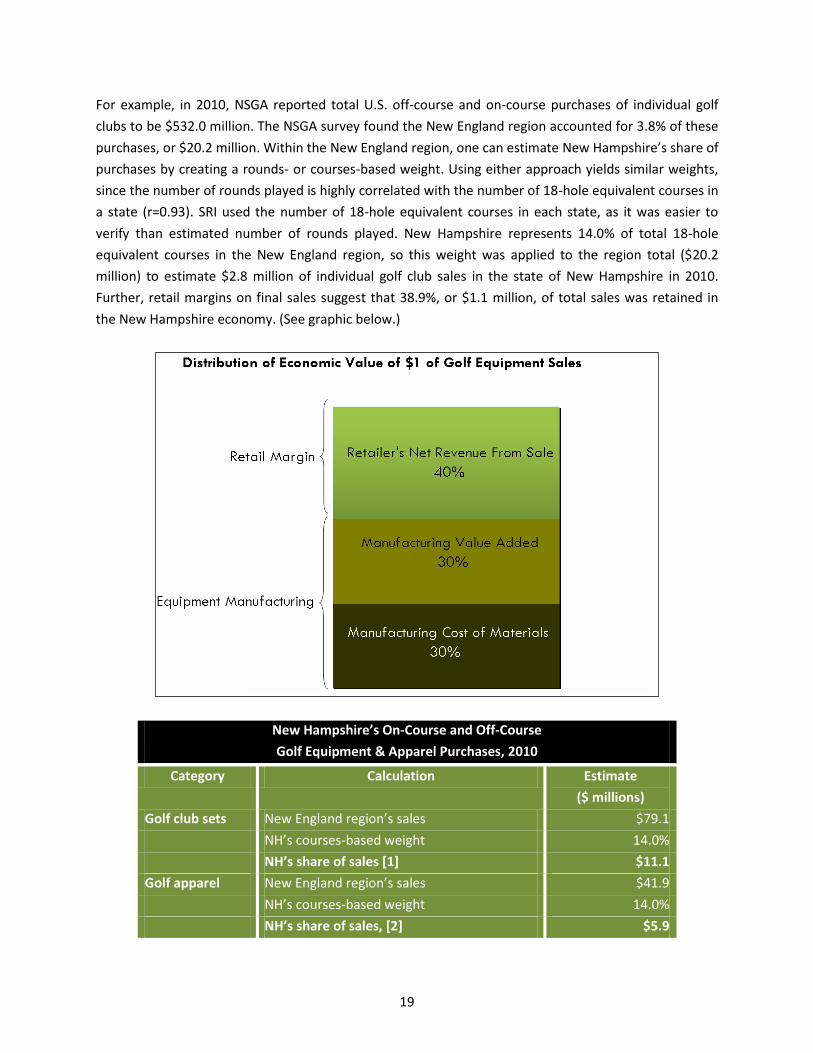
For example, in 2010, NSGA reported total U.S. off-course and on-course purchases of individual golf
clubs to be $532.0 million. The NSGA survey found the New England region accounted for 3.8% of these
purchases, or $20.2 million. Within the New England region, one can estimate New Hampshire’s share of
purchases by creating a rounds- or courses-based weight. Using either approach yields similar weights,
since the number of rounds played is highly correlated with the number of 18-hole equivalent courses in
a state (r=0.93). SRI used the number of 18-hole equivalent courses in each state, as it was easier to
verify than estimated number of rounds played. New Hampshire represents 14.0% of total 18-hole
equivalent courses in the New England region, so this weight was applied to the region total ($20.2
million) to estimate $2.8 million of individual golf club sales in the state of New Hampshire in 2010.
Further, retail margins on final sales suggest that 38.9%, or $1.1 million, of total sales was retained in
the New Hampshire economy. (See graphic below.)
New Hampshire’s On-Course and Off-Course
Golf Equipment & Apparel Purchases, 2010
Category Calculation Estimate
($ millions)
Golf club sets New England region’s sales $79.1
NH’s courses-based weight 14.0%
NH’s share of sales [1] $11.1
Golf apparel New England region’s sales $41.9
NH’s courses-based weight 14.0%
NH’s share of sales, [2] $5.9
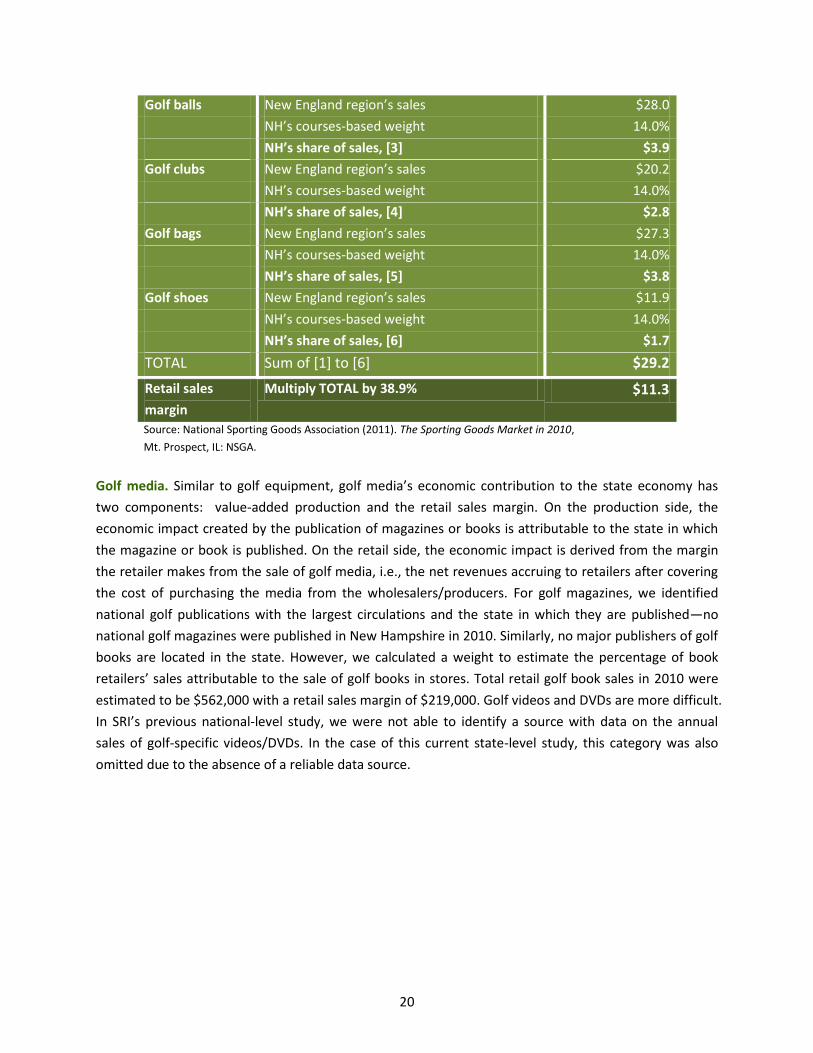
20
Golf balls New England region’s sales $28.0
NH’s courses-based weight 14.0%
NH’s share of sales, [3] $3.9
Golf clubs New England region’s sales $20.2
NH’s courses-based weight 14.0%
NH’s share of sales, [4] $2.8
Golf bags New England region’s sales $27.3
NH’s courses-based weight 14.0%
NH’s share of sales, [5] $3.8
Golf shoes New England region’s sales $11.9
NH’s courses-based weight 14.0%
NH’s share of sales, [6] $1.7
TOTAL Sum of [1] to [6] $29.2
Retail sales
margin
Multiply TOTAL by 38.9% $11.3
Source: National Sporting Goods Association (2011). The Sporting Goods Market in 2010,
Mt. Prospect, IL: NSGA.
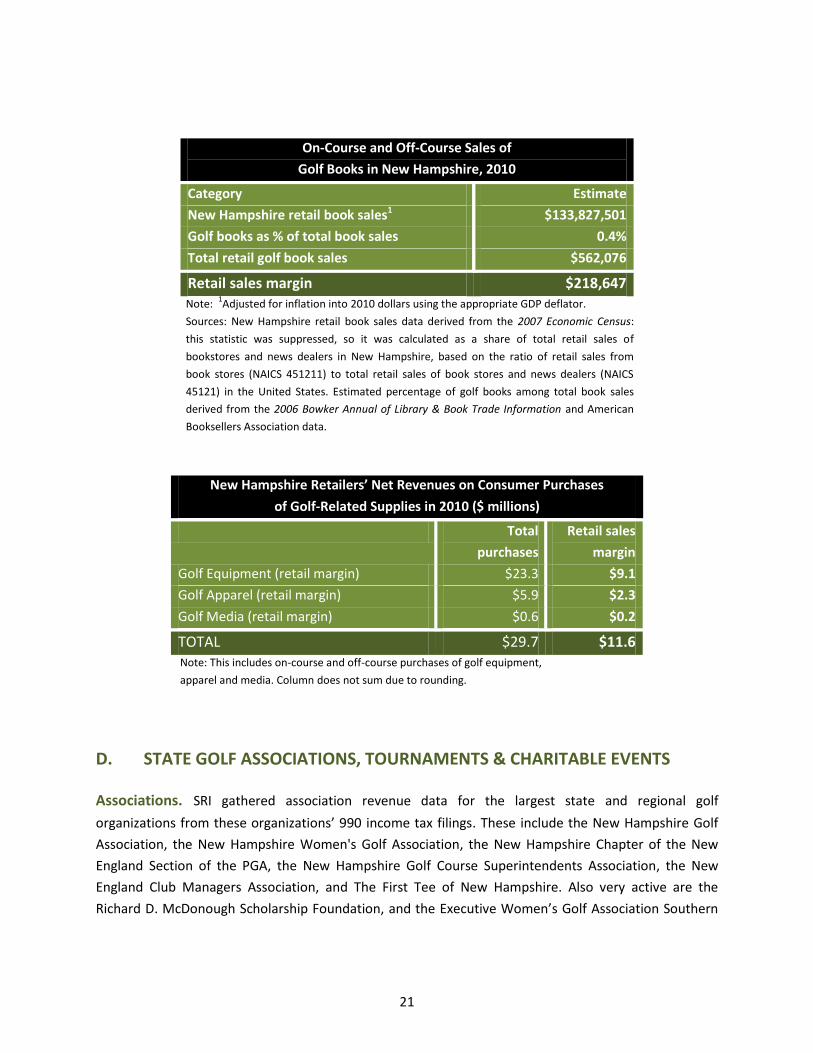
Golf media. Similar to golf equipment, golf media’s economic contribution to the state economy has
two components: value-added production and the retail sales margin. On the production side, the
economic impact created by the publication of magazines or books is attributable to the state in which
the magazine or book is published. On the retail side, the economic impact is derived from the margin
the retailer makes from the sale of golf media, i.e., the net revenues accruing to retailers after covering
the cost of purchasing the media from the wholesalers/producers. For golf magazines, we identified
national golf publications with the largest circulations and the state in which they are published—no
national golf magazines were published in New Hampshire in 2010. Similarly, no major publishers of golf
books are located in the state. However, we calculated a weight to estimate the percentage of book
retailers’ sales attributable to the sale of golf books in stores. Total retail golf book sales in 2010 were
estimated to be $562,000 with a retail sales margin of $219,000. Golf videos and DVDs are more difficult.
In SRI’s previous national-level study, we were not able to identify a source with data on the annual
sales of golf-specific videos/DVDs. In the case of this current state-level study, this category was also
omitted due to the absence of a reliable data source.
21
On-Course and Off-Course Sales of
Golf Books in New Hampshire, 2010
Category Estimate
New Hampshire retail book sales1 $133,827,501
Golf books as % of total book sales 0.4%
Total retail golf book sales $562,076
Retail sales margin $218,647 Note:
1Adjusted for inflation into 2010 dollars using the appropriate GDP deflator.
Sources: New Hampshire retail book sales data derived from the 2007 Economic Census:
this statistic was suppressed, so it was calculated as a share of total retail sales of
bookstores and news dealers in New Hampshire, based on the ratio of retail sales from
book stores (NAICS 451211) to total retail sales of book stores and news dealers (NAICS
45121) in the United States. Estimated percentage of golf books among total book sales
derived from the 2006 Bowker Annual of Library & Book Trade Information and American
Booksellers Association data.
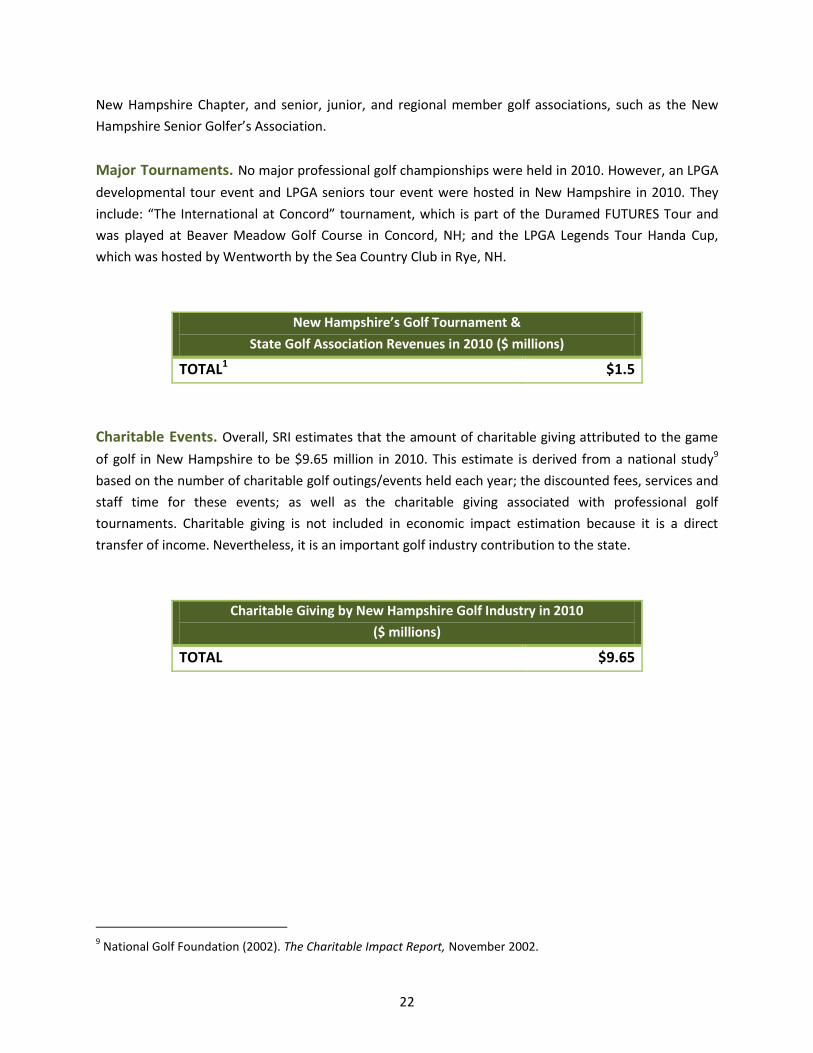
New Hampshire Retailers’ Net Revenues on Consumer Purchases
of Golf-Related Supplies in 2010 ($ millions)
Total
purchases
Retail sales
margin
Golf Equipment (retail margin) $23.3 $9.1
Golf Apparel (retail margin) $5.9 $2.3
Golf Media (retail margin) $0.6 $0.2
TOTAL $29.7 $11.6 Note: This includes on-course and off-course purchases of golf equipment,
apparel and media. Column does not sum due to rounding.
D. STATE GOLF ASSOCIATIONS, TOURNAMENTS & CHARITABLE EVENTS
Associations. SRI gathered association revenue data for the largest state and regional golf
organizations from these organizations’ 990 income tax filings. These include the New Hampshire Golf
Association, the New Hampshire Women's Golf Association, the New Hampshire Chapter of the New
England Section of the PGA, the New Hampshire Golf Course Superintendents Association, the New
England Club Managers Association, and The First Tee of New Hampshire. Also very active are the
Richard D. McDonough Scholarship Foundation, and the Executive Women’s Golf Association Southern
22
New Hampshire Chapter, and senior, junior, and regional member golf associations, such as the New
Hampshire Senior Golfer’s Association.
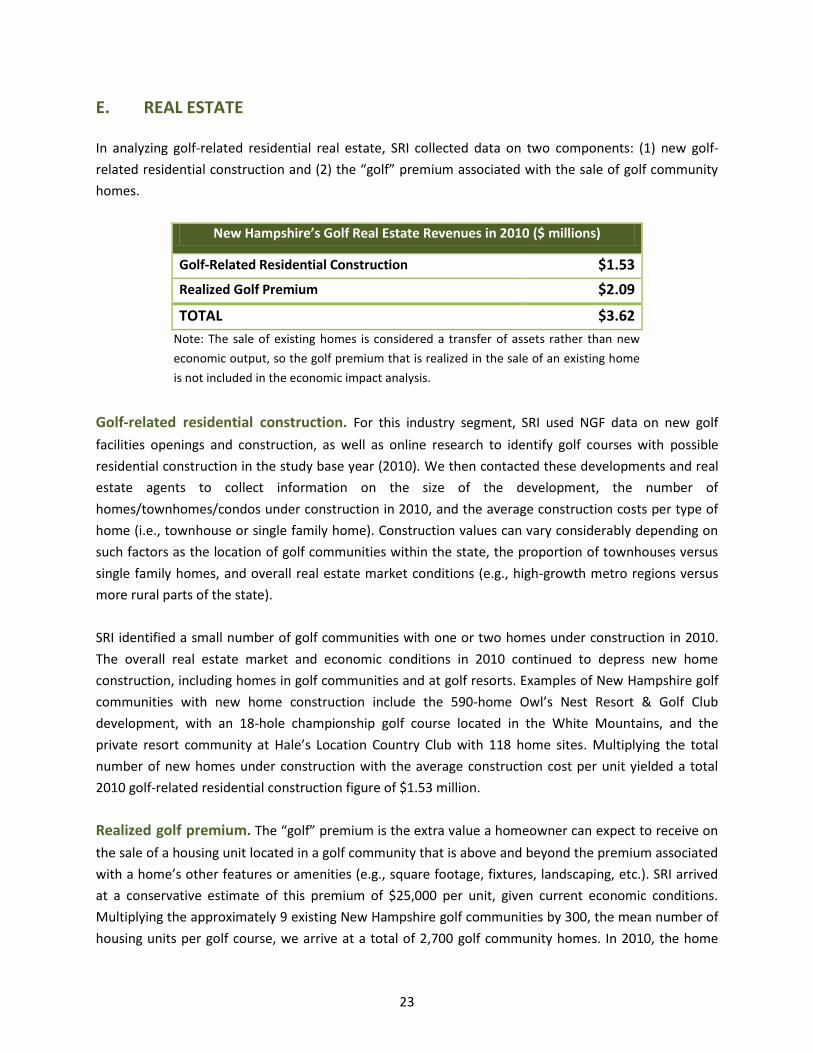
Major Tournaments. No major professional golf championships were held in 2010. However, an LPGA
developmental tour event and LPGA seniors tour event were hosted in New Hampshire in 2010. They
include: “The International at Concord” tournament, which is part of the Duramed FUTURES Tour and
was played at Beaver Meadow Golf Course in Concord, NH; and the LPGA Legends Tour Handa Cup,
which was hosted by Wentworth by the Sea Country Club in Rye, NH.
New Hampshire’s Golf Tournament &
State Golf Association Revenues in 2010 ($ millions)
TOTAL1 $1.5
Charitable Events. Overall, SRI estimates that the amount of charitable giving attributed to the game
of golf in New Hampshire to be $9.65 million in 2010. This estimate is derived from a national study9
based on the number of charitable golf outings/events held each year; the discounted fees, services and
staff time for these events; as well as the charitable giving associated with professional golf
tournaments. Charitable giving is not included in economic impact estimation because it is a direct
transfer of income. Nevertheless, it is an important golf industry contribution to the state.
Charitable Giving by New Hampshire Golf Industry in 2010
($ millions)
TOTAL $9.65
9 National Golf Foundation (2002). The Charitable Impact Report, November 2002.
23
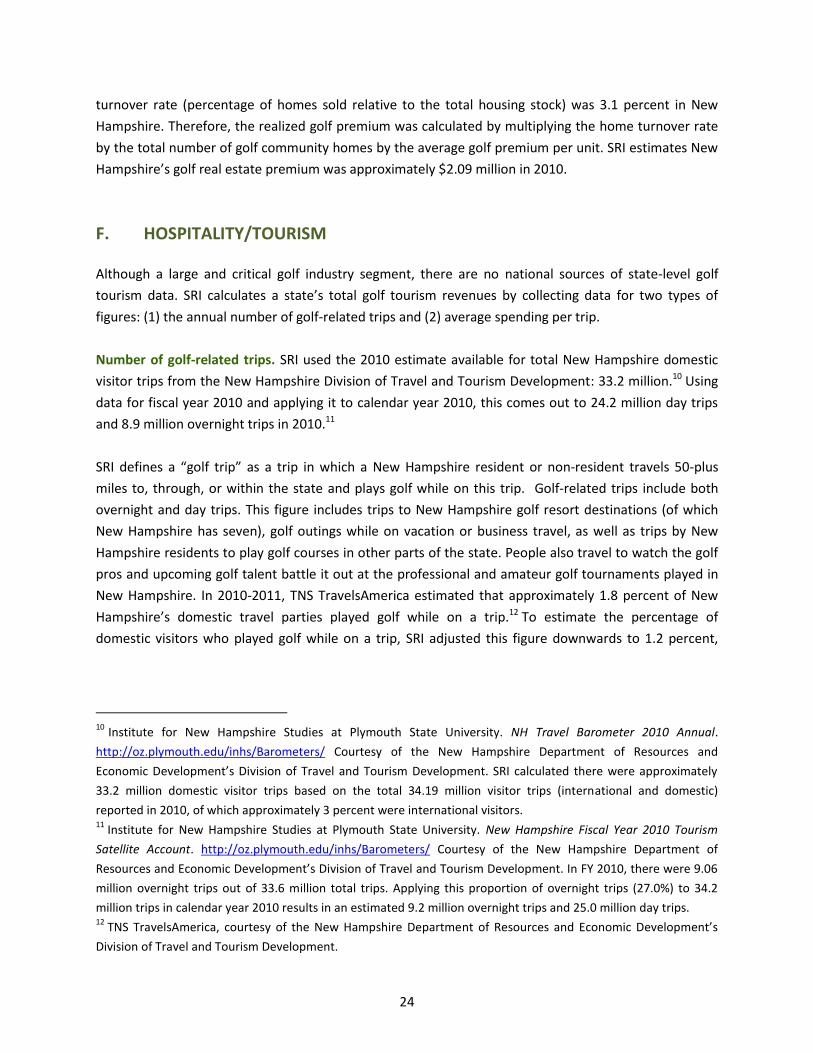
E. REAL ESTATE
In analyzing golf-related residential real estate, SRI collected data on two components: (1) new golf-
related residential construction and (2) the “golf” premium associated with the sale of golf community
homes.
New Hampshire’s Golf Real Estate Revenues in 2010 ($ millions)
Golf-Related Residential Construction $1.53
Realized Golf Premium $2.09
TOTAL $3.62
Note: The sale of existing homes is considered a transfer of assets rather than new
economic output, so the golf premium that is realized in the sale of an existing home
is not included in the economic impact analysis.
Golf-related residential construction. For this industry segment, SRI used NGF data on new golf
facilities openings and construction, as well as online research to identify golf courses with possible
residential construction in the study base year (2010). We then contacted these developments and real
estate agents to collect information on the size of the development, the number of
homes/townhomes/condos under construction in 2010, and the average construction costs per type of
home (i.e., townhouse or single family home). Construction values can vary considerably depending on
such factors as the location of golf communities within the state, the proportion of townhouses versus
single family homes, and overall real estate market conditions (e.g., high-growth metro regions versus
more rural parts of the state).
SRI identified a small number of golf communities with one or two homes under construction in 2010.
The overall real estate market and economic conditions in 2010 continued to depress new home
construction, including homes in golf communities and at golf resorts. Examples of New Hampshire golf
communities with new home construction include the 590-home Owl’s Nest Resort & Golf Club
development, with an 18-hole championship golf course located in the White Mountains, and the
private resort community at Hale’s Location Country Club with 118 home sites. Multiplying the total
number of new homes under construction with the average construction cost per unit yielded a total
2010 golf-related residential construction figure of $1.53 million.
Realized golf premium. The “golf” premium is the extra value a homeowner can expect to receive on
the sale of a housing unit located in a golf community that is above and beyond the premium associated
with a home’s other features or amenities (e.g., square footage, fixtures, landscaping, etc.). SRI arrived
at a conservative estimate of this premium of $25,000 per unit, given current economic conditions.
Multiplying the approximately 9 existing New Hampshire golf communities by 300, the mean number of
housing units per golf course, we arrive at a total of 2,700 golf community homes. In 2010, the home
24
turnover rate (percentage of homes sold relative to the total housing stock) was 3.1 percent in New
Hampshire. Therefore, the realized golf premium was calculated by multiplying the home turnover rate
by the total number of golf community homes by the average golf premium per unit. SRI estimates New
Hampshire’s golf real estate premium was approximately $2.09 million in 2010.
F. HOSPITALITY/TOURISM
Although a large and critical golf industry segment, there are no national sources of state-level golf
tourism data. SRI calculates a state’s total golf tourism revenues by collecting data for two types of
figures: (1) the annual number of golf-related trips and (2) average spending per trip.
Number of golf-related trips. SRI used the 2010 estimate available for total New Hampshire domestic
visitor trips from the New Hampshire Division of Travel and Tourism Development: 33.2 million.10 Using
data for fiscal year 2010 and applying it to calendar year 2010, this comes out to 24.2 million day trips
and 8.9 million overnight trips in 2010.11
SRI defines a “golf trip” as a trip in which a New Hampshire resident or non-resident travels 50-plus
miles to, through, or within the state and plays golf while on this trip. Golf-related trips include both
overnight and day trips. This figure includes trips to New Hampshire golf resort destinations (of which
New Hampshire has seven), golf outings while on vacation or business travel, as well as trips by New
Hampshire residents to play golf courses in other parts of the state. People also travel to watch the golf
pros and upcoming golf talent battle it out at the professional and amateur golf tournaments played in
New Hampshire. In 2010-2011, TNS TravelsAmerica estimated that approximately 1.8 percent of New
Hampshire’s domestic travel parties played golf while on a trip.12 To estimate the percentage of
domestic visitors who played golf while on a trip, SRI adjusted this figure downwards to 1.2 percent,
10
Institute for New Hampshire Studies at Plymouth State University. NH Travel Barometer 2010 Annual.
http://oz.plymouth.edu/inhs/Barometers/ Courtesy of the New Hampshire Department of Resources and
Economic Development’s Division of Travel and Tourism Development. SRI calculated there were approximately
33.2 million domestic visitor trips based on the total 34.19 million visitor trips (international and domestic)
reported in 2010, of which approximately 3 percent were international visitors. 11
Institute for New Hampshire Studies at Plymouth State University. New Hampshire Fiscal Year 2010 Tourism
Satellite Account. http://oz.plymouth.edu/inhs/Barometers/ Courtesy of the New Hampshire Department of
Resources and Economic Development’s Division of Travel and Tourism Development. In FY 2010, there were 9.06
million overnight trips out of 33.6 million total trips. Applying this proportion of overnight trips (27.0%) to 34.2
million trips in calendar year 2010 results in an estimated 9.2 million overnight trips and 25.0 million day trips. 12
TNS TravelsAmerica, courtesy of the New Hampshire Department of Resources and Economic Development’s
Division of Travel and Tourism Development.
25
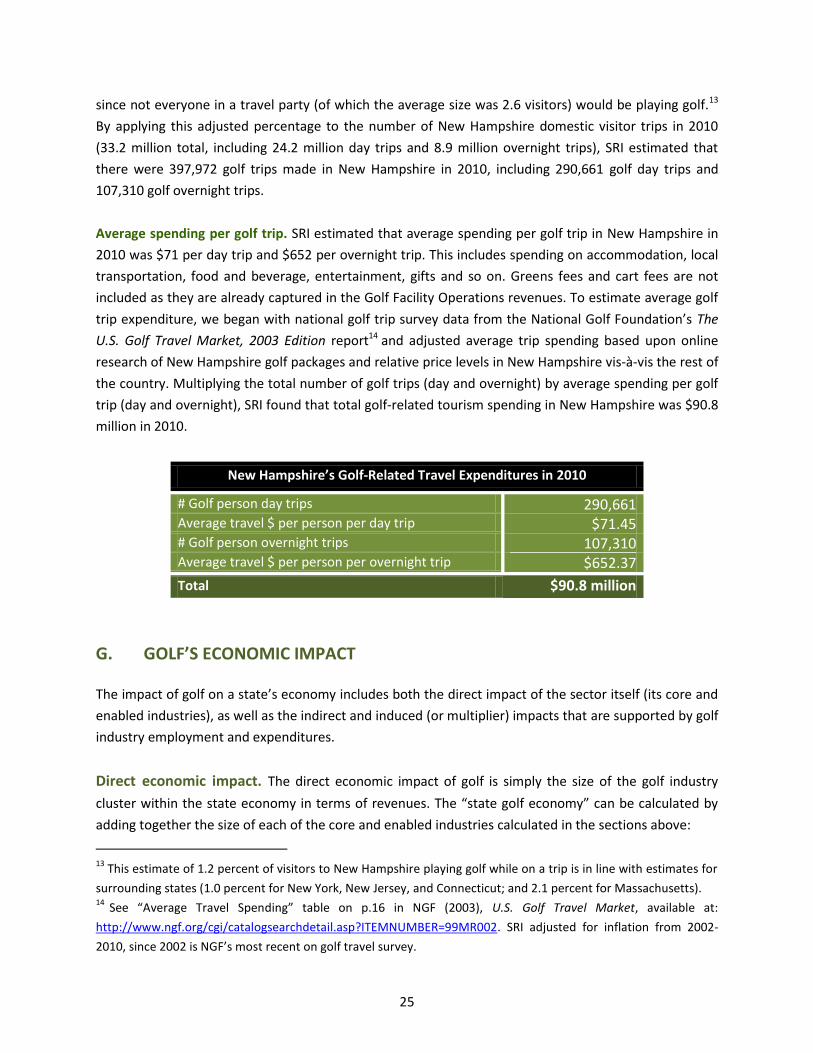
since not everyone in a travel party (of which the average size was 2.6 visitors) would be playing golf.13
By applying this adjusted percentage to the number of New Hampshire domestic visitor trips in 2010
(33.2 million total, including 24.2 million day trips and 8.9 million overnight trips), SRI estimated that
there were 397,972 golf trips made in New Hampshire in 2010, including 290,661 golf day trips and
107,310 golf overnight trips.
Average spending per golf trip. SRI estimated that average spending per golf trip in New Hampshire in
2010 was $71 per day trip and $652 per overnight trip. This includes spending on accommodation, local
transportation, food and beverage, entertainment, gifts and so on. Greens fees and cart fees are not
included as they are already captured in the Golf Facility Operations revenues. To estimate average golf
trip expenditure, we began with national golf trip survey data from the National Golf Foundation’s The
U.S. Golf Travel Market, 2003 Edition report14 and adjusted average trip spending based upon online
research of New Hampshire golf packages and relative price levels in New Hampshire vis-à-vis the rest of
the country. Multiplying the total number of golf trips (day and overnight) by average spending per golf
trip (day and overnight), SRI found that total golf-related tourism spending in New Hampshire was $90.8
million in 2010.
G. GOLF’S ECONOMIC IMPACT
The impact of golf on a state’s economy includes both the direct impact of the sector itself (its core and
enabled industries), as well as the indirect and induced (or multiplier) impacts that are supported by golf
industry employment and expenditures.
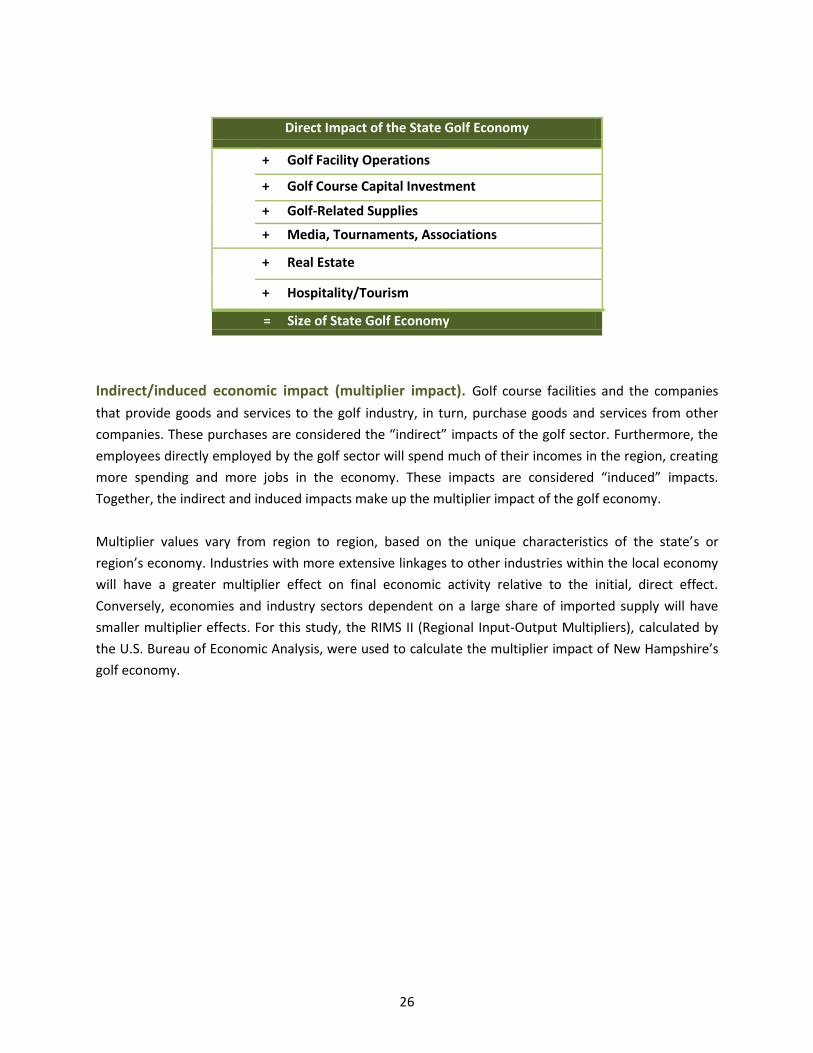
Direct economic impact. The direct economic impact of golf is simply the size of the golf industry
cluster within the state economy in terms of revenues. The “state golf economy” can be calculated by
adding together the size of each of the core and enabled industries calculated in the sections above:
13
This estimate of 1.2 percent of visitors to New Hampshire playing golf while on a trip is in line with estimates for
surrounding states (1.0 percent for New York, New Jersey, and Connecticut; and 2.1 percent for Massachusetts). 14
See “Average Travel Spending” table on p.16 in NGF (2003), U.S. Golf Travel Market, available at:
http://www.ngf.org/cgi/catalogsearchdetail.asp?ITEMNUMBER=99MR002. SRI adjusted for inflation from 2002-
2010, since 2002 is NGF’s most recent on golf travel survey.
New Hampshire’s Golf-Related Travel Expenditures in 2010
# Golf person day trips 290,661 Average travel $ per person per day trip $71.45 # Golf person overnight trips 107,310 Average travel $ per person per overnight trip $652.37
Total $90.8 million
26
Direct Impact of the State Golf Economy
Co
re In
du
stri
es
+ Golf Facility Operations
+ Golf Course Capital Investment
+ Golf-Related Supplies
+ Media, Tournaments, Associations En
able
d
Ind
ust
rie
s + Real Estate
+ Hospitality/Tourism
= Size of State Golf Economy
Indirect/induced economic impact (multiplier impact). Golf course facilities and the companies
that provide goods and services to the golf industry, in turn, purchase goods and services from other
companies. These purchases are considered the “indirect” impacts of the golf sector. Furthermore, the
employees directly employed by the golf sector will spend much of their incomes in the region, creating
more spending and more jobs in the economy. These impacts are considered “induced” impacts.
Together, the indirect and induced impacts make up the multiplier impact of the golf economy.
Multiplier values vary from region to region, based on the unique characteristics of the state’s or
region’s economy. Industries with more extensive linkages to other industries within the local economy
will have a greater multiplier effect on final economic activity relative to the initial, direct effect.
Conversely, economies and industry sectors dependent on a large share of imported supply will have
smaller multiplier effects. For this study, the RIMS II (Regional Input-Output Multipliers), calculated by
the U.S. Bureau of Economic Analysis, were used to calculate the multiplier impact of New Hampshire’s
golf economy.
27
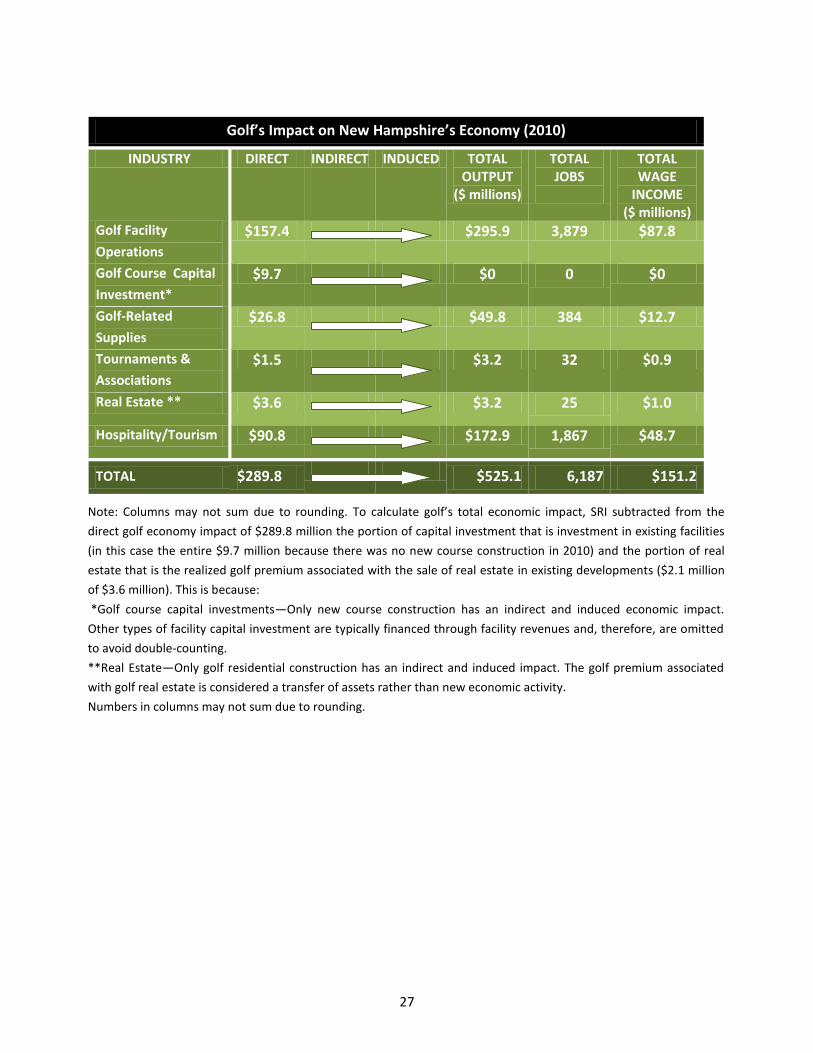
Golf’s Impact on New Hampshire’s Economy (2010)
INDUSTRY DIRECT INDIRECT INDUCED TOTAL OUTPUT
($ millions)
TOTAL JOBS
TOTAL WAGE
INCOME ($ millions)
Golf Facility
Operations
$157.4 $295.9 3,879 $87.8
Golf Course Capital
Investment*
$9.7 $0 0 $0
Golf-Related
Supplies
$26.8 $49.8 384 $12.7
Tournaments &
Associations
$1.5 $3.2 32 $0.9
Real Estate ** $3.6 $3.2 25 $1.0
Hospitality/Tourism $90.8 $172.9 1,867 $48.7
TOTAL $289.8 $525.1 6,187 $151.2
Note: Columns may not sum due to rounding. To calculate golf’s total economic impact, SRI subtracted from the
direct golf economy impact of $289.8 million the portion of capital investment that is investment in existing facilities
(in this case the entire $9.7 million because there was no new course construction in 2010) and the portion of real
estate that is the realized golf premium associated with the sale of real estate in existing developments ($2.1 million
of $3.6 million). This is because:
*Golf course capital investments—Only new course construction has an indirect and induced economic impact.
Other types of facility capital investment are typically financed through facility revenues and, therefore, are omitted
to avoid double-counting.
**Real Estate—Only golf residential construction has an indirect and induced impact. The golf premium associated
with golf real estate is considered a transfer of assets rather than new economic activity.
Numbers in columns may not sum due to rounding.
28
BIBLIOGRAPHY
Bowker Annual of Library & Book Trade Information 2006, 50th Edition. New York, NY: R.R. Bowker.
D.K. Shifflet & Associates (2011). TravelScope®/Directions® data, courtesy of the New Hampshire Office
of Tourism Development. McLean, VA: D.K. Shifflet & Associates.
Golf Course Builders Association of America (2010). Guide to Estimating Cost for Golf Course
Construction. Lincoln, NE: Golf Course Builders Association of America.
Golf Course Superintendents Association of America (2005). Compensation Survey. Lawrence, KS: Golf
Course Superintendents Association of America.
Golf Course Superintendents Association of America (2007). Compensation Survey. Lawrence, KS: Golf
Course Superintendents Association of America.
Golf Course Superintendents Association of America (2009). Compensation Survey. Lawrence, KS: Golf
Course Superintendents Association of America.
Golf Datatech (2006). On-Course Sales Data by Equipment Category. Kissimmee, FL: Golf Datatech.
Golf Range Association of America and National Golf Foundation (2003). Profile of Golf Practice Facility
Operations 2003. Jupiter, FL: National Golf Foundation.
Institute for New Hampshire Studies at Plymouth State University (2011). New Hampshire Fiscal Year
2010 Tourism Satellite Account. Plymouth, NH: Plymouth State University.
http://oz.plymouth.edu/inhs/Barometers/
Institute for New Hampshire Studies at Plymouth State University (2011). NH Travel Barometer 2010
Annual. Plymouth, NH: Plymouth State University. http://oz.plymouth.edu/inhs/Barometers/
Institute for New Hampshire Studies at Plymouth State University (2011). The New Hampshire Ski
Industry, 2009-2010: Its Contribution to the State’s Economy. Plymouth, NH: Plymouth State University.
National Association of Realtors (2011). Existing Home Sales Series. Chicago, IL: National Association of
Realtors. http://www.realtor.org/Research.nsf/Pages/EHSdata
National Golf Foundation (2002). The Charitable Impact Report. Jupiter, FL: National Golf Foundation.

29
NGF (2003). Golf Business Almanac. Jupiter, FL: National Golf Foundation.
NGF (2003). U.S. Golf Travel Market. Jupiter, FL: National Golf Foundation.
NGF (2006). Golf Industry Overview. Jupiter, FL: National Golf Foundation.
NGF (2006). Golf Industry Report. Jupiter, FL: National Golf Foundation.
NGF (2010). Operating & Financial Performance Profiles of 18-hole Facilities in the U.S., 2010 edition,
Jupiter, FL: National Golf Foundation.
NGF (2011). Golf Facilities in the U.S. Jupiter, FL: The National Golf Foundation.
National Sporting Goods Association (2010). Sports Clothing Expenditures in 2009. Mt. Prospect, IL:
National Sporting Goods Association.
National Sporting Goods Association (2011). The Sporting Goods Market in 2010. Mt. Prospect, IL:
National Sporting Goods Association.
New Hampshire Lakes Association (prepared by Gallagher, Callahan & Gartrell, P.A.) (2003). Estimates of
Select Economic Values of New Hampshire Lakes, Rivers, Streams and Ponds: Phase II Report. Concord,
NH: New Hampshire Lakes Association.
The PGA of America (2006). Compensation Study. Palm Beach Gardens, FL: The PGA of America.
The PGA of America (2009). Golf Facility Database. Palm Beach Gardens, FL: The PGA of America.
The PGA of America (2007). Operations Survey. Palm Beach Gardens, FL: The PGA of America.
The PGA of America (2008). Operations Survey. Palm Beach Gardens, FL: The PGA of America.
The PGA of America (2009). Operations Survey. Palm Beach Gardens, FL: The PGA of America.
The PGA of America (2010). Operations Survey. Palm Beach Gardens, FL: The PGA of America.
The PGA of America (2011). Operations Survey. Palm Beach Gardens, FL: The PGA of America.
SRI International (2002). The Golf Economy Report. Arlington, VA: SRI International.
SRI International (2006). The Virginia Golf Economy 2005. Arlington, VA: SRI International.
30
U.S. Census Bureau (2010). 2007 Economic Census: Arts, Entertainment and Recreation Industry Series.
Washington, DC: U.S. Department of Commerce, Economics and Statistics Administration.
U.S. Census Bureau (2010). New Hampshire: 2007. 2007 Economic Census: Arts, Entertainment and
Recreation Geographic Area Series. Washington, DC: U.S. Department of Commerce, Economics and
Statistics Administration.
U.S. Census Bureau (2010). Annual Survey of Manufacturers: 2009 Statistics for All Manufacturing by
State. Washington, DC: U.S. Department of Commerce, Economics and Statistics Administration.
http://www.census.gov/manufacturing/asm/index.html
U.S. Census Bureau (2010). Table 1: Annual Estimates of Housing Units for the United States and States:
April 1, 2000 to July 1, 2009 (HU-EST2005-01). Washington, DC: U.S. Department of Commerce,
Economics and Statistics Administration.
U.S. Department of Agriculture, Economic Research Service (2010). “Top Commodities, Exports, and
Counties,” New Hampshire State Fact Sheet. http://www.ers.usda.gov/statefacts/ga.htm