Embed Size (px)
Citation preview

THE NEW YORK GOLF ECONOMY FULL REPORT
This report was commissioned by GOLF 20/20 for the
New York Golf Task Force, and prepared by SRI International.

The New York Golf Economy
Published September 2009 through an agreement with
SRI International
THE NEW YORK GOLF ECONOMY
CONTENTS
I. STUDY OVERVIEW ............................................................................................ 1
II. ANALYTICAL FRAMEWORK ................................................................................ 2
A. Golf Industry Cluster Definition .................................................................... 2
B. Data Sources ................................................................................................ 3
III. THE SIZE OF NEW YORK’S GOLF ECONOMY ........................................................ 5
A. Core Industries ............................................................................................ 5
B. Enabled Industries ....................................................................................... 10
IV. GOLF’S ECONOMIC IMPACT IN NEW YORK ......................................................... 12
V. DETAILED METHODOLOGY & DATA SOURCES .................................................... 13
A. Golf Facility Operations................................................................................ 13
B. Golf Course Capital Investment .................................................................... 18
C. Golf-Related Supplies................................................................................... 20
D. State Golf Associations, Tournaments & Charitable Events ........................... 24
E. Real Estate ................................................................................................... 25
F. Hospitality/Tourism ..................................................................................... 26
G. Golf’s Economic Impact ................................................................................ 28
BIBLIOGRAPHY ........................................................................................................ 31
Acknowledgements This report was prepared by SRI in agreement with GOLF 20/20, the Central New York Club Managers
Association, the Central New York Section of The PGA of America, the Holiday Organization, the
Metropolitan Golf Association, the Metropolitan Section of The PGA of America, The Northeastern New
York Section of The PGA of America, the Metropolitan Club Managers Association, the Metropolitan Golf
Course Superintendents Association, the Western New York Section of The PGA of America, and the New
York State Club Managers Association. In addition, support for this report comes from the following
national allied organizations: CMAA, GCSAA, LPGA, NGCOA, The PGA of America, PGA TOUR and USGA.
The New York Golf Economy study was conducted by Nancy Chan, John Chase, Aastha Mehta, Jennifer
Ozawa, and Peter Ryan at SRI International with contributions from individuals representing the following
allied golf association in New York (in alphabetical order): Al Antonez (NYSC-CMAA), Anthony Girardi
(MGCSA), Tracie Heighes (NENY-PGA), Jay Mottola (MGA), Bill Moore (NYSGA), Charles Robson (MPGA),
and Todd Zorn (MCMA).

SRI International
ACRONYMS
CMAA Club Managers Association of America
GCBAA Golf Course Builders Association of America
GRAA Golf Range Association of America
GCSAA Golf Course Superintendents Association of America
LPGA Ladies Professional Golf Association
MCMA Metropolitan Club Managers Association
MGA Metropolitan Golf Association
MGCSA Metropolitan Golf Course Superintendents Association
MPGA Metropolitan Section of The Professional Golfers’ Association of America
NENYPGA Northeastern New York Section of The PGA of America
NGCOA National Golf Course Owners Association
NYSGA New York State Golf Association
NYSC-CMAA New York State Chapter of the Club Managers Association of America
PGA The Professional Golfers’ Association of America
USGA United States Golf Association
WGF World Golf Foundation

SRI International 1
I. STUDY OVERVIEW
Host to four U.S. Open tournaments within the last decade and birthplace of The PGA of
America, New York State’s golf pedigree is unrivaled. Moreover, with 818 courses, 38 golf
resorts and nine annual championship golf events, golf in the “Empire State” is more than just
an enjoyable pastime—it is a key industry contributing to the vitality of New York’s economy. In
2007, the size of New York’s direct golf economy was approximately $2.9 billion. Golf brings
visitors to the state, drives new construction and residential development, generates retail sales,
and creates demand for a myriad of goods and services. When the total economic impact of
these golf-related activities is considered, New York’s golf industry generated approximately
$5.3 billion of direct, indirect and induced economic output, $1.6 billion of wage income, and
nearly 56,600 jobs in 2007.
With $2.9 billion in direct annual revenues, the golf industry supports economic activity
comparable to several other important industries in the state: architectural services ($2.7
billion), women’s apparel manufacturing ($4.4 billion), and semiconductor and electronic
component manufacturing ($8.2 billion).1
Historically, many state-level economic studies surrounding the game of golf have been
conducted across the country. However, no comprehensive, standardized framework was
employed in these prior studies. This made it difficult to monitor a state’s industry growth over
time, and to make state-to-state or regional comparisons. To ameliorate this problem, SRI
International and GOLF 20/20 are currently working with key golf stakeholders in several states,
including New York, to bring consistency to the industry measurement and reporting process.
This report describes and analyzes New York’s golf industry including the revenues and
economic impact generated by the industry. Such analysis will assist New York’s industry
stakeholders2 in raising awareness of the impact of golf to state and local policymakers.
There are many potential uses for such an analysis:
� Defining the range of core and enabled industries associated with the game of golf;
� Clearly articulating, for policymakers and regulatory agencies, the employment and
revenue-generating contributions of the golf industry to the state economy; and
1 U.S. Census Bureau. 2002 Economic Census. SRI used the GDP implicit price deflator to inflate 2002 industry revenue
data to 2007 dollars. 2 Key industry stakeholders comprising the New York Golf Task Force include representatives from the Central New
York Section of The PGA of America, the Metropolitan Golf Association, the Metropolitan Section of The PGA of
America, The Northeastern New York Section of The PGA of America, the Metropolitan Club Managers Association,
the Metropolitan Golf Course Superintendents Association, the Western New York Section of The PGA of America,
and the Upstate New York Club Managers Association.
SRI International 2
� Building credibility and recognition of the golf industry as a significant business sector
and a driver of economic activity in the state.
II. ANALYTICAL FRAMEWORK
Current economic studies of the golf industry in different states emphasize various factors and
outcomes. For example, one may focus largely on the turf industry, while another might
examine the impact of sports and recreation-related tourism more broadly. Ideally, one would
want to include all the key activities and industries that are enabled by and benefit from the
game of golf. To meet this goal, SRI has developed a standardized, economic impact framework
that can be employed to measure a comprehensive set of golf-driven industry components. This
state-level framework draws on the conceptual model of the golf economy developed in SRI’s
2000 national-level The Golf Economy Report and the 2005 state-level The Virginia Golf Economy
Report.
A. Golf Industry Cluster Definition
To arrive at economic impact, one must first estimate the size of the golf economy in the state.
This entails mapping out where the golf industry begins and ends, and then estimating the size
of each of these industry segments. We divide the golf industry cluster into two main categories:
(1) core industries and (2) enabled industries (see figure). The golf industry cluster begins with
the golf facilities themselves and with those other core industries that produce goods and
services used to operate facilities and to play the game: golf equipment and golf apparel
manufacturers, golf course architects and course builders, turf maintenance equipment and
service providers, and club management services. The game of golf further enables a number of
other industries, such as golf-related tourism and real estate development.
We detail these industry segments and estimate their size in the following section. Having
defined the core and enabled golf industries, it is possible to estimate the size of each industry
segment and to total them for an overall estimate of the size of the golf economy. Multipliers
can then be applied to calculate the ripple effects of these economic activities in terms of: (1)
impact on total state economic output and (2) impact on total state employment. However, this
process is complicated by the fact that, while most of these industries produce golf-related
goods and services, the firms themselves may not limit their activities exclusively to the golf
industry. For example, Nike produces golf shoes, but also running, tennis, basketball, and other
shoes. Therefore, in general, our approach is to include only those firms and sales that are
directly attributable to the game of golf. In so doing, we use a number of different estimation
techniques to ensure that our final estimates are reasonable and robust.

SRI International 3
Moreover, additional data challenges and location factors make estimation more difficult at the
state level than the national level. For example, many of the major golf equipment
manufacturers have production facilities in just a few states. Similarly, several of the major golf
association headquarters are located in Florida. The presence of such firms, associations, or a
number of well-known courses will change the size of golf’s economic impact in the state
considerably. Therefore, one should consider the size of the golf economy and the game’s
economic impact in the state in relation to the size of the overall economy and other major
industries in that state.
B. Data Sources
SRI developed its framework for measuring state golf economies based on a broad set of
existing sources and data. Although there have been several state-level impact studies
conducted in the past, by numerous golf constituencies, few have used a similar methodology,
resulting in very different estimates depending on the golf economy elements included. A great
deal of data is collected on the golf economy by many organizations on a regular basis. For
example, government agencies, national golf associations, and national associations in the
enabled industries collect data on different industry elements periodically—annually, every few
years, or every five years. In addition, these data are based on a relatively consistent set of
inputs by large numbers of constituents. Therefore, the principal challenges involve acquiring
the data, inflating or deflating the estimates for the proper target year, and then combining
them to represent the entire golf economy in the target year. The core and enabled industry
indicators and data sources we have identified are as follows:

SRI International 4
State Golf Economy Indicators and Data Sources
Indicator Primary source Cross-validation source
Golf Facility Operations
# of golf course facilities by type PGA Facility Database, multiple years
( 2005-2007 data)
2002 Economic Census; state task force; NGF
Facility Database, multiple years
Avg. revenues by type of facility PGA Facility Operations Survey,
multiple years
(2005-2007 data)
2002 Economic Census; National Golf
Foundation; state task force
# of rounds by facility type 2006 PGA Compensation Survey
(2005 data)
National Golf Foundation
Golf Course Capital Investments
Avg. capital investment by type of
facility
GCSAA Compensation Survey
(2005, 2007 data)
National Golf Foundation; State task force
Number of golf courses under
construction in current year
National Golf Foundation
(2007, 2008 data)
NGF Construction database; state task force
Avg. cost of construction per new
course
Golf Course Builders Association of
America
State task force; interviews with golf course
builders in state
Golf-Related Supplies
Golf-related manufacturing exports Company annual reports; SEC filings;
interviews
Company interviews; state task force
Golf equipment National Sporting Goods Association
(2007, 2008 data)
2006 PGA Compensation Survey (2005 data)
Golf apparel National Sporting Goods Association
(2007, 2008 data)
2006 PGA Compensation Survey (2005 data)
Golf media Magazine Publishers of America for
golf magazine sales; Bowker Annual
of Library and Book Trade
Information (2007, 2008 data)
Amazon and Barnes & Noble for top golf book
sales
Major Tournaments
# of major tournaments held in
state
State task force Major golf associations
Visitor attendance at tournaments,
tournament revenues
Major golf associations State task force or state associations
Associations & Charitable Events
# of major state-level golf
associations
State counterparts of national golf
associations
State task force
Annual revenues/budgets State golf associations State task force
# of employees State golf associations State task force
Revenues raised through charitable
golf events
National Golf Foundation Sampling of golf professionals and club
managers to identify # of tournaments and
average amount raised
Real Estate
# of residential golf courses under
construction
National Golf Foundation;
real estate/development agencies
Interviews with golf course architects and real
estate developers
# of lots per course Interviews with golf course
architects and real estate developers
Golf Course Builders Association of America,
National Golf Course Owners Association,
SRI International 5
State Golf Economy Indicators and Data Sources
Indicator Primary source Cross-validation source
Avg. construction costs per home
and real estate premium
Interviews with real estate
developers
Golf Course Builders Association of America,
National Golf Course Owners
Hospitality/Tourism
# of golf travelers or # of golf-
related trips to the state
D.K. Shifflet & Associates State department of tourism/recent
surveys/studies
Avg. spending per traveler or per
trip
D.K. Shifflet & Associates State department of tourism/recent
surveys/studies; National Golf Foundation
III. THE SIZE OF NEW YORK’S GOLF ECONOMY
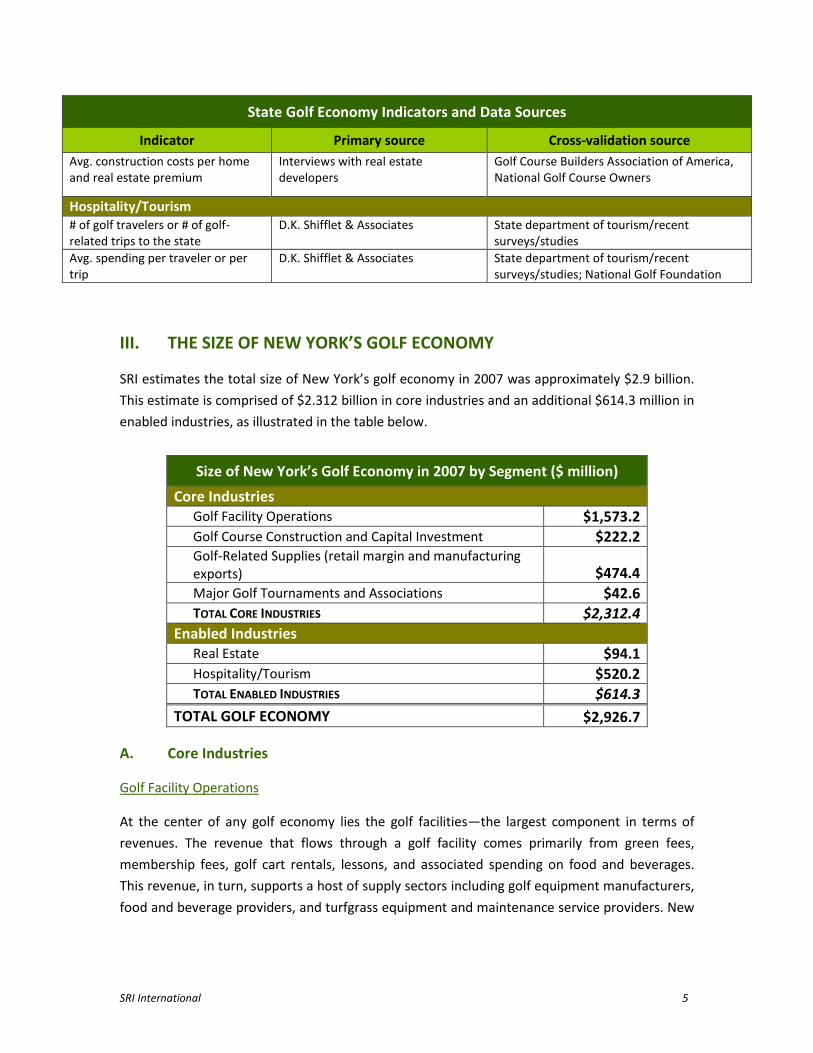
SRI estimates the total size of New York’s golf economy in 2007 was approximately $2.9 billion.
This estimate is comprised of $2.312 billion in core industries and an additional $614.3 million in
enabled industries, as illustrated in the table below.
Size of New York’s Golf Economy in 2007 by Segment ($ million)
Core Industries
Golf Facility Operations $1,573.2
Golf Course Construction and Capital Investment $222.2
Golf-Related Supplies (retail margin and manufacturing
exports) $474.4
Major Golf Tournaments and Associations $42.6
TOTAL CORE INDUSTRIES $2,312.4
Enabled Industries
Real Estate $94.1
Hospitality/Tourism $520.2
TOTAL ENABLED INDUSTRIES $614.3
TOTAL GOLF ECONOMY $2,926.7
A. Core Industries
Golf Facility Operations
At the center of any golf economy lies the golf facilities—the largest component in terms of
revenues. The revenue that flows through a golf facility comes primarily from green fees,
membership fees, golf cart rentals, lessons, and associated spending on food and beverages.
This revenue, in turn, supports a host of supply sectors including golf equipment manufacturers,
food and beverage providers, and turfgrass equipment and maintenance service providers. New
SRI International 6
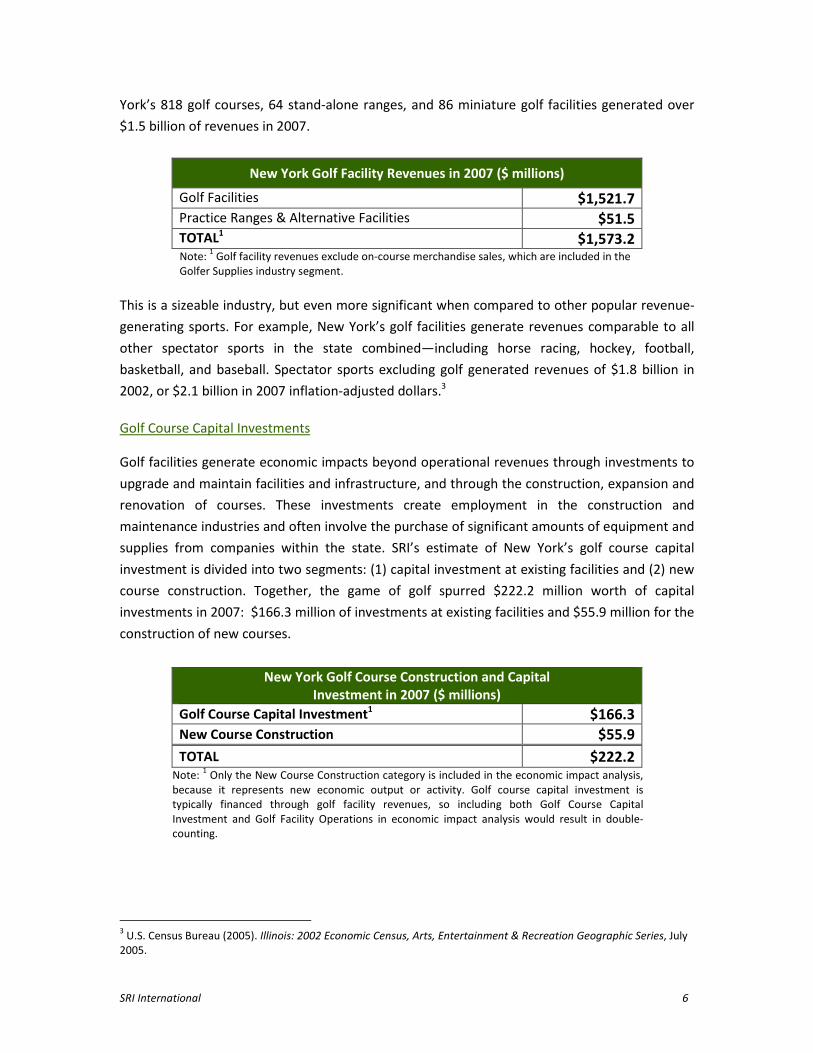
York’s 818 golf courses, 64 stand-alone ranges, and 86 miniature golf facilities generated over
$1.5 billion of revenues in 2007.
New York Golf Facility Revenues in 2007 ($ millions)
Golf Facilities $1,521.7
Practice Ranges & Alternative Facilities $51.5
TOTAL1 $1,573.2 Note:
1 Golf facility revenues exclude on-course merchandise sales, which are included in the
Golfer Supplies industry segment.
This is a sizeable industry, but even more significant when compared to other popular revenue-
generating sports. For example, New York’s golf facilities generate revenues comparable to all
other spectator sports in the state combined—including horse racing, hockey, football,
basketball, and baseball. Spectator sports excluding golf generated revenues of $1.8 billion in
2002, or $2.1 billion in 2007 inflation-adjusted dollars.3
Golf Course Capital Investments
Golf facilities generate economic impacts beyond operational revenues through investments to
upgrade and maintain facilities and infrastructure, and through the construction, expansion and
renovation of courses. These investments create employment in the construction and
maintenance industries and often involve the purchase of significant amounts of equipment and
supplies from companies within the state. SRI’s estimate of New York’s golf course capital
investment is divided into two segments: (1) capital investment at existing facilities and (2) new
course construction. Together, the game of golf spurred $222.2 million worth of capital
investments in 2007: $166.3 million of investments at existing facilities and $55.9 million for the
construction of new courses.
New York Golf Course Construction and Capital
Investment in 2007 ($ millions)
Golf Course Capital Investment1 $166.3
New Course Construction $55.9
TOTAL $222.2 Note:
1 Only the New Course Construction category is included in the economic impact analysis,
because it represents new economic output or activity. Golf course capital investment is
typically financed through golf facility revenues, so including both Golf Course Capital
Investment and Golf Facility Operations in economic impact analysis would result in double-
counting.
3 U.S. Census Bureau (2005). Illinois: 2002 Economic Census, Arts, Entertainment & Recreation Geographic Series, July
2005.
SRI International 7
Golf-Related Supplies
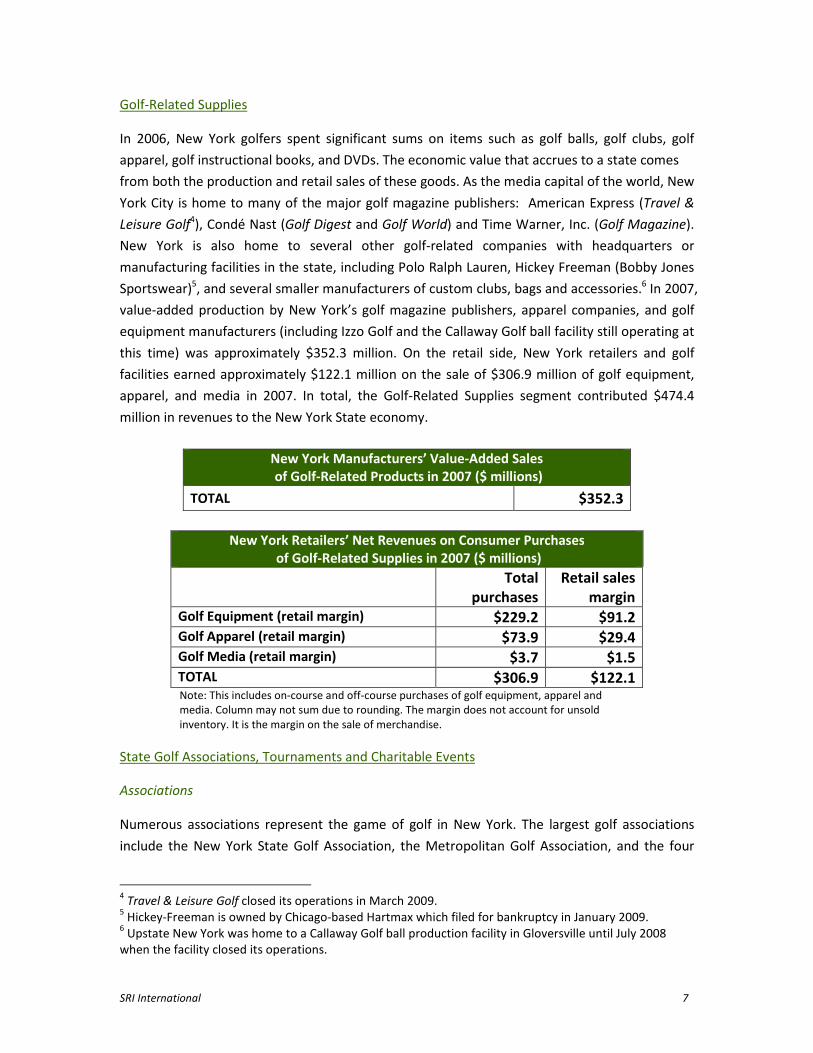
In 2006, New York golfers spent significant sums on items such as golf balls, golf clubs, golf
apparel, golf instructional books, and DVDs. The economic value that accrues to a state comes
from both the production and retail sales of these goods. As the media capital of the world, New
York City is home to many of the major golf magazine publishers: American Express (Travel &
Leisure Golf4), Condé Nast (Golf Digest and Golf World) and Time Warner, Inc. (Golf Magazine).
New York is also home to several other golf-related companies with headquarters or
manufacturing facilities in the state, including Polo Ralph Lauren, Hickey Freeman (Bobby Jones
Sportswear)5, and several smaller manufacturers of custom clubs, bags and accessories.6 In 2007,
value-added production by New York’s golf magazine publishers, apparel companies, and golf
equipment manufacturers (including Izzo Golf and the Callaway Golf ball facility still operating at
this time) was approximately $352.3 million. On the retail side, New York retailers and golf
facilities earned approximately $122.1 million on the sale of $306.9 million of golf equipment,
apparel, and media in 2007. In total, the Golf-Related Supplies segment contributed $474.4
million in revenues to the New York State economy.
New York Manufacturers’ Value-Added Sales
of Golf-Related Products in 2007 ($ millions)
TOTAL $352.3
New York Retailers’ Net Revenues on Consumer Purchases
of Golf-Related Supplies in 2007 ($ millions)
Total
purchases
Retail sales
margin
Golf Equipment (retail margin) $229.2 $91.2
Golf Apparel (retail margin) $73.9 $29.4
Golf Media (retail margin) $3.7 $1.5
TOTAL $306.9 $122.1 Note: This includes on-course and off-course purchases of golf equipment, apparel and
media. Column may not sum due to rounding. The margin does not account for unsold
inventory. It is the margin on the sale of merchandise.
State Golf Associations, Tournaments and Charitable Events
Associations
Numerous associations represent the game of golf in New York. The largest golf associations
include the New York State Golf Association, the Metropolitan Golf Association, and the four
4 Travel & Leisure Golf closed its operations in March 2009.
5 Hickey-Freeman is owned by Chicago-based Hartmax which filed for bankruptcy in January 2009.
6 Upstate New York was home to a Callaway Golf ball production facility in Gloversville until July 2008
when the facility closed its operations.
SRI International 8
sections of The Professional Golfers’ Association of America: the Central New York PGA Section,
the Metropolitan PGA Section, the Northeastern New York PGA Section, and the Western New
York PGA Section. Other regional and state-level associations include regional chapters of the
Golf Course Superintendents Association,7 the New York State Turfgrass Association, the four
chapters of the Club Managers Association (City of New York, Central New York, Metropolitan,
and New York State), as well as regional chapters of the Executive Women's Golf Association
(Albany/Capital Region, Central New York, Westchester, etc.), the Women’s Metropolitan Golf
Association, and regional seniors’ golf associations. Junior golf is supported by the New York
Junior Golf Association, each of the four New York PGA sections, and the First Tee program. In
2007, New York golf associations generated total revenues of $9.6 million.
Major Tournaments
New York has an incredible history playing host to the major golf championships. The State of
New York has hosted the U.S. Open four times over the last decade.8 The U.S. Open is one of the
four “Grand Slam” championships, along with the Masters, the Open Championship (British
Open), and the PGA Championship. In 2009, the U.S. Open returned to New York’s Bethpage
State Park, the first municipal course to host a U.S. Open event. The economic impact of hosting
this event is considerable given the large number of spectators (up to 225,000) and the tourism
revenues—estimates of previous U.S. Open impact ranges from $70 million to $124 million.9 In
addition to the U.S. Open, New York State’s Oak Hills hosted the Ryder Cup in 1995, and Winged
Foot hosted the PGA Championship in 1997. Major golf championships—but also amateur
events—generate significant economic impact for local economies because of the number of
players, officials, and golf enthusiasts they bring to New York
In 2007, the base year for this analysis, New York hosted nine professional golf tournaments,
including two PGA TOUR events, two Champions Tour events, three LPGA Tour events, and two
Nationwide Tour events.10 The Barclays is the first of four events in the PGA TOUR Playoffs
which rotates among venues in the New York/New Jersey region. In 2007, The Barclays, was
7 Regional chapters of the Golf Course Superintendents Association of America include the Central New
York GCSA, Finger Lakes Association of GCS, Hudson Valley GCSA, Long Island GCSA, Metropolitan GCSA,
Northeastern GCSA, and Western New York GCSA. 8 New York has hosted the U.S. Open four times in the last decade: in 2002 at Bethpage State Park, in
2004 at Shinnecock Hills, in 2006 at Winged Foot, and in 2009 returned to Bethpage. 9 The 2005 U.S. Open at Pinehurst, NC, is estimated to have contributed $124 million to the local economy,
while a San Diego State University study found the 2008 U.S. Open at Torrey Pines, CA, is estimated to
have contributed over $70 million. 10
The following is a list of tournaments played in the State of New York in 2007 and their locations. PGA
Tour events: The Barclays in Westchester and the Turning Stone Resort Championship in Verona. LPGA
Tour events: LPGA Corning Classic in Corning; HSBC Women's World Match Play Championship in New
Rochelle; and Wegmans LPGA Golf Tournament in Pittsford. Champions Tour events: the Commerce Bank
Championship in East Meadows and Dick's Sporting Goods Open in Endicott. Nationwide Tour events:
Peek'n Peak Classic in Findley Lake and the Xerox Classic in Rochester.
SRI International 9
played at Westchester Country Club in Rye, NY. The state’s new PGA TOUR event is the Turning
Stone Resort Championship which was played for the first time in September 2007 in Verona, NY.
Dick’s Sporting Goods Open, played at the En-Joie Golf Course in Upstate New York, is one of
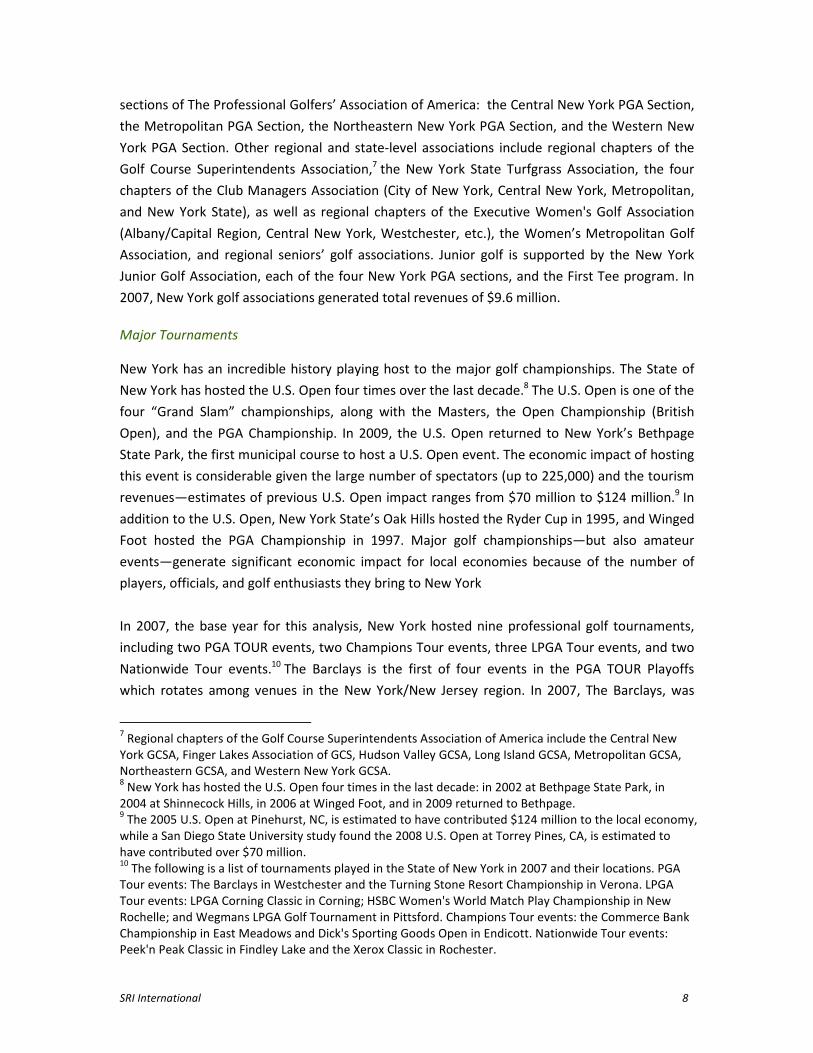
two Champions Tour events played in New York in 2007. The state’s three LPGA Tour events in
2007 included the Wegmans LPGA Tournament, the HSBC Women’s World Match Play, and the
LPGA Corning Classic. Altogether, golf events in New York generated approximately $33.0
million in direct tournament revenues in 2007, excluding the tournament purse and costs for TV
broadcasting.
New York’s Major Golf Tournaments & State Golf Association
Revenues in 2007 ($ millions)
Major tournaments $33.0
Associations $9.6
TOTAL $42.6
Charitable Giving
New York’s golf industry makes substantial contributions to a variety of charities. In addition to
monies raised at local golf club events, golf serves as a vehicle for a variety of charitable events.
For example, the Barclays event has donated over $35 million to local charities in New York and
New Jersey, as well as The First Tee since 1967. Since 1979 the LPGA Corning Classic has
generated a total of $5.4 million in net charitable proceeds that have benefited women’s health
care programs at eleven area hospitals, the disabled children at Camp Star and Lions Club sight
preservation programs. All of the net proceeds from the Wegmans LPGA Tournament are
donated to programs which promote the high school graduation rate and serve youth at risk for
dropping out of school. These United Way funded programs such as the Hillside Work-
Scholarship Connection offer academic guidance, social support, mentoring and job training.
Golf course owners, club managers, and golf professionals are happy to serve as access points
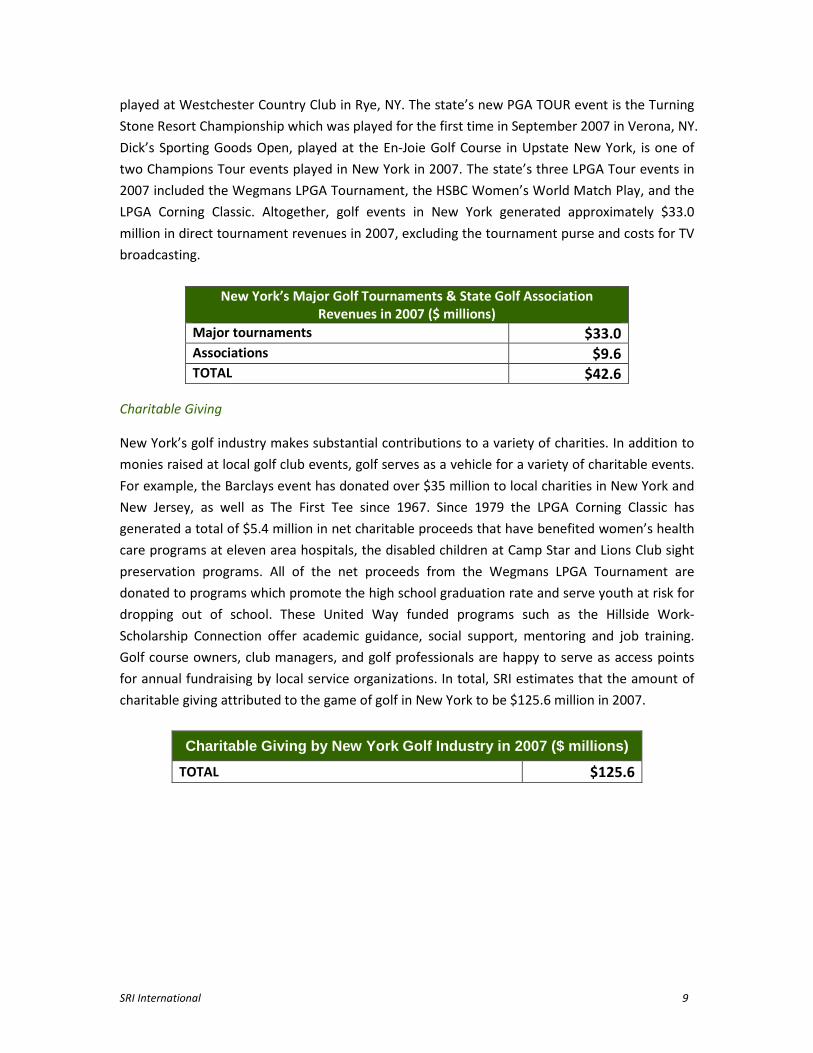
for annual fundraising by local service organizations. In total, SRI estimates that the amount of
charitable giving attributed to the game of golf in New York to be $125.6 million in 2007.
Charitable Giving by New York Golf Industry in 2007 ($ millions)
TOTAL $125.6

SRI International 10
B. Enabled Industries
Real Estate
Real estate developers use amenities to attract new home buyers, and golf courses are a key
amenity. As one of the oldest golf states in the country—where The PGA of America11 was
founded—New York has some of the oldest courses. Consequently, New York is in the unique
position of having significantly built out the residential side of most of the existing facilities in
the metropolitan New York City area. New facility growth accompanied by new residential
development lags other parts of the country because of the shorter golf season, slower
population growth12, and the limited availability of land in metropolitan New York. Still, over the
past few years, new golf homes have been constructed at Olde Vine in Riverhead, Willow Creek
in Mount Sinai, Diamond Hawk in Cheektowaga, and others. This new golf-related construction
generated average annual revenue of $71.1 million. Furthermore, in 2007 there were
approximately 45 existing golf communities in New York, and we estimate the “golf” premium
associated with the sale of real estate in these developments to be $23.0 million. The premium
is the additional amount a buyer is willing to pay for a home or property located on a golf course
or within a golf community.
New York’s Golf Real Estate Revenues in 2007 ($ millions)
Golf-Related Residential Construction $71.1
Realized Golf Premium $23.0
TOTAL $94.1 Note: The sale of existing homes is considered a transfer of assets rather than new
economic output, so the golf premium that is realized in the sale of an existing home is not
included in the economic impact analysis.
Hospitality/Tourism
Across the country, golf has enjoyed increasing popularity among travelers, whether it is the
primary motivation for a trip or is connected to other recreational time spent with friends and
family, or business colleagues. In New York, golf is an important tourism segment, alongside
trips to New York City, the lakes, the Adirondacks, and to enjoy the fall foliage. New York’s 38
golf resorts help the state attract conventions and business meetings, and both amateur and
professional golf tournaments draw people to courses in different parts of the state. The state’s
“I Love New York” tourism website features golf as a key Outdoor Activity
(http://www.iloveny.com). In 2007, SRI estimates golf-related tourism spending in New York
11
The PGA of America was established as the Professional Golfers’ Association of America in New York
City in 1916. The first PGA Championship was held in 1916 at Siwanoy Country Club in Bronxville, NY. 12
According to U.S. Census Bureau data, New York ranked 47th
among all 50 states in projected
population growth from 2004-2015. http://www.bcnys.org/whatsnew/2005/0420censuspoptable.htm
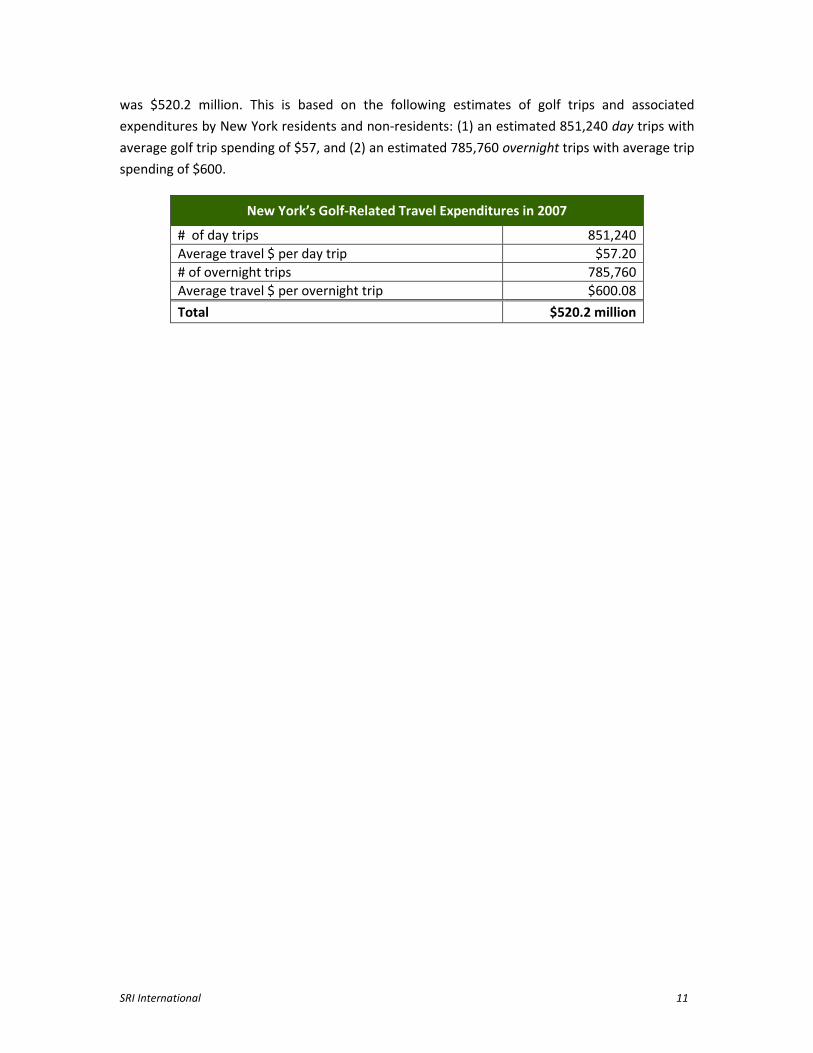
SRI International 11
was $520.2 million. This is based on the following estimates of golf trips and associated
expenditures by New York residents and non-residents: (1) an estimated 851,240 day trips with
average golf trip spending of $57, and (2) an estimated 785,760 overnight trips with average trip
spending of $600.
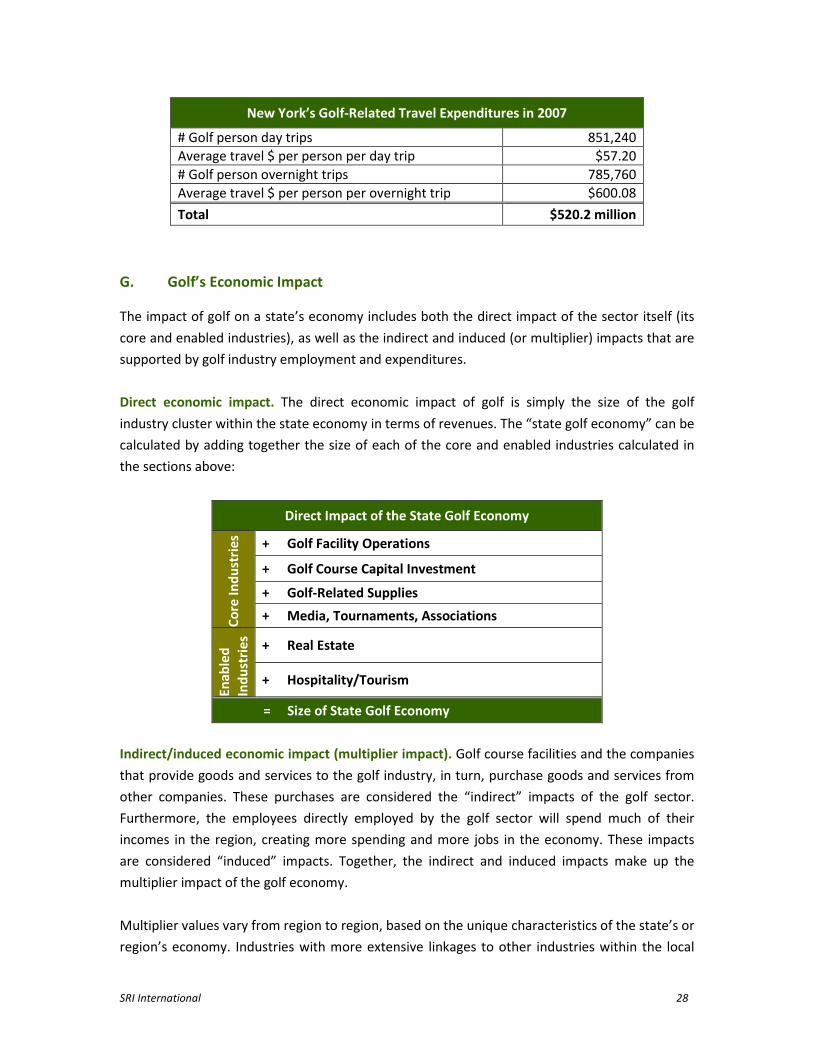
New York’s Golf-Related Travel Expenditures in 2007
# of day trips 851,240
Average travel $ per day trip $57.20
# of overnight trips 785,760
Average travel $ per overnight trip $600.08
Total $520.2 million

SRI International 12
IV. GOLF’S ECONOMIC IMPACT IN NEW YORK
Golf’s impact on the New York economy includes both the direct effects of economic activity in
the core and enabled golf industries, as well as the indirect and induced (or multiplier) effects on
the overall economy. In economics, the idea of the multiplier is that changes in the level of
economic activity in one industry impacts other industries throughout the economy. For
example, a fraction of each dollar spent at a golf course is, in turn, spent by the golf course to
purchase goods and services for golf course operation—these are indirect effects. In addition,
golf course employees spend their disposable income on personal goods and services, and this
stimulates economic activity in a myriad of other industries—these are induced effects.
Therefore, golf’s total (direct plus multiplier) economic impact includes both the direct
employment and wage income of those employed in golf-related industries, as well as the
secondary employment and wages supported in other sectors of the economy through
subsequent purchases of goods and services by golf industry employees.
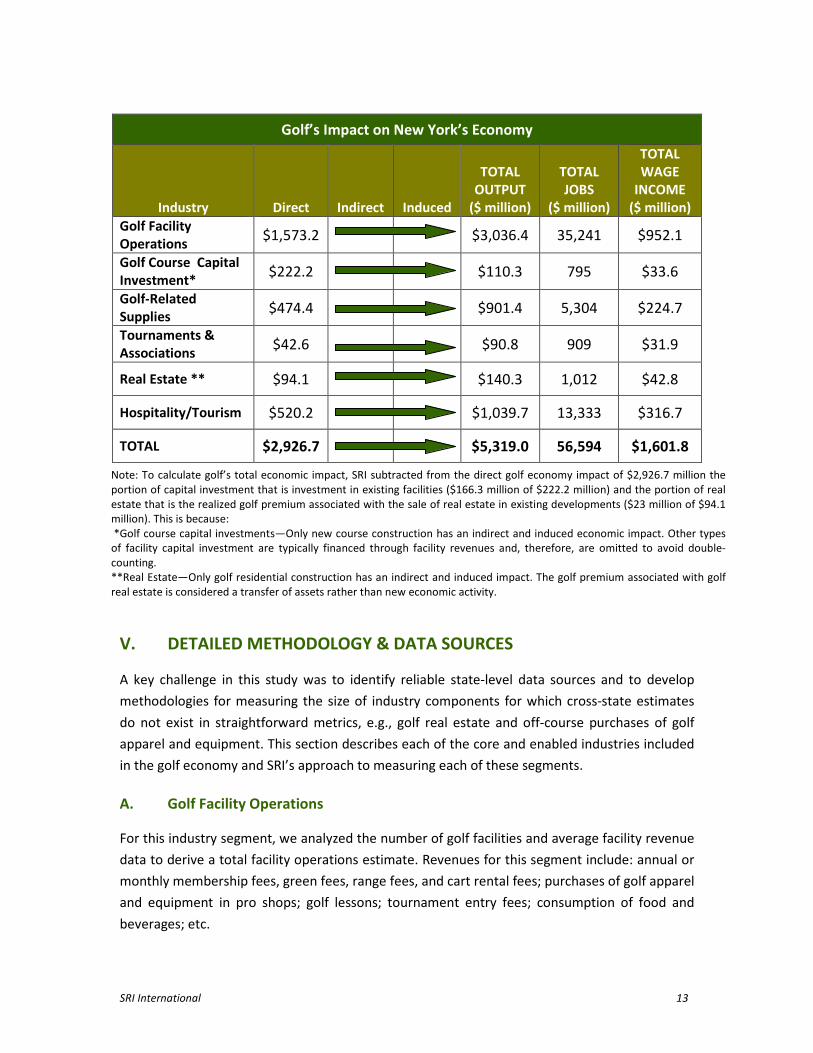
In 2007, the $2.9 billion New York golf industry supported:
� A total economic impact of $5.3 billion for the state of New York including the indirect
and induced economic impacts stimulated by golf sector activity;
� A total impact of nearly 56,600 jobs; and
� Total wage income of $1.6 billion.
SRI International 13
Golf’s Impact on New York’s Economy
Industry Direct Indirect Induced
TOTAL
OUTPUT
($ million)
TOTAL
JOBS
($ million)
TOTAL
WAGE
INCOME
($ million)
Golf Facility
Operations $1,573.2
$3,036.4 35,241 $952.1
Golf Course Capital
Investment* $222.2
$110.3 795 $33.6
Golf-Related
Supplies $474.4
$901.4 5,304 $224.7
Tournaments &
Associations $42.6
$90.8 909 $31.9
Real Estate ** $94.1 $140.3 1,012 $42.8
Hospitality/Tourism $520.2 $1,039.7 13,333 $316.7
TOTAL $2,926.7 $5,319.0 56,594 $1,601.8
V. DETAILED METHODOLOGY & DATA SOURCES
A key challenge in this study was to identify reliable state-level data sources and to develop
methodologies for measuring the size of industry components for which cross-state estimates
do not exist in straightforward metrics, e.g., golf real estate and off-course purchases of golf
apparel and equipment. This section describes each of the core and enabled industries included
in the golf economy and SRI’s approach to measuring each of these segments.
A. Golf Facility Operations
For this industry segment, we analyzed the number of golf facilities and average facility revenue
data to derive a total facility operations estimate. Revenues for this segment include: annual or
monthly membership fees, green fees, range fees, and cart rental fees; purchases of golf apparel
and equipment in pro shops; golf lessons; tournament entry fees; consumption of food and
beverages; etc.
Note: To calculate golf’s total economic impact, SRI subtracted from the direct golf economy impact of $2,926.7 million the
portion of capital investment that is investment in existing facilities ($166.3 million of $222.2 million) and the portion of real
estate that is the realized golf premium associated with the sale of real estate in existing developments ($23 million of $94.1
million). This is because:
*Golf course capital investments—Only new course construction has an indirect and induced economic impact. Other types
of facility capital investment are typically financed through facility revenues and, therefore, are omitted to avoid double-
counting.
**Real Estate—Only golf residential construction has an indirect and induced impact. The golf premium associated with golf
real estate is considered a transfer of assets rather than new economic activity.

SRI International 14
Number of golf course facilities. Many golf organizations track the number of golf facilities in a
state: the National Golf Foundation (NGF), The PGA of America, and state/regional golf
associations, among others. The U.S. Census Bureau also surveys golf course facilities as
business establishments in its Economic Census every five years. However, these organizations’
calculations of the total numbers of golf courses in each state, by type of facility, are not always
consistent with each other due to: (1) absence of data for courses which are not members (e.g.,
The PGA tracks those courses with a PGA member) or for particular subsets of courses (e.g.,
municipal facilities and golf resorts are not tracked by the Census), (2) facility closures and
openings, and (3) inconsistency in the classification of courses, especially resorts.
In some surveys, golf facilities are allowed to self-classify themselves. In others, the surveying
organization classifies the facility based on specific criteria. This can mean the difference
between a small number of resorts (e.g., a figure that includes five-star accommodation located
on or adjacent to an 18-hole course) or a much larger number of resorts (e.g., three-star hotel
accommodation located near a daily fee golf course). Similarly, a resort with two 18-hole golf
courses could be counted as two golf facilities or as one depending on the reporting
organization. Fortunately, the variances caused by these data collection issues are very small,
and thus do not materially impact the overall analysis. The table below presents slightly differing
estimates for the number of golf course facilities in New York in 2007 or the latest available year.
Estimates of New York Golf Facilities from Various Sources, 2002-2007
2002 Census (#
of facilities
minus resorts
& municipal)1
2007 PGA (# of
facilities)2
2007 NGF (# of
facilities)3
2007 NGF (# of
18-hole
equivalent
courses)3
PRIVATE 196 253 235 229
PUBLIC 497 495 545 493.5
Daily fee/
semi-private 374
Municipal
121 Military
University
RESORT 38 38 40
TOTAL 693 786 818 762.5
Sources: 1
U.S. Census Bureau, 2002 Economic Census. 2 The Professional Golfers’ Association of America (2008). Facility Database.
3 NGF (2008). Total Facility Supply Tables 5-10, Golf Facilities in the U.S., 2008 edition, pp.5-10.
After analysis of different golf facility numbers in collaboration with the New York Golf Task
Force, SRI used the NGF numbers as the basis for our assessment. NGF’s total facility numbers
are identical to task force’s estimate with minor differences by facility type. The PGA and NGF
total facility estimates fall within a narrow range: NGF’s 818 versus The PGA’s 786 facilities. NGF

SRI International 15
facility numbers are typically higher, because The PGA’s numbers may miss facilities without a
PGA professional. Looking at facility breakdowns by type, The PGA has slightly higher facility
numbers in the private facility categories, and the NGF has a slightly higher number in the public
facility category.
Average revenues per facility. The SRI team collected average revenue data from a variety of
sources. Here again, the data challenge was that average facility revenues will vary significantly
depending on: (1) the number of holes (e.g., a 9-hole course versus a 18-hole course) and (2) the
type of facility—whether a golf course facility is private, daily fee, resort, municipal, etc.
The U.S. Census Bureau collects revenue data for golf course facilities as part of its Economic
Census of all U.S. establishments every five years. Whereas facility surveys conducted by private
sector organizations are often based on low response rates (less than 30 percent), all
establishments are required by law to respond to the Census Bureau survey. However, the
Census Bureau data has several limitations. Many types of facilities are not included in the
survey: (1) resort facilities, (2) municipal and military facilities, (3) stand-alone driving ranges
and (4) golf course facilities without payroll. In addition, in 2002 the national economy was just
emerging from an economic recession which is likely to have negatively impacted the golf
industry. Still, the latest 2002 Economic Census13 contains revenue, payroll, and employment
data on 12,261 golf facilities broken down by state. This provides a robust estimate with which
to compare other available golf facility revenue data.
The PGA recently began collecting revenue data for all 50 states on an annual basis through its
Annual Operations Survey. The latest available data are from 2007. In addition, PGA revenue
data are broken down by type of facility for categories for which Census data are not available—
resorts, municipal courses, and military courses.
As an additional validity check, we also examined NGF revenue data. However, it is important to
note that NGF does not provide state-level facility data. It presents average revenue data for: (1)
public (daily fee) facilities for two regions (Sunbelt and Frostbelt) by fee level (mid-range and
premium) and (2) private facilities—a national average—by fee level (mid-range and premium).
For the table, below, SRI calculated a single NGF national average revenue figure for each
category by using the sample size and mean.
13
The most recent Economic Census is the 2007 Economic Census, but state-level data on golf facilities
will not be publicly available until 2009 or 2010.

SRI International 16
Estimates of New York Average Revenue per Facility Data
From Different Sources, 2002-2007
Census (2002)1 PGA (2007)2 NGF (2005)3,4
Private facility $3,039,444 $4,206,4355 $3,564,339
Daily fee facility $908,141 $1,274,9056 $1,291,582
Resort facility X $2,741,7507 X
Municipal/military/university
facility X $1,374,2588
X
Driving range X X $251,638
Miniature golf $287,802 X X Sources:
1 U.S. Census Bureau, 2002 Economic Census.
2 The Professional Golfers’ Association of America (2008). 2007 Operations Survey.
3 NGF (2006). Operating & Financial Performance Profiles of 18-hole Golf Facilities in the U.S., 2006 edition.
4 Golf Range Association of America and NGF (2003). Profile of Golf Practice Facility Operations 2003.
5 Weighted average of private facility revenue calculated using data from the Metropolitan Golf Association
Foundation’s 2007 Cooperative Golf Club Survey and The PGA’s 2007 Operations Survey. 6
Weighted average of daily fee facility revenue calculated using sampling of metropolitan daily fee facilities and The
PGA’s 2007 Operations Survey. 7
SRI used 2006 PGA data from The PGA’s 2006 Operations Survey, because of the low response rate in 2007. 8
Weighted average of municipal facility revenue calculated using data from the New York State Office of Parks,
Recreation and Historic Preservation, Nassau County, Westchester County, and Suffolk County and The PGA’s 2007
Operations Survey.
Average revenue data from the Census (2002), The PGA (2007) and NGF (2005) are presented
above. Note that the NGF average revenue figure for private facilities is a national average, not a
New York average, and the NGF average revenue figure for daily fee facilities is a Frostbelt
regional average, not New York specific. The 2002 Census average revenue data is typically
lower than the 2007 PGA data, because it is five years earlier. However, in the case of New York,
the Census private facility average revenue figure ($3,039,444) is much higher than the PGA
survey’s ($2,247,709). Therefore, we supplemented the PGA survey data with data from the
Metropolitan Golf Association Foundation’s (MGAF) 2007 Cooperative Golf Club Survey, which
indicated average revenue of $6,016,727 for the 59 metropolitan private facilities responding to
the survey. Assuming this higher average revenue figure for the total 139 metropolitan private
facilities and using The PGA’s $2,247,709 for the remaining 96 private facilities result in a
weighted average revenue figure of $4.3 million per facility.
Similarly, the response rate from both daily fee and municipal/military/university facilities to
The PGA’s 2007 Operations Survey was low, and the average revenue figures for both categories
seemed to be skewed downward given the existence of a significant number of much higher
revenue daily fees and municipals located in and around major cities and the New York City
metropolitan area. Additional effort was made by the golf task force and SRI to survey daily fee
and municipal facilities to produce a weighted average that more accurately reflects true
average revenue. Consequently, revenue data for 43 municipal facilities was collected from the
New York State Office of Parks, Recreation and Historic Preservation, Nassau County, Suffolk

SRI International 17
County, Westchester County, and several Northeastern New York municipal facilities. We used
the average revenue for these 43 municipal facilities ($1,771,254) and the PGA average revenue
($1,052,167) for the remaining 53 municipal facilities, resulting in a weighted average of
$1,374,258 per municipal facility. In the case of daily fees, revenue data for daily fee facilities in
the metropolitan region was collected. SRI used the average revenue for these 60 metropolitan
daily fee facilities ($3,000,000) and the PGA average revenue ($1,008,824) for the remaining 389
daily fee facilities, resulting in a weighted average of $1,274,905 per daily fee facility.
SRI then used these new weighted average revenue figures to calculate total facility operations
revenue for private facilities, daily fee facilities, and municipals/military/university facilities. For
golf resorts, SRI used 2006 PGA data from The PGA’s 2006 Operations Survey, because there
were not enough survey responses to yield an accurate average revenue figure in 2007. Driving
range revenues were calculated using the Golf Range Association of America’s estimate of
average revenue figure for golf ranges in 2006, and miniature golf facilities were calculated
using Census (2002) data. We adjusted the Golf Range Association and Census data for inflation
to 2007 dollars using the GDP deflator.
2007 Golf Facility Operations Revenues
Facility type Calculation Estimate
Private facilities Average revenue1 $3,391,857
Number of facilities 235
Total revenue [1] $797,086,317
Daily fee/semi-private
facilities
Average revenue1 $1,274,905
Number of facilities 449
Total revenue [2] $516,126,340
Municipal/military/university
facilities
Average revenue1 $1,374,258
Number of facilities 96
Total revenue [3] $113,603,453
Resort facilities Average revenue1 $2,498,404
Number of facilities 38
Total revenue [4] $94,939,366
Driving ranges Average revenue $359,417
Number of facilities 64
Total revenue $22,400,000
Miniature golf facilities Average revenue $330,975
Number of facilities 86
Total revenue $28,463,843
TOTAL Sum [1] to [6] $1,573,222,151 Note:
1In this table, on-course merchandise sales have been subtracted from average facility revenue,
because on-course merchandise sales are included in the Golf-Related Supplies industry segment.
Sources: Private facility average revenue is a weighted average calculated using data from The PGA’s 2007
Operations Survey and the Metropolitan Golf Association Foundation’s 2007 Cooperative Golf Club Survey.
Municipal facility average revenue is a weighted average calculated using data from The PGA’s 2007
Operations Survey and New York State Office of Parks, Recreation and Historic Preservation, Nassau County,
SRI International 18
Suffolk County, Westchester County, and several Northeastern New York municipal facilities. Daily fee
facility revenue is a weighted average calculated using data from The PGA’s 2007 Operations Survey and a
survey of metropolitan daily fee facilities. Resort facility average revenue is from The PGA’s 2006
Operations Survey, because of a low response rate in 2007. Driving range average revenue data from the
Golf Range Association of America (2006). Miniature golf facilities average revenue data are from the 2002
Economic Census. Driving range and miniature golf facility revenue have been adjusted for inflation to 2007
dollars.
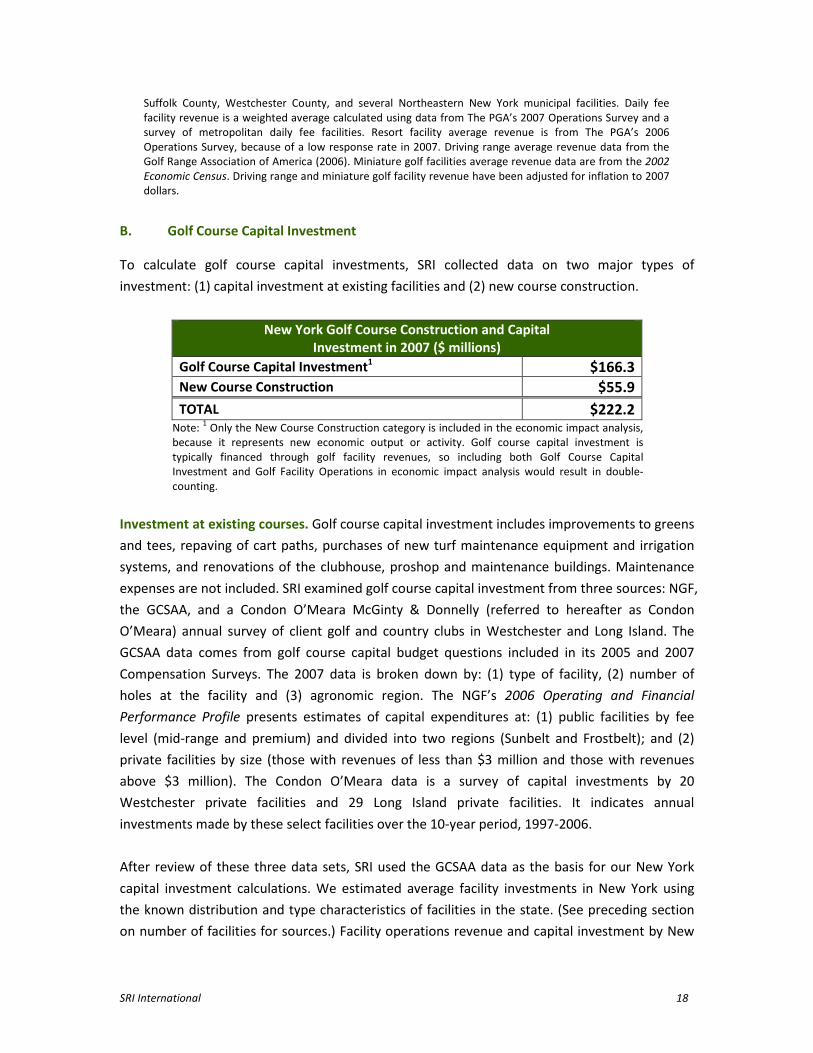
B. Golf Course Capital Investment
To calculate golf course capital investments, SRI collected data on two major types of
investment: (1) capital investment at existing facilities and (2) new course construction.
New York Golf Course Construction and Capital
Investment in 2007 ($ millions)
Golf Course Capital Investment1 $166.3
New Course Construction $55.9
TOTAL $222.2 Note:
1 Only the New Course Construction category is included in the economic impact analysis,
because it represents new economic output or activity. Golf course capital investment is
typically financed through golf facility revenues, so including both Golf Course Capital
Investment and Golf Facility Operations in economic impact analysis would result in double-
counting.
Investment at existing courses. Golf course capital investment includes improvements to greens
and tees, repaving of cart paths, purchases of new turf maintenance equipment and irrigation
systems, and renovations of the clubhouse, proshop and maintenance buildings. Maintenance
expenses are not included. SRI examined golf course capital investment from three sources: NGF,
the GCSAA, and a Condon O’Meara McGinty & Donnelly (referred to hereafter as Condon
O’Meara) annual survey of client golf and country clubs in Westchester and Long Island. The
GCSAA data comes from golf course capital budget questions included in its 2005 and 2007
Compensation Surveys. The 2007 data is broken down by: (1) type of facility, (2) number of
holes at the facility and (3) agronomic region. The NGF’s 2006 Operating and Financial
Performance Profile presents estimates of capital expenditures at: (1) public facilities by fee
level (mid-range and premium) and divided into two regions (Sunbelt and Frostbelt); and (2)
private facilities by size (those with revenues of less than $3 million and those with revenues
above $3 million). The Condon O’Meara data is a survey of capital investments by 20
Westchester private facilities and 29 Long Island private facilities. It indicates annual
investments made by these select facilities over the 10-year period, 1997-2006.
After review of these three data sets, SRI used the GCSAA data as the basis for our New York
capital investment calculations. We estimated average facility investments in New York using
the known distribution and type characteristics of facilities in the state. (See preceding section
on number of facilities for sources.) Facility operations revenue and capital investment by New

SRI International 19
York City Metropolitan Area private facilities are significantly higher than in the rest of the state.
We supplemented the GCSAA private facility data with the Condon O’Meara data by assuming
that the actual data for the 49 facilities surveyed by Condon O’Meara are representative of half
of total Metropolitan area private facilities (70 out of a total of 139 private metropolitan golf
facilities). SRI’s calculations indicate that New York’s 579 public golf courses invested an average
of $95,857, and New York’s 239 private facilities invested an average of $463,480 in 2007, for a
total capital investment of $166.3 million.
New course construction. The NGF’s Golf Facilities in the U.S. series is the only national source
for estimates of the number of new golf courses under construction in each state. In 2007, NGF
estimated that 3.0 new 18-hole equivalent golf courses opened in New York and that 7.5 were
under construction.
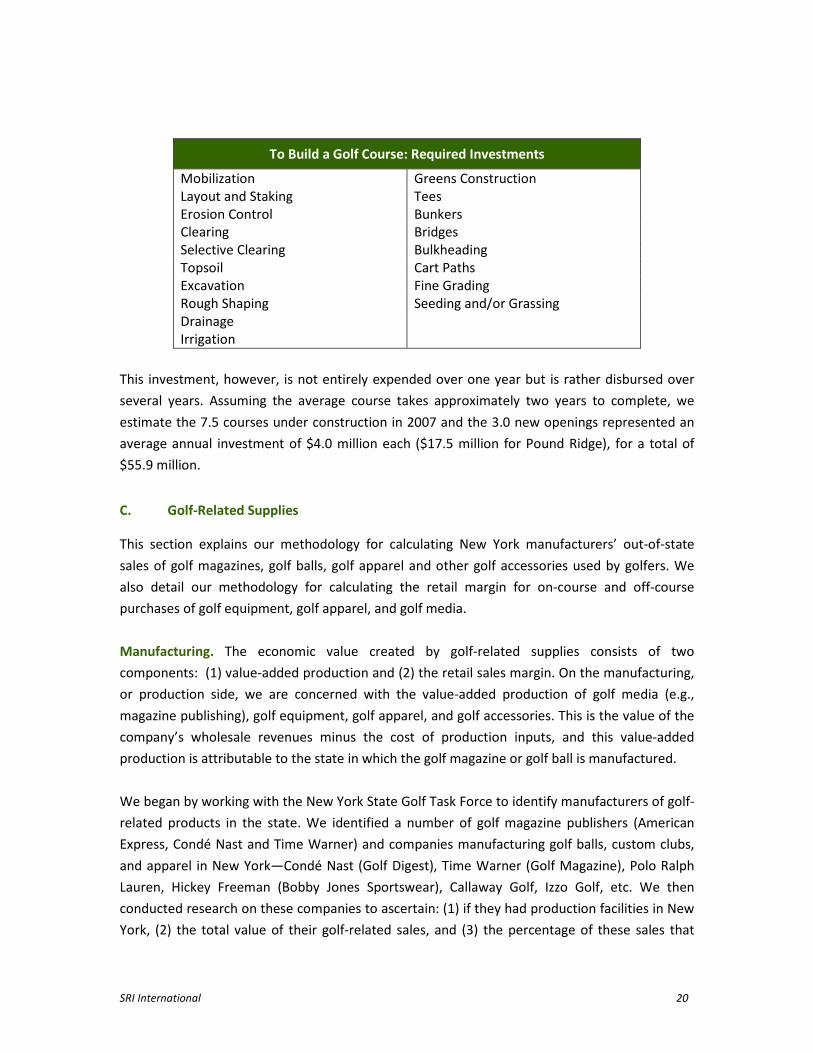
An estimate for the average investment for each new golf course in New York is derived from
the Golf Course Builders Association of America’s 2008 Guide to Estimating Cost for Golf Course
Construction. This database of golf course construction costs is based on a survey of golf course
builders around the country and is divided into four construction regions. Using the values
provided for the Coastal Lowland and Piedmont regions and the average (“normal”) costs for
each of the various construction categories (see box below), we estimate the average
investment required to build a new golf course in New York is $8.1 million. However, one of the
courses under construction in 2007 was the Pound Ridge Golf Club, an 18-hole daily fee facility
in Westchester County (north of New York City) spearheaded by developer Ken Wang (brother
of fashion designer Vera Wang). Developed with $235 green fees in mind, this course is
estimated to have cost $35 million.14 SRI used this figure for one of the 11.5 18-hole equivalent
courses under construction in 2007.
14
Barrett, David. ”Pound Ridge Golf Club, Pound Ridge, New York: Modern Marvel, ” PGA Professionals
Guide to Travel, 28 May 2008, http://pgaprofessionalsguide.travel/page/725-
31174.htm?travel_article_id=6581§ion=golfonly
SRI International 20
To Build a Golf Course: Required Investments
Mobilization Greens Construction
Layout and Staking Tees
Erosion Control Bunkers
Clearing Bridges
Selective Clearing Bulkheading
Topsoil Cart Paths
Excavation Fine Grading
Rough Shaping Seeding and/or Grassing
Drainage
Irrigation
This investment, however, is not entirely expended over one year but is rather disbursed over
several years. Assuming the average course takes approximately two years to complete, we
estimate the 7.5 courses under construction in 2007 and the 3.0 new openings represented an
average annual investment of $4.0 million each ($17.5 million for Pound Ridge), for a total of
$55.9 million.
C. Golf-Related Supplies
This section explains our methodology for calculating New York manufacturers’ out-of-state
sales of golf magazines, golf balls, golf apparel and other golf accessories used by golfers. We
also detail our methodology for calculating the retail margin for on-course and off-course
purchases of golf equipment, golf apparel, and golf media.
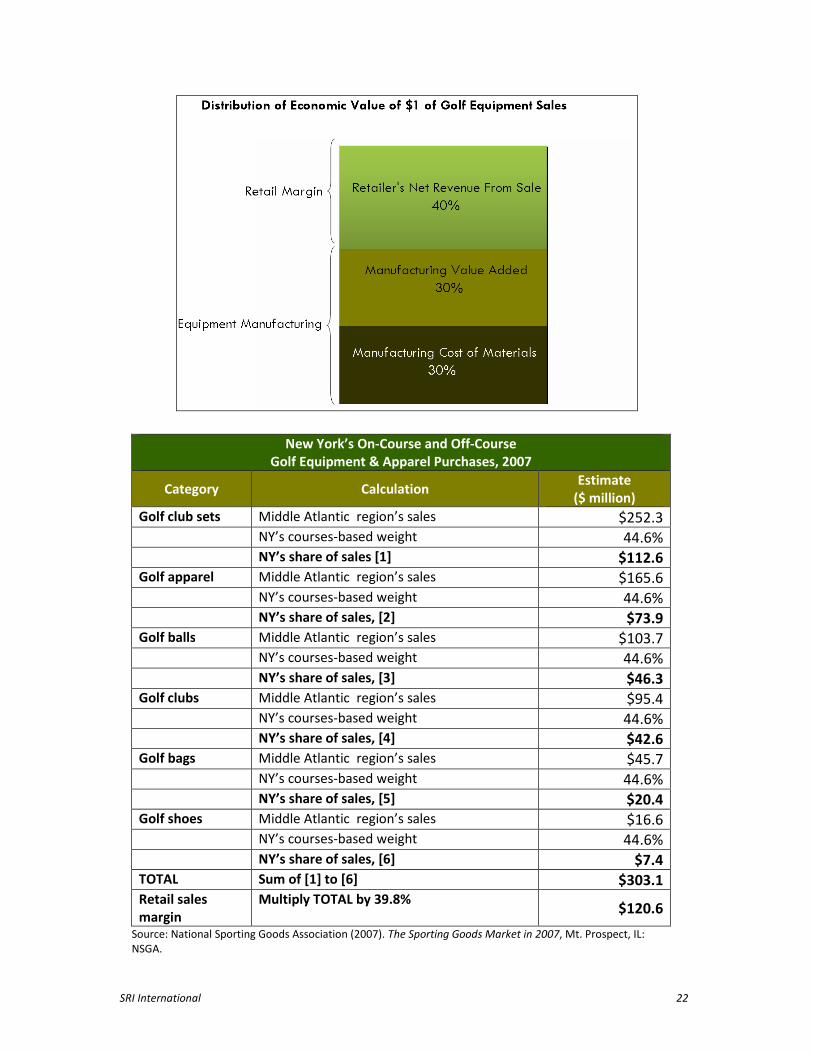
Manufacturing. The economic value created by golf-related supplies consists of two
components: (1) value-added production and (2) the retail sales margin. On the manufacturing,
or production side, we are concerned with the value-added production of golf media (e.g.,
magazine publishing), golf equipment, golf apparel, and golf accessories. This is the value of the
company’s wholesale revenues minus the cost of production inputs, and this value-added
production is attributable to the state in which the golf magazine or golf ball is manufactured.
We began by working with the New York State Golf Task Force to identify manufacturers of golf-
related products in the state. We identified a number of golf magazine publishers (American
Express, Condé Nast and Time Warner) and companies manufacturing golf balls, custom clubs,
and apparel in New York—Condé Nast (Golf Digest), Time Warner (Golf Magazine), Polo Ralph
Lauren, Hickey Freeman (Bobby Jones Sportswear), Callaway Golf, Izzo Golf, etc. We then
conducted research on these companies to ascertain: (1) if they had production facilities in New
York, (2) the total value of their golf-related sales, and (3) the percentage of these sales that

SRI International 21
were out-of-state. Finally, we extrapolated value-added production from each company’s
revenues using value-added data from the Census’s Survey of Manufacturers.
New York Manufacturers’ Value-Added Sales
of Golf-Related Products in 2007 ($ millions)
TOTAL $352.3
Retail Margin. On the retail side, the economic value is derived from the margin the retailer
makes from the sale of the golf club, i.e., the net revenues accruing to retailers after covering
the cost of purchasing the golf equipment or apparel from the wholesaler/producer.
To calculate this margin, we first estimate total sales of golf apparel and equipment at the state
level and then apply the requisite retail margin percentage for economic impact analysis. In our
national level study for GOLF 20/20, SRI was able to collect national sales data from a number of
sources: (1) the NGF, (2) the National Sporting Goods Association (NSGA), (3) Golf Datatech, and
(4) the Census Bureau. Unfortunately, the relatively small sample size for the majority of these
surveys do not allow for publication of reliable state-level estimates by these organizations.
However, each year the NSGA conducts a 100,000-household consumer panel survey for its
annual The Sporting Goods Market publication. SRI uses these data in conjunction with The
PGA’s golf facilities data for each state to derive state-level estimates of golf equipment and
apparel sales.
For example, in 2007, NSGA reported total U.S. off-course and on-course purchases of individual
golf clubs to be $615.8 million. The NSGA survey found the Middle Atlantic region accounted for
15.5% of these purchases, or $95.4 million. Within the Middle Atlantic region, one can estimate
New York’s share of purchases by creating a rounds- or courses-based weight. Using either
approach yields similar weights, since the number of rounds played is highly correlated with the
number of 18-hole equivalent courses in a state (r=0.93). SRI used the number of 18-hole
equivalent courses in each state, as it was easier to verify than estimated number of rounds
played. New York represents 44.6% of total 18-hole equivalent courses in the three-state Middle
Atlantic region, so this weight was applied to the region total ($95.4 million) to estimate $42.6
million of individual golf club sales in the state of New York in 2007. Further, retail margins on
final sales suggest that 39.8%, or $16.9 million, of total sales was retained in the New York
economy. (See graphic below.)
SRI International 22
New York’s On-Course and Off-Course
Golf Equipment & Apparel Purchases, 2007
Category Calculation Estimate
($ million)
Golf club sets Middle Atlantic region’s sales $252.3
NY’s courses-based weight 44.6%
NY’s share of sales [1] $112.6
Golf apparel Middle Atlantic region’s sales $165.6
NY’s courses-based weight 44.6%
NY’s share of sales, [2] $73.9
Golf balls Middle Atlantic region’s sales $103.7
NY’s courses-based weight 44.6%
NY’s share of sales, [3] $46.3
Golf clubs Middle Atlantic region’s sales $95.4
NY’s courses-based weight 44.6%
NY’s share of sales, [4] $42.6
Golf bags Middle Atlantic region’s sales $45.7
NY’s courses-based weight 44.6%
NY’s share of sales, [5] $20.4
Golf shoes Middle Atlantic region’s sales $16.6
NY’s courses-based weight 44.6%
NY’s share of sales, [6] $7.4
TOTAL Sum of [1] to [6] $303.1
Retail sales
margin
Multiply TOTAL by 39.8% $120.6
Source: National Sporting Goods Association (2007). The Sporting Goods Market in 2007, Mt. Prospect, IL:
NSGA.

SRI International 23
Golf media. Similar to golf equipment, golf media’s economic contribution to the state economy
has two components: value-added production and the retail sales margin. On the production
side, the economic impact created by the publication of magazines or books is attributable to
the state in which the magazine or book is published. New York is home to the publishers of
many national golf magazines (Golf Digest, Golf Magazine, Golf World, etc.). Their revenues are
included in the “Manufacturing” section above. On the retail side, the economic impact is
derived from the margin the retailer makes from the sale of golf media, i.e., the net revenues
accruing to retailers after covering the cost of purchasing the media from the
wholesalers/producers. We calculated a weight to estimate the percentage of book retailers’
sales attributable to the sale of golf books in stores. Total retail golf book sales in 2007 were
estimated to be $3,744,000 with a retail sales margin of $1,490,000. Golf videos and DVDs are
more difficult. In SRI’s previous national-level study, we were not able to identify a source with
data on the annual sales of golf-specific videos/DVDs. In the case of this current state-level study,
this category was also omitted due to the absence of a reliable data source.
On-Course and Off-Course Sales of
Golf Books in New York, 2007
Category Estimate
New York retail book sales1 $891,428,400
Golf books as % of total book sales 0.42%
Total retail golf book sales $3,744,000
Retail sales margin $1,490,000
Note: 1Adjusted for inflation into 2007 dollars using the appropriate GDP deflator.
Sources: New York retail book sales data from the 2002 Economic Census. Estimated
percentage of golf books among total book sales derived from the 2006 Bowker
Annual of Library & Book Trade Information and American Booksellers Association
data.
New York Retailers’ Net Revenues on Consumer Purchases
of Golf-Related Supplies in 2007 ($ millions)
Total
purchases
Retail sales
margin
Golf Equipment (retail margin) $229.2 $91.2
Golf Apparel (retail margin) $73.9 $29.4
Golf Media (retail margin) $3.7 $1.5
TOTAL $306.9 $122.1 Note: This includes on-course and off-course purchases of golf equipment, apparel and
media. Column does not sum due to rounding. The margin does not account for unsold
inventory. It is the margin on the sale of merchandise.

SRI International 24
D. State Golf Associations, Tournaments & Charitable Events
Associations. SRI gathered association revenue data for the largest state and regional golf
organizations from these organizations’ 990 income tax filings. These included the New York
State Golf Association, the Metropolitan Golf Association, the four sections of The Professional
Golfers’ Association of America (the Central New York PGA Section, the Metropolitan PGA
Section, the Northeastern New York PGA Section, and the Western New York PGA Section),
regional chapters of the Golf Course Superintendents Association,15 the New York State
Turfgrass Association, the four chapters of the Club Managers Association (City of New York,
Central New York, Metropolitan, and New York State), regional chapters of the Executive
Women's Golf Association (Albany/Capital Region, Central New York, Westchester, etc.), the
Women’s Metropolitan Golf Association, regional seniors’ golf associations, the New York Junior
Golf Association, the First Tee program, and other allied organizations.
Major Tournaments. In 2007, New York hosted nine professional golf events. We subtracted the
tournament purse and cost of television broadcasting from total tournament revenues to
estimate the revenues that remained in the state.
New York’s Major Golf Tournaments & State Golf Association
Revenues in 2007 ($ millions)
Major tournaments $33.0
Associations $9.6
TOTAL $42.6
Charitable Events. Overall, SRI estimates that the amount of charitable giving attributed to the
game of golf in New York to be $125.6 million in 2007. This estimate is derived from a national
study16 based on the number of charitable golf outings/events held; the discounted fees,
services and staff time for these events; as well as the charitable giving associated with
professional golf tournaments. Charitable giving is not included in economic impact estimation
because it is a direct transfer of income. Nevertheless, it is an important golf industry
contribution to the state.
Charitable Giving by New York Golf Industry in 2007 ($ millions)
TOTAL $125.6
15
Regional chapters of the Golf Course Superintendents Association of America include the Central New
York GCSA, Finger Lakes Association of GCS, Hudson Valley GCSA, Long Island GCSA, Metropolitan GCSA,
Northeastern GCSA, and Western New York GCSA. 16
National Golf Foundation (2002). The Charitable Impact Report, November 2002.

SRI International 25
E. Real Estate
In analyzing golf-related residential real estate, SRI collected data on two components: (1) new
golf-related residential construction and (2) the “golf” premium associated with the sale of golf
community homes.
New York’s Golf Real Estate Revenues in 2007 ($ millions)
Golf-Related Residential Construction $71.1
Realized Golf Premium $23.0
TOTAL $94.1 Note: The sale of existing homes is considered a transfer of assets rather than new
economic output, so the golf premium that is realized in the sale of an existing home is not
included in the economic impact analysis.
Golf-related residential construction. For this industry segment, SRI used NGF data on new golf
facilities openings and construction, as well as online research to identify a list of golf courses
with residential construction in the study base year (2007). We then contacted these
developments directly to collect information on the size of the development, the number of
homes/townhomes/condos under construction in 2007, and the average construction costs per
type of home (i.e., townhouse or single family home). Construction values varied considerably
depending on such factors as the location of golf communities within the state, the proportion
of townhouses versus single family homes, and overall real estate market conditions (e.g., high-
growth metro regions versus more rural parts of the state).
SRI identified only four New York State golf communities that were under development, to
varying degrees, in 2007. This is quite different from the case in other states and is due to a
combination of factors. Residential development properties are at a premium in the
metropolitan New York City area with the land adjacent to existing golf courses largely built out.
In addition, the shorter playing season and the overall housing market and economic conditions
since 2006 appear to have limited new golf residential construction in 2007. The golf
communities that were under development ranged from the 75 homes at the Olde Vine Golf
Club in Riverhead on Long Island, to the 177 homes at the Hamlet on Willow Creek in Mt. Sinai
(also on Long Island). Condos and townhouses with fairway views were under construction at
the Holiday Valley Resort in Ellicottville, south of Buffalo. Multiplying the total number of each
type of unit under construction with the average construction cost per unit yielded a total 2007
golf-related residential construction figure of $71.1 million.
Realized golf premium. The “golf” premium is the extra value a homeowner can expect to
receive on the sale of a housing unit located in a golf community that is above and beyond the
premium associated with a home’s other features or amenities (e.g., square footage, fixtures,
landscaping, etc.). Through industry interviews, SRI arrived at a conservative estimate of this
SRI International 26
premium of $75,000 per unit, since many golf communities are located in the metropolitan New
York area. Multiplying the approximately 45 existing New York golf communities by 175, the
mean number of housing units per golf course, we arrive at a total of 7,875 golf community
homes. In 2007, the home turnover rate (percentage of homes sold relative to the total housing
stock) was 3.9 percent in New York. Therefore, the realized golf premium was calculated by
multiplying the home turnover rate by the total number of golf community homes by the
average golf premium per unit. SRI estimates New York’s golf real estate premium was
approximately $23.0 million in 2007.17
F. Hospitality/Tourism
Hospitality/Tourism
Although a large and critical golf industry segment, there are no national sources of state-level
golf tourism data. SRI calculates a state’s total golf tourism revenues by collecting data for two
types of figures: (1) the annual number of golf-related trips and (2) average spending per trip.
Number of golf-related trips. A number of organizations conduct surveys monitoring changes in
trip volume and traveler preferences. Some of these surveys include golf participation questions.
Many states used to subscribe to the Travel Industry Association (TIA) of America’s TravelScope®
statistics. However, in 2005, TIA ceased collecting this primary data, and a new data set was
created based on a national survey conducted by D.K. Shifflet & Associates (DKSA). SRI used the
DKSA data obtained from the New York State Department of Economic Development for total
number of visitor trips in New York (163.7 million in 2007).
No data was available from DKSA for the percentage of all visitors to New York who played golf
while on a trip; typically, for other states, this percentage ranges from 0.85 percent to 2.7
percent. Factors which may affect this statistic include the length of a state’s golf season and
other key drivers of its tourism industry overall. New York has a relatively short golf season, and
New York City accounts for one-third of all trips to the state. Therefore, using DKSA data and
comparative data from other states, SRI conservatively estimated that 1 percent of visitors
played golf while on a trip to New York State, which amounts to 1.64 million golf trips. This
figure includes trips to New York golf resort destinations (of which New York has 38), as well as
trips to play golf courses in other parts of the state. People also travel to see the many
professional and amateur golf tournaments played annually in New York. The U.S. Open, which
17
Although difficult to measure quantitatively, the golf premium applies not only to private real estate
developments, but also to municipalities. Many municipalities highlight municipality-owned golf courses
to potential residents as a key location factor, along with good schools, parks, and other arts and
recreational offerings.
SRI International 27
has been hosted by the State of New York four times in the last decade18, typically attracts
30,000 to 45,000 spectators per day. 19 In 2006, an estimated 225,000 spectators turned out for
the practice and tournament rounds of the U.S. Open when it was hosted by Winged Foot in
Mamaroneck, NY.20
Using SRI’s estimate of golf trips (1.64 million) and DKSA’s estimate of the percent of day trips
(52%) versus overnight trips (48%), SRI calculated that 851,240 New York golf day trips and
785,760 golf overnight trips were made in 2007.21 SRI defines a “golf trip” as a trip in which a
New York resident or non-resident travels 50-plus miles to, through, or within the state and
plays golf while on this trip. This figure (1.64 million total golf trips, day and overnight) seems
plausible given The PGA of America’s estimate of 18.1 million rounds played in New York in
2005.22 This translates into approximately 9.0 percent of total rounds played on New York
courses being played by golfers from other parts of New York or from out of the state.
Average spending per golf trip. SRI estimated that average spending per golf trip in New York in
2007 was $57 per day trip and $600 per overnight trip. This includes spending on
accommodation, local transportation, food and beverage, entertainment, gifts, and so on. Green
fees and cart fees are not included as they are already captured in the Golf Facility Operations
revenues. To estimate average golf trip expenditure, we began with national golf trip survey
data from the National Golf Foundation’s The U.S. Golf Travel Market, 2003 Edition report23 and
adjusted average trip spending based upon cost of living in New York vis-à-vis the rest of the
country, as well as other average trip expenditure data (e.g., DKSA). Multiplying the total
number of golf trips (day and overnight) by average spending per golf trip (day and overnight),
SRI found that golf-related tourism spending in New York was approximately $48.7 million for
day trips and $471.5 million for overnight trips, totaling $520.2 million.
18
New York has hosted the U.S. Open four times in the last decade: in 2002 at Bethpage State Park, in
2004 at Shinnecock Hills, in 2006 at Winged Foot, and in 2009 returning to Bethpage. 19
http://www.seattlepi.com/golf/350594_usopen09.html 20
http://www.post-gazette.com/pg/07169/795107-382.stm 21
Only 2006 DKSA data was available for the percent of day trips (52%) versus overnight trips (48%) for
New York state, so these figures were applied to the 2007 total estimated golf trips for New York. Source:
D.K. Shifflet & Associates, Capital-Saratoga Region, New York State: TOP LINE TRAVEL PROFILE, Year 2006
vs. Year 2005, p. 5. 22
2005 was the most recent year for which the rounds data was available. 23
See “Average Travel Spending” table on p.16 in NGF (2003), U.S. Golf Travel Market, available at:
http://www.ngf.org/cgi/catalogsearchdetail.asp?ITEMNUMBER=99MR002. SRI adjusted for inflation from
2002-2007, since 2002 is NGF’s most recent on golf travel survey.
SRI International 28
G. Golf’s Economic Impact
The impact of golf on a state’s economy includes both the direct impact of the sector itself (its
core and enabled industries), as well as the indirect and induced (or multiplier) impacts that are
supported by golf industry employment and expenditures.
Direct economic impact. The direct economic impact of golf is simply the size of the golf
industry cluster within the state economy in terms of revenues. The “state golf economy” can be
calculated by adding together the size of each of the core and enabled industries calculated in
the sections above:
Direct Impact of the State Golf Economy
Co
re I
nd
ust
rie
s
+ Golf Facility Operations
+ Golf Course Capital Investment
+ Golf-Related Supplies
+ Media, Tournaments, Associations
En
ab
led
Ind
ust
rie
s
+ Real Estate
+ Hospitality/Tourism
= Size of State Golf Economy
Indirect/induced economic impact (multiplier impact). Golf course facilities and the companies
that provide goods and services to the golf industry, in turn, purchase goods and services from
other companies. These purchases are considered the “indirect” impacts of the golf sector.
Furthermore, the employees directly employed by the golf sector will spend much of their
incomes in the region, creating more spending and more jobs in the economy. These impacts
are considered “induced” impacts. Together, the indirect and induced impacts make up the
multiplier impact of the golf economy.
Multiplier values vary from region to region, based on the unique characteristics of the state’s or
region’s economy. Industries with more extensive linkages to other industries within the local
New York’s Golf-Related Travel Expenditures in 2007
# Golf person day trips 851,240
Average travel $ per person per day trip $57.20
# Golf person overnight trips 785,760
Average travel $ per person per overnight trip $600.08
Total $520.2 million

SRI International 29
economy will have a greater multiplier effect on final economic activity relative to the initial,
direct effect. Conversely, economies and industry sectors dependent on a large share of
imported supply will have smaller multiplier effects. For this study, the RIMS II (Regional Input-
Output Multipliers), calculated by the U.S. Bureau of Economic Analysis, were used to calculate
the multiplier impact of New York’s golf economy.
SRI International 30
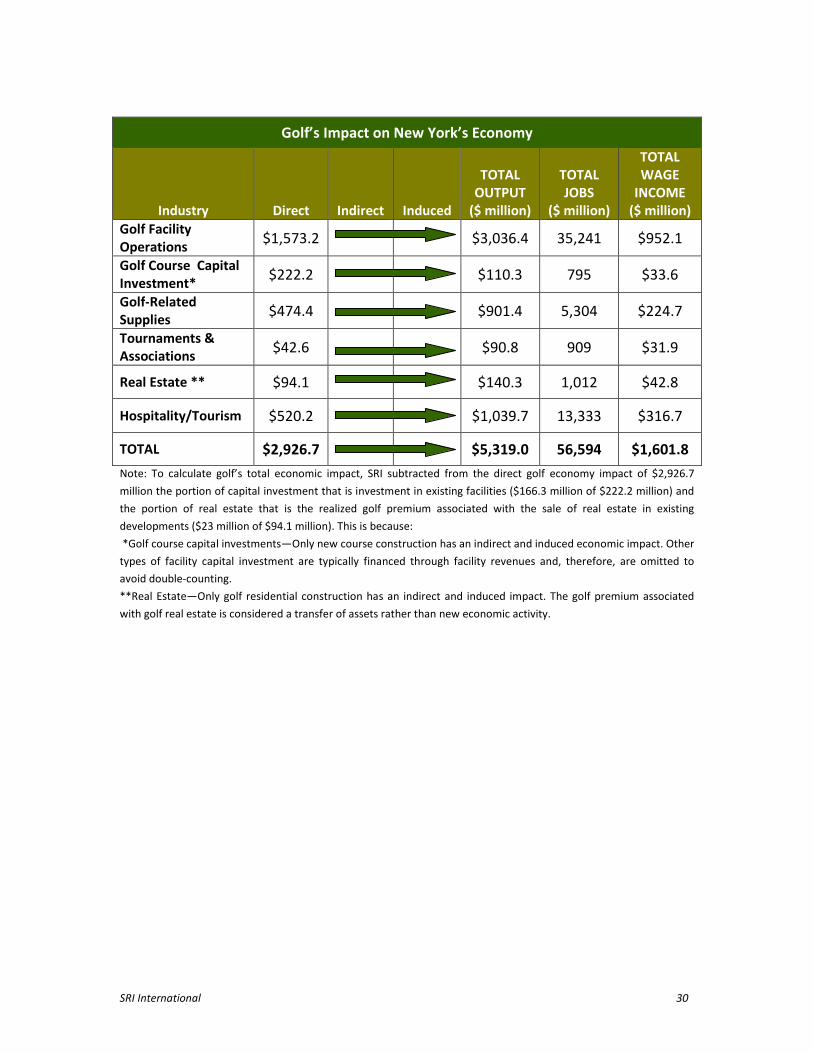
Golf’s Impact on New York’s Economy
Industry Direct Indirect Induced
TOTAL
OUTPUT
($ million)
TOTAL
JOBS
($ million)
TOTAL
WAGE
INCOME
($ million)
Golf Facility
Operations $1,573.2
$3,036.4 35,241 $952.1
Golf Course Capital
Investment* $222.2
$110.3 795 $33.6
Golf-Related
Supplies $474.4
$901.4 5,304 $224.7
Tournaments &
Associations $42.6
$90.8 909 $31.9
Real Estate ** $94.1 $140.3 1,012 $42.8
Hospitality/Tourism $520.2 $1,039.7 13,333 $316.7
TOTAL $2,926.7 $5,319.0 56,594 $1,601.8
Note: To calculate golf’s total economic impact, SRI subtracted from the direct golf economy impact of $2,926.7
million the portion of capital investment that is investment in existing facilities ($166.3 million of $222.2 million) and
the portion of real estate that is the realized golf premium associated with the sale of real estate in existing
developments ($23 million of $94.1 million). This is because:
*Golf course capital investments—Only new course construction has an indirect and induced economic impact. Other
types of facility capital investment are typically financed through facility revenues and, therefore, are omitted to
avoid double-counting.
**Real Estate—Only golf residential construction has an indirect and induced impact. The golf premium associated
with golf real estate is considered a transfer of assets rather than new economic activity.
SRI International 31
BIBLIOGRAPHY
Bowker Annual of Library & Book Trade Information 2006, 50th Edition. New York, NY: R.R.
Bowker.
Concessions Management Bureau of New York State Parks (2009). Freedom of Information Law
Request: Revenue for NYS Park Golf Facilities in 2007. Requested May 28, 2009.
Condon O’Meara McGinty & Donnelly LLP (2008). Long Island Golf Association President’s
Invitational: Tax and Financial Update. New York, NY: Condon O’Meara McGinty & Donnelly LLP.
Condon O’Meara McGinty & Donnelly LLP (2008). Westchester Golf Association 2008 Annual
Meeting and Club Conference. New York, NY: Condon O’Meara McGinty & Donnelly LLP.
County of Nassau, Department of Parks, Recreation and Conservation (2009). Freedom of
Information Law Request: Gross Income for Nassau County Parks Golf Facilities in 2007.
County of Suffolk, Department of Parks, Recreation and Conservation (2009). Freedom of
Information Law Request: Gross Income for Suffolk County Parks Golf Facilities in 2007.
County of Westchester, Department of Parks, Recreation and Conservation (2009). Freedom of
Information Law Request: Gross Income for Westchester County Parks Golf Facilities in 2007.
D.K. Shifflet & Associates (2007). Capital-Saratoga Region, New York State: TOP LINE TRAVEL
PROFILE, Year 2006 vs. Year 2005.
Golf Course Builders Association of America (2008). Guide to Estimating Cost for Golf Course
Construction. Lincoln, NE: Golf Course Builders Association of America.
Golf Course Superintendents Association of America (2005). Compensation Survey. Lawrence,
KS: Golf Course Superintendents Association of America.
Golf Course Superintendents Association of America (2007). Compensation Survey. Lawrence,
KS: Golf Course Superintendents Association of America.
Golf Datatech (2006). On-Course Sales Data by Equipment Category. Kissimmee, FL: Golf
Datatech.
Golf Range Association of America and National Golf Foundation (2003). Profile of Golf Practice
Facility Operations 2003. Jupiter, FL: National Golf Foundation.

SRI International 32
Metropolitan Golf Association Foundation (2007). Cooperative Golf Club Survey. Elmsford, NY:
MGAF.
National Association of Realtors. Existing Home Sales Series. Chicago, IL: National Association of
Realtors. http://www.realtor.org/Research.nsf/Pages/EHSdata
National Golf Foundation (2002). The Charitable Impact Report. Jupiter, FL: National Golf
Foundation.
NGF (2003). Golf Business Almanac. Jupiter, FL: National Golf Foundation.
NGF (2003). U.S. Golf Travel Market. Jupiter, FL: National Golf Foundation.
NGF (2006). Golf Industry Overview. Jupiter, FL: National Golf Foundation.
NGF (2006). Golf Industry Report. Jupiter, FL: National Golf Foundation.
NGF (2006). Operating & Financial Performance Profiles of 18-hole Facilities in the U.S. Jupiter,
FL: National Golf Foundation.
NGF (2008). Golf Facilities in the U.S. Jupiter, FL: The National Golf Foundation.
National Sporting Goods Association (2007). Sports Clothing Expenditures in 2006. Mt. Prospect,
IL: National Sporting Goods Association.
National Sporting Goods Association (2008). The Sporting Goods Market in 2007. Mt. Prospect,
IL: National Sporting Goods Association.
The PGA of America (2006). Compensation Study. Palm Beach Gardens, FL: The PGA of America.
The PGA of America (2008). Golf Facility Database. Palm Beach Gardens, FL: The PGA of America.
The PGA of America (2007). Operations Survey. Palm Beach Gardens, FL: The PGA of America.
The PGA of America (2008). Operations Survey. Palm Beach Gardens, FL: The PGA of America.
SRI International (2002). The Golf Economy Report. Arlington, VA: SRI International.
SRI International (2006). The Virginia Golf Economy 2005. Arlington, VA: SRI International.
SRI International 33
U.S. Census Bureau (2004). 2002 Economic Census: Arts, Entertainment and Recreation Industry
Series. Washington, DC: U.S. Department of Commerce, Economics and Statistics Administration.
U.S. Census Bureau (2005). New York: 2002. 2002 Economic Census: Arts, Entertainment and
Recreation Geographic Area Series. Washington, DC: U.S. Department of Commerce, Economics
and Statistics Administration.
U.S. Census Bureau (2005). New York: 2002. 2002 Economic Census: Manufacturing Geographic
Area Series. Washington, DC: U.S. Department of Commerce, Economics and Statistics
Administration.
U.S. Census Bureau (2006). Table 1: Annual Estimates of Housing Units for the United States and
States: April 1, 2000 to July 1, 2005 (HU-EST2005-01). Washington, DC: U.S. Department of
Commerce, Economics and Statistics Administration.