Embed Size (px)
Citation preview

2012 Preliminary Results 7th March 2013

Today’s Presentation Team
Steve Wiener
Founder & Chief Executive Officer
Philip Bowcock
Chief Financial Officer
Crispin Lilly
Vice President of Business Affairs
2

Cineworld Full Year Highlights
24.7% market share in UK/Ireland1
Cineworld Cinemas’ revenues increased 2.4%
Growth in MyCineworld and Unlimited membership
Acquisition of Picturehouse cinemas
52% of 2013 to 2017 target pipeline sites now signed
Proposed final dividend of 8.0p taking full year dividend to 11.8p (2011 : 11.0p)
1 Source: Rentrak EDI: January to December 2012
3

Group Financial Review (incl Picturehouse)
2012 Financial Highlights
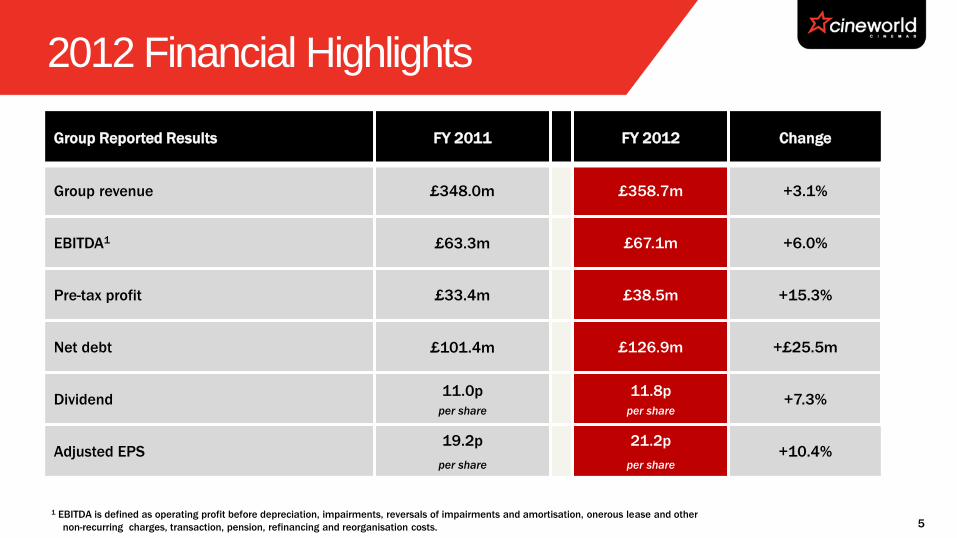
Group Reported Results FY 2011 FY 2012 Change
Group revenue £348.0m £358.7m +3.1%
EBITDA1 £63.3m £67.1m +6.0%
Pre-tax profit £33.4m £38.5m +15.3%
Net debt £101.4m £126.9m +£25.5m
Dividend 11.0p
per share
11.8p
per share +7.3%
Adjusted EPS 19.2p
per share
21.2p
per share +10.4%
1 EBITDA is defined as operating profit before depreciation, impairments, reversals of impairments and amortisation, onerous lease and other
non-recurring charges, transaction, pension, refinancing and reorganisation costs. 5

Admissions (excl Picturehouse)
2010 2011 2012 H1 2012 H2 2012 FY
Total
2010 2011 2012 H1 2012 H2 2012 FY
Growth in online bookings
47.2m 48.3m 23.0m 24.7m 47.8m
10.4% 10.0% 12.7% 20.6% 16.8%
6

Revenues (excl Picturehouse)
FY2011
£m
2012 H1
£m
2012 H2
£m
2012 FY
£m
12 v 11
%
Box Office 242.1 118.6 133.0 251.6 +3.9%
Retail 81.6 38.0 44.3 82.3 +0.9%
Other 24.3 8.8 13.5 22.3 -8.2%
348.0 165.4 190.8 356.2 +2.4%
£ £ £ £
Average Ticket Price 5.01 5.15 5.36 5.26 +5.0%
Spend per person
Year on Year
1.69 1.65
-1.3%
1.78
+4.8%
1.72 +1.8%
7

EBITDA Bridge
£63.3m 2011
EBITDA
£67.1m 2012
EBITDA
£10.2m Price and
Volume
£2.0m Other Income
£2.2m Operating
Costs
£3.4m Digital/VPF
£0.4m Property Costs
£1.7m Utilities
£1.8m Saving in
Labour £5.8m Gross
Margin £0.5m Picturehouse1
1 Picturehouse results consolidated for 22 days covering 6 December – 27 December 2012 8

Group Profits & Loss Account
(£m) 2011 2012 Growth
Revenue 348.0 358.7 +3.1%
EBITDA 63.3 67.1 +6.0%
EBITDA margin 18.2% 18.7% +0.5pp
Other non-cash & non-recurring costs (1.8) (1.4)
Depreciation and amortisation (18.9) (21.5)
Operating profit 42.6 44.2 +3.8%
Net interest charge (8.1) (6.6) -18.5%
Refinancing costs (1.1) 1.0
Share of loss in joint venture - (0.1)
Profit before tax 33.4 38.5 +15.3%
Tax (9.5) (10.8)
Profit after tax 23.9 27.7 +15.9%
EPS – adjusted1 19.2 21.2 +10.4%
DPS – proposed 11.0 11.8 +7.3%
1 EPS – adjusted and fully diluted: based on normalised tax of 24.5% (2011: 26%) and weighted average shares in the period.
£2.0m VAT credit
offset by £1.1m
transaction costs,
£1.6m onerous
lease adjustment
and £0.7m other
Expenditure on
digital projection
and systems
Expiry of hedge
9

Net Debt
£9.4m Tax
£31.1m CAPEX
£16.0m Dividends
£67.0m Cash-flow
from
Operations
Cash
£90.2m
Cash
£85.5m
£5.8m Interest &
other
£101.4m Dec 2011
Net Debt
£95.6m Cineworld
Pre- Acq
Proforma
Cash
£116.4m
£47.3m Acquisition
(incl £4.3m
acq’d debt)
£16.4m Share
proceeds
£126.9m Dec 2012
Net Debt
Non cash
£11.2m Non cash
£10.1m
Non cash
£10.5m
10

Business Review

Business Review
Box Office and Film performance
Knowing our Customers through CRM
– MyCineworld
– Unlimited
Cinema Experience
– Starbucks & Retail
– Big Screen Investment
Advertising (DCM)
2013 Film Slate 12

Box Office & Film Further market growth notwithstanding adverse factors
– Tough Q1 vs 2011 (King’s Speech)
– Jubilee, Euros & Olympics
– Exceptional Q4
• +29% vs 2011
• ‘Skyfall’ breaks £100m mark
– Greater dominance by Blockbusters
Cineworld market share still strong
– 24.7% (Box Office, UK/ROI)
– IMAX premiums driving revenues
– Continued 50%+ share of Bollywood market
– Strong Alternative Content growth (+50%)
* Calendar year basis
UK/ROI UK
£1.19bn +3.6%
£1.10bn +4.8%
Box Office *
UK
172.5m +0.5%
Admissions
13

MyCineworld Growth
14
-
0.5
1.0
1.5
2.0
2.5
3.0
Q1 2011 Q2 2011 Q3 2011 Q4 2011 Q1 2012 Q2 2012 Q3 2012 Q4 2012 Q1 2013 YTD
Scotland
Launch
Full
MyCineworld
Launch
2.7m
Me
mb
ers
(m
illio
ns)

MyCineworld & CRM
Operational Efficiencies
Advance booking increased from 10% to >20%
– Improved scheduling
– More efficient staffing
Knowing Our Customers
Data insights >3.0m MyCineworld and Unlimited customers
Demographic profiling and cluster analysis/targeting
51% of customers aged between 20 and 39
Personalised & relevant targeted emails
− Open rates up to 30%
15

CRM Driving Revenue
Monetising email campaigns through Distribution
– Database delivers a highly targeted and extremely cost
efficient marketing route
Driving admissions through cooperative campaigns
– Short term reactive responses to actual film
performance
– Proactive awareness driving campaigns
Expanding quickly, albeit from a low base
16

Unlimited Membership
17
260
270
280
290
300
310
320
330
340
Q1 2011 Q2 2011 Q3 2011 Q4 2011 Q1 2012 Q2 2012 Q3 2012 Q4 2012 Q1 2013 YTD
Act
ive
Bas
e B
y Q
uar
ter
(00
0’s
)
Active Base
Unlimited
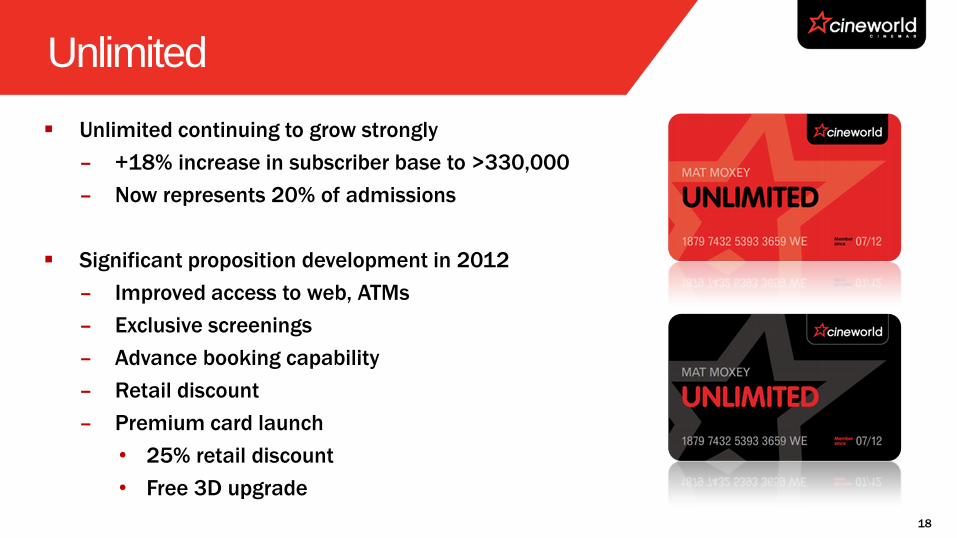
Unlimited continuing to grow strongly
– +18% increase in subscriber base to >330,000
– Now represents 20% of admissions
Significant proposition development in 2012
– Improved access to web, ATMs
– Exclusive screenings
– Advance booking capability
– Retail discount
– Premium card launch
• 25% retail discount
• Free 3D upgrade
18

Cinema Experience - Retail
Starbucks
New sites in Sheffield and Crawley
Incremental retail spend >20p
Cineworld/Starbucks joint plan 2013
– At least 8 more full stores
– Replace counter offer with “We Proudly Serve” in
remaining sites
Overall Retail Performance
Starbucks already delivering +1% growth in circuit wide spend
per person
Unlimited discounts driving increased spend
Additional retail initiatives are driving growth in underlying
spend
19

Cinema Experience - IMAX
Eight IMAX screens now opened
Strong commercial success
– Sheffield & Crawley top grossing digital
IMAX screens in country
Further sites at Edinburgh, Enfield,
Birmingham, Dublin, Nottingham & Ipswich
Glasgow Science Centre to be acquired (stc)
and re-launched under Cineworld
Sub 3 year payback
Key consideration in future new builds
20
Advertising
Full year revenue increased vs 2011 – reflecting current advertising
environment and film product
Full rollout of digital advertising completed in Q4 2012 enabling
– All Cineworld adverts to be distributed digitally
– Shorter booking lead times
– Scheduling flexibility
– Improved media selling opportunities
Already achieved new advertisers and campaigns that could not have been
delivered without digital
Fully integrated and rejuvenated pre-program being
developed for 2014
23 21

2013 Films
22
Strong Sequels Reinvention New & Exciting
Strong Family Slate
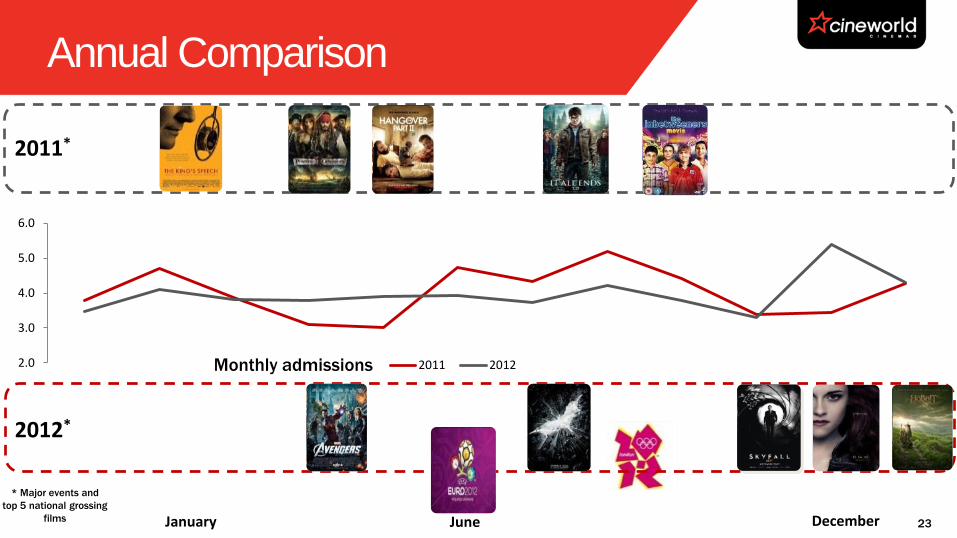
Annual Comparison
2.0
3.0
4.0
5.0
6.0
2011 2012
December January June
* Major events and
top 5 national grossing
films
2012*
2011*
Monthly admissions
23
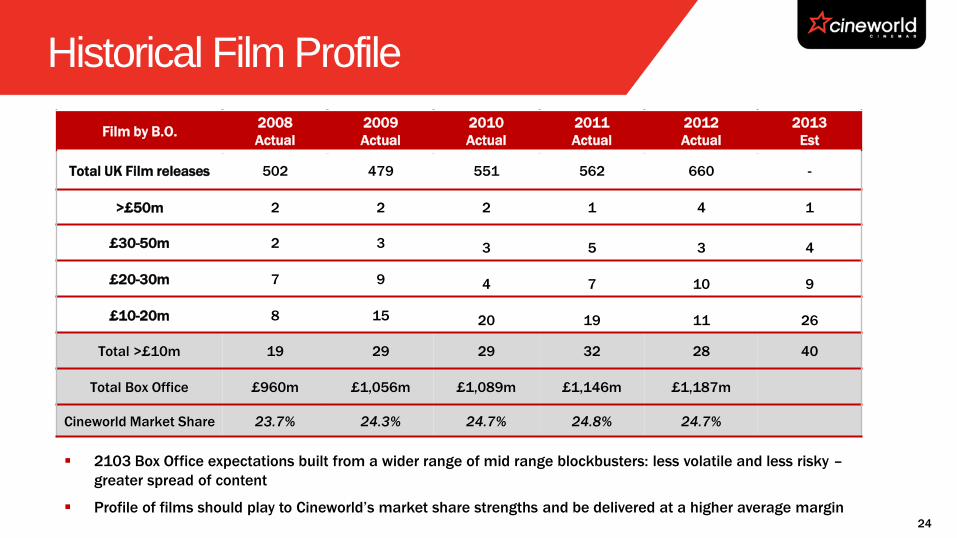
Historical Film Profile
Film by B.O. 2008
Actual
2009
Actual
2010
Actual
2011
Actual
2012
Actual
2013
Est
Total UK Film releases 502 479 551 562 660 -
>£50m 2 2 2 1 4 1
£30-50m 2 3 3 5 3 4
£20-30m 7 9 4 7 10 9
£10-20m 8 15 20 19 11 26
Total >£10m 19 29 29 32 28 40
Total Box Office £960m £1,056m £1,089m £1,146m £1,187m
Cineworld Market Share 23.7% 24.3% 24.7% 24.8% 24.7%
2103 Box Office expectations built from a wider range of mid range blockbusters: less volatile and less risky –
greater spread of content
Profile of films should play to Cineworld’s market share strengths and be delivered at a higher average margin 24

Growth

UK Market Brand Portfolio
Boutique
cinema
Premium
cinema
Value
cinema
Cineworld
Odeon
Vue
The
Screening
Rooms
Everyman
Picturehouse
Curzon
26

Picturehouse
£47.3m transaction financed by debt and £16m share issue
– Access to attractive, growing segment
– Complementary geographic and strategic footprint
– Earnings enhancing in 2013
– Conservatively financed – no impact on existing Cineworld roll-out
plans
Strong existing business with significant expansion opportunities
– Currently 21 sites with 10+ additional planned
– Enables further expansion into smaller, more discerning markets
where Cineworld proposition would struggle
– Direct synergy opportunities
– Exceptional Management expertise
– 129,000 Membership base
27
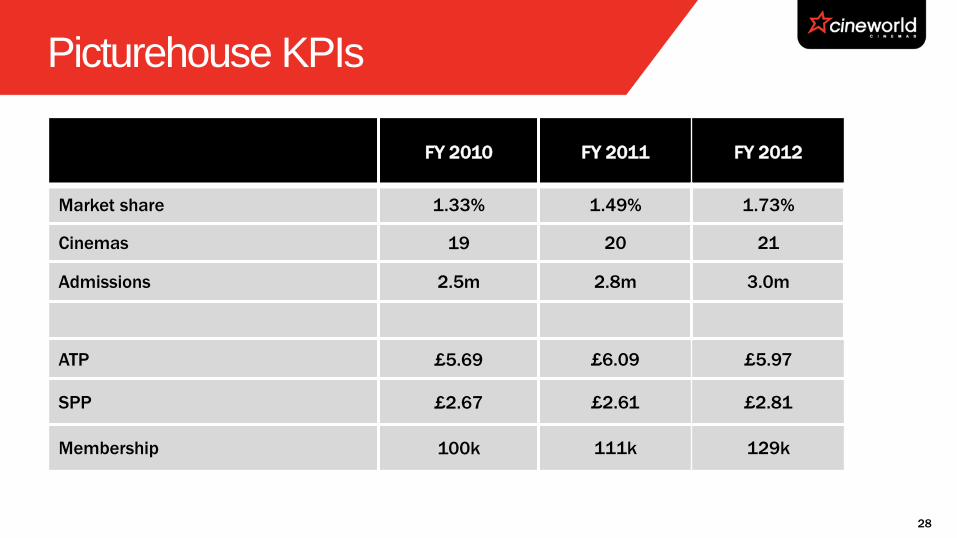
Picturehouse KPIs
FY 2010 FY 2011 FY 2012
Market share 1.33% 1.49% 1.73%
Cinemas 19 20 21
Admissions 2.5m 2.8m 3.0m
ATP £5.69 £6.09 £5.97
SPP £2.67 £2.61 £2.81
Membership 100k 111k 129k
28

Cineworld Pipeline Openings
29
3 4 6
5
8 0
5
10
2013 2014 2015 2016+
In Legals
Contracted
Under Construction
3 Cumulative 4 9 18 21
Significant number of sites under discussion
3 2
2 6 1
1
3
3

Current Trading and Outlook

2013 Outlook
31
Q1 started in line with expectations and ahead of 2012
Favourable film slate
– More £10 - £20m films than 2012
– Anticipate more even phasing of business vs 2012
Priorities for the year ahead
– Picturehouse
– MyCineworld and Unlimited
– New site openings
– Starbucks rollout

Q&A

Appendix

Some of the forthcoming films for 2013
34
Film
Expected Release
Month
Oz: The Great and Powerful March
The Croods March
Oblivion April
Iron Man 3 – 3D/IX April/May
Star Trek Sequel – 3D/IX May
Fast & Furious May
Hangover Pt3 May
Man of Steel – 3D/IX June
World War Z – 3D June
Epic – 3D June
Despicable Me 2 – 3D July
Monsters University – 3D July
The Lone Ranger July
The Wolverine July
Pacific Rim July
Smurfs 2 – 3D August
The World’s End August
Planes August
Turbo October
Thor 2 – 3D/IX November
Catching Fire (Hunger Games Pt2) November
Walking Dinosaurs – 3D December
Hobbit Desolation of Smaug – 3D/IX December

Balance Sheet
35
(£m) 2011 2012
Goodwill 217.1 236.7
Fixed Assets 124.2 160.0
Other non current assets 16.5 32.1
Total non current assets 357.9 428.8
Receivables and Stock 28.5 38.1
Cash 5.5 10.9
Total current assets 34.2 49.0
Trade and other current payables (57.7) (77.4)
Bank Debt less fees (95.7) (127.3)
Finance Lease and Swap liability (11.2) (10.5)
Provisions and LT payables (67.2) (74.0)
Total liabilities (231.8) (289.2)
Net Assets 160.3 188.6
Net Debt 101.4 126.9
Debt : Net Assets 63.3% 67.3%

Cash Flow
36
(£m) FY 2011 FY 2012
EBITDA 63.3 67.1
Change in working capital (1.6) 2.2
Non trading and non cash items (6.4) (2.3)
Cash generated from Operations 55.3 67.0
Net cash interest (5.6) (5.3)
Capex net of contributions (25.0) (31.1)
Acquisition of Picturehouse, net of acquired cash - (43.3)
Tax (8.2) (9.4)
Dividend (15.2) (16.0)
Debt repayment and fees (6.8) (5.0)
Share issue proceeds 0.4 16.3
Revolver drawdown - 32.3
Net cash movement (5.1) 5.5