Embed Size (px)
Citation preview
2.1 2012 Substatiort Refu14bislrment and Modernization NP 2012 CBA
2012 Substation Refurbishment and Modernization
June 2011
Prepared by:
Peter Feehan, P.Eng.
A FORTIS COMPANY
2.1 2012 Substation Refurbishment and Modernization NP 2012 CBA
i
Table of Contents
Page
1.0 Substation Refurbishment and Modernization Strategy ......................................................1
2.0 Substation Refurbishment and Modernization 2012 Projects ..............................................2
2.1 2012 Substation Projects ..........................................................................................2
2.2 Items Under $50,000 ..............................................................................................10
2.3 Substation Monitoring and Operations .................................................................10
Appendix A: Substation Refurbishment and Modernization Plan
Five-Year Forecast 2012 - 2016
2.1 2012 Substation Refurbishment and Modernization NP 2012 CBA
1
1.0 Substation Refurbishment and Modernization Strategy
Newfoundland Power (the “Company”) has 130 substations located throughout its operating
territory. Distribution substations connect the low voltage distribution system to the high voltage
transmission system. Transmission substations connect transmission lines of different voltages.
Generation substations connect generating plants to the electrical system. Substations are critical
to reliability; an unplanned substation outage will affect thousands of customers. The Company’s
substation maintenance program and the Substation Refurbishment and Modernization project
ensure the delivery of reliable least cost electricity to customers in a safe and environmentally
responsible manner.
The Substation Refurbishment and Modernization project provides a structured approach for the
overall refurbishment and modernization of substations and coordinates major equipment
maintenance and replacement activities. Where practical the substation plan is coordinated with
the maintenance cycle for major substation equipment. This coordination minimizes customer
service interruptions and ensures optimum use of resources.
When updating the substation strategic refurbishment and modernization plan substations are
assessed with particular consideration given to the condition of the infrastructure and equipment,
and the need to upgrade and modernize protection and control systems. This assessment is used
to establish the priority for substation work.
Much of this work requires the power transformer to be removed from service; and, therefore,
the timing of the work is restricted to the availability of the portable substation and the capacity
of the portable substation to meet the load requirement. In many circumstances, this requires the
work to be completed in the late spring and summer when the substation load is reduced.
In the Substation Strategic Plan filed with the Company’s 2007 Capital Budget Application, it
was indicated that expenditures under the Substation Refurbishment and Modernization project
were expected to average approximately $4 million per year. In 2012, the budget estimate is
materially below this level due to a requirement to address government regulations concerning
polychlorinated biphenyls (“PCB”)1 and the requirement to address additions due to load
growth.2 Also, the 2012 projects at Hearts Content and New Grand Falls substations were
originally included in the 2011 Substation Refurbishment and Modernization project. Due to the
significant impact of the two storms experienced in 2010, the 2011 plan was revised and these
projects delayed until 2012.3 Such developments highlight the practical requirement for
flexibility in execution of the Substation Refurbishment and Modernization project over time.
1 A description of the work required to meet the new PCB regulations established by Environment Canada can be
found in 2.3 2012 PCB Removal Strategy. 2 The Company has reduced Substation Refurbishment and Modernization project expenditures in 2012 in order
to moderate the overall increase in the substation capital budget. A degree of flexibility is necessarily required
for ongoing planning of capital expenditures if a reasonable degree of stability in the Company’s annual capital
budgets is to be achieved. In Order No. P.U. 36 (2002-2003) the Board stated that it believes more stable and
predictable year over year capital budgets for Newfoundland Power is a desirable objective. 3 Storm related work associated with the March 2010 ice storm and Hurricane Igor in September 2010 caused
planned work in 2010 to be delayed or deferred.
2.1 2012 Substation Refurbishment and Modernization NP 2012 CBA
2
The current five-year forecast for the Substation Refurbishment and Modernization Plan is
shown in Appendix A.
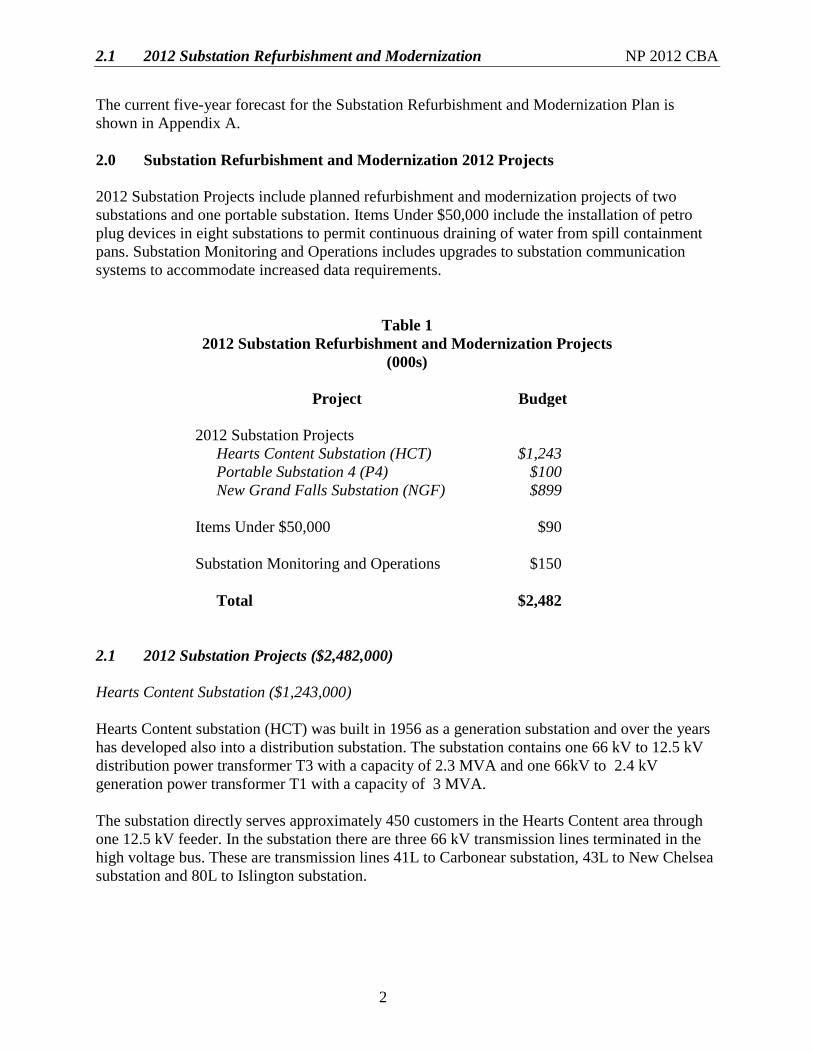
2.0 Substation Refurbishment and Modernization 2012 Projects
2012 Substation Projects include planned refurbishment and modernization projects of two
substations and one portable substation. Items Under $50,000 include the installation of petro
plug devices in eight substations to permit continuous draining of water from spill containment
pans. Substation Monitoring and Operations includes upgrades to substation communication
systems to accommodate increased data requirements.
Table 1
2012 Substation Refurbishment and Modernization Projects
(000s)
Project Budget
2012 Substation Projects
Hearts Content Substation (HCT)
Portable Substation 4 (P4)
New Grand Falls Substation (NGF)
Items Under $50,000
Substation Monitoring and Operations
$1,243
$100
$899
$90
$150
Total $2,482
2.1 2012 Substation Projects ($2,482,000)
Hearts Content Substation ($1,243,000)
Hearts Content substation (HCT) was built in 1956 as a generation substation and over the years
has developed also into a distribution substation. The substation contains one 66 kV to 12.5 kV
distribution power transformer T3 with a capacity of 2.3 MVA and one 66kV to 2.4 kV
generation power transformer T1 with a capacity of 3 MVA.
The substation directly serves approximately 450 customers in the Hearts Content area through
one 12.5 kV feeder. In the substation there are three 66 kV transmission lines terminated in the
high voltage bus. These are transmission lines 41L to Carbonear substation, 43L to New Chelsea
substation and 80L to Islington substation.
2.1 2012 Substation Refurbishment and Modernization NP 2012 CBA
3
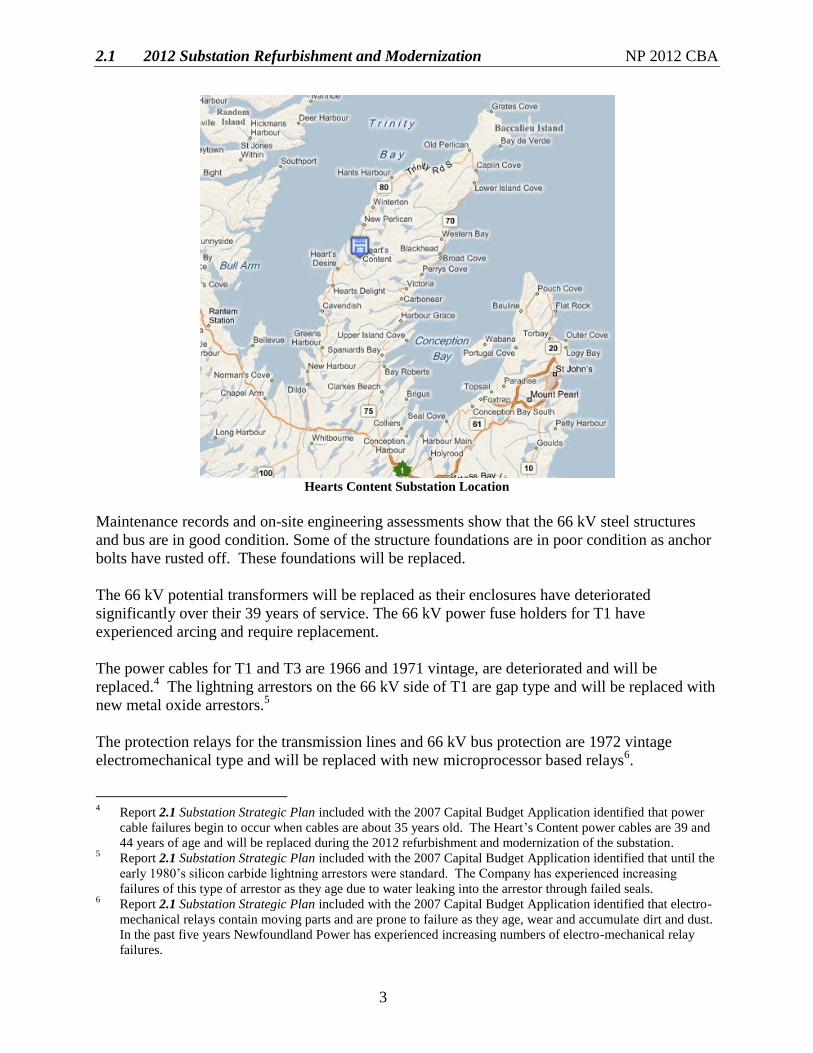
Hearts Content Substation Location
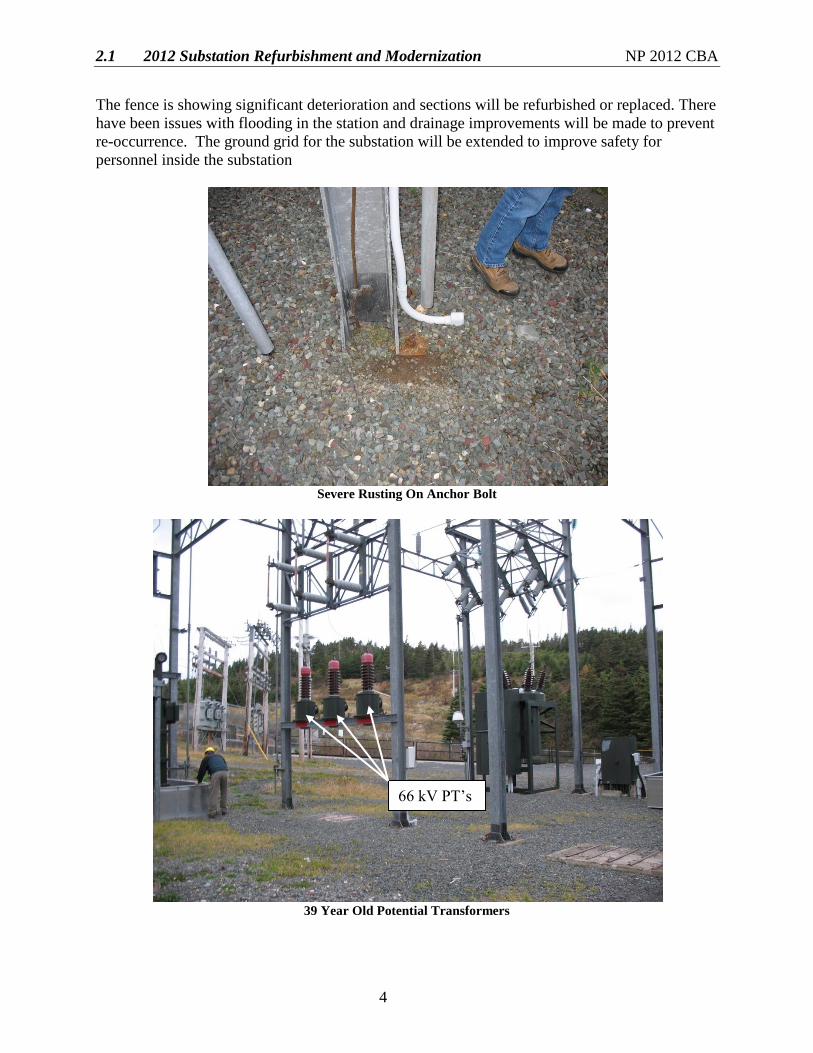
Maintenance records and on-site engineering assessments show that the 66 kV steel structures
and bus are in good condition. Some of the structure foundations are in poor condition as anchor
bolts have rusted off. These foundations will be replaced.
The 66 kV potential transformers will be replaced as their enclosures have deteriorated
significantly over their 39 years of service. The 66 kV power fuse holders for T1 have
experienced arcing and require replacement.
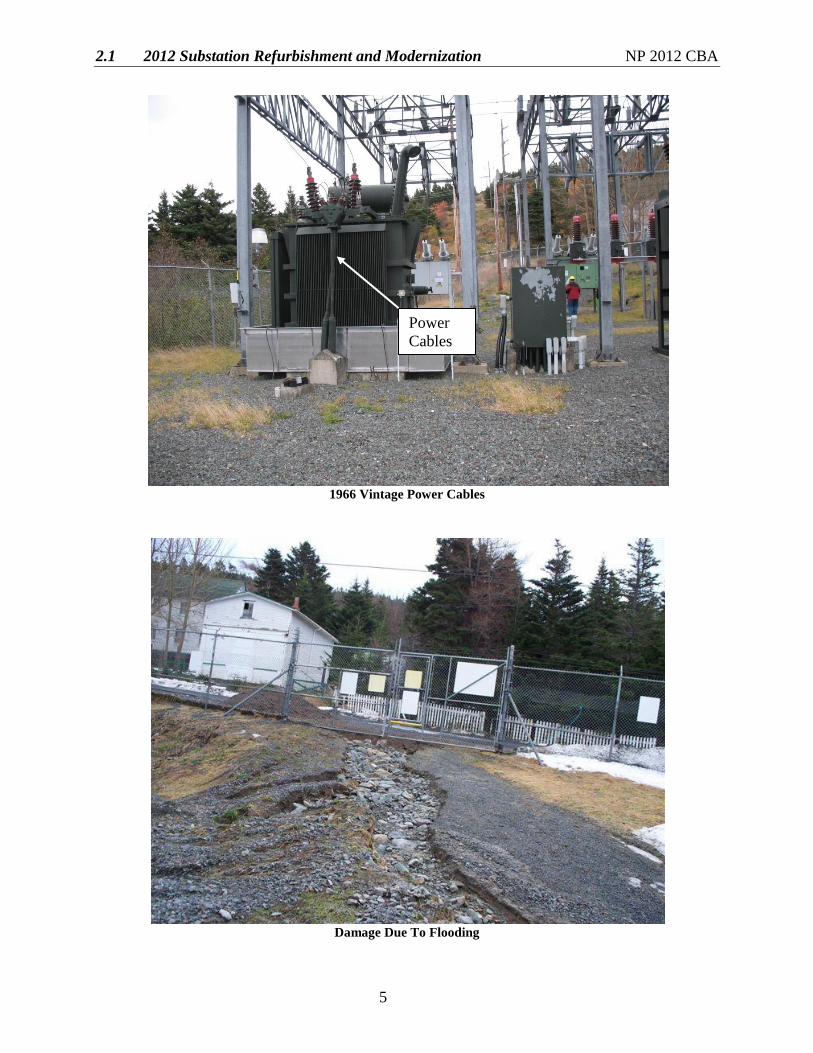
The power cables for T1 and T3 are 1966 and 1971 vintage, are deteriorated and will be
replaced.4 The lightning arrestors on the 66 kV side of T1 are gap type and will be replaced with
new metal oxide arrestors.5
The protection relays for the transmission lines and 66 kV bus protection are 1972 vintage
electromechanical type and will be replaced with new microprocessor based relays6.
4 Report 2.1 Substation Strategic Plan included with the 2007 Capital Budget Application identified that power
cable failures begin to occur when cables are about 35 years old. The Heart’s Content power cables are 39 and
44 years of age and will be replaced during the 2012 refurbishment and modernization of the substation. 5 Report 2.1 Substation Strategic Plan included with the 2007 Capital Budget Application identified that until the
early 1980’s silicon carbide lightning arrestors were standard. The Company has experienced increasing
failures of this type of arrestor as they age due to water leaking into the arrestor through failed seals. 6 Report 2.1 Substation Strategic Plan included with the 2007 Capital Budget Application identified that electro-
mechanical relays contain moving parts and are prone to failure as they age, wear and accumulate dirt and dust.
In the past five years Newfoundland Power has experienced increasing numbers of electro-mechanical relay
failures.
2.1 2012 Substation Refurbishment and Modernization NP 2012 CBA
4
The fence is showing significant deterioration and sections will be refurbished or replaced. There
have been issues with flooding in the station and drainage improvements will be made to prevent
re-occurrence. The ground grid for the substation will be extended to improve safety for
personnel inside the substation
Severe Rusting On Anchor Bolt
39 Year Old Potential Transformers
66 kV PT’s
2.1 2012 Substation Refurbishment and Modernization NP 2012 CBA
5
1966 Vintage Power Cables
Damage Due To Flooding
Power
Cables
2.1 2012 Substation Refurbishment and Modernization NP 2012 CBA
6
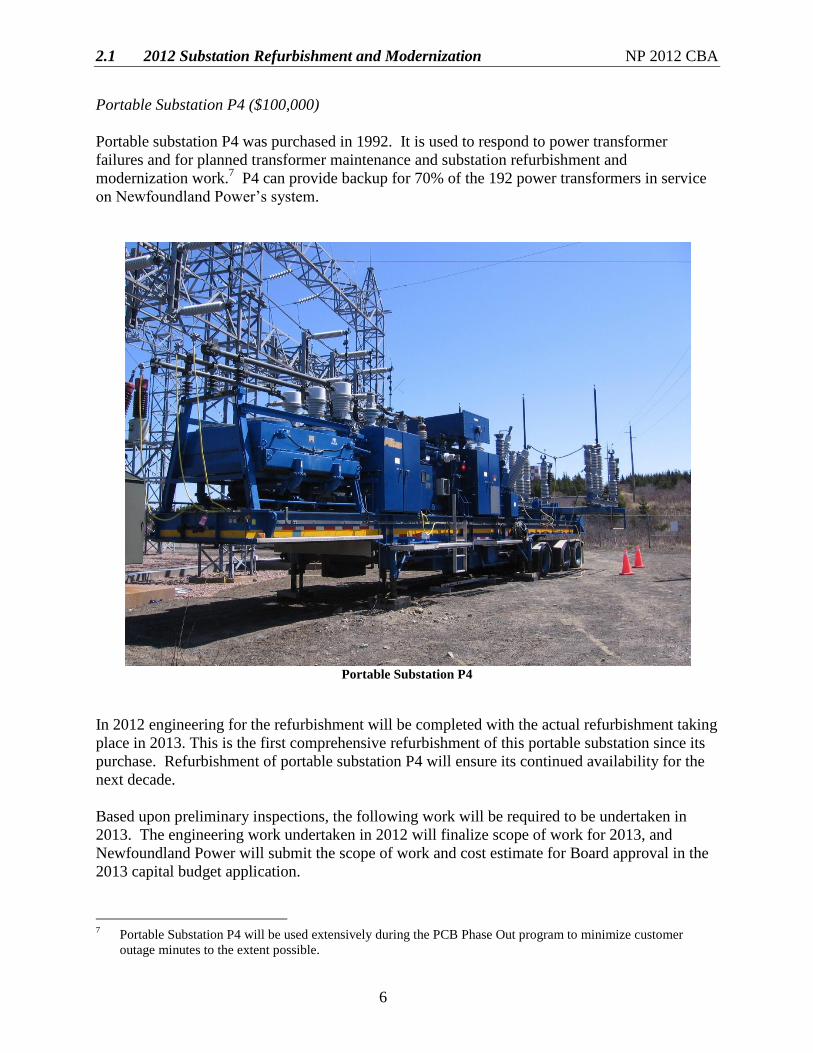
Portable Substation P4 ($100,000)
Portable substation P4 was purchased in 1992. It is used to respond to power transformer
failures and for planned transformer maintenance and substation refurbishment and
modernization work.7 P4 can provide backup for 70% of the 192 power transformers in service
on Newfoundland Power’s system.
Portable Substation P4
In 2012 engineering for the refurbishment will be completed with the actual refurbishment taking
place in 2013. This is the first comprehensive refurbishment of this portable substation since its
purchase. Refurbishment of portable substation P4 will ensure its continued availability for the
next decade.
Based upon preliminary inspections, the following work will be required to be undertaken in
2013. The engineering work undertaken in 2012 will finalize scope of work for 2013, and
Newfoundland Power will submit the scope of work and cost estimate for Board approval in the
2013 capital budget application.
7 Portable Substation P4 will be used extensively during the PCB Phase Out program to minimize customer
outage minutes to the extent possible.
2.1 2012 Substation Refurbishment and Modernization NP 2012 CBA
7
The trailer will undergo an overhaul addressing rust damage and applying a rust inhibiting
coating to the chassis. A fall arrest system and work platforms will be installed in areas where
employees have to work aloft. External lighting will be provided at locations around the trailer.
The alarm annunciation panel has had several failures and will be replaced. The protection relays
will be replaced with microprocessor based protection relays.8 A digital metering system for
power, voltage and current will be provided.
The control wiring associated with the protection and control of the portable substation is
original wiring showing signs of deterioration and will be replaced. Deteriorated termination and
junction boxes will be replaced.
Online monitoring of transformer gas and oil analysis will be provided to protect the transformer.
High voltage linkages connecting the power transformer to the switches are deteriorated and will
be replaced. The batteries and charging system are at the end of life and will be replaced.
A SCADA remote terminal unit will be installed on the portable substation to provide remote
monitoring and control capability of the unit.
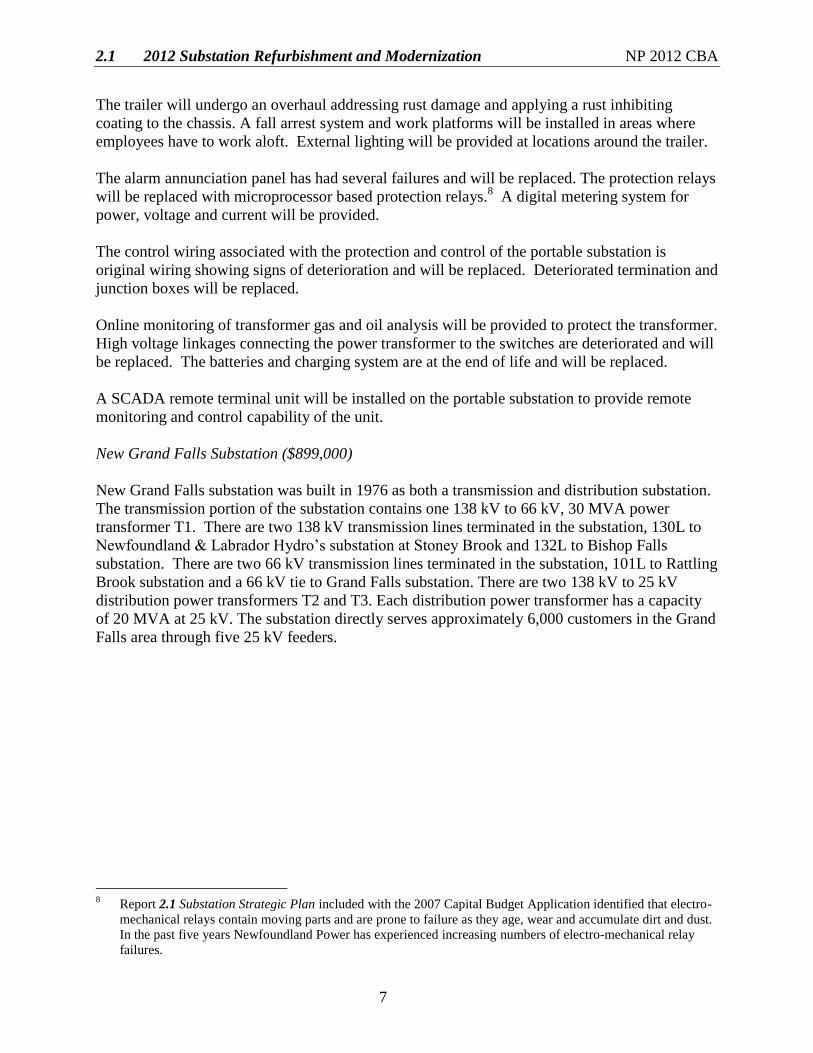
New Grand Falls Substation ($899,000)
New Grand Falls substation was built in 1976 as both a transmission and distribution substation.
The transmission portion of the substation contains one 138 kV to 66 kV, 30 MVA power
transformer T1. There are two 138 kV transmission lines terminated in the substation, 130L to
Newfoundland & Labrador Hydro’s substation at Stoney Brook and 132L to Bishop Falls
substation. There are two 66 kV transmission lines terminated in the substation, 101L to Rattling
Brook substation and a 66 kV tie to Grand Falls substation. There are two 138 kV to 25 kV
distribution power transformers T2 and T3. Each distribution power transformer has a capacity
of 20 MVA at 25 kV. The substation directly serves approximately 6,000 customers in the Grand
Falls area through five 25 kV feeders.
8 Report 2.1 Substation Strategic Plan included with the 2007 Capital Budget Application identified that electro-
mechanical relays contain moving parts and are prone to failure as they age, wear and accumulate dirt and dust.
In the past five years Newfoundland Power has experienced increasing numbers of electro-mechanical relay
failures.
2.1 2012 Substation Refurbishment and Modernization NP 2012 CBA
8
New Grand Falls Substation Location
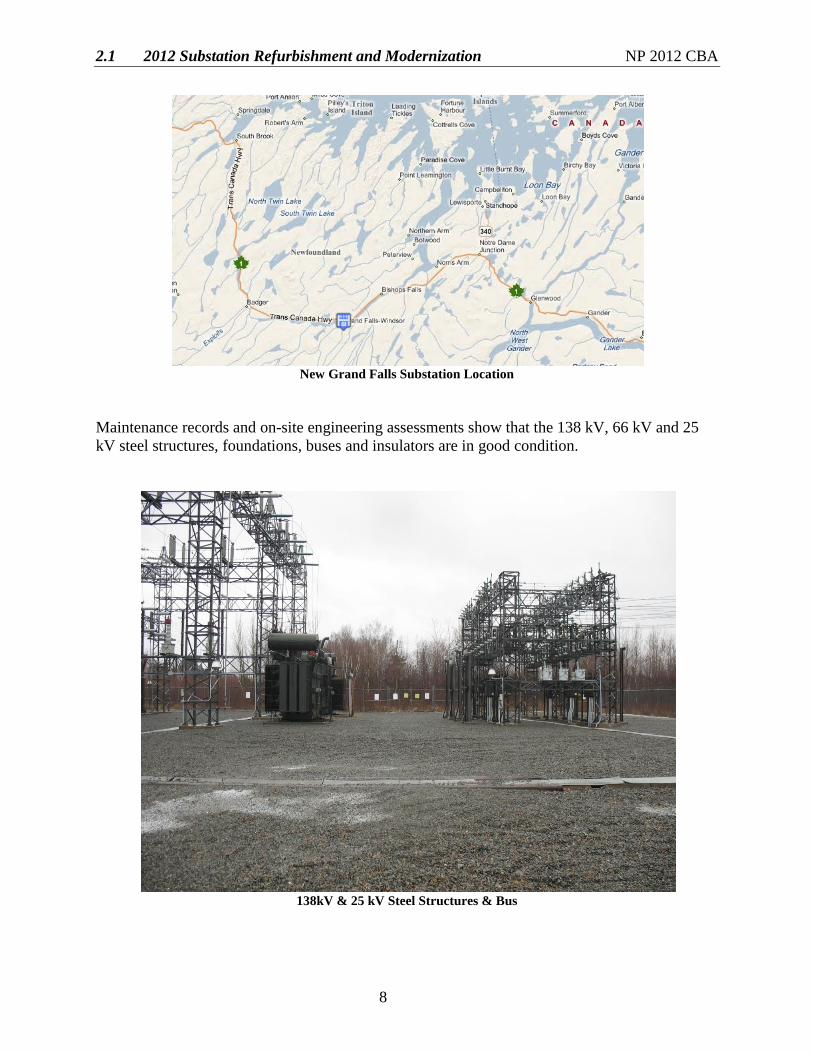
Maintenance records and on-site engineering assessments show that the 138 kV, 66 kV and 25
kV steel structures, foundations, buses and insulators are in good condition.
138kV & 25 kV Steel Structures & Bus
2.1 2012 Substation Refurbishment and Modernization NP 2012 CBA
9
The three power transformers T1, T2 and T3 are in good condition. The lightning arrestors on
the transformers are silicon carbide and will be replaced with metal oxide arrestors.9
The power cable and terminations for T2 are 35 years old, are approaching the end of their
anticipated useful life, and will be replaced.10
The 138 kV air-break switch for transformer T2
no longer operates reliably and will be replaced.
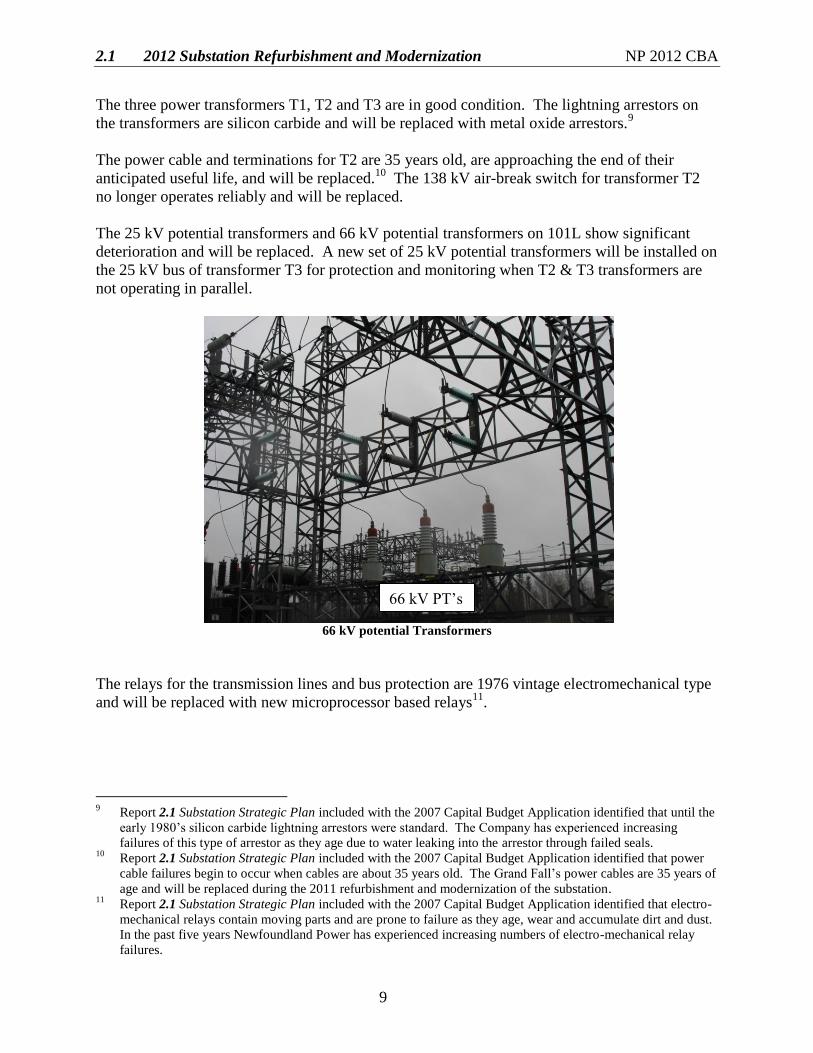
The 25 kV potential transformers and 66 kV potential transformers on 101L show significant
deterioration and will be replaced. A new set of 25 kV potential transformers will be installed on
the 25 kV bus of transformer T3 for protection and monitoring when T2 & T3 transformers are
not operating in parallel.
66 kV potential Transformers
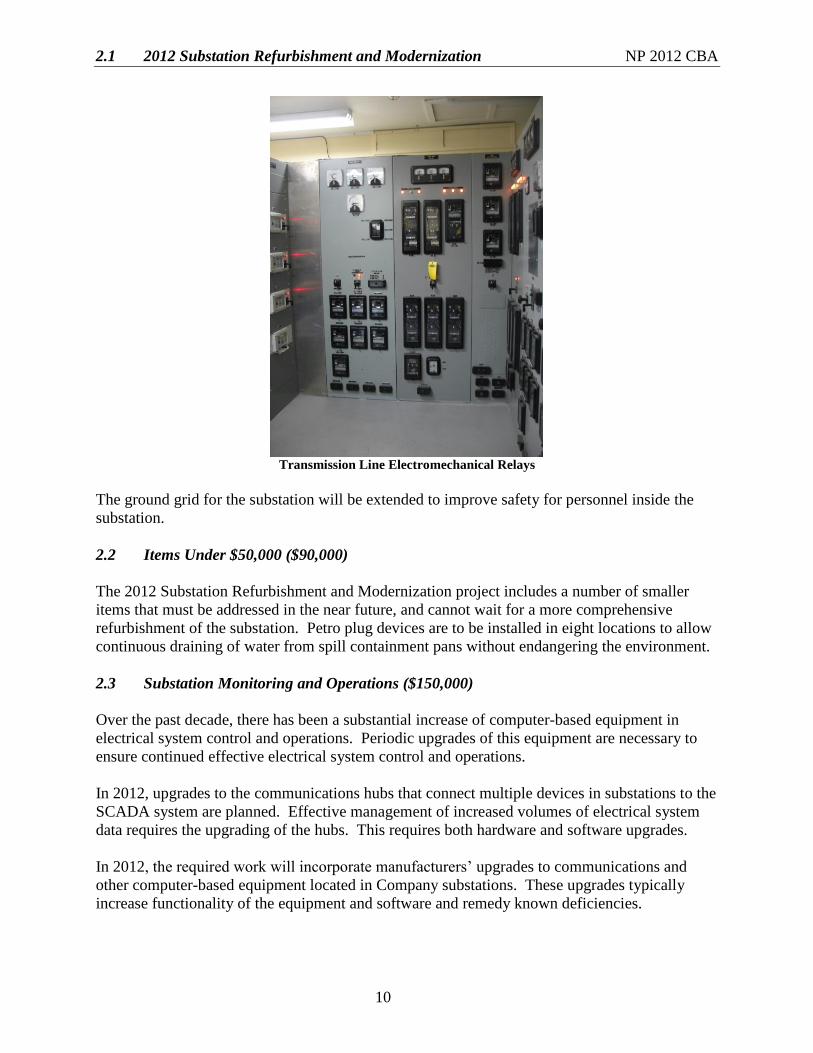
The relays for the transmission lines and bus protection are 1976 vintage electromechanical type
and will be replaced with new microprocessor based relays11
.
9 Report 2.1 Substation Strategic Plan included with the 2007 Capital Budget Application identified that until the
early 1980’s silicon carbide lightning arrestors were standard. The Company has experienced increasing
failures of this type of arrestor as they age due to water leaking into the arrestor through failed seals. 10
Report 2.1 Substation Strategic Plan included with the 2007 Capital Budget Application identified that power
cable failures begin to occur when cables are about 35 years old. The Grand Fall’s power cables are 35 years of
age and will be replaced during the 2011 refurbishment and modernization of the substation. 11
Report 2.1 Substation Strategic Plan included with the 2007 Capital Budget Application identified that electro-
mechanical relays contain moving parts and are prone to failure as they age, wear and accumulate dirt and dust.
In the past five years Newfoundland Power has experienced increasing numbers of electro-mechanical relay
failures.
66 kV PT’s
2.1 2012 Substation Refurbishment and Modernization NP 2012 CBA
10
Transmission Line Electromechanical Relays
The ground grid for the substation will be extended to improve safety for personnel inside the
substation.
2.2 Items Under $50,000 ($90,000)
The 2012 Substation Refurbishment and Modernization project includes a number of smaller
items that must be addressed in the near future, and cannot wait for a more comprehensive
refurbishment of the substation. Petro plug devices are to be installed in eight locations to allow
continuous draining of water from spill containment pans without endangering the environment.
2.3 Substation Monitoring and Operations ($150,000)
Over the past decade, there has been a substantial increase of computer-based equipment in
electrical system control and operations. Periodic upgrades of this equipment are necessary to
ensure continued effective electrical system control and operations.
In 2012, upgrades to the communications hubs that connect multiple devices in substations to the
SCADA system are planned. Effective management of increased volumes of electrical system
data requires the upgrading of the hubs. This requires both hardware and software upgrades.
In 2012, the required work will incorporate manufacturers’ upgrades to communications and
other computer-based equipment located in Company substations. These upgrades typically
increase functionality of the equipment and software and remedy known deficiencies.

2.1 2012 Substation Refurbishment and Modernization NP 2012 CBA
Appendix A
Substation Refurbishment and Modernization Plan
Five-Year Forecast 2012 to 2016
2.1 2012 Substation Refurbishment and Modernization NP 2012 CBA
A-1
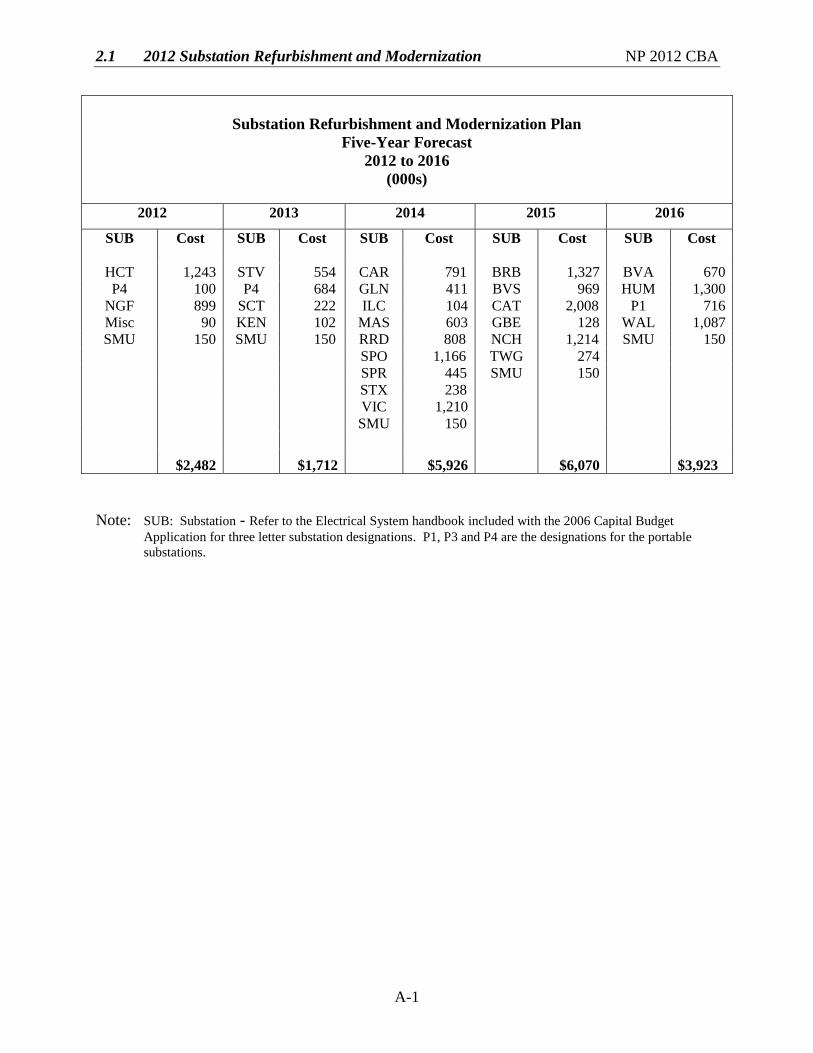
Substation Refurbishment and Modernization Plan
Five-Year Forecast
2012 to 2016
(000s)
2012 2013 2014 2015 2016
SUB Cost SUB Cost SUB Cost SUB Cost SUB Cost
HCT 1,243 STV 554 CAR 791 BRB 1,327 BVA 670
P4 100 P4 684 GLN 411 BVS 969 HUM 1,300
NGF 899 SCT 222 ILC 104 CAT 2,008 P1 716
Misc 90 KEN 102 MAS 603 GBE 128 WAL 1,087
SMU 150 SMU 150 RRD 808 NCH 1,214 SMU 150
SPO 1,166 TWG 274
SPR 445 SMU 150
STX 238
VIC 1,210
SMU 150
$2,482 $1,712 $5,926 $6,070
$3,923
Note: SUB: Substation - Refer to the Electrical System handbook included with the 2006 Capital Budget
Application for three letter substation designations. P1, P3 and P4 are the designations for the portable
substations.
2.2 2012 Additions Due to Load Growth NP 2012 CBA
2012 Additions Due to Load Growth
June 201 1
Prepared by:
Bob Cahill, P. Tech
Approved by:
Byron Cbubbs, P.Eng.
A FORllS COMPANY
2.2 2012 Additions Due to Load Growth NP 2012 CBA
i
Table of Contents
Page
1.0 Introduction ....................................................................................................................... 1
2.0 Gander Area ...................................................................................................................... 1
3.0 St. John’s South/Mount Pearl Area ................................................................................... 2
4.0 Project Cost ....................................................................................................................... 2
5.0 Concluding ........................................................................................................................ 2
Attachment A: Gander Study Attachment B: St. John’s South/Mount Pearl Study
2.2 2012 Additions Due to Load Growth NP 2012 CBA
1
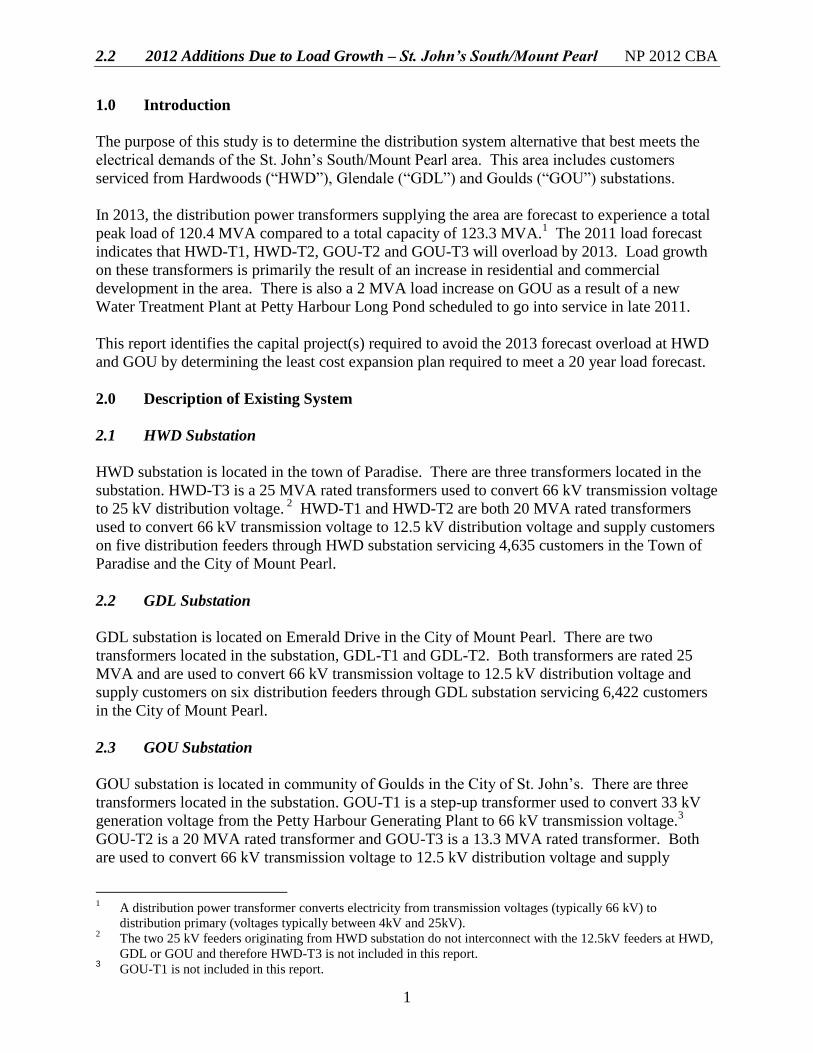
1.0 Introduction
As load increases on an electrical system, individual components can become overloaded. The
focus of Newfoundland Power’s system planning is to avoid or minimize component overloading
through cost effective upgrades to the system. In the case of substation power transformers, an
engineering study is completed to identify and evaluate technical alternatives in advance of the
overload. These technical alternatives are fully examined, cost estimates are prepared and an
economic analysis is performed to identify the least cost alternative.
In urban settings load can be transferred between adjacent substations. For this reason,
engineering studies of alternatives to address load growth commonly identify an area with
multiple substations as the scope of the system planning study.
In this case, two studies were undertaken to address the impact of load growth on the Company’s
substations in the areas of Gander and St. John’s South/Mount Pearl. The scope of the studies
included two substations serving customers in Gander, and three substations serving customers
in St. John’s South/Mount Pearl. A review of the peak loads experienced in the most recent
winter season was used to identify actual and forecast overload conditions on power transformers
in these substations.
This report identifies two items to be included in the Additions Due to Load Growth Project in
the 2012 Capital Budget. The first item is to install a new 25 MVA transformer for Cobb’s Pond
substation, addressing transformer capacity in the town of Gander. The second item is the
completion of civil work at Glendale substation in preparation for the installation of a new
transformer that will be required in 2013.
2.0 Gander Area
An engineering study has been completed on the distribution system upgrades to meet the
electrical demands in the Gander area.1 This area includes customers serviced from Cobb’s Pond
(“COB”) and Gander (“GAN”) substations.
The study examines 3 alternatives to determine the least cost approach to dealing with the
forecast overload conditions in the Gander area. Each alternative was evaluated using a 20 year
load forecast. Based on net present value calculations the least cost alternative was selected.
The least cost project involves installing a new 25 MVA power transformer at COB substation.
1 The engineering study titled “2012 Additions Due to Load Growth-Gander Study” is included as Attachment A.
2.2 2012 Additions Due to Load Growth NP 2012 CBA
2
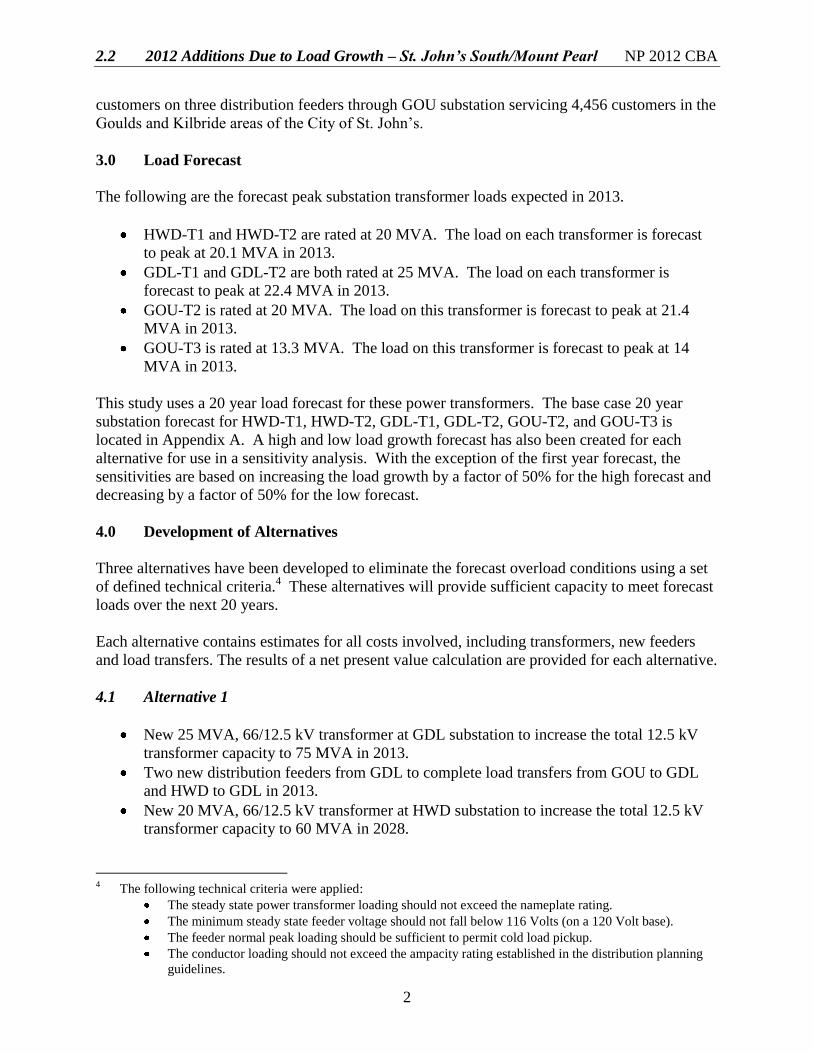
3.0 St. John’s South/Mount Pearl Area
An engineering study has been completed on the distribution system upgrades to meet the
electrical demands in the St. John’s South/Mount Pearl area.2 The St. John’s South/Mount Pearl
area includes customers serviced from Hardwoods (“HWD”), Glendale (“GDL”) and Goulds
(“GOU”) substations.
The study examines 3 alternatives to determine the least cost approach to dealing with the
forecast overload conditions in the St. John’s South/Mount Pearl area. Each alternative was
evaluated using a 20 year load forecast. Based on net present value calculations the least cost
alternative was selected.
The least cost project involves completion of civil work at Glendale substation in preparation for
the installation of a new transformer that will be required in 2013.3
4.0 Project Cost
Table 1 shows the total 2012 capital costs for each project.
Table 1
2012 Project Costs
($000)
Cost Category
Cobb’s Pond
Transformer
Glendale
Civil Work
Material 3,657 957
Labour – Internal 30 40
Engineering 368 140
Other 80 19
Total 4,135 1,156
5.0 Concluding
Both the Gander and St. John’s South/Mount Pearl areas have experienced customer and load
growth in recent years. As a result the available transformer capacity has diminished and
equipment overloads are forecast to occur.
2 The engineering study titled “2012 Additions Due to Load Growth-St. John’s South/Mount Pearl Study” is
included as Attachment B. 3 Additional transformer capacity is required at GDL substation in 2013. However, the project will extend beyond
one year. Completing civil work at GDL substation in 2012 will allow additional transformer capacity to be
installed in GDL during 2013.

2.2 2012 Additions Due to Load Growth NP 2012 CBA
3
It is recommended that the projects identified as part of the least cost alternatives in the attached
studies be undertaken in 2012 to address capacity issues in the Gander and St. John’s
South/Mount Pearl areas.
The least cost alternatives proposed include installing a new 25 MVA power transformer at COB
substation and completing civil work in preparation for the installation of an additional 25MVA
power transformer at GDL substation in 2013. The estimated cost to complete the work proposed
for 2012 is $5,291,000.
2.2 2012 Additions Due to Load Growth – Gander Study NP 2012 CBA
Attachment A
Gander Study
2.2 2012 Additions Due to Load Growth – Gander Study NP 2012 CBA
i
Table of Contents
Page
1.0 Introduction ....................................................................................................................... 1
2.0 Description of Existing System ........................................................................................ 1
2.1 GAN Substation .................................................................................................... 1
2.2 COB Substation ................................................................................................... 1
2.3 Gander Distribution Network ............................................................................... 1
3.0 Load Forecast .................................................................................................................... 2
4.0 Development of Alternatives ............................................................................................ 3
4.1 Alternative 1.......................................................................................................... 3
4.2 Alternative 2.......................................................................................................... 3
4.3 Alternative 3.......................................................................................................... 3
5.0 Evaluation of Alternatives ................................................................................................ 4
5.1 Cost of Alternatives .............................................................................................. 4
5.2 Economic Analysis ............................................................................................... 5
5.3 Sensitivity Analysis .............................................................................................. 5
6.0 Project Cost ....................................................................................................................... 6
7.0 Conclusion and Recommendation ................................................................................... 7
Appendix A: 2011 Substation Load Forecast – Base Case
Appendix B: Alternative #1 20 Year Substation Load Forecast
Appendix C: Alternative #2 20 Year Substation Load Forecast
Appendix D: Alternative #3 20 Year Substation Load Forecast
2.2 2012 Additions Due to Load Growth – Gander Study NP 2012 CBA
1
1.0 Introduction
The purpose of this study is to determine the distribution system alternative that best meets the
electrical demands of the Town of Gander. This area includes customers serviced from Gander
Substation (“GAN”) and Cobb’s Pond Substation (“COB”).
In 2010, the distribution power transformers supplying the area experienced a total peak load of
37.6 MVA compared to a total capacity of 40.0 MVA.1 The current substation load forecast
indicates that the combination of transformers in GAN and COB substations will reach overload
in 2011. Load growth on these transformers is the result of an increase in residential and
commercial development in the Town of Gander.
This report identifies the capital project(s) required to avoid the 2012 forecast overload by
determining the least cost expansion plan required to meet a 20 year load forecast.
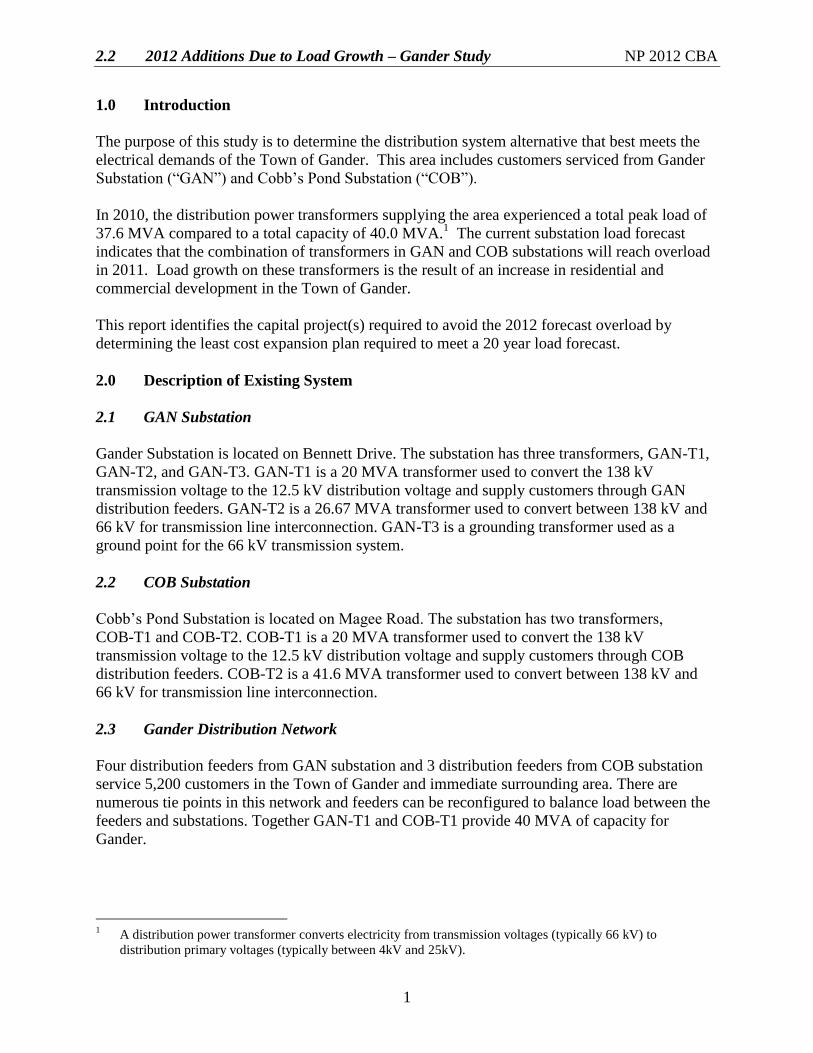
2.0 Description of Existing System
2.1 GAN Substation
Gander Substation is located on Bennett Drive. The substation has three transformers, GAN-T1,
GAN-T2, and GAN-T3. GAN-T1 is a 20 MVA transformer used to convert the 138 kV
transmission voltage to the 12.5 kV distribution voltage and supply customers through GAN
distribution feeders. GAN-T2 is a 26.67 MVA transformer used to convert between 138 kV and
66 kV for transmission line interconnection. GAN-T3 is a grounding transformer used as a
ground point for the 66 kV transmission system.
2.2 COB Substation
Cobb’s Pond Substation is located on Magee Road. The substation has two transformers,
COB-T1 and COB-T2. COB-T1 is a 20 MVA transformer used to convert the 138 kV
transmission voltage to the 12.5 kV distribution voltage and supply customers through COB
distribution feeders. COB-T2 is a 41.6 MVA transformer used to convert between 138 kV and
66 kV for transmission line interconnection.
2.3 Gander Distribution Network
Four distribution feeders from GAN substation and 3 distribution feeders from COB substation
service 5,200 customers in the Town of Gander and immediate surrounding area. There are
numerous tie points in this network and feeders can be reconfigured to balance load between the
feeders and substations. Together GAN-T1 and COB-T1 provide 40 MVA of capacity for
Gander.
1 A distribution power transformer converts electricity from transmission voltages (typically 66 kV) to
distribution primary voltages (typically between 4kV and 25kV).
2.2 2012 Additions Due to Load Growth – Gander Study NP 2012 CBA
2
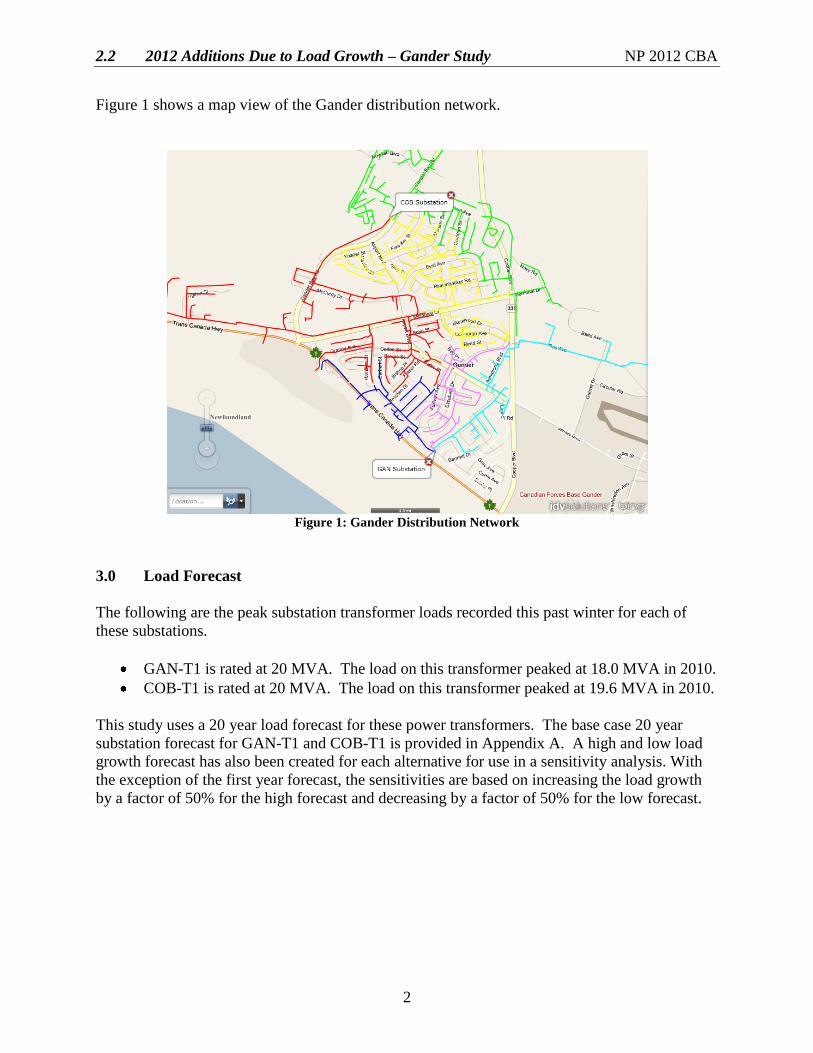
Figure 1 shows a map view of the Gander distribution network.
Figure 1: Gander Distribution Network
3.0 Load Forecast
The following are the peak substation transformer loads recorded this past winter for each of
these substations.
GAN-T1 is rated at 20 MVA. The load on this transformer peaked at 18.0 MVA in 2010.
COB-T1 is rated at 20 MVA. The load on this transformer peaked at 19.6 MVA in 2010.
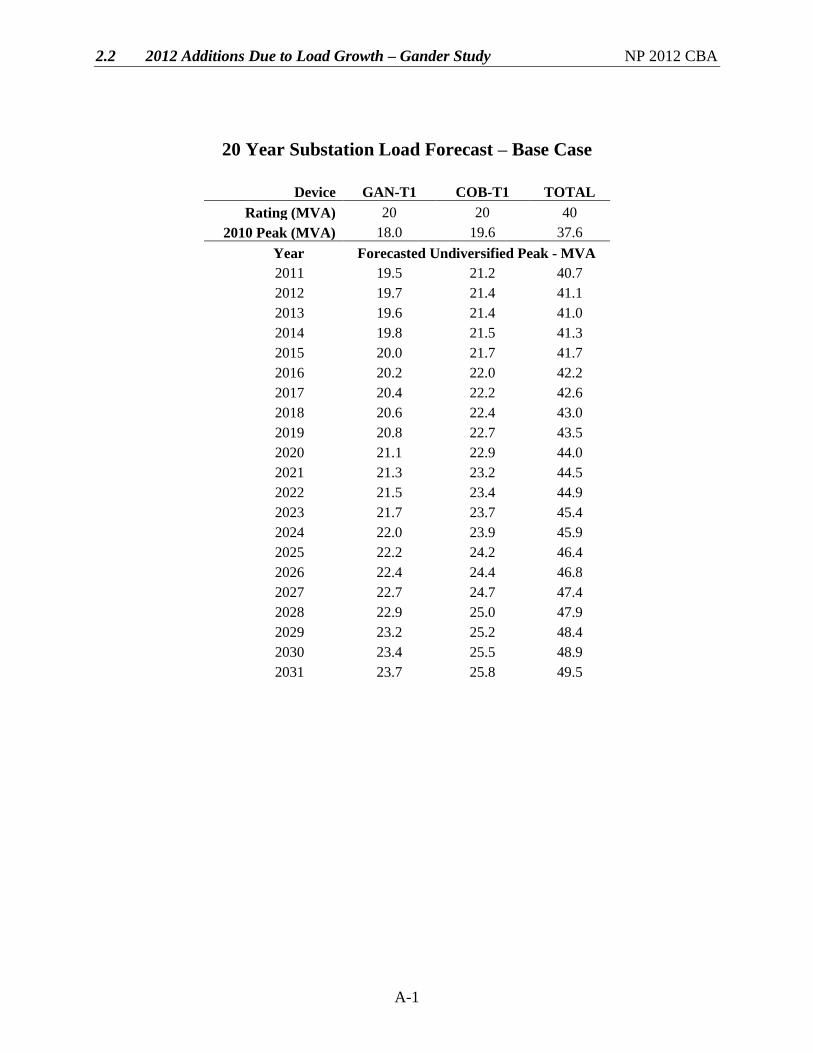
This study uses a 20 year load forecast for these power transformers. The base case 20 year
substation forecast for GAN-T1 and COB-T1 is provided in Appendix A. A high and low load
growth forecast has also been created for each alternative for use in a sensitivity analysis. With
the exception of the first year forecast, the sensitivities are based on increasing the load growth
by a factor of 50% for the high forecast and decreasing by a factor of 50% for the low forecast.
2.2 2012 Additions Due to Load Growth – Gander Study NP 2012 CBA
3
4.0 Development of Alternatives
Three alternatives have been developed to eliminate the forecast overload conditions using a set
of defined technical criteria.2 These alternatives will provide sufficient capacity to meet forecast
loads over the next 20 years. Each alternative contains estimates for all costs involved and the
results of a net present value calculation are provided for each alternative.
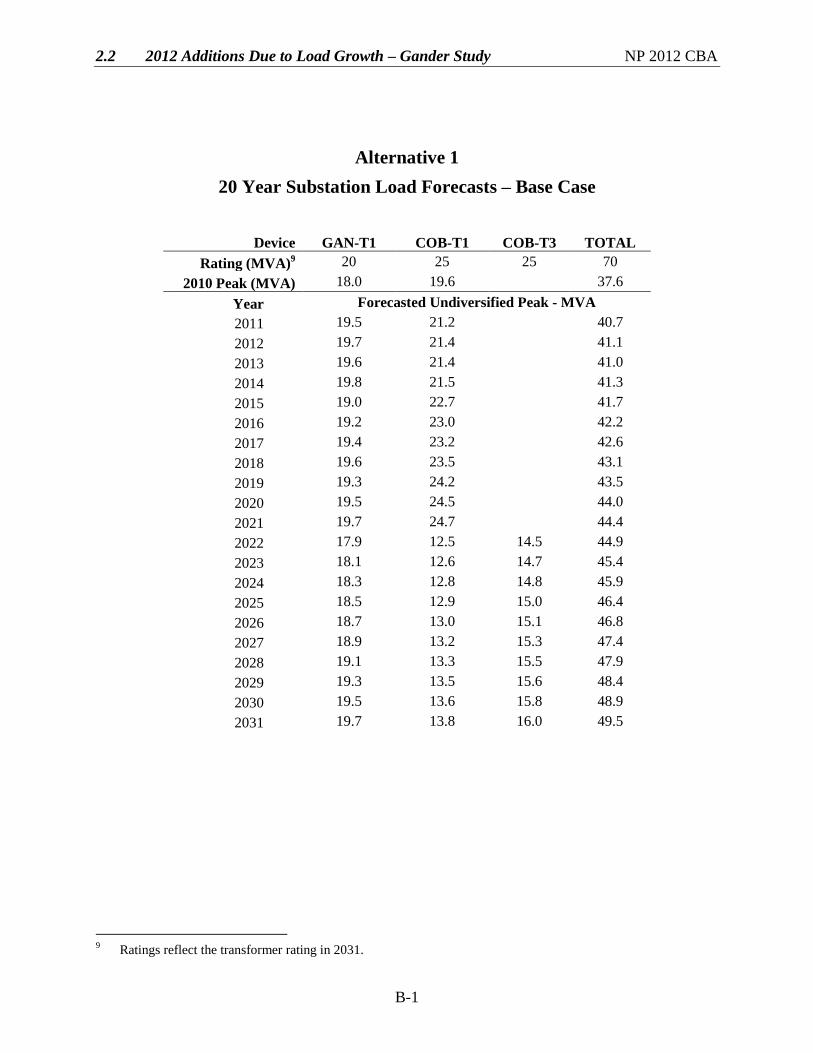
4.1 Alternative 1
Replace the existing 20 MVA, 138/12.5 kV transformer at COB substation with a
25 MVA transformer in 2012.
Purchase and install a 25 MVA, 138/12.5 kV transformer at COB substation in 2022.
The resulting peak load forecasts for each transformer under Alternative 1 are shown in
Appendix B.
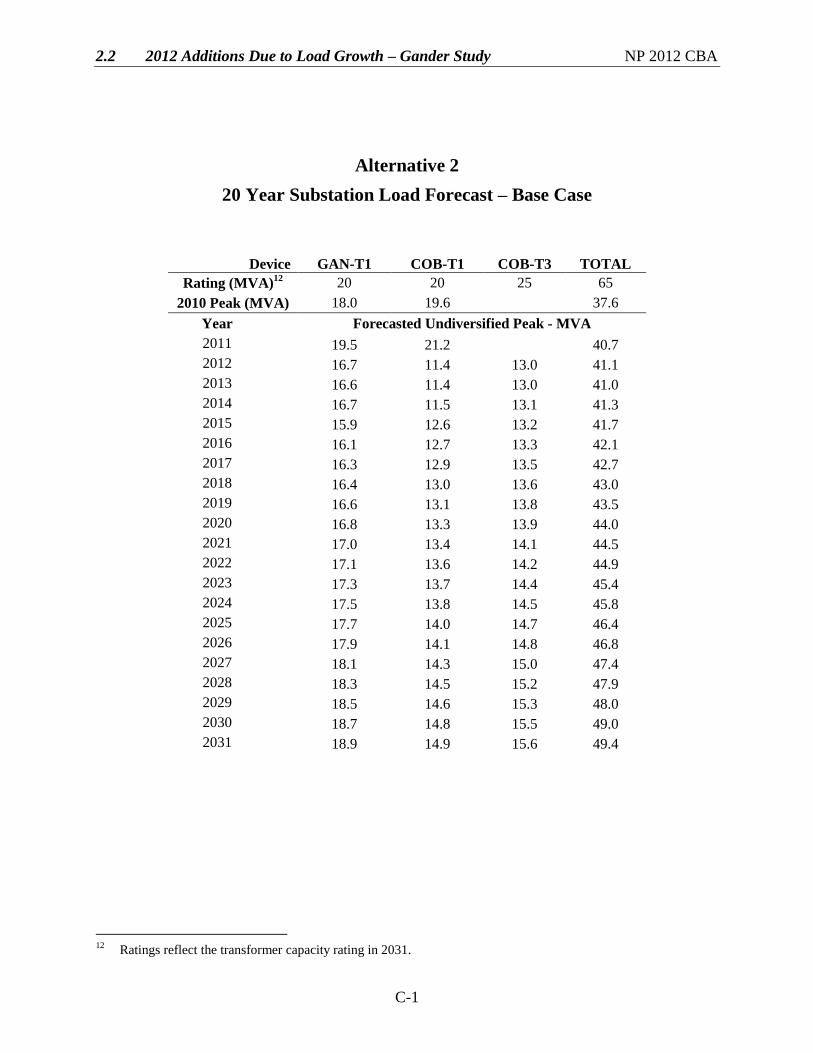
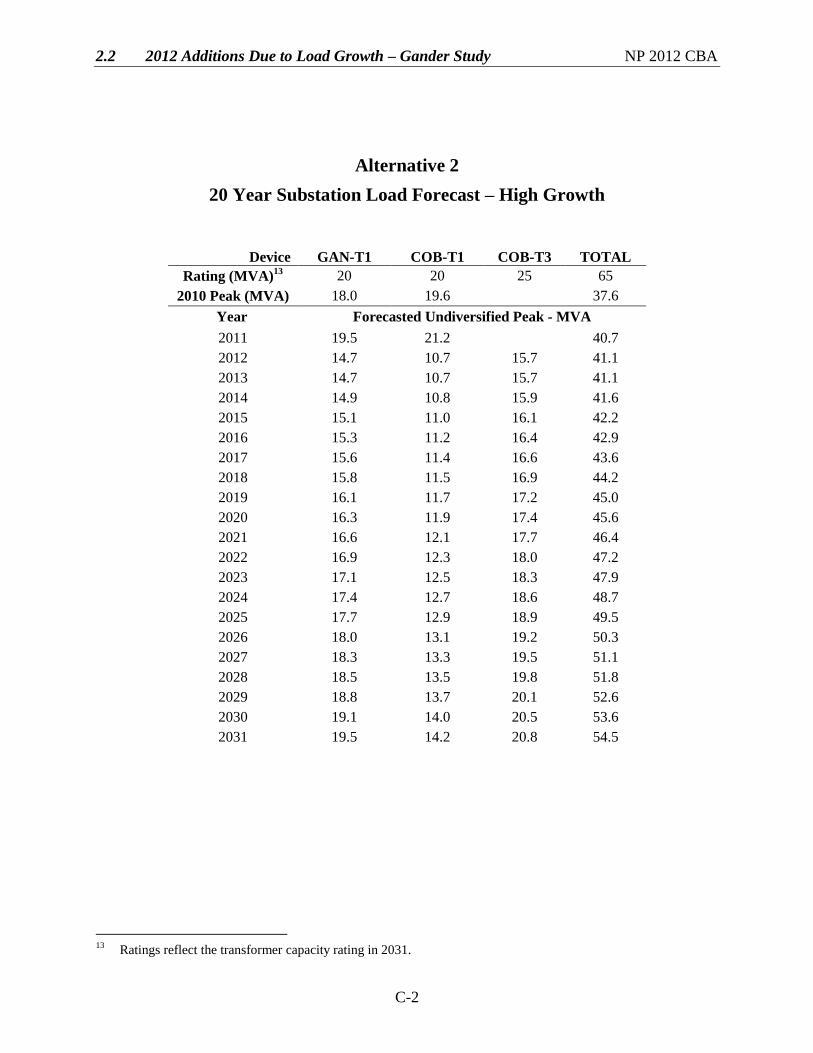
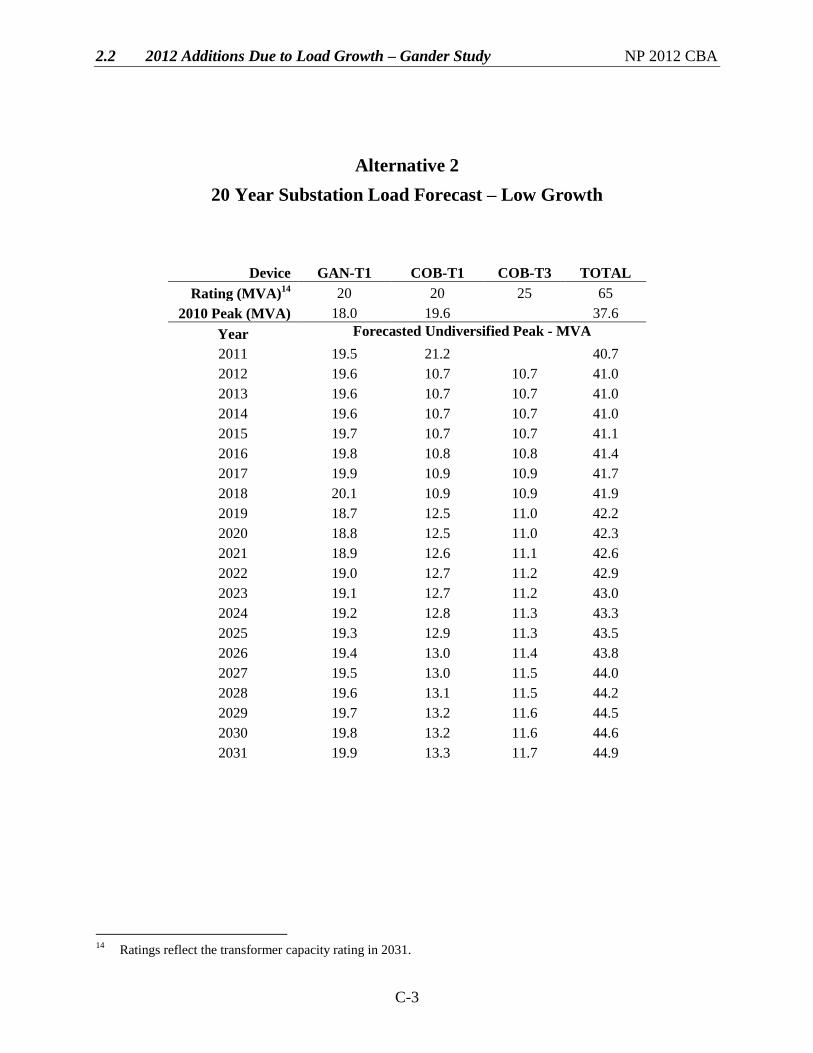
4.2 Alternative 2
Purchase and install a new 25 MVA, 138/12.5 kV transformer at COB substation in 2012.
The resulting peak load forecasts for each transformer under Alternative 2 are shown in
Appendix C.
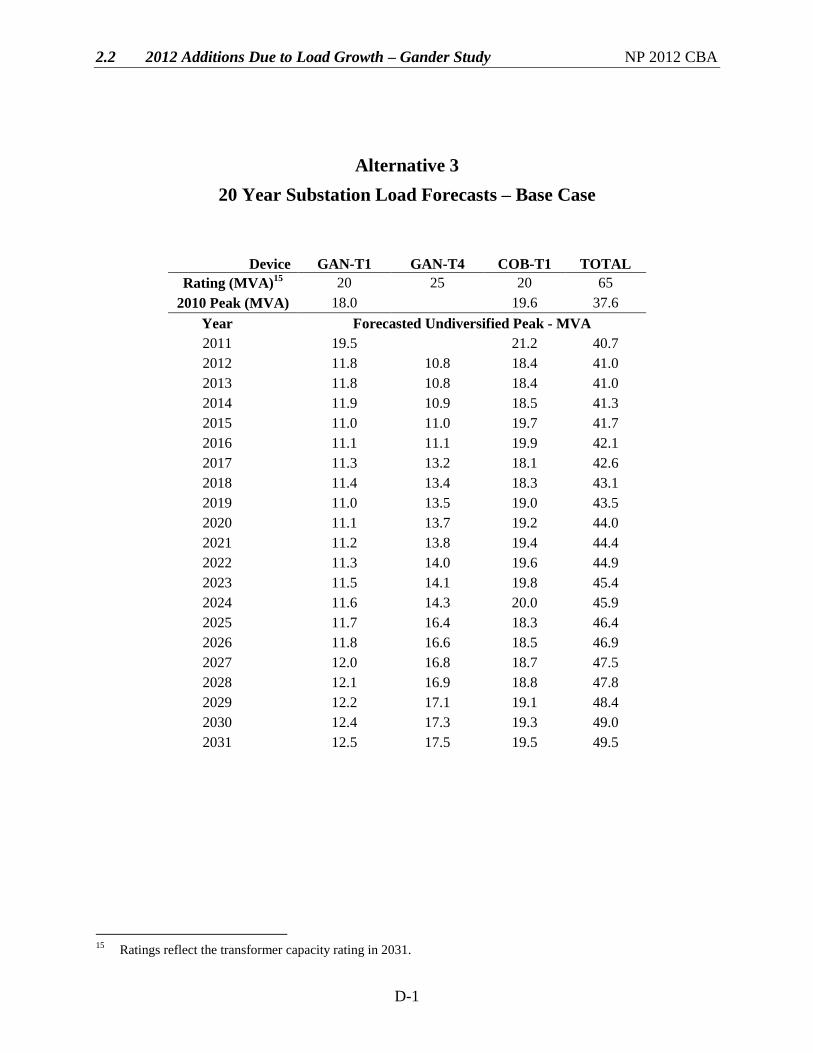
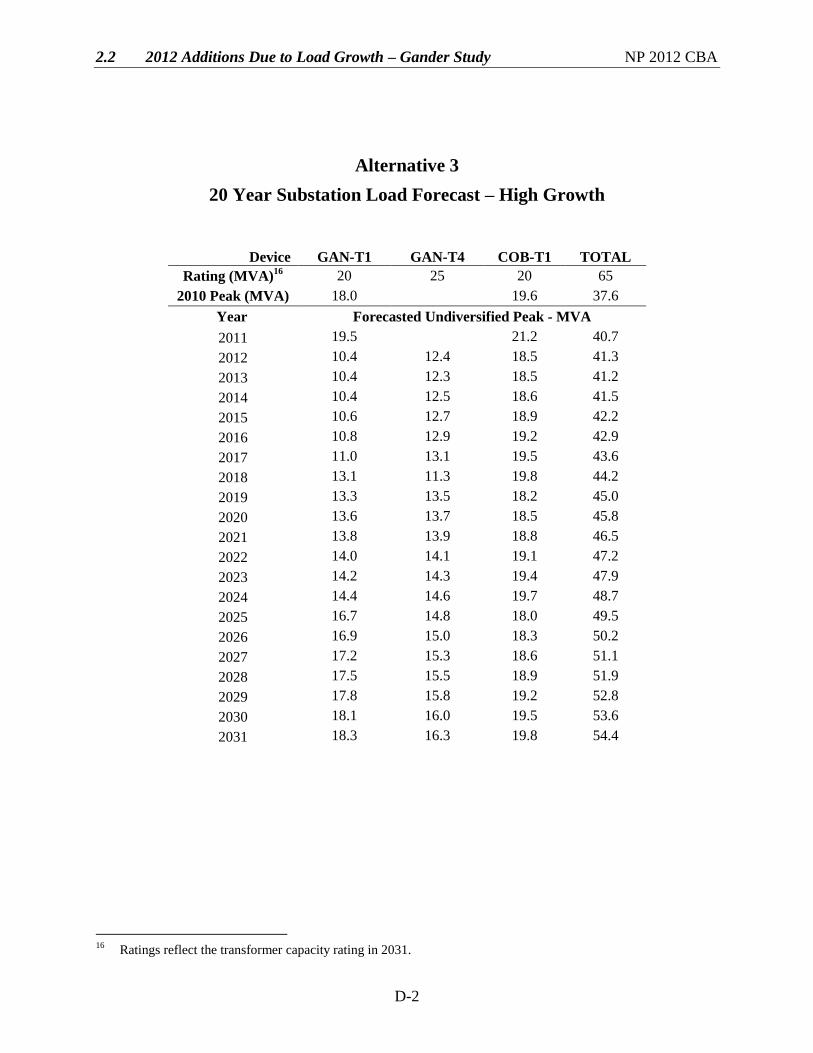
4.3 Alternative 3
Purchase and install a new 25 MVA, 138/12.5 kV transformer at GAN substation in
2012.
The resulting peak load forecasts for each transformer under Alternative 3 are shown in
Appendix D.
2 The following technical criteria were applied:
The steady state power transformer loading should not exceed the nameplate rating.
The minimum steady state feeder voltage should not fall below 116 Volts (on a 120 Volt base).
The feeder normal peak loading should be sufficient to permit cold load pickup.
The conductor loading should not exceed the ampacity rating established in the distribution planning
guidelines.
2.2 2012 Additions Due to Load Growth – Gander Study NP 2012 CBA
4
5.0 Evaluation of Alternatives
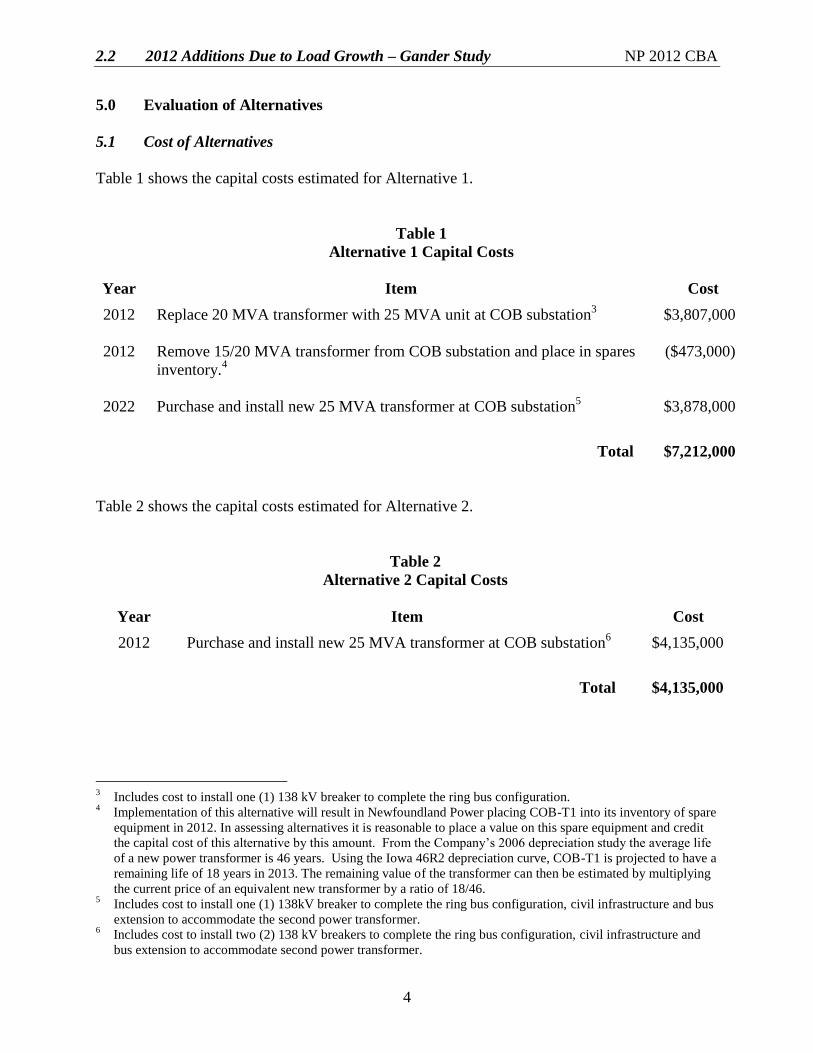
5.1 Cost of Alternatives
Table 1 shows the capital costs estimated for Alternative 1.
Table 1
Alternative 1 Capital Costs
Year Item Cost
2012 Replace 20 MVA transformer with 25 MVA unit at COB substation3 $3,807,000
2012 Remove 15/20 MVA transformer from COB substation and place in spares
inventory.4
($473,000)
2022 Purchase and install new 25 MVA transformer at COB substation5
$3,878,000
Total $7,212,000
Table 2 shows the capital costs estimated for Alternative 2.
Table 2
Alternative 2 Capital Costs
Year Item Cost
2012 Purchase and install new 25 MVA transformer at COB substation6
$4,135,000
Total $4,135,000
3 Includes cost to install one (1) 138 kV breaker to complete the ring bus configuration.
4 Implementation of this alternative will result in Newfoundland Power placing COB-T1 into its inventory of spare
equipment in 2012. In assessing alternatives it is reasonable to place a value on this spare equipment and credit
the capital cost of this alternative by this amount. From the Company’s 2006 depreciation study the average life
of a new power transformer is 46 years. Using the Iowa 46R2 depreciation curve, COB-T1 is projected to have a
remaining life of 18 years in 2013. The remaining value of the transformer can then be estimated by multiplying
the current price of an equivalent new transformer by a ratio of 18/46. 5 Includes cost to install one (1) 138kV breaker to complete the ring bus configuration, civil infrastructure and bus
extension to accommodate the second power transformer. 6 Includes cost to install two (2) 138 kV breakers to complete the ring bus configuration, civil infrastructure and
bus extension to accommodate second power transformer.
2.2 2012 Additions Due to Load Growth – Gander Study NP 2012 CBA
5
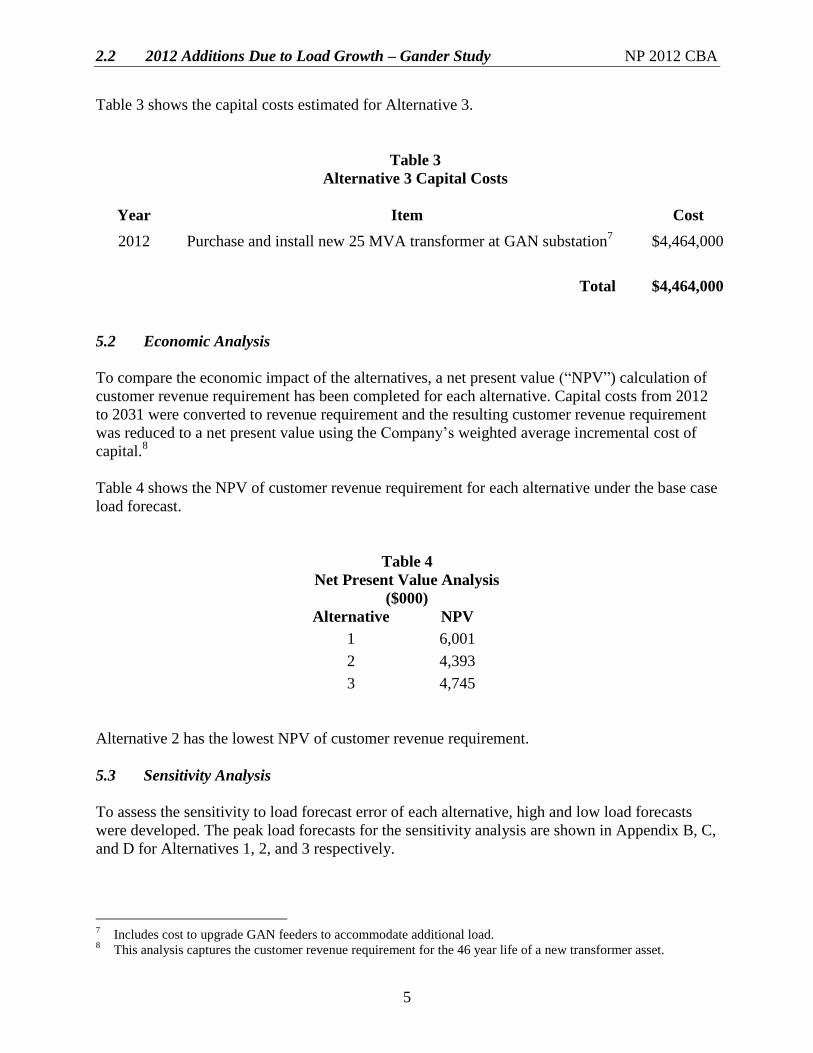
Table 3 shows the capital costs estimated for Alternative 3.
Table 3
Alternative 3 Capital Costs
Year Item Cost
2012 Purchase and install new 25 MVA transformer at GAN substation7
$4,464,000
Total $4,464,000
5.2 Economic Analysis
To compare the economic impact of the alternatives, a net present value (“NPV”) calculation of
customer revenue requirement has been completed for each alternative. Capital costs from 2012
to 2031 were converted to revenue requirement and the resulting customer revenue requirement
was reduced to a net present value using the Company’s weighted average incremental cost of
capital.8
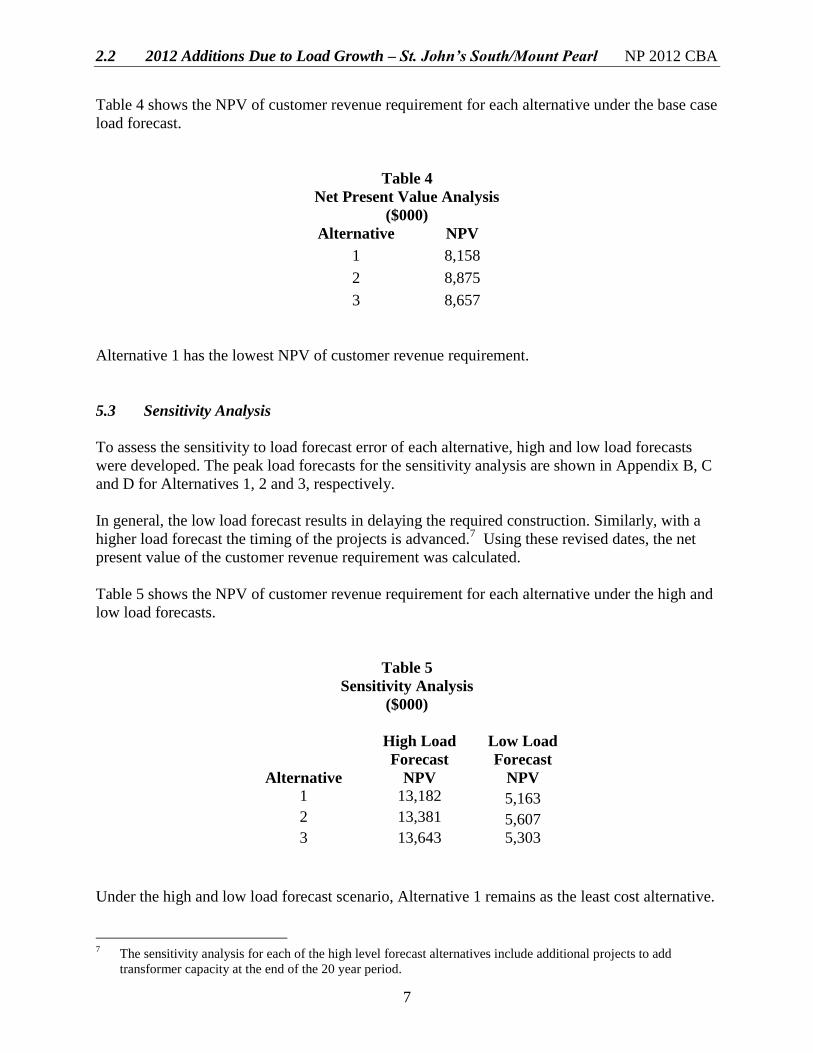
Table 4 shows the NPV of customer revenue requirement for each alternative under the base case
load forecast.
Table 4
Net Present Value Analysis
($000)
Alternative NPV
1 6,001
2 4,393
3 4,745
Alternative 2 has the lowest NPV of customer revenue requirement.
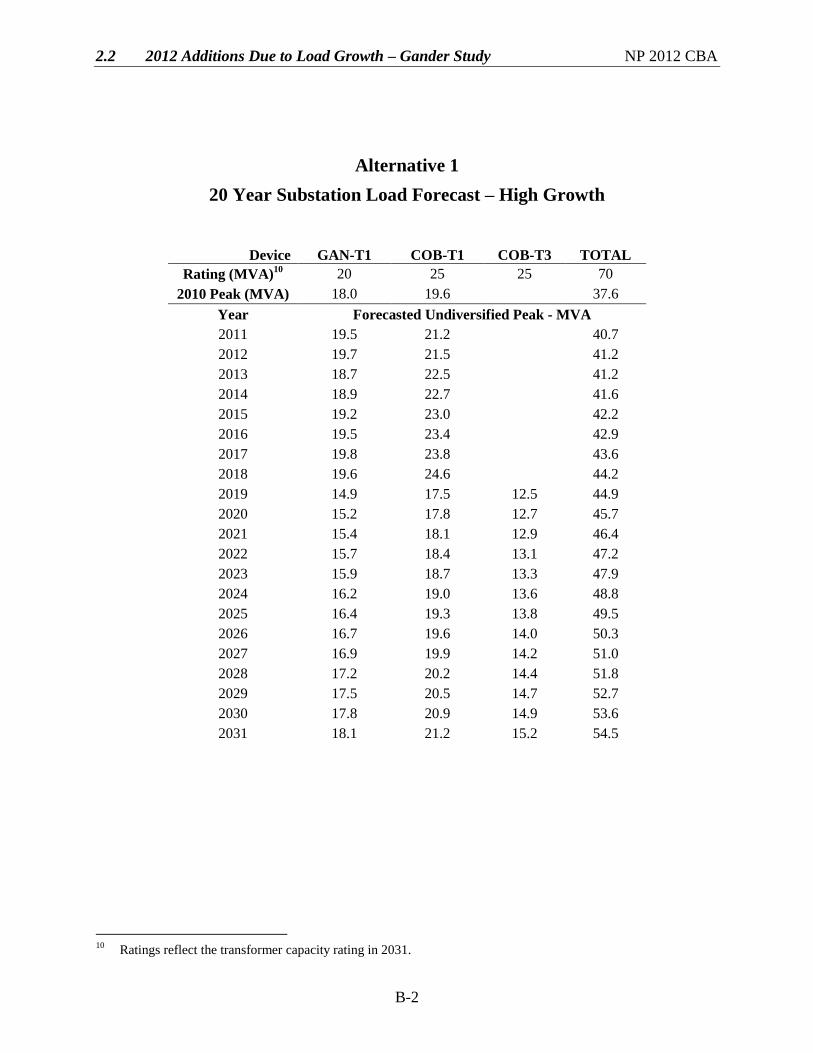
5.3 Sensitivity Analysis
To assess the sensitivity to load forecast error of each alternative, high and low load forecasts
were developed. The peak load forecasts for the sensitivity analysis are shown in Appendix B, C,
and D for Alternatives 1, 2, and 3 respectively.
7 Includes cost to upgrade GAN feeders to accommodate additional load.
8 This analysis captures the customer revenue requirement for the 46 year life of a new transformer asset.
2.2 2012 Additions Due to Load Growth – Gander Study NP 2012 CBA
6
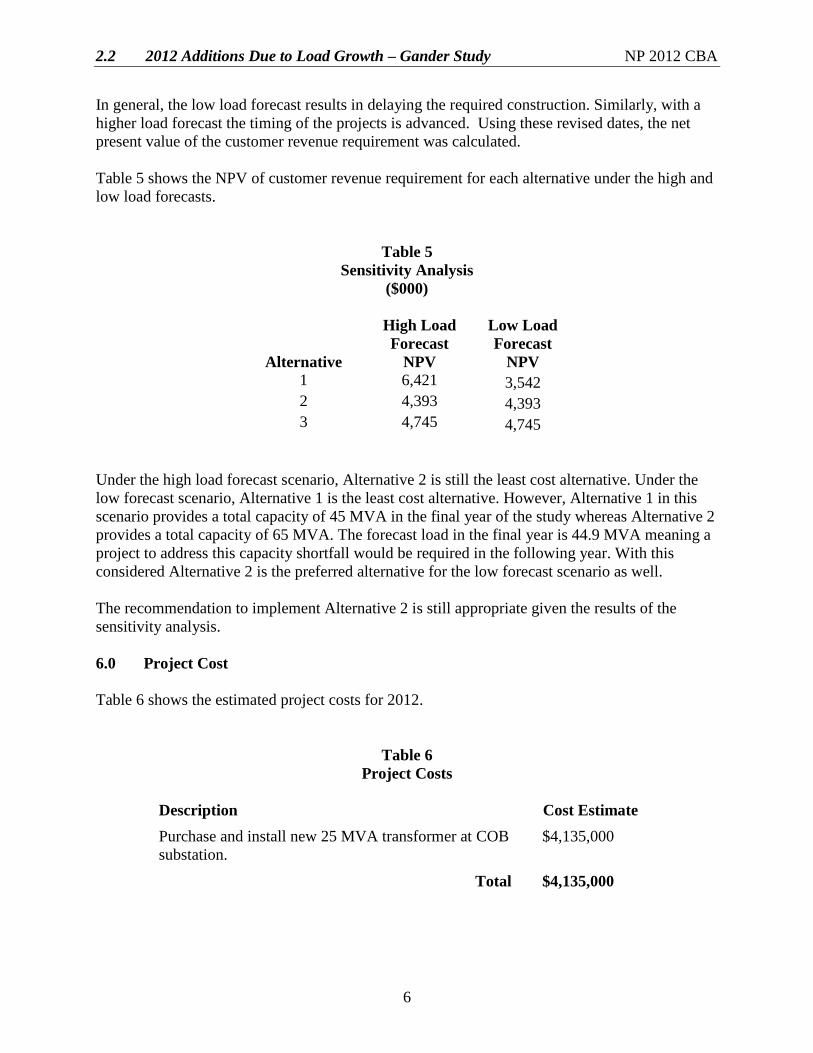
In general, the low load forecast results in delaying the required construction. Similarly, with a
higher load forecast the timing of the projects is advanced. Using these revised dates, the net
present value of the customer revenue requirement was calculated.
Table 5 shows the NPV of customer revenue requirement for each alternative under the high and
low load forecasts.
Table 5
Sensitivity Analysis
($000)
Alternative
High Load
Forecast
NPV
Low Load
Forecast
NPV
1 6,421 3,542
2 4,393 4,393
3 4,745 4,745
Under the high load forecast scenario, Alternative 2 is still the least cost alternative. Under the
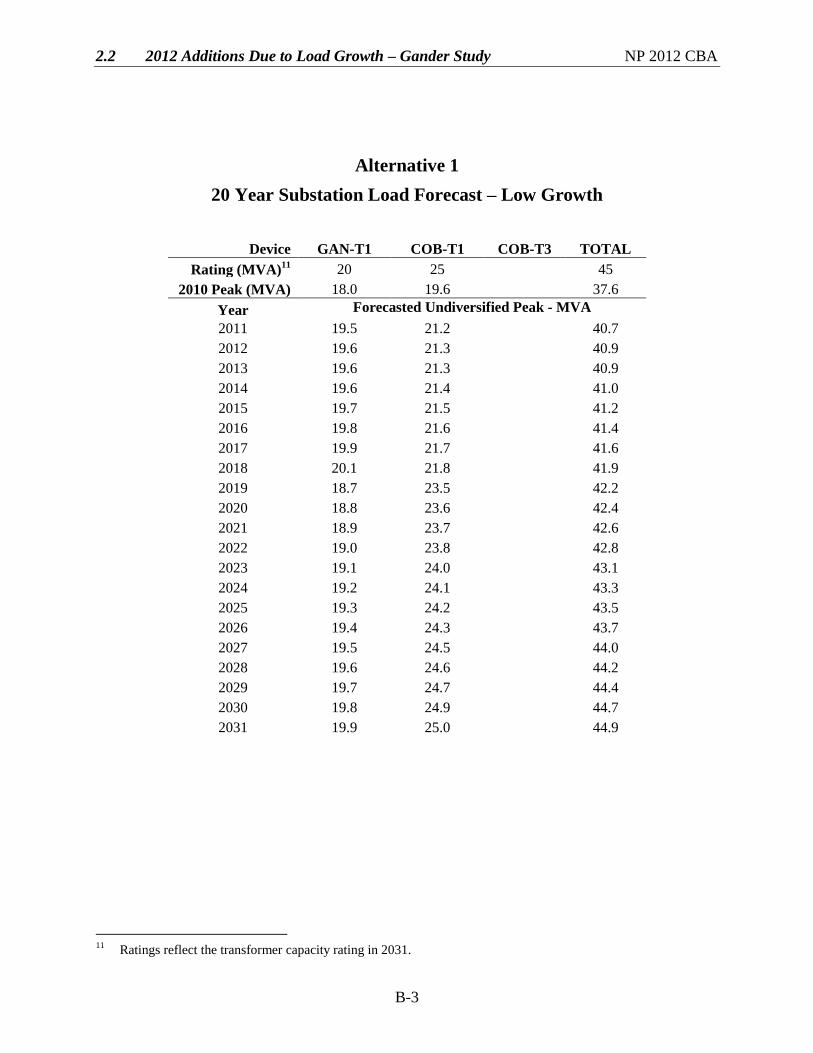
low forecast scenario, Alternative 1 is the least cost alternative. However, Alternative 1 in this
scenario provides a total capacity of 45 MVA in the final year of the study whereas Alternative 2
provides a total capacity of 65 MVA. The forecast load in the final year is 44.9 MVA meaning a
project to address this capacity shortfall would be required in the following year. With this
considered Alternative 2 is the preferred alternative for the low forecast scenario as well.
The recommendation to implement Alternative 2 is still appropriate given the results of the
sensitivity analysis.
6.0 Project Cost
Table 6 shows the estimated project costs for 2012.
Table 6
Project Costs
Description Cost Estimate
Purchase and install new 25 MVA transformer at COB
substation.
$4,135,000
Total $4,135,000
2.2 2012 Additions Due to Load Growth – Gander Study NP 2012 CBA
7
7.0 Conclusion and Recommendation
A 20-year load forecast has projected the electrical demands for the town of Gander. This
includes customers serviced from GAN and COB substations. The development and analysis of
alternatives has established a preferred expansion plan to meet the forecast needs.
The least cost alternative that meets all technical criteria is the expansion plan described in
Alternative 2.
Further, a sensitivity analysis has confirmed the recommended alternative is appropriate under
varying load growth forecasts.
The 2012 project that is part of the least cost expansion plan is to install a new 25 MVA
transformer in COB substation. This project is estimated to cost $4,135,000.
2.2 2012 Additions Due to Load Growth – Gander Study NP 2012 CBA
Appendix A
2011 Substation Load Forecast – Base Case
2.2 2012 Additions Due to Load Growth – Gander Study NP 2012 CBA
A-1
20 Year Substation Load Forecast – Base Case
Device GAN-T1 COB-T1 TOTAL
Rating (MVA) 20 20 40
2010 Peak (MVA) 18.0 19.6 37.6
Year Forecasted Undiversified Peak - MVA
2011 19.5 21.2 40.7
2012 19.7 21.4 41.1
2013 19.6 21.4 41.0
2014 19.8 21.5 41.3
2015 20.0 21.7 41.7
2016 20.2 22.0 42.2
2017 20.4 22.2 42.6
2018 20.6 22.4 43.0
2019 20.8 22.7 43.5
2020 21.1 22.9 44.0
2021 21.3 23.2 44.5
2022 21.5 23.4 44.9
2023 21.7 23.7 45.4
2024 22.0 23.9 45.9
2025 22.2 24.2 46.4
2026 22.4 24.4 46.8
2027 22.7 24.7 47.4
2028 22.9 25.0 47.9
2029 23.2 25.2 48.4
2030 23.4 25.5 48.9
2031 23.7 25.8 49.5

2.2 2012 Additions Due to Load Growth – Gander Study NP 2012 CBA
Appendix B
Alternative 1
20 Year Substation Load Forecasts
2.2 2012 Additions Due to Load Growth – Gander Study NP 2012 CBA
B-1
Alternative 1
20 Year Substation Load Forecasts – Base Case
9 Ratings reflect the transformer rating in 2031.
Device GAN-T1 COB-T1 COB-T3 TOTAL
Rating (MVA)9 20 25 25 70
2010 Peak (MVA) 18.0 19.6 37.6
Year Forecasted Undiversified Peak - MVA
2011 19.5 21.2 40.7
2012 19.7 21.4 41.1
2013 19.6 21.4 41.0
2014 19.8 21.5 41.3
2015 19.0 22.7 41.7
2016 19.2 23.0 42.2
2017 19.4 23.2 42.6
2018 19.6 23.5 43.1
2019 19.3 24.2 43.5
2020 19.5 24.5 44.0
2021 19.7 24.7 44.4
2022 17.9 12.5 14.5 44.9
2023 18.1 12.6 14.7 45.4
2024 18.3 12.8 14.8 45.9
2025 18.5 12.9 15.0 46.4
2026 18.7 13.0 15.1 46.8
2027 18.9 13.2 15.3 47.4
2028 19.1 13.3 15.5 47.9
2029 19.3 13.5 15.6 48.4
2030 19.5 13.6 15.8 48.9
2031 19.7 13.8 16.0 49.5
2.2 2012 Additions Due to Load Growth – Gander Study NP 2012 CBA
B-2
Alternative 1
20 Year Substation Load Forecast – High Growth
10
Ratings reflect the transformer capacity rating in 2031.
Device GAN-T1 COB-T1 COB-T3 TOTAL
Rating (MVA)10 20 25 25 70
2010 Peak (MVA) 18.0 19.6 37.6
Year Forecasted Undiversified Peak - MVA
2011 19.5 21.2 40.7
2012 19.7 21.5 41.2
2013 18.7 22.5 41.2
2014 18.9 22.7 41.6
2015 19.2 23.0 42.2
2016 19.5 23.4 42.9
2017 19.8 23.8 43.6
2018 19.6 24.6 44.2
2019 14.9 17.5 12.5 44.9
2020 15.2 17.8 12.7 45.7
2021 15.4 18.1 12.9 46.4
2022 15.7 18.4 13.1 47.2
2023 15.9 18.7 13.3 47.9
2024 16.2 19.0 13.6 48.8
2025 16.4 19.3 13.8 49.5
2026 16.7 19.6 14.0 50.3
2027 16.9 19.9 14.2 51.0
2028 17.2 20.2 14.4 51.8
2029 17.5 20.5 14.7 52.7
2030 17.8 20.9 14.9 53.6
2031 18.1 21.2 15.2 54.5
2.2 2012 Additions Due to Load Growth – Gander Study NP 2012 CBA
B-3
Alternative 1
20 Year Substation Load Forecast – Low Growth
11
Ratings reflect the transformer capacity rating in 2031.
Device GAN-T1 COB-T1 COB-T3 TOTAL
Rating (MVA)11 20 25 45
2010 Peak (MVA) 18.0 19.6 37.6
Year Forecasted Undiversified Peak - MVA
2011 19.5 21.2 40.7
2012 19.6 21.3 40.9
2013 19.6 21.3 40.9
2014 19.6 21.4 41.0
2015 19.7 21.5 41.2
2016 19.8 21.6 41.4
2017 19.9 21.7 41.6
2018 20.1 21.8 41.9
2019 18.7 23.5 42.2
2020 18.8 23.6 42.4
2021 18.9 23.7 42.6
2022 19.0 23.8 42.8
2023 19.1 24.0 43.1
2024 19.2 24.1 43.3
2025 19.3 24.2 43.5
2026 19.4 24.3 43.7
2027 19.5 24.5 44.0
2028 19.6 24.6 44.2
2029 19.7 24.7 44.4
2030 19.8 24.9 44.7
2031 19.9 25.0 44.9

2.2 2012 Additions Due to Load Growth – Gander Study NP 2012 CBA
Appendix C
Alternative 2
20 Year Substation Load Forecasts
2.2 2012 Additions Due to Load Growth – Gander Study NP 2012 CBA
C-1
Alternative 2
20 Year Substation Load Forecast – Base Case
12
Ratings reflect the transformer capacity rating in 2031.
Device GAN-T1 COB-T1 COB-T3 TOTAL
Rating (MVA)12 20 20 25 65
2010 Peak (MVA) 18.0 19.6 37.6
Year Forecasted Undiversified Peak - MVA
2011 19.5 21.2 40.7
2012 16.7 11.4 13.0 41.1
2013 16.6 11.4 13.0 41.0
2014 16.7 11.5 13.1 41.3
2015 15.9 12.6 13.2 41.7
2016 16.1 12.7 13.3 42.1
2017 16.3 12.9 13.5 42.7
2018 16.4 13.0 13.6 43.0
2019 16.6 13.1 13.8 43.5
2020 16.8 13.3 13.9 44.0
2021 17.0 13.4 14.1 44.5
2022 17.1 13.6 14.2 44.9
2023 17.3 13.7 14.4 45.4
2024 17.5 13.8 14.5 45.8
2025 17.7 14.0 14.7 46.4
2026 17.9 14.1 14.8 46.8
2027 18.1 14.3 15.0 47.4
2028 18.3 14.5 15.2 47.9
2029 18.5 14.6 15.3 48.0
2030 18.7 14.8 15.5 49.0
2031 18.9 14.9 15.6 49.4
2.2 2012 Additions Due to Load Growth – Gander Study NP 2012 CBA
C-2
Alternative 2
20 Year Substation Load Forecast – High Growth
13
Ratings reflect the transformer capacity rating in 2031.
Device GAN-T1 COB-T1 COB-T3 TOTAL
Rating (MVA)13 20 20 25 65
2010 Peak (MVA) 18.0 19.6 37.6
Year Forecasted Undiversified Peak - MVA
2011 19.5 21.2 40.7
2012 14.7 10.7 15.7 41.1
2013 14.7 10.7 15.7 41.1
2014 14.9 10.8 15.9 41.6
2015 15.1 11.0 16.1 42.2
2016 15.3 11.2 16.4 42.9
2017 15.6 11.4 16.6 43.6
2018 15.8 11.5 16.9 44.2
2019 16.1 11.7 17.2 45.0
2020 16.3 11.9 17.4 45.6
2021 16.6 12.1 17.7 46.4
2022 16.9 12.3 18.0 47.2
2023 17.1 12.5 18.3 47.9
2024 17.4 12.7 18.6 48.7
2025 17.7 12.9 18.9 49.5
2026 18.0 13.1 19.2 50.3
2027 18.3 13.3 19.5 51.1
2028 18.5 13.5 19.8 51.8
2029 18.8 13.7 20.1 52.6
2030 19.1 14.0 20.5 53.6
2031 19.5 14.2 20.8 54.5
2.2 2012 Additions Due to Load Growth – Gander Study NP 2012 CBA
C-3
Alternative 2
20 Year Substation Load Forecast – Low Growth
14
Ratings reflect the transformer capacity rating in 2031.
Device GAN-T1 COB-T1 COB-T3 TOTAL
Rating (MVA)14 20 20 25 65
2010 Peak (MVA) 18.0 19.6 37.6
Year Forecasted Undiversified Peak - MVA
2011 19.5 21.2 40.7
2012 19.6 10.7 10.7 41.0
2013 19.6 10.7 10.7 41.0
2014 19.6 10.7 10.7 41.0
2015 19.7 10.7 10.7 41.1
2016 19.8 10.8 10.8 41.4
2017 19.9 10.9 10.9 41.7
2018 20.1 10.9 10.9 41.9
2019 18.7 12.5 11.0 42.2
2020 18.8 12.5 11.0 42.3
2021 18.9 12.6 11.1 42.6
2022 19.0 12.7 11.2 42.9
2023 19.1 12.7 11.2 43.0
2024 19.2 12.8 11.3 43.3
2025 19.3 12.9 11.3 43.5
2026 19.4 13.0 11.4 43.8
2027 19.5 13.0 11.5 44.0
2028 19.6 13.1 11.5 44.2
2029 19.7 13.2 11.6 44.5
2030 19.8 13.2 11.6 44.6
2031 19.9 13.3 11.7 44.9

2.2 2012 Additions Due to Load Growth – Gander Study NP 2012 CBA
Appendix D
Alternative 3
20 Year Substation Load Forecasts
2.2 2012 Additions Due to Load Growth – Gander Study NP 2012 CBA
D-1
Alternative 3
20 Year Substation Load Forecasts – Base Case
15
Ratings reflect the transformer capacity rating in 2031.
Device GAN-T1 GAN-T4 COB-T1 TOTAL
Rating (MVA)15 20 25 20 65
2010 Peak (MVA) 18.0
19.6 37.6
Year Forecasted Undiversified Peak - MVA
2011 19.5
21.2 40.7
2012 11.8 10.8 18.4 41.0
2013 11.8 10.8 18.4 41.0
2014 11.9 10.9 18.5 41.3
2015 11.0 11.0 19.7 41.7
2016 11.1 11.1 19.9 42.1
2017 11.3 13.2 18.1 42.6
2018 11.4 13.4 18.3 43.1
2019 11.0 13.5 19.0 43.5
2020 11.1 13.7 19.2 44.0
2021 11.2 13.8 19.4 44.4
2022 11.3 14.0 19.6 44.9
2023 11.5 14.1 19.8 45.4
2024 11.6 14.3 20.0 45.9
2025 11.7 16.4 18.3 46.4
2026 11.8 16.6 18.5 46.9
2027 12.0 16.8 18.7 47.5
2028 12.1 16.9 18.8 47.8
2029 12.2 17.1 19.1 48.4
2030 12.4 17.3 19.3 49.0
2031 12.5 17.5 19.5 49.5
2.2 2012 Additions Due to Load Growth – Gander Study NP 2012 CBA
D-2
Alternative 3
20 Year Substation Load Forecast – High Growth
16
Ratings reflect the transformer capacity rating in 2031.
Device GAN-T1 GAN-T4 COB-T1 TOTAL
Rating (MVA)16 20 25 20 65
2010 Peak (MVA) 18.0
19.6 37.6
Year Forecasted Undiversified Peak - MVA
2011 19.5
21.2 40.7
2012 10.4 12.4 18.5 41.3
2013 10.4 12.3 18.5 41.2
2014 10.4 12.5 18.6 41.5
2015 10.6 12.7 18.9 42.2
2016 10.8 12.9 19.2 42.9
2017 11.0 13.1 19.5 43.6
2018 13.1 11.3 19.8 44.2
2019 13.3 13.5 18.2 45.0
2020 13.6 13.7 18.5 45.8
2021 13.8 13.9 18.8 46.5
2022 14.0 14.1 19.1 47.2
2023 14.2 14.3 19.4 47.9
2024 14.4 14.6 19.7 48.7
2025 16.7 14.8 18.0 49.5
2026 16.9 15.0 18.3 50.2
2027 17.2 15.3 18.6 51.1
2028 17.5 15.5 18.9 51.9
2029 17.8 15.8 19.2 52.8
2030 18.1 16.0 19.5 53.6
2031 18.3 16.3 19.8 54.4
2.2 2012 Additions Due to Load Growth – Gander Study NP 2012 CBA
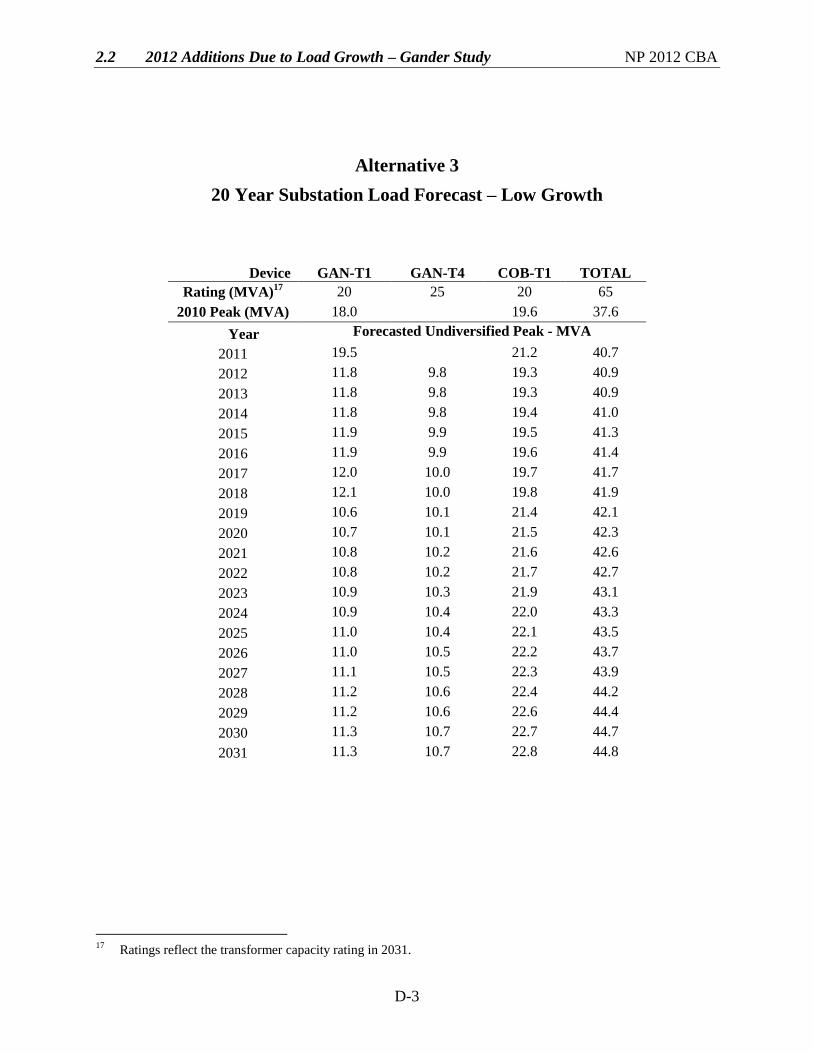
D-3
Alternative 3
20 Year Substation Load Forecast – Low Growth
17
Ratings reflect the transformer capacity rating in 2031.
Device GAN-T1 GAN-T4 COB-T1 TOTAL
Rating (MVA)17 20 25 20 65
2010 Peak (MVA) 18.0
19.6 37.6
Year Forecasted Undiversified Peak - MVA
2011 19.5
21.2 40.7
2012 11.8 9.8 19.3 40.9
2013 11.8 9.8 19.3 40.9
2014 11.8 9.8 19.4 41.0
2015 11.9 9.9 19.5 41.3
2016 11.9 9.9 19.6 41.4
2017 12.0 10.0 19.7 41.7
2018 12.1 10.0 19.8 41.9
2019 10.6 10.1 21.4 42.1
2020 10.7 10.1 21.5 42.3
2021 10.8 10.2 21.6 42.6
2022 10.8 10.2 21.7 42.7
2023 10.9 10.3 21.9 43.1
2024 10.9 10.4 22.0 43.3
2025 11.0 10.4 22.1 43.5
2026 11.0 10.5 22.2 43.7
2027 11.1 10.5 22.3 43.9
2028 11.2 10.6 22.4 44.2
2029 11.2 10.6 22.6 44.4
2030 11.3 10.7 22.7 44.7
2031 11.3 10.7 22.8 44.8

2.2 2012 Additions Due to Load Growth – St. John’s South/Mount Pearl NP 2012 CBA
Attachment B
St. John’s South/Mount Pearl Study
2.2 2012 Additions Due to Load Growth – St. John’s South/Mount Pearl NP 2012 CBA
i
Table of Contents
Page
1.0 Introduction ....................................................................................................................... 1
2.0 Description of Existing System ........................................................................................ 1
2.1 HWD Substation ................................................................................................... 1
2.2 GDL Substation ................................................................................................... 1
2.3 GOU Substation .................................................................................................... 1
3.0 Load Forecast .................................................................................................................... 2
4.0 Development of Alternatives ............................................................................................ 2
4.1 Alternative 1.......................................................................................................... 2
4.2 Alternative 2.......................................................................................................... 3
4.3 Alternative 3.......................................................................................................... 3
5.0 Evaluation of Alternatives ................................................................................................ 4
5.1 Cost of Alternatives .............................................................................................. 4
5.2 Economic Analysis ............................................................................................... 6
5.3 Sensitivity Analysis .............................................................................................. 7
6.0 Project Cost ....................................................................................................................... 8
7.0 Conclusion and Recommendation ................................................................................... 8
Appendix A: 2011 Substation Load Forecast – Base Case
Appendix B: Alternative #1 20 Year Substation Load Forecast
Appendix C: Alternative #2 20 Year Substation Load Forecast
Appendix D: Alternative #3 20 Year Substation Load Forecast
2.2 2012 Additions Due to Load Growth – St. John’s South/Mount Pearl NP 2012 CBA
1
1.0 Introduction
The purpose of this study is to determine the distribution system alternative that best meets the
electrical demands of the St. John’s South/Mount Pearl area. This area includes customers
serviced from Hardwoods (“HWD”), Glendale (“GDL”) and Goulds (“GOU”) substations.
In 2013, the distribution power transformers supplying the area are forecast to experience a total
peak load of 120.4 MVA compared to a total capacity of 123.3 MVA.1 The 2011 load forecast
indicates that HWD-T1, HWD-T2, GOU-T2 and GOU-T3 will overload by 2013. Load growth
on these transformers is primarily the result of an increase in residential and commercial
development in the area. There is also a 2 MVA load increase on GOU as a result of a new
Water Treatment Plant at Petty Harbour Long Pond scheduled to go into service in late 2011.
This report identifies the capital project(s) required to avoid the 2013 forecast overload at HWD
and GOU by determining the least cost expansion plan required to meet a 20 year load forecast.
2.0 Description of Existing System
2.1 HWD Substation
HWD substation is located in the town of Paradise. There are three transformers located in the
substation. HWD-T3 is a 25 MVA rated transformers used to convert 66 kV transmission voltage
to 25 kV distribution voltage. 2
HWD-T1 and HWD-T2 are both 20 MVA rated transformers
used to convert 66 kV transmission voltage to 12.5 kV distribution voltage and supply customers
on five distribution feeders through HWD substation servicing 4,635 customers in the Town of
Paradise and the City of Mount Pearl.
2.2 GDL Substation
GDL substation is located on Emerald Drive in the City of Mount Pearl. There are two
transformers located in the substation, GDL-T1 and GDL-T2. Both transformers are rated 25
MVA and are used to convert 66 kV transmission voltage to 12.5 kV distribution voltage and
supply customers on six distribution feeders through GDL substation servicing 6,422 customers
in the City of Mount Pearl.
2.3 GOU Substation
GOU substation is located in community of Goulds in the City of St. John’s. There are three
transformers located in the substation. GOU-T1 is a step-up transformer used to convert 33 kV
generation voltage from the Petty Harbour Generating Plant to 66 kV transmission voltage.3
GOU-T2 is a 20 MVA rated transformer and GOU-T3 is a 13.3 MVA rated transformer. Both
are used to convert 66 kV transmission voltage to 12.5 kV distribution voltage and supply
1 A distribution power transformer converts electricity from transmission voltages (typically 66 kV) to
distribution primary (voltages typically between 4kV and 25kV). 2 The two 25 kV feeders originating from HWD substation do not interconnect with the 12.5kV feeders at HWD,
GDL or GOU and therefore HWD-T3 is not included in this report. 3 GOU-T1 is not included in this report.
2.2 2012 Additions Due to Load Growth – St. John’s South/Mount Pearl NP 2012 CBA
2
customers on three distribution feeders through GOU substation servicing 4,456 customers in the
Goulds and Kilbride areas of the City of St. John’s.
3.0 Load Forecast
The following are the forecast peak substation transformer loads expected in 2013.
HWD-T1 and HWD-T2 are rated at 20 MVA. The load on each transformer is forecast
to peak at 20.1 MVA in 2013.
GDL-T1 and GDL-T2 are both rated at 25 MVA. The load on each transformer is
forecast to peak at 22.4 MVA in 2013.
GOU-T2 is rated at 20 MVA. The load on this transformer is forecast to peak at 21.4
MVA in 2013.
GOU-T3 is rated at 13.3 MVA. The load on this transformer is forecast to peak at 14
MVA in 2013.
This study uses a 20 year load forecast for these power transformers. The base case 20 year
substation forecast for HWD-T1, HWD-T2, GDL-T1, GDL-T2, GOU-T2, and GOU-T3 is
located in Appendix A. A high and low load growth forecast has also been created for each
alternative for use in a sensitivity analysis. With the exception of the first year forecast, the
sensitivities are based on increasing the load growth by a factor of 50% for the high forecast and
decreasing by a factor of 50% for the low forecast.
4.0 Development of Alternatives
Three alternatives have been developed to eliminate the forecast overload conditions using a set
of defined technical criteria.4 These alternatives will provide sufficient capacity to meet forecast
loads over the next 20 years.
Each alternative contains estimates for all costs involved, including transformers, new feeders
and load transfers. The results of a net present value calculation are provided for each alternative.
4.1 Alternative 1
New 25 MVA, 66/12.5 kV transformer at GDL substation to increase the total 12.5 kV
transformer capacity to 75 MVA in 2013.
Two new distribution feeders from GDL to complete load transfers from GOU to GDL
and HWD to GDL in 2013.
New 20 MVA, 66/12.5 kV transformer at HWD substation to increase the total 12.5 kV
transformer capacity to 60 MVA in 2028.
4 The following technical criteria were applied:
The steady state power transformer loading should not exceed the nameplate rating.
The minimum steady state feeder voltage should not fall below 116 Volts (on a 120 Volt base).
The feeder normal peak loading should be sufficient to permit cold load pickup.
The conductor loading should not exceed the ampacity rating established in the distribution planning
guidelines.
2.2 2012 Additions Due to Load Growth – St. John’s South/Mount Pearl NP 2012 CBA
3
New distribution feeder from HWD substation to complete load transfers from GDL to
HWD in 2028.
The resulting peak load forecasts for each transformer under Alternative 1 are shown in
Appendix B.
4.2 Alternative 2
New 20 MVA power transformer at GOU substation to replace existing 13.3 MVA unit
to increase the total 12.5 kV transformer capacity to 40 MVA in 2013.
New distribution feeder from GOU substation in 2013.
New 25 MVA, 66/25 kV transformer at GDL substation to increase the total 12.5 kV
transformer capacity to 75 MVA in 2019.
Two new distribution feeders from GDL to complete load transfers from MOL to GDL
and HWD to GDL in 2019.
New 20 MVA, 66/12.5 kV transformer at HWD substation to increase the total 12.5 kV
transformer capacity to 60 MVA in 2029.
The resulting peak load forecasts for each transformer under Alternative 2 are shown in
Appendix C.
4.3 Alternative 3
New 20 MVA power transformer at HWD substation to increase the total 12.5 kV
transformer capacity to 60 MVA in 2013.
New distribution feeder from HWD substation to complete load transfers from GDL to
HWD in 2013.
New distribution feeder from GDL substation to complete load transfers from GOU to
GDL in 2013.
New 25 MVA, 66/25 kV transformer at GDL substation to increase the total 12.5 kV
transformer capacity to 75 MVA in 2025.
New distribution feeder from GDL to complete load transfers from MOL to GDL in
2025.
The resulting peak load forecasts for each transformer under Alternative 1 are shown in
Appendix D.
2.2 2012 Additions Due to Load Growth – St. John’s South/Mount Pearl NP 2012 CBA
4
5.0 Evaluation of Alternatives
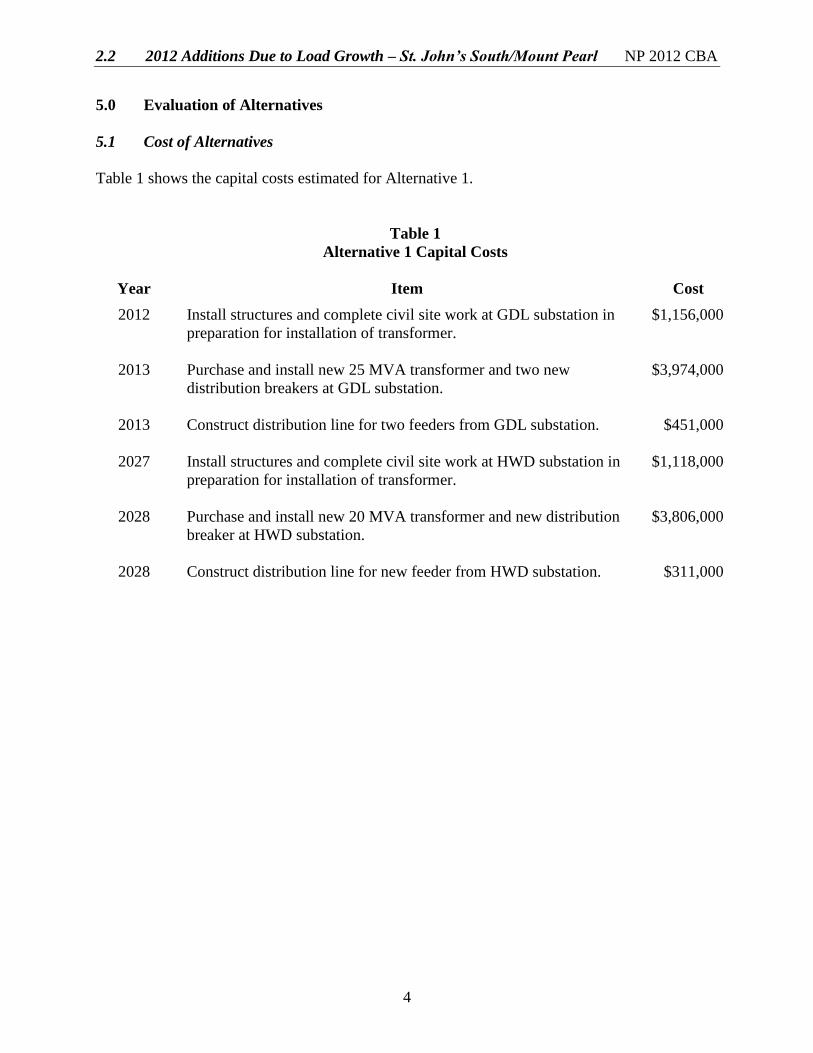
5.1 Cost of Alternatives
Table 1 shows the capital costs estimated for Alternative 1.
Table 1
Alternative 1 Capital Costs
Year Item Cost
2012
Install structures and complete civil site work at GDL substation in
preparation for installation of transformer.
$1,156,000
2013 Purchase and install new 25 MVA transformer and two new
distribution breakers at GDL substation.
$3,974,000
2013 Construct distribution line for two feeders from GDL substation.
$451,000
2027
Install structures and complete civil site work at HWD substation in
preparation for installation of transformer.
$1,118,000
2028
Purchase and install new 20 MVA transformer and new distribution
breaker at HWD substation.
$3,806,000
2028
Construct distribution line for new feeder from HWD substation. $311,000
2.2 2012 Additions Due to Load Growth – St. John’s South/Mount Pearl NP 2012 CBA
5
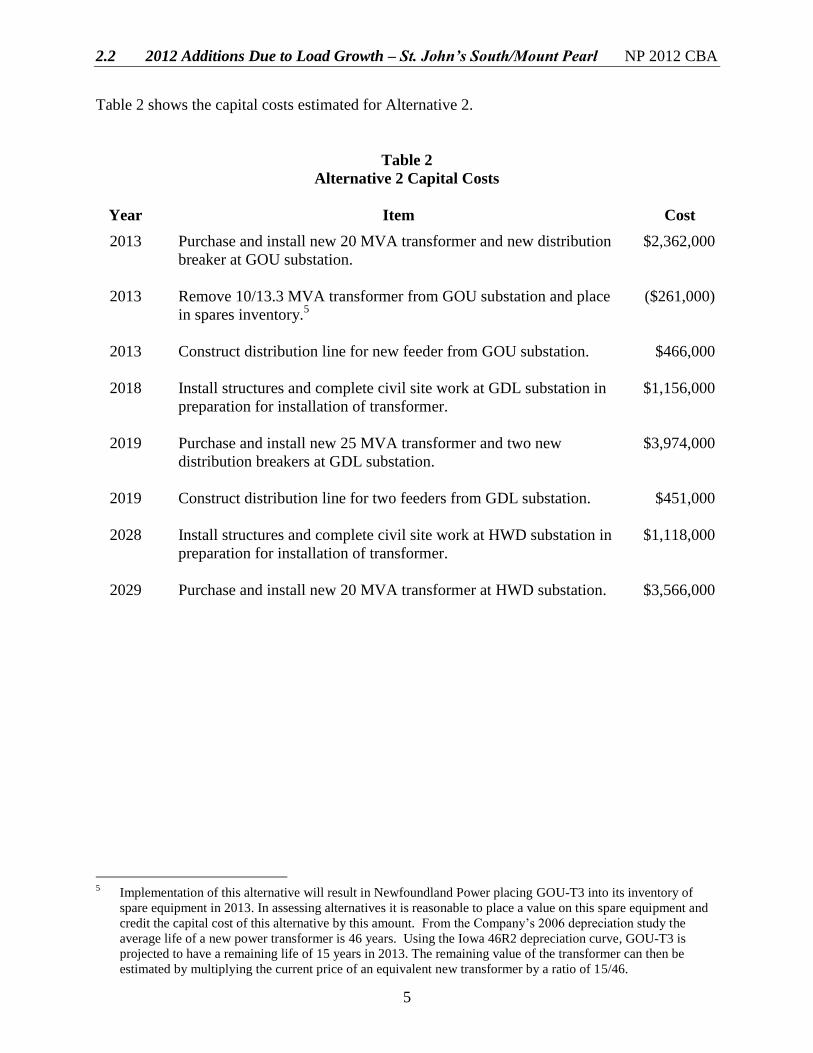
Table 2 shows the capital costs estimated for Alternative 2.
Table 2
Alternative 2 Capital Costs
Year Item Cost
2013 Purchase and install new 20 MVA transformer and new distribution
breaker at GOU substation.
$2,362,000
2013 Remove 10/13.3 MVA transformer from GOU substation and place
in spares inventory.5
($261,000)
2013 Construct distribution line for new feeder from GOU substation.
$466,000
2018
Install structures and complete civil site work at GDL substation in
preparation for installation of transformer.
$1,156,000
2019 Purchase and install new 25 MVA transformer and two new
distribution breakers at GDL substation.
$3,974,000
2019 Construct distribution line for two feeders from GDL substation.
$451,000
2028 Install structures and complete civil site work at HWD substation in
preparation for installation of transformer.
$1,118,000
2029 Purchase and install new 20 MVA transformer at HWD substation. $3,566,000
5 Implementation of this alternative will result in Newfoundland Power placing GOU-T3 into its inventory of
spare equipment in 2013. In assessing alternatives it is reasonable to place a value on this spare equipment and
credit the capital cost of this alternative by this amount. From the Company’s 2006 depreciation study the
average life of a new power transformer is 46 years. Using the Iowa 46R2 depreciation curve, GOU-T3 is
projected to have a remaining life of 15 years in 2013. The remaining value of the transformer can then be
estimated by multiplying the current price of an equivalent new transformer by a ratio of 15/46.
2.2 2012 Additions Due to Load Growth – St. John’s South/Mount Pearl NP 2012 CBA
6
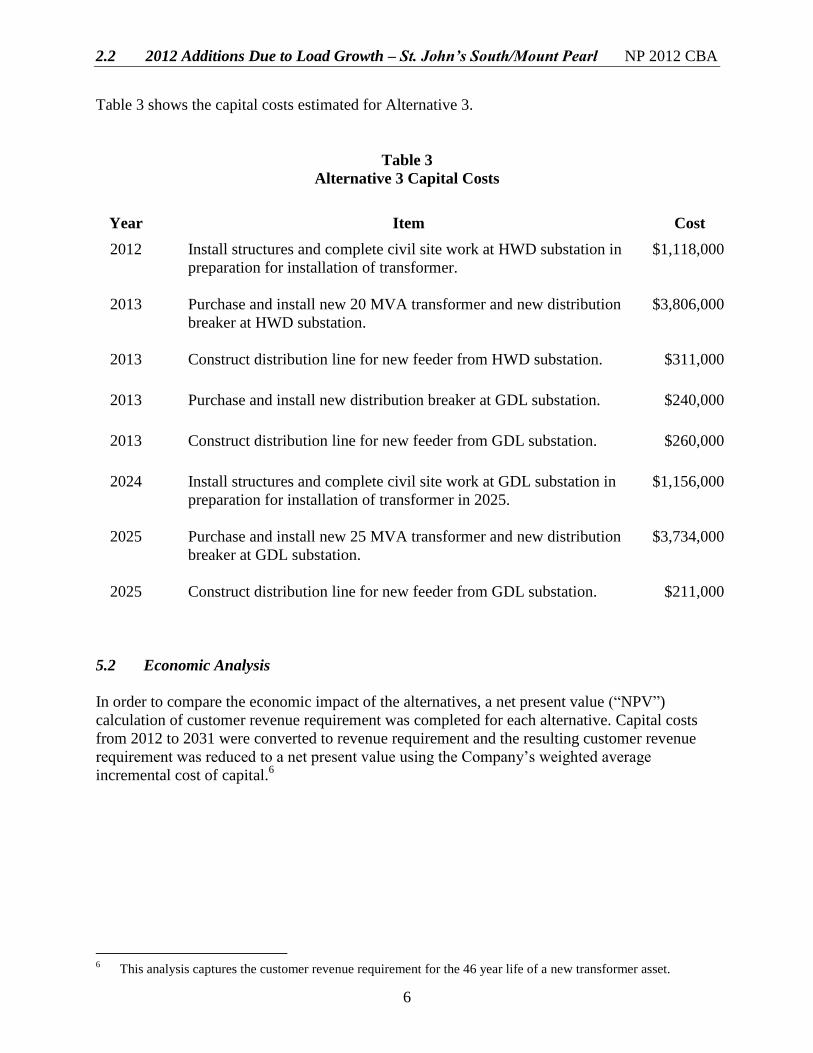
Table 3 shows the capital costs estimated for Alternative 3.
Table 3
Alternative 3 Capital Costs
Year Item Cost
2012 Install structures and complete civil site work at HWD substation in
preparation for installation of transformer.
$1,118,000
2013 Purchase and install new 20 MVA transformer and new distribution
breaker at HWD substation.
$3,806,000
2013
Construct distribution line for new feeder from HWD substation. $311,000
2013
Purchase and install new distribution breaker at GDL substation.
$240,000
2013
Construct distribution line for new feeder from GDL substation. $260,000
2024
Install structures and complete civil site work at GDL substation in
preparation for installation of transformer in 2025.
$1,156,000
2025 Purchase and install new 25 MVA transformer and new distribution
breaker at GDL substation.
$3,734,000
2025 Construct distribution line for new feeder from GDL substation.
$211,000
5.2 Economic Analysis
In order to compare the economic impact of the alternatives, a net present value (“NPV”)
calculation of customer revenue requirement was completed for each alternative. Capital costs
from 2012 to 2031 were converted to revenue requirement and the resulting customer revenue
requirement was reduced to a net present value using the Company’s weighted average
incremental cost of capital.6
6 This analysis captures the customer revenue requirement for the 46 year life of a new transformer asset.
2.2 2012 Additions Due to Load Growth – St. John’s South/Mount Pearl NP 2012 CBA
7
Table 4 shows the NPV of customer revenue requirement for each alternative under the base case
load forecast.
Table 4
Net Present Value Analysis
($000)
Alternative NPV
1 8,158
2 8,875
3 8,657
Alternative 1 has the lowest NPV of customer revenue requirement.
5.3 Sensitivity Analysis
To assess the sensitivity to load forecast error of each alternative, high and low load forecasts
were developed. The peak load forecasts for the sensitivity analysis are shown in Appendix B, C
and D for Alternatives 1, 2 and 3, respectively.
In general, the low load forecast results in delaying the required construction. Similarly, with a
higher load forecast the timing of the projects is advanced.7 Using these revised dates, the net
present value of the customer revenue requirement was calculated.
Table 5 shows the NPV of customer revenue requirement for each alternative under the high and
low load forecasts.
Table 5
Sensitivity Analysis
($000)
Alternative
High Load
Forecast
NPV
Low Load
Forecast
NPV
1 13,182 5,163
2 13,381 5,607
3 13,643 5,303
Under the high and low load forecast scenario, Alternative 1 remains as the least cost alternative.
7 The sensitivity analysis for each of the high level forecast alternatives include additional projects to add
transformer capacity at the end of the 20 year period.
2.2 2012 Additions Due to Load Growth – St. John’s South/Mount Pearl NP 2012 CBA
8
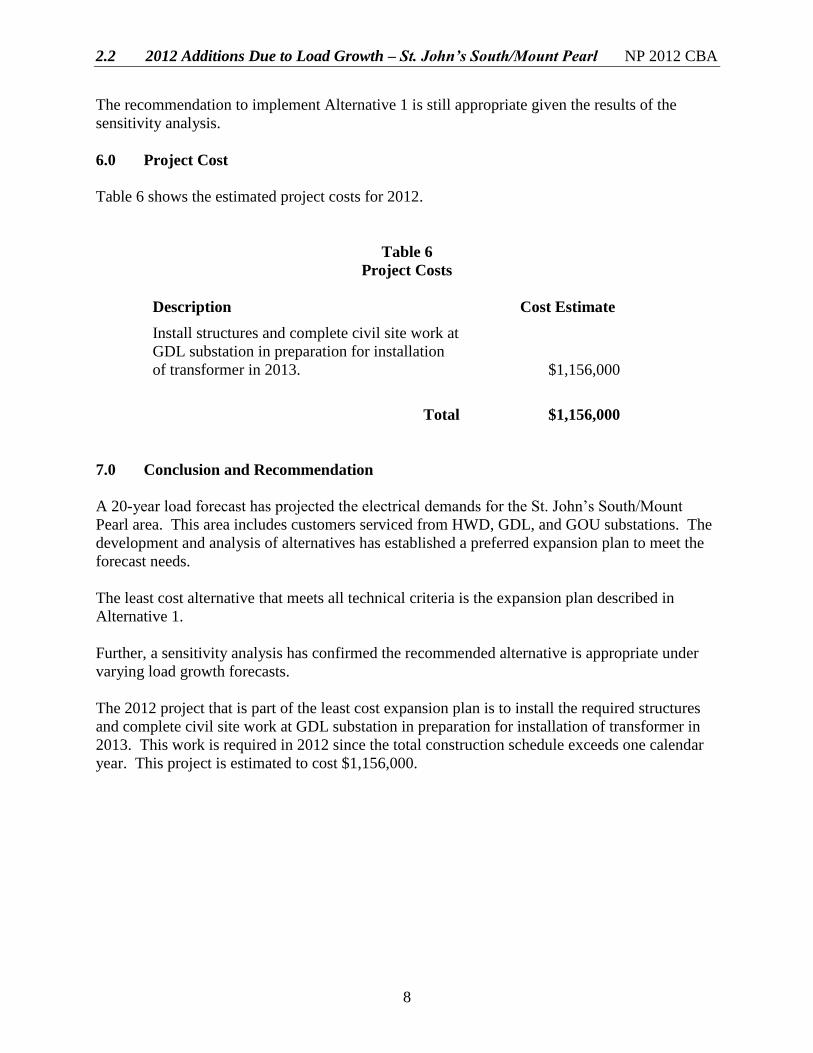
The recommendation to implement Alternative 1 is still appropriate given the results of the
sensitivity analysis.
6.0 Project Cost
Table 6 shows the estimated project costs for 2012.
Table 6
Project Costs
Description Cost Estimate
Install structures and complete civil site work at
GDL substation in preparation for installation
of transformer in 2013.
$1,156,000
Total $1,156,000
7.0 Conclusion and Recommendation
A 20-year load forecast has projected the electrical demands for the St. John’s South/Mount
Pearl area. This area includes customers serviced from HWD, GDL, and GOU substations. The
development and analysis of alternatives has established a preferred expansion plan to meet the
forecast needs.
The least cost alternative that meets all technical criteria is the expansion plan described in
Alternative 1.
Further, a sensitivity analysis has confirmed the recommended alternative is appropriate under
varying load growth forecasts.
The 2012 project that is part of the least cost expansion plan is to install the required structures
and complete civil site work at GDL substation in preparation for installation of transformer in
2013. This work is required in 2012 since the total construction schedule exceeds one calendar
year. This project is estimated to cost $1,156,000.
2.2 2012 Additions Due to Load Growth – St. John’s South/Mount Pearl NP 2012 CBA
Appendix A
2011 Substation Load Forecast – Base Case
2.2 2012 Additions Due to Load Growth – St. John’s South/Mount Pearl NP 2012 CBA
A-1
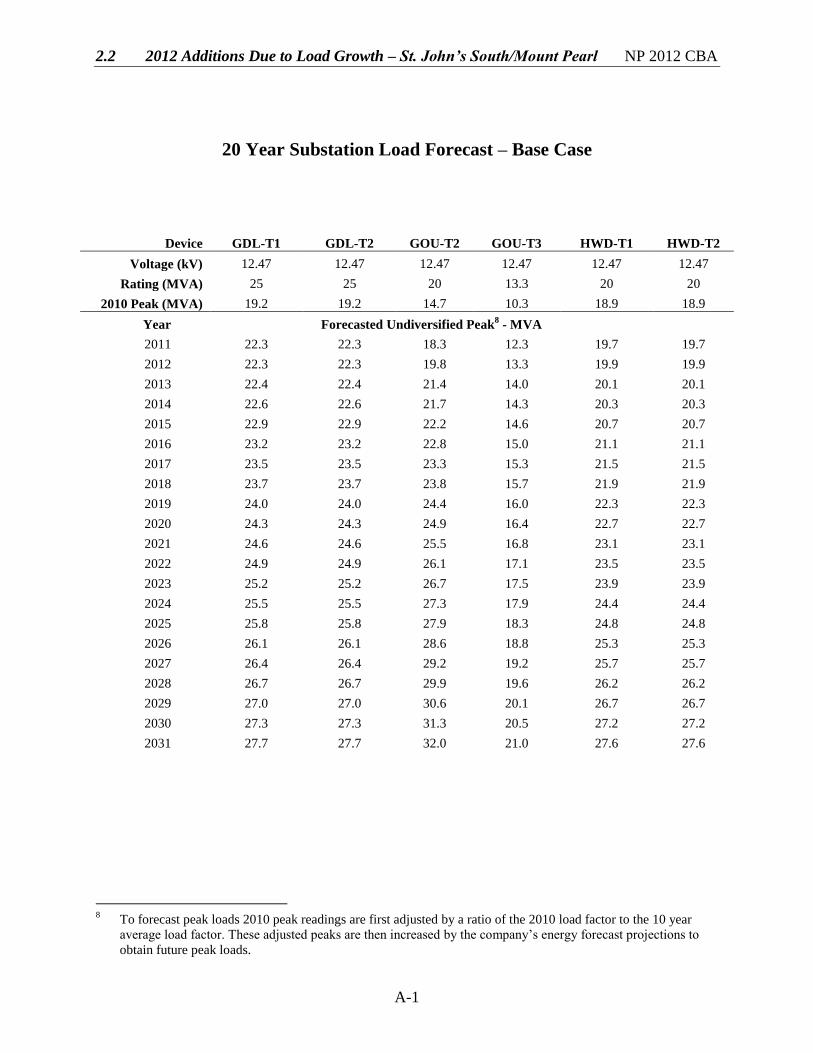
20 Year Substation Load Forecast – Base Case
8 To forecast peak loads 2010 peak readings are first adjusted by a ratio of the 2010 load factor to the 10 year
average load factor. These adjusted peaks are then increased by the company’s energy forecast projections to
obtain future peak loads.
Device GDL-T1 GDL-T2 GOU-T2 GOU-T3 HWD-T1 HWD-T2
Voltage (kV) 12.47 12.47 12.47 12.47 12.47 12.47
Rating (MVA) 25 25 20 13.3 20 20
2010 Peak (MVA) 19.2 19.2 14.7 10.3 18.9 18.9
Year Forecasted Undiversified Peak8 - MVA
2011 22.3 22.3 18.3 12.3 19.7 19.7
2012 22.3 22.3 19.8 13.3 19.9 19.9
2013 22.4 22.4 21.4 14.0 20.1 20.1
2014 22.6 22.6 21.7 14.3 20.3 20.3
2015 22.9 22.9 22.2 14.6 20.7 20.7
2016 23.2 23.2 22.8 15.0 21.1 21.1
2017 23.5 23.5 23.3 15.3 21.5 21.5
2018 23.7 23.7 23.8 15.7 21.9 21.9
2019 24.0 24.0 24.4 16.0 22.3 22.3
2020 24.3 24.3 24.9 16.4 22.7 22.7
2021 24.6 24.6 25.5 16.8 23.1 23.1
2022 24.9 24.9 26.1 17.1 23.5 23.5
2023 25.2 25.2 26.7 17.5 23.9 23.9
2024 25.5 25.5 27.3 17.9 24.4 24.4
2025 25.8 25.8 27.9 18.3 24.8 24.8
2026 26.1 26.1 28.6 18.8 25.3 25.3
2027 26.4 26.4 29.2 19.2 25.7 25.7
2028 26.7 26.7 29.9 19.6 26.2 26.2
2029 27.0 27.0 30.6 20.1 26.7 26.7
2030 27.3 27.3 31.3 20.5 27.2 27.2
2031 27.7 27.7 32.0 21.0 27.6 27.6

2.2 2012 Additions Due to Load Growth – St. John’s South/Mount Pearl NP 2012 CBA
Appendix B
Alternative 1
20 Year Substation Load Forecasts
2.2 2012 Additions Due to Load Growth – St. John’s South/Mount Pearl NP 2012 CBA
B-1
Alternative 1
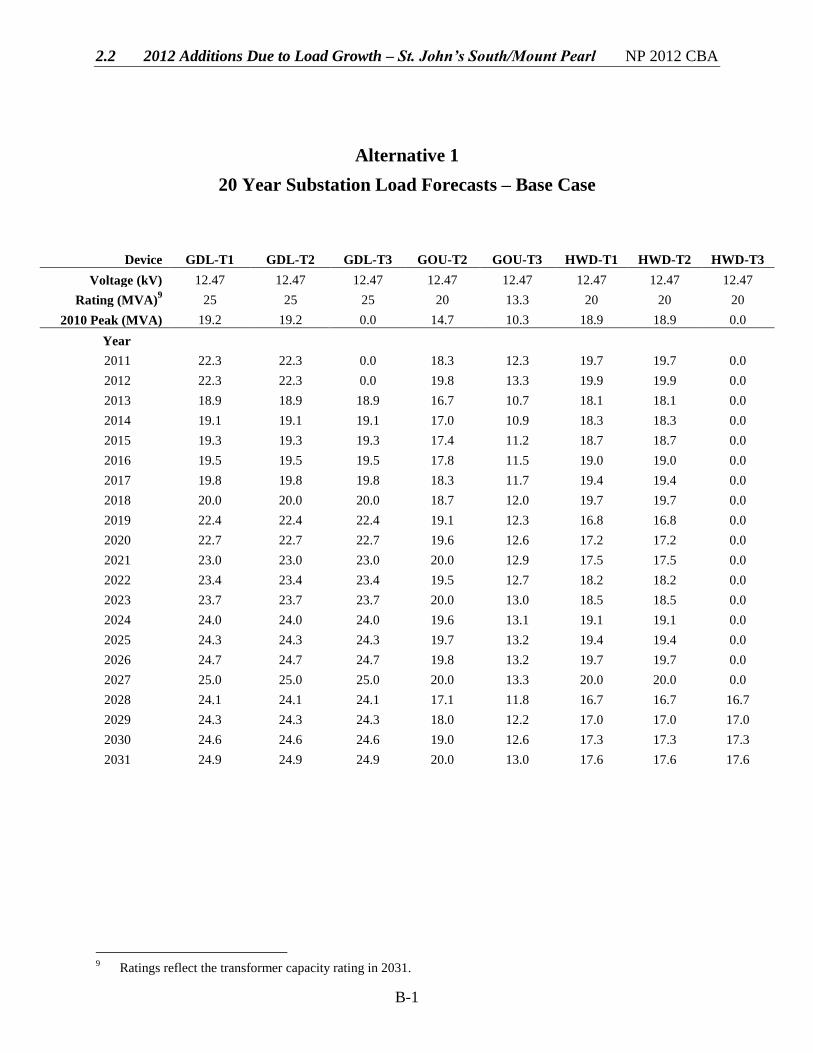
20 Year Substation Load Forecasts – Base Case
9 Ratings reflect the transformer capacity rating in 2031.
Device GDL-T1 GDL-T2 GDL-T3 GOU-T2 GOU-T3 HWD-T1 HWD-T2 HWD-T3
Voltage (kV) 12.47 12.47 12.47 12.47 12.47 12.47 12.47 12.47
Rating (MVA)9 25 25 25 20 13.3 20 20 20
2010 Peak (MVA) 19.2 19.2 0.0 14.7 10.3 18.9 18.9 0.0
Year
2011 22.3 22.3 0.0 18.3 12.3 19.7 19.7 0.0
2012 22.3 22.3 0.0 19.8 13.3 19.9 19.9 0.0
2013 18.9 18.9 18.9 16.7 10.7 18.1 18.1 0.0
2014 19.1 19.1 19.1 17.0 10.9 18.3 18.3 0.0
2015 19.3 19.3 19.3 17.4 11.2 18.7 18.7 0.0
2016 19.5 19.5 19.5 17.8 11.5 19.0 19.0 0.0
2017 19.8 19.8 19.8 18.3 11.7 19.4 19.4 0.0
2018 20.0 20.0 20.0 18.7 12.0 19.7 19.7 0.0
2019 22.4 22.4 22.4 19.1 12.3 16.8 16.8 0.0
2020 22.7 22.7 22.7 19.6 12.6 17.2 17.2 0.0
2021 23.0 23.0 23.0 20.0 12.9 17.5 17.5 0.0
2022 23.4 23.4 23.4 19.5 12.7 18.2 18.2 0.0
2023 23.7 23.7 23.7 20.0 13.0 18.5 18.5 0.0
2024 24.0 24.0 24.0 19.6 13.1 19.1 19.1 0.0
2025 24.3 24.3 24.3 19.7 13.2 19.4 19.4 0.0
2026 24.7 24.7 24.7 19.8 13.2 19.7 19.7 0.0
2027 25.0 25.0 25.0 20.0 13.3 20.0 20.0 0.0
2028 24.1 24.1 24.1 17.1 11.8 16.7 16.7 16.7
2029 24.3 24.3 24.3 18.0 12.2 17.0 17.0 17.0
2030 24.6 24.6 24.6 19.0 12.6 17.3 17.3 17.3
2031 24.9 24.9 24.9 20.0 13.0 17.6 17.6 17.6
2.2 2012 Additions Due to Load Growth – St. John’s South/Mount Pearl NP 2012 CBA
B-2
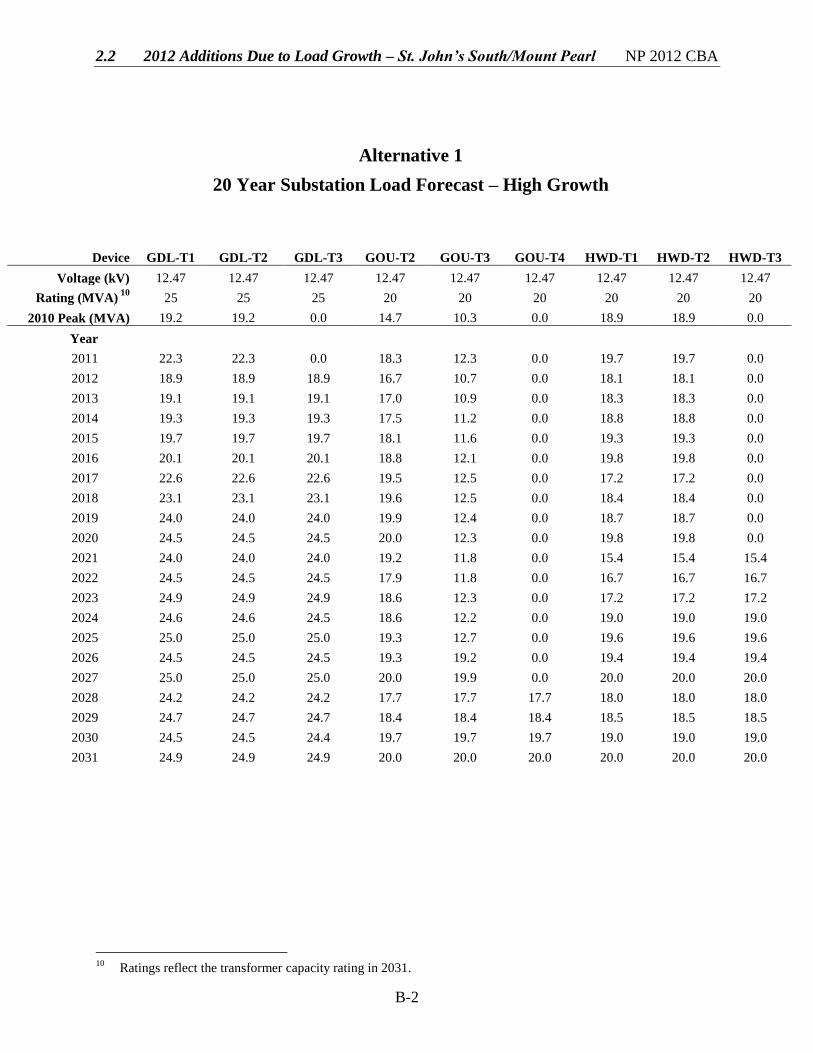
Alternative 1
20 Year Substation Load Forecast – High Growth
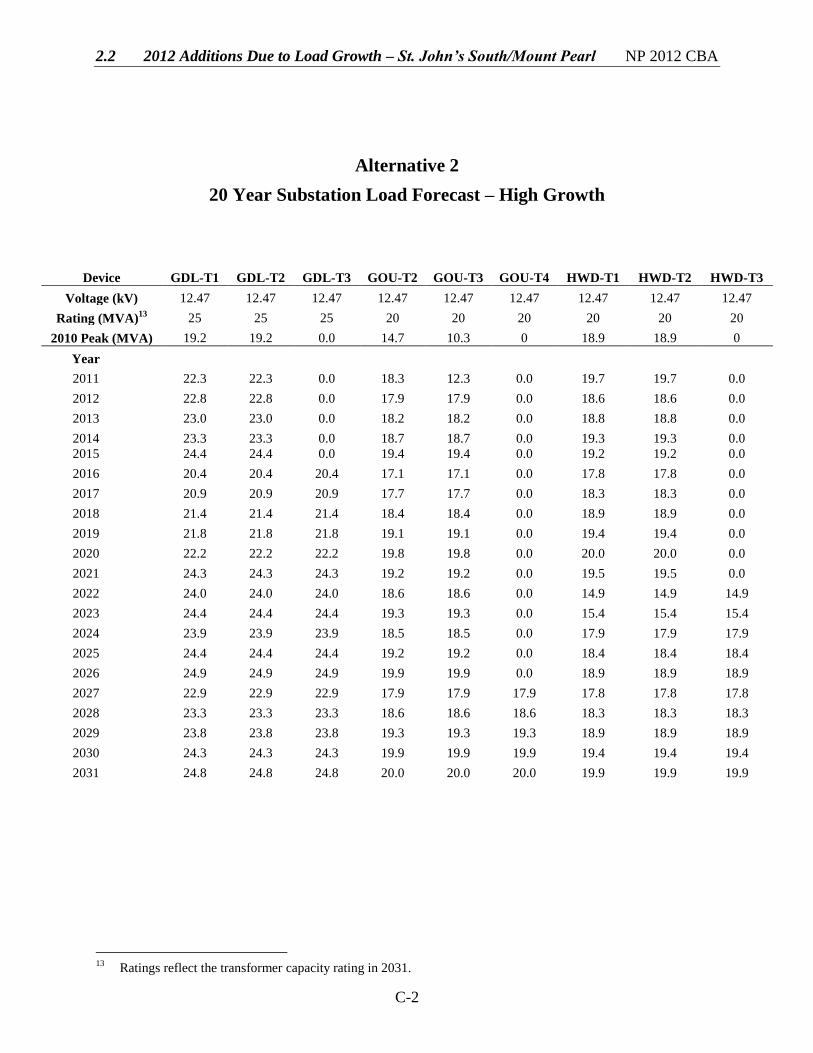
Device GDL-T1 GDL-T2 GDL-T3 GOU-T2 GOU-T3 GOU-T4 HWD-T1 HWD-T2 HWD-T3
Voltage (kV) 12.47 12.47 12.47 12.47 12.47 12.47 12.47 12.47 12.47
Rating (MVA) 10
25 25 25 20 20 20 20 20 20
2010 Peak (MVA) 19.2 19.2 0.0 14.7 10.3 0.0 18.9 18.9 0.0
Year
2011 22.3 22.3 0.0 18.3 12.3 0.0 19.7 19.7 0.0
2012 18.9 18.9 18.9 16.7 10.7 0.0 18.1 18.1 0.0
2013 19.1 19.1 19.1 17.0 10.9 0.0 18.3 18.3 0.0
2014 19.3 19.3 19.3 17.5 11.2 0.0 18.8 18.8 0.0
2015 19.7 19.7 19.7 18.1 11.6 0.0 19.3 19.3 0.0
2016 20.1 20.1 20.1 18.8 12.1 0.0 19.8 19.8 0.0
2017 22.6 22.6 22.6 19.5 12.5 0.0 17.2 17.2 0.0
2018 23.1 23.1 23.1 19.6 12.5 0.0 18.4 18.4 0.0
2019 24.0 24.0 24.0 19.9 12.4 0.0 18.7 18.7 0.0
2020 24.5 24.5 24.5 20.0 12.3 0.0 19.8 19.8 0.0
2021 24.0 24.0 24.0 19.2 11.8 0.0 15.4 15.4 15.4
2022 24.5 24.5 24.5 17.9 11.8 0.0 16.7 16.7 16.7
2023 24.9 24.9 24.9 18.6 12.3 0.0 17.2 17.2 17.2
2024 24.6 24.6 24.5 18.6 12.2 0.0 19.0 19.0 19.0
2025 25.0 25.0 25.0 19.3 12.7 0.0 19.6 19.6 19.6
2026 24.5 24.5 24.5 19.3 19.2 0.0 19.4 19.4 19.4
2027 25.0 25.0 25.0 20.0 19.9 0.0 20.0 20.0 20.0
2028 24.2 24.2 24.2 17.7 17.7 17.7 18.0 18.0 18.0
2029 24.7 24.7 24.7 18.4 18.4 18.4 18.5 18.5 18.5
2030 24.5 24.5 24.4 19.7 19.7 19.7 19.0 19.0 19.0
2031 24.9 24.9 24.9 20.0 20.0 20.0 20.0 20.0 20.0
10
Ratings reflect the transformer capacity rating in 2031.
2.2 2012 Additions Due to Load Growth – St. John’s South/Mount Pearl NP 2012 CBA
B-3
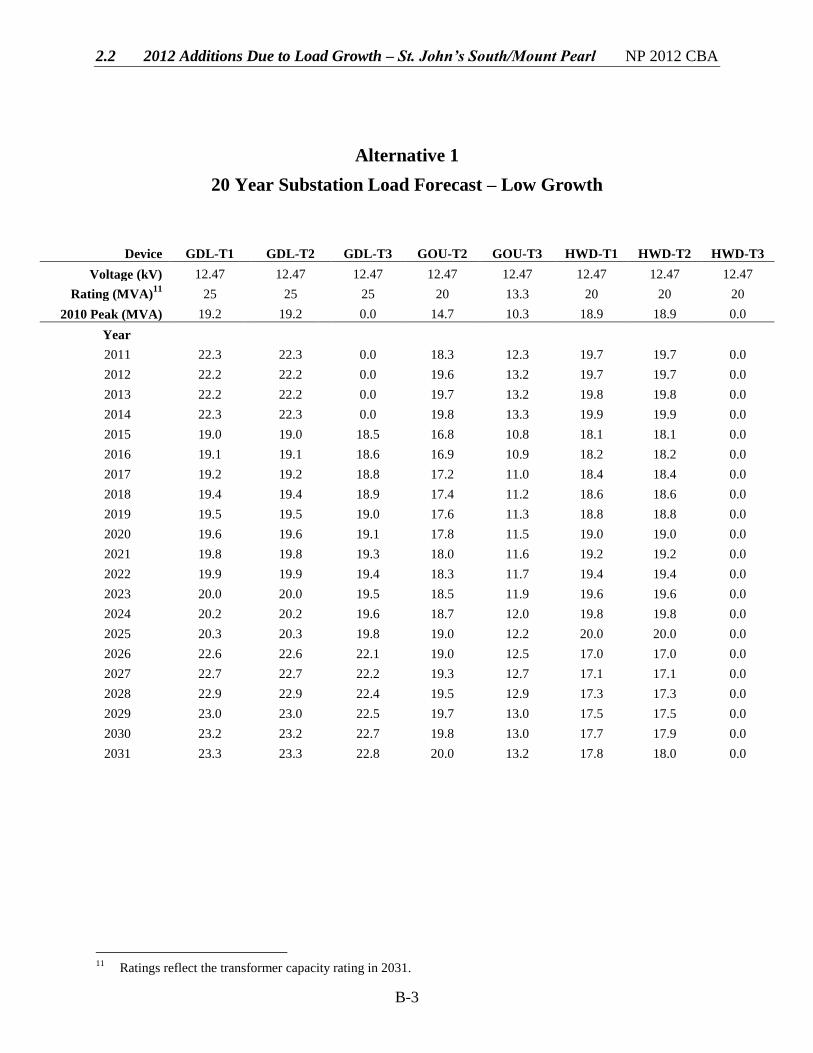
Alternative 1
20 Year Substation Load Forecast – Low Growth
11
Ratings reflect the transformer capacity rating in 2031.
Device GDL-T1 GDL-T2 GDL-T3 GOU-T2 GOU-T3 HWD-T1 HWD-T2 HWD-T3
Voltage (kV) 12.47 12.47 12.47 12.47 12.47 12.47 12.47 12.47
Rating (MVA)11
25 25 25 20 13.3 20 20 20
2010 Peak (MVA) 19.2 19.2 0.0 14.7 10.3 18.9 18.9 0.0
Year
2011 22.3 22.3 0.0 18.3 12.3 19.7 19.7 0.0
2012 22.2 22.2 0.0 19.6 13.2 19.7 19.7 0.0
2013 22.2 22.2 0.0 19.7 13.2 19.8 19.8 0.0
2014 22.3 22.3 0.0 19.8 13.3 19.9 19.9 0.0
2015 19.0 19.0 18.5 16.8 10.8 18.1 18.1 0.0
2016 19.1 19.1 18.6 16.9 10.9 18.2 18.2 0.0
2017 19.2 19.2 18.8 17.2 11.0 18.4 18.4 0.0
2018 19.4 19.4 18.9 17.4 11.2 18.6 18.6 0.0
2019 19.5 19.5 19.0 17.6 11.3 18.8 18.8 0.0
2020 19.6 19.6 19.1 17.8 11.5 19.0 19.0 0.0
2021 19.8 19.8 19.3 18.0 11.6 19.2 19.2 0.0
2022 19.9 19.9 19.4 18.3 11.7 19.4 19.4 0.0
2023 20.0 20.0 19.5 18.5 11.9 19.6 19.6 0.0
2024 20.2 20.2 19.6 18.7 12.0 19.8 19.8 0.0
2025 20.3 20.3 19.8 19.0 12.2 20.0 20.0 0.0
2026 22.6 22.6 22.1 19.0 12.5 17.0 17.0 0.0
2027 22.7 22.7 22.2 19.3 12.7 17.1 17.1 0.0
2028 22.9 22.9 22.4 19.5 12.9 17.3 17.3 0.0
2029 23.0 23.0 22.5 19.7 13.0 17.5 17.5 0.0
2030 23.2 23.2 22.7 19.8 13.0 17.7 17.9 0.0
2031 23.3 23.3 22.8 20.0 13.2 17.8 18.0 0.0

2.2 2012 Additions Due to Load Growth – St. John’s South/Mount Pearl NP 2012 CBA
Appendix C
Alternative 2
20 Year Substation Load Forecasts
2.2 2012 Additions Due to Load Growth – St. John’s South/Mount Pearl NP 2012 CBA
C-1
Alternative 2
20 Year Substation Load Forecast – Base Case
12
Ratings reflect the transformer capacity rating in 2031.
Device GDL-T1 GDL-T2 GDL-T3 GOU-T2 GOU-T3 HWD-T1 HWD-T2 HWD-T3
Voltage (kV) 12.47 12.47 12.47 12.47 12.47 12.47 12.47 12.47
Rating (MVA)12
25 25 25 20 20 20 20 20
2010 Peak (MVA) 19.2 19.2 0.0 14.7 10.3 18.9 18.9 0
Year
2011 22.3 22.3 0.0 18.3 12.3 19.7 19.7 0.0
2012 22.3 22.3 0.0 19.8 13.3 19.9 19.9 0.0
2013 22.8 22.8 0.0 17.9 17.9 18.6 18.6 0.0
2014 23.0 23.0 0.0 18.2 18.2 18.8 18.8 0.0
2015 23.3 23.3 0.0 18.7 18.6 19.2 19.2 0.0
2016 23.5 23.5 0.0 19.1 19.0 19.5 19.5 0.0
2017 23.8 23.8 0.0 19.5 19.5 19.9 19.9 0.0
2018 24.7 24.7 0.0 20.0 19.9 19.6 19.6 0.0
2019 20.7 20.7 20.7 17.4 17.4 18.0 18.0 0.0
2020 21.0 21.0 21.0 17.9 17.8 18.4 18.4 0.0
2021 21.2 21.2 21.2 18.3 18.2 18.7 18.7 0.0
2022 21.5 21.5 21.5 18.7 18.6 19.0 19.0 0.0
2023 21.7 21.7 21.7 19.1 19.0 19.4 19.4 0.0
2024 22.0 22.0 22.0 19.6 19.5 19.7 19.7 0.0
2025 22.3 22.3 22.3 20.0 19.9 20.0 20.0 0.0
2026 24.2 24.2 24.2 19.1 19.0 19.3 19.3 0.0
2027 24.5 24.5 24.5 19.5 19.5 19.7 19.7 0.0
2028 24.8 24.8 24.8 20.0 19.9 20.0 20.0 0.0
2029 24.4 24.4 24.4 19.1 19.0 15.2 15.2 15.2
2030 24.7 24.7 24.7 19.6 19.5 15.4 15.4 15.4
2031 25.0 25.0 25.0 20.0 19.9 15.7 15.7 15.7
2.2 2012 Additions Due to Load Growth – St. John’s South/Mount Pearl NP 2012 CBA
C-2
Alternative 2
20 Year Substation Load Forecast – High Growth
13
Ratings reflect the transformer capacity rating in 2031.
Device GDL-T1 GDL-T2 GDL-T3 GOU-T2 GOU-T3 GOU-T4 HWD-T1 HWD-T2 HWD-T3
Voltage (kV) 12.47 12.47 12.47 12.47 12.47 12.47 12.47 12.47 12.47
Rating (MVA)13
25 25 25 20 20 20 20 20 20
2010 Peak (MVA) 19.2 19.2 0.0 14.7 10.3 0 18.9 18.9 0
Year
2011 22.3 22.3 0.0 18.3 12.3 0.0 19.7 19.7 0.0
2012 22.8 22.8 0.0 17.9 17.9 0.0 18.6 18.6 0.0
2013 23.0 23.0 0.0 18.2 18.2 0.0 18.8 18.8 0.0
2014 23.3 23.3 0.0 18.7 18.7 0.0 19.3 19.3 0.0
2015 24.4 24.4 0.0 19.4 19.4 0.0 19.2 19.2 0.0
2016 20.4 20.4 20.4 17.1 17.1 0.0 17.8 17.8 0.0
2017 20.9 20.9 20.9 17.7 17.7 0.0 18.3 18.3 0.0
2018 21.4 21.4 21.4 18.4 18.4 0.0 18.9 18.9 0.0
2019 21.8 21.8 21.8 19.1 19.1 0.0 19.4 19.4 0.0
2020 22.2 22.2 22.2 19.8 19.8 0.0 20.0 20.0 0.0
2021 24.3 24.3 24.3 19.2 19.2 0.0 19.5 19.5 0.0
2022 24.0 24.0 24.0 18.6 18.6 0.0 14.9 14.9 14.9
2023 24.4 24.4 24.4 19.3 19.3 0.0 15.4 15.4 15.4
2024 23.9 23.9 23.9 18.5 18.5 0.0 17.9 17.9 17.9
2025 24.4 24.4 24.4 19.2 19.2 0.0 18.4 18.4 18.4
2026 24.9 24.9 24.9 19.9 19.9 0.0 18.9 18.9 18.9
2027 22.9 22.9 22.9 17.9 17.9 17.9 17.8 17.8 17.8
2028 23.3 23.3 23.3 18.6 18.6 18.6 18.3 18.3 18.3
2029 23.8 23.8 23.8 19.3 19.3 19.3 18.9 18.9 18.9
2030 24.3 24.3 24.3 19.9 19.9 19.9 19.4 19.4 19.4
2031 24.8 24.8 24.8 20.0 20.0 20.0 19.9 19.9 19.9
2.2 2012 Additions Due to Load Growth – St. John’s South/Mount Pearl NP 2012 CBA
C-3
Alternative 2
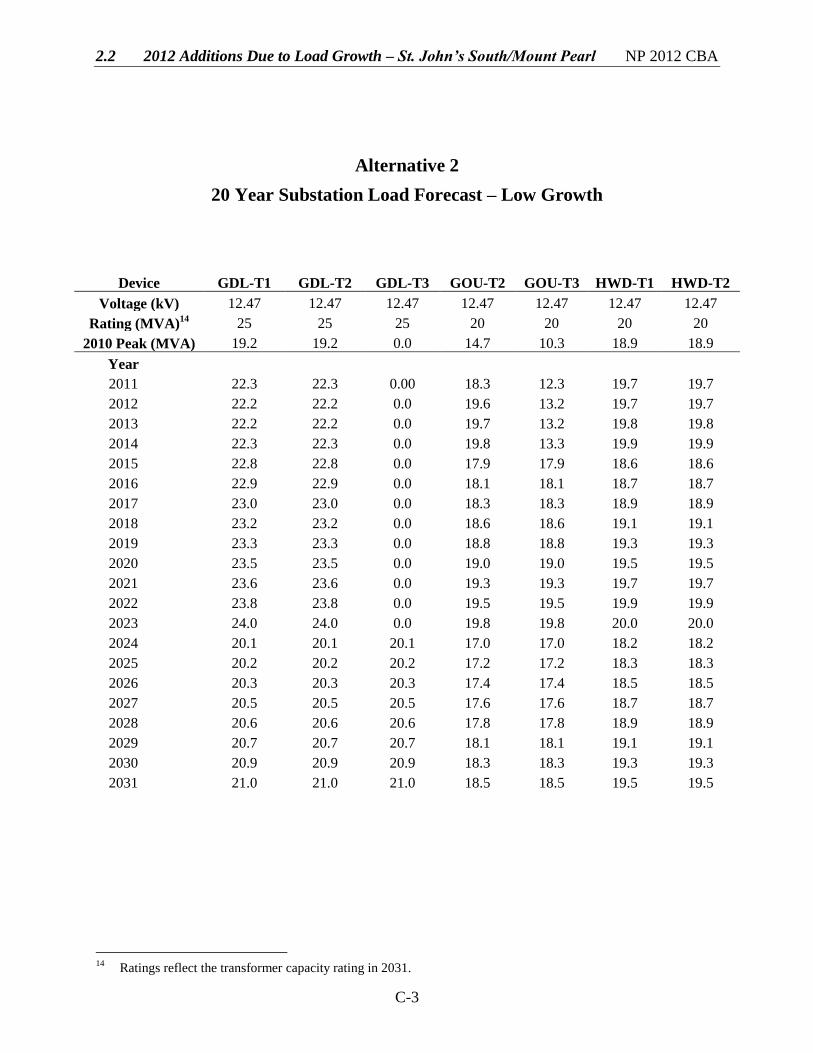
20 Year Substation Load Forecast – Low Growth
14
Ratings reflect the transformer capacity rating in 2031.
Device GDL-T1 GDL-T2 GDL-T3 GOU-T2 GOU-T3 HWD-T1 HWD-T2
Voltage (kV) 12.47 12.47 12.47 12.47 12.47 12.47 12.47
Rating (MVA)14 25 25 25 20 20 20 20
2010 Peak (MVA) 19.2 19.2 0.0 14.7 10.3 18.9 18.9
Year
2011 22.3 22.3 0.00 18.3 12.3 19.7 19.7
2012 22.2 22.2 0.0 19.6 13.2 19.7 19.7
2013 22.2 22.2 0.0 19.7 13.2 19.8 19.8
2014 22.3 22.3 0.0 19.8 13.3 19.9 19.9
2015 22.8 22.8 0.0 17.9 17.9 18.6 18.6
2016 22.9 22.9 0.0 18.1 18.1 18.7 18.7
2017 23.0 23.0 0.0 18.3 18.3 18.9 18.9
2018 23.2 23.2 0.0 18.6 18.6 19.1 19.1
2019 23.3 23.3 0.0 18.8 18.8 19.3 19.3
2020 23.5 23.5 0.0 19.0 19.0 19.5 19.5
2021 23.6 23.6 0.0 19.3 19.3 19.7 19.7
2022 23.8 23.8 0.0 19.5 19.5 19.9 19.9
2023 24.0 24.0 0.0 19.8 19.8 20.0 20.0
2024 20.1 20.1 20.1 17.0 17.0 18.2 18.2
2025 20.2 20.2 20.2 17.2 17.2 18.3 18.3
2026 20.3 20.3 20.3 17.4 17.4 18.5 18.5
2027 20.5 20.5 20.5 17.6 17.6 18.7 18.7
2028 20.6 20.6 20.6 17.8 17.8 18.9 18.9
2029 20.7 20.7 20.7 18.1 18.1 19.1 19.1
2030 20.9 20.9 20.9 18.3 18.3 19.3 19.3
2031 21.0 21.0 21.0 18.5 18.5 19.5 19.5

2.2 2012 Additions Due to Load Growth – St. John’s South/Mount Pearl NP 2012 CBA
Appendix D
Alternative 3
20 Year Substation Load Forecasts
2.2 2012 Additions Due to Load Growth – St. John’s South/Mount Pearl NP 2012 CBA
D-1
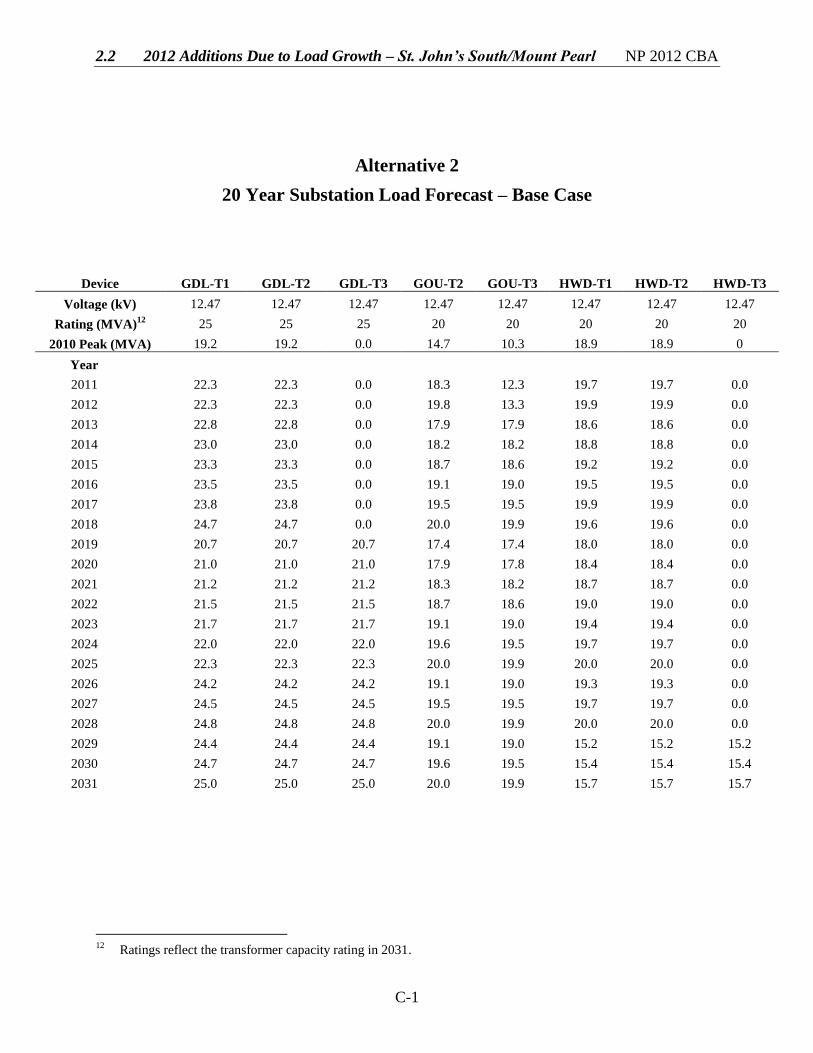
Alternative 3
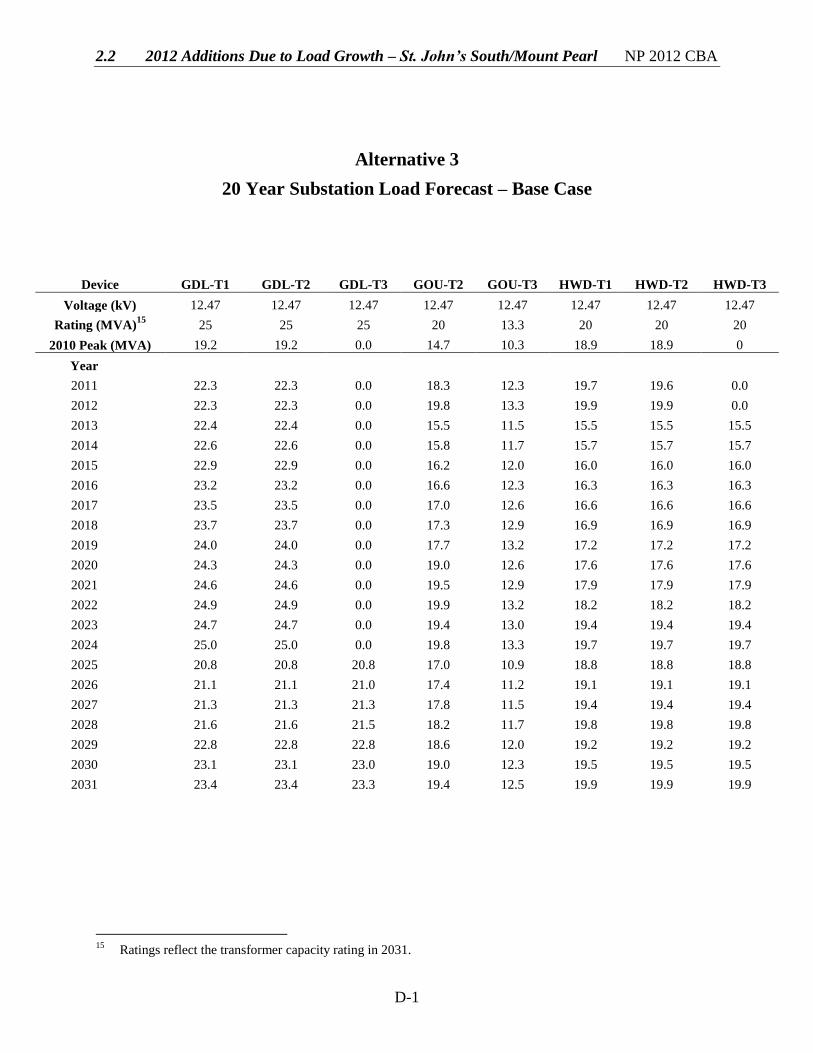
20 Year Substation Load Forecast – Base Case
15
Ratings reflect the transformer capacity rating in 2031.
Device GDL-T1 GDL-T2 GDL-T3 GOU-T2 GOU-T3 HWD-T1 HWD-T2 HWD-T3
Voltage (kV) 12.47 12.47 12.47 12.47 12.47 12.47 12.47 12.47
Rating (MVA)15
25 25 25 20 13.3 20 20 20
2010 Peak (MVA) 19.2 19.2 0.0 14.7 10.3 18.9 18.9 0
Year
2011 22.3 22.3 0.0 18.3 12.3 19.7 19.6 0.0
2012 22.3 22.3 0.0 19.8 13.3 19.9 19.9 0.0
2013 22.4 22.4 0.0 15.5 11.5 15.5 15.5 15.5
2014 22.6 22.6 0.0 15.8 11.7 15.7 15.7 15.7
2015 22.9 22.9 0.0 16.2 12.0 16.0 16.0 16.0
2016 23.2 23.2 0.0 16.6 12.3 16.3 16.3 16.3
2017 23.5 23.5 0.0 17.0 12.6 16.6 16.6 16.6
2018 23.7 23.7 0.0 17.3 12.9 16.9 16.9 16.9
2019 24.0 24.0 0.0 17.7 13.2 17.2 17.2 17.2
2020 24.3 24.3 0.0 19.0 12.6 17.6 17.6 17.6
2021 24.6 24.6 0.0 19.5 12.9 17.9 17.9 17.9
2022 24.9 24.9 0.0 19.9 13.2 18.2 18.2 18.2
2023 24.7 24.7 0.0 19.4 13.0 19.4 19.4 19.4
2024 25.0 25.0 0.0 19.8 13.3 19.7 19.7 19.7
2025 20.8 20.8 20.8 17.0 10.9 18.8 18.8 18.8
2026 21.1 21.1 21.0 17.4 11.2 19.1 19.1 19.1
2027 21.3 21.3 21.3 17.8 11.5 19.4 19.4 19.4
2028 21.6 21.6 21.5 18.2 11.7 19.8 19.8 19.8
2029 22.8 22.8 22.8 18.6 12.0 19.2 19.2 19.2
2030 23.1 23.1 23.0 19.0 12.3 19.5 19.5 19.5
2031 23.4 23.4 23.3 19.4 12.5 19.9 19.9 19.9
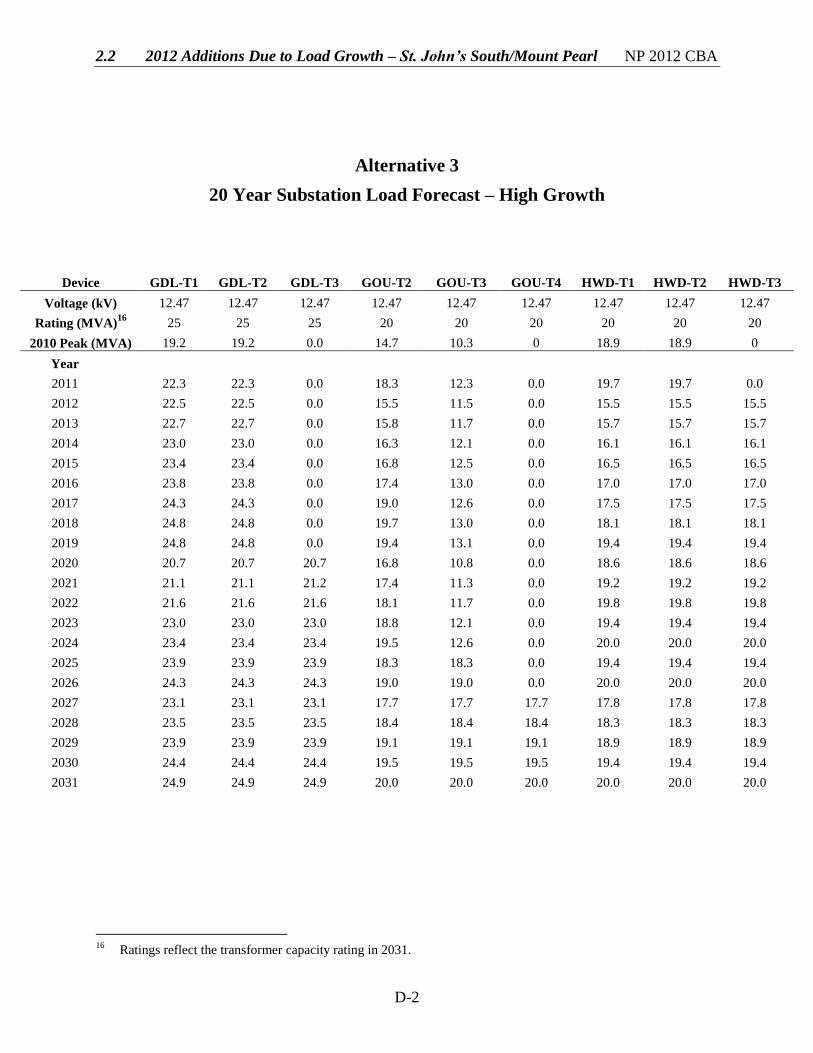
2.2 2012 Additions Due to Load Growth – St. John’s South/Mount Pearl NP 2012 CBA
D-2
Alternative 3
20 Year Substation Load Forecast – High Growth
16
Ratings reflect the transformer capacity rating in 2031.
Device GDL-T1 GDL-T2 GDL-T3 GOU-T2 GOU-T3 GOU-T4 HWD-T1 HWD-T2 HWD-T3
Voltage (kV) 12.47 12.47 12.47 12.47 12.47 12.47 12.47 12.47 12.47
Rating (MVA)16
25 25 25 20 20 20 20 20 20
2010 Peak (MVA) 19.2 19.2 0.0 14.7 10.3 0 18.9 18.9 0
Year
2011 22.3 22.3 0.0 18.3 12.3 0.0 19.7 19.7 0.0
2012 22.5 22.5 0.0 15.5 11.5 0.0 15.5 15.5 15.5
2013 22.7 22.7 0.0 15.8 11.7 0.0 15.7 15.7 15.7
2014 23.0 23.0 0.0 16.3 12.1 0.0 16.1 16.1 16.1
2015 23.4 23.4 0.0 16.8 12.5 0.0 16.5 16.5 16.5
2016 23.8 23.8 0.0 17.4 13.0 0.0 17.0 17.0 17.0
2017 24.3 24.3 0.0 19.0 12.6 0.0 17.5 17.5 17.5
2018 24.8 24.8 0.0 19.7 13.0 0.0 18.1 18.1 18.1
2019 24.8 24.8 0.0 19.4 13.1 0.0 19.4 19.4 19.4
2020 20.7 20.7 20.7 16.8 10.8 0.0 18.6 18.6 18.6
2021 21.1 21.1 21.2 17.4 11.3 0.0 19.2 19.2 19.2
2022 21.6 21.6 21.6 18.1 11.7 0.0 19.8 19.8 19.8
2023 23.0 23.0 23.0 18.8 12.1 0.0 19.4 19.4 19.4
2024 23.4 23.4 23.4 19.5 12.6 0.0 20.0 20.0 20.0
2025 23.9 23.9 23.9 18.3 18.3 0.0 19.4 19.4 19.4
2026 24.3 24.3 24.3 19.0 19.0 0.0 20.0 20.0 20.0
2027 23.1 23.1 23.1 17.7 17.7 17.7 17.8 17.8 17.8
2028 23.5 23.5 23.5 18.4 18.4 18.4 18.3 18.3 18.3
2029 23.9 23.9 23.9 19.1 19.1 19.1 18.9 18.9 18.9
2030 24.4 24.4 24.4 19.5 19.5 19.5 19.4 19.4 19.4
2031 24.9 24.9 24.9 20.0 20.0 20.0 20.0 20.0 20.0
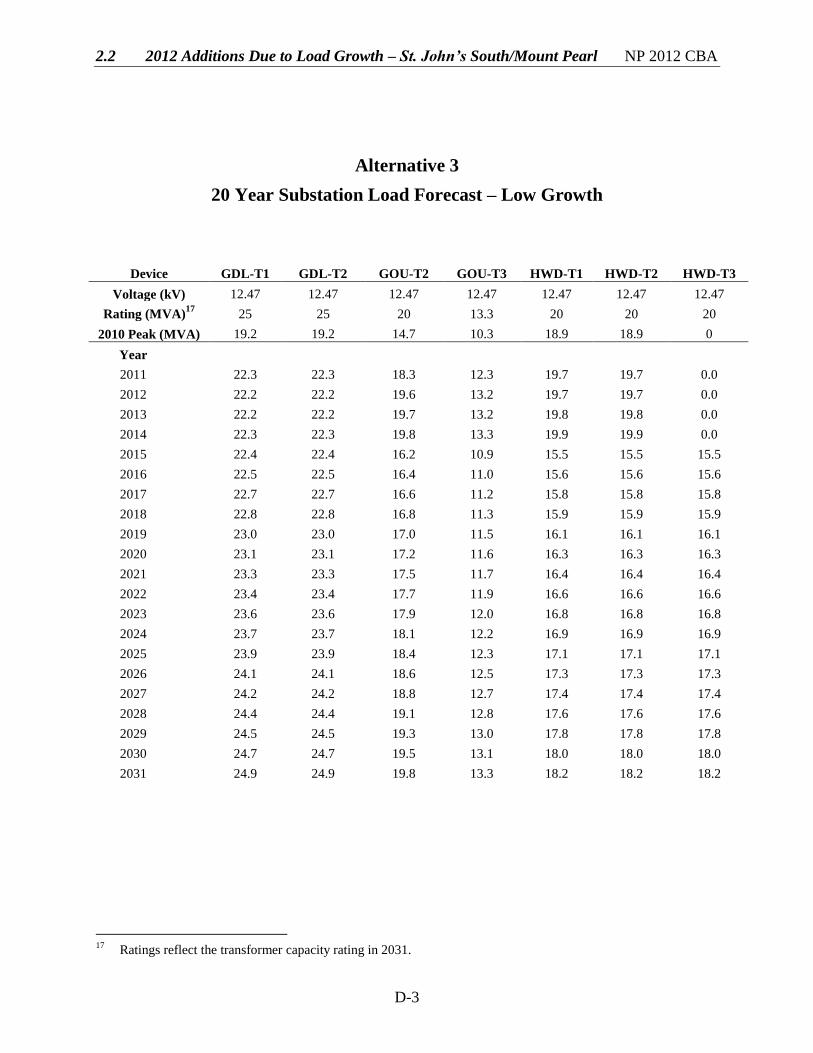
2.2 2012 Additions Due to Load Growth – St. John’s South/Mount Pearl NP 2012 CBA
D-3
Alternative 3
20 Year Substation Load Forecast – Low Growth
17
Ratings reflect the transformer capacity rating in 2031.
Device GDL-T1 GDL-T2 GOU-T2 GOU-T3 HWD-T1 HWD-T2 HWD-T3
Voltage (kV) 12.47 12.47 12.47 12.47 12.47 12.47 12.47
Rating (MVA)17
25 25 20 13.3 20 20 20
2010 Peak (MVA) 19.2 19.2 14.7 10.3 18.9 18.9 0
Year
2011 22.3 22.3 18.3 12.3 19.7 19.7 0.0
2012 22.2 22.2 19.6 13.2 19.7 19.7 0.0
2013 22.2 22.2 19.7 13.2 19.8 19.8 0.0
2014 22.3 22.3 19.8 13.3 19.9 19.9 0.0
2015 22.4 22.4 16.2 10.9 15.5 15.5 15.5
2016 22.5 22.5 16.4 11.0 15.6 15.6 15.6
2017 22.7 22.7 16.6 11.2 15.8 15.8 15.8
2018 22.8 22.8 16.8 11.3 15.9 15.9 15.9
2019 23.0 23.0 17.0 11.5 16.1 16.1 16.1
2020 23.1 23.1 17.2 11.6 16.3 16.3 16.3
2021 23.3 23.3 17.5 11.7 16.4 16.4 16.4
2022 23.4 23.4 17.7 11.9 16.6 16.6 16.6
2023 23.6 23.6 17.9 12.0 16.8 16.8 16.8
2024 23.7 23.7 18.1 12.2 16.9 16.9 16.9
2025 23.9 23.9 18.4 12.3 17.1 17.1 17.1
2026 24.1 24.1 18.6 12.5 17.3 17.3 17.3
2027 24.2 24.2 18.8 12.7 17.4 17.4 17.4
2028 24.4 24.4 19.1 12.8 17.6 17.6 17.6
2029 24.5 24.5 19.3 13.0 17.8 17.8 17.8
2030 24.7 24.7 19.5 13.1 18.0 18.0 18.0
2031 24.9 24.9 19.8 13.3 18.2 18.2 18.2
2.3 2012 PCB Removal Strategy NP 20 12 CBA
2012 PCB Removal Strategy
June 201 1
Prepared by:
Peter Feehan, P.Eng.
A FORTE COMPANY
2.3 2012 PCB Removal Strategy NP 2012 CBA
i
Table of Contents
Page
1.0 Introduction ....................................................................................................................... 1
2.0 PCB Equipment Remediation Strategy ............................................................................. 2
2.1 Power Transformers .............................................................................................. 3
2.2 Bulk Oil Circuit Breakers ..................................................................................... 6
2.3 Potential and Current Transformers ...................................................................... 8
2.4 Metering Tanks ..................................................................................................... 8
2.5 Station Service Transformers ................................................................................ 8
3.0 Project Cost ....................................................................................................................... 9
4.0 Concluding ........................................................................................................................ 9
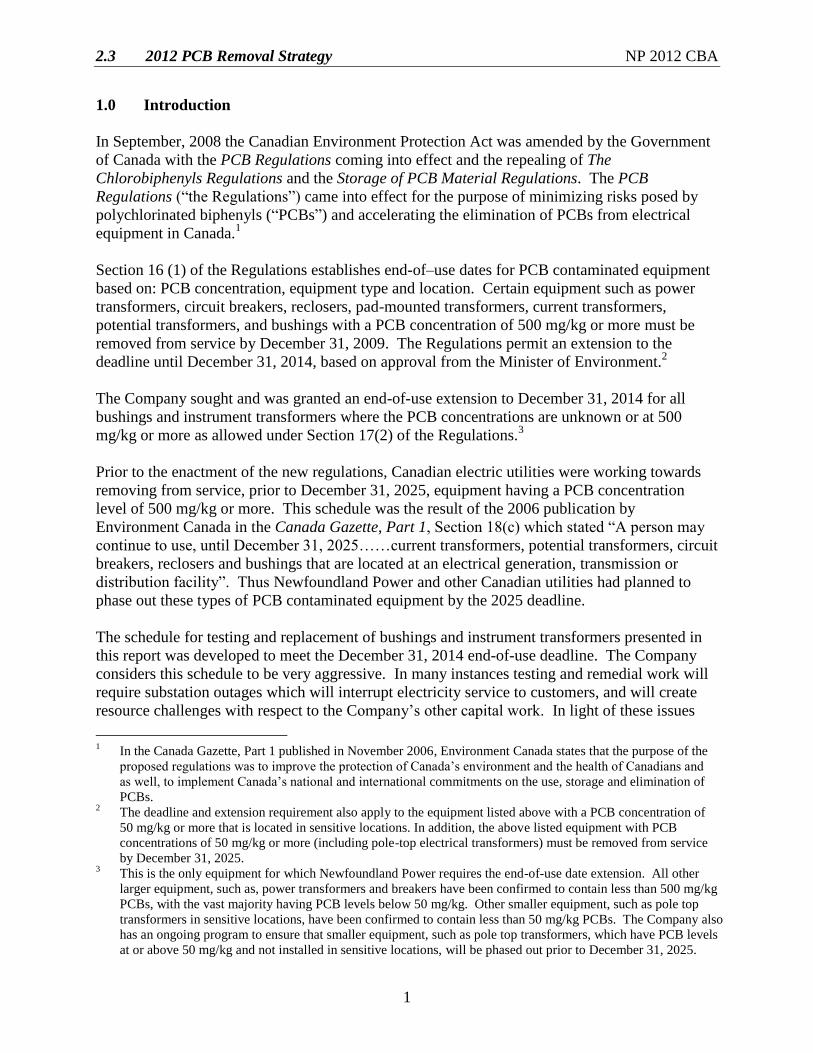
2.3 2012 PCB Removal Strategy NP 2012 CBA
1
1.0 Introduction
In September, 2008 the Canadian Environment Protection Act was amended by the Government
of Canada with the PCB Regulations coming into effect and the repealing of The
Chlorobiphenyls Regulations and the Storage of PCB Material Regulations. The PCB
Regulations (“the Regulations”) came into effect for the purpose of minimizing risks posed by
polychlorinated biphenyls (“PCBs”) and accelerating the elimination of PCBs from electrical
equipment in Canada.1
Section 16 (1) of the Regulations establishes end-of–use dates for PCB contaminated equipment
based on: PCB concentration, equipment type and location. Certain equipment such as power
transformers, circuit breakers, reclosers, pad-mounted transformers, current transformers,
potential transformers, and bushings with a PCB concentration of 500 mg/kg or more must be
removed from service by December 31, 2009. The Regulations permit an extension to the
deadline until December 31, 2014, based on approval from the Minister of Environment.2
The Company sought and was granted an end-of-use extension to December 31, 2014 for all
bushings and instrument transformers where the PCB concentrations are unknown or at 500
mg/kg or more as allowed under Section 17(2) of the Regulations.3
Prior to the enactment of the new regulations, Canadian electric utilities were working towards
removing from service, prior to December 31, 2025, equipment having a PCB concentration
level of 500 mg/kg or more. This schedule was the result of the 2006 publication by
Environment Canada in the Canada Gazette, Part 1, Section 18(c) which stated “A person may
continue to use, until December 31, 2025……current transformers, potential transformers, circuit
breakers, reclosers and bushings that are located at an electrical generation, transmission or
distribution facility”. Thus Newfoundland Power and other Canadian utilities had planned to
phase out these types of PCB contaminated equipment by the 2025 deadline.
The schedule for testing and replacement of bushings and instrument transformers presented in
this report was developed to meet the December 31, 2014 end-of-use deadline. The Company
considers this schedule to be very aggressive. In many instances testing and remedial work will
require substation outages which will interrupt electricity service to customers, and will create
resource challenges with respect to the Company’s other capital work. In light of these issues
1 In the Canada Gazette, Part 1 published in November 2006, Environment Canada states that the purpose of the
proposed regulations was to improve the protection of Canada’s environment and the health of Canadians and
as well, to implement Canada’s national and international commitments on the use, storage and elimination of
PCBs. 2 The deadline and extension requirement also apply to the equipment listed above with a PCB concentration of
50 mg/kg or more that is located in sensitive locations. In addition, the above listed equipment with PCB
concentrations of 50 mg/kg or more (including pole-top electrical transformers) must be removed from service
by December 31, 2025. 3 This is the only equipment for which Newfoundland Power requires the end-of-use date extension. All other
larger equipment, such as, power transformers and breakers have been confirmed to contain less than 500 mg/kg
PCBs, with the vast majority having PCB levels below 50 mg/kg. Other smaller equipment, such as pole top
transformers in sensitive locations, have been confirmed to contain less than 50 mg/kg PCBs. The Company also
has an ongoing program to ensure that smaller equipment, such as pole top transformers, which have PCB levels
at or above 50 mg/kg and not installed in sensitive locations, will be phased out prior to December 31, 2025.
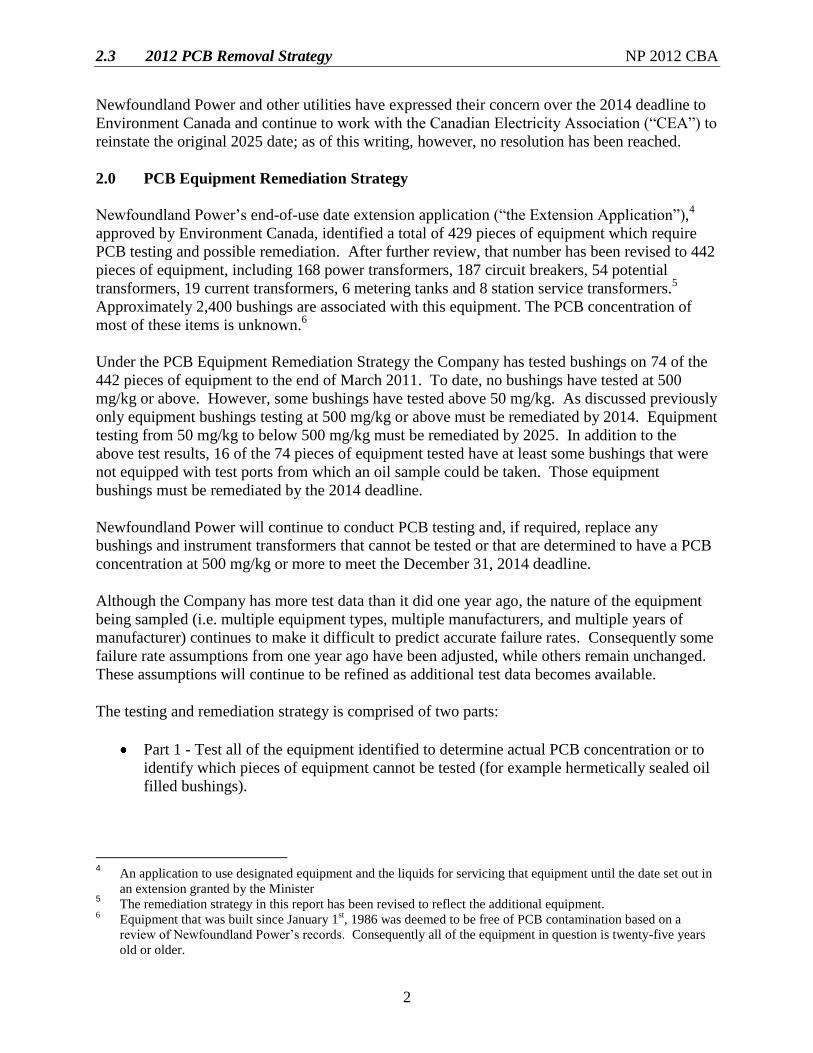
2.3 2012 PCB Removal Strategy NP 2012 CBA
2
Newfoundland Power and other utilities have expressed their concern over the 2014 deadline to
Environment Canada and continue to work with the Canadian Electricity Association (“CEA”) to
reinstate the original 2025 date; as of this writing, however, no resolution has been reached.
2.0 PCB Equipment Remediation Strategy
Newfoundland Power’s end-of-use date extension application (“the Extension Application”),4
approved by Environment Canada, identified a total of 429 pieces of equipment which require
PCB testing and possible remediation. After further review, that number has been revised to 442
pieces of equipment, including 168 power transformers, 187 circuit breakers, 54 potential
transformers, 19 current transformers, 6 metering tanks and 8 station service transformers.5
Approximately 2,400 bushings are associated with this equipment. The PCB concentration of
most of these items is unknown.6
Under the PCB Equipment Remediation Strategy the Company has tested bushings on 74 of the
442 pieces of equipment to the end of March 2011. To date, no bushings have tested at 500
mg/kg or above. However, some bushings have tested above 50 mg/kg. As discussed previously
only equipment bushings testing at 500 mg/kg or above must be remediated by 2014. Equipment
testing from 50 mg/kg to below 500 mg/kg must be remediated by 2025. In addition to the
above test results, 16 of the 74 pieces of equipment tested have at least some bushings that were
not equipped with test ports from which an oil sample could be taken. Those equipment
bushings must be remediated by the 2014 deadline.
Newfoundland Power will continue to conduct PCB testing and, if required, replace any
bushings and instrument transformers that cannot be tested or that are determined to have a PCB
concentration at 500 mg/kg or more to meet the December 31, 2014 deadline.
Although the Company has more test data than it did one year ago, the nature of the equipment
being sampled (i.e. multiple equipment types, multiple manufacturers, and multiple years of
manufacturer) continues to make it difficult to predict accurate failure rates. Consequently some
failure rate assumptions from one year ago have been adjusted, while others remain unchanged.
These assumptions will continue to be refined as additional test data becomes available.
The testing and remediation strategy is comprised of two parts:
Part 1 - Test all of the equipment identified to determine actual PCB concentration or to
identify which pieces of equipment cannot be tested (for example hermetically sealed oil
filled bushings).
4 An application to use designated equipment and the liquids for servicing that equipment until the date set out in
an extension granted by the Minister 5 The remediation strategy in this report has been revised to reflect the additional equipment.
6 Equipment that was built since January 1
st, 1986 was deemed to be free of PCB contamination based on a
review of Newfoundland Power’s records. Consequently all of the equipment in question is twenty-five years
old or older.
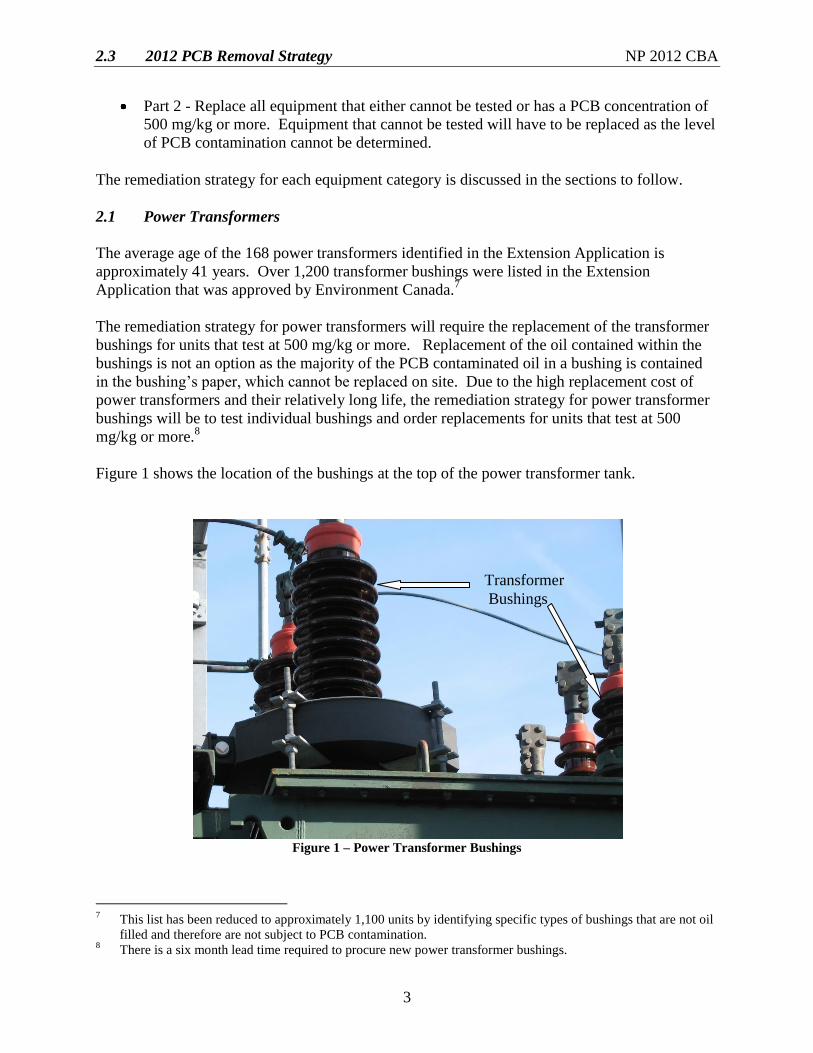
2.3 2012 PCB Removal Strategy NP 2012 CBA
3
Part 2 - Replace all equipment that either cannot be tested or has a PCB concentration of
500 mg/kg or more. Equipment that cannot be tested will have to be replaced as the level
of PCB contamination cannot be determined.
The remediation strategy for each equipment category is discussed in the sections to follow.
2.1 Power Transformers
The average age of the 168 power transformers identified in the Extension Application is
approximately 41 years. Over 1,200 transformer bushings were listed in the Extension
Application that was approved by Environment Canada.7
The remediation strategy for power transformers will require the replacement of the transformer
bushings for units that test at 500 mg/kg or more. Replacement of the oil contained within the
bushings is not an option as the majority of the PCB contaminated oil in a bushing is contained
in the bushing’s paper, which cannot be replaced on site. Due to the high replacement cost of
power transformers and their relatively long life, the remediation strategy for power transformer
bushings will be to test individual bushings and order replacements for units that test at 500
mg/kg or more.8
Figure 1 shows the location of the bushings at the top of the power transformer tank.
Figure 1 – Power Transformer Bushings
7 This list has been reduced to approximately 1,100 units by identifying specific types of bushings that are not oil
filled and therefore are not subject to PCB contamination. 8 There is a six month lead time required to procure new power transformer bushings.
Transformer
Bushings
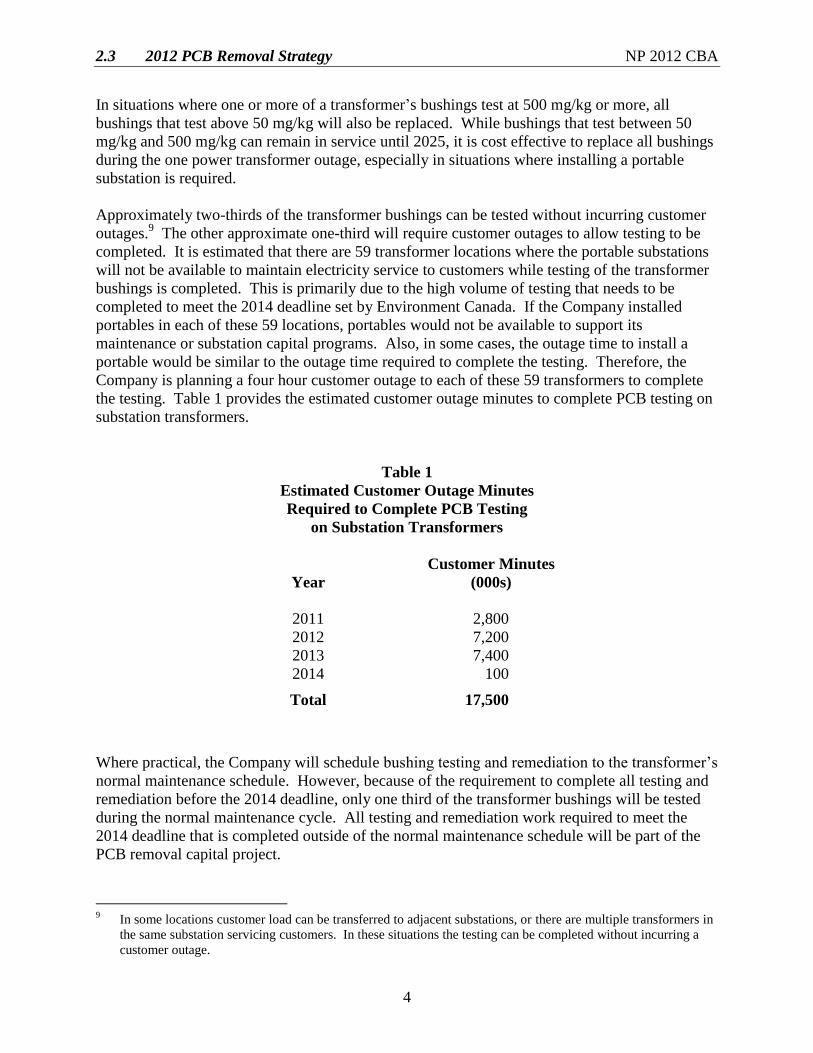
2.3 2012 PCB Removal Strategy NP 2012 CBA
4
In situations where one or more of a transformer’s bushings test at 500 mg/kg or more, all
bushings that test above 50 mg/kg will also be replaced. While bushings that test between 50
mg/kg and 500 mg/kg can remain in service until 2025, it is cost effective to replace all bushings
during the one power transformer outage, especially in situations where installing a portable
substation is required.
Approximately two-thirds of the transformer bushings can be tested without incurring customer
outages.9 The other approximate one-third will require customer outages to allow testing to be
completed. It is estimated that there are 59 transformer locations where the portable substations
will not be available to maintain electricity service to customers while testing of the transformer
bushings is completed. This is primarily due to the high volume of testing that needs to be
completed to meet the 2014 deadline set by Environment Canada. If the Company installed
portables in each of these 59 locations, portables would not be available to support its
maintenance or substation capital programs. Also, in some cases, the outage time to install a
portable would be similar to the outage time required to complete the testing. Therefore, the
Company is planning a four hour customer outage to each of these 59 transformers to complete
the testing. Table 1 provides the estimated customer outage minutes to complete PCB testing on
substation transformers.
Table 1
Estimated Customer Outage Minutes
Required to Complete PCB Testing
on Substation Transformers
Year
Customer Minutes
(000s)
2011 2,800
2012 7,200
2013 7,400
2014 100
Total 17,500
Where practical, the Company will schedule bushing testing and remediation to the transformer’s
normal maintenance schedule. However, because of the requirement to complete all testing and
remediation before the 2014 deadline, only one third of the transformer bushings will be tested
during the normal maintenance cycle. All testing and remediation work required to meet the
2014 deadline that is completed outside of the normal maintenance schedule will be part of the
PCB removal capital project.
9 In some locations customer load can be transferred to adjacent substations, or there are multiple transformers in
the same substation servicing customers. In these situations the testing can be completed without incurring a
customer outage.
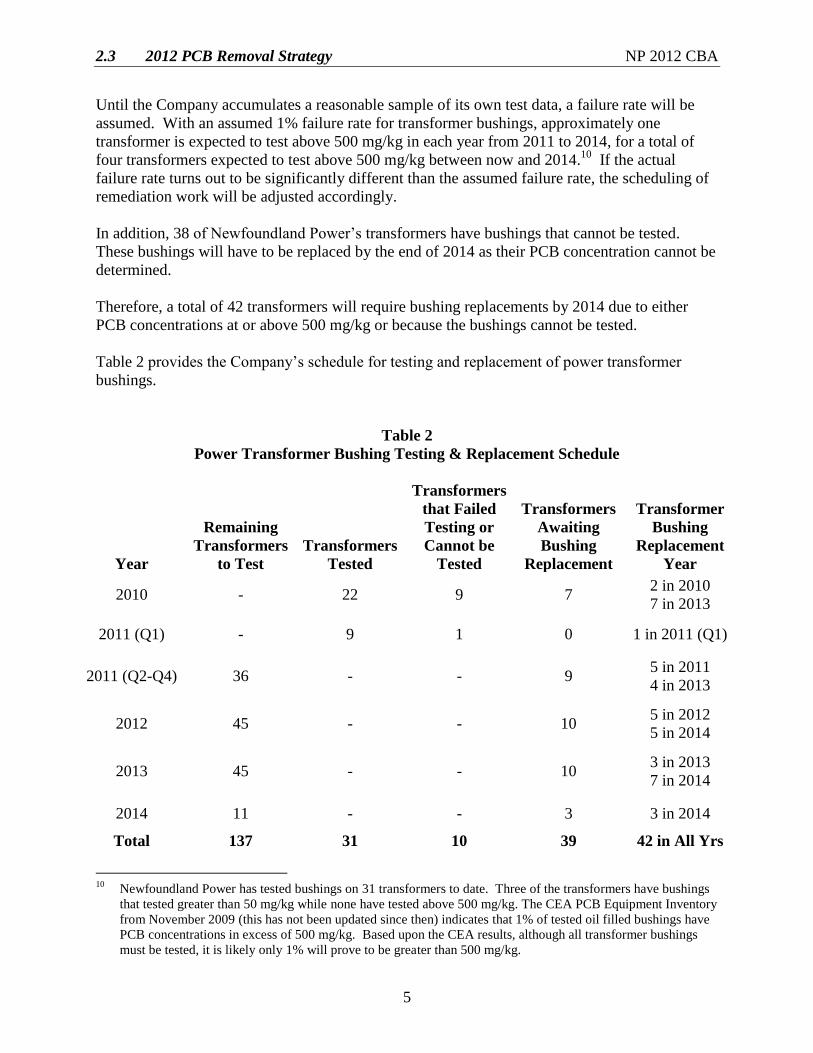
2.3 2012 PCB Removal Strategy NP 2012 CBA
5
Until the Company accumulates a reasonable sample of its own test data, a failure rate will be
assumed. With an assumed 1% failure rate for transformer bushings, approximately one
transformer is expected to test above 500 mg/kg in each year from 2011 to 2014, for a total of
four transformers expected to test above 500 mg/kg between now and 2014.10
If the actual
failure rate turns out to be significantly different than the assumed failure rate, the scheduling of
remediation work will be adjusted accordingly.
In addition, 38 of Newfoundland Power’s transformers have bushings that cannot be tested.
These bushings will have to be replaced by the end of 2014 as their PCB concentration cannot be
determined.
Therefore, a total of 42 transformers will require bushing replacements by 2014 due to either
PCB concentrations at or above 500 mg/kg or because the bushings cannot be tested.
Table 2 provides the Company’s schedule for testing and replacement of power transformer
bushings.
Table 2
Power Transformer Bushing Testing & Replacement Schedule
Year
Remaining
Transformers
to Test
Transformers
Tested
Transformers
that Failed
Testing or
Cannot be
Tested
Transformers
Awaiting
Bushing
Replacement
Transformer
Bushing
Replacement
Year
2010 - 22 9 7 2 in 2010
7 in 2013
2011 (Q1) - 9 1 0 1 in 2011 (Q1)
2011 (Q2-Q4) 36 - - 9 5 in 2011
4 in 2013
2012 45 - - 10 5 in 2012
5 in 2014
2013 45 - - 10 3 in 2013
7 in 2014
2014 11 - - 3 3 in 2014
Total 137 31 10 39 42 in All Yrs
10
Newfoundland Power has tested bushings on 31 transformers to date. Three of the transformers have bushings
that tested greater than 50 mg/kg while none have tested above 500 mg/kg. The CEA PCB Equipment Inventory
from November 2009 (this has not been updated since then) indicates that 1% of tested oil filled bushings have
PCB concentrations in excess of 500 mg/kg. Based upon the CEA results, although all transformer bushings
must be tested, it is likely only 1% will prove to be greater than 500 mg/kg.
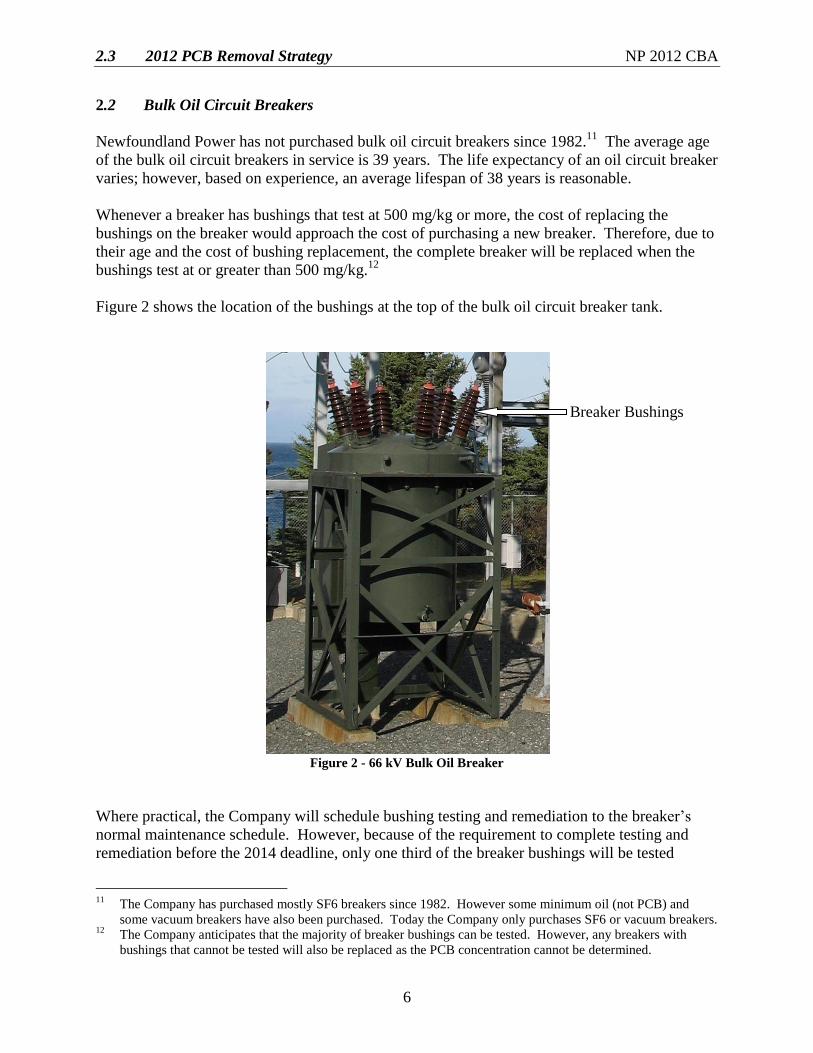
2.3 2012 PCB Removal Strategy NP 2012 CBA
6
2.2 Bulk Oil Circuit Breakers
Newfoundland Power has not purchased bulk oil circuit breakers since 1982.11
The average age
of the bulk oil circuit breakers in service is 39 years. The life expectancy of an oil circuit breaker
varies; however, based on experience, an average lifespan of 38 years is reasonable.
Whenever a breaker has bushings that test at 500 mg/kg or more, the cost of replacing the
bushings on the breaker would approach the cost of purchasing a new breaker. Therefore, due to
their age and the cost of bushing replacement, the complete breaker will be replaced when the
bushings test at or greater than 500 mg/kg.12
Figure 2 shows the location of the bushings at the top of the bulk oil circuit breaker tank.
Figure 2 - 66 kV Bulk Oil Breaker
Where practical, the Company will schedule bushing testing and remediation to the breaker’s
normal maintenance schedule. However, because of the requirement to complete testing and
remediation before the 2014 deadline, only one third of the breaker bushings will be tested
11
The Company has purchased mostly SF6 breakers since 1982. However some minimum oil (not PCB) and
some vacuum breakers have also been purchased. Today the Company only purchases SF6 or vacuum breakers. 12
The Company anticipates that the majority of breaker bushings can be tested. However, any breakers with
bushings that cannot be tested will also be replaced as the PCB concentration cannot be determined.
Breaker Bushings
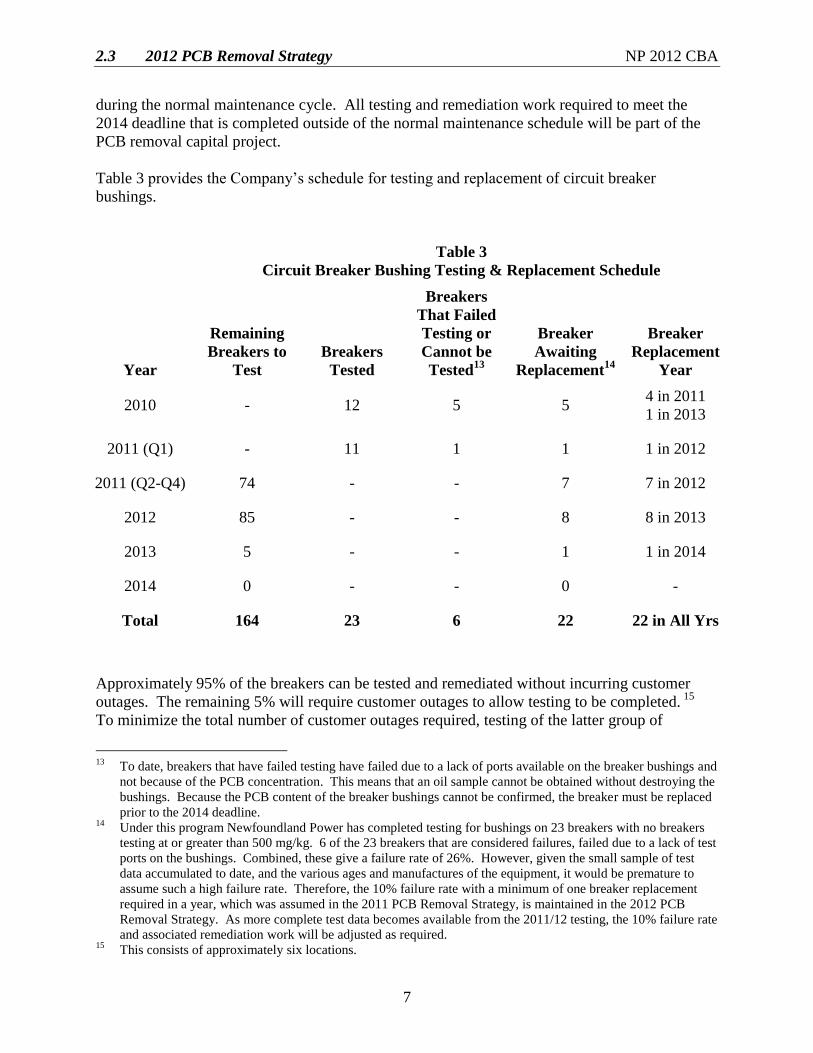
2.3 2012 PCB Removal Strategy NP 2012 CBA
7
during the normal maintenance cycle. All testing and remediation work required to meet the
2014 deadline that is completed outside of the normal maintenance schedule will be part of the
PCB removal capital project.
Table 3 provides the Company’s schedule for testing and replacement of circuit breaker
bushings.
Table 3
Circuit Breaker Bushing Testing & Replacement Schedule
Year
Remaining
Breakers to
Test
Breakers
Tested
Breakers
That Failed
Testing or
Cannot be
Tested13
Breaker
Awaiting
Replacement14
Breaker
Replacement
Year
2010 - 12 5 5 4 in 2011
1 in 2013
2011 (Q1) - 11 1 1 1 in 2012
2011 (Q2-Q4) 74 - - 7 7 in 2012
2012 85 - - 8 8 in 2013
2013 5 - - 1 1 in 2014
2014 0 - - 0 -
Total 164 23 6 22 22 in All Yrs
Approximately 95% of the breakers can be tested and remediated without incurring customer
outages. The remaining 5% will require customer outages to allow testing to be completed. 15
To minimize the total number of customer outages required, testing of the latter group of
13
To date, breakers that have failed testing have failed due to a lack of ports available on the breaker bushings and
not because of the PCB concentration. This means that an oil sample cannot be obtained without destroying the
bushings. Because the PCB content of the breaker bushings cannot be confirmed, the breaker must be replaced
prior to the 2014 deadline. 14
Under this program Newfoundland Power has completed testing for bushings on 23 breakers with no breakers
testing at or greater than 500 mg/kg. 6 of the 23 breakers that are considered failures, failed due to a lack of test
ports on the bushings. Combined, these give a failure rate of 26%. However, given the small sample of test
data accumulated to date, and the various ages and manufactures of the equipment, it would be premature to
assume such a high failure rate. Therefore, the 10% failure rate with a minimum of one breaker replacement
required in a year, which was assumed in the 2011 PCB Removal Strategy, is maintained in the 2012 PCB
Removal Strategy. As more complete test data becomes available from the 2011/12 testing, the 10% failure rate
and associated remediation work will be adjusted as required. 15
This consists of approximately six locations.
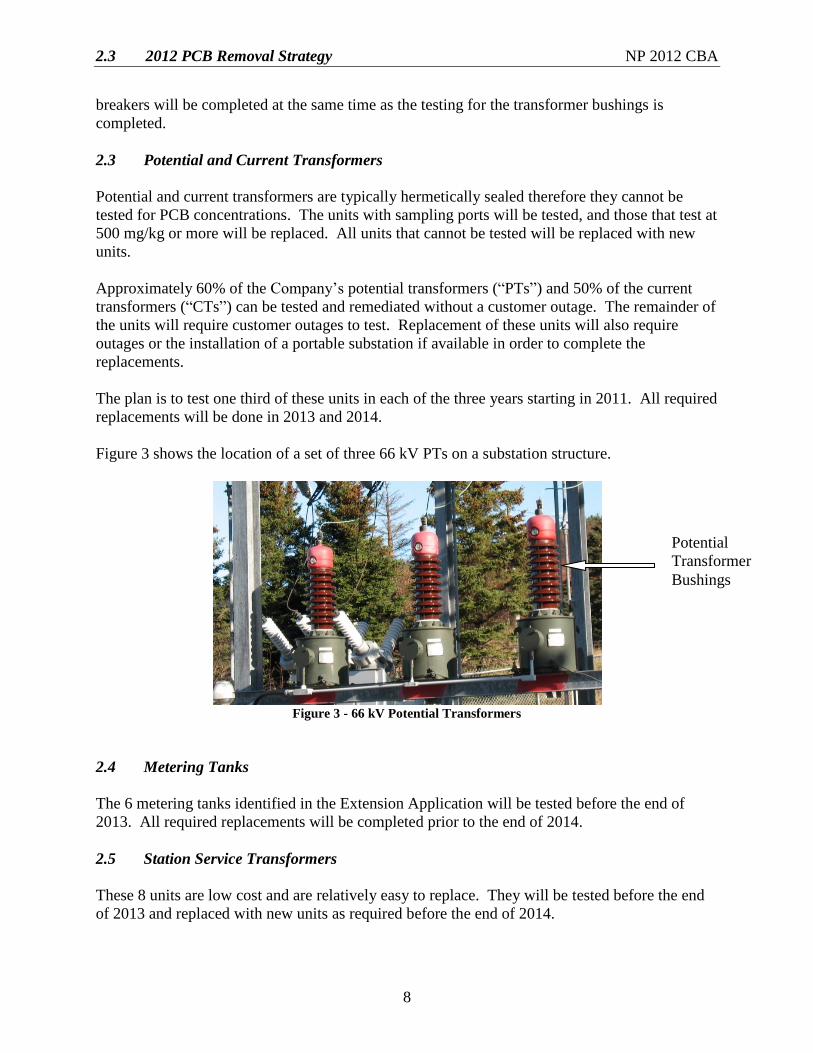
2.3 2012 PCB Removal Strategy NP 2012 CBA
8
breakers will be completed at the same time as the testing for the transformer bushings is
completed.
2.3 Potential and Current Transformers
Potential and current transformers are typically hermetically sealed therefore they cannot be
tested for PCB concentrations. The units with sampling ports will be tested, and those that test at
500 mg/kg or more will be replaced. All units that cannot be tested will be replaced with new
units.
Approximately 60% of the Company’s potential transformers (“PTs”) and 50% of the current
transformers (“CTs”) can be tested and remediated without a customer outage. The remainder of
the units will require customer outages to test. Replacement of these units will also require
outages or the installation of a portable substation if available in order to complete the
replacements.
The plan is to test one third of these units in each of the three years starting in 2011. All required
replacements will be done in 2013 and 2014.
Figure 3 shows the location of a set of three 66 kV PTs on a substation structure.
Figure 3 - 66 kV Potential Transformers
2.4 Metering Tanks
The 6 metering tanks identified in the Extension Application will be tested before the end of
2013. All required replacements will be completed prior to the end of 2014.
2.5 Station Service Transformers
These 8 units are low cost and are relatively easy to replace. They will be tested before the end
of 2013 and replaced with new units as required before the end of 2014.
Potential
Transformer
Bushings
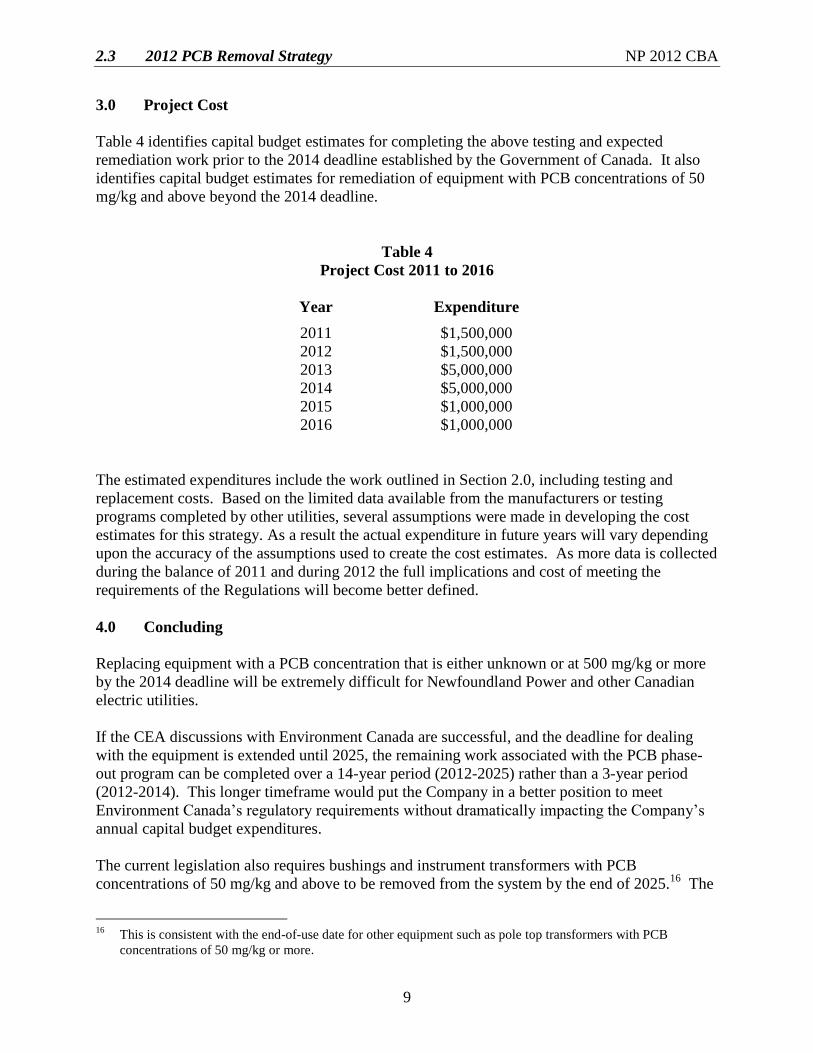
2.3 2012 PCB Removal Strategy NP 2012 CBA
9
3.0 Project Cost
Table 4 identifies capital budget estimates for completing the above testing and expected
remediation work prior to the 2014 deadline established by the Government of Canada. It also
identifies capital budget estimates for remediation of equipment with PCB concentrations of 50
mg/kg and above beyond the 2014 deadline.
Table 4
Project Cost 2011 to 2016
Year Expenditure
2011 $1,500,000
2012 $1,500,000
2013 $5,000,000
2014 $5,000,000
2015
2016
$1,000,000
$1,000,000
The estimated expenditures include the work outlined in Section 2.0, including testing and
replacement costs. Based on the limited data available from the manufacturers or testing
programs completed by other utilities, several assumptions were made in developing the cost
estimates for this strategy. As a result the actual expenditure in future years will vary depending
upon the accuracy of the assumptions used to create the cost estimates. As more data is collected
during the balance of 2011 and during 2012 the full implications and cost of meeting the
requirements of the Regulations will become better defined.
4.0 Concluding
Replacing equipment with a PCB concentration that is either unknown or at 500 mg/kg or more
by the 2014 deadline will be extremely difficult for Newfoundland Power and other Canadian
electric utilities.
If the CEA discussions with Environment Canada are successful, and the deadline for dealing
with the equipment is extended until 2025, the remaining work associated with the PCB phase-
out program can be completed over a 14-year period (2012-2025) rather than a 3-year period
(2012-2014). This longer timeframe would put the Company in a better position to meet
Environment Canada’s regulatory requirements without dramatically impacting the Company’s
annual capital budget expenditures.
The current legislation also requires bushings and instrument transformers with PCB
concentrations of 50 mg/kg and above to be removed from the system by the end of 2025.16
The
16
This is consistent with the end-of-use date for other equipment such as pole top transformers with PCB
concentrations of 50 mg/kg or more.

2.3 2012 PCB Removal Strategy NP 2012 CBA
10
implication is that expenditures on PCB remediation will likely continue until 2025. The work
completed in 2011 and proposed for 2012 will allow clearer identification of the future
remediation that will be required to meet the Regulations.
This project as presented is required to allow Newfoundland Power to meet its obligations as
stated in the Extension Application and subsequent approval by Environment Canada.
2.4 Portable Substation Study NP 2012 CBA
Portable Substation Study
June 2011
Prepared by:
Lome W. Thompson, P. Eng.
I - - - - A FORTIS COMPANY
2.4 Portable Substation Study NP 2012 CBA
i
Table of Contents
Page
1.0 Introduction ...................................................................................................................... 1
2.0 Background ....................................................................................................................... 2
2.1 Newfoundland Power’s Power Transformer Fleet ............................................... 2
2.2 Industry Experience .............................................................................................. 3
2.3 Emergency Response ............................................................................................ 4
2.4 Substation Capital Program .................................................................................. 5
2.5 Transformer Maintenance ..................................................................................... 6
2.6 Summary ............................................................................................................... 6
3.0 Portable Substations .......................................................................................................... 7
3.1 Description of Portable Substations ...................................................................... 7
3.2 Back-up Capability ............................................................................................... 8
3.3 Utilization of Existing Portable Substations ......................................................... 9
3.4 Concluding .......................................................................................................... 11
4.0 Assessment of Alternatives ............................................................................................. 11
4.1 Ensure Availability of an Existing Portable Substation ...................................... 11
4.2 Establish an Inventory of Spare Transformers .................................................... 12
4.3 N-1 Transformer Back-up Criterion ................................................................... 13
4.4 Purchase a New Portable Substation................................................................... 14
4.5 Recommendation ................................................................................................ 14
Appendix A: Power Transformer Failures 2007 to Present
Appendix B: Portable Substations Single Line Diagrams
Appendix C: Power Transformer Listing and Portable Back-up
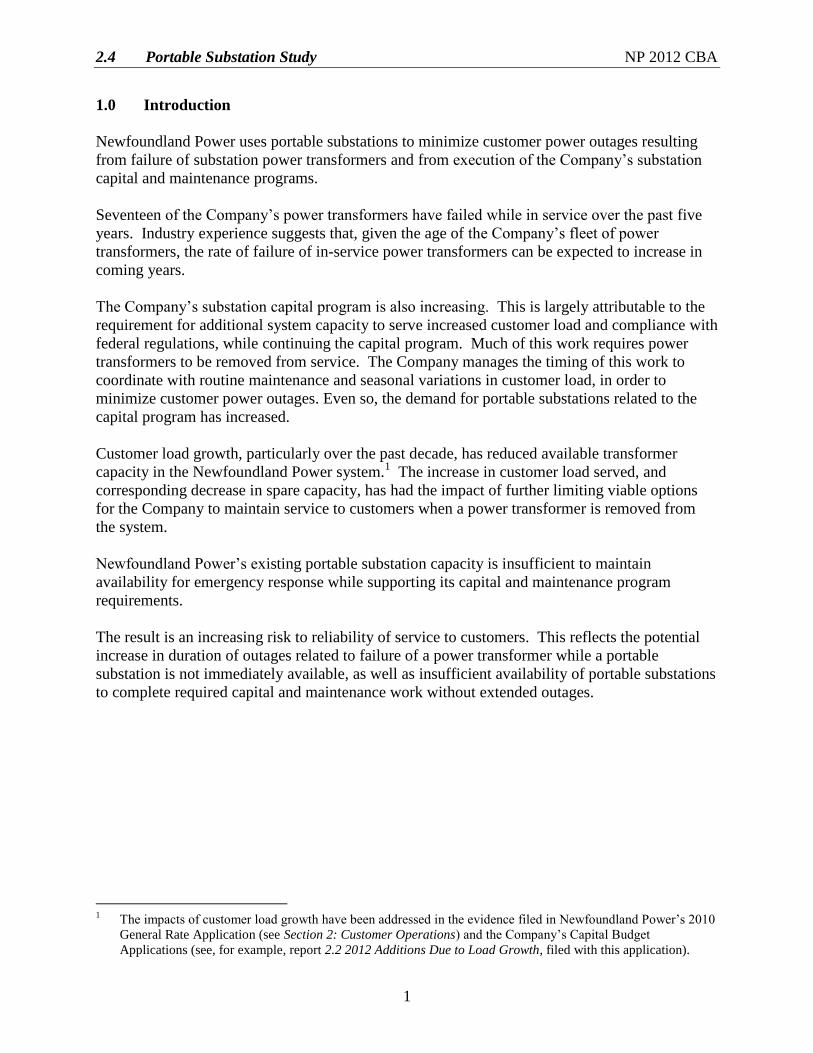
2.4 Portable Substation Study NP 2012 CBA
1
1.0 Introduction
Newfoundland Power uses portable substations to minimize customer power outages resulting
from failure of substation power transformers and from execution of the Company’s substation
capital and maintenance programs.
Seventeen of the Company’s power transformers have failed while in service over the past five
years. Industry experience suggests that, given the age of the Company’s fleet of power
transformers, the rate of failure of in-service power transformers can be expected to increase in
coming years.
The Company’s substation capital program is also increasing. This is largely attributable to the
requirement for additional system capacity to serve increased customer load and compliance with
federal regulations, while continuing the capital program. Much of this work requires power
transformers to be removed from service. The Company manages the timing of this work to
coordinate with routine maintenance and seasonal variations in customer load, in order to
minimize customer power outages. Even so, the demand for portable substations related to the
capital program has increased.
Customer load growth, particularly over the past decade, has reduced available transformer
capacity in the Newfoundland Power system.1 The increase in customer load served, and
corresponding decrease in spare capacity, has had the impact of further limiting viable options
for the Company to maintain service to customers when a power transformer is removed from
the system.
Newfoundland Power’s existing portable substation capacity is insufficient to maintain
availability for emergency response while supporting its capital and maintenance program
requirements.
The result is an increasing risk to reliability of service to customers. This reflects the potential
increase in duration of outages related to failure of a power transformer while a portable
substation is not immediately available, as well as insufficient availability of portable substations
to complete required capital and maintenance work without extended outages.
1 The impacts of customer load growth have been addressed in the evidence filed in Newfoundland Power’s 2010
General Rate Application (see Section 2: Customer Operations) and the Company’s Capital Budget
Applications (see, for example, report 2.2 2012 Additions Due to Load Growth, filed with this application).
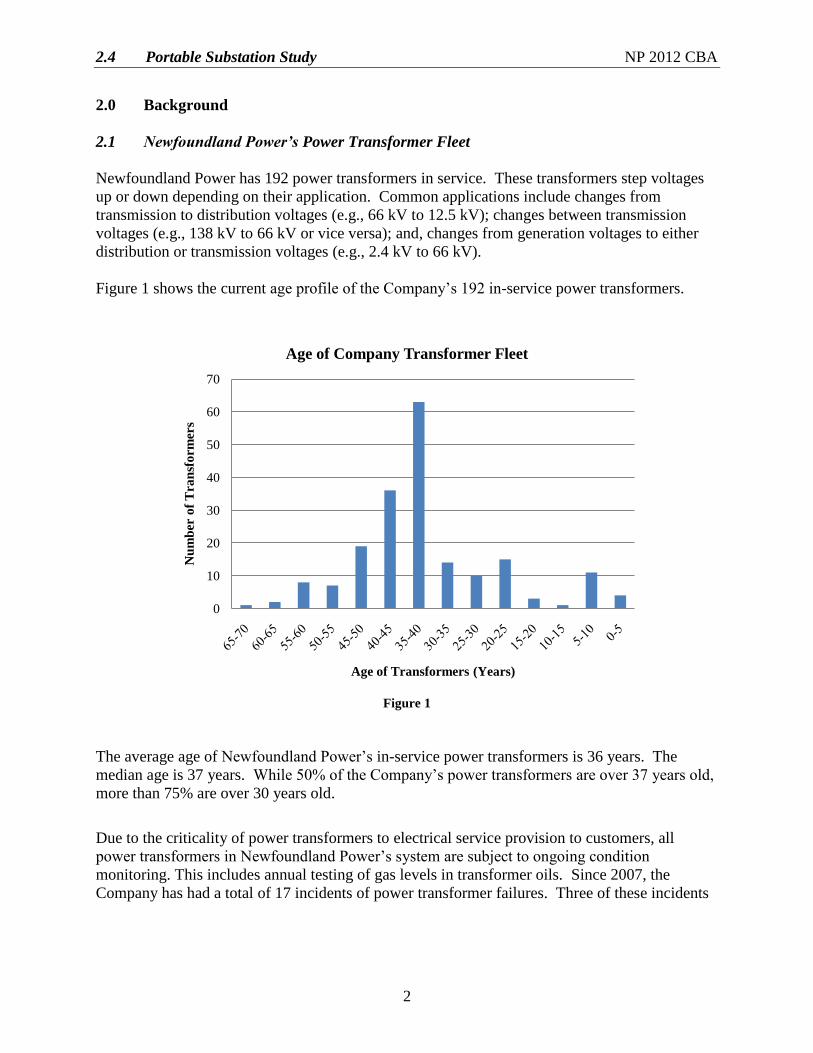
2.4 Portable Substation Study NP 2012 CBA
2
2.0 Background
2.1 Newfoundland Power’s Power Transformer Fleet
Newfoundland Power has 192 power transformers in service. These transformers step voltages
up or down depending on their application. Common applications include changes from
transmission to distribution voltages (e.g., 66 kV to 12.5 kV); changes between transmission
voltages (e.g., 138 kV to 66 kV or vice versa); and, changes from generation voltages to either
distribution or transmission voltages (e.g., 2.4 kV to 66 kV).
Figure 1 shows the current age profile of the Company’s 192 in-service power transformers.
Figure 1
The average age of Newfoundland Power’s in-service power transformers is 36 years. The
median age is 37 years. While 50% of the Company’s power transformers are over 37 years old,
more than 75% are over 30 years old.
Due to the criticality of power transformers to electrical service provision to customers, all
power transformers in Newfoundland Power’s system are subject to ongoing condition
monitoring. This includes annual testing of gas levels in transformer oils. Since 2007, the
Company has had a total of 17 incidents of power transformer failures. Three of these incidents
0
10
20
30
40
50
60
70
Nu
mb
er o
f T
ran
sfo
rmer
s
Age of Transformers (Years)
Age of Company Transformer Fleet
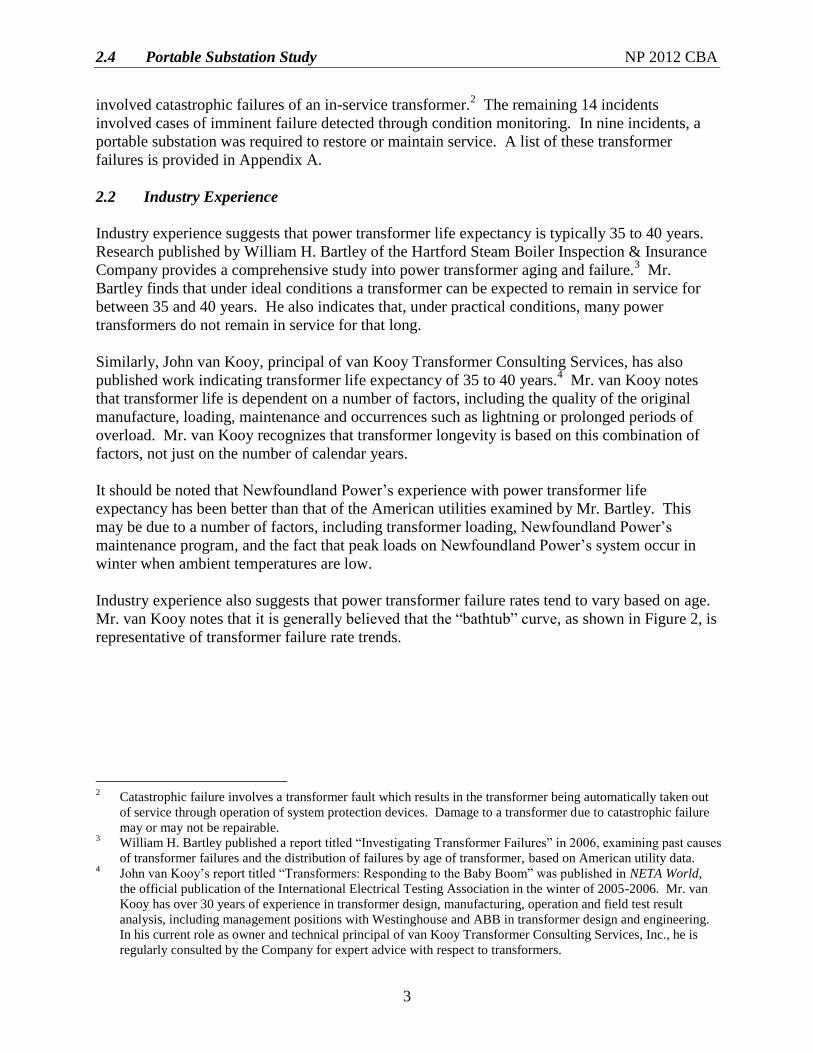
2.4 Portable Substation Study NP 2012 CBA
3
involved catastrophic failures of an in-service transformer.2 The remaining 14 incidents
involved cases of imminent failure detected through condition monitoring. In nine incidents, a
portable substation was required to restore or maintain service. A list of these transformer
failures is provided in Appendix A.
2.2 Industry Experience
Industry experience suggests that power transformer life expectancy is typically 35 to 40 years.
Research published by William H. Bartley of the Hartford Steam Boiler Inspection & Insurance
Company provides a comprehensive study into power transformer aging and failure.3 Mr.
Bartley finds that under ideal conditions a transformer can be expected to remain in service for
between 35 and 40 years. He also indicates that, under practical conditions, many power
transformers do not remain in service for that long.
Similarly, John van Kooy, principal of van Kooy Transformer Consulting Services, has also
published work indicating transformer life expectancy of 35 to 40 years.4 Mr. van Kooy notes
that transformer life is dependent on a number of factors, including the quality of the original
manufacture, loading, maintenance and occurrences such as lightning or prolonged periods of
overload. Mr. van Kooy recognizes that transformer longevity is based on this combination of
factors, not just on the number of calendar years.
It should be noted that Newfoundland Power’s experience with power transformer life
expectancy has been better than that of the American utilities examined by Mr. Bartley. This
may be due to a number of factors, including transformer loading, Newfoundland Power’s
maintenance program, and the fact that peak loads on Newfoundland Power’s system occur in
winter when ambient temperatures are low.
Industry experience also suggests that power transformer failure rates tend to vary based on age.
Mr. van Kooy notes that it is generally believed that the “bathtub” curve, as shown in Figure 2, is
representative of transformer failure rate trends.
2 Catastrophic failure involves a transformer fault which results in the transformer being automatically taken out
of service through operation of system protection devices. Damage to a transformer due to catastrophic failure
may or may not be repairable. 3 William H. Bartley published a report titled “Investigating Transformer Failures” in 2006, examining past causes
of transformer failures and the distribution of failures by age of transformer, based on American utility data. 4 John van Kooy’s report titled “Transformers: Responding to the Baby Boom” was published in NETA World,
the official publication of the International Electrical Testing Association in the winter of 2005-2006. Mr. van
Kooy has over 30 years of experience in transformer design, manufacturing, operation and field test result
analysis, including management positions with Westinghouse and ABB in transformer design and engineering.
In his current role as owner and technical principal of van Kooy Transformer Consulting Services, Inc., he is
regularly consulted by the Company for expert advice with respect to transformers.
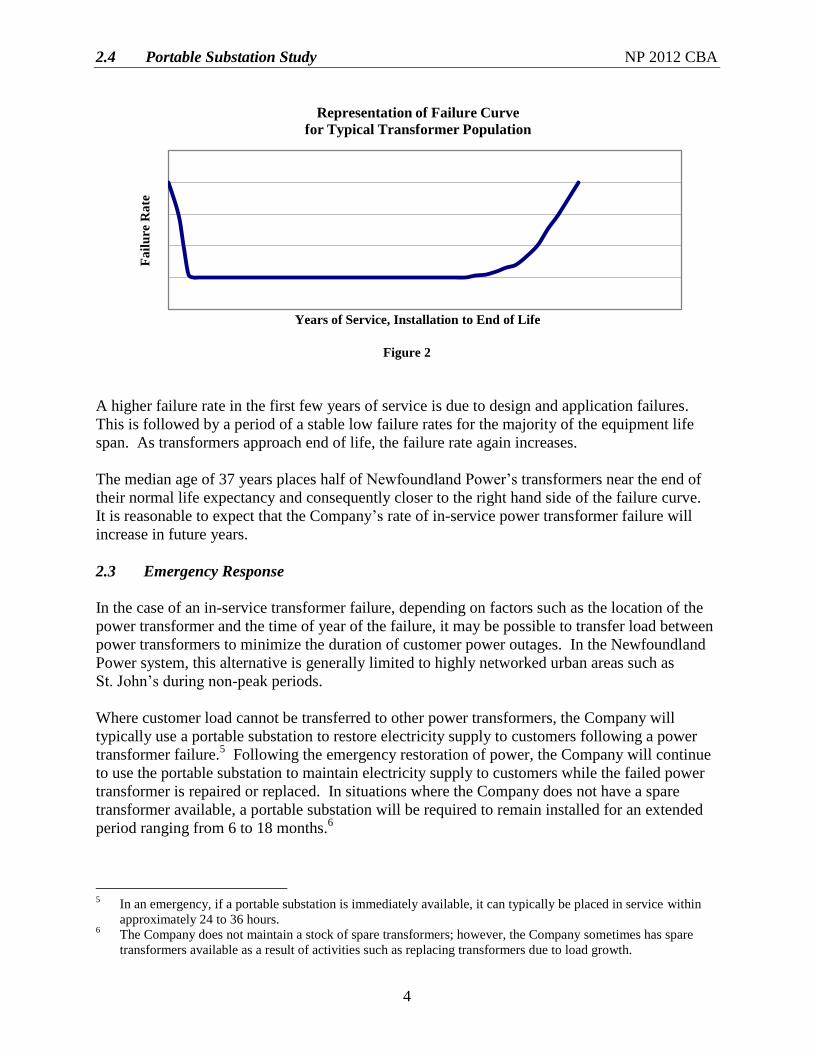
2.4 Portable Substation Study NP 2012 CBA
4
Figure 2
A higher failure rate in the first few years of service is due to design and application failures.
This is followed by a period of a stable low failure rates for the majority of the equipment life
span. As transformers approach end of life, the failure rate again increases.
The median age of 37 years places half of Newfoundland Power’s transformers near the end of
their normal life expectancy and consequently closer to the right hand side of the failure curve.
It is reasonable to expect that the Company’s rate of in-service power transformer failure will
increase in future years.
2.3 Emergency Response
In the case of an in-service transformer failure, depending on factors such as the location of the
power transformer and the time of year of the failure, it may be possible to transfer load between
power transformers to minimize the duration of customer power outages. In the Newfoundland
Power system, this alternative is generally limited to highly networked urban areas such as
St. John’s during non-peak periods.
Where customer load cannot be transferred to other power transformers, the Company will
typically use a portable substation to restore electricity supply to customers following a power
transformer failure.5 Following the emergency restoration of power, the Company will continue
to use the portable substation to maintain electricity supply to customers while the failed power
transformer is repaired or replaced. In situations where the Company does not have a spare
transformer available, a portable substation will be required to remain installed for an extended
period ranging from 6 to 18 months.6
5 In an emergency, if a portable substation is immediately available, it can typically be placed in service within
approximately 24 to 36 hours. 6 The Company does not maintain a stock of spare transformers; however, the Company sometimes has spare
transformers available as a result of activities such as replacing transformers due to load growth.
Fa
ilu
re R
ate
Years of Service, Installation to End of Life
Representation of Failure Curve
for Typical Transformer Population
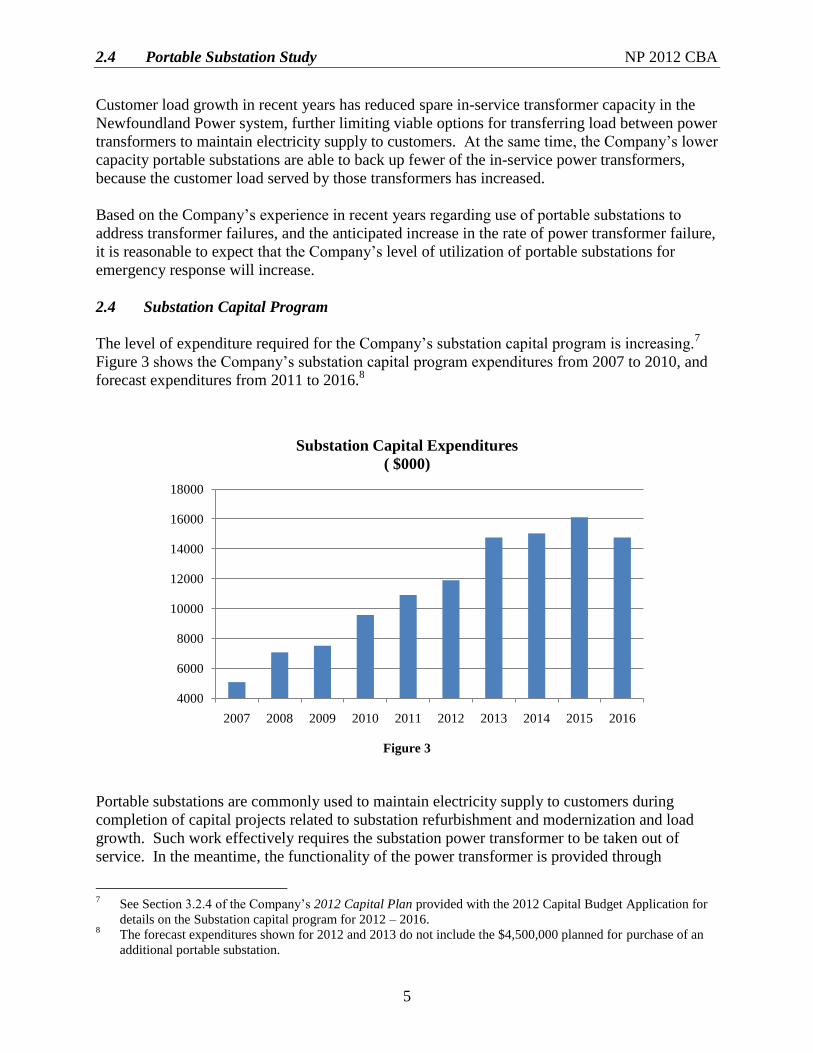
2.4 Portable Substation Study NP 2012 CBA
5
Customer load growth in recent years has reduced spare in-service transformer capacity in the
Newfoundland Power system, further limiting viable options for transferring load between power
transformers to maintain electricity supply to customers. At the same time, the Company’s lower
capacity portable substations are able to back up fewer of the in-service power transformers,
because the customer load served by those transformers has increased.
Based on the Company’s experience in recent years regarding use of portable substations to
address transformer failures, and the anticipated increase in the rate of power transformer failure,
it is reasonable to expect that the Company’s level of utilization of portable substations for
emergency response will increase.
2.4 Substation Capital Program
The level of expenditure required for the Company’s substation capital program is increasing.7
Figure 3 shows the Company’s substation capital program expenditures from 2007 to 2010, and
forecast expenditures from 2011 to 2016.8
Figure 3
Portable substations are commonly used to maintain electricity supply to customers during
completion of capital projects related to substation refurbishment and modernization and load
growth. Such work effectively requires the substation power transformer to be taken out of
service. In the meantime, the functionality of the power transformer is provided through
7 See Section 3.2.4 of the Company’s 2012 Capital Plan provided with the 2012 Capital Budget Application for
details on the Substation capital program for 2012 – 2016. 8 The forecast expenditures shown for 2012 and 2013 do not include the $4,500,000 planned for purchase of an
additional portable substation.
4000
6000
8000
10000
12000
14000
16000
18000
2007 2008 2009 2010 2011 2012 2013 2014 2015 2016
Substation Capital Expenditures
( $000)
2.4 Portable Substation Study NP 2012 CBA
6
installation of a portable substation. When used for this purpose, a portable substation may be
installed at a substation for between 2 and 7 months, depending on the extent of the planned
work.
For the foreseeable future, Newfoundland Power does not anticipate any material change in the
utilization of its portable substations in connection with the Company’s capital program.
2.5 Transformer Maintenance
The Company performs regular maintenance on power transformers. This maintenance often
requires the transformer to be taken out of service. Where customer load cannot be transferred to
other substation transformers, such as in areas served by radial transmission systems,
maintenance can require extended customer outages.9 Portable substations allow the Company
to complete the required maintenance without such extended outages. This type of usage
typically requires the portable substation to be in service for 5 to 6 weeks per maintenance
project.
For the foreseeable future, Newfoundland Power does not anticipate any material change in the
utilization of its portable substations in connection with regular power transformer maintenance.
2.6 Summary
As illustrated in Figure 4, portable substation usage is driven by three requirements: (1)
emergency restoration of service following a substation power transformer failure, (2) support
for the capital program, and (3) support for the maintenance program.
Figure 4
9 Typically, scheduled power transformer maintenance takes approximately 2 to 4 weeks (or 75 to 150 working
hours) for a maintenance crew to complete. Compressing this work schedule to reduce customer outages would
require extended work hours at overtime rates and increase maintenance costs.
Need for Portables
Maintenance Program
Capital Program
Emergency Response
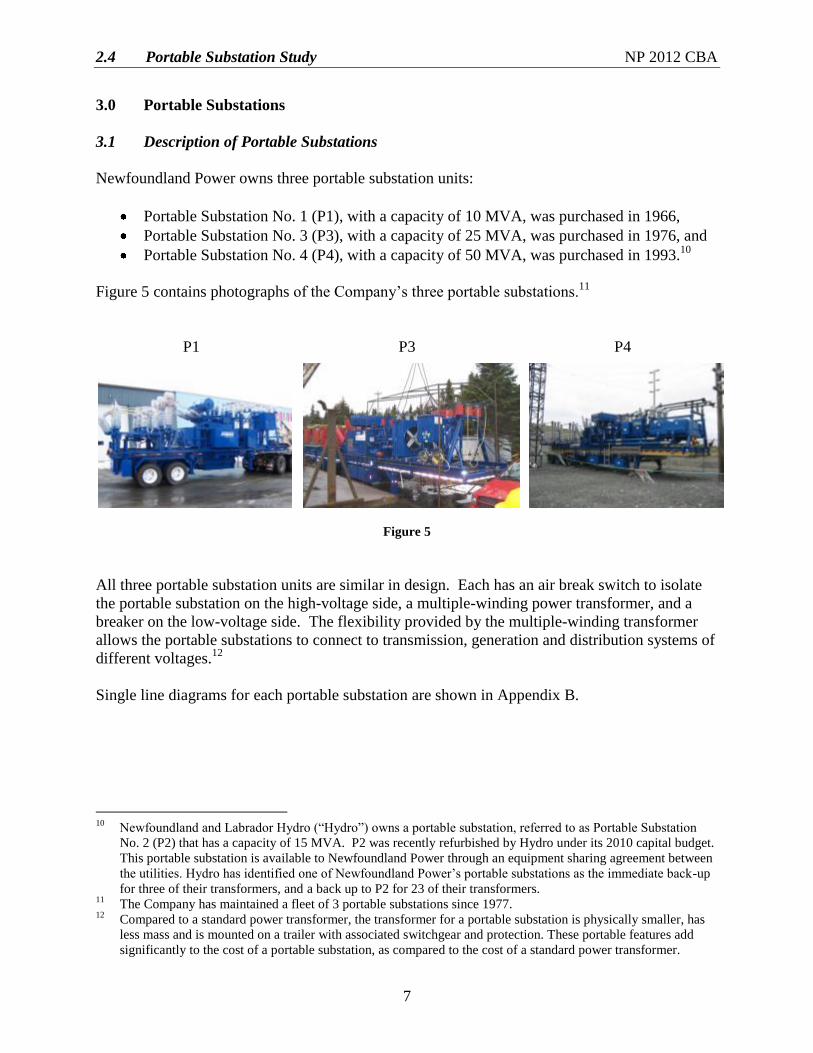
2.4 Portable Substation Study NP 2012 CBA
7
3.0 Portable Substations
3.1 Description of Portable Substations
Newfoundland Power owns three portable substation units:
Portable Substation No. 1 (P1), with a capacity of 10 MVA, was purchased in 1966,
Portable Substation No. 3 (P3), with a capacity of 25 MVA, was purchased in 1976, and
Portable Substation No. 4 (P4), with a capacity of 50 MVA, was purchased in 1993.10
Figure 5 contains photographs of the Company’s three portable substations.11
P1 P3 P4
Figure 5
All three portable substation units are similar in design. Each has an air break switch to isolate
the portable substation on the high-voltage side, a multiple-winding power transformer, and a
breaker on the low-voltage side. The flexibility provided by the multiple-winding transformer
allows the portable substations to connect to transmission, generation and distribution systems of
different voltages.12
Single line diagrams for each portable substation are shown in Appendix B.
10
Newfoundland and Labrador Hydro (“Hydro”) owns a portable substation, referred to as Portable Substation
No. 2 (P2) that has a capacity of 15 MVA. P2 was recently refurbished by Hydro under its 2010 capital budget.
This portable substation is available to Newfoundland Power through an equipment sharing agreement between
the utilities. Hydro has identified one of Newfoundland Power’s portable substations as the immediate back-up
for three of their transformers, and a back up to P2 for 23 of their transformers. 11
The Company has maintained a fleet of 3 portable substations since 1977. 12
Compared to a standard power transformer, the transformer for a portable substation is physically smaller, has
less mass and is mounted on a trailer with associated switchgear and protection. These portable features add
significantly to the cost of a portable substation, as compared to the cost of a standard power transformer.
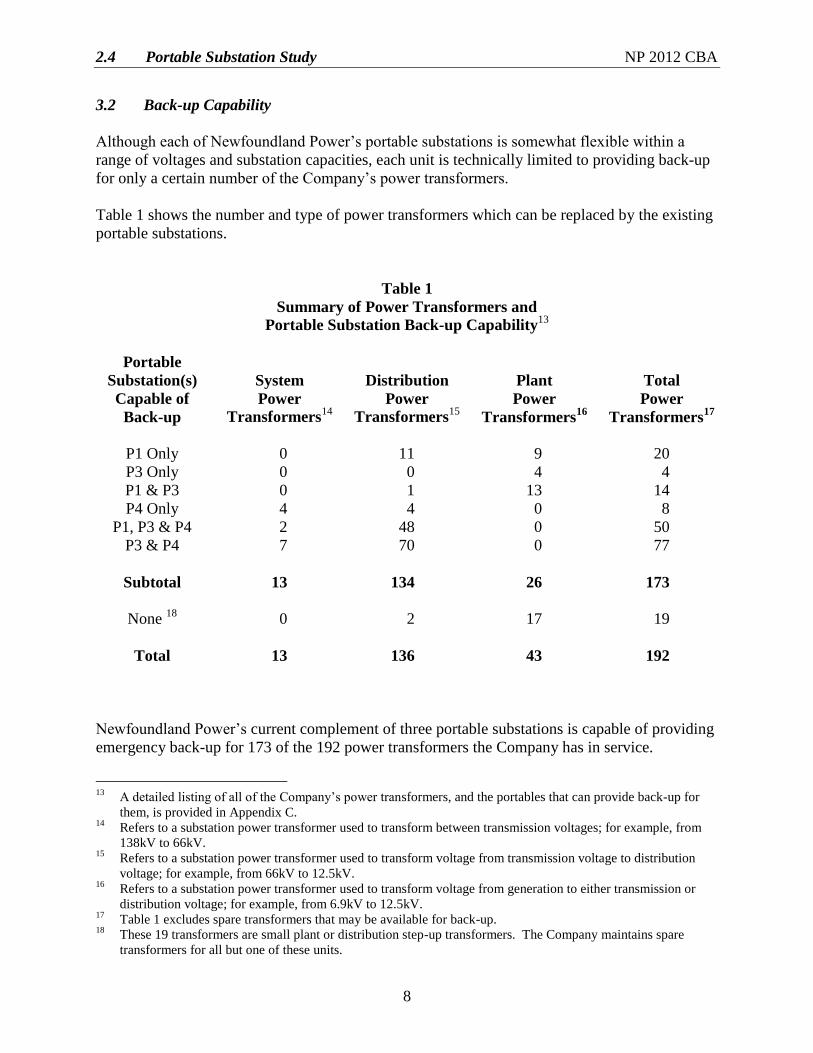
2.4 Portable Substation Study NP 2012 CBA
8
3.2 Back-up Capability
Although each of Newfoundland Power’s portable substations is somewhat flexible within a
range of voltages and substation capacities, each unit is technically limited to providing back-up
for only a certain number of the Company’s power transformers.
Table 1 shows the number and type of power transformers which can be replaced by the existing
portable substations.
Table 1
Summary of Power Transformers and
Portable Substation Back-up Capability13
Portable
Substation(s)
Capable of
Back-up
System
Power
Transformers14
Distribution
Power
Transformers15
Plant
Power
Transformers16
Total
Power
Transformers17
P1 Only
0
11
9
20
P3 Only 0 0 4 4
P1 & P3 0 1 13 14
P4 Only 4 4 0 8
P1, P3 & P4 2 48 0 50
P3 & P4 7 70 0 77
Subtotal
13
134
26
173
None 18
0 2 17 19
Total
13
136
43
192
Newfoundland Power’s current complement of three portable substations is capable of providing
emergency back-up for 173 of the 192 power transformers the Company has in service.
13
A detailed listing of all of the Company’s power transformers, and the portables that can provide back-up for
them, is provided in Appendix C. 14
Refers to a substation power transformer used to transform between transmission voltages; for example, from
138kV to 66kV. 15
Refers to a substation power transformer used to transform voltage from transmission voltage to distribution
voltage; for example, from 66kV to 12.5kV. 16
Refers to a substation power transformer used to transform voltage from generation to either transmission or
distribution voltage; for example, from 6.9kV to 12.5kV. 17
Table 1 excludes spare transformers that may be available for back-up. 18
These 19 transformers are small plant or distribution step-up transformers. The Company maintains spare
transformers for all but one of these units.
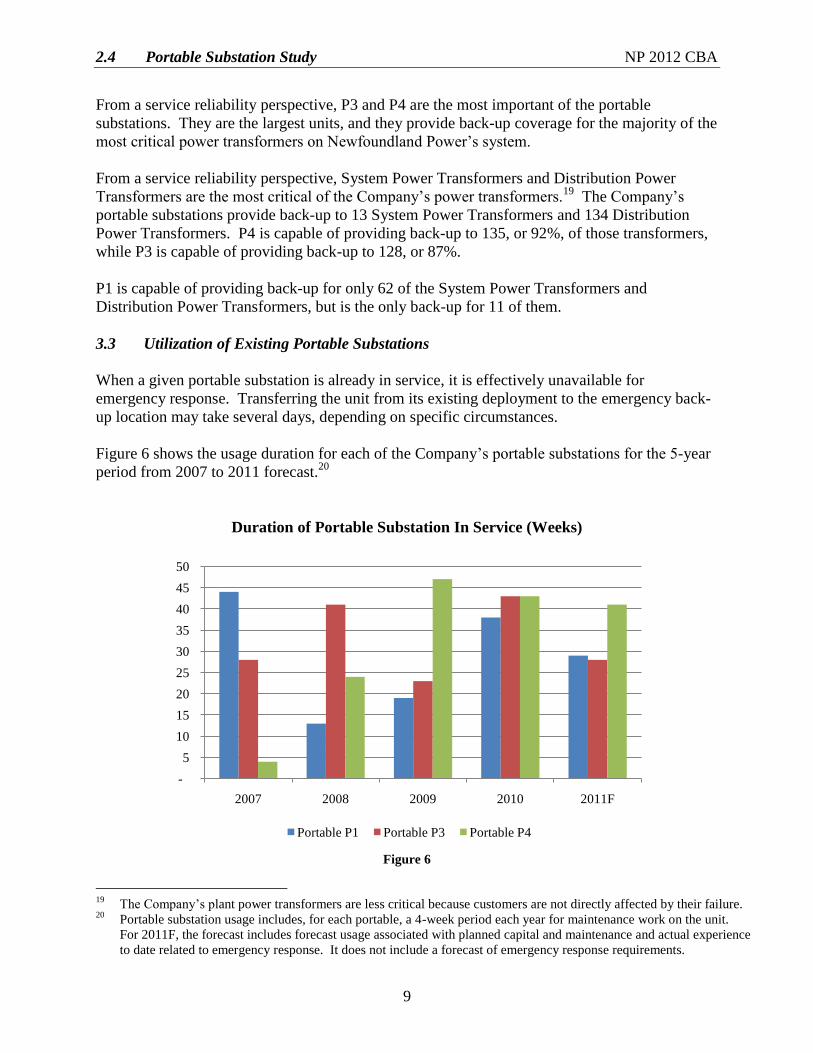
2.4 Portable Substation Study NP 2012 CBA
9
From a service reliability perspective, P3 and P4 are the most important of the portable
substations. They are the largest units, and they provide back-up coverage for the majority of the
most critical power transformers on Newfoundland Power’s system.
From a service reliability perspective, System Power Transformers and Distribution Power
Transformers are the most critical of the Company’s power transformers.19
The Company’s
portable substations provide back-up to 13 System Power Transformers and 134 Distribution
Power Transformers. P4 is capable of providing back-up to 135, or 92%, of those transformers,
while P3 is capable of providing back-up to 128, or 87%.
P1 is capable of providing back-up for only 62 of the System Power Transformers and
Distribution Power Transformers, but is the only back-up for 11 of them.
3.3 Utilization of Existing Portable Substations
When a given portable substation is already in service, it is effectively unavailable for
emergency response. Transferring the unit from its existing deployment to the emergency back-
up location may take several days, depending on specific circumstances.
Figure 6 shows the usage duration for each of the Company’s portable substations for the 5-year
period from 2007 to 2011 forecast.20
Duration of Portable Substation In Service (Weeks)
Figure 6
19
The Company’s plant power transformers are less critical because customers are not directly affected by their failure. 20
Portable substation usage includes, for each portable, a 4-week period each year for maintenance work on the unit.
For 2011F, the forecast includes forecast usage associated with planned capital and maintenance and actual experience
to date related to emergency response. It does not include a forecast of emergency response requirements.
-
5
10
15
20
25
30
35
40
45
50
2007 2008 2009 2010 2011F
Portable P1 Portable P3 Portable P4
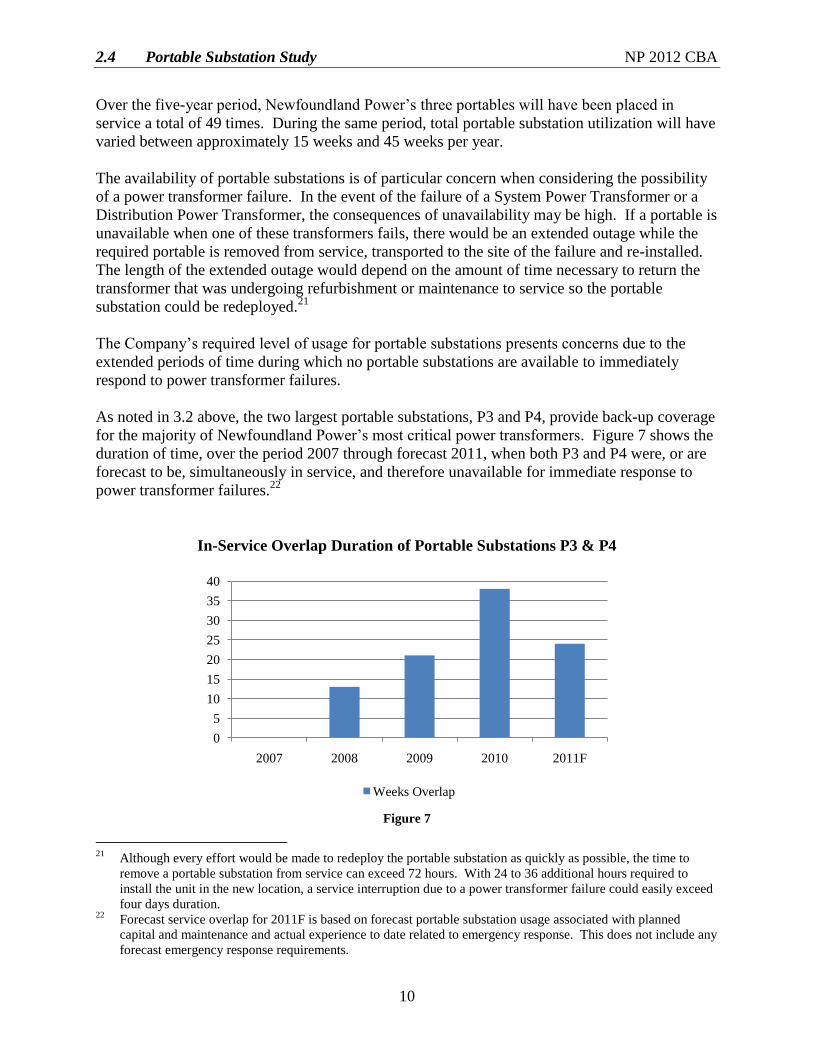
2.4 Portable Substation Study NP 2012 CBA
10
Over the five-year period, Newfoundland Power’s three portables will have been placed in
service a total of 49 times. During the same period, total portable substation utilization will have
varied between approximately 15 weeks and 45 weeks per year.
The availability of portable substations is of particular concern when considering the possibility
of a power transformer failure. In the event of the failure of a System Power Transformer or a
Distribution Power Transformer, the consequences of unavailability may be high. If a portable is
unavailable when one of these transformers fails, there would be an extended outage while the
required portable is removed from service, transported to the site of the failure and re-installed.
The length of the extended outage would depend on the amount of time necessary to return the
transformer that was undergoing refurbishment or maintenance to service so the portable
substation could be redeployed.21
The Company’s required level of usage for portable substations presents concerns due to the
extended periods of time during which no portable substations are available to immediately
respond to power transformer failures.
As noted in 3.2 above, the two largest portable substations, P3 and P4, provide back-up coverage
for the majority of Newfoundland Power’s most critical power transformers. Figure 7 shows the
duration of time, over the period 2007 through forecast 2011, when both P3 and P4 were, or are
forecast to be, simultaneously in service, and therefore unavailable for immediate response to
power transformer failures.22
In-Service Overlap Duration of Portable Substations P3 & P4
Figure 7
21
Although every effort would be made to redeploy the portable substation as quickly as possible, the time to
remove a portable substation from service can exceed 72 hours. With 24 to 36 additional hours required to
install the unit in the new location, a service interruption due to a power transformer failure could easily exceed
four days duration. 22
Forecast service overlap for 2011F is based on forecast portable substation usage associated with planned
capital and maintenance and actual experience to date related to emergency response. This does not include any
forecast emergency response requirements.
0
5
10
15
20
25
30
35
40
2007 2008 2009 2010 2011F
Weeks Overlap
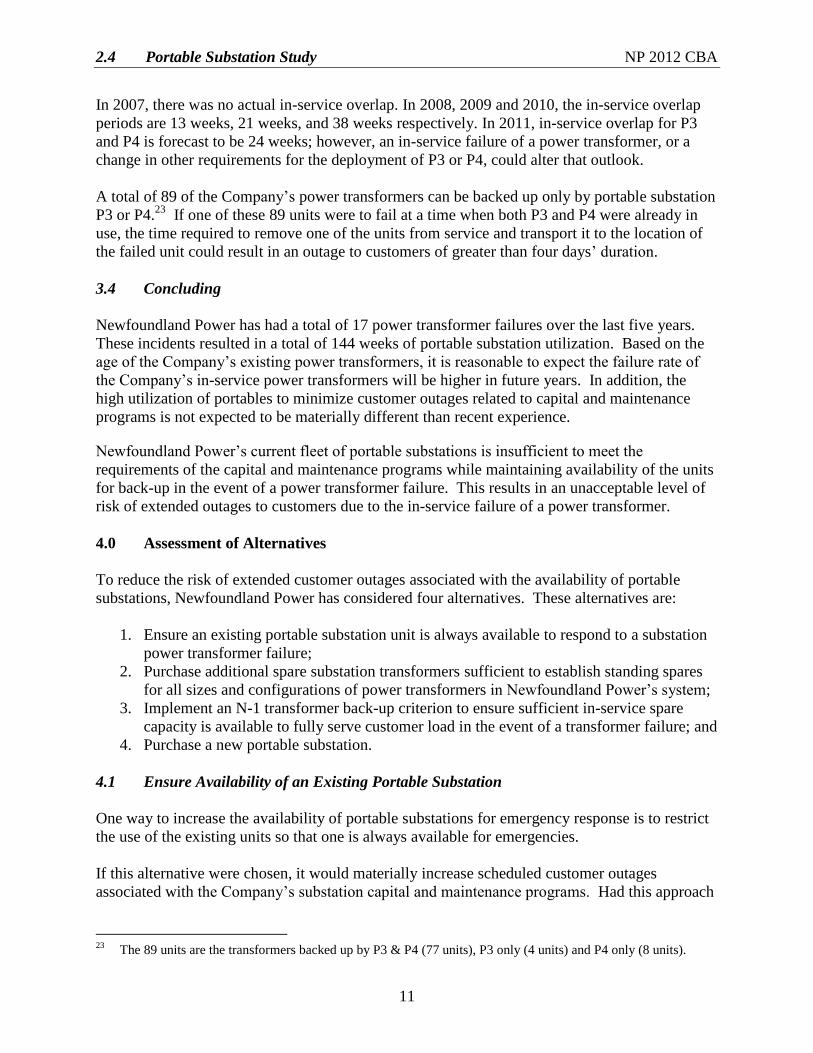
2.4 Portable Substation Study NP 2012 CBA
11
In 2007, there was no actual in-service overlap. In 2008, 2009 and 2010, the in-service overlap
periods are 13 weeks, 21 weeks, and 38 weeks respectively. In 2011, in-service overlap for P3
and P4 is forecast to be 24 weeks; however, an in-service failure of a power transformer, or a
change in other requirements for the deployment of P3 or P4, could alter that outlook.
A total of 89 of the Company’s power transformers can be backed up only by portable substation
P3 or P4.23
If one of these 89 units were to fail at a time when both P3 and P4 were already in
use, the time required to remove one of the units from service and transport it to the location of
the failed unit could result in an outage to customers of greater than four days’ duration.
3.4 Concluding
Newfoundland Power has had a total of 17 power transformer failures over the last five years.
These incidents resulted in a total of 144 weeks of portable substation utilization. Based on the
age of the Company’s existing power transformers, it is reasonable to expect the failure rate of
the Company’s in-service power transformers will be higher in future years. In addition, the
high utilization of portables to minimize customer outages related to capital and maintenance
programs is not expected to be materially different than recent experience.
Newfoundland Power’s current fleet of portable substations is insufficient to meet the
requirements of the capital and maintenance programs while maintaining availability of the units
for back-up in the event of a power transformer failure. This results in an unacceptable level of
risk of extended outages to customers due to the in-service failure of a power transformer.
4.0 Assessment of Alternatives
To reduce the risk of extended customer outages associated with the availability of portable
substations, Newfoundland Power has considered four alternatives. These alternatives are:
1. Ensure an existing portable substation unit is always available to respond to a substation
power transformer failure;
2. Purchase additional spare substation transformers sufficient to establish standing spares
for all sizes and configurations of power transformers in Newfoundland Power’s system;
3. Implement an N-1 transformer back-up criterion to ensure sufficient in-service spare
capacity is available to fully serve customer load in the event of a transformer failure; and
4. Purchase a new portable substation.
4.1 Ensure Availability of an Existing Portable Substation
One way to increase the availability of portable substations for emergency response is to restrict
the use of the existing units so that one is always available for emergencies.
If this alternative were chosen, it would materially increase scheduled customer outages
associated with the Company’s substation capital and maintenance programs. Had this approach
23
The 89 units are the transformers backed up by P3 & P4 (77 units), P3 only (4 units) and P4 only (8 units).
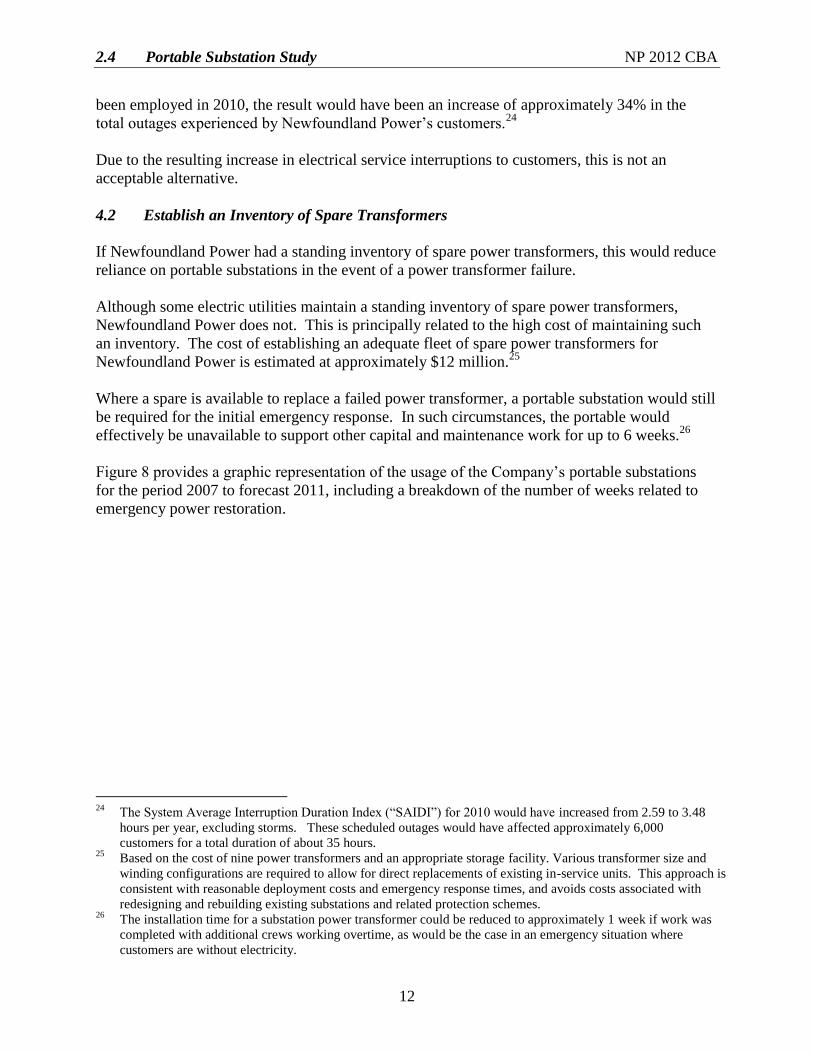
2.4 Portable Substation Study NP 2012 CBA
12
been employed in 2010, the result would have been an increase of approximately 34% in the
total outages experienced by Newfoundland Power’s customers.24
Due to the resulting increase in electrical service interruptions to customers, this is not an
acceptable alternative.
4.2 Establish an Inventory of Spare Transformers
If Newfoundland Power had a standing inventory of spare power transformers, this would reduce
reliance on portable substations in the event of a power transformer failure.
Although some electric utilities maintain a standing inventory of spare power transformers,
Newfoundland Power does not. This is principally related to the high cost of maintaining such
an inventory. The cost of establishing an adequate fleet of spare power transformers for
Newfoundland Power is estimated at approximately $12 million.25
Where a spare is available to replace a failed power transformer, a portable substation would still
be required for the initial emergency response. In such circumstances, the portable would
effectively be unavailable to support other capital and maintenance work for up to 6 weeks.26
Figure 8 provides a graphic representation of the usage of the Company’s portable substations
for the period 2007 to forecast 2011, including a breakdown of the number of weeks related to
emergency power restoration.
24
The System Average Interruption Duration Index (“SAIDI”) for 2010 would have increased from 2.59 to 3.48
hours per year, excluding storms. These scheduled outages would have affected approximately 6,000
customers for a total duration of about 35 hours. 25
Based on the cost of nine power transformers and an appropriate storage facility. Various transformer size and
winding configurations are required to allow for direct replacements of existing in-service units. This approach is
consistent with reasonable deployment costs and emergency response times, and avoids costs associated with
redesigning and rebuilding existing substations and related protection schemes. 26
The installation time for a substation power transformer could be reduced to approximately 1 week if work was
completed with additional crews working overtime, as would be the case in an emergency situation where
customers are without electricity.
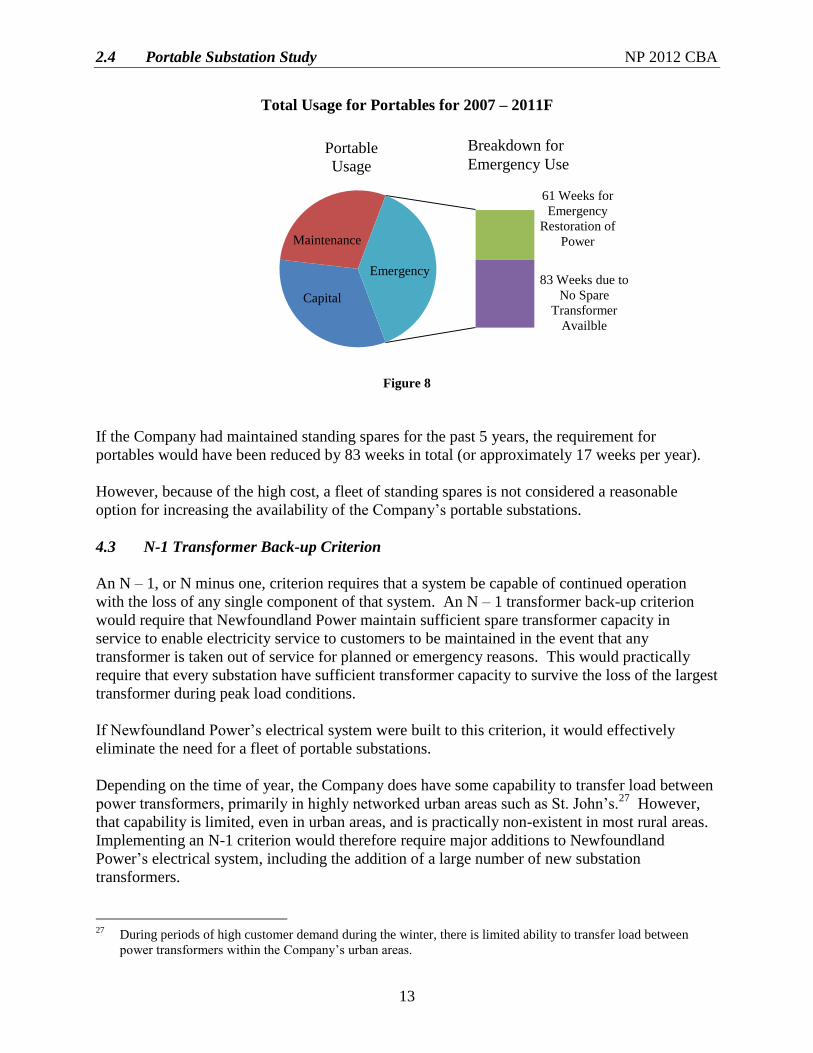
2.4 Portable Substation Study NP 2012 CBA
13
Total Usage for Portables for 2007 – 2011F
Figure 8
If the Company had maintained standing spares for the past 5 years, the requirement for
portables would have been reduced by 83 weeks in total (or approximately 17 weeks per year).
However, because of the high cost, a fleet of standing spares is not considered a reasonable
option for increasing the availability of the Company’s portable substations.
4.3 N-1 Transformer Back-up Criterion
An N – 1, or N minus one, criterion requires that a system be capable of continued operation
with the loss of any single component of that system. An N – 1 transformer back-up criterion
would require that Newfoundland Power maintain sufficient spare transformer capacity in
service to enable electricity service to customers to be maintained in the event that any
transformer is taken out of service for planned or emergency reasons. This would practically
require that every substation have sufficient transformer capacity to survive the loss of the largest
transformer during peak load conditions.
If Newfoundland Power’s electrical system were built to this criterion, it would effectively
eliminate the need for a fleet of portable substations.
Depending on the time of year, the Company does have some capability to transfer load between
power transformers, primarily in highly networked urban areas such as St. John’s.27
However,
that capability is limited, even in urban areas, and is practically non-existent in most rural areas.
Implementing an N-1 criterion would therefore require major additions to Newfoundland
Power’s electrical system, including the addition of a large number of new substation
transformers.
27
During periods of high customer demand during the winter, there is limited ability to transfer load between
power transformers within the Company’s urban areas.
Capital
Maintenance
61 Weeks for
Emergency
Restoration of
Power
83 Weeks due to
No Spare
Transformer
Availble
Emergency
Portable
Usage
Breakdown for
Emergency Use
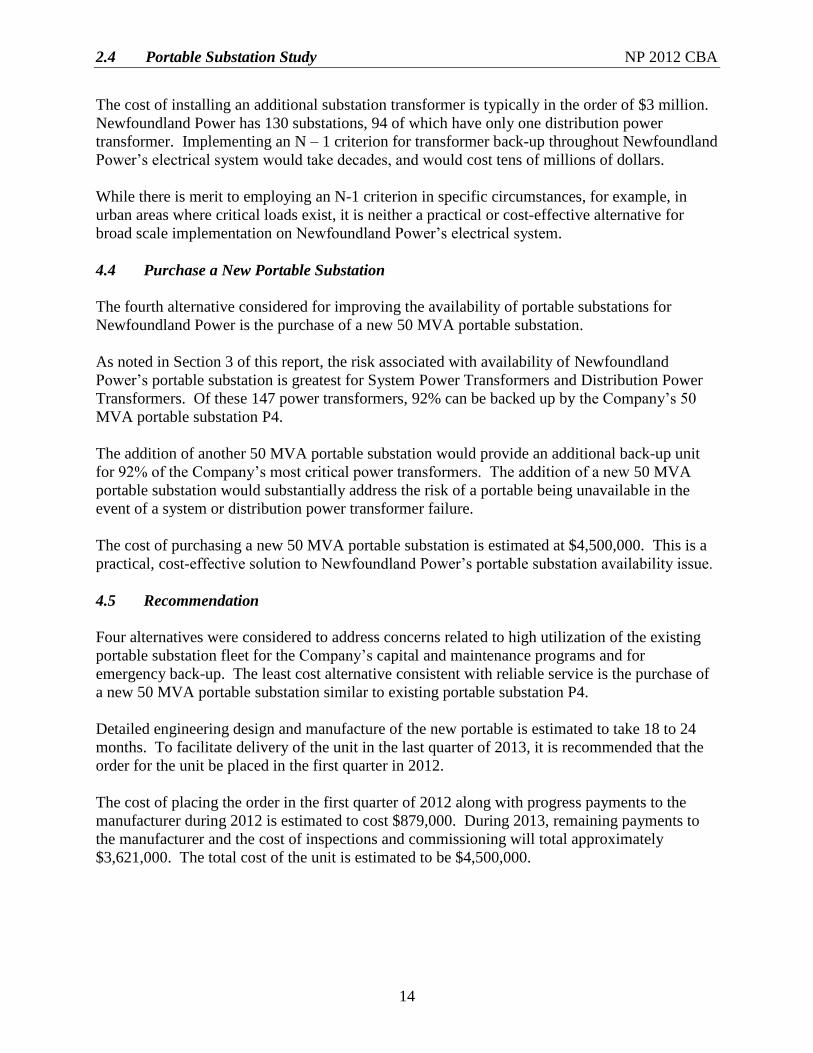
2.4 Portable Substation Study NP 2012 CBA
14
The cost of installing an additional substation transformer is typically in the order of $3 million.
Newfoundland Power has 130 substations, 94 of which have only one distribution power
transformer. Implementing an N – 1 criterion for transformer back-up throughout Newfoundland
Power’s electrical system would take decades, and would cost tens of millions of dollars.
While there is merit to employing an N-1 criterion in specific circumstances, for example, in
urban areas where critical loads exist, it is neither a practical or cost-effective alternative for
broad scale implementation on Newfoundland Power’s electrical system.
4.4 Purchase a New Portable Substation
The fourth alternative considered for improving the availability of portable substations for
Newfoundland Power is the purchase of a new 50 MVA portable substation.
As noted in Section 3 of this report, the risk associated with availability of Newfoundland
Power’s portable substation is greatest for System Power Transformers and Distribution Power
Transformers. Of these 147 power transformers, 92% can be backed up by the Company’s 50
MVA portable substation P4.
The addition of another 50 MVA portable substation would provide an additional back-up unit
for 92% of the Company’s most critical power transformers. The addition of a new 50 MVA
portable substation would substantially address the risk of a portable being unavailable in the
event of a system or distribution power transformer failure.
The cost of purchasing a new 50 MVA portable substation is estimated at $4,500,000. This is a
practical, cost-effective solution to Newfoundland Power’s portable substation availability issue.
4.5 Recommendation
Four alternatives were considered to address concerns related to high utilization of the existing
portable substation fleet for the Company’s capital and maintenance programs and for
emergency back-up. The least cost alternative consistent with reliable service is the purchase of
a new 50 MVA portable substation similar to existing portable substation P4.
Detailed engineering design and manufacture of the new portable is estimated to take 18 to 24
months. To facilitate delivery of the unit in the last quarter of 2013, it is recommended that the
order for the unit be placed in the first quarter in 2012.
The cost of placing the order in the first quarter of 2012 along with progress payments to the
manufacturer during 2012 is estimated to cost $879,000. During 2013, remaining payments to
the manufacturer and the cost of inspections and commissioning will total approximately
$3,621,000. The total cost of the unit is estimated to be $4,500,000.
2.4 Portable Substation Study NP 2012 CBA
Appendix A
Power Transformer Failures 2007 to Present
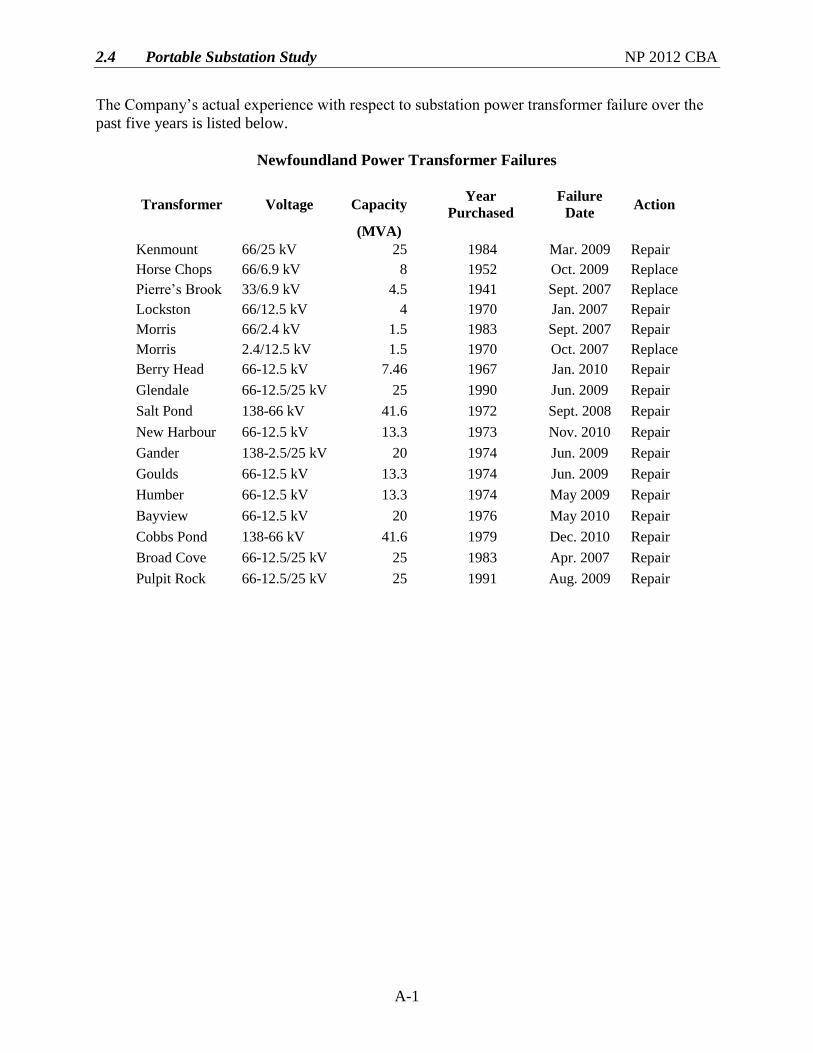
2.4 Portable Substation Study NP 2012 CBA
A-1
The Company’s actual experience with respect to substation power transformer failure over the
past five years is listed below.
Newfoundland Power Transformer Failures
Transformer Voltage Capacity Year
Purchased
Failure
Date Action
(MVA)
Kenmount 66/25 kV 25 1984 Mar. 2009 Repair
Horse Chops 66/6.9 kV 8 1952 Oct. 2009 Replace
Pierre’s Brook 33/6.9 kV 4.5 1941 Sept. 2007 Replace
Lockston 66/12.5 kV 4 1970 Jan. 2007 Repair
Morris 66/2.4 kV 1.5 1983 Sept. 2007 Repair
Morris 2.4/12.5 kV 1.5 1970 Oct. 2007 Replace
Berry Head 66-12.5 kV 7.46 1967 Jan. 2010 Repair
Glendale 66-12.5/25 kV 25 1990 Jun. 2009 Repair
Salt Pond 138-66 kV 41.6 1972 Sept. 2008 Repair
New Harbour 66-12.5 kV 13.3 1973 Nov. 2010 Repair
Gander 138-2.5/25 kV 20 1974 Jun. 2009 Repair
Goulds 66-12.5 kV 13.3 1974 Jun. 2009 Repair
Humber 66-12.5 kV 13.3 1974 May 2009 Repair
Bayview 66-12.5 kV 20 1976 May 2010 Repair
Cobbs Pond 138-66 kV 41.6 1979 Dec. 2010 Repair
Broad Cove 66-12.5/25 kV 25 1983 Apr. 2007 Repair
Pulpit Rock 66-12.5/25 kV 25 1991 Aug. 2009 Repair

2.4 Portable Substation Study NP 2012 CBA
Appendix B
Portable Substation Single Line Diagrams
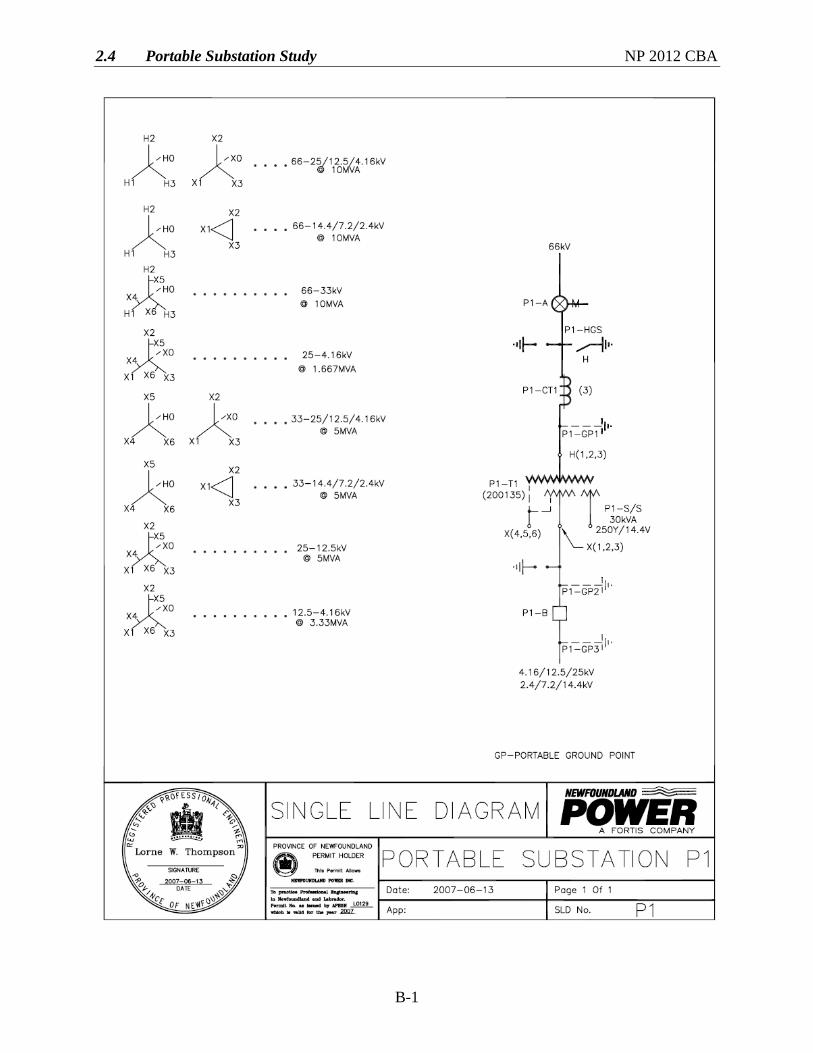
2.4 Portable Substation Study NP 2012 CBA
B-1
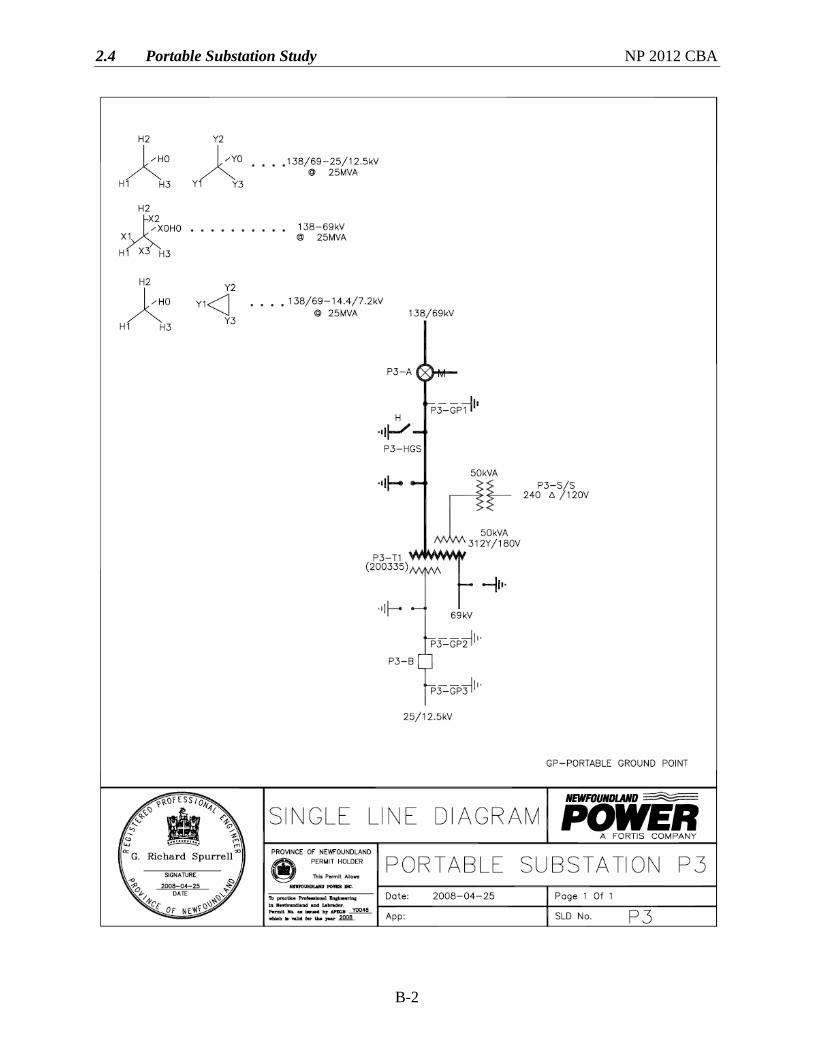
2.4 Portable Substation Study NP 2012 CBA
B-2
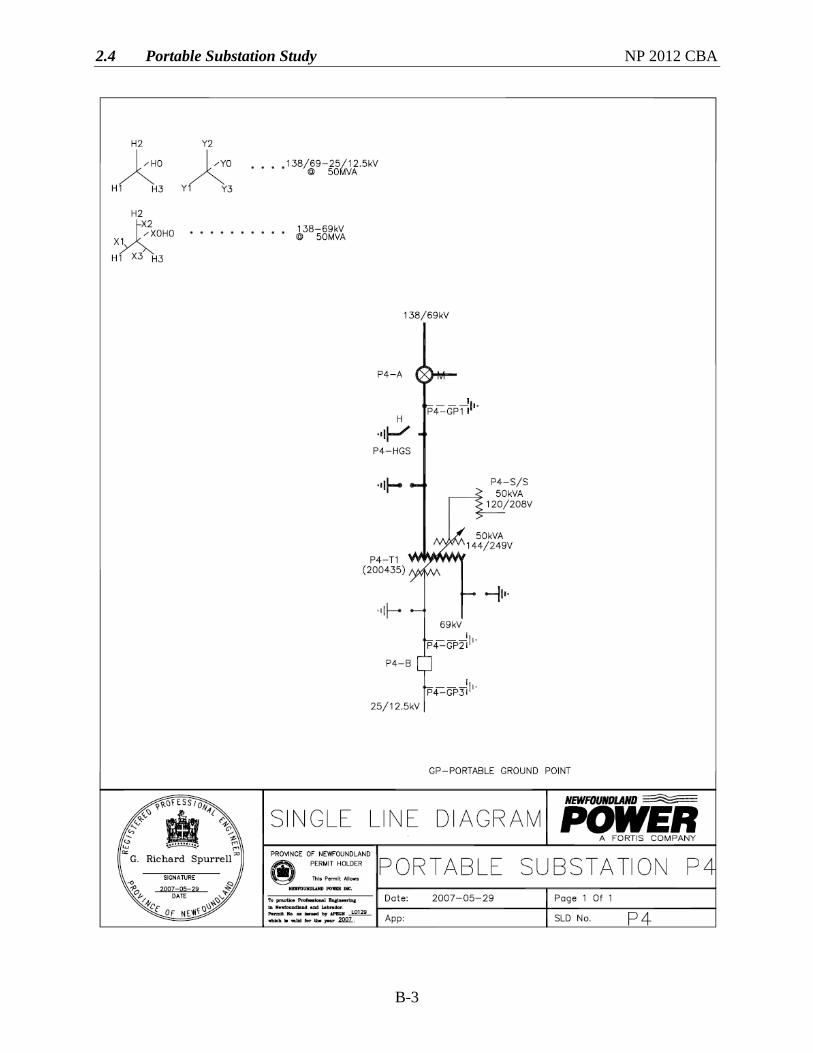
2.4 Portable Substation Study NP 2012 CBA
B-3
2.4 Portable Substation Study NP 2012 CBA
Appendix C
Power Transformer Listing And Portable Backup
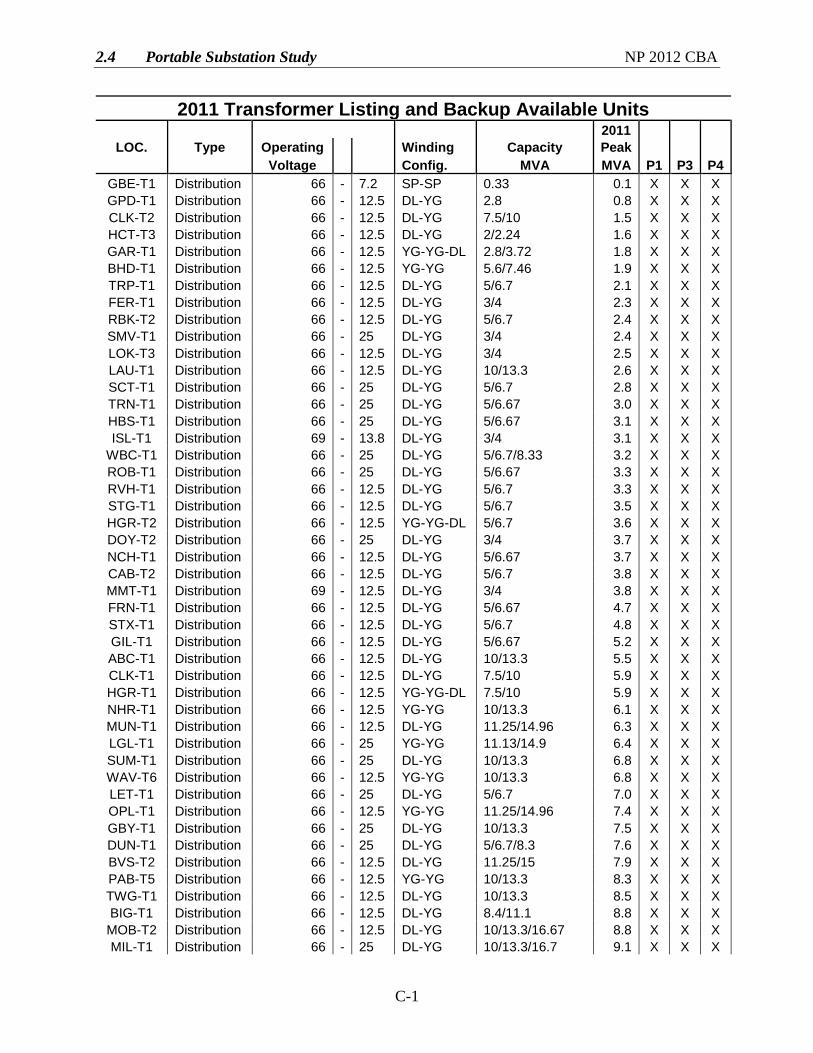
2.4 Portable Substation Study NP 2012 CBA
C-1
2011 Transformer Listing and Backup Available Units 2011
LOC. Type Operating Winding Capacity Peak
Voltage Config. MVA MVA P1 P3 P4
GBE-T1 Distribution 66 - 7.2 SP-SP 0.33 0.1 X X X
GPD-T1 Distribution 66 - 12.5 DL-YG 2.8 0.8 X X X
CLK-T2 Distribution 66 - 12.5 DL-YG 7.5/10 1.5 X X X
HCT-T3 Distribution 66 - 12.5 DL-YG 2/2.24 1.6 X X X
GAR-T1 Distribution 66 - 12.5 YG-YG-DL 2.8/3.72 1.8 X X X
BHD-T1 Distribution 66 - 12.5 YG-YG 5.6/7.46 1.9 X X X
TRP-T1 Distribution 66 - 12.5 DL-YG 5/6.7 2.1 X X X
FER-T1 Distribution 66 - 12.5 DL-YG 3/4 2.3 X X X
RBK-T2 Distribution 66 - 12.5 DL-YG 5/6.7 2.4 X X X
SMV-T1 Distribution 66 - 25 DL-YG 3/4 2.4 X X X
LOK-T3 Distribution 66 - 12.5 DL-YG 3/4 2.5 X X X
LAU-T1 Distribution 66 - 12.5 DL-YG 10/13.3 2.6 X X X
SCT-T1 Distribution 66 - 25 DL-YG 5/6.7 2.8 X X X
TRN-T1 Distribution 66 - 25 DL-YG 5/6.67 3.0 X X X
HBS-T1 Distribution 66 - 25 DL-YG 5/6.67 3.1 X X X
ISL-T1 Distribution 69 - 13.8 DL-YG 3/4 3.1 X X X
WBC-T1 Distribution 66 - 25 DL-YG 5/6.7/8.33 3.2 X X X
ROB-T1 Distribution 66 - 25 DL-YG 5/6.67 3.3 X X X
RVH-T1 Distribution 66 - 12.5 DL-YG 5/6.7 3.3 X X X
STG-T1 Distribution 66 - 12.5 DL-YG 5/6.7 3.5 X X X
HGR-T2 Distribution 66 - 12.5 YG-YG-DL 5/6.7 3.6 X X X
DOY-T2 Distribution 66 - 25 DL-YG 3/4 3.7 X X X
NCH-T1 Distribution 66 - 12.5 DL-YG 5/6.67 3.7 X X X
CAB-T2 Distribution 66 - 12.5 DL-YG 5/6.7 3.8 X X X
MMT-T1 Distribution 69 - 12.5 DL-YG 3/4 3.8 X X X
FRN-T1 Distribution 66 - 12.5 DL-YG 5/6.67 4.7 X X X
STX-T1 Distribution 66 - 12.5 DL-YG 5/6.7 4.8 X X X
GIL-T1 Distribution 66 - 12.5 DL-YG 5/6.67 5.2 X X X
ABC-T1 Distribution 66 - 12.5 DL-YG 10/13.3 5.5 X X X
CLK-T1 Distribution 66 - 12.5 DL-YG 7.5/10 5.9 X X X
HGR-T1 Distribution 66 - 12.5 YG-YG-DL 7.5/10 5.9 X X X
NHR-T1 Distribution 66 - 12.5 YG-YG 10/13.3 6.1 X X X
MUN-T1 Distribution 66 - 12.5 DL-YG 11.25/14.96 6.3 X X X
LGL-T1 Distribution 66 - 25 YG-YG 11.13/14.9 6.4 X X X
SUM-T1 Distribution 66 - 25 DL-YG 10/13.3 6.8 X X X
WAV-T6 Distribution 66 - 12.5 YG-YG 10/13.3 6.8 X X X
LET-T1 Distribution 66 - 25 DL-YG 5/6.7 7.0 X X X
OPL-T1 Distribution 66 - 12.5 YG-YG 11.25/14.96 7.4 X X X
GBY-T1 Distribution 66 - 25 DL-YG 10/13.3 7.5 X X X
DUN-T1 Distribution 66 - 25 DL-YG 5/6.7/8.3 7.6 X X X
BVS-T2 Distribution 66 - 12.5 DL-YG 11.25/15 7.9 X X X
PAB-T5 Distribution 66 - 12.5 YG-YG 10/13.3 8.3 X X X
TWG-T1 Distribution 66 - 12.5 DL-YG 10/13.3 8.5 X X X
BIG-T1 Distribution 66 - 12.5 DL-YG 8.4/11.1 8.8 X X X
MOB-T2 Distribution 66 - 12.5 DL-YG 10/13.3/16.67 8.8 X X X
MIL-T1 Distribution 66 - 25 DL-YG 10/13.3/16.7 9.1 X X X
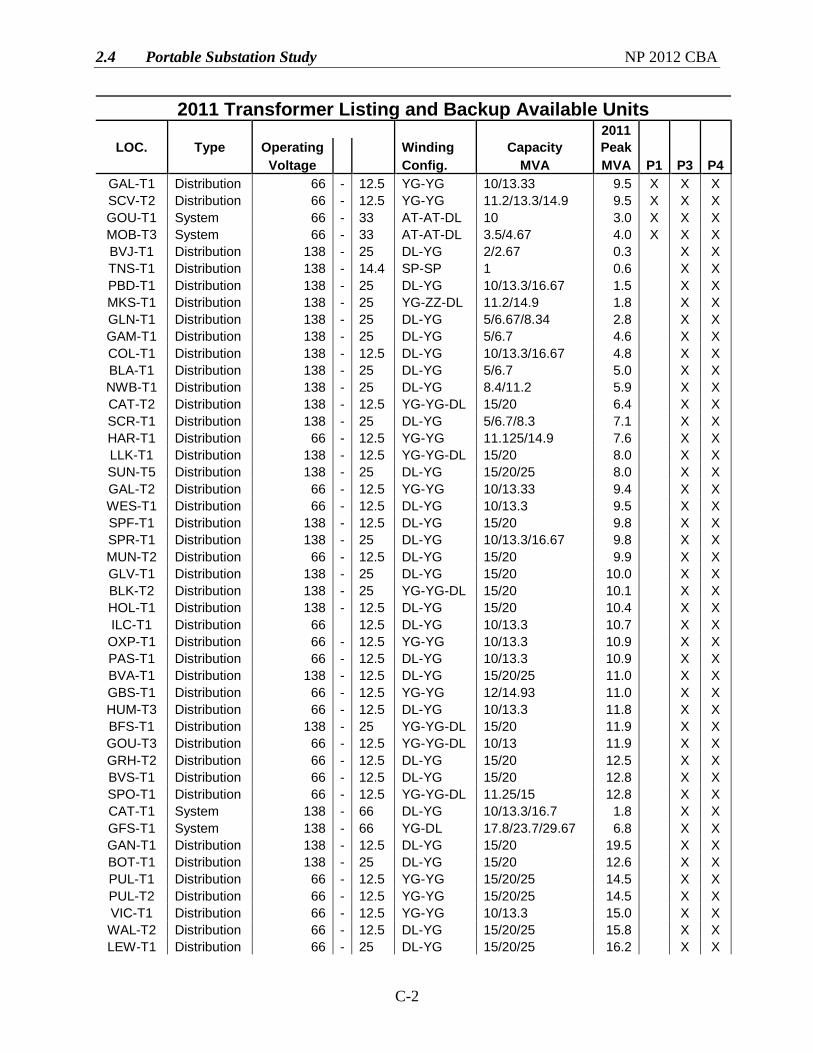
2.4 Portable Substation Study NP 2012 CBA
C-2
2011 Transformer Listing and Backup Available Units 2011
LOC. Type Operating Winding Capacity Peak
Voltage Config. MVA MVA P1 P3 P4
GAL-T1 Distribution 66 - 12.5 YG-YG 10/13.33 9.5 X X X
SCV-T2 Distribution 66 - 12.5 YG-YG 11.2/13.3/14.9 9.5 X X X
GOU-T1 System 66 - 33 AT-AT-DL 10 3.0 X X X
MOB-T3 System 66 - 33 AT-AT-DL 3.5/4.67 4.0 X X X
BVJ-T1 Distribution 138 - 25 DL-YG 2/2.67 0.3 X X
TNS-T1 Distribution 138 - 14.4 SP-SP 1 0.6 X X
PBD-T1 Distribution 138 - 25 DL-YG 10/13.3/16.67 1.5 X X
MKS-T1 Distribution 138 - 25 YG-ZZ-DL 11.2/14.9 1.8 X X
GLN-T1 Distribution 138 - 25 DL-YG 5/6.67/8.34 2.8 X X
GAM-T1 Distribution 138 - 25 DL-YG 5/6.7 4.6 X X
COL-T1 Distribution 138 - 12.5 DL-YG 10/13.3/16.67 4.8 X X
BLA-T1 Distribution 138 - 25 DL-YG 5/6.7 5.0 X X
NWB-T1 Distribution 138 - 25 DL-YG 8.4/11.2 5.9 X X
CAT-T2 Distribution 138 - 12.5 YG-YG-DL 15/20 6.4 X X
SCR-T1 Distribution 138 - 25 DL-YG 5/6.7/8.3 7.1 X X
HAR-T1 Distribution 66 - 12.5 YG-YG 11.125/14.9 7.6 X X
LLK-T1 Distribution 138 - 12.5 YG-YG-DL 15/20 8.0 X X
SUN-T5 Distribution 138 - 25 DL-YG 15/20/25 8.0 X X
GAL-T2 Distribution 66 - 12.5 YG-YG 10/13.33 9.4 X X
WES-T1 Distribution 66 - 12.5 DL-YG 10/13.3 9.5 X X
SPF-T1 Distribution 138 - 12.5 DL-YG 15/20 9.8 X X
SPR-T1 Distribution 138 - 25 DL-YG 10/13.3/16.67 9.8 X X
MUN-T2 Distribution 66 - 12.5 DL-YG 15/20 9.9 X X
GLV-T1 Distribution 138 - 25 DL-YG 15/20 10.0 X X
BLK-T2 Distribution 138 - 25 YG-YG-DL 15/20 10.1 X X
HOL-T1 Distribution 138 - 12.5 DL-YG 15/20 10.4 X X
ILC-T1 Distribution 66 12.5 DL-YG 10/13.3 10.7 X X
OXP-T1 Distribution 66 - 12.5 YG-YG 10/13.3 10.9 X X
PAS-T1 Distribution 66 - 12.5 DL-YG 10/13.3 10.9 X X
BVA-T1 Distribution 138 - 12.5 DL-YG 15/20/25 11.0 X X
GBS-T1 Distribution 66 - 12.5 YG-YG 12/14.93 11.0 X X
HUM-T3 Distribution 66 - 12.5 DL-YG 10/13.3 11.8 X X
BFS-T1 Distribution 138 - 25 YG-YG-DL 15/20 11.9 X X
GOU-T3 Distribution 66 - 12.5 YG-YG-DL 10/13 11.9 X X
GRH-T2 Distribution 66 - 12.5 DL-YG 15/20 12.5 X X
BVS-T1 Distribution 66 - 12.5 DL-YG 15/20 12.8 X X
SPO-T1 Distribution 66 - 12.5 YG-YG-DL 11.25/15 12.8 X X
CAT-T1 System 138 - 66 DL-YG 10/13.3/16.7 1.8 X X
GFS-T1 System 138 - 66 YG-DL 17.8/23.7/29.67 6.8 X X
GAN-T1 Distribution 138 - 12.5 DL-YG 15/20 19.5 X X
BOT-T1 Distribution 138 - 25 DL-YG 15/20 12.6 X X
PUL-T1 Distribution 66 - 12.5 YG-YG 15/20/25 14.5 X X
PUL-T2 Distribution 66 - 12.5 YG-YG 15/20/25 14.5 X X
VIC-T1 Distribution 66 - 12.5 YG-YG 10/13.3 15.0 X X
WAL-T2 Distribution 66 - 12.5 DL-YG 15/20/25 15.8 X X
LEW-T1 Distribution 66 - 25 DL-YG 15/20/25 16.2 X X
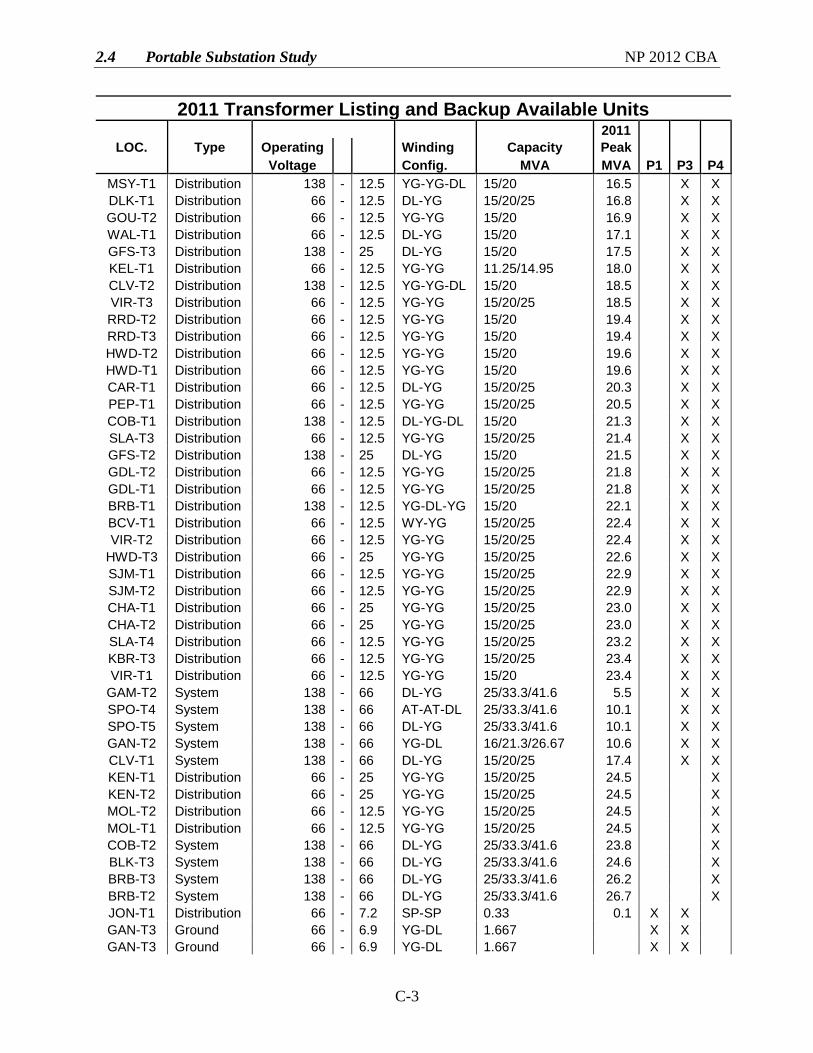
2.4 Portable Substation Study NP 2012 CBA
C-3
2011 Transformer Listing and Backup Available Units 2011
LOC. Type Operating Winding Capacity Peak
Voltage Config. MVA MVA P1 P3 P4
MSY-T1 Distribution 138 - 12.5 YG-YG-DL 15/20 16.5 X X
DLK-T1 Distribution 66 - 12.5 DL-YG 15/20/25 16.8 X X
GOU-T2 Distribution 66 - 12.5 YG-YG 15/20 16.9 X X
WAL-T1 Distribution 66 - 12.5 DL-YG 15/20 17.1 X X
GFS-T3 Distribution 138 - 25 DL-YG 15/20 17.5 X X
KEL-T1 Distribution 66 - 12.5 YG-YG 11.25/14.95 18.0 X X
CLV-T2 Distribution 138 - 12.5 YG-YG-DL 15/20 18.5 X X
VIR-T3 Distribution 66 - 12.5 YG-YG 15/20/25 18.5 X X
RRD-T2 Distribution 66 - 12.5 YG-YG 15/20 19.4 X X
RRD-T3 Distribution 66 - 12.5 YG-YG 15/20 19.4 X X
HWD-T2 Distribution 66 - 12.5 YG-YG 15/20 19.6 X X
HWD-T1 Distribution 66 - 12.5 YG-YG 15/20 19.6 X X
CAR-T1 Distribution 66 - 12.5 DL-YG 15/20/25 20.3 X X
PEP-T1 Distribution 66 - 12.5 YG-YG 15/20/25 20.5 X X
COB-T1 Distribution 138 - 12.5 DL-YG-DL 15/20 21.3 X X
SLA-T3 Distribution 66 - 12.5 YG-YG 15/20/25 21.4 X X
GFS-T2 Distribution 138 - 25 DL-YG 15/20 21.5 X X
GDL-T2 Distribution 66 - 12.5 YG-YG 15/20/25 21.8 X X
GDL-T1 Distribution 66 - 12.5 YG-YG 15/20/25 21.8 X X
BRB-T1 Distribution 138 - 12.5 YG-DL-YG 15/20 22.1 X X
BCV-T1 Distribution 66 - 12.5 WY-YG 15/20/25 22.4 X X
VIR-T2 Distribution 66 - 12.5 YG-YG 15/20/25 22.4 X X
HWD-T3 Distribution 66 - 25 YG-YG 15/20/25 22.6 X X
SJM-T1 Distribution 66 - 12.5 YG-YG 15/20/25 22.9 X X
SJM-T2 Distribution 66 - 12.5 YG-YG 15/20/25 22.9 X X
CHA-T1 Distribution 66 - 25 YG-YG 15/20/25 23.0 X X
CHA-T2 Distribution 66 - 25 YG-YG 15/20/25 23.0 X X
SLA-T4 Distribution 66 - 12.5 YG-YG 15/20/25 23.2 X X
KBR-T3 Distribution 66 - 12.5 YG-YG 15/20/25 23.4 X X
VIR-T1 Distribution 66 - 12.5 YG-YG 15/20 23.4 X X
GAM-T2 System 138 - 66 DL-YG 25/33.3/41.6 5.5 X X
SPO-T4 System 138 - 66 AT-AT-DL 25/33.3/41.6 10.1 X X
SPO-T5 System 138 - 66 DL-YG 25/33.3/41.6 10.1 X X
GAN-T2 System 138 - 66 YG-DL 16/21.3/26.67 10.6 X X
CLV-T1 System 138 - 66 DL-YG 15/20/25 17.4 X X
KEN-T1 Distribution 66 - 25 YG-YG 15/20/25 24.5 X
KEN-T2 Distribution 66 - 25 YG-YG 15/20/25 24.5 X
MOL-T2 Distribution 66 - 12.5 YG-YG 15/20/25 24.5 X
MOL-T1 Distribution 66 - 12.5 YG-YG 15/20/25 24.5 X
COB-T2 System 138 - 66 DL-YG 25/33.3/41.6 23.8 X
BLK-T3 System 138 - 66 DL-YG 25/33.3/41.6 24.6 X
BRB-T3 System 138 - 66 DL-YG 25/33.3/41.6 26.2 X
BRB-T2 System 138 - 66 DL-YG 25/33.3/41.6 26.7 X
JON-T1 Distribution 66 - 7.2 SP-SP 0.33 0.1 X X
GAN-T3 Ground 66 - 6.9 YG-DL 1.667 X X
GAN-T3 Ground 66 - 6.9 YG-DL 1.667 X X
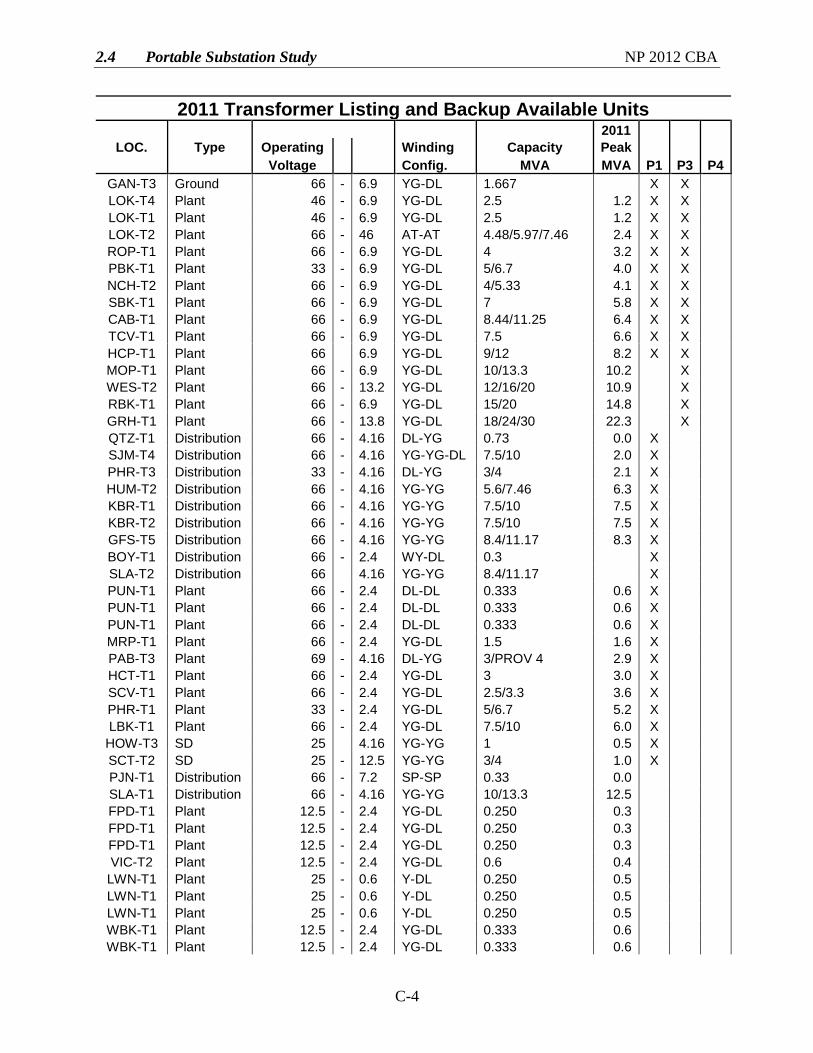
2.4 Portable Substation Study NP 2012 CBA
C-4
2011 Transformer Listing and Backup Available Units 2011
LOC. Type Operating Winding Capacity Peak
Voltage Config. MVA MVA P1 P3 P4
GAN-T3 Ground 66 - 6.9 YG-DL 1.667 X X
LOK-T4 Plant 46 - 6.9 YG-DL 2.5 1.2 X X
LOK-T1 Plant 46 - 6.9 YG-DL 2.5 1.2 X X
LOK-T2 Plant 66 - 46 AT-AT 4.48/5.97/7.46 2.4 X X
ROP-T1 Plant 66 - 6.9 YG-DL 4 3.2 X X
PBK-T1 Plant 33 - 6.9 YG-DL 5/6.7 4.0 X X
NCH-T2 Plant 66 - 6.9 YG-DL 4/5.33 4.1 X X
SBK-T1 Plant 66 - 6.9 YG-DL 7 5.8 X X
CAB-T1 Plant 66 - 6.9 YG-DL 8.44/11.25 6.4 X X
TCV-T1 Plant 66 - 6.9 YG-DL 7.5 6.6 X X
HCP-T1 Plant 66 6.9 YG-DL 9/12 8.2 X X
MOP-T1 Plant 66 - 6.9 YG-DL 10/13.3 10.2 X
WES-T2 Plant 66 - 13.2 YG-DL 12/16/20 10.9 X
RBK-T1 Plant 66 - 6.9 YG-DL 15/20 14.8 X
GRH-T1 Plant 66 - 13.8 YG-DL 18/24/30 22.3 X
QTZ-T1 Distribution 66 - 4.16 DL-YG 0.73 0.0 X
SJM-T4 Distribution 66 - 4.16 YG-YG-DL 7.5/10 2.0 X
PHR-T3 Distribution 33 - 4.16 DL-YG 3/4 2.1 X
HUM-T2 Distribution 66 - 4.16 YG-YG 5.6/7.46 6.3 X
KBR-T1 Distribution 66 - 4.16 YG-YG 7.5/10 7.5 X
KBR-T2 Distribution 66 - 4.16 YG-YG 7.5/10 7.5 X
GFS-T5 Distribution 66 - 4.16 YG-YG 8.4/11.17 8.3 X
BOY-T1 Distribution 66 - 2.4 WY-DL 0.3 X
SLA-T2 Distribution 66 4.16 YG-YG 8.4/11.17 X
PUN-T1 Plant 66 - 2.4 DL-DL 0.333 0.6 X
PUN-T1 Plant 66 - 2.4 DL-DL 0.333 0.6 X
PUN-T1 Plant 66 - 2.4 DL-DL 0.333 0.6 X
MRP-T1 Plant 66 - 2.4 YG-DL 1.5 1.6 X
PAB-T3 Plant 69 - 4.16 DL-YG 3/PROV 4 2.9 X
HCT-T1 Plant 66 - 2.4 YG-DL 3 3.0 X
SCV-T1 Plant 66 - 2.4 YG-DL 2.5/3.3 3.6 X
PHR-T1 Plant 33 - 2.4 YG-DL 5/6.7 5.2 X
LBK-T1 Plant 66 - 2.4 YG-DL 7.5/10 6.0 X
HOW-T3 SD 25 4.16 YG-YG 1 0.5 X
SCT-T2 SD 25 - 12.5 YG-YG 3/4 1.0 X
PJN-T1 Distribution 66 - 7.2 SP-SP 0.33 0.0
SLA-T1 Distribution 66 - 4.16 YG-YG 10/13.3 12.5
FPD-T1 Plant 12.5 - 2.4 YG-DL 0.250 0.3
FPD-T1 Plant 12.5 - 2.4 YG-DL 0.250 0.3
FPD-T1 Plant 12.5 - 2.4 YG-DL 0.250 0.3
VIC-T2 Plant 12.5 - 2.4 YG-DL 0.6 0.4
LWN-T1 Plant 25 - 0.6 Y-DL 0.250 0.5
LWN-T1 Plant 25 - 0.6 Y-DL 0.250 0.5
LWN-T1 Plant 25 - 0.6 Y-DL 0.250 0.5
WBK-T1 Plant 12.5 - 2.4 YG-DL 0.333 0.6
WBK-T1 Plant 12.5 - 2.4 YG-DL 0.333 0.6
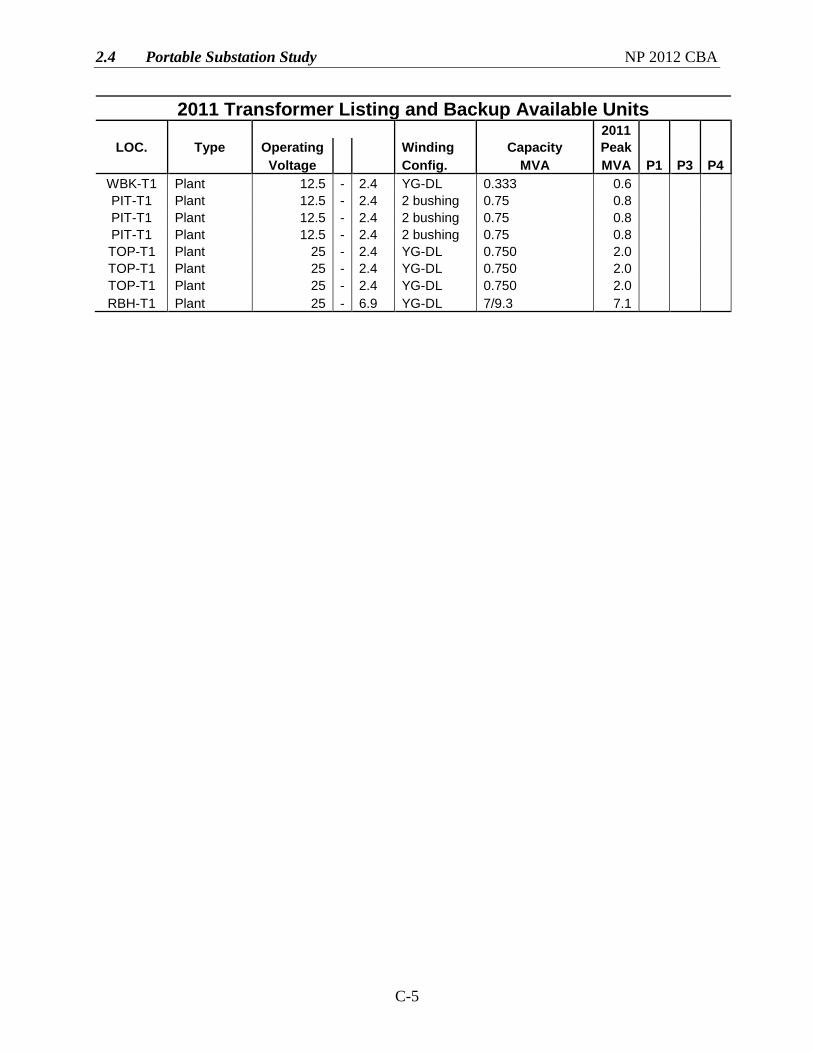
2.4 Portable Substation Study NP 2012 CBA
C-5
2011 Transformer Listing and Backup Available Units 2011
LOC. Type Operating Winding Capacity Peak
Voltage Config. MVA MVA P1 P3 P4
WBK-T1 Plant 12.5 - 2.4 YG-DL 0.333 0.6
PIT-T1 Plant 12.5 - 2.4 2 bushing 0.75 0.8
PIT-T1 Plant 12.5 - 2.4 2 bushing 0.75 0.8
PIT-T1 Plant 12.5 - 2.4 2 bushing 0.75 0.8
TOP-T1 Plant 25 - 2.4 YG-DL 0.750 2.0
TOP-T1 Plant 25 - 2.4 YG-DL 0.750 2.0
TOP-T1 Plant 25 - 2.4 YG-DL 0.750 2.0
RBH-T1 Plant 25 - 6.9 YG-DL 7/9.3 7.1