Embed Size (px)
Citation preview

2012 Waste Stream Analysis
for Clark County, Washington
December 2012


2012 WASTE STREAM ANALYSIS
Prepared for:
Clark County Department of Environmental Services,
Sustainability & Outreach Division
Prepared by:
Green Solutions PO Box 680
South Prairie, WA 98385 [email protected]
(360) 897-9533
with assistance from:
Environmental Practices, LLC Portland, OR
(503) 230-9513
December 2012


2012 Clark County Waste Stream Analysis i Table of Contents
T A B L E O F C O N T E N T S Executive Summary
Introduction ..................................................................................... E-1 Results ............................................................................................... E-1 Conclusions ...................................................................................... E-2
I. Introduction
A. Scope and Objectives .............................................................. 1 B. Background ................................................................................ 1
II. Results
A. Overview .................................................................................... 3 B. Waste Quantities ........................................................................ 4 C. Waste Composition .................................................................. 7
III. Conclusions
A. Introduction ............................................................................... 19 B. Weight of Materials Disposed .................................................. 19 C. Trends ......................................................................................... 19 D. Conclusions ............................................................................... 22
Glossary
Appendices A. Statistical Certainty of Results B. Customer Survey Results Cover photos, clockwise from upper left:
1) Sample waiting to be sorted (another sample can be seen in the background, contained in the gray trash cans), May 22, 2012;
2) Sorting crew at CTR, May 22, 2012; and
3) Load from the compactor that serves a group of Clark County buildings, waiting to be sampled at West Van, May 25, 2012.

2012 Clark County Waste Stream Analysis ii Table of Contents
L I S T O F T A B L E S
Executive Summary E-1. Annual Quantities of Disposed Wastes ................................. E-2 Section II – Waste Characterization Results 1. Quantities of Disposed Wastes ................................................. 6 2. Number of Samples by Type of Generator ............................ 7 3. Waste Composition Results ...................................................... 9 Section III - Conclusions 4. Weight of Disposed Materials ................................................. 20 5. Comparison of Results to Previous Studies ............................ 21 Appendix A - Statistical Certainty of Results A-1. Confidence Limits by Type of Generator ............. A-2, A-3, A-4
L I S T O F F I G U R E S
Executive Summary E-1. Waste Composition Results .................................................... E-3 Section II - Waste Characterization Results 1. Waste Composition Results ..................................................... 10 2. Single-Family Waste .................................................................. 11 3. Multi-Family Waste .................................................................... 12 4. Residential Self-Haul Waste ..................................................... 13 5. Non-Residential Self-Haul Waste ............................................. 14 6. Commercial Waste .................................................................. 15 7. Commercial Compactor Waste ............................................. 16

2012 Clark County Waste Stream Analysis E-1 Executive Summary
E X E C U T I V E S U M M A R Y
INTRODUCTION
This study examined the quantity and composition of solid waste (garbage) disposed by homes and businesses in Clark County in 2012. The goals of this study were to:
provide data for evaluating current waste diversion programs and for planning future programs.
provide data that can be used to evaluate the performance of waste diversion activities at the transfer stations.
satisfy the County’s contractual obligation to periodically conduct a comprehensive analysis of the municipal solid waste stream.
This waste composition study was conducted by the environmental consulting firms of Green Solutions and Environmental Practices, LLC. Waste Connections provided substantial assistance by surveying self-haul customers, arranging loads, pulling samples from loads, and providing waste quantity data. County solid waste staff and others also assisted with this project. RESULTS Waste Quantities
The quantity (tonnage) of solid waste disposed by different types of customers and sources (“waste generators”) was determined through existing transaction records and additional data provided by Waste Connections, the City of Camas, and others. Table E-1 shows the results of the waste quantity analysis. Waste Composition
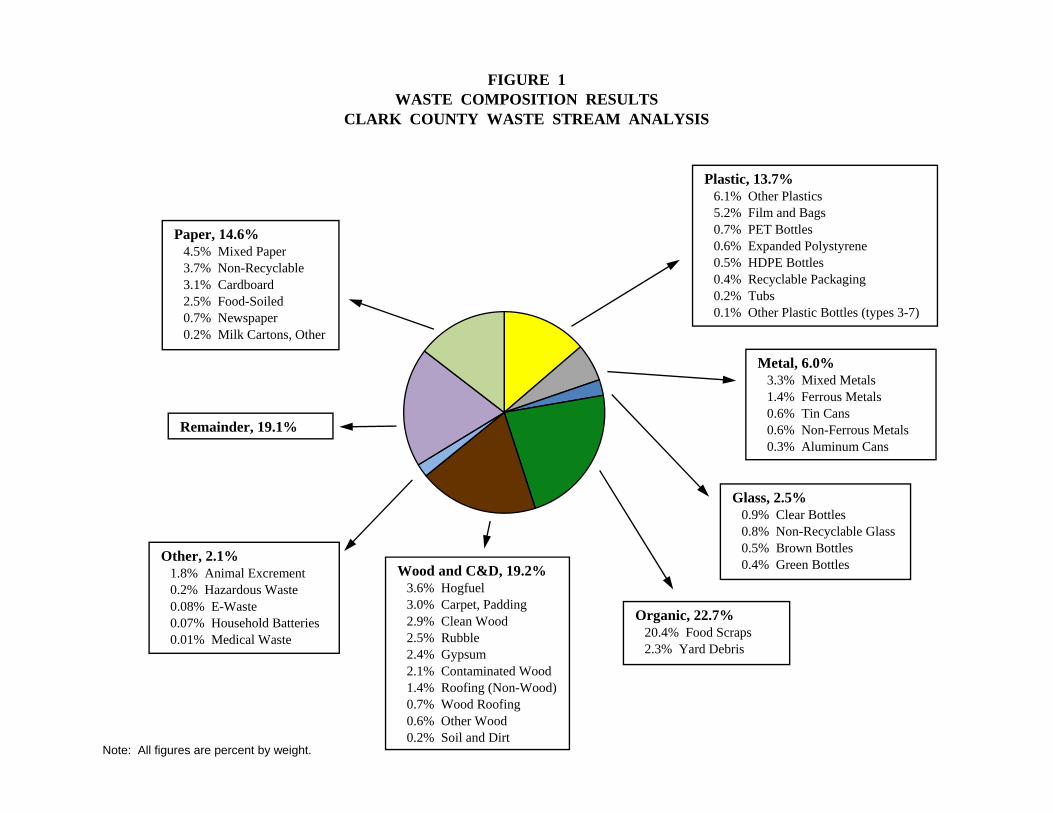
The composition of the County’s solid waste stream was determined by randomly selecting and sorting samples of waste from loads delivered to the three transfer stations in Clark County. The waste composition results are illustrated in Figure E-1. The results shown in Figure E-1 are a weighted annual average for all sources. Figure E-1 shows all of the categories measured in this study. Some types of materials were not measured in this study, including materials such as clothing, diapers and cosmetics, and these materials are included in the broad category called “remainder.”

2012 Clark County Waste Stream Analysis E-2 Executive Summary
TABLE E-1 ANNUAL QUANTITIES OF DISPOSED WASTES
Type of Waste Generator Annual Amounts
Tons Percent
Residential Self-Haul 29,280 12.0
Non-Residential Self-Haul 32,520 13.3
Self-Haul Subtotal 61,810 25.4
Single-Family 77,530 31.8
Multi-Family 12,800 5.2
Commercial 45,390 18.6
Commercial Compactors 46,240 18.6
Garbage Truck Subtotal 181,960 74.6
Total 243,770 100.0
Note: Quantities shown are for the period November 1, 2011 through October 31, 2012. CONCLUSIONS Waste Quantities
A number of observations and conclusions can be made by examining the waste quantity data:
Residential Self-Haul: the Residential Self-Haul waste stream is made up of numerous small loads delivered to the transfer stations in cars, pickup trucks and similar vehicles. It is an important service to allow people to haul their own waste to the transfer stations, but this is also the least efficient method of garbage collection. While this source contributes only 12.0% of the County’s total waste stream, this type of generator is responsible for 74% of the traffic at the transfer stations. Self-haul loads average 436 pounds per vehicle, compared to 9,000 to 14,000 pounds per load for municipal and private garbage trucks, but frequently take as long or longer to unload as garbage trucks.
Non-Residential Self-Haul: this type of generator brings in slightly more waste (13.3%) than Residential Self-Haul generators, and it does so with fewer trips and larger loads. Based on transaction records for the period of this study, Non-

Paper, 14.6% 4.5% Mixed Paper 3.7% Non-Recyclable 3.1% Cardboard 2.5% Food-Soiled 0.7% Newspaper 0.2% Milk Cartons, Other
Plastic, 13.7% 6.1% Other Plastics 5.2% Film and Bags 0.7% PET Bottles 0.6% Expanded Polystyrene 0.5% HDPE Bottles 0.4% Recyclable Packaging 0.2% Tubs 0.1% Other Plastic Bottles (types 3-7)
Metal, 6.0% 3.3% Mixed Metals 1.4% Ferrous Metals 0.6% Tin Cans 0.6% Non-Ferrous Metals 0.3% Aluminum Cans
Glass, 2.5% 0.9% Clear Bottles 0.8% Non-Recyclable Glass 0.5% Brown Bottles 0.4% Green Bottles
Organic, 22.7% 20.4% Food Scraps 2.3% Yard Debris
Other, 2.1% 1.8% Animal Excrement 0.2% Hazardous Waste 0.08% E-Waste 0.07% Household Batteries 0.01% Medical Waste
FIGURE E-1 WASTE COMPOSITION RESULTS
CLARK COUNTY WASTE STREAM ANALYSIS
Note: All figures are percent by weight.
Remainder, 19.1%
Wood and C&D, 19.2% 3.6% Hogfuel 3.0% Carpet, Padding 2.9% Clean Wood 2.5% Rubble 2.4% Gypsum 2.1% Contaminated Wood 1.4% Roofing (Non-Wood) 0.7% Wood Roofing 0.6% Other Wood 0.2% Soil and Dirt

2012 Clark County Waste Stream Analysis E-4 Executive Summary
Residential Self-Haul loads represent 10.6% of the vehicle trips through the transfer stations and deliver an average of 1,242 pounds per vehicle.
Single-Family: Single-Family wastes contribute almost one-third (31.8%) of the total tonnage of the County’s waste stream. This figure does not include Residential Self-Haul quantities, which are also almost entirely from single-family homes.
Multi-Family: this study shows that 12,800 tons per year, or 5.2%, of Clark County’s waste stream is from Multi-Family units. This is consistent with the amount found in the previous study (14,160 tons, or 5.0%, of the waste stream in 2008).
Commercial and Commercial Compactors: the Commercial and Commercial Compactor waste streams together make up 37.2% of the County’s waste stream, with nearly equal amounts collected by garbage trucks servicing dumpsters (45,390 tons per year) versus single-source roll-off’s and compactors (46,240 tons). Both of these figures are significantly lower than in the previous study, when these two sources together contributed almost half of the County’s waste stream (123,850 tons in 2008, or 45.0% of the total).
Waste Composition
There are distinct differences in the waste streams disposed by the different types of waste generators, as can be seen in several of the tables and figures in this report. For each of the generators, a few noteworthy conclusions can be drawn:
Single-Family: the largest material in this waste stream is food scraps (29.4% by weight), which is disposed at four times the quantity as the next largest material (plastic film and bags, at 7.2%). There are significant quantities of various grades of paper (mixed waste paper, at 4.6%; non-recyclable paper, at 4.0%; and food-soiled paper, at 3.9%). There are also substantial amounts of other plastics, at 4.1%, and animal excrement (“kitty litter),” at 3.8%.
The Single-Family waste stream contains only 15.6% of the materials collected through the curbside recycling program (including glass and yard debris). This is down from the 20.9% that was found in the study four years ago.
Multi-Family: the Multi-Family waste stream also contains a high amount of food scraps (22.6%), with mixed waste paper (7.7%) and animal excrement (5.5%) being the next two highest materials. There are also significant quantities of film and bags (5.0%), other plastics (4.3%), and various grades of paper.
The Multi -Family waste stream contains 28.4% recyclable materials (including the materials collected through the curbside program and yard debris).

2012 Clark County Waste Stream Analysis E-5 Executive Summary
Residential Self-Haul: self-haul loads from residential sources have more wood, construction debris and metal than other residential sources, and less “regular” household trash (paper, plastic and food scraps), reflecting the activities such as remodeling and other special projects that are often the source of self-haul waste. Other plastics is the material present in the single largest quantity, at 10.5%, followed by mixed metals (10.5%), wood (hogfuel, 9.4%), food scraps (7.8%), and carpeting (6.8%).
The Residential Self-Haul waste stream contains the highest amount of recyclable materials, with 30.6% of this waste consisting of those materials that are collected through the curbside recycling program (including glass and yard debris). Half of this amount consists of various grades of metal and one-third consists of various grades of paper.
Non-Residential Self-Haul: like self-haul waste from residential sources, Non-Residential Self-Haul loads are often the result of construction activities or other special projects. The large amount of wood (26.3% for all grades taken together) and construction and demolition (C&D) waste (36.6%) clearly shows the influence of construction activities on this waste stream. Although this waste generator contributes only 13.3% of the County’s total waste stream, Non-Residential Self-Haul customers are disposing of 36% of the wood and 52% of the C&D materials.
The Non-Residential Self-Haul waste stream contains 22.6% recyclable materials (for the materials collected through the curbside program and yard debris).
Commercial: waste from this source also contains a large amount of food scraps (33.1%), followed by plastic film and bags (8.3%), mixed waste paper (6.7%), and non-recyclable paper (5.2%). The Commercial waste stream contains 20.3% recyclable materials (for the materials collected through the curbside program and yard debris).
Commercial Compactors: waste from this source contains less food scraps (11.6%) than the other commercial category, but it is still the largest single category, followed closely by other plastics (10.5%). Wood is the largest category overall (19.3%), followed by non-recyclable paper (4.6%), mixed metals (4.4%), cardboard (4.2%), and plastic film and bags (3.9%).
The Commercial Compactor waste stream contains 20.3% recyclable materials (for the materials collected through the curbside program and yard debris).
General Conclusions
Additional conclusions that resulted from this study include:
Plastic film is present in most of the waste streams in significant amounts, especially given the fact that the individual pieces of this material are very light. In other

2012 Clark County Waste Stream Analysis E-6 Executive Summary
words, it takes a lot of this material to add up to the amounts shown in the results. Likewise for expanded polystyrene (“Styrofoam”). Although the amounts of expanded polystyrene are not that high on a weight basis, these figures represent a large volume of material.
“Other plastics” also contribute a significant amount to the County’s waste stream, and probably bear additional scrutiny for possible recycling or waste reduction programs.

2012 Clark County Waste Stream Analysis 1 Introduction
S E C T I O N O N E I N T R O D U C T I O N
A. SCOPE AND OBJECTIVES This study examined the quantity and composition of solid waste (garbage) disposed by homes and businesses in Clark County in 2012 at the three in-county transfer stations. The goals of this study were to:
provide data for evaluating current waste diversion programs and for planning future programs.
provide data that can be used to evaluate the performance of waste diversion activities at the transfer stations.
satisfy the County’s contractual obligation to periodically conduct a comprehensive analysis of the municipal solid waste stream.
This waste composition study was conducted by the environmental consulting firm of Green Solutions, with assistance from Environmental Practices, LLC. Waste Connections provided substantial assistance by surveying self-haul customers, arranging loads, pulling samples from loads, and providing waste quantity data. County solid waste staff and others also assisted with this project. B. BACKGROUND There are three transfer stations in Clark County, all of which are operated by Waste Connections: the Central Transfer and Recycling Center, the Washougal Transfer Station, and the West Van Materials Recovery Center. Each of these facilities includes:
a waste transfer operation, where waste is compacted into transfer trailers and later transported by barge to the Finley Buttes landfill in Oregon;
an extensive recycling drop-off center;
a household hazardous waste collection facility.
In addition, West Van offers a buy-back opportunity for some recyclables, yard debris collection, and a processing line for recyclable materials from residential and commercial sources. This study examined only the solid wastes brought to the transfer stations for disposal purposes, although the customer survey conducted as part of this

2012 Clark County Waste Stream Analysis 2 Introduction
project also included customers that were only bringing in recyclables or household hazardous wastes.

2012 Clark County Waste Stream Analysis 3 Results
S E C T I O N T W O R E S U L T S
A. OVERVIEW This study examined mixed municipal solid waste brought for disposal to the West Van Materials Recovery Center (West Van), the Washougal Transfer Station (WTS), and the Central Transfer and Recycling Center (CTR). “Mixed municipal solid waste” is the term commonly used for general residential and commercial wastes, including the waste collected by garbage haulers and the waste delivered to transfer or disposal sites by the waste generators themselves (“self-haul”). Types of Waste Generators The design of the sampling and data collection procedures for this study allowed information to be provided on the quantity and composition of waste disposed by different sources (“waste generators”) as well as the County’s overall waste stream. For this purpose, the County’s waste stream was divided into six groups according to the source and method of delivery. The six groups are:
Residential Self-Haul: this is waste that is brought in by homeowners and renters who generated the load of waste, although in some cases they may be assisting a family member, neighbor or acquaintance who actually generated the waste. This category also includes landlords hauling their tenants’ waste. This type of waste is typically transported to the disposal site using a car or pickup truck, and there is a distinct pattern in the timing of such deliveries. Most of the Residential Self-Haul waste is brought to the disposal site on weekends or in the evenings (i.e., at times other than regular daytime work hours).
Non-Residential Self-Haul: this waste is from businesses or contractors, and is
typically brought in by an employee of that business. The pattern in the delivery of this waste tends to be the opposite of Residential Self-Haul wastes, occurring primarily during regular work hours, and is typically brought in with larger vehicles (dump trucks, pickup trucks with trailers, and other trucks). A substantial amount of this waste stream consists of loads of construction and demolition wastes brought in by construction contractors.
Single-Family: by definition, this waste is brought in by garbage haulers
(including municipal collectors), and is collected from single-family homes. This waste is typically bagged before collection, relatively heterogeneous (consisting of small pieces of many different types of materials), and is delivered to the disposal site most often between mid-morning and mid-afternoon Monday through Friday.

2012 Clark County Waste Stream Analysis 4 Results
Multi-Family: by definition, this waste is brought in by garbage haulers or municipal collectors from apartment buildings. This waste is often bagged before collection, relatively heterogeneous (consisting of small pieces of many different types of materials), and is delivered to the disposal site most often between early morning and mid-afternoon Monday through Friday. Most Multi-Family waste is mixed with Commercial waste when collected because both types of customers use dumpsters for garbage collection and are collected on routes served by front-loading garbage trucks. Larger multi-family sites often use a compactor for their wastes, in which case these loads are separately brought to the disposal sites using the same equipment that services Commercial Compactors.
Commercial: for this study, “commercial” waste is defined to include wastes from
businesses (commercial and industrial) and institutions (schools, hospitals, government offices, etc.). These wastes are typically collected using front-loading garbage trucks that empty dumpsters and are usually delivered early morning through mid-afternoon Monday through Friday.
Commercial Compactors: this is waste that is brought to one of the transfer
stations from businesses, industries or institutions, delivered by a municipal collection crew or private garbage hauler in a stationary compactor or roll-off container (dropbox). Since these wastes are in large containers that are brought directly to one of the transfer stations to be emptied, the waste is only from the one business or institution where the compactor or roll-off was located (unless other types of wastes are thrown in at the point of generation, which sometimes occurs).
Construction and demolition (C&D) wastes and other special wastes are included in the above categories as appropriate for the source and delivery method. C&D waste is often delivered by employees of a construction company and so is included with Non-Residential Self-Haul waste, but C&D waste is also delivered by homeowners and landlords (i.e., Residential Self-Haul waste), or by waste haulers from construction sites (Commercial waste), or even by waste haulers delivering roll-off containers from do-it-yourself home remodeling projects (Single-Family waste). B. WASTE QUANTITIES The quantity (tonnage) of solid waste disposed by each type of generator was determined through existing transaction records and additional data provided by Waste Connections and others. The additional data provided by Waste Connections included:
a survey of self-haul customers by scalehouse personnel. Data collected by this survey determined the breakdown of cash customers into residential and non-residential sources, and also determined how much waste was delivered by sources from the City of Vancouver versus the rest of Clark County.

2012 Clark County Waste Stream Analysis 5 Results
data from their customer records as to how much Single-Family, Multi-Family, and Commercial wastes were included in deliveries by their collection trucks to the transfer stations.
The City of Camas provided the information needed to allocate their waste deliveries into Single-Family, Multi-Family, and Commercial categories. Annual tonnage data for charge accounts (provided by Waste Connections) was analyzed by the consultants to allocate those tonnages between Residential Self-Haul and Non-Residential Self-Haul. Thus, tonnages for the four major types of customers (cash, charge accounts, private hauler, and municipal hauler) were allocated to the six generator types used in this study. The data used for this study was either for a one-year period coinciding with the period of this study (November 1, 2011 through October 31, 2012), or was weekly and monthly data coinciding with the timing of the waste sorting fieldwork. Table 1 shows the results of the waste quantity analysis. One way to look at the waste quantity data is in terms of waste generation rates. Comparing Clark County’s waste tonnages for the study period (243,770 tons) to recent population estimates (431,250 people in 2012 according to the Washington Office of Financial Management), leads to a per capita waste generation rate of 0.57 tons per person per year (down from 0.68 tons per person in 2008), or 3.10 pounds per person per day. Waste quantity data can also be applied separately to residential and non-residential generators. For Clark County’s estimated 2012 population (431,250 people) and the residential waste quantities (118,610 tons per year), the residential waste generation rate is 0.28 tons per person per year or 1.51 pounds per person per day. For non-residential waste quantities (125,160 tons per year) and an estimated 130,800 workers (from the Washington Employment Security Department for October 2012), the non-residential waste generation rate is 0.96 tons per employee per year or 5.24 pounds per employee per day (or 7.33 pounds per employee per day on the basis of a five-day work week). The self-haul survey conducted by scalehouse personnel collected data on the geographic source of the waste (for customers from the City of Vancouver versus the rest of the County) in addition to determining whether it was from residential or non-residential sources. This data shows that:
40% of the cash customers in 2012 were residential self-haul customers from the City of Vancouver,
32% were residential self-haul customers from the rest of Clark County,
18% were non-residential self-haul customers from the City of Vancouver, and
11% were non-residential self-haul customers from the rest of the Clark County.

2012 Clark County Waste Stream Analysis 6 Results
TABLE 1
QUANTITIES OF DISPOSED WASTES
Type of Waste Generator
March 2012 May 2012 August 2012 October 2012 Annual Amounts Tons Percent Tons Percent Tons Percent Tons Percent Tons Percent
Residential Self-Haul 2,280 11.8 2,740 12.8 3,120 13.3 2,250 10.4 28,280 12.0
Non-Residential Self-Haul 2,280 11.8 2,730 12.7 4,080 17.4 3,260 15.1 32,520 13.3
Self-Haul Subtotal 4,560 23.6 5,470 25.5 7,200 30.6 5,510 25.5 61,810 25.4
Single-Family 6,180 31.9 6,830 31.8 6,950 29.6 6,700 30.9 77,530 31.8
Multi-Family 1,050 5.4 1,130 5.3 1,150 4.9 1,150 5.3 12,800 5.2
Commercial 3,880 20.0 3,970 18.5 3,820 16.2 4,050 18.7 45,390 18.6
Commercial Compactor 3,680 19.0 4,070 19.0 4,390 18.7 4,230 19.5 46,240 19.0
Garbage Truck Subtotal 14,780 76.4 16,000 74.5 16,310 69.4 16,130 74.5 181,960 74.6
Totals 19,340 100.0 21,480 100.0 23,510 100.0 21,640 100.0 243,770 100.0

2012 Clark County Waste Stream Analysis 7 Results
C. WASTE COMPOSITION The composition of the County’s solid waste stream was determined by randomly selecting and sorting samples of waste from loads delivered to West Van, WTS and CTR. Sampling was conducted Tuesday through Saturday for three quarters (March, May, and August 2012), and Sunday through Thursday in one quarter (October 2012). Each sample was sorted into 42 distinct categories of materials. Notes were also recorded on the field data form as to the specific source of the loads for Commercial Compactors and Non-Residential Self-Haul. The Glossary provides additional detail on the definitions used for this study for the types of generators and material categories. Appendix A shows the statistical certainty of the results. Sampling Methods The composition of the County’s mixed municipal waste stream was determined by randomly selecting and sorting a total of 227 samples of waste. These samples were allocated between the types of generators based on the need to examine certain types in greater detail. A greater number of samples were taken for the waste streams that are considered inherently more variable (the two self-haul waste streams, Commercial wastes and Commercial Compactor wastes), and fewer of the samples were allocated to the waste streams that are typically less variable (Single-Family and Multi-Family). An additional 12 samples were taken from the compactor used by Clark County office buildings and the courthouse, and a separate report was provided for those results. The number of samples taken each quarter is shown in Table 2.
TABLE 2 NUMBER OF SAMPLES BY TYPE OF GENERATOR
Type of Waste Generator
March 2012
May 2012
August 2012
October 2012
Totals Number Percent
Residential Self-Haul 11 11 11 11 44 18% Non-Residential Self-Haul 11 11 11 12 45 19% Single-Family 8 8 8 7 31 13% Multi-Family 6 6 6 7 25 11% Commercial 10 10 10 8 38 16% Commercial Compactors 11 10 10 13 44 18% County Buildings 3 3 3 3 12 5%
——— ——— ——— ——— ——— ———Totals 60 59 59 61 239 100%

2012 Clark County Waste Stream Analysis 8 Results
Waste Composition Results Table 3 shows the annual average waste composition figures for each generator and for the entire County. The results for the entire County are also illustrated in Figure 1. The waste composition results for each generator are shown in Figures 2 through 7. As can be seen in Table 3, there are substantial differences in the composition of wastes from the different sources. These differences can be explained by the different activities that created the wastes. Single-Family waste, for instance, is influenced by the activities associated with living in and maintaining a home. Residential Self-Haul waste contains typical household garbage but also contains some construction debris and other materials from the special projects that often motivate people to make a special trip to disposal facilities. The Commercial waste stream in Clark County is dominated by various manufacturing and administrative activities, while the Non-Residential Self-Haul waste stream is dominated by construction activities. A business or institution will sometimes choose to haul their own waste, in which case the waste will not differ greatly from the waste that would have been collected by garbage haulers (Commercial waste), but Non-Residential Self-Haul wastes in many cases are from construction projects. Ample evidence of the contribution of construction activities to this waste stream is provided by the fact that over half of the Non-Residential Self-Haul waste stream is comprised of various grades of wood (26.3%) and C&D waste (36.6%). Additional Data Collected In addition to the results shown in the following tables and figures, a few other pieces of information were collected in the course of the fieldwork conducted for this project:
reusable materials: samples containing reusable items or reusable amounts of wood and construction/demolition wastes were noted during the sorting process, but not very many samples were found to contain reusable materials. Only eight samples were found to contain reusables, which were primarily wood objects or materials and also a few items that fell in the “rubble” category (a toilet and a bag of clay-based aggregate for hydroponics). Five of the eight samples were from Residential Self-Haul generators, two were from Commercial Compactors, and one sample that contained reusables was from an apartment building (Multi-Family). For all of the samples taken together, the average amount of reusable materials in the County’s entire waste stream is estimated to be 0.5% based on these results.
customer survey: self-haul customers were surveyed at the three transfer stations
on Saturday, August 11 to gather information about the frequency of their visits, the services used, the source of the loads, whether reusable materials were in their load, and other data. The results of this survey are shown in Appendix B.

PAPER Newspaper 0.55% 2.35% 0.51% 0.00% 1.04% 0.50% 0.65%Cardboard 0.87% 3.22% 4.64% 4.84% 3.33% 4.20% 3.07%Mixed Waste Paper 4.60% 7.67% 4.71% 1.11% 6.73% 3.32% 4.46%Milk Cartons, Other 0.19% 0.34% 0.10% 0.06% 0.28% 0.14% 0.18%Food-Soiled Paper 3.86% 2.35% 1.04% 0.33% 3.88% 1.35% 2.50%Non-Recyclable Paper 3.97% 3.50% 1.68% 1.70% 5.20% 4.61% 3.72%Paper Subtotal 14.05% 19.44% 12.68% 8.04% 20.46% 14.12% 14.57%
PLASTIC PET Bottles 0.83% 1.93% 0.49% 0.18% 1.06% 0.52% 0.74%HDPE Bottles 0.48% 1.01% 0.22% 0.01% 0.87% 0.30% 0.45%Bottles 3-7 0.06% 0.11% 0.04% 0.03% 0.06% 0.06% 0.06%Tubs 0.40% 0.30% 0.06% 0.04% 0.25% 0.07% 0.22%Film and Bags 7.16% 5.00% 2.10% 1.05% 8.27% 3.85% 5.20%Recyclable Packaging 0.60% 0.44% 0.19% 0.04% 0.37% 0.24% 0.36%Other Plastics 4.06% 4.28% 10.50% 3.36% 4.54% 10.51% 6.06%Expanded Polystyrene 0.58% 0.49% 0.63% 0.28% 0.38% 1.20% 0.62%Plastic Subtotal 14.16% 13.56% 14.23% 4.99% 15.81% 16.76% 13.72%
METAL Aluminum Cans 0.33% 0.86% 0.19% 0.04% 0.50% 0.22% 0.31%Tin Cans 0.76% 1.20% 0.37% 0.20% 0.94% 0.10% 0.57%Ferrous Metals 0.79% 0.41% 2.75% 0.49% 0.59% 3.05% 1.36%Non-Ferrous Metals 0.47% 0.43% 1.22% 0.81% 0.17% 0.46% 0.55%Mixed Metals 1.46% 2.39% 10.45% 2.71% 1.07% 4.43% 3.25%Metal Subtotal 3.80% 5.29% 14.98% 4.24% 3.26% 8.26% 6.03%
ORGANIC Food Scraps 29.41% 22.56% 7.81% 3.94% 33.14% 11.64% 20.38%Yard Debris 1.60% 1.46% 3.29% 3.05% 2.84% 2.15% 2.32%Organic Subtotal 31.01% 24.02% 11.10% 6.99% 35.97% 13.79% 22.70%
GLASS Clear Bottles 1.13% 2.78% 0.62% 0.05% 1.23% 0.34% 0.88%Brown Bottles 0.61% 1.32% 0.50% 0.00% 0.82% 0.27% 0.53%Green Bottles 0.31% 0.52% 0.41% 0.03% 0.78% 0.15% 0.35%Non-Recyclable Glass 0.34% 0.51% 1.68% 2.73% 0.25% 0.18% 0.78%Glass Subtotal 2.39% 5.13% 3.21% 2.81% 3.08% 0.94% 2.54%
WOOD Clean Wood 0.47% 0.28% 1.46% 7.79% 0.63% 7.13% 2.85%Hogfuel 0.46% 0.57% 9.44% 8.21% 0.45% 5.70% 3.57%Natural Wood 0.00% 0.00% 0.00% 0.03% 0.00% 0.00% 0.004%Roofing, Wood 0.00% 0.00% 0.00% 4.88% 0.00% 0.05% 0.66%Contaminated 0.56% 0.10% 2.65% 5.34% 0.18% 4.72% 2.14%Other Wood 0.05% 0.94% 1.33% 0.04% 0.06% 1.75% 0.57%Wood Subtotal 1.54% 1.88% 14.89% 26.30% 1.32% 19.34% 9.80%
CONST. Gypsum 0.07% 0.00% 4.59% 8.11% 0.00% 3.73% 2.36% & DEMO. Rubble 0.44% 1.71% 3.75% 9.72% 0.01% 2.45% 2.45%
Roofing 0.00% 0.01% 2.84% 6.27% 0.01% 0.90% 1.35%Carpet, Padding 0.26% 0.22% 6.79% 12.36% 0.53% 1.73% 2.99%Soil, Dirt 0.10% 0.04% 1.44% 0.11% 0.00% 0.08% 0.24%C&D Subtotal 0.88% 1.99% 19.41% 36.56% 0.55% 8.89% 9.38%
OTHER Hazardous Wastes 0.06% 0.29% 0.31% 0.07% 0.18% 0.33% 0.18%Medical Wastes 0.01% 0.02% 0.00% 0.00% 0.02% 0.01% 0.01%Animal Excrement 3.76% 5.48% 0.96% 0.00% 0.67% 0.33% 1.79%Household Batteries 0.14% 0.07% 0.06% 0.01% 0.07% 0.01% 0.07%E-Waste 0.04% 1.13% 0.02% 0.00% 0.03% 0.00% 0.08%Other Subtotal 4.01% 6.98% 1.35% 0.08% 0.98% 0.68% 2.12%
REMAINDER Garbage 28.15% 21.70% 8.15% 9.99% 18.57% 17.23% 19.13%TOTAL 100.00% 100.00% 100.00% 100.00% 100.00% 100.00% 100.00%
Pounds of Samples Sorted: 7,357 4,978 6,568 5,355 8,024 6,485 38,766Number of Samples Sorted: 31 25 44 45 38 44 227
Note: All figures are percent by weight (except for the bottom two rows).
TABLE 3
FamilyMulti-Family Entire CountySelf-Haul Self-Haul CompactorsCommercial
WASTE COMPOSITION RESULTSCLARK COUNTY WASTE STREAM ANALYSIS
Single- Residential Average forNon-Res. Commercial
2012 Clark County Waste Stream Analysis 9 Results
Paper, 14.6% 4.5% Mixed Paper 3.7% Non-Recyclable 3.1% Cardboard 2.5% Food-Soiled 0.7% Newspaper 0.2% Milk Cartons, Other
Plastic, 13.7% 6.1% Other Plastics 5.2% Film and Bags 0.7% PET Bottles 0.6% Expanded Polystyrene 0.5% HDPE Bottles 0.4% Recyclable Packaging 0.2% Tubs 0.1% Other Plastic Bottles (types 3-7)
Metal, 6.0% 3.3% Mixed Metals 1.4% Ferrous Metals 0.6% Tin Cans 0.6% Non-Ferrous Metals 0.3% Aluminum Cans
Glass, 2.5% 0.9% Clear Bottles 0.8% Non-Recyclable Glass 0.5% Brown Bottles 0.4% Green Bottles
Organic, 22.7% 20.4% Food Scraps 2.3% Yard Debris
Other, 2.1% 1.8% Animal Excrement 0.2% Hazardous Waste 0.08% E-Waste 0.07% Household Batteries 0.01% Medical Waste
FIGURE 1 WASTE COMPOSITION RESULTS
CLARK COUNTY WASTE STREAM ANALYSIS
Note: All figures are percent by weight.
Remainder, 19.1%
Wood and C&D, 19.2% 3.6% Hogfuel 3.0% Carpet, Padding 2.9% Clean Wood 2.5% Rubble 2.4% Gypsum 2.1% Contaminated Wood 1.4% Roofing (Non-Wood) 0.7% Wood Roofing 0.6% Other Wood 0.2% Soil and Dirt

SUMMARY OF WASTE COMPOSITION RESULTS:
PAPER Newspaper 0.6% ORGANIC Food Scraps 29.4%Cardboard 0.9% Yard Debris 1.6%Mixed Waste Paper 4.6% Organic Subtotal 31.0%Milk Cartons, Other 0.2%Food-Soiled Paper 3.9% GLASS Clear Bottles 1.1%Non-Recyclable Paper 4.0% Brown Bottles 0.6%Paper Subtotal 14.0% Green Bottles 0.3%
Non-Recyclable Glass 0.3%PLASTIC PET Bottles 0.8% Glass Subtotal 2.4%
HDPE Bottles 0.5%Bottles 3-7 0.1% WOOD Clean Wood 0.5%Tubs 0.4% C&D Hogfuel 0.5%Film and Bags 7.2% Wood Roofing 0.0%Recyclable Packaging 0.6% Gypsum 0.1%Other Plastics 4.1% Rubble 0.4%Expanded Polystyrene 0.6% Roofing 0.0%Plastic Subtotal 14.2% Carpet and Padding 0.3%
Other Wood, C&D 0.7%METAL Aluminum Cans 0.3% Wood, C&D Subtotal 2.4%
Tin Cans 0.8%Ferrous Metals 0.8% OTHER Hazardous and Medical 0.1%Non-Ferrous Metals 0.5% Animal Excrement 3.8%Mixed Metals 1.5% Household Batteries 0.1%Metal Subtotal 3.8% E-Waste 0.04%
Other Subtotal 4.0%
Remainder (Garbage) 28.2%Note: All figures are percent by weight.
FIGURE 2SINGLE - FAMILY WASTE
CLARK COUNTY WASTE STREAM ANALYSIS
Plastic14.2%
Metal3.8%
Glass2.4%
Organic31.0%
Wood and C&D2.4%
Other4.0%
Garbage28.2%
Paper14.0%
2012 Clark County Waste Stream Analysis 11 Results

SUMMARY OF WASTE COMPOSITION RESULTS:
PAPER Newspaper 2.4% ORGANIC Food Scraps 22.6%Cardboard 3.2% Yard Debris 1.5%Mixed Waste Paper 7.7% Organic Subtotal 24.0%Milk Cartons, Other 0.3%Food-Soiled Paper 2.3% GLASS Clear Bottles 2.8%Non-Recyclable Paper 3.5% Brown Bottles 1.3%Paper Subtotal 19.4% Green Bottles 0.5%
Non-Recyclable Glass 0.5%PLASTIC PET Bottles 1.9% Glass Subtotal 5.1%
HDPE Bottles 1.0%Bottles 3-7 0.1% WOOD Clean Wood 0.3%Tubs 0.3% C&D Hogfuel 0.6%Film and Bags 5.0% Wood Roofing 0.0%Recyclable Packaging 0.4% Gypsum 0.0%Other Plastics 4.3% Rubble 1.7%Expanded Polystyrene 0.5% Roofing 0.01%Plastic Subtotal 13.6% Carpet and Padding 0.2%
Other Wood, C&D 1.1%METAL Aluminum Cans 0.9% Wood, C&D Subtotal 3.9%
Tin Cans 1.2%Ferrous Metals 0.4% OTHER Hazardous and Medical 0.3%Non-Ferrous Metals 0.4% Animal Excrement 5.5%Mixed Metals 2.4% Household Batteries 0.1%Metal Subtotal 5.3% E-Waste 1.1%
Other Subtotal 7.0%
Remainder (Garbage) 21.7%Notes: All figures are percent by weight.
FIGURE 3MULTI - FAMILY WASTE
CLARK COUNTY WASTE STREAM ANALYSIS
Plastic13.6%
Metal5.3%
Glass5.1%
Organic24.0%
Wood and C&D3.9%
Other7.0%
Garbage21.7%
Paper19.4%
2012 Clark County Waste Stream Analysis 12 Results

SUMMARY OF WASTE COMPOSITION RESULTS:
PAPER Newspaper 0.5% ORGANIC Food Scraps 7.8%Cardboard 4.6% Yard Debris 3.3%Mixed Waste Paper 4.7% Organic Subtotal 11.1%Milk Cartons, Other 0.1%Food-Soiled Paper 1.0% GLASS Clear Bottles 0.6%Non-Recyclable Paper 1.7% Brown Bottles 0.5%Paper Subtotal 12.7% Green Bottles 0.4%
Non-Recyclable Glass 1.7%PLASTIC PET Bottles 0.5% Glass Subtotal 3.2%
HDPE Bottles 0.2%Bottles 3-7 0.04% WOOD Clean Wood 1.5%Tubs 0.1% C&D Hogfuel 9.4%Film and Bags 2.1% Wood Roofing 0.0%Recyclable Packaging 0.2% Gypsum 4.6%Other Plastics 10.5% Rubble 3.8%Expanded Polystyrene 0.6% Roofing 2.8%Plastic Subtotal 14.2% Carpet and Padding 6.8%
Other Wood, C&D 5.4%METAL Aluminum Cans 0.2% Wood, C&D Subtotal 34.3%
Tin Cans 0.4%Ferrous Metals 2.8% OTHER Hazardous and Medical 0.3%Non-Ferrous Metals 1.2% Animal Excrement 1.0%Mixed Metals 10.4% Household Batteries 0.1%Metal Subtotal 15.0% E-Waste 0.02%
Other Subtotal 1.4%
Remainder (Garbage) 8.1%Note: All figures are percent by weight.
FIGURE 4
CLARK COUNTY WASTE STREAM ANALYSISRESIDENTIAL SELF - HAUL WASTE
Plastic14.2%
Metal15.0%
Glass3.2%
Organic11.1%Wood and C&D
34.3%
Other1.4%
Garbage8.1%
Paper12.7%
2012 Clark County Waste Stream Analysis 13 Results

SUMMARY OF WASTE COMPOSITION RESULTS:
PAPER Newspaper 0.0% ORGANIC Food Scraps 3.9%Cardboard 4.8% Yard Debris 3.1%Mixed Waste Paper 1.1% Organic Subtotal 7.0%Milk Cartons, Other 0.1%Food-Soiled Paper 0.3% GLASS Clear Bottles 0.1%Non-Recyclable Paper 1.7% Brown Bottles 0.0%Paper Subtotal 8.0% Green Bottles 0.03%
Non-Recyclable Glass 2.7%PLASTIC PET Bottles 0.2% Glass Subtotal 2.8%
HDPE Bottles 0.01%Bottles 3-7 0.03% WOOD Clean Wood 7.8%Tubs 0.04% C&D Hogfuel 8.2%Film and Bags 1.0% Wood Roofing 4.9%Recyclable Packaging 0.04% Gypsum 8.1%Other Plastics 3.4% Rubble 9.7%Expanded Polystyrene 0.3% Roofing 6.3%Plastic Subtotal 5.0% Carpet and Padding 12.4%
Other Wood, C&D 5.5%METAL Aluminum Cans 0.04% Wood, C&D Subtotal 62.9%
Tin Cans 0.2%Ferrous Metals 0.5% OTHER Hazardous and Medical 0.1%Non-Ferrous Metals 0.8% Animal Excrement 0.0%Mixed Metals 2.7% Household Batteries 0.01%Metal Subtotal 4.2% E-Waste 0.0%
Other Subtotal 0.1%
Remainder (Garbage) 10.0%Note: All figures are percent by weight.
NON - RESIDENTIAL SELF - HAUL WASTEFIGURE 5
CLARK COUNTY WASTE STREAM ANALYSIS
Plastic5.0%
Metal4.2%
Glass2.8%
Organic7.0%
Wood and C&D62.9%
Other0.1%
Garbage10.0%
Paper8.0%
2012 Clark County Waste Stream Analysis 14 Results

SUMMARY OF WASTE COMPOSITION RESULTS:
PAPER Newspaper 1.0% ORGANIC Food Scraps 33.1%Cardboard 3.3% Yard Debris 2.8%Mixed Waste Paper 6.7% Organic Subtotal 36.0%Milk Cartons, Other 0.3%Food-Soiled Paper 3.9% GLASS Clear Bottles 1.2%Non-Recyclable Paper 5.2% Brown Bottles 0.8%Paper Subtotal 20.5% Green Bottles 0.8%
Non-Recyclable Glass 0.3%PLASTIC PET Bottles 1.1% Glass Subtotal 3.1%
HDPE Bottles 0.9%Bottles 3-7 0.1% WOOD Clean Wood 0.6%Tubs 0.3% C&D Hogfuel 0.4%Film and Bags 8.3% Wood Roofing 0.0%Recyclable Packaging 0.4% Gypsum 0.0%Other Plastics 4.5% Rubble 0.01%Expanded Polystyrene 0.4% Roofing 0.01%Plastic Subtotal 15.8% Carpet and Padding 0.5%
Other Wood, C&D 0.2%METAL Aluminum Cans 0.5% Wood, C&D Subtotal 1.9%
Tin Cans 0.9%Ferrous Metals 0.6% OTHER Hazardous and Medical 0.2%Non-Ferrous Metals 0.2% Animal Excrement 0.7%Mixed Metals 1.1% Household Batteries 0.1%Metal Subtotal 3.3% E-Waste 0.03%
Other Subtotal 1.0%
Remainder (Garbage) 18.6%Note: All figures are percent by weight.
COMMERCIAL WASTECLARK COUNTY WASTE STREAM ANALYSIS
FIGURE 6
Plastic15.8%
Metal3.3%
Glass3.1%
Organic36.0%
Wood and C&D1.9%
Other1.0%
Garbage 18.6%
Paper20.5%
2012 Clark County Waste Stream Analysis 15 Results

SUMMARY OF WASTE COMPOSITION RESULTS:
PAPER Newspaper 0.5% ORGANIC Food Scraps 11.6%Cardboard 4.2% Yard Debris 2.1%Mixed Waste Paper 3.3% Organic Subtotal 13.8%Milk Cartons, Other 0.1%Food-Soiled Paper 1.4% GLASS Clear Bottles 0.3%Non-Recyclable Paper 4.6% Brown Bottles 0.3%Paper Subtotal 14.1% Green Bottles 0.2%
Non-Recyclable Glass 0.2%PLASTIC PET Bottles 0.5% Glass Subtotal 0.9%
HDPE Bottles 0.3%Bottles 3-7 0.1% WOOD Clean Wood 7.1%Tubs 0.1% C&D Hogfuel 5.7%Film and Bags 3.9% Wood Roofing 0.1%Recyclable Packaging 0.2% Gypsum 3.7%Other Plastics 10.5% Rubble 2.5%Expanded Polystyrene 1.2% Roofing 0.9%Plastic Subtotal 16.8% Carpet and Padding 1.7%
Other Wood, C&D 6.5%METAL Aluminum Cans 0.2% Wood, C&D Subtotal 28.2%
Tin Cans 0.1%Ferrous Metals 3.1% OTHER Hazardous and Medical 0.3%Non-Ferrous Metals 0.5% Animal Excrement 0.3%Mixed Metals 4.4% Household Batteries 0.01%Metal Subtotal 8.3% E-Waste 0.0%
Other Subtotal 0.7%
Remainder (Garbage) 17.2%Note: All figures are percent by weight.
CLARK COUNTY WASTE STREAM ANALYSIS
FIGURE 7COMMERCIAL COMPACTOR WASTE
Plastic16.8%
Metal8.3%
Glass0.9%
Organic13.8%
Wood and C&D28.2%
Other0.7%
Garbage17.2%
Paper14.1%
2012 Clark County Waste Stream Analysis 16 Results

2012 Clark County Waste Stream Analysis 17 Results
types of hazardous wastes: of the 239 samples that were sorted during the course of this project, 26 samples (11% of the total) were found to contain “hazardous wastes” of various types. Four of these samples contained only latex paint, however, which is not actually classified as hazardous. One additional sample contained latex paint along with other materials that were hazardous (mouse poison, solvent and spray cleaner). Florescent bulbs were the most commonly found item, occurring in 11 of the samples. The number of samples in which each type of material was found is:
florescent bulbs – 11 latex paint – 5 oil filters – 3 yard and garden chemicals – 3 solvents – 2 adhesives – 2 thermometers with mercury – 2 oil paint – 1 other items - 5
Hazardous wastes were found in 16% of the samples from Single-Family, Multi-Family and Commercial generators, and in lower numbers of samples from the two self-haul streams and Commercial Compactors.
number of syringes: in addition to recording the weight of medical wastes, the
number of syringes found in the samples was noted. A total of 45 syringes were found during the four quarters of fieldwork. This is the equivalent of 2.2 syringes per ton of waste. Most of the syringes were found in samples from the Commercial (17 syringes), Single-Family (15), and Multi-Family (10) waste streams.

2012 Clark County Waste Stream Analysis 18 Results

2012 Clark County Waste Stream Analysis 19 Conclusions
S E C T I O N T H R E E C O N C L U S I O N S
A. INTRODUCTION This section examines trends and provides conclusions based on the data collected by this study. B. WEIGHT OF MATERIALS DISPOSED The waste quantity and composition results can be combined to show the total weight of disposed materials. Table 4 shows this information for each waste generator, combining the composition data for these generators with their annual waste quantities to calculate the tons of each material that are disposed each year. C. TRENDS Data from this study can be compared to previous studies to see how the waste stream has changed in the past 20 years (see Table 5). Since the list of materials examined by the various studies are different, some modifications were necessary in order to compare the results. These modifications include:
several paper categories needed to be combined, either as “mixed waste paper” or as “all other paper.”
all categories of plastics had to be combined into one category called “all plastics” because the categories used in the 2003 study were limited and significantly different from the other studies.
several categories for metals had to be combined into a category called “all other metals.”
categories for wood, C&D and other wastes needed to be combined into broad categories for each of these types of materials.
The bottom row of Table 5 shows the total amount of waste disposed in each year that a waste composition study was performed. For all but the current study and the previous study, the figures shown are tons per year for the calendar year corresponding to the date of the study. For 2008, the figure shown (281,900 tons) is a mid-year to mid-year figure corresponding to the period of that study (May 1, 2007 through April 30, 2008). For the current study, the figures shown correspond to a one-year period from November 1, 2011 through October 31, 2012. As can be seen, the amount of waste

PAPER Newspaper 430 300 150 0 470 230 1,580Cardboard 680 410 1,360 1,570 1,510 1,940 7,470Mixed Waste Paper 3,570 980 1,380 360 3,050 1,540 10,880Milk Cartons, Other 150 40 30 20 130 70 430Food-Soiled Paper 2,990 300 310 110 1,760 630 6,090Non-Recyclable Paper 3,080 450 490 550 2,360 2,130 9,070
PLASTIC Paper Subtotal 10,890 2,490 3,710 2,620 9,290 6,530 35,530PET Bottles 640 250 140 60 480 240 1,810HDPE Bottles 370 130 60 4 390 140 1,100Bottles 3-7 50 10 10 10 30 30 140Tubs 310 40 20 10 120 30 530Film and Bags 5,550 640 610 340 3,760 1,780 12,690Recyclable Packaging 460 60 60 10 170 110 870Other Plastics 3,150 550 3,070 1,090 2,060 4,860 14,780Expanded Polystyrene 450 60 180 90 170 560 1,510
METAL Plastic Subtotal 10,980 1,740 4,170 1,620 7,180 7,750 33,430Aluminum Cans 250 110 60 10 230 100 760Tin Cans 590 150 110 60 430 40 1,380Ferrous Metals 610 50 810 160 270 1,410 3,310Non-Ferrous Metals 360 60 360 260 80 210 1,330Mixed Metals 1,130 310 3,060 880 490 2,050 7,910
ORGANIC Metal Subtotal 2,950 680 4,390 1,380 1,480 3,820 14,690Food Scraps 22,800 2,890 2,290 1,280 15,040 5,380 49,680Yard Debris 1,240 190 960 990 1,290 990 5,670Organic Subtotal 24,050 3,070 3,250 2,270 16,330 6,380 55,350
GLASS Clear Bottles 870 360 180 20 560 160 2,140Brown Bottles 470 170 150 0 370 120 1,290Green Bottles 240 70 120 10 350 70 860Non-Recyclable Glass 260 70 490 890 110 80 1,900Glass Subtotal 1,850 660 940 910 1,400 430 6,200
WOOD Clean Wood 360 40 430 2,530 290 3,300 6,940Hogfuel 360 70 2,770 2,670 200 2,630 8,700Natural Wood 0 0 0 10 0 0 10Roofing, Wood 0 0 0 1,590 0 20 1,610Contaminated 430 10 780 1,740 80 2,180 5,220Other Wood 40 120 390 10 30 810 1,390Wood Subtotal 1,190 240 4,360 8,550 600 8,940 23,880
CONST. Gypsum 50 0 1,340 2,640 0 1,720 5,760 & DEMO. Rubble 340 220 1,100 3,160 4 1,130 5,960
Roofing 0 1 830 2,040 3 420 3,290Carpet, Padding 210 30 1,990 4,020 240 800 7,280Soil, Dirt 80 10 420 40 0 40 580C&D Subtotal 680 250 5,680 11,890 250 4,110 22,870
OTHER Hazardous Wastes 50 40 90 20 80 150 430 WASTES Medical Wastes 10 3 0 0 10 3 20
Animal Excrement 2,920 700 280 0 300 150 4,360Household Batteries 110 10 20 3 30 10 180E-Waste 30 140 5 0 10 0 190Other Subtotal 3,110 890 400 30 440 310 5,180
REMAINDER Garbage 21,830 2,780 2,390 3,250 8,430 7,970 46,630TOTAL 77,530 12,800 29,290 32,520 45,400 46,240 243,760
Note: All figures are tons per year.
CommercialCompactorsCommercial
Multi- Residential Non-Res. Totals forSelf-Haul Entire County
CLARK COUNTY WASTE STREAM ANALYSIS
TABLE 4WEIGHT OF DISPOSED MATERIALS (TONS PER YEAR)
FamilySingle-
Family Self-Haul
2012 Clark County Waste Stream Analysis 20 Conclusions

Current Study,
PAPER Newspaper 1.8% 2.0% 2.1% 1.6% 1.0% 0.6%Cardboard 4.7% 5.3% 4.7% 4.0% 4.7% 3.1%Mixed Waste Paper 8.8% 8.0% 6.4% 7.0% 6.1% 4.5%All Other Paper 10.8% 8.0% 8.6% 6.6% 6.5% 6.4%Paper Subtotal 26.1% 23.3% 21.8% 19.2% 18.3% 14.6%
PLASTIC All Plastics 10.4% 11.6% 12.9% 11.5% 13.2% 13.7%METAL Aluminum Cans 0.4% 0.4% 0.4% 0.3% 0.3% 0.3%
Ferrous Metals 2.1% 2.4% 2.1% 3.1% 2.8% 1.4%Non-Ferrous Metals 0.2% 0.3% 0.2% 0.2% 0.3% 0.5%All Other Metals 3.4% 3.5% 4.5% 3.5% 3.4% 3.8%Metal Subtotal 6.1% 6.6% 7.2% 7.1% 6.8% 6.0%
ORGANIC Food Scraps 12.1% 11.9% 14.5% 15.3% 16.3% 20.4%Yard Debris 5.8% 4.1% 3.3% 3.8% 1.5% 2.3%Organic Subtotal 17.9% 16.0% 17.8% 19.1% 17.7% 22.7%
GLASS Clear Bottles 1.4% 1.4% 1.5% 1.5% 1.1% 0.9%Brown Bottles 0.4% 0.4% 0.7% 0.7% 0.5% 0.5%Green Bottles 0.3% 0.4% 0.4% 0.4% 0.3% 0.4%Non-Recyclable Glass 0.6% 0.5% 0.5% 0.5% 0.9% 0.8%Glass Subtotal 2.7% 2.7% 3.2% 3.2% 2.8% 2.5%
WOOD, Wood 10.5% 9.4% 8.5% 10.4% 9.7% 9.8% C&D Construction & Demolition 8.4% 8.9% 7.4% 7.8% 5.4% 9.4%
Wood, C&D Subtotal 18.9% 18.3% 15.9% 18.2% 15.1% 19.2%REMAINDER All Other Wastes 17.9% 21.5% 21.2% 21.7% 26.1% 21.3%
TOTAL 100.0% 100.0% 100.0% 100.0% 100.0% 100.0%
TONS PER YEAR DISPOSED 183,210 197,446 227,259 254,019 281,900 243,770
Note: All figures are percentages by weight, except the figures for tons per year shown in the bottom row.
201220081999
TABLE 5COMPARISON OF RESULTS TO PREVIOUS STUDIES
CLARK COUNTY WASTE STREAM ANALYSIS
Previous Studies1993 1995 2003
2012 Clark County Waste Stream Analysis 21 Conclusions

2012 Clark County Waste Stream Analysis 22 Conclusions
increased by almost 100,000 tons per year (a 54% increase) in the period from 1993 to 2008. All or most of this increase can probably be directly correlated to increased numbers of residents and employees, but part of the increase may also be the result of increasing generation rates on a per capita and/or per employee basis. The annual amount of garbage in the latest study is significantly less, however, and has dropped to levels similar to about ten years ago. This decrease is similar to the drop in waste tonnages that has been seen throughout the rest of Washington State and the nation, and is widely attributed to the recession. D. CONCLUSIONS Waste Quantities
A number of observations and conclusions can be made by examining the waste quantity data:
Residential Self-Haul: the Residential Self-Haul waste stream is made up of numerous small loads delivered to the transfer stations in cars, pickup trucks and similar vehicles. It is an important service to allow people to haul their own waste to the transfer stations, but this is also the least efficient method of garbage collection. While this source contributes only 12.0% of the county’s total waste stream, this type of generator is responsible for 74% of the traffic at the transfer stations. Self-haul loads average 436 pounds per vehicle, compared to 9,000 to 14,000 pounds per load for municipal and private garbage trucks, but frequently take as long or longer to unload as garbage trucks.
Non-Residential Self-Haul: this type of generator brings in slightly more waste (13.3%) than Residential Self-Haul generators, and it does so with fewer trips and larger loads. Based on transaction records for the period of this study, Non-Residential Self-Haul loads represent 10.6% of the vehicle trips through the transfer stations and deliver an average of 1,242 pounds per vehicle.
Single-Family: Single-Family wastes contribute almost one-third (31.8%) of the total tonnage of the County’s waste stream. This figure does not include Residential Self-Haul quantities, which are also almost entirely from single-family homes.
Multi-Family: this study shows that 12,800 tons per year, or 5.2%, of Clark County’s waste stream is from Multi-Family units. This is consistent with the amount found in the previous study (14,160 tons, or 5.0%, of the waste stream in 2008).
Commercial and Commercial Compactors: the Commercial and Commercial Compactor waste streams together make up 37.2% of the County’s waste stream, with nearly equal amounts collected by garbage trucks servicing dumpsters (45,390 tons per year) versus single-source roll-off’s and compactors (46,240 tons). Both of

2012 Clark County Waste Stream Analysis 23 Conclusions
these figures are significantly lower than in the previous study, when these two sources together contributed almost half of the County’s waste stream (123,850 tons in 2008, or 45.0% of the total).
Waste Composition
There are distinct differences in the waste streams disposed by the different types of waste generators, as can be seen in several of the tables and figures in this report. For each of the generators, a few noteworthy conclusions can be drawn:
Single-Family: the largest material in this waste stream is food scraps (29.4% by weight), which is disposed at four times the quantity as the next largest material (plastic film and bags, at 7.2%). There are significant quantities of various grades of paper (mixed waste paper, at 4.6%; non-recyclable paper, at 4.0%; and food-soiled paper, at 3.9%). There are also substantial amounts of other plastics, at 4.1%, and animal excrement (“kitty litter),” at 3.8%.
The Single-Family waste stream contains only 15.6% of the materials collected through the curbside recycling program (including glass and yard debris). This is down from the 20.9% that was found in the study four years ago.
Multi-Family: the Multi-Family waste stream also contains a high amount of food scraps (22.6%), with mixed waste paper (7.7%) and animal excrement (5.5%) being the next two highest materials. There are also significant quantities of film and bags (5.0%), other plastics (4.3%), and various grades of paper.
The Multi -Family waste stream contains 28.4% recyclable materials (including the materials collected through the curbside program and yard debris).
Residential Self-Haul: self-haul loads from residential sources have more wood, construction debris and metal than other residential sources, and less “regular” household trash (paper, plastic and food scraps), reflecting the activities such as remodeling and other special projects that are often the source of self-haul waste. Other plastics is the material present in the single largest quantity, at 10.5%, followed by mixed metals (10.5%), wood (hogfuel, 9.4%), food scraps (7.8%), and carpeting (6.8%).
The Residential Self-Haul waste stream contains the highest amount of recyclable materials, with 30.6% of this waste consisting of those materials that are collected through the curbside recycling program (including glass and yard debris). Half of this amount consists of various grades of metal and one-third consists of various grades of paper.
Non-Residential Self-Haul: like self-haul waste from residential sources, Non-Residential Self-Haul loads are often the result of construction activities or other special projects. The large amount of wood (26.3% for all grades taken together) and construction and demolition (C&D) waste (36.6%) clearly shows the influence
2012 Clark County Waste Stream Analysis 24 Conclusions
of construction activities on this waste stream. Although this waste generator contributes only 13.3% of the County’s total waste stream, Non-Residential Self-Haul customers are disposing of 36% of the wood and 52% of the C&D materials.
The Non-Residential Self-Haul waste stream contains 22.6% recyclable materials (for the materials collected through the curbside program and yard debris).
Commercial: waste from this source also contains a large amount of food scraps (33.1%), followed by plastic film and bags (8.3%), mixed waste paper (6.7%), and non-recyclable paper (5.2%). The Commercial waste stream contains 20.3% recyclable materials (for the materials collected through the curbside program and yard debris).
Commercial Compactors: waste from this source contains less food scraps (11.6%) than the other commercial category, but it is still the largest single category, followed closely by other plastics (10.5%). Wood is the largest category overall (19.3%), followed by non-recyclable paper (4.6%), mixed metals (4.4%), cardboard (4.2%), and plastic film and bags (3.9%).
The Commercial Compactor waste stream contains 20.3% recyclable materials (for the materials collected through the curbside program and yard debris).
General Conclusions
Additional conclusions that resulted from this study include:
Plastic film is present in most of the waste streams in significant amounts, especially given the fact that the individual pieces of this material are very light. In other words, it takes a lot of this material to add up to the amounts shown in the results. Likewise for expanded polystyrene (“Styrofoam”). Although the amounts of expanded polystyrene are not that high on a weight basis, these figures represent a large volume of material.
“Other plastics” also contribute a significant amount to the County’s waste stream, and probably bear additional scrutiny for possible recycling or waste reduction programs.

G L O S S A R Y


2012 Clark County Waste Stream Analysis G-1 Glossary
GLOSSARY INTRODUCTION This glossary shows the definitions for the types of generators and waste sorting categories used for the 2012 Clark County Waste Stream Analysis. A. GENERATOR CATEGORIES Single-Family Homes: waste originating from single-family homes and mobile home parks. To be counted in this category, the waste must have been delivered to the transfer station by a municipal collection crew, private garbage hauler, or manager/owner of a mobile home park.
Multi-Family: wastes collected from apartment buildings. To be counted in this category, the waste must have been delivered to the transfer station by a municipal collection crew, private garbage hauler, or manager/owner of a mobile home park.
Residential Self-Haul: residential waste delivered to the transfer station by a homeowner, renter or landlord, typically using cars, vans, jeeps, pick-up trucks, rented trucks and trailers.
Non-Residential Self-Haul: non-residential waste delivered to the transfer station by the same company that generated the waste, including construction and demolition waste brought in by contractors.
General Commercial: waste from businesses, industries and institutions, delivered by a municipal collection crew or private garbage hauler, generally in a front-loading truck but not including single-source containers such as roll-off’s.
Commercial Compactors: waste from businesses, industries and institutions, delivered by a municipal collection crew or private garbage hauler in a roll-off. B. WASTE SORTING CATEGORIES PAPER
Newspaper: printed groundwood newsprint, including glossy ads and Sunday edition magazines delivered with the newspaper.
Cardboard: unwaxed kraft paper corrugated containers and boxes, unless waxed or laminated, and including brown paper bags. Brown paper bags that have been used for holding food scraps and all pizza boxes are defined as “Food-Soiled Paper.”
Mixed Waste Paper (MWP): low and high grades of paper, including office/computer paper and magazines. Also including colored papers, notebook or other lined paper,

2012 Clark County Waste Stream Analysis G-2 Glossary
envelopes with plastic windows, non-corrugated paperboard, carbonless copy paper, egg cartons, paperback books, other groundwood products, and junk mail.
Milk Cartons and Other Aseptic Containers: milk cartons and similar gable-top containers (such as orange juice cartons), and juice drink boxes.
Food-Soiled Paper: all paper napkins and pizza boxes, whether food-soiled or not, plus newspaper and brown bags that were used for holding food scraps.
Non-Recyclable Paper: contaminated papers and non-recyclable types of papers such as carbon paper, tissues, paper plates, waxed papers, frozen food containers, paper packaging with metal or plastic parts, and hardcover books.
PLASTIC
PET Bottles: polyethylene terephthalate (PET) bottles, including soda, oil, liquor and other types of bottles. The SPI code for PET is 1.
HDPE Bottles: clear and colored high density polyethylene (HDPE) milk, juice, detergent, and other bottles. This category did not include motor oil bottles, which are defined as “Other Plastics.” The SPI code for HDPE is 2.
Bottles Types 3 - 7: all bottles that are not PET or HDPE, where the neck of the container is narrower than the body. Includes SPI codes 3 - 7.
Tubs: plastic containers of all resin types that are as wide as or wider at the top than at the bottom.
Film and Bags: all plastic packaging films and bags. To be counted in this category, the material must have been flexible (i.e., could be bent without making a noise) and relatively clean (recoverable).
Recyclable Packaging: rigid plastic packaging that is potentially recyclable, such as trays and clamshells.
Other Plastics: finished plastic products such as toys, toothbrushes, vinyl hose and shower curtains, and non-recyclable plastic packaging, such as shipping materials and other plastic items which are not finished consumer products. Also includes HDPE motor oil bottles.
Expanded Polystyrene: packaging and finished products made of expanded polystyrene. The SPI code for polystyrene (PS) is 6.
METAL
Aluminum Cans: aluminum beverage cans.
Tin Cans: tin-coated steel food containers. This category includes bi-metal beverage cans, but not paint cans or other types of cans.
Ferrous Metals: products and pieces made from metal to which a magnet adheres (but including stainless steel), and which are not significantly contaminated with other

2012 Clark County Waste Stream Analysis G-3 Glossary
metals or materials (in the latter case, the item should be included instead under “mixed metals/materials”). This category includes paint cans, aerosol cans (empty cans only, partially-full cans will be characterized by the contents), and other non-food cans.
Non-Ferrous Metals: metallic products and pieces not derived from iron (i.e., to which a magnet does not adhere) and which were not significantly contaminated with other metals or materials. Includes aluminum foil and pans, and aluminum cat food and other cans.
Mixed Metals/Materials: small appliances, motors, insulated wire and finished products containing a mixture of metals and/or other materials, but which are greater than 50% metal.
ORGANICS
Food Scraps: food waste and scraps, including bones, rinds, etc., and including the container when the container weight was not appreciable compared to the food inside.
Yard and Garden Wastes: grass clippings, leaves and weeds, and prunings four inches or less in diameter.
GLASS
Clear, Green and Brown Glass Containers: these are three separate categories for bottles and jars that were clear, green or brown in color. Blue glass containers were included with non-recyclable glass.
Non-Recyclable Glass: window glass, light bulbs, glassware, mirrors, and other glass which is not recyclable. Does not include ceramics.
WOOD
Clean Wood: unfinished, clean wood that could be included in a composting program, such as dimension lumber and clean pallets.
Hog Fuel: wood that was not clean enough for a composting system but that could be burned for heat recovery, including plywood and treated wood.
Natural Wood: stumps of trees and shrubs, with the adhering soil (if any), and other natural woods, such as logs and branches in excess of four inches in diameter.
Roofing: wood products commonly used for roofing, such as cedar shingles or shakes, which are often contaminated with bits of tar paper, nails and other materials.
Contaminated Wood: wood that was contaminated with other wastes in such a way that the materials could not easily be separated, but consisting primarily (over 50%) of wood. Examples include wood with sheetrock nailed to it or with tiles glued to it.
Other Wood Waste: other types of wood that did not fit into the above categories, including sawdust.

2012 Clark County Waste Stream Analysis G-4 Glossary
C&D WASTES
Gypsum Board: used or new gypsum wallboard, sheetrock or drywall present in recoverable amounts or pieces (generally any piece larger than two inches square was recovered from the sample).
Rubble: rock, gravel, cement, concrete blocks, bricks, ceramics, porcelain, and similar materials.
Roofing Waste: asphalt and fiberglass shingles, tar paper, and similar wastes from demolition or installation of roofs. Did not include cedar shingle or shakes (see wood roofing subcategory).
Carpet and Padding: pieces of carpet and foam rubber and other materials used as padding under carpets.
Soil, Dirt, and Non-Distinct Fines: this category includes soil, sand, dirt and similar materials, where these could be recovered separately from the sample.
OTHER WASTES
Hazardous Wastes: hazardous wastes of all types.
Medical Waste: medical wastes containing or contaminated with bodily fluids. The presence and number of syringes was also noted.
Animal Excrement: kitty litter and other animal wastes.
Household Batteries: household batteries (Ni-Cd and other special batteries were noted if found).
E-Wastes: electronic wastes as defined by Washington’s State rules, including computers (base units and monitors), televisions, laptops, e-readers and tablets. This study also included loose circuit boards and keyboards in this category.
REMAINDER
Garbage and Other: all other wastes that did not fit into the above categories, including clothing, diapers, rubber products, cosmetics, etc.
REUSE CRITERIA
For the Wood and C&D categories only, the amounts of reusable materials were noted. Reuse criteria were applied on a case-by-case basis, but examples include pieces of dimension lumber in good condition and over 4 feet in length, sheet goods that were half of a sheet or more, unopened bags of concrete and other materials, and functional ceramic products (toilets and sinks).

A P P E N D I X A S T A T I S T I C A L C E R T A I N T Y O F R E S U L T S


2012 Clark County Waste Stream Analysis A-1 Appendix A: Statistical Certainty of Results
APPENDIX A STATISTICAL CERTAINTY OF RESULTS
A. INTRODUCTION There is a quantifiable degree of error associated with the waste composition results shown in this report, and this error can be expressed as confidence intervals. This appendix shows the confidence intervals associated with the waste composition results. B. METHODOLOGY This waste composition study was designed to provide accurate data on the amount and composition of wastes from several sources. As with all sampling projects and surveys, however, there is a definable amount of potential error in the results. The amount of error, or “uncertainty,” associated with the results can be calculated based on the sample results. For this type of study, the statistical certainty of the results can be expressed using confidence intervals. Confidence intervals are the range of values for which one can be confident (to a given degree, such as 90% confident) that the true value falls within. The confidence limits are also sometimes shown as a “plus or minus value.” For example, this study shows that the potential amount of newspaper in the Single-Family waste stream is 0.55% +/- 0.27%. This is based on a confidence interval of 90%, so that in this example one can be 90% confident that the true value for newspaper falls between 0.29% and 0.82%. The calculation of confidence intervals for this study is complicated slightly by the use of weighted averages. The calculation of confidence intervals for weighted averages begins with calculating standard deviations for each material for each generator and for each quarter. Dividing the standard deviations by the square root of the number of samples converts these to the standard error of the mean (SEM). The SEM’s can be applied using weighted averages as appropriate for the data being combined. The final SEM’s can be multiplied by a factor of 1.64 and then added or subtracted from the average composition values to derive the upper and lower confidence limits, respectively. The factor of 1.64 is based on the choice of a 90% confidence interval. C. RESULTS Table A-1 shows the confidence limits associated with the composition results for each generator and for the entire County.

Single-Family Multi-Family Residential Self-HaulAverage LCL UCL Average LCL UCL Average LCL UCL
PAPER Newspaper 0.55% 0.29% 0.82% 2.35% 1.16% 3.55% 0.51% 0.03% 0.98%Cardboard 0.87% 0.53% 1.21% 3.22% 1.76% 4.69% 4.64% 0.24% 9.05%Mixed Waste Paper 4.60% 3.71% 5.49% 7.67% 5.72% 9.63% 4.71% 0.75% 8.67%Milk Cartons, Other 0.19% 0.12% 0.27% 0.34% 0.24% 0.44% 0.10% 0.00% 0.23%Food-Soiled Paper 3.86% 3.04% 4.67% 2.35% 1.87% 2.82% 1.04% 0.10% 1.99%Non-Recyclable Paper 3.97% 3.46% 4.49% 3.50% 2.64% 4.37% 1.68% 0.41% 2.95%Paper Subtotal 14.05% 12.34% 15.76% 19.44% 14.92% 23.96% 12.68% 4.61% 20.75%
PLASTIC PET Bottles 0.83% 0.63% 1.04% 1.93% 1.48% 2.38% 0.49% 0.12% 0.85%HDPE Bottles 0.48% 0.35% 0.61% 1.01% 0.78% 1.24% 0.22% 0.03% 0.41%Bottles 3-7 0.06% 0.02% 0.11% 0.11% 0.04% 0.19% 0.04% 0.00% 0.08%Tubs 0.40% 0.31% 0.49% 0.30% 0.22% 0.38% 0.06% 0.01% 0.12%Film and Bags 7.16% 6.29% 8.03% 5.00% 4.38% 5.63% 2.10% 0.78% 3.41%Recyclable Packaging 0.60% 0.46% 0.73% 0.44% 0.31% 0.56% 0.19% 0.05% 0.34%Other Plastics 4.06% 3.06% 5.05% 4.28% 3.19% 5.37% 10.50% 1.13% 19.86%Expanded Polystyrene 0.58% 0.42% 0.73% 0.49% 0.29% 0.69% 0.63% 0.00% 1.32%Plastic Subtotal 14.16% 12.59% 15.74% 13.56% 11.69% 15.43% 14.23% 4.59% 23.86%
METAL Aluminum Cans 0.33% 0.22% 0.43% 0.86% 0.52% 1.20% 0.19% 0.02% 0.37%Tin Cans 0.76% 0.52% 0.99% 1.20% 0.86% 1.53% 0.37% 0.03% 0.71%Ferrous Metals 0.79% 0.45% 1.13% 0.41% 0.21% 0.61% 2.75% 0.51% 4.99%Non-Ferrous Metals 0.47% 0.28% 0.66% 0.43% 0.08% 0.78% 1.22% 0.15% 2.30%Mixed Metals 1.46% 0.83% 2.10% 2.39% 0.45% 4.34% 10.45% 2.58% 18.31%Metal Subtotal 3.80% 2.95% 4.66% 5.29% 3.50% 7.08% 14.98% 6.12% 23.85%
ORGANIC Food Scraps 29.41% 25.79% 33.04% 22.56% 18.66% 26.46% 7.81% 0.92% 14.69%Yard Debris 1.60% 0.08% 3.13% 1.46% 0.16% 2.76% 3.29% 0.00% 6.80%Organic Subtotal 31.01% 27.41% 34.62% 24.02% 19.96% 28.08% 11.10% 2.38% 19.81%
GLASS Clear Bottles 1.13% 0.64% 1.61% 2.78% 1.62% 3.94% 0.62% 0.07% 1.16%Brown Bottles 0.61% 0.00% 1.26% 1.32% 0.71% 1.94% 0.50% 0.00% 1.05%Green Bottles 0.31% 0.00% 0.68% 0.52% 0.15% 0.88% 0.41% 0.00% 0.95%Non-Recyclable Glass 0.34% 0.10% 0.58% 0.51% 0.07% 0.96% 1.68% 0.00% 3.49%Glass Subtotal 2.39% 1.37% 3.41% 5.13% 3.43% 6.83% 3.21% 0.14% 6.28%
WOOD Clean Wood 0.47% 0.00% 1.15% 0.28% 0.00% 0.70% 1.46% 0.17% 2.74%Hogfuel 0.46% 0.00% 1.05% 0.57% 0.00% 1.18% 9.44% 0.00% 19.83%Natural Wood 0.00% 0.00% 0.00% 0.00% 0.00% 0.00% 0.00% 0.00% 0.00%Roofing, Wood 0.00% 0.00% 0.00% 0.00% 0.00% 0.00% 0.00% 0.00% 0.00%Contaminated 0.56% 0.00% 1.35% 0.10% 0.00% 0.24% 2.65% 0.00% 5.74%Other Wood 0.05% 0.01% 0.08% 0.94% 0.00% 2.26% 1.33% 0.11% 2.56%Wood Subtotal 1.54% 0.11% 2.96% 1.88% 0.00% 3.88% 14.89% 3.48% 26.30%
CONST. Gypsum 0.07% 0.00% 0.16% 0.00% 0.00% 0.01% 4.59% 0.00% 10.74% & DEMO. Rubble 0.44% 0.00% 0.93% 1.71% 0.00% 4.28% 3.75% 0.00% 9.32%
Roofing 0.00% 0.00% 0.01% 0.01% 0.00% 0.02% 2.84% 0.00% 6.71%Carpet, Padding 0.26% 0.00% 0.66% 0.22% 0.00% 0.54% 6.79% 0.00% 14.19%Soil, Dirt 0.10% 0.00% 0.24% 0.04% 0.00% 0.10% 1.44% 0.00% 3.05%C&D Subtotal 0.88% 0.17% 1.59% 1.99% 0.00% 4.86% 19.41% 5.26% 33.56%
OTHER Hazardous Wastes 0.06% 0.00% 0.15% 0.29% 0.00% 0.68% 0.31% 0.00% 0.73% WASTES Medical Wastes 0.01% 0.00% 0.01% 0.02% 0.00% 0.06% 0.00% 0.00% 0.00%
Animal Excrement 3.76% 2.12% 5.41% 5.48% 2.08% 8.88% 0.96% 0.00% 2.10%Household Batteries 0.14% 0.06% 0.22% 0.07% 0.01% 0.13% 0.06% 0.00% 0.12%E-Waste 0.04% 0.00% 0.10% 1.13% 0.00% 2.77% 0.02% 0.00% 0.04%Other Subtotal 4.01% 2.29% 5.73% 6.98% 3.23% 10.74% 1.35% 0.00% 2.85%
REMAINDER Garbage 28.15% 25.10% 31.21% 21.70% 17.91% 25.48% 8.15% 2.97% 13.33%
Notes: LCL = Lower Confidence Limit for 90% confidence interval. UCL = Upper Confidence Limit for 90% confidence interval. All figures are percentages by weight.
TABLE A - 1CONFIDENCE LIMITS BY TYPE OF GENERATOR
CLARK COUNTY WASTE STREAM ANALYSIS
2012 Clark County Waste Stream Analysis A-2 Appendix A: Statistical Certainty of Results

CONFIDENCE LIMITS BY TYPE OF GENERATORCLARK COUNTY WASTE STREAM ANALYSIS
Non-Residential Self-Haul Commercial Commercial CompactorAverage LCL UCL Average LCL UCL Average LCL UCL
PAPER Newspaper 0.00% 0.00% 0.01% 1.04% 0.49% 1.59% 0.50% 0.04% 0.97%Cardboard 4.84% 1.16% 8.52% 3.33% 2.09% 4.57% 4.20% 2.17% 6.23%Mixed Waste Paper 1.11% 0.11% 2.11% 6.73% 4.96% 8.50% 3.32% 1.19% 5.45%Milk Cartons, Other 0.06% 0.00% 0.15% 0.28% 0.14% 0.42% 0.14% 0.00% 0.28%Food-Soiled Paper 0.33% 0.00% 0.84% 3.88% 2.61% 5.15% 1.35% 0.15% 2.56%Non-Recyclable Paper 1.70% 0.01% 3.40% 5.20% 3.92% 6.48% 4.61% 2.32% 6.89%Paper Subtotal 8.04% 2.53% 13.55% 20.46% 17.59% 23.33% 14.12% 8.70% 19.55%
PLASTIC PET Bottles 0.18% 0.00% 0.44% 1.06% 0.77% 1.35% 0.52% 0.07% 0.96%HDPE Bottles 0.01% 0.00% 0.03% 0.87% 0.53% 1.20% 0.30% 0.04% 0.56%Bottles 3-7 0.03% 0.00% 0.08% 0.06% 0.02% 0.10% 0.06% 0.00% 0.14%Tubs 0.04% 0.00% 0.09% 0.25% 0.13% 0.37% 0.07% 0.01% 0.13%Film and Bags 1.05% 0.34% 1.76% 8.27% 6.97% 9.57% 3.85% 2.00% 5.70%Recyclable Packaging 0.04% 0.00% 0.09% 0.37% 0.23% 0.50% 0.24% 0.01% 0.47%Other Plastics 3.36% 1.20% 5.52% 4.54% 2.08% 7.00% 10.51% 2.46% 18.56%Expanded Polystyrene 0.28% 0.00% 0.60% 0.38% 0.26% 0.50% 1.20% 0.00% 2.67%Plastic Subtotal 4.99% 2.04% 7.94% 15.81% 12.87% 18.75% 16.76% 8.92% 24.61%
METAL Aluminum Cans 0.04% 0.00% 0.08% 0.50% 0.31% 0.69% 0.22% 0.05% 0.40%Tin Cans 0.20% 0.00% 0.50% 0.94% 0.52% 1.36% 0.10% 0.00% 0.20%Ferrous Metals 0.49% 0.00% 0.99% 0.59% 0.15% 1.03% 3.05% 0.00% 6.62%Non-Ferrous Metals 0.81% 0.00% 1.68% 0.17% 0.05% 0.28% 0.46% 0.00% 1.06%Mixed Metals 2.71% 0.05% 5.36% 1.07% 0.21% 1.93% 4.43% 0.12% 8.73%
ORGANIC Metal Subtotal 4.24% 1.04% 7.45% 3.26% 2.15% 4.38% 8.26% 2.14% 14.37%Food Scraps 3.94% 0.00% 9.78% 33.14% 24.59% 41.69% 11.64% 3.24% 20.04%Yard Debris 3.05% 0.00% 6.74% 2.84% 0.00% 5.68% 2.15% 0.00% 4.43%Organic Subtotal 6.99% 0.00% 14.87% 35.97% 27.82% 44.12% 13.79% 4.89% 22.68%
GLASS Clear Bottles 0.05% 0.00% 0.11% 1.23% 0.51% 1.95% 0.34% 0.00% 0.69%Brown Bottles 0.00% 0.00% 0.01% 0.82% 0.28% 1.36% 0.27% 0.00% 0.64%Green Bottles 0.03% 0.00% 0.07% 0.78% 0.11% 1.44% 0.15% 0.00% 0.37%Non-Recyclable Glass 2.73% 0.00% 6.42% 0.25% 0.05% 0.45% 0.18% 0.00% 0.41%Glass Subtotal 2.81% 0.00% 6.53% 3.08% 1.64% 4.53% 0.94% 0.00% 1.88%
WOOD Clean Wood 7.79% 0.00% 16.36% 0.63% 0.00% 1.37% 7.13% 1.10% 13.15%Hogfuel 8.21% 2.20% 14.22% 0.45% 0.00% 0.94% 5.70% 0.00% 12.06%Natural Wood 0.03% 0.00% 0.09% 0.00% 0.00% 0.00% 0.00% 0.00% 0.00%Roofing, Wood 4.88% 0.00% 12.52% 0.00% 0.00% 0.00% 0.05% 0.00% 0.14%Contaminated 5.34% 0.66% 10.02% 0.18% 0.00% 0.36% 4.72% 0.00% 10.10%Other Wood 0.04% 0.00% 0.11% 0.06% 0.01% 0.10% 1.75% 0.00% 3.98%Wood Subtotal 26.30% 11.82% 40.78% 1.32% 0.26% 2.37% 19.34% 6.38% 32.29%
CONST. Gypsum 8.11% 0.00% 18.85% 0.00% 0.00% 0.00% 3.73% 0.00% 8.86% & DEMO. Rubble 9.72% 1.02% 18.42% 0.01% 0.00% 0.02% 2.45% 0.00% 5.54%
Roofing 6.27% 0.09% 12.44% 0.01% 0.00% 0.02% 0.90% 0.00% 2.31%Carpet, Padding 12.36% 0.55% 24.16% 0.53% 0.00% 1.36% 1.73% 0.00% 4.30%Soil, Dirt 0.11% 0.00% 0.28% 0.00% 0.00% 0.00% 0.08% 0.00% 0.18%C&D Subtotal 36.56% 20.87% 52.25% 0.55% 0.00% 1.39% 8.89% 0.00% 18.39%
OTHER Hazardous Wastes 0.07% 0.00% 0.18% 0.18% 0.00% 0.44% 0.33% 0.00% 0.84% WASTES Medical Wastes 0.00% 0.00% 0.00% 0.02% 0.00% 0.05% 0.01% 0.00% 0.01%
Animal Excrement 0.00% 0.00% 0.00% 0.67% 0.00% 1.50% 0.33% 0.00% 0.84%Household Batteries 0.01% 0.00% 0.02% 0.07% 0.01% 0.14% 0.01% 0.00% 0.03%E-Waste 0.00% 0.00% 0.00% 0.03% 0.00% 0.07% 0.00% 0.00% 0.00%Other Subtotal 0.08% 0.00% 0.19% 0.98% 0.11% 1.84% 0.68% 0.00% 1.71%
REMAINDER Garbage 9.99% 2.09% 17.88% 18.57% 13.44% 23.69% 17.23% 8.56% 25.89%
Notes: LCL = Lower Confidence Limit for 90% confidence interval. UCL = Upper Confidence Limit for 90% confidence interval. All figures are percentages by weight.
TABLE A-1, continued
2012 Clark County Waste Stream Analysis A-3 Appendix A: Statistical Certainty of Results

CONFIDENCE LIMITS BY TYPE OF GENERATORCLARK COUNTY WASTE STREAM ANALYSIS
Annual Average for Entire CountyAverage LCL UCL
PAPER Newspaper 0.65% 0.25% 1.05%Cardboard 3.07% 1.25% 4.89%Mixed Waste Paper 4.46% 2.73% 6.19%Milk Cartons, Other 0.18% 0.07% 0.29%Food-Soiled Paper 2.50% 1.57% 3.43%Non-Recyclable Paper 3.72% 2.46% 4.98%Paper Subtotal 14.57% 10.53% 18.62%
PLASTIC PET Bottles 0.74% 0.44% 1.05%HDPE Bottles 0.45% 0.26% 0.64%Bottles 3-7 0.06% 0.01% 0.11%Tubs 0.22% 0.14% 0.30%Film and Bags 5.20% 4.05% 6.36%Recyclable Packaging 0.36% 0.21% 0.50%Other Plastics 6.06% 2.29% 9.84%Expanded Polystyrene 0.62% 0.13% 1.11%Plastic Subtotal 13.72% 9.53% 17.90%
METAL Aluminum Cans 0.31% 0.17% 0.46%Tin Cans 0.57% 0.29% 0.84%Ferrous Metals 1.36% 0.14% 2.57%Non-Ferrous Metals 0.55% 0.09% 1.00%Mixed Metals 3.25% 0.67% 5.82%
ORGANIC Metal Subtotal 6.03% 2.80% 9.26%Food Scraps 20.38% 14.23% 26.53%Yard Debris 2.32% 0.00% 4.75%Organic Subtotal 22.70% 16.04% 29.37%
GLASS Clear Bottles 0.88% 0.39% 1.37%Brown Bottles 0.53% 0.05% 1.01%Green Bottles 0.35% 0.00% 0.73%Non-Recyclable Glass 0.78% 0.00% 1.67%Glass Subtotal 2.54% 0.81% 4.27%
WOOD Clean Wood 2.85% 0.03% 5.66%Hogfuel 3.57% 0.00% 7.14%Natural Wood 0.00% 0.00% 0.01%Roofing, Wood 0.66% 0.00% 1.70%Contaminated 2.14% 0.00% 4.45%Other Wood 0.57% 0.00% 1.24%Wood Subtotal 9.80% 3.28% 16.31%
CONST. Gypsum 2.36% 0.00% 5.54% & DEMO. Rubble 2.45% 0.00% 5.15%
Roofing 1.35% 0.00% 2.91%Carpet, Padding 2.99% 0.00% 6.24%Soil, Dirt 0.24% 0.00% 0.52%C&D Subtotal 9.38% 3.26% 15.51%
OTHER Hazardous Wastes 0.18% 0.00% 0.44% WASTES Medical Wastes 0.01% 0.00% 0.02%
Animal Excrement 1.79% 0.70% 2.88%Household Batteries 0.07% 0.02% 0.12%E-Waste 0.08% 0.00% 0.20%Other Subtotal 2.12% 0.83% 3.42%
REMAINDER Garbage 19.13% 13.69% 24.57%
Notes: LCL = Lower Confidence Limit for 90% confidence interval. UCL = Upper Confidence Limit for 90% confidence interval. All figures are percentages by weight.
TABLE A-1, continued
2012 Clark County Waste Stream Analysis A-4 Appendix A: Statistical Certainty of Results

A P P E N D I X B C U S T O M E R S U R V E Y R E S U L T S


Phone: (360) 897-9533 e-mail: [email protected] FAX: (360) 897-2348
G R E E N S O L U T I O N S M E M O R A N D U M DATE: September 13, 2012
TO: Mike Davis
FROM: Rick Hlavka
RE: Survey Results
Surveys were conducted at the three Clark County transfer stations on Saturday, August 11, 2012. The primary target group for the surveys were self-haul customers, hence the reason for conducting the survey on the weekend. Questions about the source of the loads, frequency of visits to the transfer stations, and services used were just some of the information gathered that day The number of surveys conducted at Washougal Transfer Station (WTS) and West Van Material Recovery Facility (West Van) represents almost every customer that went to those stations during the survey period (which was from when the station opened that day until noon or 1:00). At Central Transfer and Recycling Station (CTR), the customers surveyed were only a portion of the total customers that day. Not every customer was surveyed due to the need to avoid creating traffic problems, the separation of the recycling area from the garbage disposal queue, and the need to pull samples for the waste sorting crew. A total of 212 surveys were conducted at the three stations. It should be noted that in any case the number of surveys conducted is relatively small and since the survey was only conducted for one day, the results may not be statistically meaningful. The attached table summarizes the responses collected from surveyed customers. Two sets of data are shown for CTR because the layout of that facility required surveys to be conducted separately for customers that were only going to the recycling/MRW area. For age and gender, the collected information was generally based on a visual observation of the driver, although in one or two cases it was the passenger who was clearly in charge at the time and so it was their age and gender that was noted. Note that the percentages for the services used that day add up to more than 100% because some people used more than one service. On the reuse question, our goal was to ask this question for about 50% of the (garbage) customers, but at CTR we actually asked significantly fewer customers this question because we did not want to create traffic delays there. At West Van, we asked exactly 50% of the surveyed customers this question, and at WTS almost 100% of the surveyed customers were asked this question. While the majority of customers said they did not have reusables in their load, the yes/no responses to this question are probably less interesting than the comments and anecdotal information gathered by asking this question (see attached list of comments received). At WTS, for instance, the surveyor was in a better position to be able to determine the accuracy of the customer’s response by viewing the load after being dropped on the tipping floor, and it was observed that people often had reusables in their load even though they said they didn’t.

Phone: (360) 897-9533 e-mail: [email protected] FAX: (360) 897-2348
In addition to the set of questions that were asked at each station, additional questions were asked at WTS and at West Van. At WTS, the additional questions asked were a series of questions about what other transfer stations are used and what additional days of the week that WTS should be open. Slightly more than half of the customers said they do not go to another station when WTS is closed. Of the 44% who said they do go to another station, 55% of them said they go to CTR, 35% said they go to Skamania County’s transfer station, 10% go to West Van, and 5% said they go to Oregon. As for their preferences on the additional open days of the week, 6 people (50% of the respondents) said Friday or included a range of days that included Friday, 5 people (42%) said Sunday, 3 people (25%) said Monday, and 1 person said Monday through Friday. The extra question asked at West Van was simply whether people used other transfer stations on Sunday (when West Van is closed). Of the 51 people that answered this question, 28% of the people said yes and 72% said they do not use other stations on Sunday (see attached comments from West Van for more details on the responses received). By sorting the survey responses according to age or other characteristics (cross-tabulations), a few interesting observations can be extracted from the results:
• Many of the customers who stated that they go to the transfer stations weekly or more often were businesses, and of course it’s no surprise that contractors visit the transfer stations that often, but several residential customers also fell into this usage category. A total of 8 commercial self-haul customers were surveyed that said they visit the transfer stations that often, versus 6 residential customers (but bear in mind that we were more likely to find residential customers on the weekend, when this survey was conducted, and that 2 to 3 customers at CTR were not fully surveyed because they were talking on their cell phones at the time and these appeared to be business customers that may also visit the transfer stations fairly often).
For the 6 residential customers that visit the transfer stations weekly or more often, three were found at CTR and all three of these did not subscribe to garbage collection. One of these three customers was also dropping off recyclables that day but the other two were only dropping off garbage. No residential customers were found at WTS that visit the transfer stations that often. Three residential customers were found at West Van that visit the transfer stations weekly or more often, and all three of these customers said they also subscribe to garbage collection at home. One was only dropping off yard debris, one was only dropping off recyclables and one was dropping both recyclables and garbage that day.
• The majority of services used that day were garbage disposal (except for the
customers surveyed at the CTR recycling and MRW area). The second highest percentile for using the transfer station was for recycling. Yard debris and household hazardous waste services ranked third and fourth (excepting CTR Recycling as noted above).

Phone: (360) 897-9533 e-mail: [email protected] FAX: (360) 897-2348
• For combined trips, the average age of the customer that was using two or more services (recycling, yard debris, HHW or garbage disposal) that day was somewhat higher at all three stations than the average age of the customers who were only using one service. Where 2 = people from ages 31 to 54, and 3 = ages 55 and up, the average age for people who were combining trips at CTR, WTS and West Van was 2.4, 2.4 and 2.3, respectively, versus 2.0, 2.2 and 2.1 for customers that were on single-purpose visits.
Other cross-tabulations might be possible, so do not hesitate to let me know if you have specific questions along those lines. I would say, however, that there were too few female customers surveyed to be able to say anything about gender differences, so unfortunately we cannot do meaningful cross-tabulations based on gender.

Survey Results Transfer Station Surveys conducted on August 11, 2012 (all results are percentages of the total except where noted)
Factor CTR CTR Recycling Washougal West Van
Number of Surveys 95 14 46 57 Age group for driver (or person in charge), percent breakdown;
18 to 30 31 to 54 55 and over
18 62 21
0 57 43
15 46 39
14 61 25
Gender for driver (or person in charge), percent breakdown; Female Male
13 87
43 57
2 98
19 81
Source of load, percent breakdown; Home Apartment Business Home and Business
89 2 7 1
93 0 7 0
83 2
13 2
95 0 4 2
Do they have garbage collection at home (or at their business if the load is from a business), percent breakdown:
Yes No
73 27
69 31
65 35
89 11
Frequency of visits to transfer stations, percent breakdown; Rarely 1-2 times per year 3-4 5-6 12 24 52 More than 52 times/yr
Average (median) number of annual visits
9 34 19
8 15
8 4 3
2-3 times/yr
15 15 23 23 15
0 8 0
4-5 times/yr
20 17 15
9 24 11
4 0
4-5 times/yr
4 30 13 24 19
4 4 4
4-5 times/yr
Services used that day, percent of customers using that service;
Recycling Yard debris HHW Garbage More than one
13 2 1
99 16
38 0
62 23 23
35 0 4
87 26
29 16 14 61 14
Do they have reusable materials in load, percent breakdown; Yes No
15 85
NA NA
7 93
11 89
Note: All figures are percentages, except the number of samples in the top row and the average number
of visits per year.

Comments from CTR Survey, August 11, 2012 (survey conducted by Rick Hlavka)
General In the course of doing the survey, at least 2 to 3 people at CTR mentioned each of the following reasons for coming to the transfer station: • Remodeling their home. • Missed garbage pickup. • Recently bought a house, still cleaning up after previous owners. • Emptying a storage unit (because they were moving into an RV or simply reducing their
storage needs). There were also 2-3 customers that I didn’t survey because they were talking on their cell phones at the time, and all of these appeared to be contractors (business customers). Reusables One of the two people that actually said “yes” to having reusables in their load had 1-2 boxes in the back of the truck that they were going to take to Goodwill next. One of the people that said “no” to having reusables stated that they already gave everything like that to Salvation Army. In the load of one of the people that said “no” to having reusables, there were large plastic flowerpots clearly visible and that appeared to be in good shape (and even reasonably clean). One of the people that said “no” to having reusables stated that they were cleaning out the garage, so I went to look at their load after they dropped it off but could not see anything I would consider reusable. One of the people that said “no” to having reusables stated that their load was stuff that didn’t sell at a garage sale so they assumed Goodwill wouldn’t want it either. I looked at their load after they dropped it off but could not see anything I would consider reusable.

Comments from Washougal Survey, August 11, 2012
(survey conducted by Betty Patton) Comments received during survey: Because he travels for work, it would be convenient to have the facility open on another day, but
not a necessity. Brings things here that aren’t collected curbside (larger items) and comes 2/yr. Load contained lots of useable toys, car seat, etc. but responded negatively to the question
regarding reusables. Cleaning out house for neighbor. Happy to have facility here. Don’t need to have it open more; it
would just increase the cost. Material from 5 construction sites. Plans his transfer station visits around the Wed & Sat
schedule. Just bought a house and is cleaning it out. Has not initiated garbage service yet. Cleaning out Aunt’s house. Brought in a tv and didn’t know it was recyclable. Mattress only. Manages 2 mobile home parks. Has an account at CTR. Had a lot of yard debris, but didn’t separate it. Another case of emptying aunt’s house. Majority of his transfer station needs are for yard debris. 2 customers dropped off lots of recyclable material as garbage – aluminum cans, glass bottles,
cardboard boxes. Many customers (maybe 6 – 8) were moving elderly people out of houses and into assisted living. Additional Open Days of Week: Sunday - 5 Friday - 2 Monday and/or Friday – 2 Monday through Friday – 1 Friday – 1 Any day – 2 Ignoring the “any day” responses, the total number of times each day was mentioned was: Sunday – 5, Monday – 3, Tuesday – 1, Thursday – 1, Friday – 5. Note from Rick: when we were at WTS for the waste sorting, Jeff mentioned that he thinks Monday would be a good day to add.

Comments from West Van Survey, August 11, 2012
(survey conducted by Sharon Hlavka) Reusables: Takes reusables to church. Goodwill and garage sales. Had reusable wood in garbage load, but he said it was commingled. Garbage load contained dimensional lumber, driver answered no to having reusables. Had metal muffler, that is the closest to a reusable (?). Use other transfer stations on Sundays? H & H CRC off 500, 509? Central Would be here on Sunday if it was open. No, goes to church on Sunday. Used to go to 117th, but more expensive. Goes to H & H with construction materials and HHW at other times. Heard about 117th
117th, but thought they didn’t’ take microwaves. Where else, where are they? 117th Orchards. 117th This is the closest (heard quite often, though did not count the number of times). 117th Eastside, 117th 117th CRC. Takes yard waste elsewhere. Others in the area. Additional comments Citizens should know that the HHW and reusables collection is free. Scale house staff is great with customer service. I’ve been coming for three years, and I’m happy. My recyclables didn’t get picked up at 4701 Sheridan Place (I asked if he called it in, he said no). Just moved from Reno. “Already did survey” said no. Should open up earlier.

![Campus Waste Stream Assessment - Facilities Services · 2016. 3. 31. · ENST 698—Environmental Capstone [Fall 2010] Campus Waste Stream Assessment: OWRR Strategic Improvement Plan](https://img.pdfslide.net/doc/110x75/60354b4a50776d54076dea66/campus-waste-stream-assessment-facilities-services-2016-3-31-enst-698aenvironmental.jpg)