Embed Size (px)
Citation preview
77
G ECONOMIC OUTLOOK
G ANNEX
ECONOMIC OUTLOOK
78 ECONOMIC OUTLOOK • FISCAL PLAN 2013–16 #buildingAlberta
TABLE OF CONTENTS
ECONOMIC OUTLOOK
Key Energy and Economic Assumptions . . . . . . . . . . . . . . . . . . . . . . . . . . . . 82
Economic Outlook 2013 –16 . . . . . . . . . . . . . . . . . . . . . . . . . . . . . . . . . . . . . 83Alberta economy moderates to more sustainable growth . . . . . . . . . . . . 83
Chart 1: Economic growth expected to moderate from elevated levels . . . . . . . 83
Business Sector: Proceeding at a more cautious pace . . . . . . . . . . . . . . . . 84Chart 2: Energy prices soften in 2012-13 . . . . . . . . . . . . . . . . . . . . . . . . . . . . . 84
Chart 3: Oil differentials remain wide and volatile . . . . . . . . . . . . . . . . . . . . . . 85
Chart 4: Growing importance of oil exports . . . . . . . . . . . . . . . . . . . . . . . . . . . 85
Chart 5: Weakness in the gas sector weighs on rig activity . . . . . . . . . . . . . . . . . 86
Chart 6: Machinery shipments lift manufacturing sector . . . . . . . . . . . . . . . . . 87
Chart 7: Alberta farmers benefit from higher prices . . . . . . . . . . . . . . . . . . . . . 87
Household Sector: Supporting Alberta’s economic growth . . . . . . . . . . . 88Chart 8: Consumers help drive the expansion . . . . . . . . . . . . . . . . . . . . . . . . . . 88
Chart 9: Growth in a low inflation environment . . . . . . . . . . . . . . . . . . . . . . . . 89
Chart 10: Alberta’s labour market to remain healthy . . . . . . . . . . . . . . . . . . . . . 89
Chart 11: Alberta leads the country in population growth . . . . . . . . . . . . . . . . 90
Chart 12: Net migration to continue to fuel strong population gains . . . . . . . . 91
Chart 13: New housing market supported by new interprovincial migrants . . . 91
Global Economy . . . . . . . . . . . . . . . . . . . . . . . . . . . . . . . . . . . . . . . . . . . . 92Chart 14: Uncertainty over policy actions remains elevated . . . . . . . . . . . . . . . . 92
Chart 15: An era of public debt and fiscal restraint . . . . . . . . . . . . . . . . . . . . . . 93
Chart 16: Anaemic or negative growth in many Eurozone economies . . . . . . . . 93
Chart 17: Growth in China has picked up . . . . . . . . . . . . . . . . . . . . . . . . . . . . 94
Chart 18: US housing market showing signs of improvement . . . . . . . . . . . . . . 94
Chart 19: US labour market on long road to recovery . . . . . . . . . . . . . . . . . . . . 95
Canadian Economy . . . . . . . . . . . . . . . . . . . . . . . . . . . . . . . . . . . . . . . . . . 96Chart 20: Residential investment in Canada is cooling . . . . . . . . . . . . . . . . . . 96
Chart 21: Fall in commodity prices hits Canada’s nominal GDP growth . . . . . . 97
Chart 22: Canada attracts foreign investment . . . . . . . . . . . . . . . . . . . . . . . . . . 97
Chart 23: Long term yields continue to edge lower . . . . . . . . . . . . . . . . . . . . . . 98
Summary . . . . . . . . . . . . . . . . . . . . . . . . . . . . . . . . . . . . . . . . . . . . . . . . . . 99Risks to the Economic Outlook . . . . . . . . . . . . . . . . . . . . . . . . . . . . . . . . 99
79#buildingAlberta FISCAL PLAN 2013–16 • ECONOMIC OUTLOOK
ANNEX
Benchmarking Tables . . . . . . . . . . . . . . . . . . . . . . . . . . . . . . . . . . . . . . . . 102Oil Price Benchmark . . . . . . . . . . . . . . . . . . . . . . . . . . . . . . . . . . . . . . . . . . . . . 102
How Oil Price Forecasters Fared in Budget 2012 . . . . . . . . . . . . . . . . . . . . . . . . 102
Natural Gas Price Benchmark . . . . . . . . . . . . . . . . . . . . . . . . . . . . . . . . . . . . . . 103
How Natural Gas Price Forecasters Fared in Budget 2012 . . . . . . . . . . . . . . . . . 103
Light-Heavy Oil Price Differential Benchmark . . . . . . . . . . . . . . . . . . . . . . . . 104
Canadian Short-Term Interest Rate Benchmark . . . . . . . . . . . . . . . . . . . . . . . . 104
Canadian Long-Term Interest Rate Benchmark . . . . . . . . . . . . . . . . . . . . . . . . 104
Canada / United States Exchange Rate Benchmark . . . . . . . . . . . . . . . . . . . . . . 105
Alberta Real Gross Domestic Product Benchmark . . . . . . . . . . . . . . . . . . . . . . . 105
Alberta Primary Household Income Benchmark . . . . . . . . . . . . . . . . . . . . . . . . 106
Alberta Corporate Net Operating Surplus Benchmark . . . . . . . . . . . . . . . . . . . 106
Alberta Housing Starts Benchmark . . . . . . . . . . . . . . . . . . . . . . . . . . . . . . . . . . 106
Alberta Employment Benchmark . . . . . . . . . . . . . . . . . . . . . . . . . . . . . . . . . . . 107
Alberta Unemployment Rate Benchmark . . . . . . . . . . . . . . . . . . . . . . . . . . . . . 107

80
BLANK PAGE

81#buildingAlberta FISCAL PLAN 2013–16 • ECONOMIC OUTLOOK
G ECONOMIC OUTLOOK
82 ECONOMIC OUTLOOK • FISCAL PLAN 2013–16 #buildingAlberta
a Refers to the average price per barrel of Alberta light, medium and heavy oil.b Alberta Treasury Board and Finance estimate.
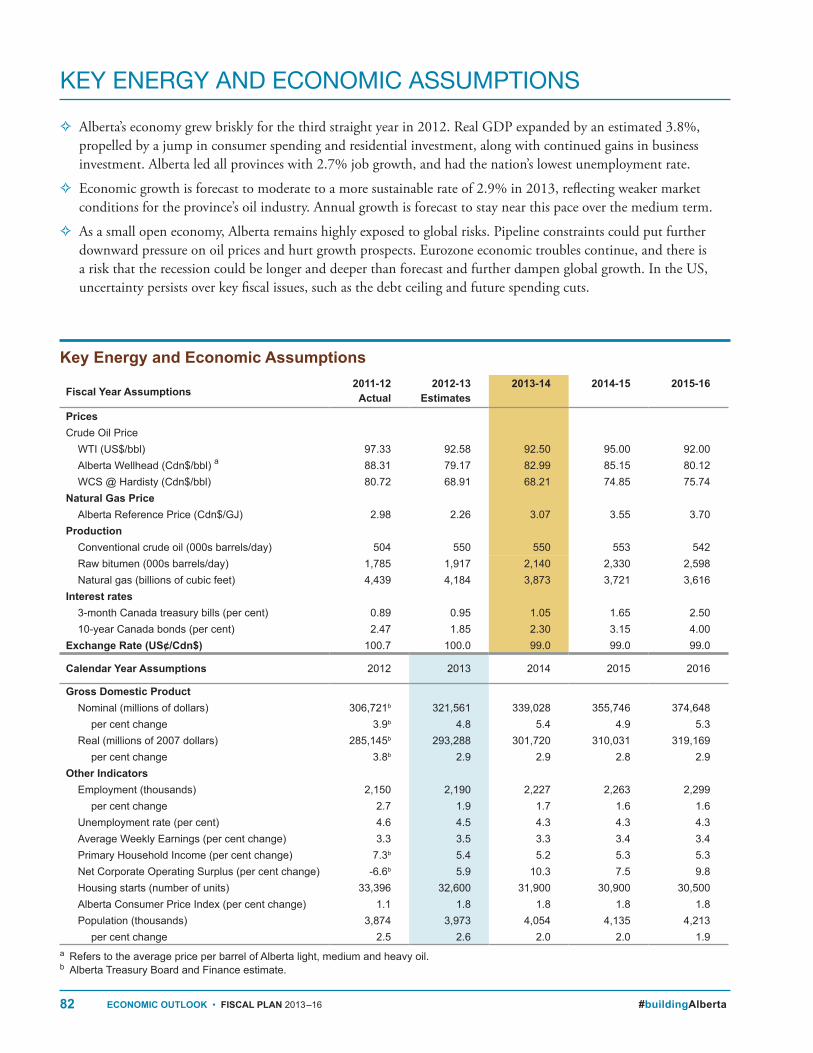
KEY ENERGY AND ECONOMIC ASSUMPTIONS
G Alberta’s economy grew briskly for the third straight year in 2012 . Real GDP expanded by an estimated 3 .8%, propelled by a jump in consumer spending and residential investment, along with continued gains in business investment . Alberta led all provinces with 2 .7% job growth, and had the nation’s lowest unemployment rate .
G Economic growth is forecast to moderate to a more sustainable rate of 2 .9% in 2013, reflecting weaker market conditions for the province’s oil industry . Annual growth is forecast to stay near this pace over the medium term .
G As a small open economy, Alberta remains highly exposed to global risks . Pipeline constraints could put further downward pressure on oil prices and hurt growth prospects . Eurozone economic troubles continue, and there is a risk that the recession could be longer and deeper than forecast and further dampen global growth . In the US, uncertainty persists over key fiscal issues, such as the debt ceiling and future spending cuts .
Fiscal Year Assumptions2011‑12
Actual2012‑13
Estimates2013‑14 2014‑15 2015‑16
PricesCrude Oil Price
WTI (US$/bbl) 97.33 92.58 92.50 95.00 92.00Alberta Wellhead (Cdn$/bbl) a 88.31 79.17 82.99 85.15 80.12WCS @ Hardisty (Cdn$/bbl) 80.72 68.91 68.21 74.85 75.74
Natural Gas PriceAlberta Reference Price (Cdn$/GJ) 2.98 2.26 3.07 3.55 3.70
ProductionConventional crude oil (000s barrels/day) 504 550 550 553 542Raw bitumen (000s barrels/day) 1,785 1,917 2,140 2,330 2,598Natural gas (billions of cubic feet) 4,439 4,184 3,873 3,721 3,616
Interest rates3‑month Canada treasury bills (per cent) 0.89 0.95 1.05 1.65 2.5010‑year Canada bonds (per cent) 2.47 1.85 2.30 3.15 4.00
Exchange Rate (US¢/Cdn$) 100.7 100.0 99.0 99.0 99.0
Calendar Year Assumptions 2012 2013 2014 2015 2016
Gross Domestic ProductNominal (millions of dollars) 306,721b 321,561 339,028 355,746 374,648
per cent change 3.9b 4.8 5.4 4.9 5.3Real (millions of 2007 dollars) 285,145b 293,288 301,720 310,031 319,169
per cent change 3.8b 2.9 2.9 2.8 2.9Other Indicators
Employment (thousands) 2,150 2,190 2,227 2,263 2,299per cent change 2.7 1.9 1.7 1.6 1.6
Unemployment rate (per cent) 4.6 4.5 4.3 4.3 4.3Average Weekly Earnings (per cent change) 3.3 3.5 3.3 3.4 3.4Primary Household Income (per cent change) 7.3b 5.4 5.2 5.3 5.3Net Corporate Operating Surplus (per cent change) ‑6.6b 5.9 10.3 7.5 9.8Housing starts (number of units) 33,396 32,600 31,900 30,900 30,500Alberta Consumer Price Index (per cent change) 1.1 1.8 1.8 1.8 1.8Population (thousands) 3,874 3,973 4,054 4,135 4,213
per cent change 2.5 2.6 2.0 2.0 1.9
Key Energy and Economic Assumptions
83#buildingAlberta FISCAL PLAN 2013–16 • ECONOMIC OUTLOOK
ECONOMIC OUTLOOK 2013 –16
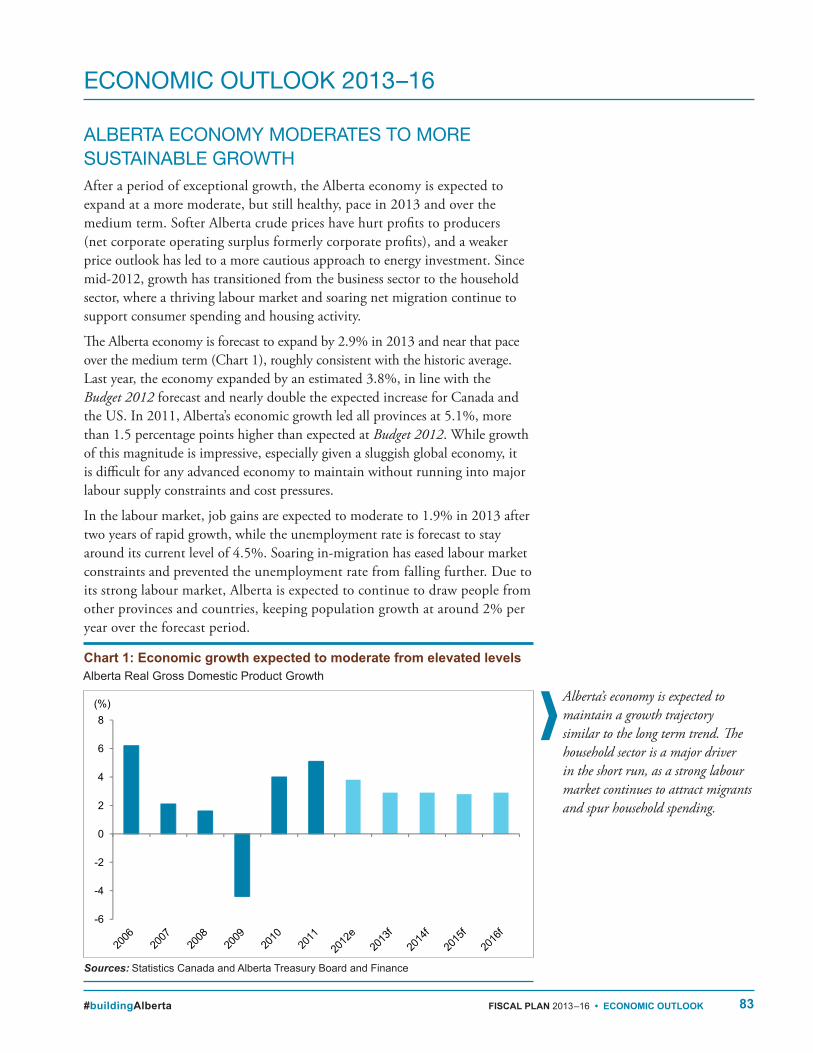
ALBERTA ECONOMY MODERATES TO MORE SUSTAINABLE GROWTHAfter a period of exceptional growth, the Alberta economy is expected to expand at a more moderate, but still healthy, pace in 2013 and over the medium term . Softer Alberta crude prices have hurt profits to producers (net corporate operating surplus formerly corporate profits), and a weaker price outlook has led to a more cautious approach to energy investment . Since mid-2012, growth has transitioned from the business sector to the household sector, where a thriving labour market and soaring net migration continue to support consumer spending and housing activity .
The Alberta economy is forecast to expand by 2 .9% in 2013 and near that pace over the medium term (Chart 1), roughly consistent with the historic average . Last year, the economy expanded by an estimated 3 .8%, in line with the Budget 2012 forecast and nearly double the expected increase for Canada and the US . In 2011, Alberta’s economic growth led all provinces at 5 .1%, more than 1 .5 percentage points higher than expected at Budget 2012 . While growth of this magnitude is impressive, especially given a sluggish global economy, it is difficult for any advanced economy to maintain without running into major labour supply constraints and cost pressures .
In the labour market, job gains are expected to moderate to 1 .9% in 2013 after two years of rapid growth, while the unemployment rate is forecast to stay around its current level of 4 .5% . Soaring in-migration has eased labour market constraints and prevented the unemployment rate from falling further . Due to its strong labour market, Alberta is expected to continue to draw people from other provinces and countries, keeping population growth at around 2% per year over the forecast period .
Sources: Statistics Canada and Alberta Treasury Board and Finance
Alberta’s economy is expected to maintain a growth trajectory similar to the long term trend. The household sector is a major driver in the short run, as a strong labour market continues to attract migrants and spur household spending.
Chart 1: Economic growth expected to moderate from elevated levelsAlberta Real Gross Domestic Product Growth
PDF name: EO13_chrt_01_aeotfsg_AG.pdf EO Budget 2013
Economic growth expected to moderate from elevated levelsAlberta Real Gross Domestic Product Growth
Source: Statistics Canada and Alberta Treasury Board and Finance
EO13_chrt_01_aeotfsg_AG.pdf
-6
-4
-2
0
2
4
6
8(%)
W:\Obm.admin\OBM.ADMIN‐EPF\OBM.ADMIN‐EPF‐Desktop_Publishing\2012_Economy_Publications\5_Economic‐Outlook_2013\Text_Files_sourceDocs\Household_Budget_Charts_AG.xlsx 2/20/2013: 10:45 AM
W:\Obm.admin\OBM.ADMIN‐EPF\OBM.ADMIN‐EPF‐Desktop_Publishing\2012_Economy_Publications\5_Economic‐Outlook_2013\Text_Files_sourceDocs\Household_Budget_Charts_AG.xlsx 2/20/2013: 10:45 AM
84 ECONOMIC OUTLOOK • FISCAL PLAN 2013–16 #buildingAlberta
Despite healthy gains in the real economy, the current value of Alberta’s economic output has been negatively impacted by lower oil prices . Nominal GDP growth slowed from 9% in 2011 to an estimated 3 .9% in 2012, and is forecast to average about 5% per year over the medium term .
As a small, trade-dependent economy, Alberta remains exposed to global risks (see pg . 99) . These include a lack of pipeline infrastructure in North America to accommodate rising oil production, the ongoing recession in Europe, and fiscal uncertainty in the US .
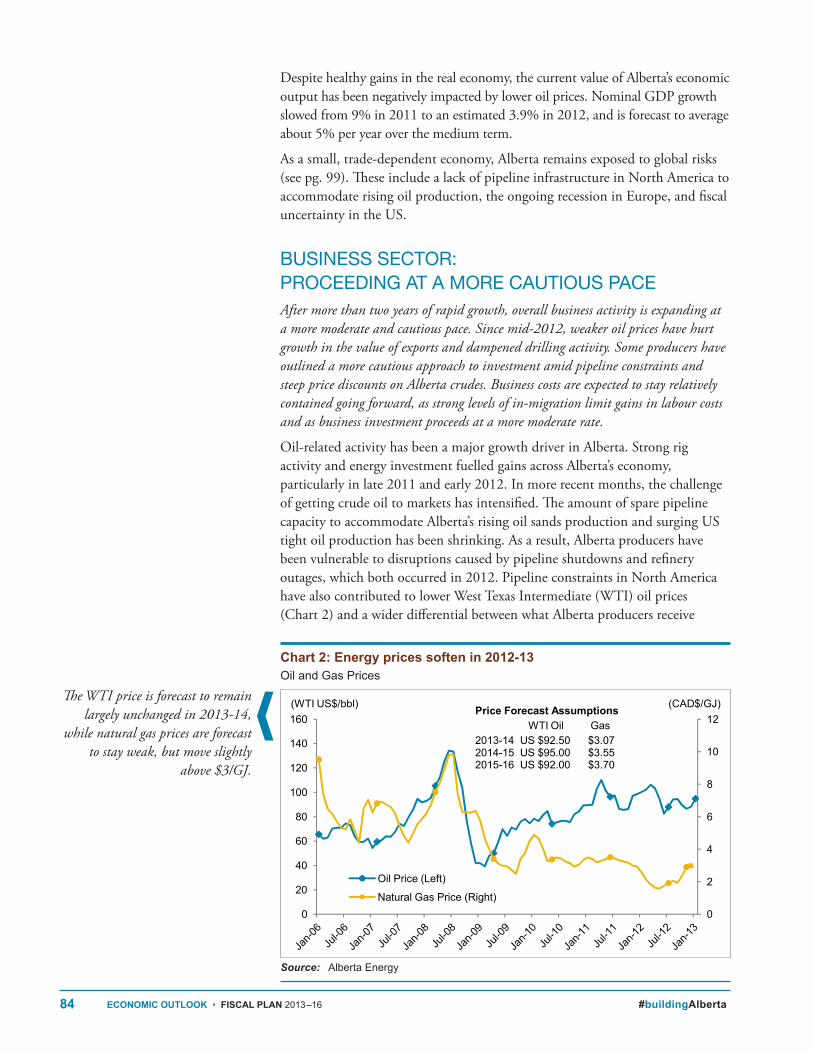
BUSINESS SECTOR: PROCEEDING AT A MORE CAUTIOUS PACEAfter more than two years of rapid growth, overall business activity is expanding at a more moderate and cautious pace. Since mid-2012, weaker oil prices have hurt growth in the value of exports and dampened drilling activity. Some producers have outlined a more cautious approach to investment amid pipeline constraints and steep price discounts on Alberta crudes. Business costs are expected to stay relatively contained going forward, as strong levels of in-migration limit gains in labour costs and as business investment proceeds at a more moderate rate.
Oil-related activity has been a major growth driver in Alberta . Strong rig activity and energy investment fuelled gains across Alberta’s economy, particularly in late 2011 and early 2012 . In more recent months, the challenge of getting crude oil to markets has intensified . The amount of spare pipeline capacity to accommodate Alberta’s rising oil sands production and surging US tight oil production has been shrinking . As a result, Alberta producers have been vulnerable to disruptions caused by pipeline shutdowns and refinery outages, which both occurred in 2012 . Pipeline constraints in North America have also contributed to lower West Texas Intermediate (WTI) oil prices (Chart 2) and a wider differential between what Alberta producers receive
Source: Alberta Energy
The WTI price is forecast to remain largely unchanged in 2013-14,
while natural gas prices are forecast to stay weak, but move slightly
above $3/GJ.
Chart 2: Energy prices soften in 2012‑13Oil and Gas Prices
Pdf named: EO13_chrt_02_eps_SA.pdf EO Budget 2013
Energy prices soften in 2012-13
Source: Alberta Energy EO13_chrt_02_eps_SA.pdf
0
2
4
6
8
10
12
0
20
40
60
80
100
120
140
160
Oil Price (Left)
Natural Gas Price (Right)
(CAD$/GJ)(WTI US$/bbl) Price Forecast AssumptionsWTI Oil Gas
2013-14 US $92.50 $3.07 2014-15 US $95.00 $3.552015-16 US $92.00 $3.70
W:\Obm.admin\OBM.ADMIN‐EPF\OBM.ADMIN‐EPF‐Desktop_Publishing\2012_Economy_Publications\5_Economic‐Outlook_2013\Text_Files_sourceDocs\Business_Sector_Budget_charts_SA.xlsx 2/25/2013: 4:09 PM
W:\Obm.admin\OBM.ADMIN‐EPF\OBM.ADMIN‐EPF‐Desktop_Publishing\2012_Economy_Publications\5_Economic‐Outlook_2013\Text_Files_sourceDocs\Business_Sector_Budget_charts_SA.xlsx 2/25/2013: 4:09 PM
85#buildingAlberta FISCAL PLAN 2013–16 • ECONOMIC OUTLOOK
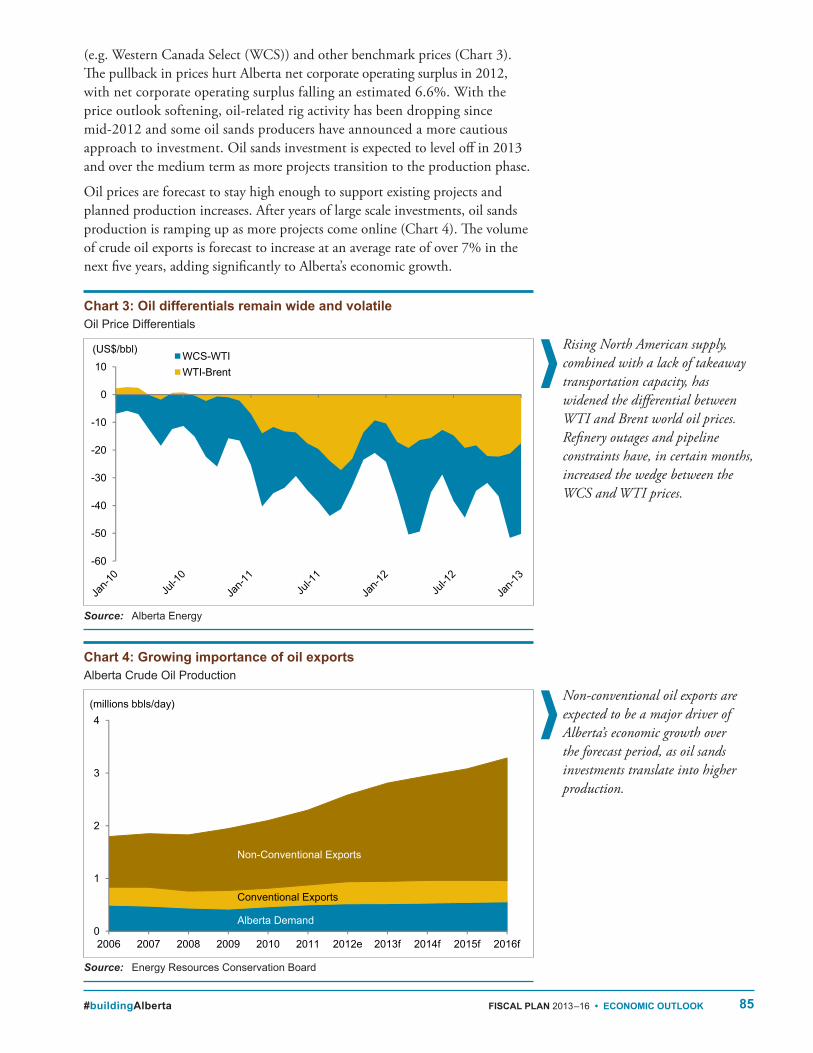
(e .g . Western Canada Select (WCS)) and other benchmark prices (Chart 3) . The pullback in prices hurt Alberta net corporate operating surplus in 2012, with net corporate operating surplus falling an estimated 6 .6% . With the price outlook softening, oil-related rig activity has been dropping since mid-2012 and some oil sands producers have announced a more cautious approach to investment . Oil sands investment is expected to level off in 2013 and over the medium term as more projects transition to the production phase .
Oil prices are forecast to stay high enough to support existing projects and planned production increases . After years of large scale investments, oil sands production is ramping up as more projects come online (Chart 4) . The volume of crude oil exports is forecast to increase at an average rate of over 7% in the next five years, adding significantly to Alberta’s economic growth .
Source: Alberta Energy
Source: Energy Resources Conservation Board
Rising North American supply, combined with a lack of takeaway transportation capacity, has widened the differential between WTI and Brent world oil prices. Refinery outages and pipeline constraints have, in certain months, increased the wedge between the WCS and WTI prices.
Non-conventional oil exports are expected to be a major driver of Alberta’s economic growth over the forecast period, as oil sands investments translate into higher production.
Chart 4: Growing importance of oil exportsAlberta Crude Oil Production
PDF named: EO13_chrt_04_gioep_SA.pdf EO Budget 2013
Growing importance of oil exports
Alberta Crude Oil Production
0
1
2
3
4
2006 2007 2008 2009 2010 2011 2012e 2013f 2014f 2015f 2016f
(millions bbls/day)
Non-Conventional Exports
Conventional Exports
Alberta Demand
W:\Obm.admin\OBM.ADMIN‐EPF\OBM.ADMIN‐EPF‐Desktop_Publishing\2012_Economy_Publications\5_Economic‐Outlook_2013\Text_Files_sourceDocs\Business_Sector_Budget_charts_SA.xlsx
2/27/2013: 11:49 AM
0
1
2
3
4
2006 2007 2008 2009 2010 2011 2012e 2013f 2014f 2015f 2016f
(millions bbls/day)
Non-Conventional Exports
Conventional Exports
Alberta Demand
Source: Energy Resources Conservation Board
0
1
2
3
4
2006 2007 2008 2009 2010 2011 2012e 2013f 2014f 2015f 2016f
(millions bbls/day)
Non-Conventional Exports
Conventional Exports
Alberta Demand
Source: Energy Resources Conservation Board
EO13_chrt_04_gioep_SA.pdf
W:\Obm.admin\OBM.ADMIN‐EPF\OBM.ADMIN‐EPF‐Desktop_Publishing\2012_Economy_Publications\5_Economic‐Outlook_2013\Text_Files_sourceDocs\Business_Sector_Budget_charts_SA.xlsx
2/27/2013: 11:49 AMW:\Obm.admin\OBM.ADMIN‐EPF\OBM.ADMIN‐EPF‐Desktop_Publishing\2012_Economy_Publications\5_Economic‐Outlook_2013\Text_Files_sourceDocs\Business_Sector_Budget_charts_SA.xlsx
2/27/2013: 11:49 AM
Chart 3: Oil differentials remain wide and volatileOil Price Differentials
PDF named: EO13_chrt_03_odrwav_SA.pdf EO Budget 2013
Oil differentials remain wide and volatileOil Prices Differential
-60
-50
-40
-30
-20
-10
0
10WCS-WTIWTI-Brent
(US$/bbl)
W:\Obm.admin\OBM.ADMIN‐EPF\OBM.ADMIN‐EPF‐Desktop_Publishing\2012_Economy_Publications\5_Economic‐Outlook_2013\Text_Files_sourceDocs\Business_Sector_Budget_charts_SA.xlsx
2/20/2013: 9:26 AM
-60
-50
-40
-30
-20
-10
0
10WCS-WTIWTI-Brent
(US$/bbl)
Source: Alberta Energy
-60
-50
-40
-30
-20
-10
0
10WCS-WTIWTI-Brent
(US$/bbl)
EO13_chrt_03_odrwav_SA.pdf
W:\Obm.admin\OBM.ADMIN‐EPF\OBM.ADMIN‐EPF‐Desktop_Publishing\2012_Economy_Publications\5_Economic‐Outlook_2013\Text_Files_sourceDocs\Business_Sector_Budget_charts_SA.xlsx
2/20/2013: 9:26 AMW:\Obm.admin\OBM.ADMIN‐EPF\OBM.ADMIN‐EPF‐Desktop_Publishing\2012_Economy_Publications\5_Economic‐Outlook_2013\Text_Files_sourceDocs\Business_Sector_Budget_charts_SA.xlsx
2/20/2013: 9:26 AM
86 ECONOMIC OUTLOOK • FISCAL PLAN 2013–16 #buildingAlberta
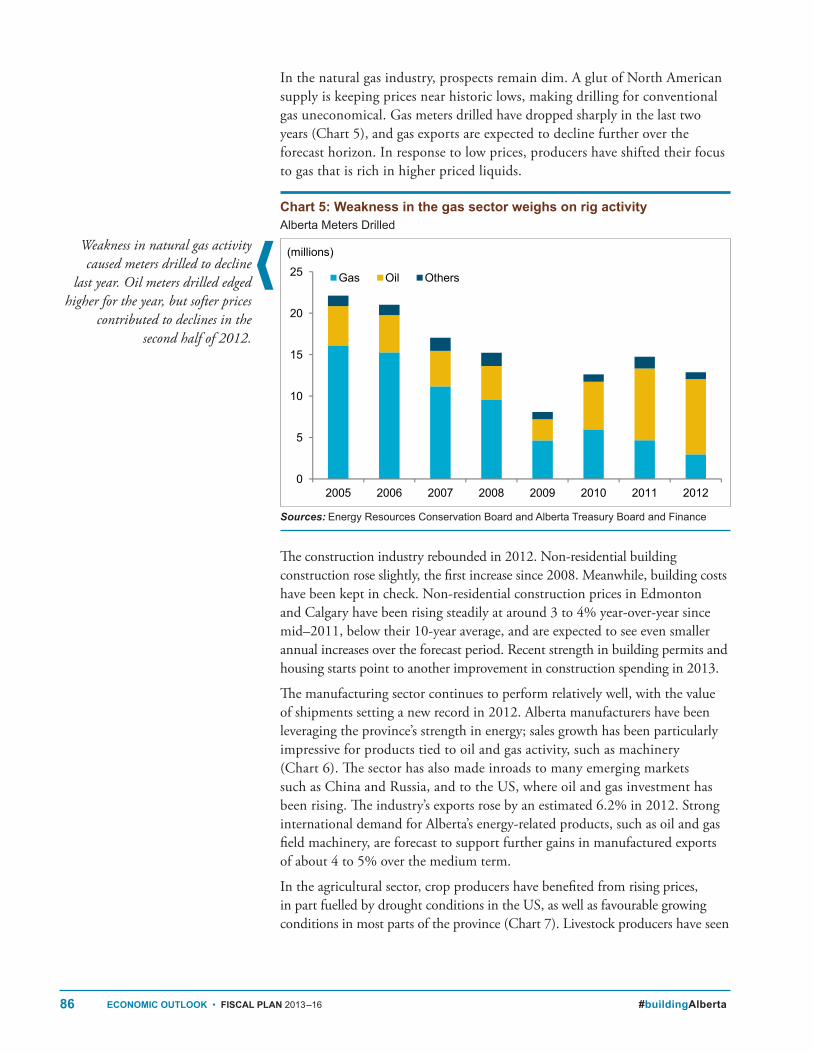
In the natural gas industry, prospects remain dim . A glut of North American supply is keeping prices near historic lows, making drilling for conventional gas uneconomical . Gas meters drilled have dropped sharply in the last two years (Chart 5), and gas exports are expected to decline further over the forecast horizon . In response to low prices, producers have shifted their focus to gas that is rich in higher priced liquids .
Sources: Energy Resources Conservation Board and Alberta Treasury Board and Finance
The construction industry rebounded in 2012 . Non-residential building construction rose slightly, the first increase since 2008 . Meanwhile, building costs have been kept in check . Non-residential construction prices in Edmonton and Calgary have been rising steadily at around 3 to 4% year-over-year since mid–2011, below their 10-year average, and are expected to see even smaller annual increases over the forecast period . Recent strength in building permits and housing starts point to another improvement in construction spending in 2013 .
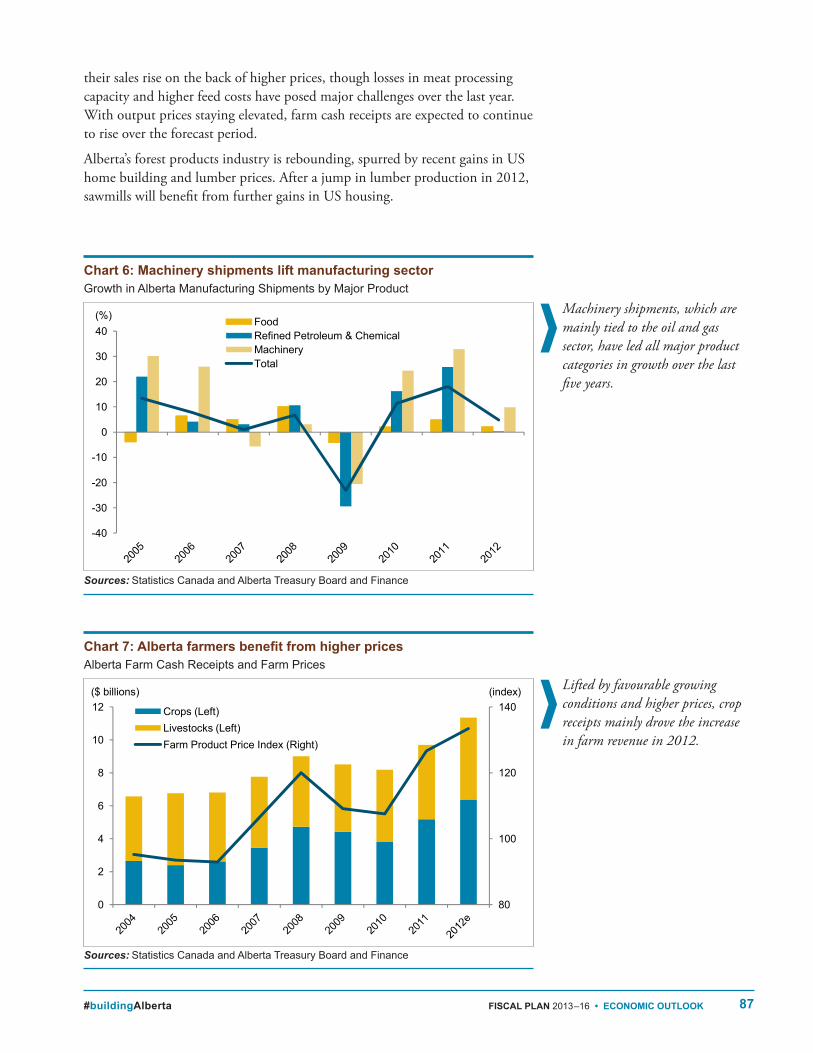
The manufacturing sector continues to perform relatively well, with the value of shipments setting a new record in 2012 . Alberta manufacturers have been leveraging the province’s strength in energy; sales growth has been particularly impressive for products tied to oil and gas activity, such as machinery (Chart 6) . The sector has also made inroads to many emerging markets such as China and Russia, and to the US, where oil and gas investment has been rising . The industry’s exports rose by an estimated 6 .2% in 2012 . Strong international demand for Alberta’s energy-related products, such as oil and gas field machinery, are forecast to support further gains in manufactured exports of about 4 to 5% over the medium term .
In the agricultural sector, crop producers have benefited from rising prices, in part fuelled by drought conditions in the US, as well as favourable growing conditions in most parts of the province (Chart 7) . Livestock producers have seen
Weakness in natural gas activity caused meters drilled to decline
last year. Oil meters drilled edged higher for the year, but softer prices
contributed to declines in the second half of 2012.
Chart 5: Weakness in the gas sector weighs on rig activityAlberta Meters Drilled
Pdf named: EO13_chrt_05_wgaword_SA.pdf EO Budget 2013
Weaker gas activity weigns on rig drillingMetres Drilled
Source: Energy Resources Conservation Board and Alberta Treasury Board Fina
EO13_chrt_05_wgaword_black.pdf
0
5
10
15
20
25
2005 2006 2007 2008 2009 2010 2011 2012
Gas Oil Others
(millions)
(millions)
W:\Obm.admin\OBM.ADMIN‐EPF\OBM.ADMIN‐EPF‐Desktop_Publishing\2012_Economy_Publications\5_Economic‐Outlook_2013\Text_Files_sourceDocs\Business_Sector_Budget_charts_SA.xlsx 2/27/2013: 11:43 AM
0
5
10
15
20
25
2005 2006 2007 2008 2009 2010 2011 2012
Gas Oil Others
(millions)
W:\Obm.admin\OBM.ADMIN‐EPF\OBM.ADMIN‐EPF‐Desktop_Publishing\2012_Economy_Publications\5_Economic‐Outlook_2013\Text_Files_sourceDocs\Business_Sector_Budget_charts_SA.xlsx 2/27/2013: 11:43 AM
87#buildingAlberta FISCAL PLAN 2013–16 • ECONOMIC OUTLOOK
Sources: Statistics Canada and Alberta Treasury Board and Finance
Sources: Statistics Canada and Alberta Treasury Board and Finance
their sales rise on the back of higher prices, though losses in meat processing capacity and higher feed costs have posed major challenges over the last year . With output prices staying elevated, farm cash receipts are expected to continue to rise over the forecast period .
Alberta’s forest products industry is rebounding, spurred by recent gains in US home building and lumber prices . After a jump in lumber production in 2012, sawmills will benefit from further gains in US housing .
Machinery shipments, which are mainly tied to the oil and gas sector, have led all major product categories in growth over the last five years.
Lifted by favourable growing conditions and higher prices, crop receipts mainly drove the increase in farm revenue in 2012.
Chart 7: Alberta farmers benefit from higher pricesAlberta Farm Cash Receipts and Farm Prices
Pdf named: EO13_chrt_07_afbfhcalp_SA.pdf EO Budget 2013
Alberta farmers benefit from higher pricesAlberta Farm Cash Receipts and Farm Prices
Source: Statistics Canada and Alberta Treasury Board and FinanceEO13_chrt_07_afbfhcalp_SA.pdf
80
100
120
140
0
2
4
6
8
10
12 Crops (Left)Livestocks (Left)Farm Product Price Index (Right)
($ billions) (index)
W:\Obm.admin\OBM.ADMIN‐EPF\OBM.ADMIN‐EPF‐Desktop_Publishing\2012_Economy_Publications\5_Economic‐Outlook_2013\Text_Files_sourceDocs\Business_Sector_Budget_charts_SA.xlsx 2/21/2013: 4:15 PM
W:\Obm.admin\OBM.ADMIN‐EPF\OBM.ADMIN‐EPF‐Desktop_Publishing\2012_Economy_Publications\5_Economic‐Outlook_2013\Text_Files_sourceDocs\Business_Sector_Budget_charts_SA.xlsx 2/21/2013: 4:15 PM
Chart 6: Machinery shipments lift manufacturing sectorGrowth in Alberta Manufacturing Shipments by Major Product
Pdf named: EO13_chrt_06_mslbea_SA.pdf EO Budget 2013
Machinery shipments lift manufacturing sectorGrowth in Manufacturing Shipments by Major Products
Source: Statistics Canada and Alberta Treasury Board and FinanceEO13_chrt_06_mslbea_SA.pdf
-40
-30
-20
-10
0
10
20
30
40FoodRefined Petroleum & ChemicalMachineryTotal
(%)
W:\Obm.admin\OBM.ADMIN‐EPF\OBM.ADMIN‐EPF‐Desktop_Publishing\2012_Economy_Publications\5_Economic‐Outlook_2013\Text_Files_sourceDocs\Business_Sector_Budget_charts_SA.xlsx 2/20/2013: 9:25 AM
W:\Obm.admin\OBM.ADMIN‐EPF\OBM.ADMIN‐EPF‐Desktop_Publishing\2012_Economy_Publications\5_Economic‐Outlook_2013\Text_Files_sourceDocs\Business_Sector_Budget_charts_SA.xlsx 2/20/2013: 9:25 AM
88 ECONOMIC OUTLOOK • FISCAL PLAN 2013–16 #buildingAlberta
Sources: Statistics Canada and Alberta Treasury Board and Finance
HOUSEHOLD SECTOR: SUPPORTING ALBERTA’S ECONOMIC GROWTHEconomic activity shifted to the household sector in the second half of 2012 and into 2013. Robust demand for consumer goods and services, as well as housing, has helped offset slower gains in the business sector. Households are expected to play a key role in 2013 and over the medium term, as a healthy labour market and strong in-migration support the household sector.
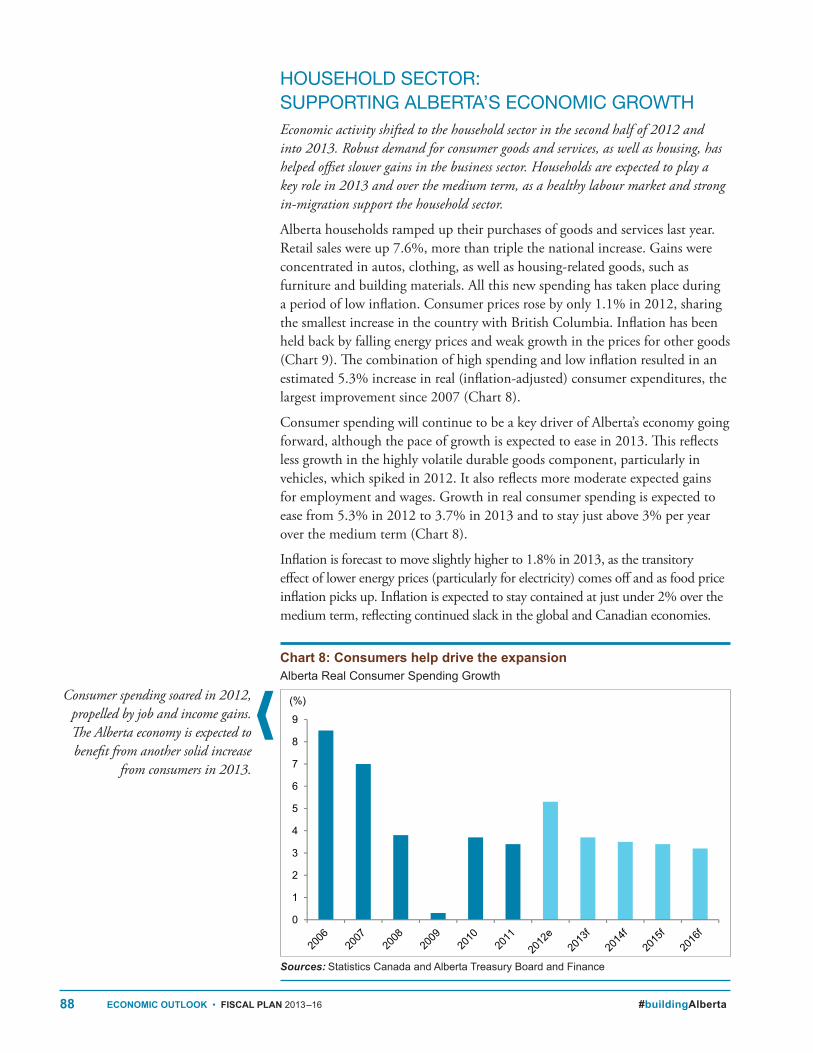
Alberta households ramped up their purchases of goods and services last year . Retail sales were up 7 .6%, more than triple the national increase . Gains were concentrated in autos, clothing, as well as housing-related goods, such as furniture and building materials . All this new spending has taken place during a period of low inflation . Consumer prices rose by only 1 .1% in 2012, sharing the smallest increase in the country with British Columbia . Inflation has been held back by falling energy prices and weak growth in the prices for other goods (Chart 9) . The combination of high spending and low inflation resulted in an estimated 5 .3% increase in real (inflation-adjusted) consumer expenditures, the largest improvement since 2007 (Chart 8) .
Consumer spending will continue to be a key driver of Alberta’s economy going forward, although the pace of growth is expected to ease in 2013 . This reflects less growth in the highly volatile durable goods component, particularly in vehicles, which spiked in 2012 . It also reflects more moderate expected gains for employment and wages . Growth in real consumer spending is expected to ease from 5 .3% in 2012 to 3 .7% in 2013 and to stay just above 3% per year over the medium term (Chart 8) .
Inflation is forecast to move slightly higher to 1 .8% in 2013, as the transitory effect of lower energy prices (particularly for electricity) comes off and as food price inflation picks up . Inflation is expected to stay contained at just under 2% over the medium term, reflecting continued slack in the global and Canadian economies .
Consumer spending soared in 2012, propelled by job and income gains. The Alberta economy is expected to benefit from another solid increase
from consumers in 2013.
Chart 8: Consumers help drive the expansionAlberta Real Consumer Spending Growth
PDF name: EO13_chrt_08_chdte_AG.pdf EO Budget 2013
Consumers help drive the expansionAlberta Real Consumer Spending Growth
0
1
2
3
4
5
6
7
8
9
(%)
W:\Obm.admin\OBM.ADMIN‐EPF\OBM.ADMIN‐EPF‐Desktop_Publishing\2012_Economy_Publications\5_Economic‐Outlook_2013\Text_Files_sourceDocs\Household_Budget_Charts_AG.xlsx 2/20/2013: 11:31 AM
0
1
2
3
4
5
6
7
8
9
(%)
0
1
2
3
4
5
6
7
8
9
(%)
Source: Statistics Canada and Alberta Treasury Board and Finance
EO13_chrt_08_chdte_AG.pdf
W:\Obm.admin\OBM.ADMIN‐EPF\OBM.ADMIN‐EPF‐Desktop_Publishing\2012_Economy_Publications\5_Economic‐Outlook_2013\Text_Files_sourceDocs\Household_Budget_Charts_AG.xlsx 2/20/2013: 11:31 AM
89#buildingAlberta FISCAL PLAN 2013–16 • ECONOMIC OUTLOOK
Source: Statistics Canada
Sources: Statistics Canada and Alberta Treasury Board and Finance
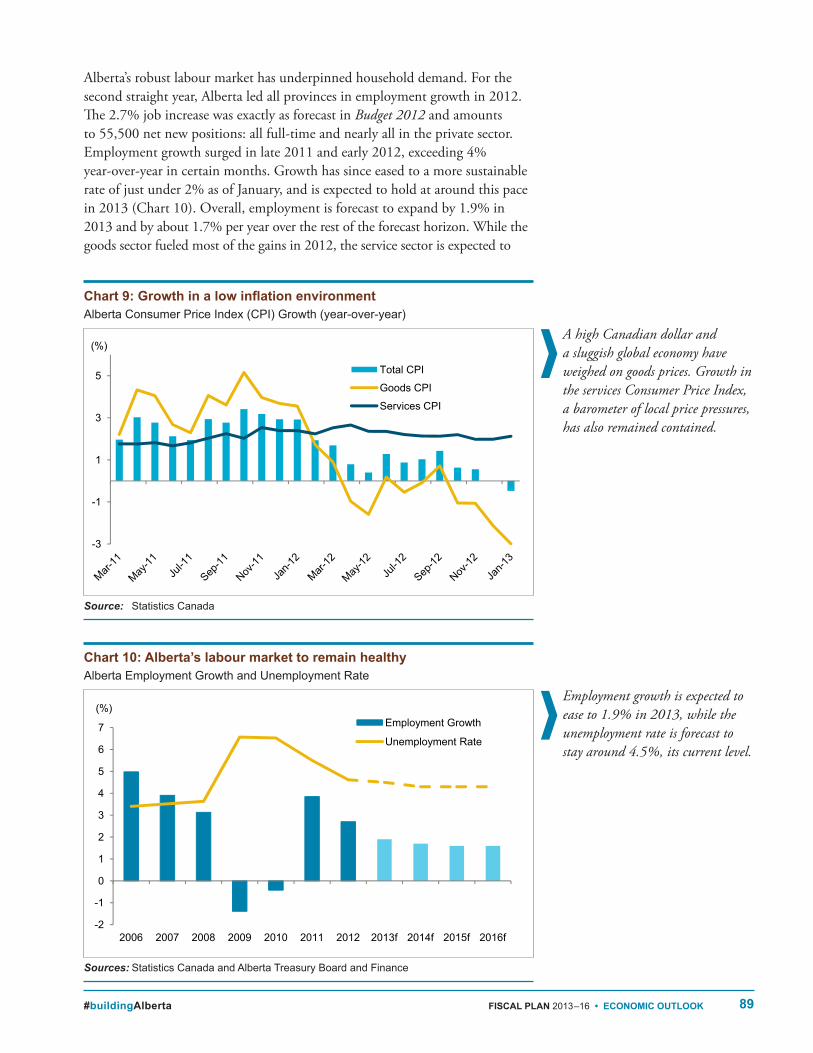
Alberta’s robust labour market has underpinned household demand . For the second straight year, Alberta led all provinces in employment growth in 2012 . The 2 .7% job increase was exactly as forecast in Budget 2012 and amounts to 55,500 net new positions: all full-time and nearly all in the private sector . Employment growth surged in late 2011 and early 2012, exceeding 4% year-over-year in certain months . Growth has since eased to a more sustainable rate of just under 2% as of January, and is expected to hold at around this pace in 2013 (Chart 10) . Overall, employment is forecast to expand by 1 .9% in 2013 and by about 1 .7% per year over the rest of the forecast horizon . While the goods sector fueled most of the gains in 2012, the service sector is expected to
A high Canadian dollar and a sluggish global economy have weighed on goods prices. Growth in the services Consumer Price Index, a barometer of local price pressures, has also remained contained.
Employment growth is expected to ease to 1.9% in 2013, while the unemployment rate is forecast to stay around 4.5%, its current level.
Chart 10: Alberta’s labour market to remain healthyAlberta Employment Growth and Unemployment Rate
PDF name: EO13_chrt_10_AEGAUR_AG.pdf EO Budget 2013
Alberta's labour market to remain healthyAlberta Employment Growth and Unemployment Rate
-2
-1
0
1
2
3
4
5
6
7
2006 2007 2008 2009 2010 2011 2012 2013f 2014f 2015f 2016f
Employment Growth
Unemployment Rate
(%)
W:\Obm.admin\OBM.ADMIN‐EPF\OBM.ADMIN‐EPF‐Desktop_Publishing\2012_Economy_Publications\5_Economic‐Outlook_2013\Text_Files_sourceDocs\Household_Budget_Charts_AG.xlsx 2/20/2013: 10:11 AM
-2
-1
0
1
2
3
4
5
6
7
2006 2007 2008 2009 2010 2011 2012 2013f 2014f 2015f 2016f
Employment Growth
Unemployment Rate
(%)
-2
-1
0
1
2
3
4
5
6
7
2006 2007 2008 2009 2010 2011 2012 2013f 2014f 2015f 2016f
Employment Growth
Unemployment Rate
(%)
Source: Statistics Canada and Alberta Treasury Board and Finance
EO13_chrt_10_AEGAUR_AG.pdf
W:\Obm.admin\OBM.ADMIN‐EPF\OBM.ADMIN‐EPF‐Desktop_Publishing\2012_Economy_Publications\5_Economic‐Outlook_2013\Text_Files_sourceDocs\Household_Budget_Charts_AG.xlsx 2/20/2013: 10:11 AM
Chart 9: Growth in a low inflation environmentAlberta Consumer Price Index (CPI) Growth (year‑over‑year)
PDF name: EO13_chrt_09_ACPIG_AG.pdf EO Budget 2013
Growth in a low inflation environmentAlberta Consumer Price Index (CPI) Growth (year‐over‐year)
-3
-1
1
3
5 Total CPI
Goods CPI
Services CPI
(%)
W:\Obm.admin\OBM.ADMIN‐EPF\OBM.ADMIN‐EPF‐Desktop_Publishing\2012_Economy_Publications\5_Economic‐Outlook_2013\Text_Files_sourceDocs\Household_Budget_Charts_AG.xlsx 2/25/2013: 4:01 PM
-3
-1
1
3
5 Total CPI
Goods CPI
Services CPI
(%)
-3
-1
1
3
5 Total CPI
Goods CPI
Services CPI
(%)
Source: Statistics CanadaEO13_chrt_09_ACPIG_AG.pdf
W:\Obm.admin\OBM.ADMIN‐EPF\OBM.ADMIN‐EPF‐Desktop_Publishing\2012_Economy_Publications\5_Economic‐Outlook_2013\Text_Files_sourceDocs\Household_Budget_Charts_AG.xlsx 2/25/2013: 4:01 PM
90 ECONOMIC OUTLOOK • FISCAL PLAN 2013–16 #buildingAlberta
Source: Statistics Canada
play a much larger role going forward as strong population growth increases the demand for services . Supported by healthy job gains, the unemployment rate is forecast to stay around its recent level, averaging 4 .5% in 2013 before edging down to 4 .3% in 2014 through to 2016 .
Alberta workers have the highest average earnings of all provinces, making about 20% more per week than the national average . After rising by 4 .6% for two straight years, average weekly earnings grew at a more moderate pace of 3 .3% in 2012 . With the labour market remaining fairly tight, average earnings are forecast to expand at 3 .5% in 2013, and grow at around this pace over the medium term . Total primary household income (the new measure of personal income) is expected to ease from 7 .3% growth in 2012 to 5 .4% in 2013, mainly reflecting a moderation in job gains .
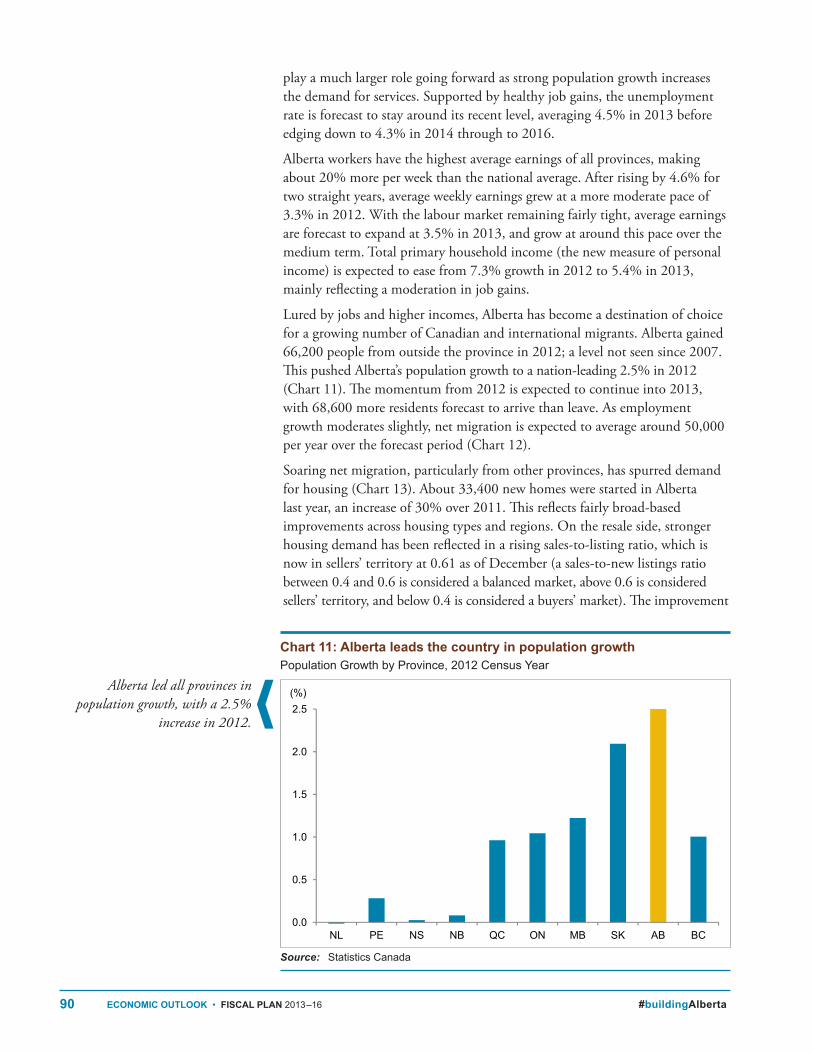
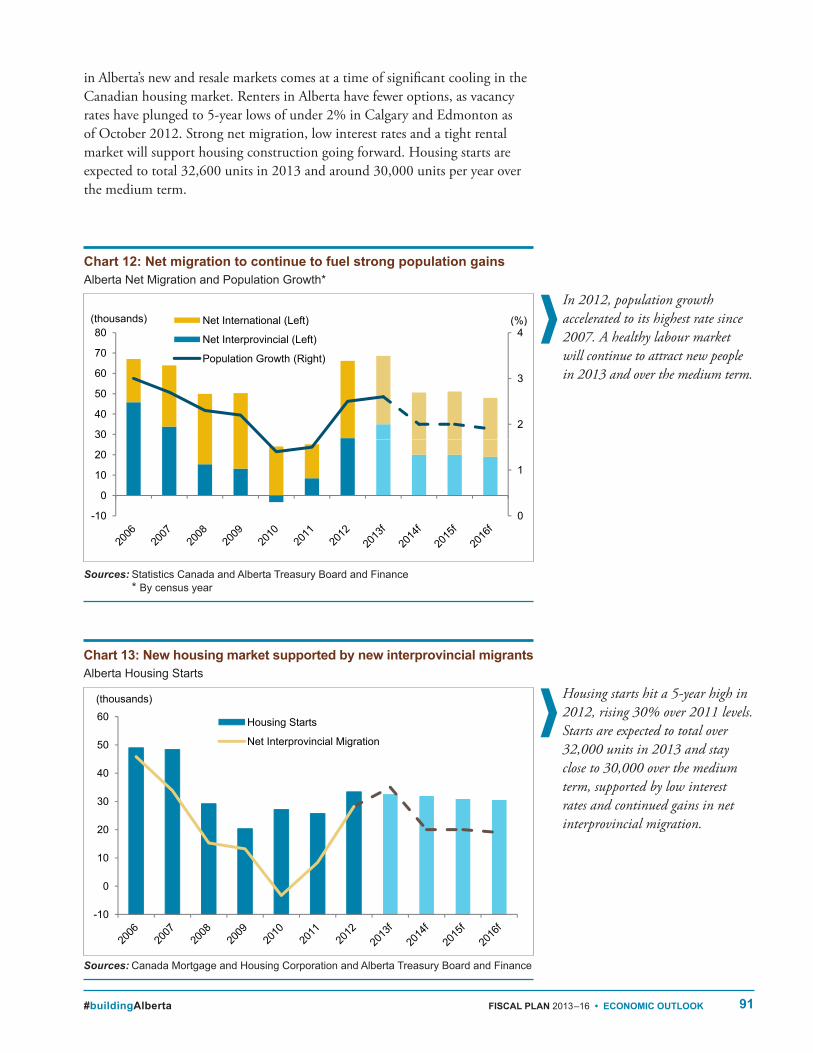
Lured by jobs and higher incomes, Alberta has become a destination of choice for a growing number of Canadian and international migrants . Alberta gained 66,200 people from outside the province in 2012; a level not seen since 2007 . This pushed Alberta’s population growth to a nation-leading 2 .5% in 2012 (Chart 11) . The momentum from 2012 is expected to continue into 2013, with 68,600 more residents forecast to arrive than leave . As employment growth moderates slightly, net migration is expected to average around 50,000 per year over the forecast period (Chart 12) .
Soaring net migration, particularly from other provinces, has spurred demand for housing (Chart 13) . About 33,400 new homes were started in Alberta last year, an increase of 30% over 2011 . This reflects fairly broad-based improvements across housing types and regions . On the resale side, stronger housing demand has been reflected in a rising sales-to-listing ratio, which is now in sellers’ territory at 0 .61 as of December (a sales-to-new listings ratio between 0 .4 and 0 .6 is considered a balanced market, above 0 .6 is considered sellers’ territory, and below 0 .4 is considered a buyers’ market) . The improvement
Alberta led all provinces in population growth, with a 2.5%
increase in 2012.
Chart 11: Alberta leads the country in population growthPopulation Growth by Province, 2012 Census Year
PDF name: EO13_chrt_11_pgbp_AG.pdf EO Budget 2013
Alberta continues to lead the country in population growthPopulation Growth by Province, 2012
0.0
0.5
1.0
1.5
2.0
2.5
NL PE NS NB QC ON MB SK AB BC
(%)
W:\Obm.admin\OBM.ADMIN‐EPF\OBM.ADMIN‐EPF‐Desktop_Publishing\2012_Economy_Publications\5_Economic‐Outlook_2013\Text_Files_sourceDocs\Household_Budget_Charts_AG.xlsx 2/21/2013: 4:31 PM
0.0
0.5
1.0
1.5
2.0
2.5
NL PE NS NB QC ON MB SK AB BC
(%)
0.0
0.5
1.0
1.5
2.0
2.5
NL PE NS NB QC ON MB SK AB BC
(%)
Source: Statistics Canada
EO13_chrt_11_pgbp_AG.pdf
W:\Obm.admin\OBM.ADMIN‐EPF\OBM.ADMIN‐EPF‐Desktop_Publishing\2012_Economy_Publications\5_Economic‐Outlook_2013\Text_Files_sourceDocs\Household_Budget_Charts_AG.xlsx 2/21/2013: 4:31 PM
91#buildingAlberta FISCAL PLAN 2013–16 • ECONOMIC OUTLOOK
Sources: Statistics Canada and Alberta Treasury Board and Finance * By census year
Sources: Canada Mortgage and Housing Corporation and Alberta Treasury Board and Finance
in Alberta’s new and resale markets comes at a time of significant cooling in the Canadian housing market . Renters in Alberta have fewer options, as vacancy rates have plunged to 5-year lows of under 2% in Calgary and Edmonton as of October 2012 . Strong net migration, low interest rates and a tight rental market will support housing construction going forward . Housing starts are expected to total 32,600 units in 2013 and around 30,000 units per year over the medium term .
In 2012, population growth accelerated to its highest rate since 2007. A healthy labour market will continue to attract new people in 2013 and over the medium term.
Housing starts hit a 5-year high in 2012, rising 30% over 2011 levels. Starts are expected to total over 32,000 units in 2013 and stay close to 30,000 over the medium term, supported by low interest rates and continued gains in net interprovincial migration.
Chart 13: New housing market supported by new interprovincial migrantsAlberta Housing Starts
PDF name: EO13_chrt_13_AHS_AG.pdf EO Budget 2013
Housing market lifted by new migrantsAlberta Housing Starts
-10
0
10
20
30
40
50
60 Housing Starts
Net Interprovincial Migration
(thousands)
W:\Obm.admin\OBM.ADMIN‐EPF\OBM.ADMIN‐EPF‐Desktop_Publishing\2012_Economy_Publications\5_Economic‐Outlook_2013\Text_Files_sourceDocs\Household_Budget_Charts_AG.xlsx 2/27/2013: 11:44 AM
-10
0
10
20
30
40
50
60 Housing Starts
Net Interprovincial Migration
(thousands)
-10
0
10
20
30
40
50
60 Housing Starts
Net Interprovincial Migration
(thousands)
Source: Canada Mortgage and Housing Corporation, Statistics Canada, and Alberta Treasury
EO13_chrt_13_AHS_AG.pdf
W:\Obm.admin\OBM.ADMIN‐EPF\OBM.ADMIN‐EPF‐Desktop_Publishing\2012_Economy_Publications\5_Economic‐Outlook_2013\Text_Files_sourceDocs\Household_Budget_Charts_AG.xlsx 2/27/2013: 11:44 AM
Chart 12: Net migration to continue to fuel strong population gainsAlberta Net Migration and Population Growth*
PDF name: EO13_chrt_12_ANMAPG_AG.pdf EO Budget 2013
Net migration to continue to fuel strong population growthAlberta Net Migration and Population Growth*
0
1
2
3
4
-10
0
10
20
30
40
50
60
70
80Net International (Left)
Net Interprovincial (Left)
Population Growth (Right)
(thousands) (%)
W:\Obm.admin\OBM.ADMIN‐EPF\OBM.ADMIN‐EPF‐Desktop_Publishing\2012_Economy_Publications\5_Economic‐Outlook_2013\Text_Files_sourceDocs\Household_Budget_Charts_AG.xlsx 2/28/2013: 11:19 AM
0
1
2
3
4
-10
0
10
20
30
40
50
60
70
80Net International (Left)
Net Interprovincial (Left)
Population Growth (Right)
(thousands) (%)
0
1
2
3
4
-10
0
10
20
30
40
50
60
70
80Net International (Left)
Net Interprovincial (Left)
Population Growth (Right)
(thousands) (%)
Source: Statistics Canada and Alberta Treasury Board and Finance* By census yearEO13_chrt_12_ANMAPG_AG.pdf
4
70
80Net International (Left)
Net Interprovincial (Left)
Population Growth (Right)
(thousands) (%)
0
1
2
3
4
-10
0
10
20
30
40
50
60
70
80Net International (Left)
Net Interprovincial (Left)
Population Growth (Right)
(thousands) (%)
1
2
3
4
10
20
30
40
50
60
70
80( )
Net Interprovincial (Left)
Population Growth (Right)
( ) (%)
0
1
-10
0
10
20
W:\Obm.admin\OBM.ADMIN‐EPF\OBM.ADMIN‐EPF‐Desktop_Publishing\2012_Economy_Publications\5_Economic‐Outlook_2013\Text_Files_sourceDocs\Household_Budget_Charts_AG.xlsx 2/28/2013: 11:19 AM
92 ECONOMIC OUTLOOK • FISCAL PLAN 2013–16 #buildingAlberta
Source: Economic Policy Uncertainty: Scott Baker, Nicholas Bloom and Steven Davis
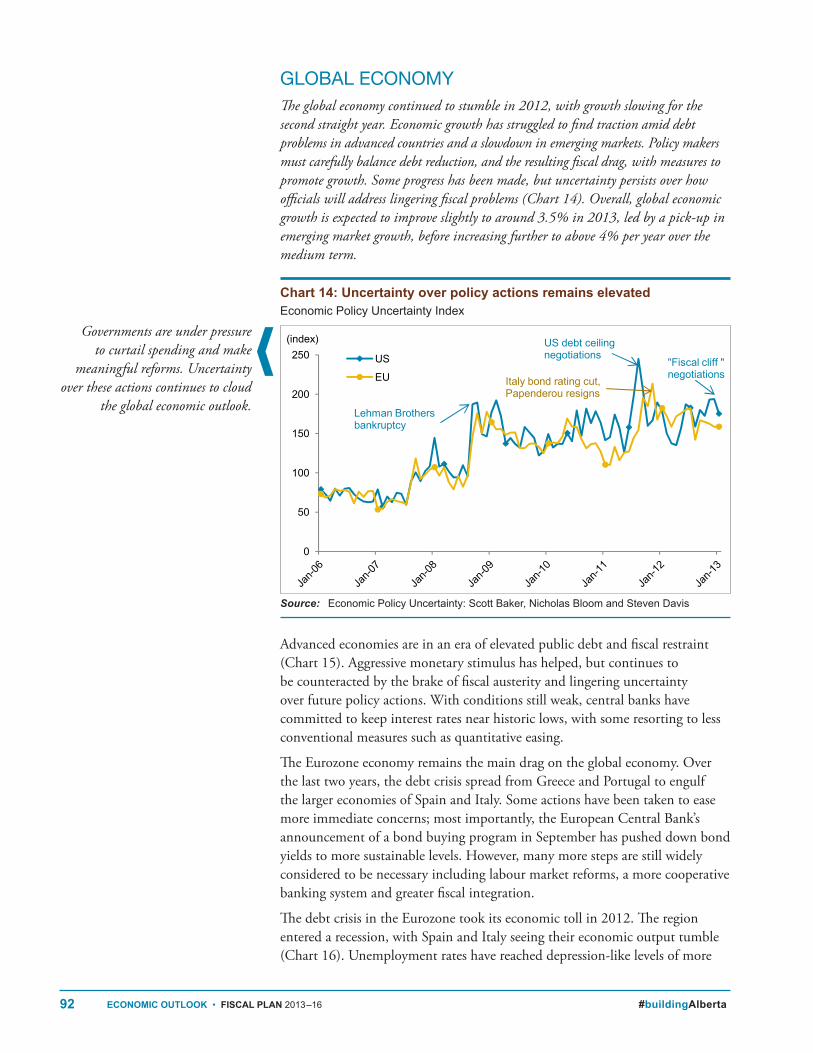
GLOBAL ECONOMYThe global economy continued to stumble in 2012, with growth slowing for the second straight year. Economic growth has struggled to find traction amid debt problems in advanced countries and a slowdown in emerging markets. Policy makers must carefully balance debt reduction, and the resulting fiscal drag, with measures to promote growth. Some progress has been made, but uncertainty persists over how officials will address lingering fiscal problems (Chart 14). Overall, global economic growth is expected to improve slightly to around 3.5% in 2013, led by a pick-up in emerging market growth, before increasing further to above 4% per year over the medium term.
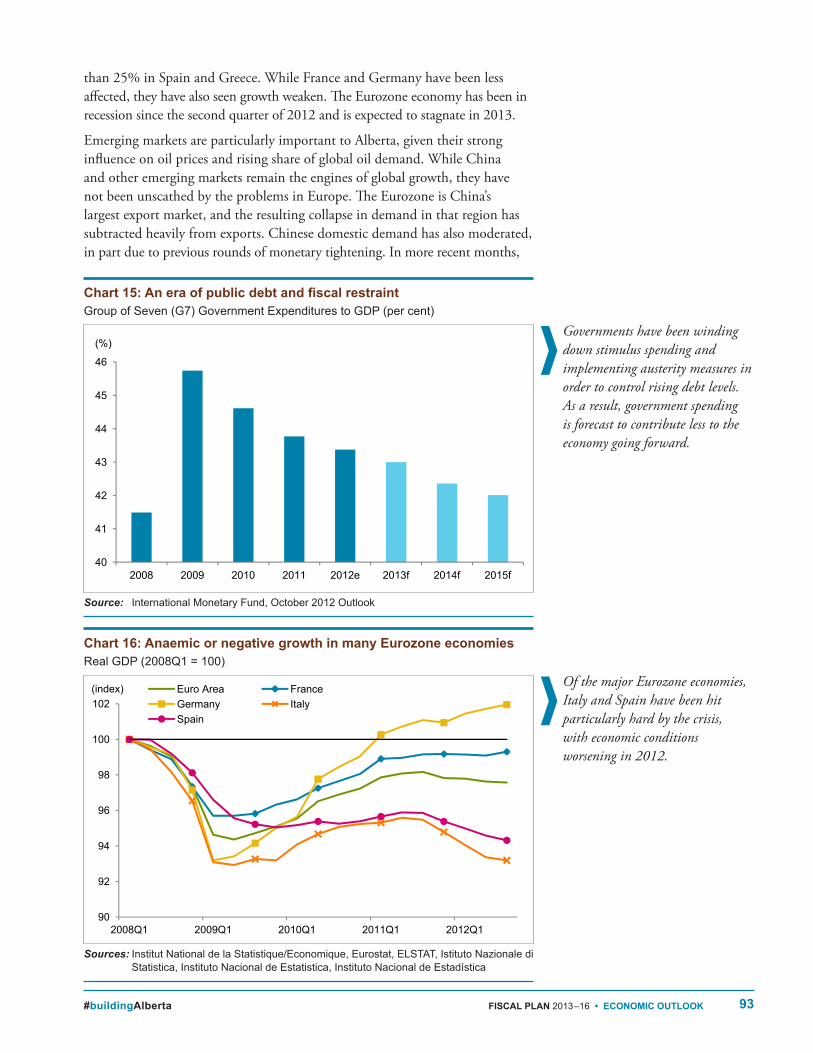
Advanced economies are in an era of elevated public debt and fiscal restraint (Chart 15) . Aggressive monetary stimulus has helped, but continues to be counteracted by the brake of fiscal austerity and lingering uncertainty over future policy actions . With conditions still weak, central banks have committed to keep interest rates near historic lows, with some resorting to less conventional measures such as quantitative easing .
The Eurozone economy remains the main drag on the global economy . Over the last two years, the debt crisis spread from Greece and Portugal to engulf the larger economies of Spain and Italy . Some actions have been taken to ease more immediate concerns; most importantly, the European Central Bank’s announcement of a bond buying program in September has pushed down bond yields to more sustainable levels . However, many more steps are still widely considered to be necessary including labour market reforms, a more cooperative banking system and greater fiscal integration .
The debt crisis in the Eurozone took its economic toll in 2012 . The region entered a recession, with Spain and Italy seeing their economic output tumble (Chart 16) . Unemployment rates have reached depression-like levels of more
Governments are under pressure to curtail spending and make
meaningful reforms. Uncertainty over these actions continues to cloud
the global economic outlook.
Chart 14: Uncertainty over policy actions remains elevatedEconomic Policy Uncertainty Index
Pdf name:
EO13_chrt_14_uopare.pdf
Budget 2013,Economic Chapter
Uncertainty over policy actions remains elevated
Economic Policy Uncertainty Index
Source: Economic Policy Uncertainty: Scott Baker, Nicholas Bloom and St
EO13_chrt_14_uopare.pdf
0
50
100
150
200
250(index)
US
EU
Lehman Brothers bankruptcy
US debt ceiling negotiations
"Fiscal cliff " negotiationsItaly bond rating cut,
Papenderou resigns
W:\Obm.admin\OBM.ADMIN‐EPF\OBM.ADMIN‐EPF‐Desktop_Publishing\2012_Economy_Publications\5_Economic‐Outlook_2013\Text_Files_sourceDocs\External_Budget_Charts_KM.xlsx / 14)Uncertainty last printed: 2/26/2013 / 10:06 AM
W:\Obm.admin\OBM.ADMIN‐EPF\OBM.ADMIN‐EPF‐Desktop_Publishing\2012_Economy_Publications\5_Economic‐Outlook_2013\Text_Files_sourceDocs\External_Budget_Charts_KM.xlsx / 14)Uncertainty last printed: 2/26/2013 / 10:06 AM
93#buildingAlberta FISCAL PLAN 2013–16 • ECONOMIC OUTLOOK
Source: International Monetary Fund, October 2012 Outlook
Sources: Institut National de la Statistique/Economique, Eurostat, ELSTAT, Istituto Nazionale di Statistica, Instituto Nacional de Estatistica, Instituto Nacional de Estadística
than 25% in Spain and Greece . While France and Germany have been less affected, they have also seen growth weaken . The Eurozone economy has been in recession since the second quarter of 2012 and is expected to stagnate in 2013 .
Emerging markets are particularly important to Alberta, given their strong influence on oil prices and rising share of global oil demand . While China and other emerging markets remain the engines of global growth, they have not been unscathed by the problems in Europe . The Eurozone is China’s largest export market, and the resulting collapse in demand in that region has subtracted heavily from exports . Chinese domestic demand has also moderated, in part due to previous rounds of monetary tightening . In more recent months,
Governments have been winding down stimulus spending and implementing austerity measures in order to control rising debt levels. As a result, government spending is forecast to contribute less to the economy going forward.
Of the major Eurozone economies, Italy and Spain have been hit particularly hard by the crisis, with economic conditions worsening in 2012.
Chart 16: Anaemic or negative growth in many Eurozone economiesReal GDP (2008Q1 = 100)
PDF named:EO13_chrt_16_rgdp.pdf
Budget 2013Economic Chapter
Growth has been aenemic or negative in many Eurozone economiesReal GDP (index; 2008Q1 = 100)
90
92
94
96
98
100
102
2008Q1 2009Q1 2010Q1 2011Q1 2012Q1
(index) Euro Area FranceGermany ItalySpain
W:\Obm.admin\OBM.ADMIN‐EPF\OBM.ADMIN‐EPF‐Desktop_Publishing\2012_Economy_Publications\5_Economic‐Outlook_2013\Text_Files_sourceDocs\External_Budget_Charts_KM.xlsx / 16) EuroCrisis Last printed: 2/20/2013 / 4:36 PM
90
92
94
96
98
100
102
2008Q1 2009Q1 2010Q1 2011Q1 2012Q1
(index) Euro Area FranceGermany ItalySpain
90
92
94
96
98
100
102
2008Q1 2009Q1 2010Q1 2011Q1 2012Q1
(index) Euro Area FranceGermany ItalySpain
Source: Institut National de la Statistique/Economique, Eurostat, ELSTAT, Istituto Peripheral Europe has yet to recover 2007 levels of outputGrowth since 2007q1
EO13_chrt_16_rgdp.pdf
W:\Obm.admin\OBM.ADMIN‐EPF\OBM.ADMIN‐EPF‐Desktop_Publishing\2012_Economy_Publications\5_Economic‐Outlook_2013\Text_Files_sourceDocs\External_Budget_Charts_KM.xlsx / 16) EuroCrisis Last printed: 2/20/2013 / 4:36 PM
Chart 15: An era of public debt and fiscal restraintGroup of Seven (G7) Government Expenditures to GDP (per cent)
PDF named: EO13_chrt_15_gctrgdp.pdf
2013 BudgetEconomic Chapter
An era of public debt and fiscal restraint
G7 Government expenditures to GDP (per cent)
Source: Statistics Canada, BLS, Eurostat, TBF calculations
EO13_chrt_15_gctrgdp.pdf
40
41
42
43
44
45
46
2008 2009 2010 2011 2012e 2013f 2014f 2015f
(%)
W:\Obm.admin\OBM.ADMIN‐EPF\OBM.ADMIN‐EPF‐Desktop_Publishing\2012_Economy_Publications\5_Economic‐Outlook_2013\Text_Files_sourceDocs\External_Budget_Charts_KM.xlsx / 15)Fiscal Restraint Last printed: 2/26/2013/ 1:51 PMW:\Obm.admin\OBM.ADMIN‐EPF\OBM.ADMIN‐EPF‐Desktop_Publishing\2012_Economy_Publications\5_Economic‐Outlook_2013\Text_Files_sourceDocs\External_Budget_Charts_KM.xlsx / 15)Fiscal Restraint Last printed: 2/26/2013/ 1:51 PM
94 ECONOMIC OUTLOOK • FISCAL PLAN 2013–16 #buildingAlberta
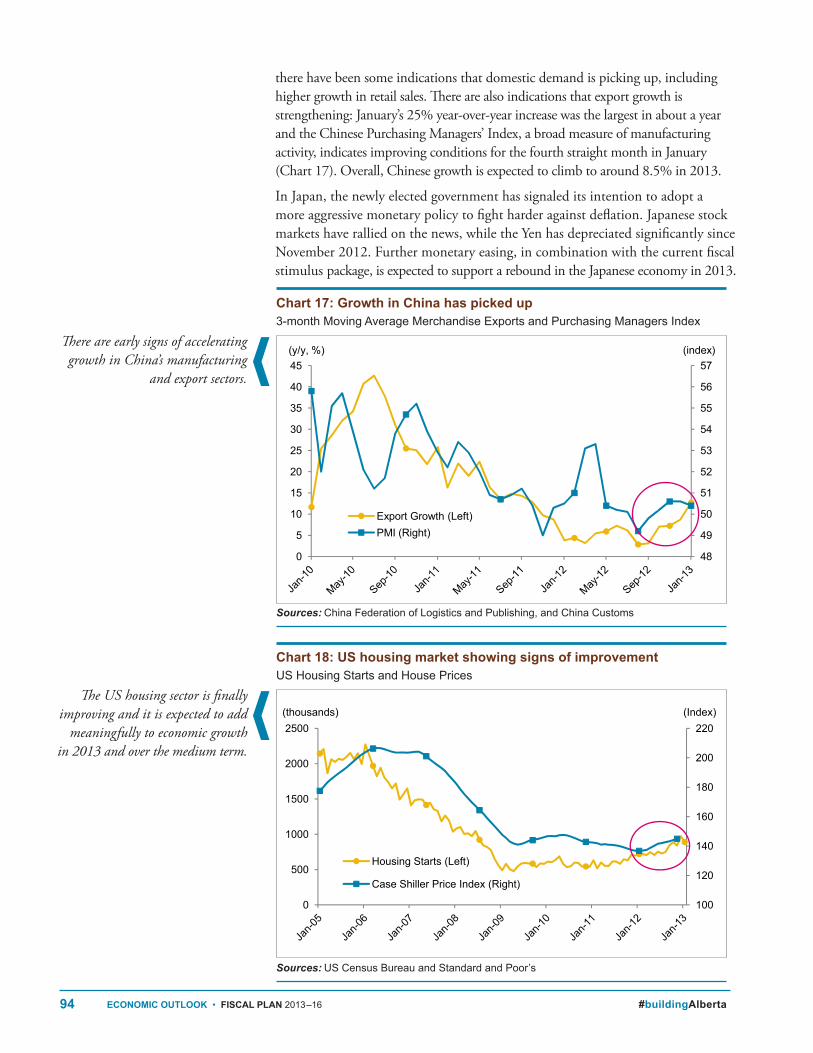
Sources: China Federation of Logistics and Publishing, and China Customs
Sources: US Census Bureau and Standard and Poor’s
there have been some indications that domestic demand is picking up, including higher growth in retail sales . There are also indications that export growth is strengthening: January’s 25% year-over-year increase was the largest in about a year and the Chinese Purchasing Managers’ Index, a broad measure of manufacturing activity, indicates improving conditions for the fourth straight month in January (Chart 17) . Overall, Chinese growth is expected to climb to around 8 .5% in 2013 .
In Japan, the newly elected government has signaled its intention to adopt a more aggressive monetary policy to fight harder against deflation . Japanese stock markets have rallied on the news, while the Yen has depreciated significantly since November 2012 . Further monetary easing, in combination with the current fiscal stimulus package, is expected to support a rebound in the Japanese economy in 2013 .
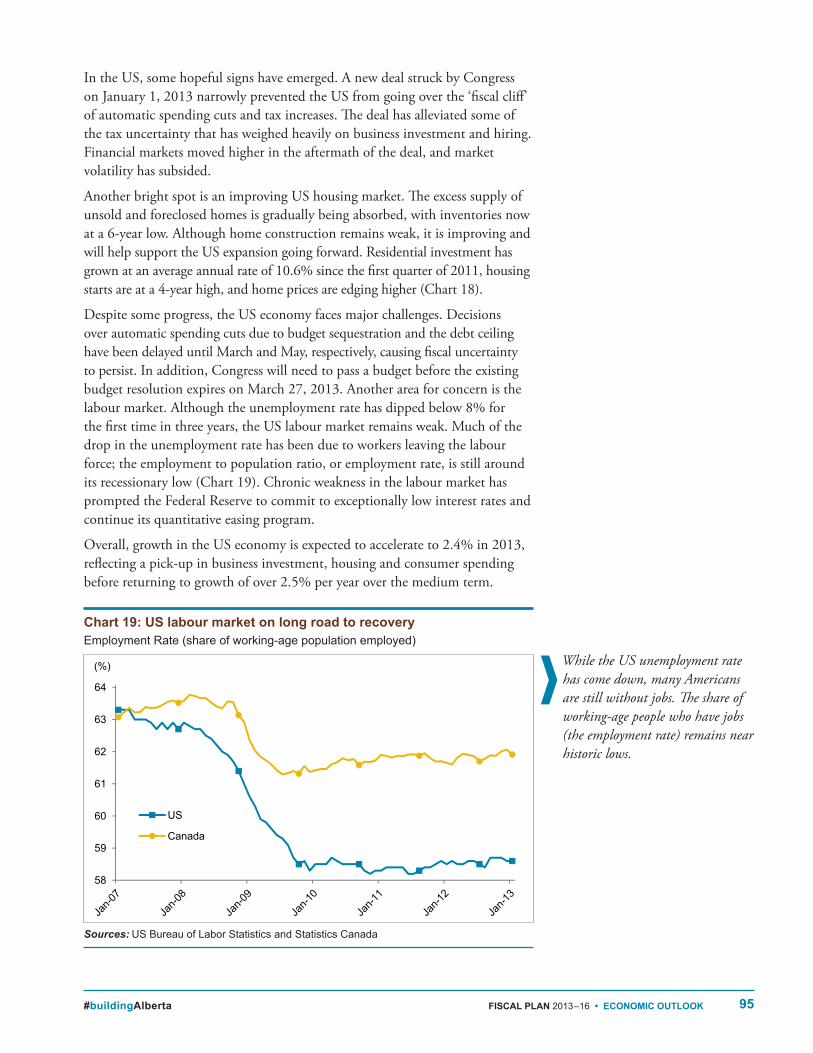
The US housing sector is finally improving and it is expected to add
meaningfully to economic growth in 2013 and over the medium term.
There are early signs of accelerating growth in China’s manufacturing
and export sectors.
Chart 18: US housing market showing signs of improvementUS Housing Starts and House Prices
PDF named:EO13_chrt_18_ushsahp.pdf
Budget 2013Economic Chapter
US Housing market starting to show signs of recoveryUS housing starts and house prices
100
120
140
160
180
200
220
0
500
1000
1500
2000
2500
Housing Starts (Left)
Case Shiller Price Index (Right)
(Index)(thousands)
W:\Obm.admin\OBM.ADMIN‐EPF\OBM.ADMIN‐EPF‐Desktop_Publishing\2012_Economy_Publications\5_Economic‐Outlook_2013\Text_Files_sourceDocs\External_Budget_Charts_KM.xlsx/18)USHousing last printe: 2/25/2013 /4:01 PM
100
120
140
160
180
200
220
0
500
1000
1500
2000
2500
Housing Starts (Left)
Case Shiller Price Index (Right)
(Index)(thousands)
100
120
140
160
180
200
220
0
500
1000
1500
2000
2500
Housing Starts (Left)
Case Shiller Price Index (Right)
(Index)(thousands)
Source: Census Bureau, Standard and Poor's
EO13_chrt_18_ushsahp.pdf
W:\Obm.admin\OBM.ADMIN‐EPF\OBM.ADMIN‐EPF‐Desktop_Publishing\2012_Economy_Publications\5_Economic‐Outlook_2013\Text_Files_sourceDocs\External_Budget_Charts_KM.xlsx/18)USHousing last printe: 2/25/2013 /4:01 PM
Chart 17: Growth in China has picked up3‑month Moving Average Merchandise Exports and Purchasing Managers Index
PDF name: EO13_chrt_17_gichpu_KM.pdf EO Budget 2013
Growth in China has picked up3‐mo. Moving Average Merchandise Exports and purchasing managers' index
Source: China Federation of Logistics and Publishing / China Customs
EO13_chrt_17_gichpu_KM.pdf
48
49
50
51
52
53
54
55
56
57
0
5
10
15
20
25
30
35
40
45
Export Growth (Left)PMI (Right)
a
(y/y, %) (index)
W:\Obm.admin\OBM.ADMIN‐EPF\OBM.ADMIN‐EPF‐Desktop_Publishing\2012_Economy_Publications\5_Economic‐Outlook_2013\Text_Files_sourceDocs\External_Budget_Charts_KM.xlsx
2/21/2013: 4:18 PMW:\Obm.admin\OBM.ADMIN‐EPF\OBM.ADMIN‐EPF‐Desktop_Publishing\2012_Economy_Publications\5_Economic‐Outlook_2013\Text_Files_sourceDocs\External_Budget_Charts_KM.xlsx
2/21/2013: 4:18 PM
95#buildingAlberta FISCAL PLAN 2013–16 • ECONOMIC OUTLOOK
Sources: US Bureau of Labor Statistics and Statistics Canada
In the US, some hopeful signs have emerged . A new deal struck by Congress on January 1, 2013 narrowly prevented the US from going over the ‘fiscal cliff’ of automatic spending cuts and tax increases . The deal has alleviated some of the tax uncertainty that has weighed heavily on business investment and hiring . Financial markets moved higher in the aftermath of the deal, and market volatility has subsided .
Another bright spot is an improving US housing market . The excess supply of unsold and foreclosed homes is gradually being absorbed, with inventories now at a 6-year low . Although home construction remains weak, it is improving and will help support the US expansion going forward . Residential investment has grown at an average annual rate of 10 .6% since the first quarter of 2011, housing starts are at a 4-year high, and home prices are edging higher (Chart 18) .
Despite some progress, the US economy faces major challenges . Decisions over automatic spending cuts due to budget sequestration and the debt ceiling have been delayed until March and May, respectively, causing fiscal uncertainty to persist . In addition, Congress will need to pass a budget before the existing budget resolution expires on March 27, 2013 . Another area for concern is the labour market . Although the unemployment rate has dipped below 8% for the first time in three years, the US labour market remains weak . Much of the drop in the unemployment rate has been due to workers leaving the labour force; the employment to population ratio, or employment rate, is still around its recessionary low (Chart 19) . Chronic weakness in the labour market has prompted the Federal Reserve to commit to exceptionally low interest rates and continue its quantitative easing program .
Overall, growth in the US economy is expected to accelerate to 2 .4% in 2013, reflecting a pick-up in business investment, housing and consumer spending before returning to growth of over 2 .5% per year over the medium term .
While the US unemployment rate has come down, many Americans are still without jobs. The share of working-age people who have jobs (the employment rate) remains near historic lows.
Chart 19: US labour market on long road to recoveryEmployment Rate (share of working‑age population employed)
PDF named: EO13_chrt_19_er.pdf Budget 2013Economic Chapter
US labour market Remains weakEmployment Rate
58
59
60
61
62
63
64
(%)
US
Canada
W:\Obm.admin\OBM.ADMIN‐EPF\OBM.ADMIN‐EPF‐Desktop_Publishing\2012_Economy_Publications\5_Economic‐Outlook_2013\Text_Files_sourceDocs\External_Budget_Charts_KM.xlsx/19) US labour Market last printed: 2/20/2013/3:44 PM
58
59
60
61
62
63
64
(%)
US
Canada
58
59
60
61
62
63
64
(%)
US
Canada
Source: BLS, Statistics Canada
EO13_chrt_19_er.pdf
W:\Obm.admin\OBM.ADMIN‐EPF\OBM.ADMIN‐EPF‐Desktop_Publishing\2012_Economy_Publications\5_Economic‐Outlook_2013\Text_Files_sourceDocs\External_Budget_Charts_KM.xlsx/19) US labour Market last printed: 2/20/2013/3:44 PM
96 ECONOMIC OUTLOOK • FISCAL PLAN 2013–16 #buildingAlberta
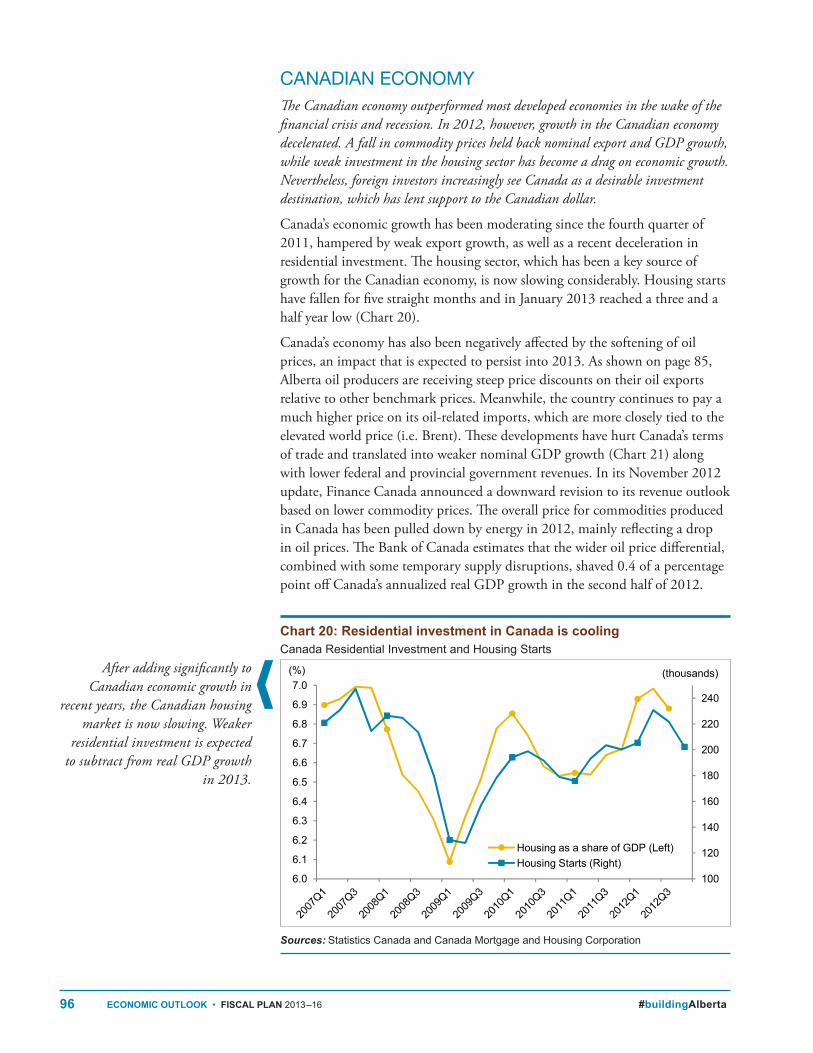
Sources: Statistics Canada and Canada Mortgage and Housing Corporation
CANADIAN ECONOMYThe Canadian economy outperformed most developed economies in the wake of the financial crisis and recession. In 2012, however, growth in the Canadian economy decelerated. A fall in commodity prices held back nominal export and GDP growth, while weak investment in the housing sector has become a drag on economic growth. Nevertheless, foreign investors increasingly see Canada as a desirable investment destination, which has lent support to the Canadian dollar.
Canada’s economic growth has been moderating since the fourth quarter of 2011, hampered by weak export growth, as well as a recent deceleration in residential investment . The housing sector, which has been a key source of growth for the Canadian economy, is now slowing considerably . Housing starts have fallen for five straight months and in January 2013 reached a three and a half year low (Chart 20) .
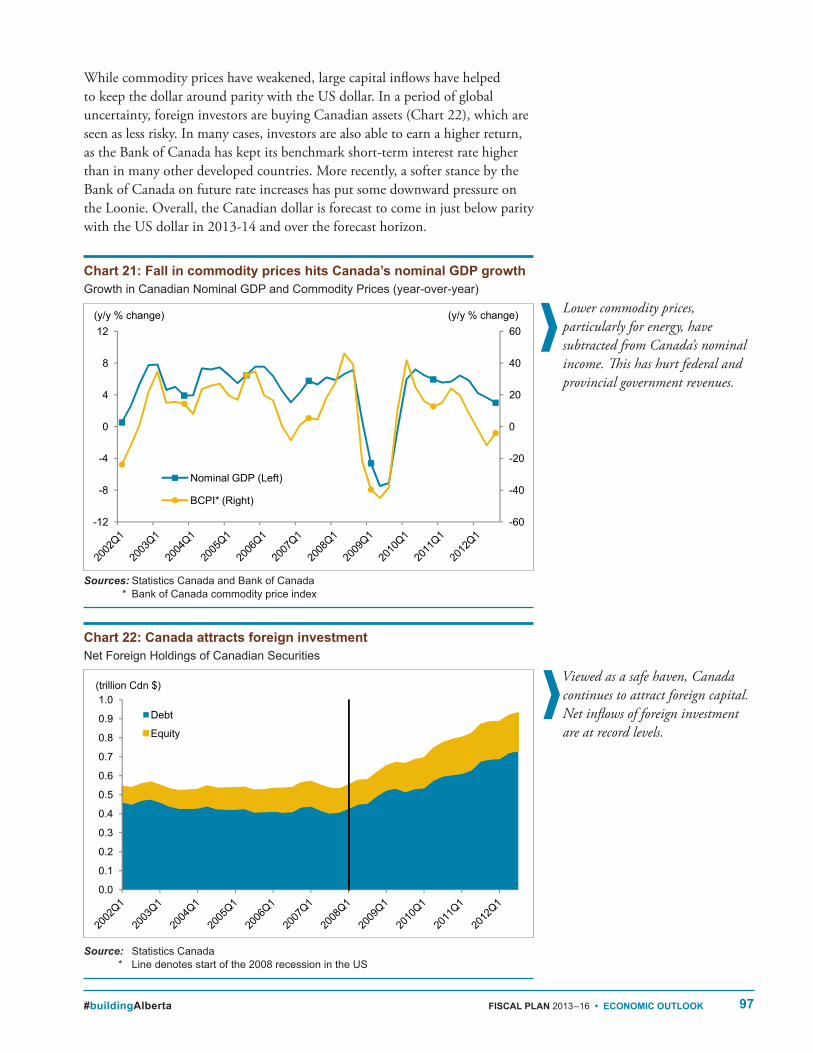
Canada’s economy has also been negatively affected by the softening of oil prices, an impact that is expected to persist into 2013 . As shown on page 85, Alberta oil producers are receiving steep price discounts on their oil exports relative to other benchmark prices . Meanwhile, the country continues to pay a much higher price on its oil-related imports, which are more closely tied to the elevated world price (i .e . Brent) . These developments have hurt Canada’s terms of trade and translated into weaker nominal GDP growth (Chart 21) along with lower federal and provincial government revenues . In its November 2012 update, Finance Canada announced a downward revision to its revenue outlook based on lower commodity prices . The overall price for commodities produced in Canada has been pulled down by energy in 2012, mainly reflecting a drop in oil prices . The Bank of Canada estimates that the wider oil price differential, combined with some temporary supply disruptions, shaved 0 .4 of a percentage point off Canada’s annualized real GDP growth in the second half of 2012 .
After adding significantly to Canadian economic growth in
recent years, the Canadian housing market is now slowing. Weaker
residential investment is expected to subtract from real GDP growth
in 2013.
Chart 20: Residential investment in Canada is cooling Canada Residential Investment and Housing Starts
chart 20: Residential investment in Canada is cooling Canada Residential Investment and Housing Starts
Source: Statistics Canada and CMHC
EO13_chrt_20_riicic.pdf
100
120
140
160
180
200
220
240
6.0
6.1
6.2
6.3
6.4
6.5
6.6
6.7
6.8
6.9
7.0(thousands)(%)
Housing as a share of GDP (Left)Housing Starts (Right)
97#buildingAlberta FISCAL PLAN 2013–16 • ECONOMIC OUTLOOK
Sources: Statistics Canada and Bank of Canada * Bank of Canada commodity price index
Source: Statistics Canada * Line denotes start of the 2008 recession in the US
While commodity prices have weakened, large capital inflows have helped to keep the dollar around parity with the US dollar . In a period of global uncertainty, foreign investors are buying Canadian assets (Chart 22), which are seen as less risky . In many cases, investors are also able to earn a higher return, as the Bank of Canada has kept its benchmark short-term interest rate higher than in many other developed countries . More recently, a softer stance by the Bank of Canada on future rate increases has put some downward pressure on the Loonie . Overall, the Canadian dollar is forecast to come in just below parity with the US dollar in 2013-14 and over the forecast horizon .
Lower commodity prices, particularly for energy, have subtracted from Canada’s nominal income. This has hurt federal and provincial government revenues.
Viewed as a safe haven, Canada continues to attract foreign capital. Net inflows of foreign investment are at record levels.
Chart 21: Fall in commodity prices hits Canada’s nominal GDP growthGrowth in Canadian Nominal GDP and Commodity Prices (year‑over‑year)
PDF named:EO13_chrt_21_gicngacp.pdf
Budget 2013Economic Chapter
Nominal income has slowed due to terms of trade effects
Growth in Canadian nominal GDP and commodity prices
*Bank of Canada commodity price index
Source: Statistics Canada / Bank of Canada
EO13_chrt_21_gicngacp.pdf
-60
-40
-20
0
20
40
60
-12
-8
-4
0
4
8
12(y/y % change)(y/y % change)
Nominal GDP (Left)
BCPI* (Right)
W:\Obm.admin\OBM.ADMIN‐EPF\OBM.ADMIN‐EPF‐Desktop_Publishing\2012_Economy_Publications\5_Economic‐Outlook_2013\Text_Files_sourceDocs\External_Budget_Charts_KM.xlsx/21)TermsOfTrade last printed: 2/21/2013 /4:28 PMW:\Obm.admin\OBM.ADMIN‐EPF\OBM.ADMIN‐EPF‐Desktop_Publishing\2012_Economy_Publications\5_Economic‐Outlook_2013\Text_Files_sourceDocs\External_Budget_Charts_KM.xlsx/21)TermsOfTrade last printed: 2/21/2013 /4:28 PM
Chart 22: Canada attracts foreign investmentNet Foreign Holdings of Canadian Securities
PDF named: EO13_chrt_22_ciip.pdf Budget 2013Economic Chapter
Canada attracts foreign investmentNet foreign holdings of Canadian securities
0.0
0.1
0.2
0.3
0.4
0.5
0.6
0.7
0.8
0.9
1.0(trillion Cdn $)
Debt
Equity
W:\Obm.admin\OBM.ADMIN‐EPF\OBM.ADMIN‐EPF‐Desktop_Publishing\2012_Economy_Publications\5_Economic‐Outlook_2013\Text_Files_sourceDocs\External_Budget_Charts_KM.xlsx/22)Safe Haven last printedL 2/21/2013/ 4:30 PM
0.0
0.1
0.2
0.3
0.4
0.5
0.6
0.7
0.8
0.9
1.0(trillion Cdn $)
Debt
Equity
0.0
0.1
0.2
0.3
0.4
0.5
0.6
0.7
0.8
0.9
1.0(trillion Cdn $)
Debt
Equity
Source: Statistics Canada*Line denotes start of the 2008 recession in the US
EO13_chrt_22_ciip.pdf
W:\Obm.admin\OBM.ADMIN‐EPF\OBM.ADMIN‐EPF‐Desktop_Publishing\2012_Economy_Publications\5_Economic‐Outlook_2013\Text_Files_sourceDocs\External_Budget_Charts_KM.xlsx/22)Safe Haven last printedL 2/21/2013/ 4:30 PM
98 ECONOMIC OUTLOOK • FISCAL PLAN 2013–16 #buildingAlberta
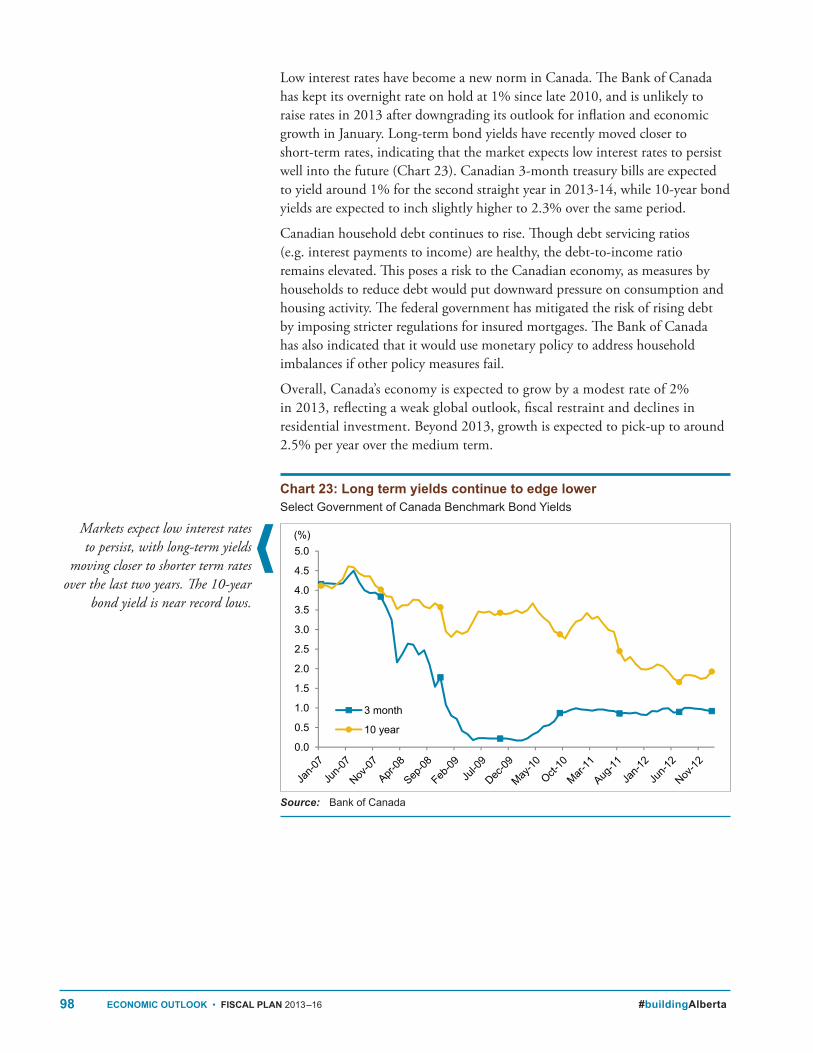
Markets expect low interest rates to persist, with long-term yields
moving closer to shorter term rates over the last two years. The 10-year
bond yield is near record lows.
Low interest rates have become a new norm in Canada . The Bank of Canada has kept its overnight rate on hold at 1% since late 2010, and is unlikely to raise rates in 2013 after downgrading its outlook for inflation and economic growth in January . Long-term bond yields have recently moved closer to short-term rates, indicating that the market expects low interest rates to persist well into the future (Chart 23) . Canadian 3-month treasury bills are expected to yield around 1% for the second straight year in 2013-14, while 10-year bond yields are expected to inch slightly higher to 2 .3% over the same period .
Canadian household debt continues to rise . Though debt servicing ratios (e .g . interest payments to income) are healthy, the debt-to-income ratio remains elevated . This poses a risk to the Canadian economy, as measures by households to reduce debt would put downward pressure on consumption and housing activity . The federal government has mitigated the risk of rising debt by imposing stricter regulations for insured mortgages . The Bank of Canada has also indicated that it would use monetary policy to address household imbalances if other policy measures fail .
Overall, Canada’s economy is expected to grow by a modest rate of 2% in 2013, reflecting a weak global outlook, fiscal restraint and declines in residential investment . Beyond 2013, growth is expected to pick-up to around 2 .5% per year over the medium term .
Chart 23: Long term yields continue to edge lowerSelect Government of Canada Benchmark Bond Yields
Long term yields continue to edge lowerSelect Government of Canada benchmark bond yields
0.0
0.5
1.0
1.5
2.0
2.5
3.0
3.5
4.0
4.5
5.0(%)
3 month
10 year0.0
0.5
1.0
1.5
2.0
2.5
3.0
3.5
4.0
4.5
5.0(%)
3 month
10 year0.0
0.5
1.0
1.5
2.0
2.5
3.0
3.5
4.0
4.5
5.0(%)
3 month
10 year
Source: Bank of Canada
EO13_chrt_23_ciip.pdf
Source: Bank of Canada
99#buildingAlberta FISCAL PLAN 2013–16 • ECONOMIC OUTLOOK
SUMMARYThe global economy is expected to remain weak in 2013 . Despite some tentative signs of improvement, global economic growth will continue to be held back by the recession in Europe and uncertainty over future policy actions . The Canadian economy is expected to see another year of a modest growth due to a weak global outlook, a slowdown in the housing market, and fiscal restraint .
In a sluggish global economy, Alberta’s economy has performed very well . Growth is expected to ease to 2 .9% in 2013, which mainly reflects weaker market conditions for the oil industry, particularly the negative impact of pipeline constraints on the price of oil produced in Alberta .
RISKS TO THE ECONOMIC OUTLOOKF Failure to approve new pipeline projects, which would further dampen oil
prices and hurt growth prospects for the oil industry .
F Rising supply of oil in the US and in other regions could put more downward pressure on oil prices than expected .
F A deepening of the Eurozone economic recession, and the possibility that the recession could spill over to other major European economies .
F In the US, the fiscal situation remains uncertain, and fiscal restraint could lead to a larger-than-expected drag on the US economy .
F An improvement in emerging market growth could be jeopardized by another flare up in the Eurozone debt crisis or a deceleration in domestic demand . As a growing source of global energy demand, a slowdown in emerging markets would weigh on commodity prices .
F On the upside, a number of factors could lead to stronger-than-forecast economic growth in Alberta . These include an immediate easing of pipeline bottlenecks, a stronger than expected pick-up in emerging market growth, as well as significant steps towards a resolution to Eurozone economic woes and the US fiscal situation .

100
BLANK PAGE

101#buildingAlberta FISCAL PLAN 2013–16 • ECONOMIC OUTLOOK
G ANNEX
102 ECONOMIC OUTLOOK • FISCAL PLAN 2013–16 #buildingAlberta
BENCHMARKING TABLES
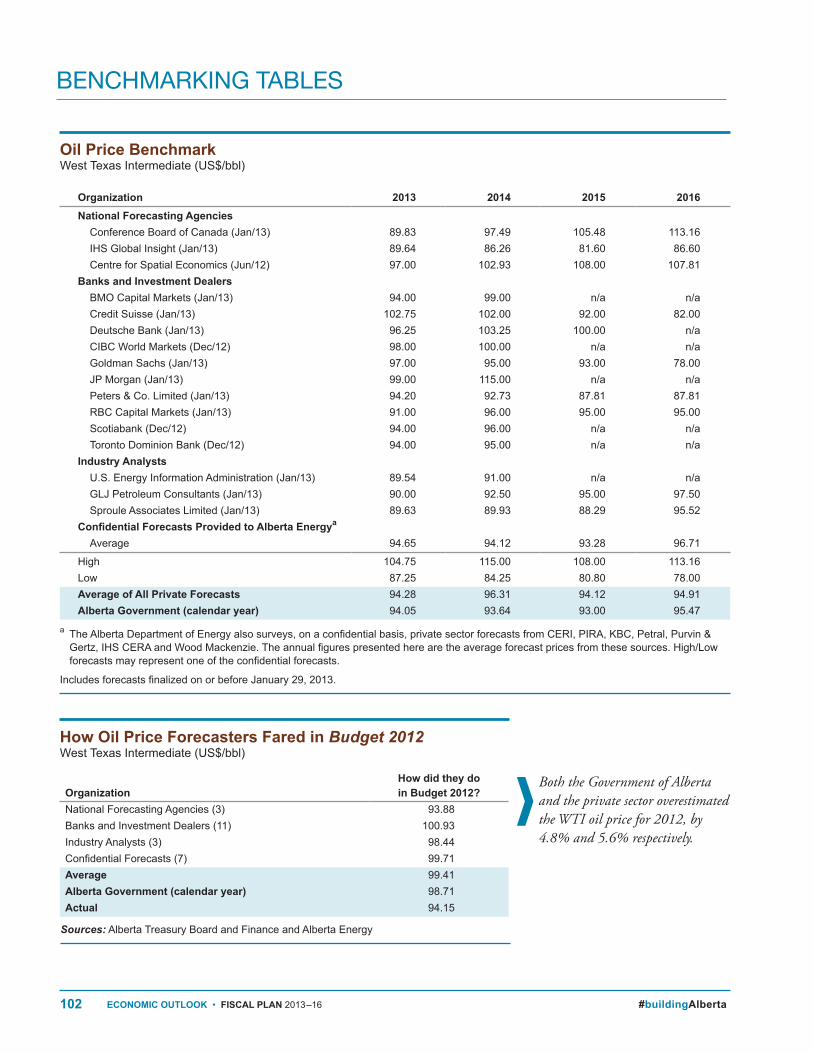
Both the Government of Alberta and the private sector overestimated the WTI oil price for 2012, by 4.8% and 5.6% respectively.
Oil Price BenchmarkWest Texas Intermediate (US$/bbl)
a The Alberta Department of Energy also surveys, on a confidential basis, private sector forecasts from CERI, PIRA, KBC, Petral, Purvin & Gertz, IHS CERA and Wood Mackenzie. The annual figures presented here are the average forecast prices from these sources. High/Low forecasts may represent one of the confidential forecasts.
Includes forecasts finalized on or before January 29, 2013.
How Oil Price Forecasters Fared in Budget 2012West Texas Intermediate (US$/bbl)
Sources: Alberta Treasury Board and Finance and Alberta Energy
OrganizationHow did they do in Budget 2012?
National Forecasting Agencies (3) 93.88Banks and Investment Dealers (11) 100.93Industry Analysts (3) 98.44Confidential Forecasts (7) 99.71Average 99.41Alberta Government (calendar year) 98.71Actual 94.15
Organization 2013 2014 2015 2016National Forecasting Agencies
Conference Board of Canada (Jan/13) 89.83 97.49 105.48 113.16IHS Global Insight (Jan/13) 89.64 86.26 81.60 86.60Centre for Spatial Economics (Jun/12) 97.00 102.93 108.00 107.81
Banks and Investment DealersBMO Capital Markets (Jan/13) 94.00 99.00 n/a n/aCredit Suisse (Jan/13) 102.75 102.00 92.00 82.00Deutsche Bank (Jan/13) 96.25 103.25 100.00 n/aCIBC World Markets (Dec/12) 98.00 100.00 n/a n/aGoldman Sachs (Jan/13) 97.00 95.00 93.00 78.00JP Morgan (Jan/13) 99.00 115.00 n/a n/aPeters & Co. Limited (Jan/13) 94.20 92.73 87.81 87.81RBC Capital Markets (Jan/13) 91.00 96.00 95.00 95.00Scotiabank (Dec/12) 94.00 96.00 n/a n/aToronto Dominion Bank (Dec/12) 94.00 95.00 n/a n/a
Industry AnalystsU.S. Energy Information Administration (Jan/13) 89.54 91.00 n/a n/aGLJ Petroleum Consultants (Jan/13) 90.00 92.50 95.00 97.50Sproule Associates Limited (Jan/13) 89.63 89.93 88.29 95.52
Confidential Forecasts Provided to Alberta Energya
Average 94.65 94.12 93.28 96.71
High 104.75 115.00 108.00 113.16Low 87.25 84.25 80.80 78.00Average of All Private Forecasts 94.28 96.31 94.12 94.91Alberta Government (calendar year) 94.05 93.64 93.00 95.47
103#buildingAlberta FISCAL PLAN 2013–16 • ECONOMIC OUTLOOK
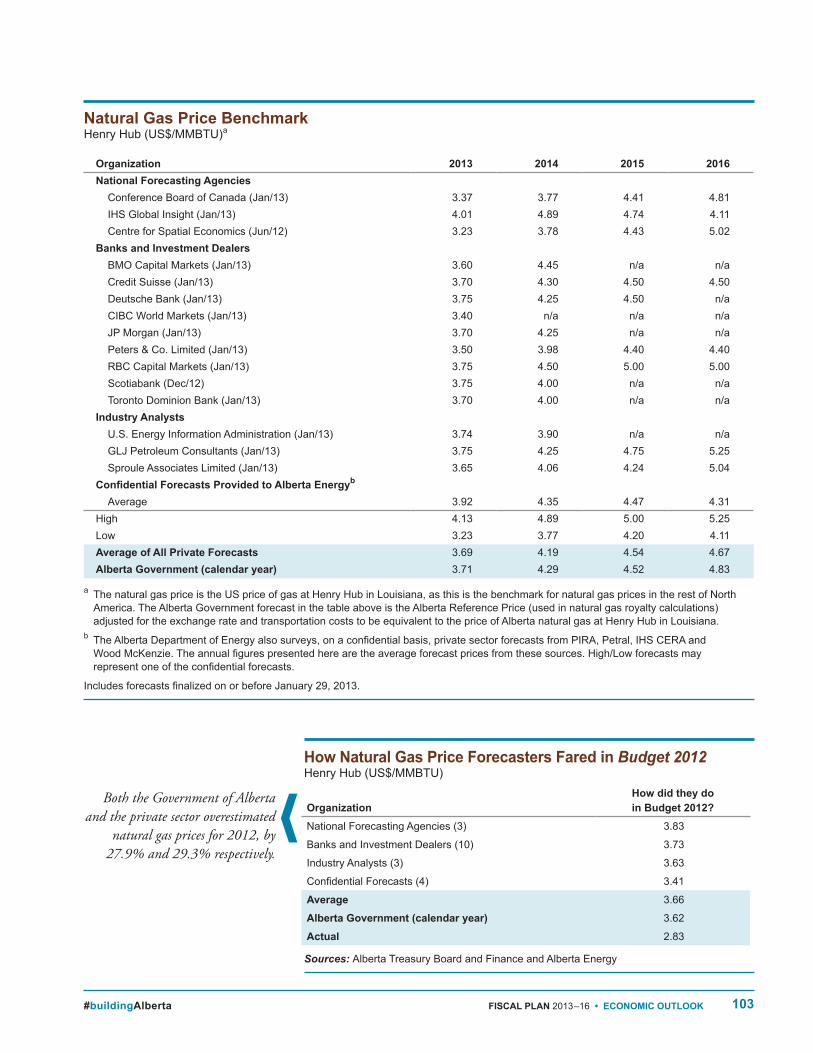
Both the Government of Alberta and the private sector overestimated
natural gas prices for 2012, by 27.9% and 29.3% respectively.
Natural Gas Price BenchmarkHenry Hub (US$/MMBTU)a
How Natural Gas Price Forecasters Fared in Budget 2012Henry Hub (US$/MMBTU)
Sources: Alberta Treasury Board and Finance and Alberta Energy
a The natural gas price is the US price of gas at Henry Hub in Louisiana, as this is the benchmark for natural gas prices in the rest of North America. The Alberta Government forecast in the table above is the Alberta Reference Price (used in natural gas royalty calculations) adjusted for the exchange rate and transportation costs to be equivalent to the price of Alberta natural gas at Henry Hub in Louisiana.
b The Alberta Department of Energy also surveys, on a confidential basis, private sector forecasts from PIRA, Petral, IHS CERA and Wood McKenzie. The annual figures presented here are the average forecast prices from these sources. High/Low forecasts may represent one of the confidential forecasts.
Includes forecasts finalized on or before January 29, 2013.
Organization 2013 2014 2015 2016National Forecasting Agencies
Conference Board of Canada (Jan/13) 3.37 3.77 4.41 4.81IHS Global Insight (Jan/13) 4.01 4.89 4.74 4.11Centre for Spatial Economics (Jun/12) 3.23 3.78 4.43 5.02
Banks and Investment DealersBMO Capital Markets (Jan/13) 3.60 4.45 n/a n/aCredit Suisse (Jan/13) 3.70 4.30 4.50 4.50Deutsche Bank (Jan/13) 3.75 4.25 4.50 n/aCIBC World Markets (Jan/13) 3.40 n/a n/a n/aJP Morgan (Jan/13) 3.70 4.25 n/a n/aPeters & Co. Limited (Jan/13) 3.50 3.98 4.40 4.40RBC Capital Markets (Jan/13) 3.75 4.50 5.00 5.00Scotiabank (Dec/12) 3.75 4.00 n/a n/aToronto Dominion Bank (Jan/13) 3.70 4.00 n/a n/a
Industry AnalystsU.S. Energy Information Administration (Jan/13) 3.74 3.90 n/a n/aGLJ Petroleum Consultants (Jan/13) 3.75 4.25 4.75 5.25Sproule Associates Limited (Jan/13) 3.65 4.06 4.24 5.04
Confidential Forecasts Provided to Alberta Energyb
Average 3.92 4.35 4.47 4.31High 4.13 4.89 5.00 5.25Low 3.23 3.77 4.20 4.11Average of All Private Forecasts 3.69 4.19 4.54 4.67Alberta Government (calendar year) 3.71 4.29 4.52 4.83
OrganizationHow did they do in Budget 2012?
National Forecasting Agencies (3) 3.83
Banks and Investment Dealers (10) 3.73
Industry Analysts (3) 3.63
Confidential Forecasts (4) 3.41
Average 3.66
Alberta Government (calendar year) 3.62
Actual 2.83
104 ECONOMIC OUTLOOK • FISCAL PLAN 2013–16 #buildingAlberta
Organization 2013 2014 2015 2016National Forecasting Agencies
Conference Board of Canada (Jan/13) 1.03 1.57 2.43 3.42
IHS Global Insight (Jan/13) 1.04 1.81 2.91 3.88
Centre for Spatial Economics (Jun/12) 1.10 2.50 2.90 3.80
BanksBMO Capital Markets (Jan/13) 0.92 1.21 n/a n/a
CIBC World Markets (Jan/13) 1.01 1.65 n/a n/a
RBC Royal Bank (Jan/13) 1.23 1.88 n/a n/a
Scotiabank (Dec/12) 1.03 1.76 n/a n/a
Toronto Dominion Bank (Jan/13) 1.23 1.75 n/a n/a
Laurentian Bank (Jan/13) 1.01 1.98 n/a n/a
High 1.23 2.50 2.91 3.88
Low 0.92 1.21 2.43 3.42
Average of All Private Forecasts 1.07 1.79 2.75 3.70
Alberta Government (calendar year) 1.00 1.40 2.40 3.35
2013 2014 2015 2016Average of All Private Forecastsa 27% 23% 19% 17%
Alberta Government (calendar year) 29% 24% 19% 17%
Organization 2013 2014 2015 2016National Forecasting Agencies
Conference Board of Canada (Jan/13) 1.77 2.02 2.54 3.24
IHS Global Insight (Jan/13) 2.16 2.75 3.17 4.04
Centre for Spatial Economics (Jun/12) 3.10 4.00 4.80 5.30
BanksBMO Capital Markets (Jan/12) 2.05 2.80 n/a n/a
CIBC World Markets (Jan/12) 2.38 2.75 n/a n/a
RBC Royal Bank (Dec/12) 2.20 2.94 n/a n/a
Scotiabank (Dec/12) 2.06 2.95 n/a n/a
Toronto Dominion Bank (Jan/13) 2.08 2.59 n/a n/a
Laurentian Bank (Jan/13) 2.39 3.39 n/a n/a
High 3.10 4.00 4.80 5.30
Low 1.77 2.02 2.54 3.24
Average of All Private Forecasts 2.24 2.91 3.50 4.19
Alberta Government (calendar year) 2.20 2.90 3.90 4.20
Canadian Short‑Term Interest Rate Benchmark3‑month Government of Canada Treasury Bills (per cent)
Light‑Heavy Oil Price Differential Benchmark (per cent)
Includes forecasts finalized on or before January 29, 2013.
a Alberta Energy surveyed the following forecasters of the light heavy differential: PIRA, KBC, IHS CERA, Purvin & Gertz , Peters & Co Ltd, CIBC World Markets Sproule Associates Limited, GLJ Petroleum Consultants.
Canadian Long‑Term Interest Rate Benchmark10‑Year Government of Canada Bonds (per cent)
Includes forecasts finalized on or before January 29, 2013.
105#buildingAlberta FISCAL PLAN 2013–16 • ECONOMIC OUTLOOK
Alberta Real Gross Domestic Product Benchmark(per cent change)
Includes forecasts finalized on or before January 29, 2013.
Canada / United States Exchange Rate Benchmark(US¢/Cdn$)
Includes forecasts finalized on or before January 29, 2013.
Organization 2012 2013 2014 2015 2016National Forecasting Agencies
Conference Board of Canada (Jan/13) 3.4 3.0 3.3 2.9 2.3
IHS Global Insight (Jan/13) 3.1 2.5 2.8 2.9 2.8
Centre for Spatial Economics (Jun/12) 3.5 3.2 2.1 2.2 2.4
BanksBMO Capital Markets (Jan/13) 3.4 2.7 3.1 n/a n/a
CIBC World Markets (Jan/13) 3.4 2.3 2.8 n/a n/a
RBC Royal Bank (Dec/12) 3.8 3.5 4.2 n/a n/a
Scotiabank (Dec/12) 3.4 2.7 3.1 n/a n/a
Toronto Dominion Bank (Dec/12) 3.1 2.5 3.2 n/a n/a
Laurentian Bank (Oct/12) 3.2 3.0 n/a n/a n/a
Other
Canada Mortgage and Housing Corporation (Jan/13) 3.2 2.9 n/a n/a n/a
High 3.8 3.5 4.2 2.9 2.8
Low 3.1 2.3 2.1 2.2 2.3
Average of All Private Forecasts 3.4 2.8 3.1 2.6 2.5
Alberta Government (calendar year) 3.8 2.9 2.9 2.8 2.9
Organization 2013 2014 2015 2016National Forecasting Agencies
Conference Board of Canada (Jan/13) 97.0 95.8 96.3 98.5
IHS Global Insight (Jan/13) 99.1 95.0 92.2 91.2
Centre for Spatial Economics (Jun/12) 96.6 95.2 94.7 94.7
BanksBMO Capital Markets (Jan/13) 100.8 103.2 n/a n/a
CIBC World Markets (Jan/13) 99.5 103.5 n/a n/a
RBC Royal Bank (Jan/13) 102.8 105.3 n/a n/a
Scotiabank (Dec/12) 103.5 105.5 n/a n/a
Toronto Dominion Bank (Dec/12) 99.3 102.5 n/a n/a
Laurentian Bank (Jan/13) 99.5 96.0 n/a n/a
High 103.5 105.5 96.3 98.5
Low 96.6 95.0 92.2 91.2
Average of All Private Forecasts 99.8 100.2 94.4 94.8
Alberta Government (calendar year) 99.1 99.0 99.0 99.0
106 ECONOMIC OUTLOOK • FISCAL PLAN 2013–16 #buildingAlberta
Organization 2012 2013 2014 2015 2016Conference Board of Canada* (Jan/13) 0.0 4.5 5.7 6.6 3.8IHS Global Insight (Jan/13) ‑1.6 5.7 1.5 3.3 2.9Centre for Spatial Economics* (Jun/12) ‑1.8 ‑1.3 15.1 10.5 4.7Toronto Dominion Bank (not supplied) n/a n/a n/a n/a n/a
High 0.0 5.7 15.1 10.5 4.7Low ‑1.8 ‑1.3 1.5 3.3 2.9Average of All Private Forecasts ‑1.1 3.0 5.6 6.8 3.8Alberta Government (calendar year) ‑6.6 5.9 10.3 7.5 9.8
Organization 2012 2013 2014 2015 2016Conference Board of Canada* (Jan/13) 6.3 4.8 5.3 5.2 4.9IHS Global Insight (Jan/13) 5.5 4.5 4.8 4.8 4.4Centre for Spatial Economics* (Jun/12) 6.1 5.2 3.8 4.1 4.3Toronto Dominion Bank* (Dec/12) 5.5 4.7 6.1 n/a n/a
High 6.3 5.2 6.1 5.2 4.9Low 5.5 4.5 3.8 4.1 4.3Average of All Private Forecasts 5.9 4.8 5.0 4.7 4.5Alberta Government (calendar year) 7.3 5.4 5.2 5.3 5.3
Organization 2013 2014 2015 2016National Forecasting Agencies
Conference Board of Canada (Jan/13) 29.9 30.2 30.6 30.0IHS Global Insight (Jan/13) 33.2 32.0 31.8 31.6Centre for Spatial Economics (Jun/12) 35.5 35.3 34.5 31.5
BanksBMO Capital Markets (Jan/13) 32.5 32.5 n/a n/aCIBC World Markets (Jan/13) 29.0 28.0 n/a n/aRBC Royal Bank (Dec/12) 32.0 32.0 n/a n/aScotiabank (Dec/12) 30.0 30.0 n/a n/aToronto Dominion Bank (Dec/12) 33.5 32.0 n/a n/aLaurentian Bank (Oct/12) 31.7 n/a n/a n/a
OtherCanada Mortgage and Housing Corporation (Jan/13) 31.2 n/a n/a n/a
High 35.5 35.3 34.5 31.6Low 29.0 28.0 30.6 30.0Average of All Private Forecasts 31.8 31.5 32.3 31.0Alberta Government (calendar year) 32.6 31.9 30.9 30.5
Alberta Primary Household Income Benchmark(per cent change)
Includes forecasts finalized on or before January 29, 2013. * Denotes forecast of Personal Income under Statistics Canada’s previous vintage of national accounts.
Alberta Corporate Net Operating Surplus Benchmark(per cent change)
Alberta Housing Starts Benchmark(thousands)
Includes forecasts finalized on or before January 29, 2013.
Includes forecasts finalized on or before January 29, 2013. * Denotes forecast of Corporation Profits Before Taxes under Statistics Canada’s previous vintage of national accounts.
107#buildingAlberta FISCAL PLAN 2013–16 • ECONOMIC OUTLOOK
Alberta Employment Benchmark(per cent change)
Includes forecasts finalized on or before January 29, 2013.
Organization 2013 2014 2015 2016National Forecasting Agencies
Conference Board of Canada (Dec/12) 2.1 2.4 2.1 1.7
IHS Global Insight (Jan/13) 1.7 1.8 2.2 1.7
Centre for Spatial Economics (Jun/12) 2.1 1.0 1.1 1.1
BanksBMO Capital Markets (Jan/13) 1.6 1.4 n/a n/a
CIBC World Markets (Jan/13) 1.4 1.5 n/a n/a
RBC Royal Bank (Dec/12) 2.4 2.0 n/a n/a
Scotiabank (Dec/12) 2.0 2.1 n/a n/a
Toronto Dominion Bank (Dec/12) 1.6 1.8 n/a n/a
Laurentian Bank (Oct/12) 1.7 n/a n/a n/a
OtherCanada Mortgage and Housing Corporation (Jan/13) 2.2 n/a n/a n/a
High 2.4 2.4 2.2 1.7
Low 1.4 1.0 1.1 1.1
Average of All Private Forecasts 1.9 1.7 1.8 1.5
Alberta Government (calendar year) 1.9 1.7 1.6 1.6
Alberta Unemployment Rate Benchmark(per cent)
Includes forecasts finalized on or before January 29, 2013.
Organization 2013 2014 2015 2016National Forecasting Agencies
Conference Board of Canada (Dec/12) 4.8 4.5 4.1 3.8
IHS Global Insight (Jan/13) 4.4 4.3 4.3 4.3
Centre for Spatial Economics (Jun/12) 4.4 4.9 5.0 5.1
BanksBMO Capital Markets (Jan/13) 4.5 4.4 n/a n/a
CIBC World Markets (Jan/13) 4.6 4.6 n/a n/a
RBC Royal Bank (Dec/12) 4.4 4.5 n/a n/a
Scotiabank (Dec/12) 4.6 4.5 n/a n/a
Toronto Dominion Bank (Dec/12) 4.5 4.4 n/a n/a
Laurentian Bank (Oct/12) 4.8 n/a n/a n/a
OtherCanada Mortgage and Housing Corporation (Jan/13) 4.6 n/a n/a n/a
High 4.8 4.9 5.0 5.1
Low 4.4 4.3 4.1 3.8
Average of All Private Forecasts 4.6 4.5 4.5 4.4
Alberta Government (calendar year) 4.5 4.3 4.3 4.3