Embed Size (px)
Citation preview
�2013Alumni Perspectives SurveySurvey�report � �
this�document�includes�the�following�topic�reports:
program�DemanD, �report �01
What are some of the factors affecting demand for graduate management education programs today?
recruitment �planning, �report �02
What is the traditional timeline for student decision making, what motivates them to pursue graduate management
education, and which resources do prospects use to gather information about business schools?
School�appeal , �report �03
Which features make a difference to prospective students considering various program types and study destinations?

ABOUT THIS STUDY
The Alumni Perspectives Survey is a product of the Graduate Management Admission Council® (GMAC®), a global nonprofit education organization of leading graduate business schools and the owner of the Graduate Management Admission Test® (GMAT®). The GMAT exam is an important part of the admissions process for nearly 5,600 graduate management programs around the world. GMAC is dedicated to creating access to and disseminating information about graduate management education; these schools and others rely on the Council as the premier provider of reliable data about the graduate management education industry.
School Sign-Up Open for 2013 GMAC Survey Research Series
Visit gmac.com/surveysignup today to include your school in GMAC research studies. The deadline for schools is February 1, 2013 for the Global Management Education Graduate Survey and Corporate Recruiters Survey. Schools can facilitate the survey directly by sending invitations and survey links to students and/or employers; or you can send your contact list to GMAC researchers who will manage the survey process for you. Sign-up continues through-out the year for the Application Trends and Alumni Perspective Surveys. This year for the first time schools will be able to participate directly in the Alumni Survey. Go to gmac.com/surveysignup for details.
ACCOMPANYING DATA
GMAC is offering a new interactive online data report to accompany this 2013 summary of the Alumni Perspectives Survey findings. The interactive data report allows you to examine responses for each of the various survey items in greater depth. The summary report with overall response
information is publicly available at gmac.com/alumniperspectives. Schools that use the GMAT exam as part of their admissions process can explore the comprehensive interactive data report
through the GMAC Research Library at gmac.com/gmacresearchlibrary (login required to view report). The new format for this interactive report allows users to conduct customized data searches by any demographic variables of their own choosing, including custom age ranges, gender, employment status, industry, citizenship, school and work location, program type, world region, and more.
Alumni Perspectives Survey 2013 Survey Report
© 2013 Graduate Management Admission Council®. All rights reserved. 3
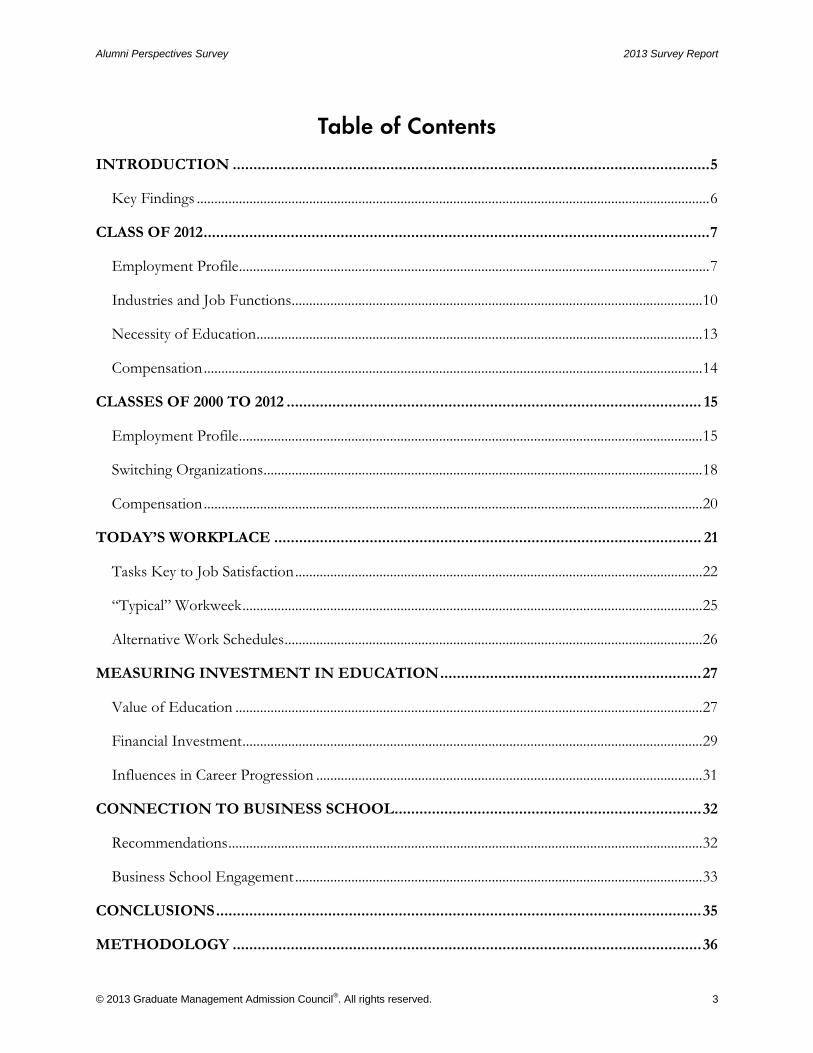
Table of Contents
INTRODUCTION ................................................................................................................... 5
Key Findings .................................................................................................................................................. 6
CLASS OF 2012 .......................................................................................................................... 7
Employment Profile ...................................................................................................................................... 7
Industries and Job Functions..................................................................................................................... 10
Necessity of Education ............................................................................................................................... 13
Compensation .............................................................................................................................................. 14
CLASSES OF 2000 TO 2012 .................................................................................................... 15
Employment Profile .................................................................................................................................... 15
Switching Organizations ............................................................................................................................. 18
Compensation .............................................................................................................................................. 20
TODAY’S WORKPLACE ....................................................................................................... 21
Tasks Key to Job Satisfaction .................................................................................................................... 22
“Typical” Workweek ................................................................................................................................... 25
Alternative Work Schedules ....................................................................................................................... 26
MEASURING INVESTMENT IN EDUCATION ............................................................... 27
Value of Education ..................................................................................................................................... 27
Financial Investment ................................................................................................................................... 29
Influences in Career Progression .............................................................................................................. 31
CONNECTION TO BUSINESS SCHOOL .......................................................................... 32
Recommendations ....................................................................................................................................... 32
Business School Engagement .................................................................................................................... 33
CONCLUSIONS ..................................................................................................................... 35
METHODOLOGY ................................................................................................................. 36

2013 Survey Report Alumni Perspectives Survey
4 © 2013 Graduate Management Admission Council®. All rights reserved.
REGIONAL LOCATION OF SURVEY RESPONDENTS ................................................. 37
CONTACT INFORMATION ................................................................................................ 38
Contributors ................................................................................................................................................. 38
Acknowledgements ..................................................................................................................................... 39

Alumni Perspectives Survey 2013 Survey Report
© 2013 Graduate Management Admission Council®. All rights reserved. 5
ow successful was the class of 2012 at securing employment after graduation? What does a “typical day” of work look like for graduate business school alumni? What impact do job tasks and work environments have on job satisfaction? How do alumni assess the value of
their graduate management degree?
The findings in the 2013 Alumni Perspectives Survey report answer these questions and others that address current economic and regional trends affecting alumni of MBA and other business master’s programs.
The Alumni Perspectives Survey, conducted in September 2012 by the Graduate Management Admission Council® (GMAC®), is a longitudinal study of respondents to the Global Management Education Graduate Survey, the annual GMAC exit survey of graduate management students in their final year of business school. This 13th annual report includes responses from 4,444 alumni who graduated from the classes of 2000 through 2012, including 834 members of the class of 2012.1
Since the survey’s inception, the profile of business school alumni has changed with our efforts to survey alumni from more schools worldwide. For the first few years the majority of responding alumni graduated from programs in the United States. Today, survey responses reflect the greater international mix of alumni who studied at school locations in Europe, Asia-Pacific, Central Asia, and Latin America. Survey findings also reveal shifts at the program level: 87 percent of class of 2002 survey respondents earned a degree from a full-time MBA program and only one percent graduated from non-MBA master’s programs. By contrast, 59 percent of class of 2012 respondents graduated from a full-time MBA programs, 31 percent from other MBA programs, and 10 percent from non-MBA graduate business programs.
Survey topics include the following:
Profile of the class of 2012 and their job offer time frame, employment status, and compensation;
Current employment and salary data for alumni across all graduation years (2000–2012);
Statistics on today’s workplace, including alumni job tasks, work roles, typical workweek, and alternative work schedules;
Alumni views about their business school experience, the value of their degree, the financial return on their investment, and career progression; and
Alumni relations with schools and their likelihood to recommend their program to others.
1 See the Methodology section at the back of this report for more details on survey methods and samples used for this report.
H

2013 Survey Report Alumni Perspectives Survey
6 © 2013 Graduate Management Admission Council®. All rights reserved.
Key Findings
Class of 2012
Employment Rate: Ninety-two (92%) percent of class of 2012 graduates were employed at graduation—the highest employment rate reported in this survey for any graduating class since 2003. Nearly 7 in 10 (68%) graduates secured their job before leaving graduate school.
Global Compensation Trends: More than 3 out of 4 (77%) graduates from the class of 2012 reported that their starting salary met or exceeded their expectations.
Necessity of Graduate Management Education: Three out of four (76%) alumni of the class of 2012 said they could not have obtained their job without the skills, knowledge, and abilities attained through their graduate management education.
All Alumni—Classes of 2000 to 2012
Overall Employment Rate: Among alumni from all graduating classes, 2000–2012, 96 percent were employed at the time of the survey, up two percent from last year. Eighty-nine percent (89%) of all alumni were working for an employer, and seven percent were self-employed.
Salary and Compensation:2 Alumni from full-time MBA programs (two-year and one-year programs), regardless of graduation year, reported earning a median salary of US$100,000 in 2012, with additional compensation of US$12,899. Part-time MBA alumni reported earning a median salary of US$95,000, with additional compensation of US$8,500, and alumni from executive MBA programs reported earning a median salary of US$125,000, with additional compensation of US$20,000.
Typical Work Day: Alumni across all graduation years work an average of 48 hours spread across a five-day workweek. Forty-five percent (45%) of alumni utilize a flexible schedule option in their employment, and 2 in 5 (43%) alumni telecommute as a part of their regular workweek.
Job Tasks and Satisfaction. Job tasks that influenced alumni satisfaction most positively in their daily work were exercising leadership skills, thinking analytically, developing strategic plans, and using problem-solving skills.
Value of Graduate Management Education: More than 9 in 10 (95%) alumni rated the value of their education as good to outstanding. Having more opportunities for progressively challenging and interesting work, developing managerial skills, and the flexibility to become an entrepreneur were top outcomes alumni cited as contributing to the value of their graduate management degree.
2 Please use caution when comparing or combining compensation data as this information is subject to variability of many factors, including years of work experience, pre-degree salary, regional cost of living differences, industry and function of employment, job level, and sampling and data collection methodologies.

Alumni Perspectives Survey 2013 Survey Report
© 2013 Graduate Management Admission Council®. All rights reserved. 7
Class of 2012
Employment Profile
lumni in the class of 2012 reported the highest employment rate (92 percent), after graduation, six percentage points higher than 2011 survey results (Figure 1). This employment rate echoes the high rate of job offers that class of 2012 students reported prior
to graduation. According to separate findings from GMAC’s student exit survey conducted in February 2012, 62 percent of all job seekers in the 2012 graduating class received a job offer prior to graduation, an eight percent increase over job offers received by their peers in 2011.3
Figure 1. Percentage of Employed Alumni, by Graduation Year* (All Program Types)
*Data for the classes of 2008 through 2011 are taken from past GMAC Alumni Perspectives Surveys.
Current year data are from the September 2012 Alumni Perspectives Survey.
Employer demand for new MBA and business master’s degree-holders remains high. Across all program types, more than 90 percent of class of 2012 alumni was employed at the time of this survey. In fact, 74 percent of full-time two-year MBA graduates and 67 percent of full-time one-year MBA graduates started a new job after completing their program. Eighty-four percent (84%) of non-MBA business master’s degree-holders had jobs. Figure 2 shows the employment status of class of 2012 alumni by program type after graduation.
Overall, one-third (34%) of the class of 2012 alumni continued working for the employer with whom they worked while enrolled in business school, a rate also seen in prior years’ surveys.
Part-time MBA (77%) and executive MBA (70%) alumni were the most likely to continue working for the same employer after graduation, consistent with prior years’ findings.4
3 GMAC. (2012). Global Management Education Graduate Survey Report.
88%84%
88% 86%92%
0%
25%
50%
75%
100%
2008 2009 2010 2011 2012
Perc
enta
ge e
mp
loyed
Graduation year
A

2013 Survey Report Alumni Perspectives Survey
8 © 2013 Graduate Management Admission Council®. All rights reserved.
A majority of non-MBA master’s alumni began new jobs after graduation (55%), a quarter (25%) continued working for their existing employer, and 4 percent were self-employed.
Executive MBA alumni were about twice as likely as other MBA program alumni to be self-employed.
Figure 2. Employment Status After Graduation, by Program Type, Class of 20125
Employment rates reported for the class of 2012 varied significantly by school location (Table 1).6 As examined later in the discussion about industry switching, the success of alumni in securing employment may in part be due to their willingness to try new industries and explore different job functions and their flexibility in accepting jobs outside their comfort zone.
4 χ2 = 270.866, df = 20, p < .05. 5 The total employment rate excludes those not working and not searching for employment, i.e., currently not in the labor force. This comprises one percent of class of 2012 respondents. 6 χ2 = 32.443, df = 12, p < .05.
12%19%
77%70%
25%
74% 67%
14%
12%
55%
5% 6%5%
11%4%
0%
20%
40%
60%
80%
100%
Full-timetwo-year MBA
Full-timeone-year
MBA
Part-timeMBA
ExecutiveMBA
Non-MBAmaster's
Perc
enta
ge e
mp
loyed
Continued existing job Took new job Self-employed

Alumni Perspectives Survey 2013 Survey Report
© 2013 Graduate Management Admission Council®. All rights reserved. 9
Table 1. Employment Status After Graduation, by School Location, Class of 2012 (All Program Types)
Employed New Job
Global 92% 52%
Asia/Pacific Islands 93% 56%
Canada 91% 64%
India 100% 86%
Europe 87% 43%
Latin America 92% 38%
United States 92% 51%
Note: Responses for Middle East/Africa were not sufficient to report.
Employment Time Frame 7
The time frame for finding a new job had an impact on how the most recent alumni cohort in 2012 viewed their education in relation to their career advancement and earning potential. Overall, more than two-thirds (68%) of class of 2012 alumni had obtained an offer of employment before graduation, which is consistent with findings for graduating students reported in the GMAC student exit survey earlier in 2012.8 An additional 15 percent of class of 2012 alumni had a job offer in hand within a month after graduating. The job offer time frame varied significantly by alumni school location, however (Table 2).9
Table 2. Time Frame for Receiving Job Offers, by School Location, Class of 2012 (All Program Types)
School Location
Time Frame for Receiving Job Offer
Before Graduation
Within a Month After Graduation
More Than a Month After Graduation*
Overall 68% 15% 17%
Asia/Pacific Islands 51% 13% 36%
Canada 52% 10% 38%
India 88% 8% 4%
Europe 62% 24% 14%
Latin America 36% 36% 28%
United States 73% 14% 13%
*As reported at the time of the September 2012 survey.
Note: Responses for Middle East/Africa were not sufficient to report.
Overall, 87 percent of class of 2012 respondents felt their education offered opportunities for quicker career advancement and increased earnings power. Not surprisingly, of those who had a job
7 New question in 2012. 8 GMAC. (2012). Global Management Education Graduate Survey Report, p. 3. In February–March 2012, 62 percent of class of 2012 survey respondents reported they had received a job offer. 9 χ2 = 75.681, df = 30, p < .05.

2013 Survey Report Alumni Perspectives Survey
10 © 2013 Graduate Management Admission Council®. All rights reserved.
offer before graduation, 93 percent rated their opportunities for career advancement favorably, and 92 percent said their education increased their earnings power.
The Job Search
When searching for a job, alumni found their greatest number of employment opportunities through three main channels: networks of personal contacts (23%), school career services (22%), and on-campus interviews (21%). These are also the top methods employers use to recruit new graduate business school talent.10 As reported in GMAC’s 2012 Corporate Recruiters Survey findings, companies primarily seek new business school hires through referrals and on-campus recruitment.
Not only were class of 2012 alumni successful in landing job offers, the vast majority (92%) said they took a job that they wanted. For those who received job offers within a month after graduation, 95 percent indicated the job they took was the one they sought.11 On the other hand, alumni who received a job offer more than a month after graduation were less likely to take a job that matched what they were seeking (84%).
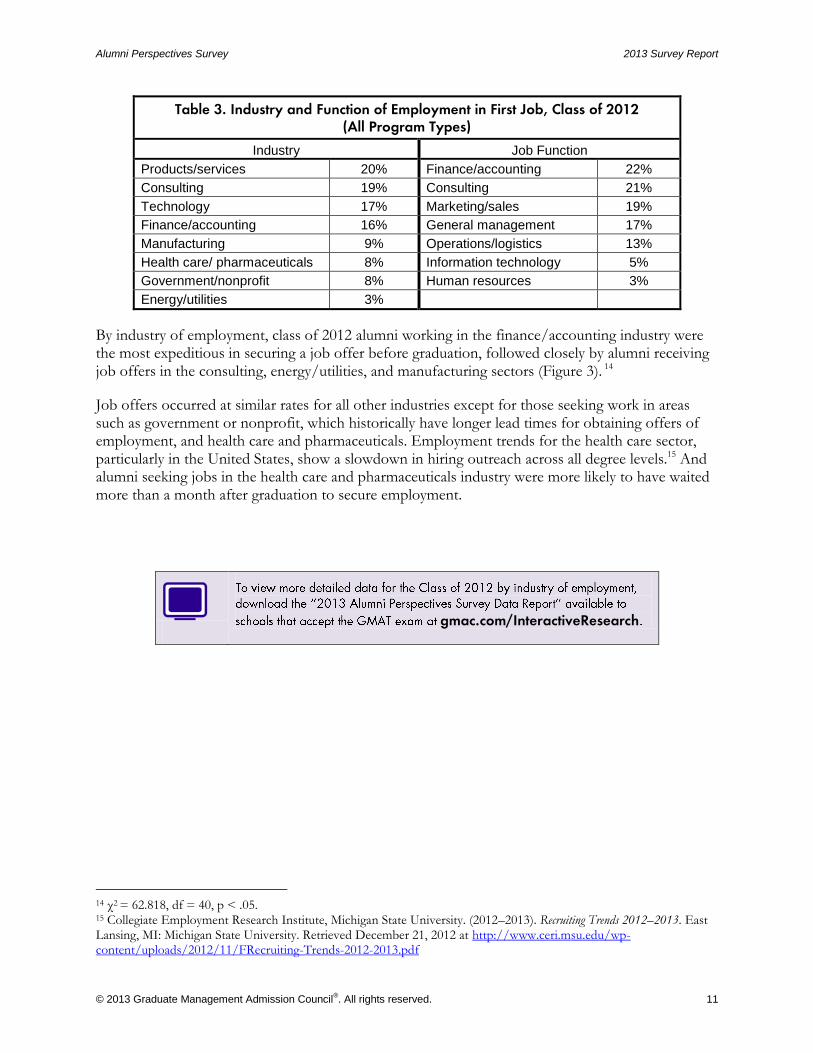
Industries and Job Functions he types of industries and job functions in which class of 2012 alumni found employment are consistent with previous research, with some exceptions (Table 3). Products and services (20%) and consulting (19%) remain among the top three industries of employment for class of 2012 alumni. Fewer were employed in the finance/
accounting industry (16%) compared with 2011, however, when 20 percent found jobs in this sector. Declining interest in this industry echoes earlier findings reported in the GMAC student exit survey.12
The technology sector edged out finance/accounting as the third most prevalent industry of employment for class of 2012 alumni, with a 10 percent increase in the number of alumni employed in this industry compared with the class of 2011. This growth was driven primarily by the higher rate of technology job offers received by class of 2012 alumni from schools in Central Asia,13 specifically in India (28%). Although employment in the finance/accounting industry slowed somewhat in 2012 compared with 2011, more alumni from the class of 2012 (22%) were hired to fill finance and accounting positions than any other job function this year. Many alumni found such job opportunities outside the finance/accounting industry. Thirteen percent (13%) of class of 2012 alumni employed in the products and services industry and 12 percent in consulting worked in a finance/accounting position.
10 GMAC. (2012). Corporate Recruiters Survey Report. 11 χ2 = 28.739, df = 10, p < .05. 12 GMAC. (2012). Global Management Education Graduate Survey Report. 13 χ2 = 85.863, df = 48, p < .05.
T
Alumni Perspectives Survey 2013 Survey Report
© 2013 Graduate Management Admission Council®. All rights reserved. 11
Table 3. Industry and Function of Employment in First Job, Class of 2012 (All Program Types)
Industry Job Function
Products/services 20% Finance/accounting 22%
Consulting 19% Consulting 21%
Technology 17% Marketing/sales 19%
Finance/accounting 16% General management 17%
Manufacturing 9% Operations/logistics 13%
Health care/ pharmaceuticals 8% Information technology 5%
Government/nonprofit 8% Human resources 3%
Energy/utilities 3%
By industry of employment, class of 2012 alumni working in the finance/accounting industry were the most expeditious in securing a job offer before graduation, followed closely by alumni receiving job offers in the consulting, energy/utilities, and manufacturing sectors (Figure 3). 14
Job offers occurred at similar rates for all other industries except for those seeking work in areas such as government or nonprofit, which historically have longer lead times for obtaining offers of employment, and health care and pharmaceuticals. Employment trends for the health care sector, particularly in the United States, show a slowdown in hiring outreach across all degree levels.15 And alumni seeking jobs in the health care and pharmaceuticals industry were more likely to have waited more than a month after graduation to secure employment.
gmac.com/InteractiveResearch
14 χ2 = 62.818, df = 40, p < .05. 15 Collegiate Employment Research Institute, Michigan State University. (2012–2013). Recruiting Trends 2012–2013. East Lansing, MI: Michigan State University. Retrieved December 21, 2012 at http://www.ceri.msu.edu/wp-content/uploads/2012/11/FRecruiting-Trends-2012-2013.pdf

2013 Survey Report Alumni Perspectives Survey
12 © 2013 Graduate Management Admission Council®. All rights reserved.
Figure 3. Time Frame for Receiving Job Offers, by Industry of Employment, Class of 2012 (All Program Types)*
*Responses from alumni taking longer than a month after graduation to receive a job offer are not shown.
Industry Switching
Overall, 31 percent of the class of 2012 was employed in an industry that differed from the industry they intended when they started business school. This is slightly lower than the 33 percent of class of 2011 alumni who changed industries. Class of 2012 respondents who switched industries indicated they were inspired to switch when they learned about opportunities in different industries while meeting with employers and recruiters (38%) or while enrolled in school (34%). Additionally, 35 percent sought jobs in different industries due to increased earning potential. Some alumni also were influenced through their networking efforts with peers (23%) and alumni (19%). Despite working in a different industry than the one planned, 82 percent of class of 2012 alumni said the job they took fit the type of employment they were seeking.16
Two-thirds (65%) of the class of 2012 found employment in their intended job functions; only 35 percent were working in a job function they had not envisioned. Most of these alumni moved out of their original job functions into consulting roles. For example, 47 percent of alumni who planned to seek a marketing and sales position changed to consulting, and 50 percent of those intending to work in information and technology roles obtained a consulting position.
Alumni who remained employed in their original industry but changed job functions were more likely to move into general management roles. Three in five (61%) alumni previously holding
16 χ2 = 68.003, df = 2, p < .05.
45%
50%
66%
66%
72%
73%
75%
77%
18%
35%
19%
19%
17%
9%
10%
9%
0% 20% 40% 60% 80% 100%
Health care/pharmaceutical
Government/nonprofit
Products/services
Technology
Manufacturing
Energy/utilities
Consulting
Finance/accounting
Percentage of respondents
Had job offer before graduation Had job offer within a month after graduation

Alumni Perspectives Survey 2013 Survey Report
© 2013 Graduate Management Admission Council®. All rights reserved. 13
operations/logistics roles and half of those (50%) working in human resources roles switched to general management positions.
Necessity of Education
s earlier GMAC surveys of prospective students show, most individuals who pursue a graduate management education do so with the stated goal of career enhancement.17 Most class of 2012 alumni reported achieving a sense of career enhancement from earning their
degrees. Nine out of 10 alumni said their graduate management education prepared them for their chosen career and 87 percent indicated their education offered opportunities for quicker career advancement and increased earnings power.
Seventy-six percent (76%) of the class of 2012 agreed they could not have obtained this job without their graduate management education. Those who earned an MBA degree from a full-time two-year program (82%) expressed the greatest agreement, although 67 percent of alumni with non-MBA business master’s degrees also believed their graduate management education was instrumental in helping them obtain their first job after graduating.
Among the 24 percent of alumni who did not view their education as a prerequisite for securing immediate employment, 61 percent had already found a job before graduation. Most indicated they earned their degree as part of their long-term career plans, not to satisfy short-term employment goals. In fact, nearly half (46%) of these class of 2012 alumni reported they were somewhat or very likely to switch employers in the next 12 months. Despite their plans to change organizations in their first year after graduation for the sake of their future careers, when asked, “Knowing what you know now, would you still have pursued a graduate management degree?” these alumni replied with an overwhelming “yes” (95%).
A few of these recent 2012 alumni offered some interesting points of view on why earning their MBA or business master’s degree, while not necessary to meet their immediate employment goals, may play a part in achieving their long-term career visions:
“I decided to do my MBA and my employer helped me pay for it. But because I worked in a small family business before my MBA (and this is the same company I returned to after my schooling), I was basically guaranteed a job regardless of my graduate management education. I did an MBA because I thought it would help solidify my career in the long term, not because it was a prerequisite in the short term.”
—Class of 2012 alumnus with joint degree (full-time MBA and Master of Global Management)
17 GMAC. (2012). mba.com Prospective Students Survey Report.
A

2013 Survey Report Alumni Perspectives Survey
14 © 2013 Graduate Management Admission Council®. All rights reserved.
“The firm hires people directly from undergrad for the same position. However, having the graduate degree helps, because then I had sufficient accounting hours to get my CPA license, which will help my career advance.”
—Class of 2012 alumnus with Master of Accounting degree
“It’s easy work and I could do it without a master’s degree, but hopefully my next job or advancement will utilize my degree and my new experience.”
—Class of 2012 full-time MBA alumnus
“Since I am young and have minimal work experience I am looking at the job as experience and a resume builder so that I can get my dream job next, in a year or two.”
—Class of 2012 full-time MBA alumnus
Compensation18
he majority of class of 2012 alumni (77%) felt their salary met (57%) or exceeded (20%) their expectations. Median starting salary for the class of 2012 varied by program type.19 Please use caution when comparing or combining compensation data, however, as this information is
subject to variability of many factors, including years of work experience, pre-degree salary, regional cost of living differences, industry and function of employment, job level, and sampling and data collection methodologies.
Full-time two-year MBA: US$85,000 base with an additional compensation of US$10,000
Full-time one-year MBA: US$59,000 base with an additional compensation of US$5,700
Part-time MBA: US$79,800 base with an additional compensation of US$5,500
Median starting salary also varied based on alumni work locations and regional economies, and ranged from a median salary of US$27,818 in Central Asia to US$105,120 in Europe (Figure 4).
18 A methodological change was made in the 2012 survey to include the starting salary representing all graduating students of the class of 2012. Previous salary analysis included only those alumni who obtained a new job after graduation, not those continuing an existing job. 19 Data for other program types unavailable due to sample size.
T

Alumni Perspectives Survey 2013 Survey Report
© 2013 Graduate Management Admission Council®. All rights reserved. 15
Figure 4. Comparison of Median Starting Salaries, Class of 2012, by Work Location20 (All Program Types)
*Salary reported in currency of choice and converted to US dollars for purpose of comparison.
Another important indicator of post-degree salary is the amount of work experience a student had prior to entering his or her program. Alumni in the class of 2012 with three or more years of work experience at the time of enrollment in graduate business school earned a premium of US$25,000 (median), on average, upon graduation compared with those who entered their programs with less experience.21 Participation in an internship also led to increased starting salaries. Class of 2012 alumni who participated in an internship saw a salary boost of US$21,995 (median) compared with those who did not participate in an internship, regardless of program type.22
Classes of 2000 to 2012
Employment Profile
he vast majority (96%) of alumni across all graduating classes (2000–2012) were employed at the time of this survey, up two percent from last year’s survey findings.23 Eighty-nine percent (89%) of alumni stated they worked for an employer and 7 percent were self-employed or a
20 Country distribution of survey respondents within each region may differ from year to year, which consequently may influence earnings comparisons. See Regional Location of Survey Respondents at end of this report for representative countries. 21 χ2 = 32.119, df = 2, p < .05. (Kruskal-Wallis Test) 22 χ2 = 5.816, df = 1, p < .05. (Kruskal-Wallis Test) 23 Test of two proportions, z = -4.23, p < .05.
Me
dia
n, $
52
,32
9
Med
ian
, $81
,443 M
ed
ian
, $27
,818
Me
dia
n, $
10
5,1
20 M
ed
ian
, $4
8,5
57
Me
dia
n, $
83
,00
0
$0
$20,000
$40,000
$60,000
$80,000
$100,000
$120,000
$140,000
Asia/PI Canada Central Asia Europe Latin America US
US D
olla
rs*
Region of work location
25th percentile Median 75th percentile
T

2013 Survey Report Alumni Perspectives Survey
16 © 2013 Graduate Management Admission Council®. All rights reserved.
small-business owner. Compared with US and European unemployment rates published in the fall of 2012, alumni with graduate management degrees fare much better in today’s job market than reported national/regional averages.24
By citizenship, there are only minor differences in employment across regions, with more than 9 in 10 alumni respondents employed (Figure 5).25 Throughout the remainder of this report, analyses of employment trends by country/region will be shown by work location.
Figure 5. Current Employment Status of Alumni, by Citizenship, Classes of 2000–2012 (All Program Types)*
*Percentages displayed in this figure reflect responses provided by alumni at the time of the September 2012 survey.
Table 4 displays the industries and job functions for all employed alumni across all program types and graduating classes (2000–2012). The top three job functions vary slightly from last year, with finance and accounting (24%) and marketing and sales (21%) as the two most prevalent, and general management (19%), up five percent compared with 2011, replacing consulting as the third most frequently reported job function in 2012.
24 The Employment Situation, US Bureau of Labor Statistics, accessed October 17, 2012. http://www.bls.gov/news.release/empsit.nr0.htm; Eurostat News Release. Accessed October 18, 2012 http://epp.eurostat.ec.europa.eu/cache/ITY_PUBLIC/3-01102012-AP/EN/3-01102012-AP-EN.PDF 25 χ2 = 52.854, df = 12, p < .05.
86% 84% 89% 83% 86% 80%91%
8% 12% 7%10%
11%14%
5%
0%
20%
40%
60%
80%
100%
Asia/PacificIslands
Canada CentralAsia
Europe LatinAmerica
MiddleEast/Africa
UnitedStates
Perc
enta
ge o
f re
spo
nd
ents
Citizenship
Employed Self-Employed

Alumni Perspectives Survey 2013 Survey Report
© 2013 Graduate Management Admission Council®. All rights reserved. 17
Table 4. Industry & Job Function of Employed Alumni, Classes of 2000–2012 (All Program Types)
Industry Job Function
Products/services 19% Finance/accounting 24%
Consulting 17% Marketing/sales 21%
Finance/accounting 17% General management 19%
Technology 15% Consulting 16%
Government/nonprofit 11% Operations/logistics 11%
Health care/ pharmaceutical 9% Information technology/MIS 5%
Manufacturing 8% Human resources 3%
Energy/utilities 5%
Gender
Men and women across all graduation years (2000–2012) reported equal rates of employment at the time of this survey (89%), but slightly more men (8%) than women (5%) reported being self-employed.26
When comparing jobs data for men and women across all graduation years (2000–2012), there are differences by industry27 and job function.28 Statistically, women were more likely to report working in industries such as health care (11%; compared with 8% of men) and government/nonprofit (16%; compared with 8% of men). Men were more likely to report working in technology (16%) compared with women (11%). These differences by gender are consistent with previous research.
With respect to job functions, men were more likely to work as consultants (17%) and hold general management roles (20%) in comparison with women (14% and 16%, respectively). Women were more likely to be employed in marketing/sales roles (27% ,compared with 19 % of men) and human resources functions (7%, compared with 2% of men). Choosing a job role is one of many factors that have implications for compensation differences, which will be discussed below.
Self-Employed
Generally, self-employed business owners or entrepreneurs have constituted a relatively small percentage of the overall population of alumni. Roughly 7 percent of graduate business alumni from all graduating classes (2000–2012) reported being self-employed when surveyed in 2012. Of this group, nearly half (49%) indicated they owned more than one business. Self-employment rates also vary considerably by alumni work location.29 Mirroring data from recent GMAC prospective students’ research,30 alumni working in developing economies worldwide were more likely to engage in entrepreneurial activities than those in more established markets.
26 χ2 = 13.551, df = 2, p < .05. 27 χ2 = 93.997, df = 7, p < .05. 28 χ2 = 80.373, df = 6, p < .05. 29 χ2 = 67.358, df = 6, p < .05. 30 GMAC. (2012). mba.com Prospective Students Survey Report.

2013 Survey Report Alumni Perspectives Survey
18 © 2013 Graduate Management Admission Council®. All rights reserved.
The following list shows the percentage of self-employed alumni (regardless of program type), by work location:
Middle East/Africa (20%),
Latin America (13%),
Canada (13%),
Central Asia (13%),
Europe (11%),
Asia/Pacific Islands (6%), and
United States (5%).
Not surprisingly, the industries in which self-employed alumni established their businesses were similar to the industries where other alumni reported working with the exception of consulting, which drew a higher rate of self-employed alumni by comparison. The following list includes industries for self-employed alumni (classes of 2000–2012):
Consulting (37%)
Products and services (28%)
Technology (13%)
Finance/accounting (10%)
Health care and pharmaceuticals (5%)
Energy and utilities (3%)
Manufacturing (2%)
Government and nonprofit (2%)
Alumni Not Employed
Of the 4 percent of alumni who reported they were not working at the time of the survey, the majority (81%) were seeking employment. The top reasons they cited for not being able to find employment were: lack of relevant industry or functional experience (43%), being overqualified (35%), not finding work that is interesting (29%), and not finding work that pays enough (29%).
The remaining 19 percent of alumni who were not employed reported they were not currently searching for a job. About half (49%) said they were continuing their education and 37 percent cited family reasons.
Switching Organizations
mong all survey respondents, 3 in 5 reported they were employed by the same organization where they took their first job after graduation; only 18 percent reported they were extremely or very likely to switch jobs in the next two months. Most alumni who said they
were working for the same organization graduated between 2010 and 2012 (ranging from 63% in 2010, to 67% in 2011, and 91% in 2012).
Alumni who indicated they changed employers since their first job after graduation had done so twice, on average, and tended to have graduated between 2000 and 2008. In fact, 64 percent of
A

Alumni Perspectives Survey 2013 Survey Report
© 2013 Graduate Management Admission Council®. All rights reserved. 19
alumni from these class years reported having switched organizations (ranging between 53% and 74%).31 Overall, alumni who reported switching organizations tended to hold senior (41%) and executive-level (31%) positions.32
Any decision to change one’s career path requires some cost/benefit analysis, weighing potential financial gains with future career prospects. Switching organizations often will have an impact on salary and one’s likelihood for career advancement.33 Alumni who switched organizations reported seeing a median salary increase of US$3,350 compared with all alumni. These job switchers, however, were slightly less likely (37%) than those who remained with their current employer to indicate that their career progress was “on track” (41%), or where they thought they would be in their career. In fact, 47 percent of those who switched organizations actually felt behind in their career advancement.
While those holding full-time MBAs and part-time MBAs are equally (41%) likely to switch employers in the next 12 months, there were more subtle differences when comparing the two degree types when looking across organizational shifts across their career. Almost half (46%) of full-time MBA alumni have switched organizations since their first employer compared with 2 in 5 part-time MBA (40%) degree holders.34 The full-time MBA switchers felt less on track or ahead in their career (54%) than the full-time MBA alumni that remained with their same employer since graduation (65%).35 Interestingly, part-time MBA alumni who switched employers did not report differences in their career progression compared with who continued with their original organizations (50%, 51%, respectively). This parity could be affected by factors such as the value that less interrupted work experience plays in the part-time MBA alumni compared to the typical full-time MBA alumni experience. Part-time MBA alumni have increased number of promotions, higher proportions of senior and executive work positions, and typically more years of pre-degree work experience.
Nearly 3 in 5 alumni (58%) who felt their careers were not progressing as planned were likely to switch organizations in the next 12 months compared with those whose careers were progressing on track (33%) or ahead of plan (29%).36 Of those who felt they were behind in their career advancement, more than half (55%) were still satisfied with their current job. Not surprisingly, the greatest level of job satisfaction was expressed by alumni whose careers were advancing as desired (89% satisfied) or ahead of plan (94% satisfied).37 As noted earlier, the decision to switch organizations involves trade-offs and based on alumni responses it appears switching organizations has a positive impact on salary levels but a negative impact on career momentum.
31 χ2 = 581.643, df = 12, p < .05. 32 χ2 = 47.671, df = 3, p < .05. 33 χ2 = 118.768, df = 5, p < .05. (Kruskal-Wallis Test) 34 χ2 = 10.405, df = 5, p < .05. 35 χ2 = 22.191, df = 2, p < .05. 36 χ2 = 253.409, df = 5, p < .05. 37 χ2 = 622.002, df = 6, p < .05.

2013 Survey Report Alumni Perspectives Survey
20 © 2013 Graduate Management Admission Council®. All rights reserved.
Compensation
alaries continue to rise as alumni advance in their careers. At the time of this survey, alumni of full-time MBA (two-year and one-year) programs38 across all graduation years (2000–2012) reported earning a median annual salary of US$100,000, compared with the median salary of
US$95,000 that full-time MBA alumni reported earning last year. Part-time MBA alumni are not far behind, reporting a median salary of US$95,000, up from US$91,000 that this group reported in 2011. Executive MBA alumni reported a median annual salary of US$125,000, which is consistent with findings published in the 2012 alumni survey report. Please use caution when comparing or combining compensation data, however, as this information is subject to variability of many factors, including years of work experience, pre-degree salary, regional cost of living differences, industry and function of employment, job level as well as sampling and data collection methodologies.
The biggest variations in salary appear when viewing compensation data by work location (Figure 6). Alumni across all graduation years (2000–2012) currently employed in Europe and the United States reported the highest median annual salaries, at US$108,355 and US$100,000, respectively. The lowest current median salary, US$33,117, was reported by survey respondents in Central Asia (the majority, 91%, were working in India).
Figure 6. Median Annual Salary, by Work Location & World Region, Classes 2000–2012 (All Program Types)
*Salary reported in currency of choice and converted to US dollars for purposes of comparison.
38 For the purpose of historical comparison, full-time two-year and full-time one-year MBA programs were combined into a single category—full-time MBA.
Me
dia
n, $
94
,04
5
Me
dia
n, $
94
,93
2
Me
dia
n, $
33
,11
7
Me
dia
n, $
10
8,3
55
Med
ian
, $73
,686
Med
ian
, $85
,000
Me
dia
n, $
10
0,0
00
$0
$20,000
$40,000
$60,000
$80,000
$100,000
$120,000
$140,000
$160,000
Asia/PI Canada Central Asia Europe LatinAmerica
MiddleEast/Africa
UnitedStates
US D
olla
rs*
Region of work location
25th percentile Median 75th percentile
S

Alumni Perspectives Survey 2013 Survey Report
© 2013 Graduate Management Admission Council®. All rights reserved. 21
There are some differences in annual salary by industry (Figure 7). Alumni (classes of 2000–2012) working in the energy/utilities sector not only reported the largest median annual salary (US$108,000), but also received the greatest amount of additional compensation at US$20,000. This differs from previous years when alumni working in consulting typically reported the highest salary and compensation levels.
Salary differentials for alumni working in the energy/utilities field may be explained by other factors. This industry had the highest proportion of men (85% versus 15% women), compared with any other industry represented in the survey sample. The energy/utilities industry also had the highest representation of older alumni (from the classes of 2000–2005) compared with all other industries. Although only five percent of alumni reported working in the energy/utilities sector (the lowest level reported for any industry), they have the second highest job satisfaction rating (78%) after alumni working in the government/nonprofit arena (79%), and the highest number of alumni indicating their career progress is ahead of plan (25%) or exactly as expected (37%).
Figure 7. Median Annual Salary, by Industry, Classes 2000–2012 (All Program Types)
*Salary reported in currency of choice and converted to US dollars for purpose of comparison.
Today’s Workplace
ast year’s alumni survey spotlighted issues that contribute to an individual’s overall job satisfaction including company strategies to retain workers and intrinsic and extrinsic motivators that keep alumni engaged on the job. In 2012, new research was conducted to
better understand the tasks alumni perform based on job roles, typical workweeks, and work options such as flexible work schedules and telecommuting, and what impact these may have on job satisfaction.
Me
dia
n, $
10
8,0
00
Me
dia
n, $
10
5,0
00
Me
dia
n, $
10
4,0
00
Me
dia
n, $
10
2,8
22
Me
dia
n, $
10
0,0
00
Me
dia
n, $
97
,38
5
Med
ian
, $92
,025
Me
dia
n, $
80
,00
0
$0
$20,000
$40,000
$60,000
$80,000
$100,000
$120,000
$140,000
Energy/utilities
Consulting Health care/pharmaceutical
Technology Finance/accounting
Manufacturing Products/services
Government/nonprofit
US D
olla
rs*
Industry
25th percentile Median 75th percentile
L

2013 Survey Report Alumni Perspectives Survey
22 © 2013 Graduate Management Admission Council®. All rights reserved.
Tasks Key to Job Satisfaction
istorically, survey findings have shown that alumni job satisfaction is often tied to doing work that is challenging and interesting. The following analysis expands on this connection by uncovering the key tasks that influence job satisfaction. The four job tasks that exert the
greatest influence on job satisfaction are: practicing leadership skills, analytical thinking, developing strategic plans, and exercising problem-solving skills (Figure 8). Budget preparation, managing and maintaining staff, and conducting supervisory tasks did not affect job satisfaction and in fact are listed in the category of other nonsignificant tasks. Some tasks, such as report writing and meeting attendance, actually had a negative effect on job satisfaction.
In general, tasks involving thought leadership and intellectual engagement appear to have the strongest impact on job satisfaction compared with operational tasks, which would seem to confirm earlier findings that employees engaged in challenging and interesting work are more satisfied with their jobs.
The ability to lead, think analytically, plan strategically, and solve problems were also the top skills and traits employers seek in recent graduate business hires, according to results from the GMAC 2012 Corporate Recruiters Survey.39
Figure 8. Key Drivers of Job Satisfaction, Classes 2000–201240 (All Program Types)
*These items were indicated as the top skills and traits employers seek in the 2012 Corporate Recruiters Survey.
**These items had a negative relationship with job satisfaction.
39 GMAC. (2012). Corporate Recruiters Survey. 40 Pratt Index = (β*r)/R2, where β is the standardized regression coefficient, r is the simple Pearson correlation
coefficient, and R2 is the proportion of the variance explained by the regression model. Pratt Index: Multiple R = .361;
F = 29.504; df = 3821; p < .05.
12%
-1%
-3%
5%
6%
7%
7%
8%
9%
16%
26%
-5% 0% 5% 10% 15% 20% 25% 30%
All other tasks
Write reports**
Attend/conduct meetings**
Network
Communicate with management
Travel domestically
Travel internationally
Use problem-solving skills*
Develop strategic plans
Analytical thinking*
Exhibit leadership skills*
Pratt Index
H

Alumni Perspectives Survey 2013 Survey Report
© 2013 Graduate Management Admission Council®. All rights reserved. 23
Prior research also has shown that engagement in one’s job can lead to increased earnings.41 Alumni who spent more time performing tasks that engaged them in their work and enhanced their job satisfaction improved their salary by up to 50 percent compared with those whose jobs did not involve performing similar tasks. For example, alumni who rarely or never had opportunities to exhibit leadership skills on the job had a median salary of US$68,000 compared with alumni who demonstrated leadership skills most or all of the time (US$105,000). This demonstrates how performance of certain tasks at work can influence not only personal fulfillment but monetary gains.
Tasks & Roles
For a deeper look at how job tasks vary by job role, survey respondents were asked how they distributed their work time among 20 distinct job-related tasks. These tasks were categorized into four main areas:42
Operational skills (operating computer, using problem-solving skills, oral communication, analytical thinking, communicating with management, attending/conducting meetings);
Finance and data analysis (using technical skills, analyzing data, conducting financial analyses, conducting cost/benefit analyses, writing reports);
Travel and marketing (domestic travel, international travel, networking, designing and conducting market research); and
Supervisory tasks (recruiting and maintaining staff, performing supervisory tasks, exhibiting leadership skills, managing change, developing strategic plans).
Alumni also indicated whether their current job role was administrative, technical, professional, managerial, or entrepreneurial.
Nearly all alumni reported that their jobs include components of communication, meeting attendance, and practice of their specialty skills. Not surprisingly, job role influences the amount of time alumni spend in various work activities (Table 5).
gmac.com/InteractiveResearch
41 GMAC. (2011, 2012). Alumni Perspectives Survey Report. 42 A principal components analysis (PCA) is used to summarize and simplify 20 job tasks alumni rated in terms of frequency of use. These items were reduced to four components: operational skills, finance and data analysis, travel and marketing, and supervisory tasks. The PCA had a multiple r of .496.

2013 Survey Report Alumni Perspectives Survey
24 © 2013 Graduate Management Admission Council®. All rights reserved.
Table 5. Top 5 Most Frequent Job Activities, by Job Role, Classes of 2000–2012
(All Program Types)
Administrative Technical Professional Managerial Entrepreneurial
#1 Oral communication
Using problem-solving skills
Oral communication Oral
communication Oral
communication
#2 Communicating with management
Analytical thinking
Analytical thinking Using problem-
solving skills Analytical thinking
#3 Using problem-
solving skills
Using technical skills for my
specialty
Using problem-solving skills
Communicating with
management
Using problem-solving skills
#4 Analytical thinking
Oral communication
Communicating with management
Exhibiting leadership
skills
Communicating with
management
#5 Attending/conducting
meetings
Communicating with
management
Attending/conducting meetings
Analytical thinking
Exhibiting leadership
skills
Figure 9 shows that alumni working in technical and professional roles are more likely to spend time on operational tasks than employees in other roles. As expected, managers spend the most time engaged in supervisory activities, whereas alumni in entrepreneurial roles spend more time marketing and traveling. Overall, alumni performing administrative roles spread their work time equally across all areas.
Figure 9. Summary of Job Tasks, by Job Role, Classes of 2000–2012 (All Program Types)
Administrative Technical Professional Managerial Entrepreneurial
Job role
Operational tasks Finance and data analysis
Travel and marketing Supervisory tasks
Mostfrequent
Leastfrequent

Alumni Perspectives Survey 2013 Survey Report
© 2013 Graduate Management Admission Council®. All rights reserved. 25
“Typical” Workweek
cross the globe, the structure of the “average” workweek varies by culture, profession, cost of living, national policies, and government regulation.
For business school alumni, the “40-hour workweek,” standard in many industries and countries, is no longer part of the typical experience. On average, business school alumni work five days a week, and nine hours per day. In total, business school alumni work an average of 48 hour per week.
The typical workweek tends to differ by gender. On average, men work 49 hours compared with 46 hours of work for women per week.43 A further examination of typical work hours revealed no differences by job level, and virtually no differences between men and women in the hours worked, whether at lower entry-level jobs or at higher senior and executive-level positions.
Examining average work hours across world regions, survey findings showed some variations, as displayed in Figure 10.
Figure 10. Average Workweek, by Location, Gender, & Mean Number of Hours Worked, Classes 2000–2012 (All Program Types)
43 One-way ANOVA with Bonferroni post hoc analysis, F = 72.675, df = 1, 4156, p < .05.
A
US: 48 hours Men: 49
Women: 46
CANADA: 48 hours Men: 49
Women: 45
ASIA/PI: 49 hours Men: 49
Women: 47
CENTRAL ASIA: 51 hours Men: 52
Women: 44
EUROPE: 49 hours Men: 49
Women: 49
ME/AFRICA: 48 hours Men: 49
Women: 43 LATAM: 50 hours
Men: 50 Women: 46

2013 Survey Report Alumni Perspectives Survey
26 © 2013 Graduate Management Admission Council®. All rights reserved.
Alternative Work Schedules
ast studies have shown that being able to exercise autonomy on the job, particularly with respect to flexible work scheduling (variable hours), has a significant impact on job satisfaction and productivity.44 This continues to be the case in 2012—survey responses
reveal a significant positive correlation between having flexibility in one’s work schedule and job satisfaction.45 In fact, alumni who reported having the option to work a flexible schedule increased their job satisfaction 12 percent over those who did not have such an option.46
Flexible Work Hours
When asked about flexible work schedules, 2 in 5 (40%) alumni overall agreed they are able to set their own hours, and 62 percent indicated they have the opportunity to work a flexible schedule at their job. There were no variations in these findings based on gender or job level. In spite of these opportunities, less than half of alumni reported using flexible work schedules (45%), however.
Telecommuting
Overall, 2 in 5 (43%) alumni are taking advantage of increasing opportunities to telecommute (work from home). Telecommuting options were more likely to be used by alumni who work for large companies (46%)47 and within the consulting (53%) and technology (57%) industries.48 Nearly half (46%) of alumni who reported telecommuting are aged 35 and older, in senior positions (48%), and work primarily in the United States (46%). Again, there were no gender differences seen in the percentages of alumni who telecommute. Alumni were more likely to take advantage of the telecommuting option the farther away from graduation they were. For example, 57 percent of the class of 2001 telecommutes compared with only 39 percent of the class of 2011.
Telecommuters in the respondent sample spend an average of 11 hours a week telecommuting. As mentioned previously, availability of flexible work schedules has a measurable impact on alumni job satisfaction. Seventy-nine percent (79%) of telecommuters expressed satisfaction with their jobs, a slight improvement in job satisfaction compared with 72 percent of those who did not telecommute.49 The degree to which alumni perceive that flexible work schedules are acceptable in their workplace determines how much they avail themselves of this work option (Figure 11).50
44 Society for Human Resource Management (SHRM). 2008. Flexibility in the 21st century. Accessed November 14, 2012: http://www.shrm.org/research/surveyfindings/articles/documents/09-0464_workplace_flexibility_survey_report_inside_finalonline.pdf 45 Pearson’s r = .193, df = 3545, p < .05. 46 Test of two proportions, z = –8.89, p < .05. 47 χ2 = 20.846, df = 2, p < .05. 48 χ2 = 98.065, df = 7, p < .05. 49 Test of two proportions, z = 4.77, p < .05. 50 χ2 = 928.761, df = 2, p < .05. (Use flex time); χ2 = 479.195, df = 1, p < .05. (Telecommute); χ2 = 997.862, df = 1, p < .05.
P

Alumni Perspectives Survey 2013 Survey Report
© 2013 Graduate Management Admission Council®. All rights reserved. 27
Figure 11. Perception of Company’s Alternative Schedule Policy, by Alumni Usage, Classes 2000–2012 (All Program Types)
Measuring Investment in Education
alue can be defined or measured by comparing the outcomes one achieves with one’s initial investment. In reference to a graduate business degree, the value proposition can be posed as the question, “Was it worth it?”
There are several ways to measure the value of a graduate management education—financially, by comparing the salary and earnings gains against the time and expense of attending a graduate program; professionally, by promotions and advancement up the career ladder; and personally, by increased job satisfaction and personal development.
Value of Education
cross all graduating classes and program types, 95 percent of business school alumni rated the value of their education as good, excellent, or outstanding. Current employment status influences how alumni assess the value of their degree. Ninety-six percent (96%) of alumni
working for an employer rated the value of their education highly, compared with 80 percent of unemployed alumni.51 Even among employed alumni, their perception of their own job satisfaction and career success affected how they rated the value of their education. As Figure 12 shows, alumni who reported the greatest satisfaction with their current job were more likely to rate the value of their education favorably.52 There were no differences in alumni ratings of educational value by program type, gender, or world region.
51 χ2 = 92.598, df = 2, p < .05. 52 χ2 = 344.551, df = 4, p < .05; Pearson’s r = .338, df = 3822, p < .05.
65%
57%
19%15%
21%
70%
0%
20%
40%
60%
80%
Use flex time Telecommute Use neither option
Perc
enta
ge o
f re
spo
nd
ents
Agree that alternative schedules are acceptable at my job
Do not agree that alternative schedules are acceptable at my job
V
A

2013 Survey Report Alumni Perspectives Survey
28 © 2013 Graduate Management Admission Council®. All rights reserved.
Figure 12. Rating Value of Education, by Job Satisfaction, Classes 2000–2012 (All Program Types)
Alumni across all graduating classes assess the value of their degrees highly and consider many factors when evaluating their educational investment. They ranked the following three outcomes as the top drivers of educational value: receiving progressively challenging and interesting work, developing managerial knowledge and technical skills, and being enabled to start their own business (Figure 13). Salary potential is a less prominent driver of educational value compared with other employment attributes and is ranked fifth on the list of factors driving educational value.
gmac.com/InteractiveResearch
87%78%
61%
34%29%
13%22%
39%
66%71%
0%
20%
40%
60%
80%
100%
Outstanding Excellent Good Fair Poor
Pe
rce
nta
ge o
f re
spo
nd
en
ts
Value of education
Very satisfied/satisfied Neither/dissatisfied/very dissatisfied

Alumni Perspectives Survey 2013 Survey Report
© 2013 Graduate Management Admission Council®. All rights reserved. 29
Figure 13. Key Outcomes Driving Value of Education, Classes 2000–201253 (All Program Types)
*Other factors include receiving greater recognition and respect at work, ability to obtain an international assignment, personal development, and increased personal confidence.
Financial Investment
oans historically have been a significant and important part of the financial aid package for most students. More than half (51%) of prospective business school students surveyed in 2011 indicated that loans would be part of the financial sources (including personal savings,
grants, fellowships, scholarships, etc.) they would use to pay for their education.54
Overall, 60 percent of alumni reported taking out loans to finance their graduate management education, with no differences seen by graduation year. When surveyed several months before graduation, 59 percent of the class of 2012 expected to graduate with debt. Results from that GMAC student exit study found no relationship between a student’s debt load and the student’s assessment of educational quality, value, or reputation of their program.55
Existence of debt among alumni varied by program type, however. Two-thirds (67%) of full-time MBA alumni reported having loans, compared with 47 percent of part-time MBA alumni, 50 percent of executive MBA alumni, and 48 percent of non-MBA master’s degree-holders.56 Although more full-time MBA alumni have taken out loans compared with all other business school alumni, they
53 Pratt Index: Multiple R = .202; F = 12.616; df = 4056; p < .05. 54 GMAC. (2012). mba.com Prospective Students Survey Report. 55 GMAC. (2012). Global Management Education Graduate Survey Report. (See Table 6.) 56 χ2 = 136.987, df = 3, p < .05.
5%
3%
4%
4%
5%
6%
7%
11%
12%
13%
13%
17%
0% 5% 10% 15% 20%
Other factors*
Able to change occupations
Able to switch industries
Able to have the kind of job desired
Increased my job security
Received promotion
Increased my visibility to upper management
Received desired salary/pay increase
Increased my professional network
Able to start my own business
Developed managerial/technical expertise
Increasingly challenging & interesting work
Pratt Index
L

2013 Survey Report Alumni Perspectives Survey
30 © 2013 Graduate Management Admission Council®. All rights reserved.
also report the highest percentage of loan repayment among all alumni and expressed the fewest concerns about their ability to repay their loans based on their current financial situation.57
Survey responses showed some regional differences in alumni reliance on loans to finance their education (Figure 14).58 Alumni attending school in the United States (63%) and Central Asia (78%) had the highest percentage of student loan debt. Alumni who attended school in Asia/Pacific Islands or Europe had the lowest level of student loan debt (40% and 44%, respectively).
Figure 14. Percentage of Alumni with School Debt, by School Location, Classes 2000–2012 (All Program Types)
Of survey respondents who have yet to pay off their loans, half (50%) said they had no concerns about doing so. A third (33%) reported some concern about their ability to repay their loans based on their current financial situation, and only 18 percent of alumni said they were very or extremely concerned. Similar to responses collected before graduation in 2012, debt burden does not change or determine how alumni view the value of their education—94 percent of alumni who reported holding loan debt after graduation rated the value of their education as good to outstanding compared with the 95 percent of alumni with no loan debt who also rated their education highly for value.
Return on Investment (ROI)
Overall, regardless of program type, alumni experienced a 50 percent return on their investment two years after graduation and a full return after four years. On average, the class of 2012 reported recouping 38 percent of their investment at the time of this survey in comparison to class of 2011
57 χ2 = 93.408, df = 15, p < .05. 58 Taking out a loan: χ2 = 284.097, df = 6, p < .05; loan payback: χ2 = 65.615, df = 30, p < .05.
32%
44%
58% 59%63%
79%
32%17%
39%
18%24% 25%
0%
20%
40%
60%
80%
100%
Asia/PacificIslands
Europe LatinAmerica
Canada UnitedStates
CentralAsia
Perc
enta
ge o
f re
spo
nd
ents
School location
Alumni with loan debt Concerned about paying back loans

Alumni Perspectives Survey 2013 Survey Report
© 2013 Graduate Management Admission Council®. All rights reserved. 31
alumni, who reported recouping 33 percent of their investment the year prior. Furthermore, 74 percent of alumni said the amount recouped has met or exceeded their expectations.
When looking at expectations for ROI by class year across a 10-year span, 86 percent of the class of 2003 felt their ROI had met or exceeded their expectations, compared with 67 percent of the class of 2012. The data suggest that the further removed alumni are, each year after graduation, the more likely they are to report they have met or exceeded their expectations for ROI. These findings are not surprising considering that as alumni progress throughout their career they are likely to see wage increases and promotions that enhance their financial and professional standing. Not only does their actual ROI increase, but their perceptions of having met their ROI expectations also increase the further along they progress in their careers.
Influences in Career Progression
hen assessing the value of a graduate management education, alumni tend to look beyond compensation and ROI and also consider their career progression as a significant outcome measure of their education. Overall, 51 percent of alumni reported receiving a
promotion since they first began working for their employer, for an average of two promotions per respondent. Nearly a third (30%) said they received their promotion faster than they expected and an additional 50 percent felt their promotion occurred within their expected time frame.
Overall, 85 percent of alumni attribute their graduate business education for advancing their careers and 95 percent also cite their personal efforts on the job as a major factor in their career progress. Education and personal effort were the top 2 of 13 factors that alumni cited as influential in their career progress. These items fall into three categories:59
Internal effort (graduate business education, personal efforts, undergraduate education, other graduate education, years of work experience, networking);
Hybrid (supervisor at work, opportunities within one’s company); and
External effort (economic conditions, luck/good fortune, move to a new organization).
Personal or internal efforts are those that alumni contributed to their own career, external factors are outside an individual’s direct control, and hybrid conditions include both alumni internal effort and response to external demands.
Figure 15 shows that internal efforts, such as hard work and a graduate business education, are the driving factors for career progress cited by alumni who reported being ahead or on track in their careers. In comparison, those alumni who feel they are behind in their career progress attribute more influence to external factors and very little to their own internal efforts.
59 A principal components analysis (PCA) is used to summarize and simplify 13 career influencers alumni rated either influential or not influential in their career. Two items were removed due to cross-loading and poor model fit (organizational change and support from family and friends). The remaining 11 items were reduced to three components: internal effort, hybrid conditions, and external effort. The PCA had a multiple r of .418.
W

2013 Survey Report Alumni Perspectives Survey
32 © 2013 Graduate Management Admission Council®. All rights reserved.
Figure 15. Factors Influencing Current State of Career Progress, Classes 2000–2012 (All Program Types)
Connection to Business School
fter graduation, business school alumni have many opportunities to remain active and involved with their graduating institutions through alumni relations and career services offices, networking and social media outlets, and that most powerful reflection of their
affiliation to the alma mater—a personal recommendation.
Recommendations
lumni connections with their alma maters had a positive effect on alumni recommendation intention—word-of-mouth referrals60—as well as on the value they placed on their education. Nearly all alumni across all graduation years would recommend a graduate
management education to others (96%) and specifically would recommend their program (96%), and business school (94%). Alumni who stayed connected with their business school, through the alumni website, alumni services, or career services, for example, were likely to give more positive recommendations about their experience than those who did not maintain contact with their school, however.
60 Value: Pearson’s r = .509, df = 4444, p < .05; Recommend program: Pearson’s r = .119, df = 4444, p < .05; Recommend education: Pearson’s r = .091, df = 4444, p < .05.; Recommend school: Pearson’s r = .155, df = 4444, p < .05.
Ahead in career Career progress ontrack
Behind in career
Internal/personal efforts Hybrid factors External factors
Mostinfluential
Least
influential
A
A

Alumni Perspectives Survey 2013 Survey Report
© 2013 Graduate Management Admission Council®. All rights reserved. 33
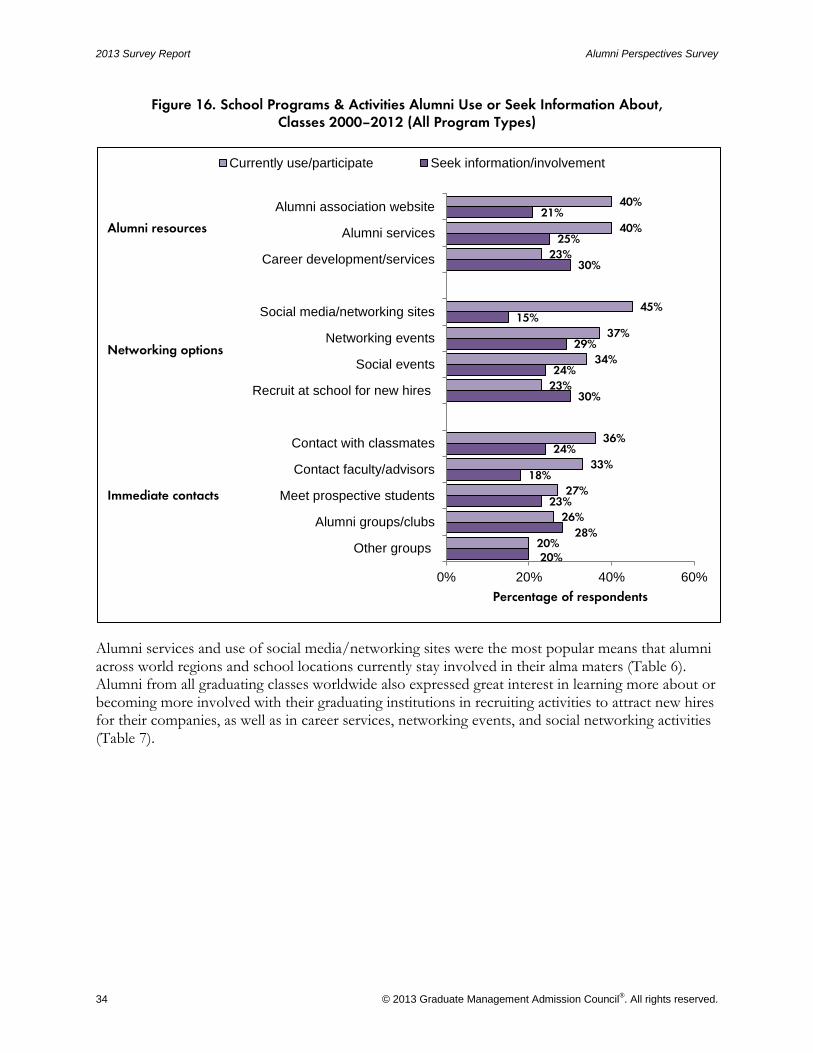
Business School Engagement
he most popular means alumni use to stay connected with their business schools are social media and networking (45%), alumni association websites, and alumni services (40% each; Figure 16). Participation in these activities varies by graduation year and age. The highest
users of social networking sites were recent graduates of the class of 2012 (51%); the lowest were graduates of the class of 2001 (35%). The opposite trend was true for alumni websites, which 45 percent of the class of 2000 reported using, compared with slightly lower rates for the class of 2011 (37%) and 2012 (39%).
No doubt some of these trends reflect ways that alumni have adapted to changes in Internet technology and the recent explosion of social media networking as a primary communication tool (Facebook and Twitter did not exist in 2000.) Knowing the different means alumni use to gather information may help schools reach all segments of their alumni population.
Less than a quarter (23%) of alumni used career development services, although 30 percent expressed a desire for more information or involvement with this service. This was also true for alumni who wished to recruit new hires for their company (30% expressed interest in learning more about this).
gmac.com/InteractiveResearch
T
2013 Survey Report Alumni Perspectives Survey
34 © 2013 Graduate Management Admission Council®. All rights reserved.
Figure 16. School Programs & Activities Alumni Use or Seek Information About, Classes 2000–2012 (All Program Types)
Alumni services and use of social media/networking sites were the most popular means that alumni across world regions and school locations currently stay involved in their alma maters (Table 6). Alumni from all graduating classes worldwide also expressed great interest in learning more about or becoming more involved with their graduating institutions in recruiting activities to attract new hires for their companies, as well as in career services, networking events, and social networking activities (Table 7).
20%
28%
23%
18%
24%
30%
24%
29%
15%
30%
25%
21%
20%
26%
27%
33%
36%
23%
34%
37%
45%
23%
40%
40%
0% 20% 40% 60%
Other groups
Alumni groups/clubs
Meet prospective students
Contact faculty/advisors
Contact with classmates
Recruit at school for new hires
Social events
Networking events
Social media/networking sites
Career development/services
Alumni services
Alumni association website
Percentage of respondents
Currently use/participate Seek information/involvement
Alumni resources
Networking options
Immediate contacts

Alumni Perspectives Survey 2013 Survey Report
© 2013 Graduate Management Admission Council®. All rights reserved. 35
Table 6. Top 3 Alumni Services Used, by School Location
Asia/ Pacific Islands Canada Central Asia Europe
Latin America United States
Alumni services Social
media/social networking
Alumni services
Alumni services
Social media/social networking
Social media/social networking
Social media/social networking
Networking events
Social media/social networking
Alumni association
website
Alumni services
Alumni association
website
Alumni association website
Alumni services Contact with
fellow students
Networking events
Contact with fellow
students Alumni services
Table 7. Top 3 Activities Where Alumni Seek Greater Involvement, by School Location
Asia/ Pacific Islands Canada Central Asia Europe Latin America United States
Recruiting new hires Career
services Career
services Recruiting new
hires Networking
events Career
services
Career services Recruiting new hires
Recruiting new hires
Career services
Alumni groups/clubs
Networking events
Meet prospective students
Alumni services
Alumni groups/clubs
Alumni groups/clubs
Recruiting new hires
Recruiting new hires
Conclusions
verall, survey respondents had reason to be optimistic about the outcomes of their education:
Ninety-two percent (92%) of class of 2012 alumni were employed at graduation—the highest employment rate reported in this survey for any graduating class since 2003. Nearly 7 in 10 had secured a job before leaving graduate business school.
Median starting salaries for class of 2012 alumni worldwide showed gains over those reported by alumni in 2011.
Job tasks that influenced alumni job satisfaction most positively in their daily work were exercising leadership skills, analytical thinking, developing strategic plans, and using problem-solving skills.
Overall, regardless of graduation year, program type, or global location, when asked if they would still pursue graduate management education, more than 9 in 10 (94%) said yes.
O

2013 Survey Report Alumni Perspectives Survey
36 © 2013 Graduate Management Admission Council®. All rights reserved.
Methodology
he Alumni Perspectives Survey, first launched by GMAC in 2001, is a longitudinal research study of graduate business school alumni who have agreed to let GMAC follow their career progression since graduation. The objectives of the survey, which is conducted annually every
September, are to follow alumni employment characteristics both for their first jobs after graduation and their current jobs, employment and compensation trends, job satisfaction, on-the-job expectations, and factors that affect their career development.
The survey sample represented in this report includes graduate business school alumni who participated in past GMAC Global Management Education Graduate Surveys administered to the 2000 through 2012 classes and who agreed to further follow-up through GMAC alumni studies. This year, our research team tested a split-sample methodological condition. Typically, all respondents receive an invitation email, a reminder, and a last-call email. The research team sent one half of the sample a preliminary note a week prior to the invitation and sent nothing to the second half of the sample. Researchers further split the samples by two graduation year conditions, the graduation class of 2012, and all prior classes from 2000 through 2011. The message content was tailored to be appropriate to new graduates or veteran participants in the longitudinal GMAC research. This condition of the preliminary note did not affect earlier or higher response completion, nor did the tailored messaging condition affect response rates. Researchers are conducting further analysis of demographic or attitudinal differences in response items.
The results of this survey do not necessarily reflect a statistically representative sample of graduating students. Because of this limitation, the study results should not be used to generalize about the student population, but they can be seen as a reflection of the sample frame under consideration. Several clear trends emerge from the data, nonetheless.
This summary report analyzes data collected from the 2012 Alumni Perspectives Survey. Table 8 shows the overall response rate and respondent distribution by graduation year, program type, world region, citizenship, school and work location, age, and gender.
T

Alumni Perspectives Survey 2013 Survey Report
© 2013 Graduate Management Admission Council®. All rights reserved. 37
Table 8. Respondent Profile for 2013 Survey Year
N = 4,444
Overall response rate: 12%
Graduation year School location
2000 1% Asia/Pacific Islands 4%
2001 2% United States 75%
2002 2% Canada 5%
2003 3% Latin America 2%
2004 5% Europe 10%
2005 6% Middle East/Africa 1%
2006 7% Central Asia 2%
2007 6% Work location
2008 10% Asia/Pacific Islands 6%
2009 14% Canada 5%
2010 11% Central Asia 4%
2011 14% Europe 9%
2012 19% Latin America 5%
Program type Middle East/Africa 2%
Full-time MBA 63% United States 70%
Part-time MBA 20% Gender
Executive MBA 8% Men 72%
Other degrees 9% Women 28%
Citizenship Current age
Asia/Pacific Islands 6% 27 and younger 8%
Canada 5% 28 to 34 45%
Central Asia 8% 35 and older 47%
Europe 9%
Latin America 7%
Middle East/Africa 2%
United States 64%
Regional Location of Survey Respondents
orld geographic classifications used in this report for work location differ based on graduation year. The following geographic classifications include the countries within each region that were represented in the 2012 survey and are divided into two groups: class of
2012, and all classes from 2000 to 2012 inclusive.
Asia/Pacific Islands (Asia/PI): Class of 2012: Australia, China, Hong Kong (SAR of China), Indonesia, Japan, Malaysia, Mongolia, Myanmar, New Zealand, Philippines, Singapore, South Korea, Taiwan, Thailand; Classes of 2000–2012: Australia, China, Hong Kong (SAR of China), Indonesia, Japan, Malaysia, Mongolia, Myanmar, New Zealand, Philippines, Singapore, South Korea, Taiwan, Thailand, Viet Nam.
Canada: All classes: Canada.
W

2013 Survey Report Alumni Perspectives Survey
38 © 2013 Graduate Management Admission Council®. All rights reserved.
Central Asia: Class of 2012: India, Kazakhstan, Nepal, Uzbekistan; Classes of 2000–2012: Afghanistan, India, Kazakhstan, Nepal, Pakistan, Uzbekistan.
Europe: Class of 2012: Belgium, Bulgaria, Denmark, Estonia, Finland, France, Germany, Greece, Iceland, Ireland, Italy, Latvia, Luxembourg, Norway, Portugal, Russian Federation, Spain, Switzerland, Ukraine, United Kingdom; Classes of 2000–2012: Albania, Andorra, Austria, Belgium, Bulgaria, Cyprus, Czech Republic, Denmark, Estonia, Finland, France, Georgia, Germany, Greece, Iceland, Ireland, Italy, Kosovo, Latvia, Luxembourg, Malta, Netherlands, Norway, Poland, Portugal, Romania, Russian Federation, Slovakia, Spain, Sweden, Switzerland, Ukraine, United Kingdom.
Latin America: Class of 2012: Brazil, Chile, Colombia, Costa Rica, Dominican Republic, Ecuador, Guatemala, Mexico, Nicaragua, Panama, Peru; Classes of 2000–2012: Argentina, Bermuda, Bolivia, Brazil, Chile, Colombia, Costa Rica, Dominican Republic, Ecuador, El Salvador, Guatemala, Honduras, Mexico, Nicaragua, Panama, Peru, Suriname, Venezuela.
Middle East/Africa: Class of 2012: Israel, Jordan, Kenya, Lebanon, Mali, Mozambique, Rwanda, Saudi Arabia, South Africa, Turkey, United Arab Emirates; Classes of 2000–2012: Bahrain, Botswana, The Democratic Republic Congo, Egypt, Ethiopia, Ghana, Iraq, Israel, Jordan, Kenya, Kuwait, Lebanon, Madagascar, Mali, Mozambique, Nigeria, Oman, Occupied Palestinian Territory, Qatar, Rwanda, Saudi Arabia, South Africa, Tunisia, Turkey, United Arab Emirates, Zambia.
United States: All classes: United States of America and its territories.
Contact Information
or questions or comments regarding the study findings, methodology, or data, please contact the GMAC Research and Development department at [email protected].
Contributors
aura Leach, Survey Research Manager, Lead Author, Research & Development Department, Graduate Management Admission Council (GMAC), design, analysis and interpretation of data and the drafting/revising of the manuscript for intellectual content; Paula Bruggeman, R
& D Editor-Writer, Manager, Lead Editor, GMAC, review, editing, and revising of survey questionnaire and manuscript; Veronica Sinz, Lead Research Publications Manager, GMAC, editorial review and graphic development; Gregg Schoenfeld, Director, Management Education Research, GMAC, review of questionnaire, analysis, and manuscript; Michelle Sparkman Renz, Director, Research Communications, GMAC, manuscript review; and Dr. Lawrence M. Rudner, Vice President, Research and Development, GMAC, manuscript review.
F
L

Alumni Perspectives Survey 2013 Survey Report
© 2013 Graduate Management Admission Council®. All rights reserved. 39
Acknowledgements
MAC especially expresses its thanks to the 4,444 graduate management alumni who completed the 2012 survey questionnaire. Without your feedback, this report would not have been possible.
G
STUDENT EXIT AND EMPLOYER DATA
gmac.com/surveysignup

Alumni PersPectives survey • 2011 – 2012
11921 Freedom Drive, Suite 300Reston, VA 20190 gmac.com mba.com
[email protected]/surveys twitter.com/GMACResearchers
© 2013 Graduate Management Admission Council® (GMAC®). All rights reserved.
No part of this publication may be reproduced, stored in a retrieval system, distributed or transmitted in any form by any means, electronic, mechanical, photocopying, recording or otherwise, without the prior written permission of GMAC. For permission contact the GMAC legal department at [email protected].
The GMAC logo, GMAC®, GMAT®, Graduate Management Admission Council®, and Graduate Management Admission Test® are registered trademarks of the Graduate Management Admission Council in the United States and other countries.
T he Alumni Perspectives Survey is one in a series of five annual or biannual surveys produced by the Graduate Management Admission Council® that explore relevant issues in graduate management education. Survey reports provide an overview of data in addition
to offering context for and discussing implications of the research. They frequently are used to help drive strategic decision-making processes in graduate business schools. All survey reports are available online at gmac.com/surveys. Print copies are free upon request from the GMAC® Research and Development Department at [email protected].
Other GMAC® surveys include—
mba.com Prospective Students Survey
Who is in the pipeline for a graduate business degree? What factors influence their enrollment decisions? Launched in 2003, this annual survey (formerly known as the mba.com Registrants Survey) profiles prospective students, tracking how and why they move through the pipeline, and what motivates them and gets their attention.
Application Trends Survey
How does a school’s application volume compare with that of other schools? Since its debut in 1999, this annual two-part survey compares current and previous year application data for business school programs worldwide, highlighting trends by program type and world region.
Global Management Education Graduate Survey
What value do business school students place on their education as they prepare to graduate? Premiering in 2000, this survey is conducted every February to provide a comprehensive picture of soon-to-be graduates: who they are, how they chose their schools, how satisfied they are with their education, and where they are headed after they graduate.
Corporate Recruiters Survey
Who hires MBAs and why? What are the hiring plans in various industries? How do companies decide where to recruit? Launched in 2001–2002, this annual survey helps schools better understand the job market, clarify employer expectations, and benchmark their career services practices. Employers use the survey results to benchmark the MBA recruitment activities of their companies.
2012