Embed Size (px)
Citation preview

©2014 The Advisory Board Company 1 eab.com
Advancement Forum
University of Cincinnati McMicken College of Arts and Sciences
Alumni Survey Results
eab.com Research Brief

©2014 The Advisory Board Company 2 eab.com
Advancement Forum
Monica Joy Wilson
Research Associate
Joe LeMaster
Research Manager
LEGAL CAVEAT
The Advisory Board Company has made efforts to verify the accuracy of the information it provides to members. This report relies on data obtained from many sources, however, and The Advisory Board Company cannot guarantee the accuracy of the information provided or any analysis based thereon. In addition, The Advisory Board Company is not in the business of giving legal, medical, accounting, or other professional advice, and its reports should not be construed as professional advice. In particular, members should not rely on any legal commentary in this report as a basis for action, or assume that any tactics described herein would be permitted by applicable law or appropriate for a given member’s situation. Members are advised to consult with appropriate professionals concerning legal, medical, tax, or accounting issues, before implementing any of these tactics. Neither The Advisory Board Company nor its officers, directors, trustees, employees and agents shall be liable for any claims, liabilities, or expenses relating to (a) any errors or omissions in this report, whether caused by The Advisory Board Company or any of its employees or agents, or sources or other third parties, (b) any recommendation or graded ranking by The Advisory Board Company, or (c) failure of member and its employees and agents to abide by the terms set forth herein.
The Advisory Board is a registered trademark of The Advisory Board Company in the United States and other countries. Members are not permitted to use this trademark, or any other Advisory Board trademark, product name, service name, trade name, and logo, without the prior written consent of The Advisory Board Company. All other trademarks, product names, service names, trade names, and logos used within these pages are the property of their respective holders. Use of other company trademarks, product names, service names, trade names and logos or images of the same does not necessarily constitute (a) an endorsement by such company of The Advisory Board Company and its products and services, or (b) an endorsement of the company or its products or services by The Advisory Board Company. The Advisory Board Company is not affiliated with any such company.
IMPORTANT: Please read the following.
The Advisory Board Company has prepared this report for the exclusive use of its members. Each member acknowledges and agrees that this report and the information contained herein (collectively, the “Report”) are confidential and proprietary to The Advisory Board Company. By accepting delivery of this Report, each member agrees to abide by the terms as stated herein, including the following:
1. The Advisory Board Company owns all right, title and interest in and to this Report. Except as stated herein, no right, license, permission or interest of any kind in this Report is intended to be given, transferred to or acquired by a member. Each member is authorized to use this Report only to the extent expressly authorized herein.
2. Each member shall not sell, license, or republish this Report. Each member shall not disseminate or permit the use of, and shall take reasonable precautions to prevent such dissemination or use of, this Report by (a) any of its employees and agents (except as stated below), or (b) any third party.
3. Each member may make this Report available solely to those of its employees and agents who (a) are registered for the workshop or membership program of which this Report is a part, (b) require access to this Report in order to learn from the information described herein, and (c) agree not to disclose this Report to other employees or agents or any third party. Each member shall use, and shall ensure that its employees and agents use, this Report for its internal use only. Each member may make a limited number of copies, solely as adequate for use by its employees and agents in accordance with the terms herein.
4. Each member shall not remove from this Report any confidential markings, copyright notices, and other similar indicia herein.
5. Each member is responsible for any breach of its obligations as stated herein by any of its employees or agents.
6. If a member is unwilling to abide by any of the foregoing obligations, then such member shall promptly return this Report and all copies thereof to The Advisory Board Company.
©2014 The Advisory Board Company 3 eab.com
Table of Contents
1) Executive Overview ............................................................................................................................. 4
Key Observations .................................................................................................................................. 4
2) Demographic Information of Survey Respondents ......................................................................... 5
Class Year ............................................................................................................................................. 5
Gender and Location ............................................................................................................................. 5
3) Employment Status ............................................................................................................................. 7
Industry, Employer, and Salary ............................................................................................................. 7
Securing a Job and Unemployment .................................................................................................... 10
4) Post-Baccalaureate Education ......................................................................................................... 12
Graduate School by Class .................................................................................................................. 12
Completed a Graduate Degree ........................................................................................................... 12
Currently Enrolled in Graduate School ............................................................................................... 14
Employment and Current Graduate Students ..................................................................................... 15
5) Reported McMicken Experience ....................................................................................................... 17
Undergraduate Opportunities .............................................................................................................. 17
Plans for the Next Five Years ............................................................................................................. 18

©2014 The Advisory Board Company 4 eab.com
1) Executive Overview
Most survey respondents currently work full-time in industries such as education,
health, and technology. Other common industries include business and operations,
marketing and media, government, and non-profit. Seventy-three percent of employed
respondents who are not simultaneously in graduate school believe their current position
is somewhat or very related to their field of study at the University of Cincinnati (UC).
About half of all full- or part-time employed respondents earn between $30,000 and
$50,000, and 26 percent earn a salary greater than $50,000.
Nearly half of all survey respondents have already completed or are currently
pursuing a post-baccalaureate degree, and an additional 23 percent of
respondents intend to pursue further education in the next five years. The social
sciences and humanities were the most popular disciplines of study for respondents who
have already completed a graduate degree. Thirty- four percent of currently enrolled
graduate students and 77 percent of respondents who have already completed a post-
baccalaureate degree matriculated at the University of Cincinnati. Of the students who
are currently enrolled in graduate programs, 54 percent are simultaneously working in
industries that most respondents feel is somewhat or very related to both their current
field of study and their field of study at UC.
Respondents report written and verbal communication as the most applicable skill
gained at UC for their current professional and educational pursuits. Other highly
ranked skills include the ability to problem solve, research, and think creatively. Students
also praised the networking, analytic, and leadership skills they gained at McMicken.
Additionally, 38 percent of respondents completed an internship or co-op while at
McMicken, and 58 percent participated in research. Other common experiential learning
opportunities include service learning, study abroad, and ROTC.
Half of all respondents plan to continue in their current career, while 26 percent
intend to change careers and 23 percent wish to pursue additional education in
the next five years. Only three respondents plan to leave the workforce to start a
family. Several respondents in graduate school prioritize completion of their degree. Of
the respondents who plan to enroll in further education, 22 percent hope to obtain a PhD
and 31 percent a Master’s degree.
Key Observations

©2014 The Advisory Board Company 5 eab.com
Class of 2009, 93
Class of 2012, 164
Male, 89
Female, 165
Other, 1 I prefer not to say, 2
2) Demographic Information of Survey Respondents
Two Hundred and Thirty Three UC McMicken Alumni from the Classes of 2009 and 2012 Completed the Survey
While 258 alumni began the survey, 25 respondents exited at various points throughout
the questionnaire; 233 alumni completed the entire survey.
Graduation Class of Survey Respondents
Most Survey Respondents are Female and Currently Reside in Ohio
Sixty-four percent of survey respondents are female, and 35 percent are male. Sixty-
eight percent currently live in Ohio, while 28 percent live elsewhere in the United States
and three percent live abroad.
Gender of Survey Respondents
Many respondents noted in comment boxes later in the survey that they did not graduate in either class of 2009 or 2012, or did not complete their undergraduate degree at UC McMicken.
n=257
n=257
Class Year
Gender and Location
Total not equal to 100% due to rounding.
©2014 The Advisory Board Company 6 eab.com
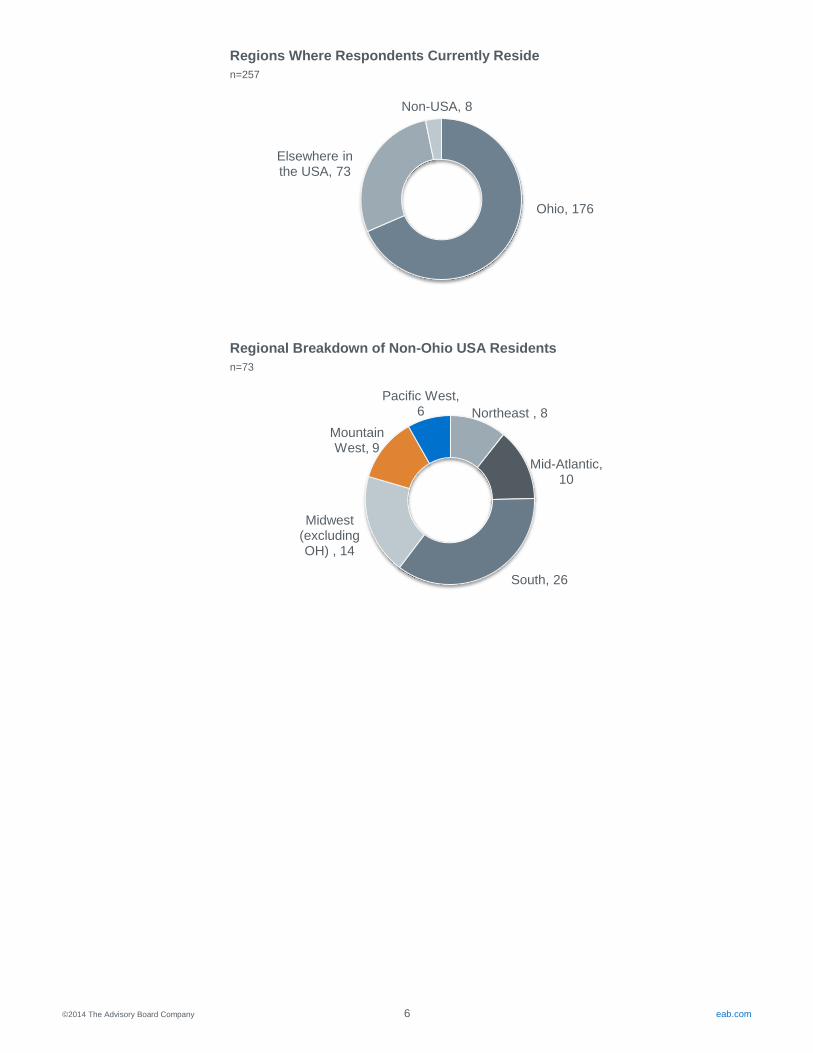
Regions Where Respondents Currently Reside
Regional Breakdown of Non-Ohio USA Residents
Ohio, 176
Elsewhere in the USA, 73
Non-USA, 8
Northeast , 8
Mid-Atlantic, 10
South, 26
Midwest (excluding OH) , 14
Mountain West, 9
Pacific West, 6
n=73
n=257

©2014 The Advisory Board Company 7 eab.com
Full-Time, 187
Part-Time, 16
Unemployed, 18
Graduate Student, 35
1
5
5
6
9
11
12
13
15
17
19
20
21
36
0 5 10 15 20 25 30 35 40
Law
Social Services
Sales
Retail
Finance
Manufacturing
Non-Profit
Marketing & Media
Government
Business & Operations
Technology
Other
Health
Education
3) Employment Status
Most Survey Respondents Work Full-Time in Industries Such As Education and Health
Seventy-nine percent of all survey respondents are employed full- or part-time, seven
percent are unemployed, and 14 percent are currently in graduate school. Of the
employed respondents, 73 percent work in an industry that is either somewhat or very
related to their field of study at UC. The majority of employed respondents earn between
$30,000 and $50,000 and work in the education, health, technology, and business
industries. Top employers include the University of Cincinnati, the University of
Cincinnati Foundation, Cincinnati Children’s Hospital, and PNC Bank.
Current Employment Status of All Respondents
Industries of Respondents Employed Full-Time or Part-Time
Industry, Employer, and Salary
n=256
n=256
n=190
Other industries include aviation, architecture, and animal care.
Includes graduate students who are also currently employed.
©2014 The Advisory Board Company 8 eab.com
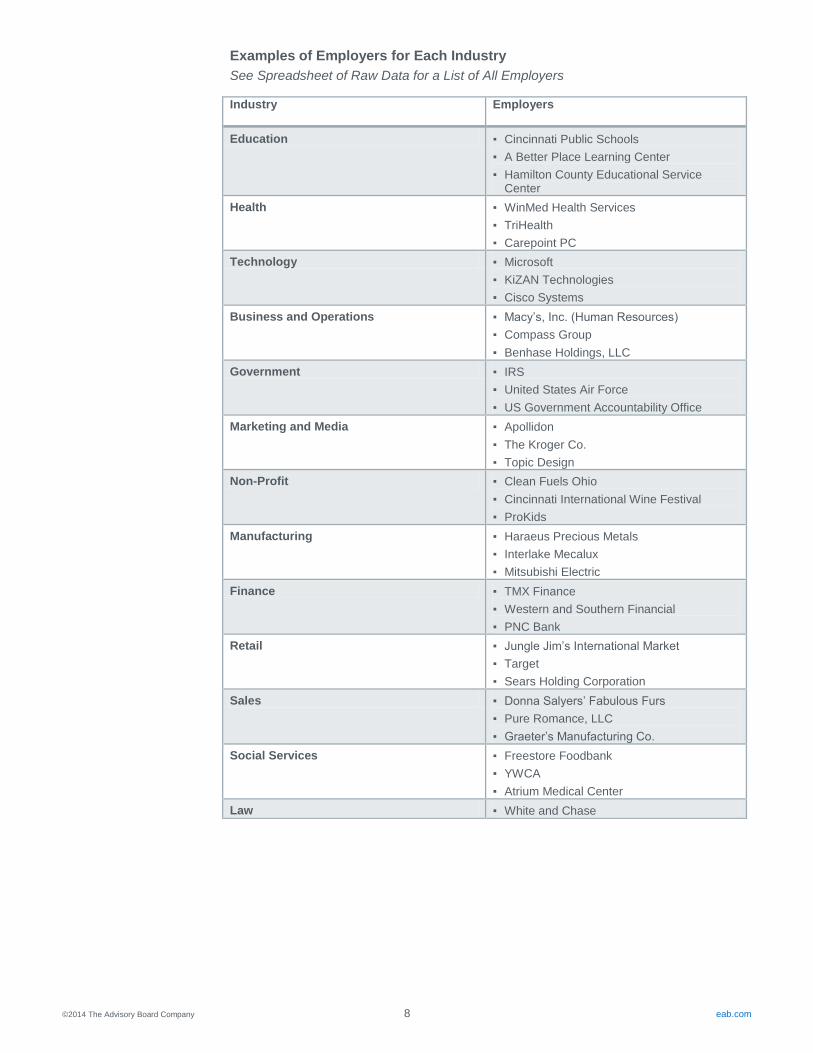
Examples of Employers for Each Industry
See Spreadsheet of Raw Data for a List of All Employers
Industry Employers
Education ▪ Cincinnati Public Schools
▪ A Better Place Learning Center
▪ Hamilton County Educational Service Center
Health ▪ WinMed Health Services
▪ TriHealth
▪ Carepoint PC
Technology ▪ Microsoft
▪ KiZAN Technologies
▪ Cisco Systems
Business and Operations ▪ Macy’s, Inc. (Human Resources)
▪ Compass Group
▪ Benhase Holdings, LLC
Government ▪ IRS
▪ United States Air Force
▪ US Government Accountability Office
Marketing and Media ▪ Apollidon
▪ The Kroger Co.
▪ Topic Design
Non-Profit ▪ Clean Fuels Ohio
▪ Cincinnati International Wine Festival
▪ ProKids
Manufacturing ▪ Haraeus Precious Metals
▪ Interlake Mecalux
▪ Mitsubishi Electric
Finance ▪ TMX Finance
▪ Western and Southern Financial
▪ PNC Bank
Retail ▪ Jungle Jim’s International Market
▪ Target
▪ Sears Holding Corporation
Sales ▪ Donna Salyers’ Fabulous Furs
▪ Pure Romance, LLC
▪ Graeter’s Manufacturing Co.
Social Services ▪ Freestore Foodbank
▪ YWCA
▪ Atrium Medical Center
Law ▪ White and Chase

©2014 The Advisory Board Company 9 eab.com
Extent to Which Respondents’ Current Position Relates to Their Field of Study at UC
Salaries of Respondents Employed Full-Time or Part-Time
65
74
22
29
0
10
20
30
40
50
60
70
80
Very Related Somewhat Related Not Very Related Not Related At All
8
36
19
6
1 1 1 1
29
62
18
2 1 0 0
5
0
10
20
30
40
50
60
70
Class of 2009
Class of 2012
n=190
n=190

©2014 The Advisory Board Company 10 eab.com
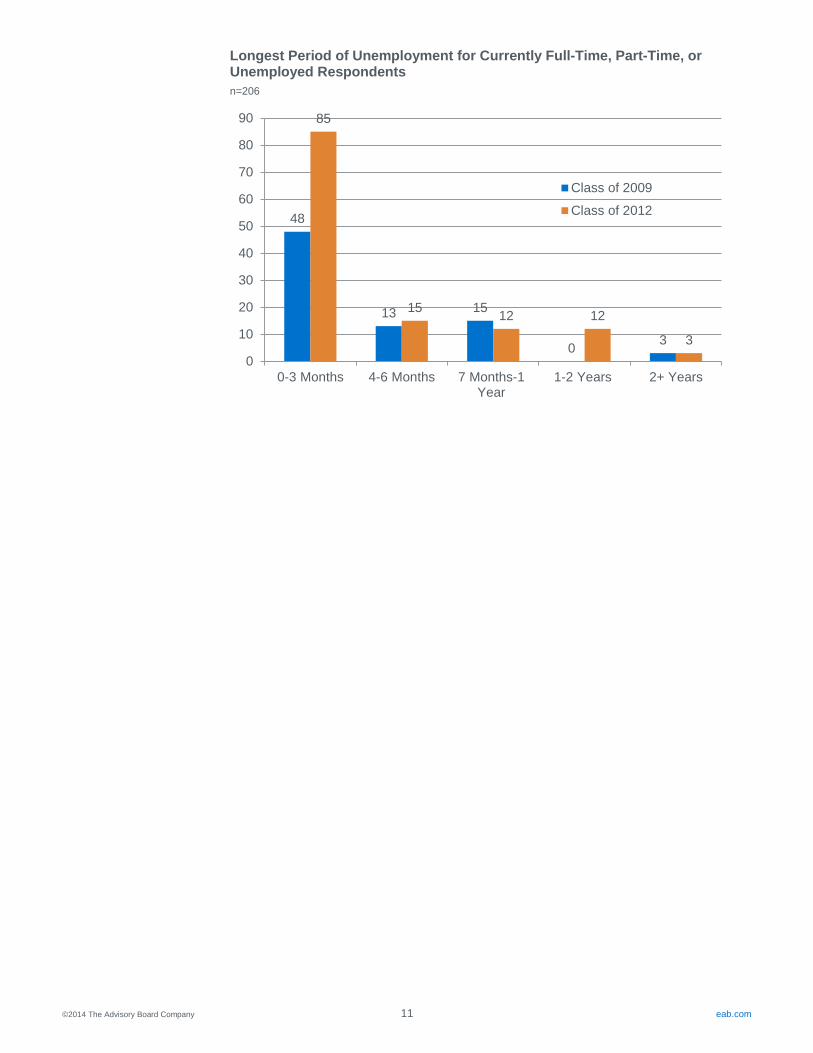
Most Respondents Secured a Job within Three Months of Graduation and Have Not Held More Than Two Jobs
No significant differences in unemployment exist between the classes of 2009 and 2012.
The majority of respondents from each class secured a job before or within three months
of graduation and spent either no time or less than three months unemployed. Of all the
survey respondents, only 25 percent have held more than two jobs since graduation.
Length of Time for Full-Time, Part-Time, or Currently Unemployed Respondents to Secure First Job after Graduation
Number of Jobs Full-Time, Part-Time, or Currently Unemployed Respondents Have Held Since Graduation
36
9 13
10 5
0
6
67
12
22
13
6
0
7
0
10
20
30
40
50
60
70
80
0-3 Months4-6 Months 7 Months-1 Year
1-2 Years 2-4 Years 5+ Years N/A
Class of 2009
Class of 2012
24
30
18
5 2
50 50
17
6 4
0
10
20
30
40
50
60
1 Job 2 Jobs 3 Jobs 4 Jobs 5+ Jobs
Class of 2009
Class of 2012
Securing a Job and Unemployment
n=206
Survey question did not specify if the length of time to find first job includes time spent job searching while still a student.
n=206
©2014 The Advisory Board Company 11 eab.com
Longest Period of Unemployment for Currently Full-Time, Part-Time, or Unemployed Respondents
48
13 15
0 3
85
15 12 12
3
0
10
20
30
40
50
60
70
80
90
0-3 Months 4-6 Months 7 Months-1Year
1-2 Years 2+ Years
Class of 2009
Class of 2012
n=206

©2014 The Advisory Board Company 12 eab.com
4) Post-Baccalaureate Education
Nearly Half of All Survey Respondents Have Already Completed or are Pursuing a Graduate Degree
A total of 114 respondents have finished or are currently enrolled in graduate school,
and an additional 54 respondents intend to pursue additional education in the next five
years.
Class Breakdown of Post-Baccalaureate Education
Currently Enrolled Already Completed a Degree
Class of 2009 8 35
Class of 2012 27 44
Total 35 79
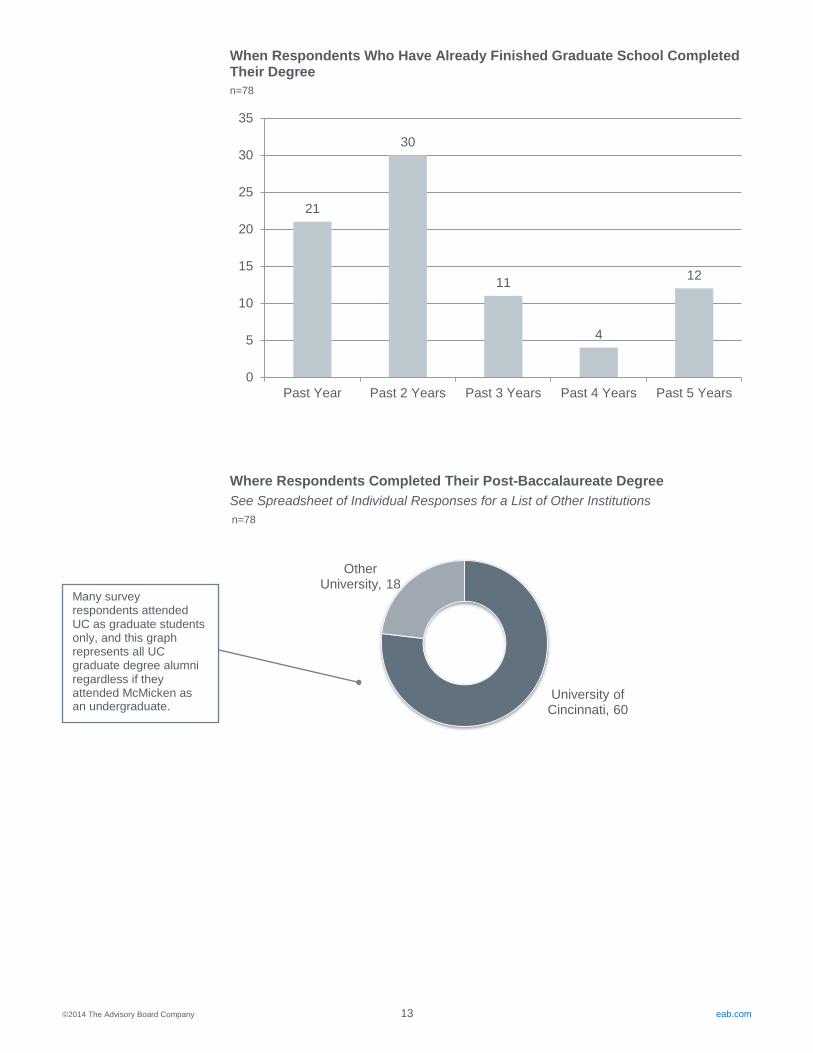
Thirty- Eight Percent of Respondents Who are Not Currently in Graduate School Have Completed a Post-Baccalaureate Degree
Most of the 38 percent of currently employed or unemployed respondents who hold a
post-baccalaureate degree completed their degree within the past two years. Seventy-
seven percent of these respondents obtained their graduate degrees at the University of
Cincinnati. Other institutions include Xavier University, the University of South Florida,
and American University, and the University of Leipzig. Common fields studied include
Chemistry, Communications, Human Resources, History, Marketing, Psychology, and
Sociology.
Respondents Not Currently in Graduate School who Have Completed a Post-Baccalaureate Degree
Have Completed a Degree, 79 Have Not
Completed a Degree, 127
Completed a Graduate Degree
n=206
Graduate School by Class
©2014 The Advisory Board Company 13 eab.com
University of Cincinnati, 60
Other University, 18
When Respondents Who Have Already Finished Graduate School Completed Their Degree
Where Respondents Completed Their Post-Baccalaureate Degree
See Spreadsheet of Individual Responses for a List of Other Institutions
21
30
11
4
12
0
5
10
15
20
25
30
35
Past Year Past 2 Years Past 3 Years Past 4 Years Past 5 Years
n=78
Many survey respondents attended UC as graduate students only, and this graph represents all UC graduate degree alumni regardless if they attended McMicken as an undergraduate.
n=78
©2014 The Advisory Board Company 14 eab.com
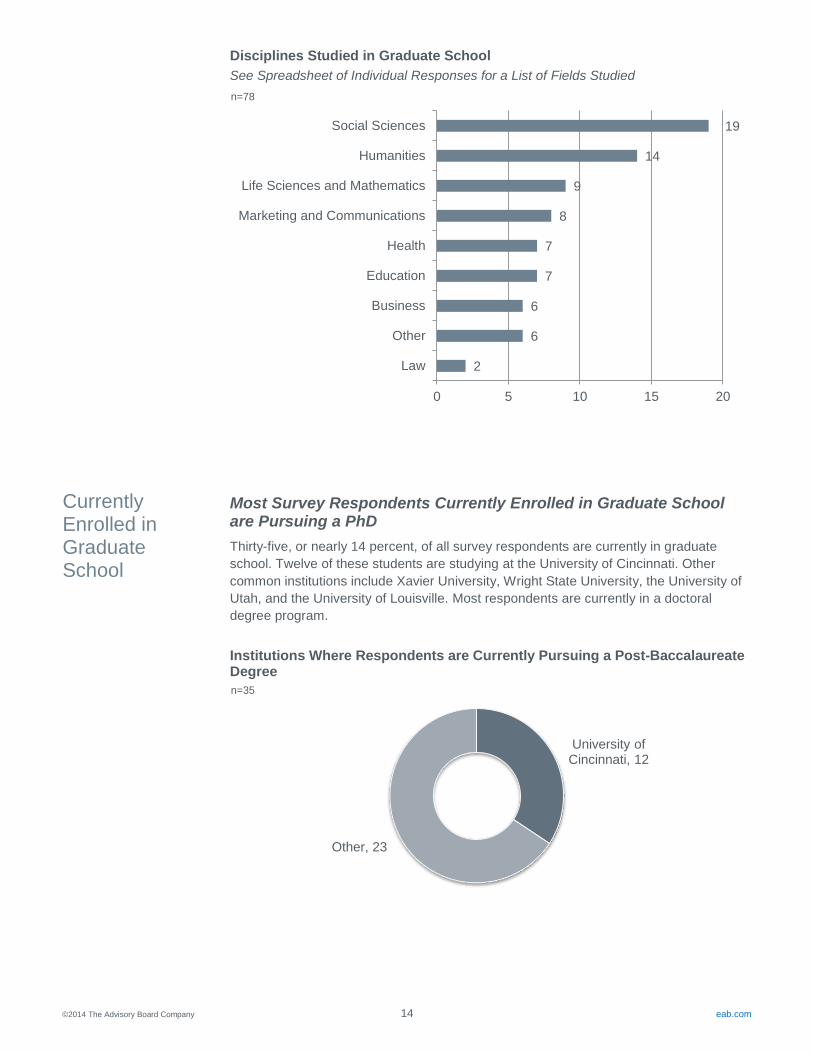
Disciplines Studied in Graduate School
See Spreadsheet of Individual Responses for a List of Fields Studied
Most Survey Respondents Currently Enrolled in Graduate School are Pursuing a PhD
Thirty-five, or nearly 14 percent, of all survey respondents are currently in graduate
school. Twelve of these students are studying at the University of Cincinnati. Other
common institutions include Xavier University, Wright State University, the University of
Utah, and the University of Louisville. Most respondents are currently in a doctoral
degree program.
Institutions Where Respondents are Currently Pursuing a Post-Baccalaureate Degree
2
6
6
7
7
8
9
14
19
0 5 10 15 20
Law
Other
Business
Education
Health
Marketing and Communications
Life Sciences and Mathematics
Humanities
Social Sciences
University of Cincinnati, 12
Other, 23
Currently Enrolled in Graduate School
n=78
n=35
©2014 The Advisory Board Company 15 eab.com
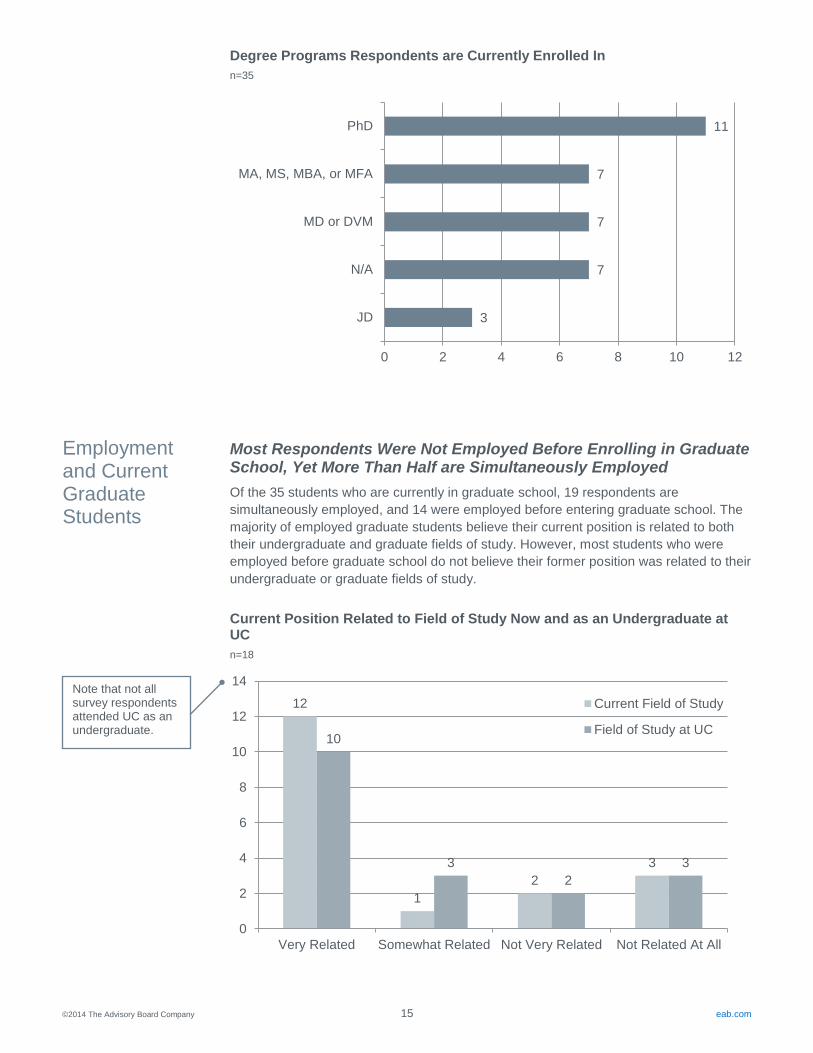
Degree Programs Respondents are Currently Enrolled In
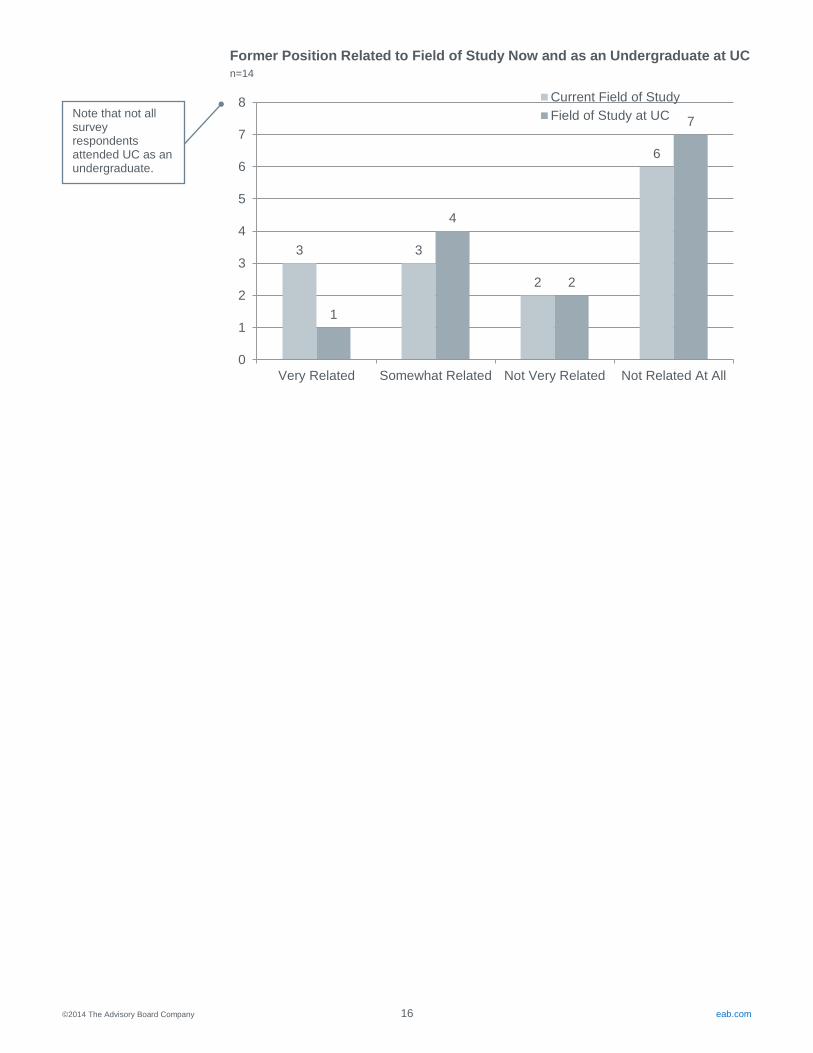
Most Respondents Were Not Employed Before Enrolling in Graduate School, Yet More Than Half are Simultaneously Employed
Of the 35 students who are currently in graduate school, 19 respondents are
simultaneously employed, and 14 were employed before entering graduate school. The
majority of employed graduate students believe their current position is related to both
their undergraduate and graduate fields of study. However, most students who were
employed before graduate school do not believe their former position was related to their
undergraduate or graduate fields of study.
Current Position Related to Field of Study Now and as an Undergraduate at UC
3
7
7
7
11
0 2 4 6 8 10 12
JD
N/A
MD or DVM
MA, MS, MBA, or MFA
PhD
12
1
2
3
10
3
2
3
0
2
4
6
8
10
12
14
Very Related Somewhat Related Not Very Related Not Related At All
Current Field of Study
Field of Study at UC
n=35
n=18
Employment and Current Graduate Students
Note that not all survey respondents attended UC as an undergraduate.
©2014 The Advisory Board Company 16 eab.com
3 3
2
6
1
4
2
7
0
1
2
3
4
5
6
7
8
Very Related Somewhat Related Not Very Related Not Related At All
Current Field of Study
Field of Study at UC
Former Position Related to Field of Study Now and as an Undergraduate at UC
n=14
Note that not all survey respondents attended UC as an undergraduate.

©2014 The Advisory Board Company 17 eab.com
5) Reported McMicken Experience
Most Respondents Participated in Research or Service Learning at UC and Report Written and Verbal Communication as the Most Valuable Skill Learned
Respondents believe written and verbal communication and the ability to problem solve
are the most relevant skills gained at UC for their current professional and educational
pursuits. Other skills listed include photography, analytics, independence, networking,
language skills, leadership, and confidence. Thirty-eight percent of respondents
completed an internship or co-op while at UC, and more than half of respondents
participated in research.
Skills Gained at UC that Respondents Believe are Most Applicable to Current Professional or Educational Pursuits
Respondents Who Completed an Internship or Co-Op While at UC
Problem Solving, 138
Research, 110
Teamwork, 96
Creative Thinking, 104
Yes, 89
No, 144
n=234
n=233
Undergraduate Opportunities
Note that not all survey respondents attended UC as an undergraduate.
Written and Verbal Communication,
187
The survey asked respondents to “check all that apply.”

©2014 The Advisory Board Company 18 eab.com
Respondents Participated in the Following Experiential Learning Opportunities While at UC
Additional Experiential Learning Opportunities
Learning Opportunities Listed in Comment Box Responses
Number of Respondents
Did not participate in any experiential learning opportunity
36
Internship 7
ROTC 4
Other 11
Half of the Survey Respondents Plan to Continue in Their Current Career
In the next five years, half of respondents intend to continue in their current career while
about a quarter plan to change careers or pursue additional education. Of the 23 percent
of respondents who wish to pursue additional education, most plan to obtain a Masters
degree.
31
134
96
0
20
40
60
80
100
120
140
160
Study Abroad Research Service Learning
n=233
Respondents were required to select at least one of these three options but also listed additional experiential learning opportunities in the comment box provided.
Plans for the Next Five Years
The survey asked respondents to “check all that apply.”

©2014 The Advisory Board Company 19 eab.com
Respondents’ Plans for the Next Five Years
Additional Education Respondents Wish to Pursue in the Next Five Years
Continue in Current
Career, 116
Change Careers, 60
Pursue Additional
Education, 54
Masters, 17
PhD, 12
Other, 11
Law, 2
MBA, 5
n=233
n=54
Leave the Workforce to Raise a Family, 3
Intend to complete current degree, 7