Embed Size (px)
Citation preview
2013 Annual Deployment Plan for Observers in the Groundfish and
Halibut Fisheries off Alaska
January 2013
Fisheries Monitoring and Analysis Division, Alaska Fisheries Science Center
National Marine Fisheries Service, NOAA Fisheries
7600 Sand Point Way NE, Seattle, WA 98115.
National Marine Fisheries Service, Alaska Regional Office
709 W. 9th Street
Juneau, Alaska 99802

i
Table of Contents
Chapter 1: 2013 Annual Deployment Plan ................................................................................................... 1
1.1 Purpose of the Deployment Plan ...................................................................................................... 1
1.2 ADP Process .................................................................................................................................... 2
1.3 Changes to the Draft 2013 ADP ...................................................................................................... 2
1.4 Evaluation of changes to the Draft 2013 ADP ................................................................................. 4
1.5 2013 deployment summary .............................................................................................................. 6
1.5.1 At-sea selection pools (strata) ..................................................................................... 7
1.5.2 Dockside sampling ...................................................................................................... 8
1.5.3 Electronic monitoring ................................................................................................. 8
1.5.4 Outreach for 2012/2013 .............................................................................................. 8
Chapter 2: October 2012 Draft Annual Deployment Plan .......................................................................... 10
2.1 The current NPGOP sampling design ............................................................................................ 10
2.2 Goal for 2013 ................................................................................................................................. 10
2.3 Deployment strata for 2013 ........................................................................................................... 11
2.3.1 Trip-selection stratum ............................................................................................... 12
2.3.2 Vessel-selection stratum ........................................................................................... 13
2.4 How observer effort will be allocated among strata ...................................................................... 14
2.4.1 At-sea sampling ........................................................................................................ 14
2.4.2 Dockside sampling .................................................................................................... 16
2.5 Evaluation of the program goal ...................................................................................................... 16
2.5.1 Evaluation analysis 1: Determination of the deployment rate (r) ............................. 17
2.5.2 Evaluation analysis 2: Anticipated changes to CV coverage .................................... 18
2.5.3 Evaluation Analysis 3: Anticipated changes to the number of lengths and specimens
................................................................................................................................... 19
2.5.4 Evaluation Analysis 4: Anticipated cost of dockside sampling for GOA salmon
genetics ..................................................................................................................... 21
2.5.5 Evaluation Analysis 5: Summary of total observer deployment in the fleet ............ 22
2.6 Methods to evaluate the 2013 Observer program in 2013 ............................................................. 23
2.7 Innovation for 2013........................................................................................................................ 23
2.8 Acknowledgements ........................................................................................................................ 25
2.9 Literature Cited .............................................................................................................................. 25
2.10 Tables ........................................................................................................................................ 27
2.11 Figures ....................................................................................................................................... 32

ii
Appendix 1.1 September 2012 Minutes of the Joint BSAI and GOA Groundfish Plan Teams ................. 40
Appendix 1.2 October 2012 SSC meeting minutes .................................................................................... 42
Appendix 1.3 October 6, 2012, Final Council motion ................................................................................ 44
Appendix 1.4 December 2012 NMFS letter to the council ......................................................................... 46
Appendix 1.5 Full Coverage Letter for the BSAI Pacific Cod Fleet .......................................................... 53
Appendix 2.1 Background information ...................................................................................................... 55
History of the North Pacific Groundfish Observer Program (NPGOP) .................................................. 55
Towards a restructured observer program .............................................................................................. 56
Background to the 2013 Innovation ........................................................................................................ 58
Case-studies of EM in the North Pacific ............................................................................... 58
Literature Cited ....................................................................................................................................... 60
Appendix 2.2 Effort Calculations ............................................................................................................... 62
Problem statement ................................................................................................................................... 62
Available data ......................................................................................................................................... 62
Data limitations ....................................................................................................................................... 62
Methods .................................................................................................................................................. 63
Defining a trip ....................................................................................................................... 63
Creation of the OBSFRAME ................................................................................................ 63
Calculating trip duration ....................................................................................................... 64
Enumerating yearly effort ..................................................................................................... 65
Tables and Figures. ................................................................................................................................. 66
Appendix 2.3. Abbreviated methods........................................................................................................... 69
Appendix 2.4 ORAnG analysis of Council motion .................................................................................... 75

1
Chapter 1: 2013 Annual Deployment Plan
1.1 Purpose of the Deployment Plan
This 2013 Annual Deployment Plan (ADP) documents the plans of the National Marine
Fisheries Service (NMFS) to assign observers to collect independent information from fishing
operations conducted in the North Pacific under the authority of the Fishery Management Plans
(FMP) for the Bering Sea and Aleutian Islands (BSAI) and the Gulf of Alaska (GOA), and the
Northern Pacific Halibut Act of 1982. Data collection by at-sea observers is currently the only
reliable and verifiable method available for NMFS to gain fishery discard information and data
concerning seabird and marine mammal interactions with fisheries. Onboard observers also
collect biological data such as species composition, weights, and tissue samples that are
important for stock assessment scientists and researchers. Much of this information is available
in near real-time (e.g. daily or at the end of a trip, depending on the type of vessel) to ensure
effective management.
Details on the legal authority and purpose of the ADP are found in the Final Rule for
Amendment 86 to the BSAI FMP and Amendment 76 to the GOA FMP (77 FR 70062). This
ADP follows Section 313 of the Magnuson-Stevens Fishery Conservation and Management Act
(MSA, 16 U.S.C 1862), which authorized the North Pacific Fishery Management Council
(Council) to prepare a fisheries research plan that requires observers to be deployed in the North
Pacific fisheries and establishes a system of fees. The intent of the ADP is not to adjust policy,
but rather to focus on science driven deployment to reduce potential bias and meet NMFS‟s data
needs. Some aspects of observer deployment can be adjusted through the ADP, including the
assignment of vessels to the selection pools or the allocation strategy used to deploy observers in
the partial coverage category.
The 2013 ADP was developed following the process designed in the restructured Observer
Program. NMFS and the Council created the ADP process to provide flexibility in the
deployment to meet scientifically based estimation needs. NMFS and the Council recognized
that coverage rates for any given year would be dependent on available revenue and anticipated
vessel-days at-sea and these annual changes in revenue and costs are inherent in the program.
This flexibility allows NMFS to optimize deployment in each year so that statistically robust
sampling can be achieved in a cost-effective manner.
The 2013 ADP implements a sampling plan for the partial coverage category to improve the
reliability of data collection within this category. The sampling methods in the 2013 ADP will
achieve representative sampling of fishing events for vessels in the partial observer category
greater than or equal to 40‟ length overall (LOA) and not fishing jig gear. These changes are
intended to reduce sampling bias that results from non-representative deployment of observers
(deployment bias). Addressing deployment bias represents an important step towards providing
the best available scientific information to fishery managers and scientists. The sampling
methods described in the 2013 ADP will reduce bias in observer data, improve catch estimates,
and lay the groundwork for cost-effective improvements to sampling methods implemented in
future ADPs.

2
1.2 ADP Process
Analysis and evaluation of the data collected by observers is an on-going process. The ADP
process ensures that the best available information is used to evaluate deployment, including
Council and public input to annually determine deployment methods. Each year, NMFS will
develop an ADP to describe how observers will be deployed for the upcoming calendar year and
prepare an annual report that analyzes the prior year‟s ADP. In 2012, NMFS did not fully realize
this timeline because it is the first year of the program. Starting in 2013, the ADP process will
include the following:
June: NMFS will present an annual report that provides a comprehensive evaluation of
observer activities, costs, sampling levels, issues and potential changes in the coming
year. NMFS will evaluate data collected in prior years to identify areas where
improvements are needed to (1) collect the data necessary to manage the groundfish and
halibut fisheries; (2) maintain the scientific goals of unbiased data collection; and (3)
accomplish the most effective and efficient use of the funds collected through the
observer fee. It is intended that this review will inform the Council and the public of how
well various aspects of the program are working, and consequently lead to
recommendations for improvement. In June 2013, NMFS will present the first of the
annual reports; however; since it is the first year of the program, the review will not
include an entire year of data collection and will instead focus on implementation of the
program to date.
June – September: Using information from the prior year‟s deployment and Council
recommendations, NMFS will conduct an evaluation to understand the impact and trade-
off of proposed changes in observer deployment and provide recommendations to make
improvements to the ADP for the upcoming year. September: NMFS will release the
draft ADP by September 1 of each year to allow review by the Groundfish and Crab Plan
Teams, as requested.
October: The Council and its Scientific and Statistical Committee (SSC) will review the
revised draft ADP and Plan Team recommendations. Based on input from its advisory
bodies and the public, the Council may choose to clarify objectives and provide
recommendations for the final ADP. NMFS will review and consider these
recommendations; however, extensive analysis and large scale revisions to the draft ADP
are not feasible. This constraint is due to the short time period before the December
Council meeting and practical limitations on planning for deployment (including
contracting with an observer provider) and associated processes that need to be in place
by January 1.
December: Upon final analysis of the Council recommendations, NMFS will make any
necessary adjustments to finalize the ADP and release it to the public; ideally the ADP
will be released to the public prior to the December Council meeting.
1.3 Changes to the Draft 2013 ADP
3
The 2013 ADP provides analysis of sampling methods and describes deployment of
observers on vessels and processing plants under the partial observer coverage category
described in 50 CFR 679.51. The ADP provides information on deployment methods NMFS will
use in the partial coverage category, including assignment of vessels to the trip and vessel
selection pools, and the allocation of observers among selection pools and processors.
Generally, the deployment of observers in 2013 will follow the deployment methods described in
Chapter 2 (Draft 2013 ADP), which were developed and recommended to NMFS by the
Observer Restructure Analysis Group (ORAnG) and presented to the Council during its October
2012 meeting. The deployment methods presented in Chapter 2 were also scientifically
reviewed by the Groundfish Plan Teams in September 20121 (Appendix 1.1) and the Scientific
and Statistical Committee (SSC) of the Council in October 2012 (Appendix 1.2).
At its October 2012 meeting, the Council requested that NMFS consider several modifications to
the Draft 2013 ADP (Appendix 1.3):
1. NMFS should revise the ADP to reflect a priority for monitoring vessels managed under
prohibited species catch (PSC) limits in the trip selection pool.
2. NMFS should consider a 2-month deployment period rather than a 3-month period for
selected vessels in the vessel selection pool.
3. NMFS should consider allowing 100% observer coverage on trawl vessels fishing in the
BSAI Pacific cod fishery, with additional costs to be borne by the vessel owners.
4. NMFS should allow all trawl fleets in the GOA to have the option to voluntarily carry
100% observer coverage at some times and seasons, with additional costs to be borne by
the vessel owners.
NMFS made several changes to the Draft 2013 ADP based on data needs for the management of
the groundfish and halibut fisheries and comments received from the Council. At its December
2012 meeting, the Council received a letter and presentation from NMFS providing a response to
the Council request to modify the Draft 2013 ADP. In drafting its response to the Council
(Appendix 1.4), NMFS considered data needs for the inseason management of groundfish and
prohibited species as well as scientific recommendations from the ORAnG (Appendix 2.4).
After careful consideration of its data needs (section 1.4), NMFS made the following changes to
the 2013 Draft ADP (Chapter 2):
1. NMFS increased the anticipated coverage rate for the trip selection pool and decreased
the anticipated coverage rate for the vessel selection pool. The vessel selection pool is
anticipated to have a deployment rate of approximately 11%, although deviations from
the rate is expected due to differences in fishing effort between the 2011 landing
1 An early draft ADP (September 2012) was presented to the Joint Groundfish Plan Teams and the Council‟s
Observer Advisory Committee. The September draft of the ADP presented the methods in Chapter 2, but specified
a range of deployment rates because contracting costs associated with deploying observers were unknown at that
time.

4
information used in the simulations and what will be realized in 2013. The rest of the
available coverage days will be placed into the trip selection pool. NMFS anticipates that
the coverage rate in the trip selection pool will be between 14-15%.
2. NMFS changed the deployment period for vessels in the vessel selection pool to 2-
months, rather than 3-months indicated in Chapter 2. A 2-month selection period
conforms more closely to fishery openings than quarterly durations of coverage and will
improve data collection for the vessel selection pool.
3. NMFS implemented the industry proposal for trawl vessels in the BSAI Pacific cod trawl
fishery to carry an observer at all times while fishing in the BSAI in 2013. This proposal
will improve the information available to NMFS for the management of this fishery and
will support effort by industry to manage PSC limits and minimize bycatch to the extent
practicable. The proposal also eliminates the logistical complexities of vessels crossing
from full to partial observer coverage, or vice versa. This proposal presented
implementation challenges that would best addressed through a regulatory amendment in
the long term and perhaps an exempted fishing permit in the interim. However, allowing
this activity in 2013 will provide valuable information to potentially construct a
regulatory amendment. Details on the requirements to implement voluntary full coverage
are provided in Appendix 1.5.
4. NMFS will consider specific requests, on a case-by-case basis, for full coverage on trawl
vessel groups fishing in the GOA during 2013. An implementation model similar to that
described above for the BSAI Pacific cod trawl fishery would be required. Future
proposals should be addressed through a regulatory amendment.
Further detail on the rationale and analysis behind these changes is provided in the NMFS letter
to the Council (Appendix 1.4) and section 1.4 of this document.
1.4 Evaluation of changes to the Draft 2013 ADP
In considering adjustments to the selection rates, NMFS balanced the data collection needs
specific to PSC estimation and management on large vessels with those for all vessels and
species. As described in section 1.3, NMFS set the anticipated selection rate for the vessel
selection pool at 11%. This adjustment is intended to provide inseason managers with more
information to monitor PSC on large vessels without severely compromising sampling rates in
the vessel selection pool. The actual rate of coverage for both the selection pools will be reported
after all fishing in 2013 has been realized.
A vessel selection rate of 11% was evaluated using simulations of fishing activity in 2011.
Using simulated mean values, the total number of vessels observed over 2011 with an 11%
sampling rate would equate to approximately 80 vessels (Table 1.1). The number of observed
vessels for each 2-month time period ranged between 7 and 25. Fishing activity in 2011
represents the best available science for a proxy on 2013 fishing effort, although changes in
fishing patterns and logistical issues with deployment in 2013 are uncertain given fishing has not
yet occurred. For example, the rate is based on a summary of simulated outcomes that provide a

5
mean rate (and distribution) based on a large number of repeated trials; however, actual coverage
(i.e., realized coverage) may deviate from the mean rate, particularly in situations where a small
number of vessels go fishing during a 2-month period and/or the distribution of fishing activity
in 2013 diverges appreciably from the mean of possible outcomes in 2011. Thus, the anticipated
level of coverage specified in Table 1.1 may deviate from realized levels in 2013. NMFS will
report the actual rate of coverage following completion of the 2013 fishing season.
Table 1.1. Anticipated number of vessels in the vessel selection (VS) pool. These estimates are
based on 2011 fishing activity and an unknown amount of deviation from these counts is
expected given realized fishing activity is unknown for 2013. NMFS will report the actual rate of
coverage after all 2013 fishing has been realized.
Time Period Number of unique
vessels that fished in VS
each time period
Number of vessels
anticipated to receive
coverage
Mean simulated
number of unique
vessels observed
January- February 65 7 5
March-April 153 17 15
May-June 231 25 16
July-August 169 19 17
September-October 194 21 18
November-December 66 7 8
TOTAL: assumes that no selected vessel ever fishes
in multiple time periods and is not selected again (no
overlap).
96 --
TOTAL: assumes that vessels fish in multiple time periods and can be selected
for several time periods (assumption for total number of vessels). 79
Note- do not sum the first column to get the number of unique vessels for the year. Some individual vessels fished in multiple time periods.
Catch information from observed trips is aggregated (post-stratified) to create PSC and
groundfish bycatch estimates in the Catch Accounting System (CAS, Cahalan et al 2010). Catch
estimation is required for all vessels regardless of whether they reside in the vessel or trip
selection pool. However, as discussed in ORAnG recommendations (Appendix 2.4), an increase
in the deployment rate for the trip selection pool reduces the amount of observer information
available in the vessel selection pool relative to an even rate across both selection pools. The
change in observer coverage rates among selection pools also influences the amount of
information available for catch estimates in CAS. Aggregation of observer data (post-strata)
occurs after the data are collected by observers and is used to estimate PSC and and groundfish
discard (Cahalan et al 2010). In considering the impact of differential observer deployment rates
between the selection pools, the ORAnG evaluated the amount of observer information that
would be available for aggregation to estimate PSC and groundfish at the NMFS statistical area,
calendar week, and target species level (Appendix 2.4). These combinations of aggregation
criteria (i.e., post-strata) represent certain types of fishing activity. In general, estimates of catch
are improved as observer coverage represents the diversity of fishing activity defined by calendar
week, fishery target, and area combinations (post-strata).
Comparisons of deployment rate combinations revealed that reducing the deployment rate in the
vessel selection pool resulted in a much steeper decline in the estimated coverage of post-strata

6
in the vessel selection pool relative to the trip selection pool (Appendix 2.4, Figure A2.4-1).
Simulations also demonstrated a large amount of uncertainty for PSC post-strata, which is
indicative of the large interquartile range (middle 50th
percentile) shown in Figure A2.4-1.
NMFS anticipates that the coverage rate in the trip selection pool will be between 14-15%. The
increase in sample size for the trip selection pool may improve confidence in PSC estimates for
large vessels by increasing the amount of data available for inseason management on trawl
vessels and hook-and-line vessels greater than 57.5 feet in the trip selection pool. However, any
increase in the sampling rate for the trip selection pool disproportionately decreases the quality
and confidence of catch estimates for the vessel-selection pool (Figure A2.4-1). This
disproportionate decrease is particularly pronounced for groundfish and PSC strata combined. A
large reduction in the vessel selection pool could compromise discard estimates that form the
basis for inseason monitoring of groundfish catch quotas, the assessment and management of
annual catch limits as required by the MSA, monitoring of PSC in the vessel selection pool, and
assessment of undersize halibut. This includes groundfish catch caught by vessels targeting
halibut, which represent a large and previously (prior to 2013) unobserved fishing fleet operating
in nearshore areas. Data collection by at-sea observers is currently the only reliable and
verifiable method available for NMFS to gain fishery discard information and data concerning
seabird and marine mammal interactions with fisheries.
1.5 2013 deployment summary
Sampling by observers may occur at shoreside processors, floating processors, or
onboard vessels at-sea. Regardless of sampling location, observers must be able to obtain a
complete and representative sample of trips and vessels, including information collected at
shoreside and floating processors. Total program funds in 2013 are $4.48 Million and cover both
at-sea coverage and at dockside deployment. The distribution of days fished by location will
influence costs in 2013, therefore a simulation of potential fishing activity was used to develop a
budget for the deployment of observers into the partial coverage category. An at-sea budget was
developed by using 2011 as the base year of effort and simulating the deployment rate that
resulted in 88 to 92% of the simulated values being less than or equal to the available funds after
subtracting the cost of dockside sampling. A more detailed description of the methodology is
provided in sections 2.5.1 and 2.5.4. The deployment of observers in 2013 will generally follow
the methods described in Chapter 2 with the exceptions noted in section 1.3.
Overall, the restructured Observer Program is anticipated to reduce the number of vessels
without any chance of coverage, increase the number of vessels in the partial coverage category,
and result in an increase in observer coverage due to full coverage requirements on catcher
processors and voluntary full coverage for catcher vessels in the BSAI. The sampling methods in
the 2013 ADP will achieve representative sampling of fishing events for vessels in the partial
observer category greater than or equal to 40‟ length overall (LOA) and not fishing jig gear.
These changes are intended to reduce sampling bias that results from non-representative
deployment of observers (deployment bias), and are an important step towards providing the best
available scientific information to fishery managers and scientists.

7
Under the 2013 ADP, the median coverage rate for vessels in the partial coverage category is
anticipated to be higher than was seen under the previous deployment method (using 2011 as a
comparison year) in all FMP and area combinations for hook-and-line gear (Figure 2.5), three of
four combinations for pot gear (Figure 2.6), and seven of twelve combinations for trawl gear
(Figure 2.7). For example, several major trawl fisheries are expected to have improvements in
coverage relative to status quo: deep water and shallow water flatfish; Pacific cod; rock sole; and
rex sole. Observer coverage for the BSAI Pacific cod trawl fishery is also anticipated to be much
higher than shown in Figure 2.7 due to the majority of the fleet (392 of approximately 50 vessels)
electing to voluntarily carry observers on 100 percent of their fishing trips, which is not reflected
in Figure 2.7. In addition, random deployment in 2013 is expected to result in observer coverage
that is proportional to fishing effort (Figure 2.4). Thus, combinations of gear, time, target, and
FMP area combinations with high amounts of effort are expected to receive more observer
coverage than those with low effort.
An in-depth description and analysis of deployment in the partial coverage category in 2013 is
found in Chapter 2 with the changes noted in section 1.3. The following is an overview of
stratification for the “partial-coverage” category (defined in §679.51), including the changes to
the Draft 2013 ADP described in section 1.3.
1.5.1 At-sea selection pools (strata)
The random deployment methods described in sections 2.3 and 2.4 of Chapter 2 will be used
to deploy observers on vessels in the partial coverage category. This observer coverage is
divided into three selection pools:
No selection: Vessels less that 40 ft LOA or fishing with jig gear are in the “no
selection” pool which means that they will not be selected for observer coverage.
NMFS did not to deploy observers on these vessels in 2013 due to logistical issues.
NMFS will consider expanding coverage to vessels less than 40 ft and/or vessels fishing
with jig gear if data collection needs warrant coverage and logistical issues are resolved.
Vessel selection: Vessels are in the vessel selection pool if they are fishing hook-and-line
or pot gear and are greater than or equal to 40 ft, but less than 57.5 ft in length overall
(LOA). NMFS intends to randomly select vessels in the vessel selection pool for
mandatory observer coverage approximately 60 days prior to the start of each 2-month
selection period. Vessels will be required to carry an observer for all trips taken within a
selected 2-month period.
Trip selection: Vessels fishing trawl gear, vessels fishing hook-and-line gear that are also
greater than or equal to 57.5 ft LOA, comprise the trip-selection pool. NMFS developed
a system, termed the Observer Declare and Deploy System (ODDS), to facilitate the
random assignment of observers to trips.
2 As of 1/20/2013

8
1.5.2 Dockside sampling
The collection of salmon genetic and bycatch information is a priority for the 2013
deployment of observers to shoreside and floating processors. This priority follows the
promulgation of Amendment 93, which requires the retention of salmon at-sea and retention of
salmon until released by an observer. As described in Chapter 2, observers will be deployed to
shoreside and floating processors to enumerate and genetically sample salmon bycatch in the
GOA pollock fishery.
1.5.3 Electronic monitoring
Building a strong relationship with industry is essential to the future success of an
electronic monitoring program (EM) in the North Pacific. Currently, EM does not provide the
fishery data equivalent to that collected by observers. NMFS has identified limitations with the
existing technology, including the inability to collect biological information, difficulty in species
identification, challenges associated with estimating the weight of the catch, the time lag in
information availability, system reliability, and susceptibility to tampering. NMFS is working
collaboratively with the Council to develop an Electronic Monitoring Strategic Plan. The
Council will review the strategic plan, and take public testimony, in June 2013. NMFS will
continue to work with the Council and the fishing industry to integrate electronic monitoring into
the Observer Program in the future and where technically and economically feasible.
In 2013, NMFS will provide electronic monitoring equipment to vessels volunteering in a study
to evaluate the efficacy of electronic monitoring to collect catch and discard in the hook-and-line
halibut and sablefish fleets (vessels between 40 ft LOA and 57.5 ft LOA).
NMFS developed a contract for a business to construct, deploy, and maintain a video based EM
system on vessels in the vessel-selection pool. A list of vessel operators in the vessel selection
pool who volunteered for the EM project will be used by AFSC to randomly deploy EM in each
calendar quarter. However, given financial limitations, to meet OAC intent, and improve
logistical efficiencies, EM systems will not be deployed until the second calendar quarter (April
1st) and will only be deployed on vessels with a history of fishing from the ports of Homer,
Petersburg, Sitka, and (if funding permits) Kodiak. A more detailed description of the EM
project is provided in section 2.7.
1.5.4 Outreach for 2012/2013
As part of the 2013 Annual Deployment Plan, NMFS has conducted outreach to affected
participants through meetings, mailings, and posting information on the web. NMFS conducted a
series of public outreach meetings and attended industry group meetings throughout the fall and
winter of 2012/2013 (Table 1.2). The purpose of these meetings was to provide an explanation of
the new observer program and explain the process that vessels owners and processors need to
undertake to comply with the new Observer Program regulations. The outreach meetings were
organized based on location recommendations by the Council‟s Observer Advisory Committee
(OAC) and requests from industry groups, including remote meetings hosted through WebEx
and phone.

9
In early November 2012, NMFS mailed letters to all vessels in the trip selection and vessel
selection pools. These letters provided information on the new Observer Program and
instructions on how to comply with the new regulations. Information about the new observer
program has been made available on the web
(http://www.alaskafisheries.noaa.gov/sustainablefisheries/observers/) including a list of
frequently asked questions (FAQs)
(http://www.alaskafisheries.noaa.gov/sustainablefisheries/observers/faq.htm). The agency
continues to revise and create additional FAQs to address specific topics of concern from the
Council and the public.
Table 1.2. Outreach Activities on the new Observer Program in the fall and winter,
Date Location Description
Oct 31, 2012 Seattle WA Fishing Vessel Owners
Association
Nov 27- 29, 2012 Seattle Pacific Marine Expo
Nov 27, 2012 Seattle Aleutians East Borough
meeting
Nov 28, 2012 Petersburg public outreach meeting
Dec 11, 2012 Anchorage CDQ Group meeting
Dec 12, 2012 Homer public outreach meeting
Dec 14, 2012 Kodiak public outreach meeting
Dec 18, 2012 Newport OR public outreach meeting
Dec 20, 2012 WebEx / phone demo for processors on
observer fees & eLandings
Dec 20, 2012 Phone fishermen in the community
of Chignik
Jan 2, 2013 Phone Aleutians East Borough
Jan 14, 2013 Ketchikan public outreach meeting
Jan 15, 2013 Sitka public outreach meeting
Jan 16, 2013 Juneau public outreach meeting
Jan 16, 2013 WebEx / phone Demo of ODDS for Kodiak
trawl fleet
Jan 23, 2013 WebEx / phone demo for processors on
observer fees & eLandings

10
Chapter 2: October 2012 Draft Annual Deployment Plan
2.1 The current NPGOP sampling design
Since 2008 the NPGOP has employed a hierarchical (nested) sampling design consisting
of five levels (Cahalan et al. 2010). At the lowest and most granular level (level 5), specimens
including ageing structures (e.g., otoliths, spines, and vertebrae), and reproductive tissues (e.g.,
to be used for assessing gonad maturation or sex identification) are obtained from a simple
random sample of individual fish. These individual fish comprise the fourth level of the design,
and are used for sex/length determination3. Such “sex/length fish” represent a random sample of
individual fish contained within the third level of the design: the species composition sample.
The species and sample size for sex/length fish are determined largely by request to FMA by the
Status of Stocks and Marine Assessment group scientists of the Alaska Fishery Science Center
(AFSC). Species composition data result from a systematic random sample of the second level of
the design, i.e., the haul (total unsorted catch). If a systematic random sample of species
composition data is not possible, observers are instructed to obtain a simple random sample or
opportunistic sampling of the haul. These species composition data are used to determine the
relative abundances of all species captured by fishing gear, not just those retained by the vessel
or plant. Generally, all hauls on a trip are sampled; however, in cases where the observer cannot
sample every haul, hauls are randomly selected for sampling by observers. Hauls are a
component of the first level of the sampling design, the trip.
Randomization is a component of the NPGOP sampling design at all levels with the exception of
the first level. Although the current NPGOP sampling design has trip as the first level, the
deployment of observers in some instances may be based on vessels. In such instances, the
vessel would constitute a new level of the sampling design above trips (since trips are nested
within vessels). Consequently, this ADP is only concerned with addressing proposed changes to
the first level of the NPGOP sampling design and the anticipated outcomes of those changes.
Sampling that incorporates randomization is desirable at all levels of the NPGOP design since
(1) sampling theory dictates that randomization at all levels allows for unbiased estimation (2)
sampling is generally preferential over a census because it is more cost efficient, is less prone to
bias than an imperfectly implemented census (one subject to logistical constraints), and can
result in greater data quality (Cochran 1977). Nevertheless, there are cases in Alaska where a
census has been implemented. For example, in the case of salmon prohibited species
management in the Bering Sea walleye pollock (Theragra chalcogramma) fishery, NMFS has
chosen the a census approach and attempted to mitigate the risk of bias resulting from an
imperfect census through use of video monitoring and enforcement efforts.
2.2 Goal for 2013
This document follows the proposed plan to deploy observers as presented to the Council
at their April and October 2010 meetings. Having gained control over the deployment of
observers as a result of Council action, the goal of this ADP is to address the data quality
concern expressed within Council‟s 2010 problem statement; i.e., to achieve a representative
3 In addition, auxiliary tissues for genetics and stomachs are collected from salmon and selected groundfish
respectively under certain circumstances.

11
sample of fishing events, and to do this without exceeding available funds. This will in a large
part be accomplished by incorporating randomization into the first tier of the NPGOP sampling
design.
2.3 Deployment strata for 2013
Since the trip or vessel constitutes the highest level of the NPGOP sampling design, it is
important that either complete observation or a representative sample of trips or vessels is
accomplished. Achieving a representative sample of the population of fishing trips or vessels
through randomization aids stock assessment scientists as well as in-season managers of fishery
quotas. These benefits in turn help sustain conservation goals and economic opportunities of
fishers.
There are two classes of vessels on which fishing trips are observed: 1) catcher processors (CP)
and motherships (M) that characteristically take longer trips further from shore and 2) catcher
vessels which need to limit their trip duration due to concerns over product quality and hold
space. Trips taken on CP and M vessels belong to a class of vessels requiring “full-coverage” (all
fishing trips observed; Table 2.1) because they discard and process fish onboard. Since catcher
vessels belonging to catch share programs with “prohibited species caps” (PSC) require greater
in-season data specificity, those vessels fishing under the authority of the (1) American Fisheries
Act (AFA) walleye pollock fishery in the Bering Sea, (2) Amendment 80 to the BSAI FMP, and
(3) the central GOA Rockfish Program (RP) as well as processing facilities receiving AFA
deliveries are also placed within this full-coverage category. These entities are not considered
further in this document since they are to obtain their observers using status quo (pay-as-you-go)
methods and do not fall under random deployment.
There are also vessels and plants that because of the size of their operations would be logistically
challenging to place observers on board (vessels under 40 feet length overall), have small
amounts of catch (catcher vessels fishing with jig gear), or fall outside of the jurisdiction of
NMFS (vessels fishing for groundfish in state Guideline Harvest Level (GHL) fisheries). For
2013, these entities constitute the “zero-coverage” category and will have zero probability of
their vessels/fishing events being observed.
Two exceptions to the above full and zero coverage categories were made by the Council and are
included in Council‟s motion and the proposed rule (NOAA 2012a). First, CP vessels (those with
a CP endorsement on their Federal Fisheries Permit (FFP)) with a history of maximum daily
production of 1 metric ton as determined by the Alaska Regional Offices (AKRO) Catch
Accounting System (CAS) will not be required to carry full observer coverage. Second, a vessel
with a history of both CP and CV activity in a single calendar year, and owners of CPs with an
average daily groundfish production of less than 5,000 lbs in the most recent full calendar year
from January 2003 through January 2010, are given a one-time choice to be treated as a CP with
full coverage requirements or as a CV under the trip selection pool.
It is important for NMFS to document assumptions regarding the catch of vessels exempted from
observer coverage. Catch is estimated through the CAS, which incorporates two types of
estimators of at-sea discards depending on the type of estimation: a deterministic imputation

12
method for groundfish discard on observed trips; and a ratio estimation procedure for groundfish
discard on unobserved trips and PSC estimation (Cahalan et al. 2010)4. These estimation
techniques rely on the basic assumption that catch for observed events represents unobserved
events and that the underlying data reasonably conform to statistical assumptions on which ratio
estimators are based. When these assumptions are violated, bias and decreased efficiency may be
introduced. Current CAS methods rely on the post-stratification of observer information to
decrease potential biases and increase precision of the estimates. Evaluation of these assumptions
is critical towards understanding and improving the estimation techniques currently used in CAS.
Random deployment will greatly improve NMFS's ability to evaluate the statistical properties of
estimators and improve catch estimation procedures. The necessary catch estimation assumptions
described above are identical to those used in the current program - only which operations are
exempted from observer coverage and which operations receive observer coverage differ
between the current and restructured observer deployments.
The remainder of this document focuses on fishing operations that are in the “partial-coverage”
category: (1) CVs designated on an Federal Fisheries Permit (FFP) when directed fishing for
groundfish in federally managed or parallel fisheries (defined as fisheries concurrently open for
both state and Federal waters where catch comes off the federal catch limit), that do not fall
under the full coverage category, (2) CVs fishing for halibut or sablefish (Anoplopoma fimbria)
individual fishing quota (IFQ) or community development quota (CDQ), (3) shoreside or
stationary floating processors not in the full coverage category, and (4) CPs meeting the
previously described full coverage exemption. Within the partial coverage category, there are
two deployment strata defined- the (1) “trip-selection” stratum and the (2) “vessel-selection”
stratum (Table 2.1).
2.3.1 Trip-selection stratum
Vessels fishing trawl gear, vessels fishing hook-and-line and pot gear that are also greater
than or equal to 57.5 feet overall, and shoreside and floating processing facilities comprise the
trip-selection stratum. Approximately 60 days prior to the start of the year, registered owners will
receive a letter informing them that they are required to log all intended future trips for their
vessel using a supplied username and password into a web-based system (that is also accessible
by telephone). This system, termed the Observer Declare and Deploy System (ODDS), was
developed by NMFS to facilitate the assignment of observers to future fishing events on a trip-
by-trip basis. As described in the proposed rule, ODDS works by providing vessel operators
(either owners or their designated captains) with an account through which they shall enter their
anticipated fishing trips. More than one trip can be entered- three if the start time of the first trip
and the end time of the last trip span more than 72 hours, six if not. Anticipated target fishery is
not required- only the port of departure and landing with the anticipated start and end times of
the trip. Each trip must be entered at least 72 hours before anticipated departure to allow the
vessels‟ observer provider time to deploy an observer. If the contractor provider cannot provide
an observer to the vessel, the vessel may be granted a release from coverage by NMFS and go
fishing. If the provider obtains an observer for the trip, the vessel may still opt to defer a trip for
up to 48 hours from the anticipated departure to account for unanticipated events such as poor
weather conditions. If, however, after this additional 48 hour period has passed and the vessel
4 CV retained catch is taken from landings reports and is not considered in this discussion.

13
has still not departed, that trip is cancelled by the ODDS, the observer is released from the vessel
to be deployed elsewhere, and the vessel‟s next logged trip will require observer coverage.
Trip-selection systems have been successfully instituted elsewhere in the nation such as in the
system administrated by the Northeast Groundfish Observer Program. Trip-selection systems
work by having participants (potentially all) in a stratum observed for a short duration at a time.
Trip selection systems reduce the potential negative influence of vessel operators‟ decisions to
artificially manipulate which fishing events are observed by postponing the outcome of the trip
selection (i.e., to be observed or not to be observed) until after the final trip details have been
entered. Furthermore, the ODDS is designed so that (1) if selected for coverage, a “to be
observed” trip can only be cancelled by the observer provider responsible for obtaining an
observer, and (2) if a vessel does cancel a “to be observed” trip, the vessel‟s next logged trip
status will change to “to be observed”.
2.3.2 Vessel-selection stratum
Vessels fishing hook-and-line and pot gear greater than or equal to 40 feet and less than
57.5 feet in length overall will constitute the “vessel-selection” stratum. Approximately 60 days
prior to the start of the year, registered owners will receive a letter informing them that their
vessel may be selected for observer coverage during any of the calendar quarters in the
upcoming year. This letter will provide details for the owner to update their vessel‟s registration
information as well as how to obtain the required USCG safety decal. Included with this letter
will be a self-addressed post card where owners can indicate to NMFS if they would be willing
to participate in a voluntary Electronic Monitoring (EM) study described in section 2.7. Vessel
operators who would like to volunteer for the EM project must return the post card by February
1st, 2013 or NMFS will assume that the vessel owner does not want to participate in the EM
program.
Vessels in the vessel-selection stratum will be randomly selected for mandatory observer
coverage approximately 30 days prior to the start of each calendar quarter. Owners of selected
vessels will be notified through the U.S. postal service of their selection, given contact
information for their observer provider, and given a username and password. This information
can be used to access a vessel-selection survey that provides a way for owners of vessels that
have been selected for observer coverage in the vessel-selection stratum to verify their contact
and vessel information and provides a forum for communication with NMFS. The vessel-
selection survey will be available online or by phone if the vessel owner chooses. Owners will be
asked to provide their intent to fish in the upcoming quarter to improve the logistical efficiency
of observer assignment and deployment in this stratum5. In addition, the survey will provide
owners of vessels with a way to provide a rationale as to why their vessel may not be able to
accommodate an observer. Answers to these two questions will be needed by NMFS a minimum
of two weeks prior to the vessels‟ first fishing trip of the quarter of selection in order to provide
time for scheduling and conducting an on-site evaluation by NMFS. NMFS will assume the
vessel intends to fish and can accommodate an observer in cases where they have not received a
response to the vessel-selection survey from a vessel operator.
5 NMFS plans to query database records to ensure against discrepancies if owners declare their intent is not to fish.
14
Vessel selection systems similar to that proposed for the vessel selection stratum have been
successfully implemented elsewhere in the nation such as in the Northwest Groundfish Observer
Program. These systems work to reduce the logistical complexities associated with having large
amounts of participants. However, because the number of vessels that can be observed is likely
to be low relative to the total number of vessels in the sample population and to reduce the
operator‟s ability to manipulate fishing events (for example by not fishing at all if selected) there
is a need to increase the duration of observer coverage for selected vessels. This ADP adopts the
duration of a calendar quarter for selected vessels in this stratum. Therefore, selected vessels in
this stratum will be responsible for carrying an observer for all of its fishing during the quarter
for which they have been selected by working directly with their observer provider. In this ADP,
if any portion of a trip falls within a calendar quarter for which the vessel was selected the entire
trip will be subject to observer coverage. The duration of coverage in this ADP will help the
observer program obtain data from as many of the target fisheries, locations, and times the vessel
participates in, was proposed to the Council in documents between 2010 and present, and was
first presented to the Council‟s Observer Advisory Committee in September of 2011.
The definitions for the vessel and trip stratum were determined through an analysis conducted on
2007 and 2008 landings data using recursive binary partitioning – a technique that repetitively
splits groups of the variable in question (here landed weight) by variations in a suite of potential
cofactors in order to maximize their differences (NPFMC and NOAA 2011). Thus the division of
these strata based on a vessel size of 57.5 feet in length overall was due to the fact that there
were many vessels of length 58 feet and many vessels of length 57 feet (thus the difference
between them was determined to be 57.5). Since the dynamics of vessel size in the fleet is likely
to change, and alternative ways to group fishing events also likely to change, the definitions for
the trip and vessel strata used here are limited to the 2013 calendar year only.
2.4 How observer effort will be allocated among strata
2.4.1 At-sea sampling
Stratified sampling, such as used here, requires that sample units (trips or vessels) be
assigned to one-and-only-one stratum and that within a stratum a single sampling design and
estimation process is used. Hence, the partial coverage trip selection stratum and the full
coverage stratum are two separate strata and estimation calculations will reflect this. By
definition, each trip (or vessel) must be assigned to a stratum before any fishing occurs, the
probability of selection must be based on the stratum, and this probability must be known for all
observed and unobserved trips (or vessels).
It is nearly impossible to assign observers to a specific fishery since fisheries may be defined by
some or all of a combination of area (determined at the end of a fishing trip), fishing cooperative,
gear type, and trip target (also determined after the trip is completed). In addition, fishers do not
always fish in the areas nor realize the catch they intended to before the fishing trip began. If
observers were deployed randomly onto vessels or fishing trips through stratified random
selection (sampling) where every sample unit (vessels or trips) had an equal chance of being
selected, then (on average) the proportion of the fisheries (and areas) observed would be
proportional to the fisheries (and areas) that fishers participated in.

15
An immediate benefit to assigning observers to trips with equal probability (within a stratum) is
the ability to estimate the „observer deployment‟ effect. Since observer coverage within a
time/area/gear type/target designation should be proportional to the actual fishing patterns within
the same „fishery‟ deviations of coverage proportions from the expected values given fishing
patterns will be due to errors in reporting of trips (in ODDS) or catch (on landing reports).
Regardless of the cause, identifying the magnitude of this potential problem will guide efforts to
increase the effectiveness of observer deployment and catch estimation processes.
It may seem intuitive to adjust the probability of observer coverage to reflect the relative size of
the fleet, either in terms of effort (trip length, vessel size) or impact to the marine resource
(magnitude of catch, or catch histories for example). However in studies that have compared
catch estimates resulting from sampling with probabilities proportional to size (PPS) to those
obtained through equal probability sampling (as proposed here), it has been found that equal
probability sampling was preferable given the relatively marginal estimation benefits (if any) and
greater logistical complexities that arise from implementing PPS (Allen et al. 2001; Cotter et al.
2002).
Similarly, the preferential assignment of observers into fleet sectors that are perceived to have a
greater potential to impact or encounter species whose populations are of special concern
(generally due to a depressed state of the population) may not result in data and hence catch
estimates of higher quality or that better meet management needs. For example, constituents
differ on what those species of special concern are and the suite of species of interest may vary
over time. Regardless, if the population of such a special species is large, and encounter rates by
fishers is common, then the bycatch amounts obtained from observers deployed with equal
probability sampling will be unbiased and sampling will be robust enough to capture such events
without compromising the catch estimates of other, more abundant species. If however, the
bycatch rates for a special species are low, and/or fishing encounters infrequent, then it is
possible that a sample may not capture the rare event or if the event is captured, the variance in
the resulting catch estimate may be high.
Since the CAS estimates groundfish and PSC catch within sampling strata (vessel or trip
selection strata), a change in the sampling rate within a year constitutes the creation of new
sampling strata (trips that are subject to the new rate) and therefore has ramifications on catch
estimation and evaluation of current estimation procedures. For example, the change in sampling
rate marks a point in time that would require creation of an additional stratification of observer
information and consequent estimation within that new stratum, but the CAS relies on
programming algorithms to provide in-season estimates of catch that may not recognize the new
stratum. Changing the programming of the CAS cannot be done quickly enough to accommodate
dynamic sampling rates or employ some other procedure (i.e., sample weighting) on an in-season
basis.
For the previously described reasons, this ADP will allocate observer effort among trips in the
trip selection stratum and among vessels in the vessel selection stratum so that these two strata
are sampled at a set rate, and it is the intent of NMFS to keep this value constant throughout the
year. For example, each vessel has an x % chance of carrying an observer for a quarter in the

16
vessel-selection stratum while each declared trip in the trip selection stratum has the same x %
chance of carrying an observer. This allocation scheme was proposed in documents presented to
the Council during 2010 (NPFMC and NOAA 2011).
2.4.2 Dockside sampling
While stock-assessment scientists and in-season managers represent the primary clients
of observer data, there are other reasons to deploy observers. Regulations specify full observer
coverage for AFA pollock deliveries to monitor salmon bycatch in the Bering Sea. Salmon
bycatch in the AFA pollock fishery is enumerated and systematically sampled for genetic tissues
following a protocol developed by Pella and Geiger (2009), and there is similar interest in using
observers to perform these same tasks in the GOA. While NMFS and industry have worked
cooperatively since the start of 2012, new regulations that became effective late in 2012 now
require industry to set aside salmon caught as bycatch within the GOA pollock fishery at
processing facilities so that the salmon can be tallied and recorded by observers (NOAA 2012b).
In order to provide complete monitoring of all pollock offloads, for 2013, observers will be
deployed under this ADP to shoreside and floating processors to enumerate and genetically
sample salmon bycatch in GOA pollock deliveries since funds to pay for observers are limited.
The NMFS and their contracted observer provider will coordinate with the plants to realize this
observer coverage. This dockside sampling approach continues to be dependent on the industry
retaining salmon and making them available for observer sampling. The ability of NMFS collect
an unbiased genetic sample of salmon is dependent on the assumption of full retention of salmon
and this will be evaluated.
2.5 Evaluation of the program goal
The evaluation of the program goals will follow the protocols used for the preparation of
stock assessments in Alaska. This process utilizes the most recent full year of data (2011) for
comparisons between current state (2011 data collected by NPGOP) and a future state (2011 as
restructured and sampled according to this ADP). Where appropriate, formulations have been
provided using the abbreviations in Table 2.2 to clarify our methods. We chose the R
environment (R Core Development Team, 2011) as the preferred platform on which to conduct
data analyses.
Five “evaluation analysis” have been conducted:
1. Cost and fishing effort information were used to simulate total annual program costs
under different sampling rate scenarios to determine a final deployment rate to be used in
2013.
2. Simulations were performed to calculate the difference in observer coverage that would
have been expected in a prior year of fishing in the partial coverage CV fleet between the
(a) actual NPGOP sampling effort and (b) the anticipated sampling effort if that same
prior year had been sampled according to this ADP. Comparisons were made at a scale
that serves in-season managers (the first main client of observer data).
3. Extrapolations were used to evaluate potential differences in the amount of tissues that
had been collected by the NPGOP in 2011 and those that which would be expected to
have been collected had the year been sampled according to this ADP. Comparative

17
summaries were made by data type (length or tissues) for a species to serve stock
assessment authors and ecosystem scientists (the second main client of observer data).
4. Estimates were made to evaluate the cost of dockside salmon sampling in pollock
offloads and its potential impact in terms of at-sea coverage rates.
5. Comparisons in terms of the number of participants, trips, and catch observed by the
NPGOP in a prior year and that same year as if sampled according to this ADP were
made for the entire fleet.
2.5.1 Evaluation analysis 1: Determination of the deployment rate (r)
The deployment rate (r) of observers into the 2013 at-sea partial coverage category fleet
was determined through simulation of 2011 landings information. The basic components of this
analysis included the amount of fishing effort conducted by the fleet, and the cost per observer
day. Details on how effort was generated can be found in the Appendix 2.2 and Figure A2.3-1.
Cost estimates derive from confidential contract information negotiated between NOAA's
acquisition and grants office and the selected observer provider. The simulated deployment rate
was determined from an evaluation of estimated annual program costs assessed against the risk
of exceeding the observer program‟s available funds. One simulation consisted of a random draw
of unique trips within the trip-selection stratum, and unique vessel-quarter combinations in the
vessel-selection stratum, each with a probability of being observed equal to r.
Total program costs from a single simulation trial (CS) were determined by summing the number
of simulated trips that would have been sampled in the trip-selection stratum and adding these
costs to that of observing all trips for selected vessels in each quarter ( ), or
∑ ∑∑
where S indexes the simulated draw of landings (equivalent of trips) made by CVs in 2011 that
would belong to the trip-selection stratum and all trips of selected vessels in a quarter that made
landings in 2011 that would belong to the vessel-selection stratum. Prior to the establishment of a
final contract agreement between an observer provider and NMFS (observer contract), the cost
(c) of a trip (n) was originally explored as a function of the base cost rate (B, $ day-1
) estimated
to occur from a contract between NMFS and an observer provider (observer contract) added to a
random draw of incidental costs (I, $ day-1
) for a trip that has been determined from past invoice
data and multiplied for each day (d) so that
( ) and
∑ ( )
.
Upon achievement of the observer contract, these formulations were changed to use the actual
contracted values for B, and incidental costs were not included. Instead, incidental costs in
simulations were accounted for by reducing the total available funds for the deployment of
observers for the upcoming year by the total “not-to-exceed” incidental travel costs for the entire
year from the observer contract. Reducing the remaining budget further by the amount of money
calculated for dockside deployment in section 2.5.4 resulted in an available “at-sea” budget for
the deployment of observers.
18
Two-thousand values of CS constituted a set of simulations. The distribution of CS values from a
set was evaluated against the desired outcome that between 88 and 92% of CS values were at or
below the at-sea budget. If the desired outcome was not achieved, the initial rate of sampling
was adjusted, another set of simulations was generated, and the evaluation was conducted again.
This entire process was repeated until a set of simulations achieved the desired outcome. Based
on this evaluation, the deployment rate was 13.03968, or 13.0. The histogram of CS values from
the final set of simulated trials is depicted in Figure 2.1 and the process for simulating costs and
rates is depicted in Figure A2.3-2.
2.5.2 Evaluation analysis 2: Anticipated changes to CV coverage
Having established a deployment rate, this next analysis was performed to evaluate the
questions:
How much and where is at-sea coverage expected to be realized in 2013 as a result of this
deployment plan?
How does it compare to current levels in the partial coverage category of the CV fleet?
Any examination of changes in CV at-sea observer data needs to be done at scales relevant to the
main clients of the observer program. Stock assessment scientists use data from biological tissues
such as otoliths and observer length-frequency samples to generate age-length keys to estimate
catch-at-age. Some authors examine their catch data at spatial and temporal scales equivalent to
the FMP area/year stratum, while others aggregate catch, length and age compositions at the
season/NMFS Area scale (e.g., Dorn et al. 2011, Thompson and Lauth 2011). In contrast, the
CAS estimation procedures for CVs generally use a post-stratification procedure (with the
exception of census salmon) to match observed discard rates with landing information. The
definition of post strata depend on whether groundfish or PSC is being estimated (Cahalan et al
2010). The coarsest resolution used in defining post-strata for observer information is at the FMP
area, gear, and target; whereas the finest resolution is specific to a vessel‟s observed trip.
Weighing the ease of calculation, the need for specificity by clients of observer data and the need
for a clear interpretation of results, past and anticipated future observed and unobserved fishing
effort was examined at the gear/FMP area/target/week scale. A data set was generated that
equates to landings made in 2011 in what would constitute the partial coverage category for the
CV fleet in 2013. Trips were enumerated for the criteria described above and used to generate
heat maps and histograms. Heat maps simultaneously depict the number of trips in a week
(column) and gear/FMP area/target (row) combination (i.e. a heatmap cell), and the number of
observed trips in a cell. Three heat maps were generated for comparison. In the first map, the
cell colors depict the proportion of trips in a cell that were observed in 2011 (Figure 2.2). In the
second map, cell colors depict the proportion of trips in a cell expected to be observed (that is,
the average number of observed trips in that cell from the final set of 2000 simulations; Figure
2.3). The third map depicts the difference in the relative coverage values from Figures 2.2 and
2.3, expressed as Figure 2.2 color relative coverage values minus Figure 2.3 color relative
coverage values (Figure 2.4). While there is variation in the amount of observer coverage in each
heat map cell in Figure 2.3, this variance is not depicted.
Compared to heat maps that express data in a graphical table format and are good at identifying
the distribution of values of interest with respect to time and space, histograms depict the relative

19
frequency and distribution of different values of interest. As an alternative way to depict the
information provided in Figure 2.4, histograms were generated from the trip and relative
observer coverage data in Figures 2.2 and 2.3 for each FMP/gear type/Target. These plots depict
the difference in the distribution of current and anticipated observer coverage rates by hook and
line gear (Figure 2.5), pot gear (Figure 2.6) and trawl gear (Figure 2.7). A graphical
representation of the process through which the deployment rate is set and these figures were
created is depicted in Figure A2.3-2.
From Figures 2.2 through 2.7, the following conclusions can be made.
Observer coverage in the current deployment system was heavily skewed into BSAI trawl
cod fishery during weeks 4-17 and in the GOA trawl cod fishery during weeks 39-41.
Observer coverage anticipated from this ADP would be expected to result in a greater
number of gear/FMP area/target/week combinations that had at least some observer data
within them than was realized in 2011 even though future deployment is anticipated to
occur at a lower rate based on trips than current deployment rules based on days. This is
especially true for the hook and line fleet, of which a large number are under 60 feet in
length and fish halibut.
The median coverage rate anticipated under this ADP is greater than that of the current
program in seven of seven FMP area/target combinations for hook and line gear, three of
four combinations for pot gear, and 7 of 12 combinations for trawl gear. For pot gear,
median values of coverage declined between current and future simulations in the BSAI
sablefish fishery. For similar comparisons made for trawl gear, median values of
coverage declined for BSAI cod and GOA arrowtooth, and median values were similar
for GOA cod and GOA pollock.
2.5.3 Evaluation Analysis 3: Anticipated changes to the number of lengths and specimens
Since the specimens collected by observers are used by stock assessment scientists, it is
important to gauge the potential impact that changes in the deployment of observers will have on
the amount of tissues collected. Each year, FMA solicits requests for changes in their observer
training manual from other groups including stock assessors within the AFSC and the number of
specimens collected annually can change based on their responses. Perhaps the most important
sources of change with respect to the number of specimens observers collect are the fish length
and specimen tables (e.g., pgs 13-25 to 13-34, NMFS 2010). These tables dictate the type, the
amount, and from what species observers collect lengths and specimens from each haul based on
the predominant species in that haul, and what FMP the vessel is fishing. Out of necessity, in
order to determine the number of specimens we would anticipate to be collected from this
deployment plan, the decision was made to calculate tissue accumulation rates where applicable
assuming that the rates in the future would be identical to those in the past (that is, the table of
instructions to observers did not change). In practice, NMFS may adjust these sampling rates to
address potential shortfalls for stock assessment.
There are three potential sources of length and tissue information: those collected at-sea on a CV,
those collected at-sea on at CP or M, and those collected from CV deliveries dockside. Within
each of these sources, the current (i.e. 2011 actual data) and the future (2011 data based on the
2013 deployment methods) number of lengths and specimens needed to be obtained and
calculated respectfully. Since separate calculations needed to be made for each potential source
20
of length and tissue data, data summaries from this exercise were made at the FMP
area/source/species level of aggregation. For a workflow diagram of length and tissue analyses
the reader is referred to Figure A2.3-3.
The simplest calculation was the enumeration of lengths and tissues from the 2011 observer
database NORPAC that provided a baseline from which to evaluate future changes.
Future length measurements and biological specimens from dockside sources were calculated by
enumerating only those lengths and specimens collected from within the BSAI AFA fishery, and
adding these values to the number of reported Chinook (a.k.a. King) salmon (Oncorhynchus
tshawytscha) and non-Chinook salmon landed in 2011 from the GOA6 that had been multiplied
by 0.1 and 0.3 respectfully since these sampling rates represent those currently used by the
NPGOP for salmon tissue collections following the instructions to observers that originated from
AFSC genetic scientists at the Auke Bay Laboratories (NMFS 2010).
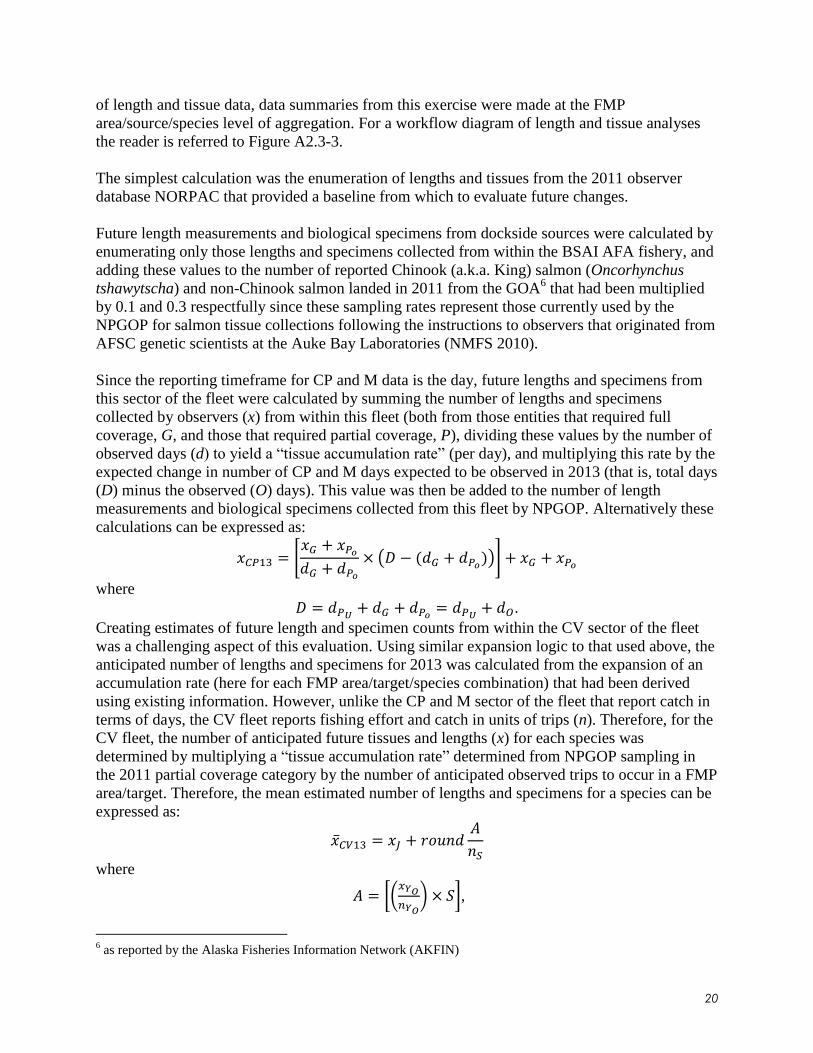
Since the reporting timeframe for CP and M data is the day, future lengths and specimens from
this sector of the fleet were calculated by summing the number of lengths and specimens
collected by observers (x) from within this fleet (both from those entities that required full
coverage, G, and those that required partial coverage, P), dividing these values by the number of
observed days (d) to yield a “tissue accumulation rate” (per day), and multiplying this rate by the
expected change in number of CP and M days expected to be observed in 2013 (that is, total days
(D) minus the observed (O) days). This value was then be added to the number of length
measurements and biological specimens collected from this fleet by NPGOP. Alternatively these
calculations can be expressed as:
[
( ( ))]
where
.
Creating estimates of future length and specimen counts from within the CV sector of the fleet
was a challenging aspect of this evaluation. Using similar expansion logic to that used above, the
anticipated number of lengths and specimens for 2013 was calculated from the expansion of an
accumulation rate (here for each FMP area/target/species combination) that had been derived
using existing information. However, unlike the CP and M sector of the fleet that report catch in
terms of days, the CV fleet reports fishing effort and catch in units of trips (n). Therefore, for the
CV fleet, the number of anticipated future tissues and lengths (x) for each species was
determined by multiplying a “tissue accumulation rate” determined from NPGOP sampling in
the 2011 partial coverage category by the number of anticipated observed trips to occur in a FMP
area/target. Therefore, the mean estimated number of lengths and specimens for a species can be
expressed as:
where
[(
) ],
6 as reported by the Alaska Fisheries Information Network (AKFIN)
21
and J represents the 2011 sector of the fleet that has full coverage due to cooperative
membership (and would remain under full coverage in 2013), is the 2011 partial coverage CV
fleet, S represents a simulated number of observed trips from the 2011 landings data that would
be classified as belonging to the 2013 partial coverage category using the rate defined in section
2.5.1 and nS is the number of simulated draws of trips (chosen to be 2000 here- Table 2.2).
Similarly the 0.025 and the 0.975 quantiles of A added to xJ yielded the upper and lower
confidence bounds for the estimates of .
Summaries of the actual and anticipated future lengths and specimens to result from this ADP
are presented in Tables 2.3 and 2.4 for the BSAI and GOA respectfully.
Since it is difficult to gain a broad program-wide understanding of the potential impacts of a
restructured observer program from summary tables, for each FMP area/species, relative
differences in the total amount of each tissue type (lengths, ageing structures, maturities, and
stomachs) were calculated from:
so that the estimated (e) number of tissues to have been collected in 2011 using 2013 ADP
sampling procedures is compared to those actually collected in 2011 (O). Plots of Δx were made
with respect to values of x realized in 2011 to determine whether patterns were evident among
species within an FMP (Figure 2.8). As anticipated, the magnitude of changes in lengths and
tissues was negatively related to the values of x realized in 2011. In other words, those species
that saw large numbers of lengths and ages collected in 2011 are anticipated to experience the
least relative change from those values as a result of the restructured program and vise versa.
Most of these differences are the result of changes in dockside observer deployment strategies.
For example, a large relative increase in GOA Chinook salmon lengths would be offset by a
relatively large decrease in GOA pollock and cod ageing structures (otoliths). However while a
decrease in total maturity and stomach samples would also be anticipated for GOA pollock,
similar values for cod are expected to increase (Figure 2.8). The at-sea collection rates that are
included in the instructions to 2013 observers are likely to be adjusted to account for these
differences.
2.5.4 Evaluation Analysis 4: Anticipated cost of dockside sampling for GOA salmon genetics
Tracking the bycatch of salmon in the pollock fishery has been an ongoing concern for
NMFS and the Council. Bycatch of Chinook salmon in the GOA pollock fishery has historically
accounted for the greatest proportion of Chinook salmon taken in the GOA groundfish fisheries
(NMFS 2012). To address these concerns, the Council took action in June of 2011 which capped
the Chinook bycatch in 2012 in the GOA, and NMFS is working with industry to collect salmon
tissues from this bycatch (NOAA 2012b).
The amount of observer time and money required to sample pollock offloads in the GOA for
salmon genetics was estimated in several steps. First, the total amount of salmon (W) in each
GOA pollock offload (L) each day (d) during 2011 was enumerated. Next, the sum of the number
of Chinook salmon (K) divided by 10 and the number of chum salmon (H) divided by 30 will be
used as a proxy for the number of genetic samples taken in each offload (xl) following the

22
instructions to observers that originated from AFSC genetic scientists at the Auke Bay
Laboratories (NMFS 2010). Using the time-per-task values from prior analyses of observer
duties at-sea as a guide (MRAG 2004), the number of total salmon was multiplied by 0.008 and
the number of genetic samples multiplied by 0.17 to determine the observer workload in units of
hours per offload. The mean value ( ) among offloads was then multiplied against the number of
GOA pollock landings made each day to yield the daily observer workload. Next this daily
observer workload was divided by a 12 hour day, rounded, and a value of one added to yield the
number of observers required for this day (fd). This calculation is presented in this way under the
assumption that partial days would be billed to NMFS by the observer contractor as a full day.
Multiplying the contract value of an observer day by the number of observers required for each
GOA pollock offload day and summing yielded the total cost of this task. Expressed
mathematically these calculations read as:
∑
where
[ ( )
]
and
∑ ( ) ( )
and
.
To evaluate the impact of this task on the at-sea deployment rate, the total cost of the task
defined above was converted into at-sea days by dividing by the contract estimate of an at-sea
day to yield the number of potential at-sea days. Dividing by the estimated at-sea fishing
effort days for the 2013 partial coverage fleet yielded the “cost” of GOA dockside observer
deployment in terms of the at-sea deployment rate. The dockside work effort (days) in this ADP
represented less than a third of a percent of the total 2013 at-sea partial-coverage category fleet
effort. For a workflow diagram the reader is referred to Figure A2.3-4.
2.5.5 Evaluation Analysis 5: Summary of total observer deployment in the fleet
Up until now, the evaluation analyses of restructure have dealt with individual aspects of
the program. Here, evaluations between the actual 2011 observer data, and that expected had
2011 been sampled under this ADP was conducted with respect to three metrics for the entire
fleet. The first of these metrics is the number of vessels, which is a proxy for the number of
fishery participants “in the program.” The second metric is the number of days, which equates
not only to fishing effort, but also to costs. Finally, the total catch was evaluated since this metric
equates to resource use and impact by the fleet.
Data for fleet evaluations come from multiple sources. For a workflow diagram of how total fleet
comparisons were generated, the reader is referred to Figure A2.3-5. Table 2.5 contains the

23
output from these comparisons. Comparisons of 2011 actual observer coverage to that expected
had 2011 been sampled according to this ADP reveal that the restructured program would have
reduced the number of vessels without any chance of observer coverage and increased the
number of vessels in the partial coverage category with little change in the full coverage
category. Consequently, the sampling rate for the partial coverage fleet according to this ADP is
reduced compared to that achieved in 2011. However, since CPs are all within the 2013 ADP
full-coverage category and these vessels fish disproportionately greater days and catch compared
to CVs, when partial and full coverage fleets are combined, sampling under this ADP would
have resulted in a small net increase in observer coverage in terms of total vessels, days, and
catch compared to 2011 actual values.
2.6 Methods to evaluate the 2013 Observer program in 2013
In the Council‟s June 2012 meeting, NMFS proposed that in June of each year they
would deliver a report on how participants in the fleet adjusted to the new ADP, and termed this
the “ADP performance report.” While a complete list of elements to be included in this future
document is beyond the scope of this ADP, we will include how NMFS will be tracking key
performance metrics. To address the second portion of this ADP‟s objective (do not run out of
funds), the NFMS needs to track ongoing expenses against available funds. Following the
example used in the Northeast Groundfish Observer Program, the relative cumulative days fished
in the partial coverage stratum (normalized so it sums to 1) in the most recent past year will be
plotted against the relative cumulative cost of observer deployment in the current year derived
from (a) the number of days and cost per day in the ODDS, and (b) the number of days in
debriefed status within NORPAC. While (a) represents anticipated costs to NMFS in near real
time, (b) represents actual billable costs to NMFS, but will be delayed by up to 90 days since this
is the maximum deployment for an observer prior to debriefing. In addition, the rates of observer
coverage in terms of trips for the partial coverage category portion of the fleet from eLandings
reports will be compared to those declared in ODDS and those for which NORPAC data exists.
Deviations from expected values of coverage given ODDS deployment rates will be interpreted
as the combination of both random error (unintentional) and intentional forces (e.g., the observer
effect). Comparisons between these deviations among various fisheries, ports, and times of year
will be used to gain insight as to which of these forces are responsible for observed patterns, and
will be used to recommend targeted outreach, education, and enforcement activities to portions
of the fleet. This “deploy and evaluate” approach represents an iterative improvement of the
deployment efficiency of observers by NMFS.
2.7 Innovation for 2013
This 2013 NPGOP EM project strategy and design incorporates many of the lessons
learned from past studies in Alaska and elsewhere- for example those summarized before the
Pacific Fisheries Management Council at their April 2012 meeting (Appendix 2.1;
Environmental Defense Fund 2012). Many (if not all) of these studies would not have been
possible without close cooperation from the fishing industry (industry). It is obvious that
building a strong working relationship with the industry is essential to the future success of an
EM program in the North Pacific.

24
The objective of EM deployment in 2013 is to evaluate the efficacy of EM to identify
species and the disposition of those species covered by the full retention requirements for
Demersal Shelf rockfish in the hook-and-line fishery operating out of southeastern Alaska
(NMFS reporting area 649 and 650) and, if funding permits the Central Gulf of Alaska (NMFS
reporting area 630). Towards this end, a contract was developed by NMFS for a business to
construct, deploy, and maintain a video based EM system on vessels in the vessel-selection
stratum. Vessel operators whose vessels are within the vessel-selection stratum and have
indicated they would like to volunteer for the EM program will be included in the list of vessels
that will be randomly selected from to determine EM deployment to occur in each calendar
quarter. However, given financial limitations, to meet OAC intent, and improve logistical
efficiencies, EM systems will not be deployed until the second calendar quarter (April 1st) and
will only be deployed on vessels with a history of fishing from the ports of Homer, Petersburg,
Sitka, and (if funding permits) Kodiak. The number of vessels that will receive EM within any
given quarter will be equal to the number of EM units available. This will be determined upon
finalization of a test video that will guide final development of an EM system that will be
deployed and from which the final cost will be determined. . Vessels selected for an EM system
will be notified through the U.S. Postal Service 30 days prior to the start of the calendar quarter.
The letter will contain instructions and contact information for the EM contractor to get the
system installed prior to the first fishing trip of the calendar quarter. Following system
installation, the EM contractor will provide detailed instructions and training on how to operate
and maintain the EM system to ensure the camera system continues to deliver clear footage
throughout a trip. Upon completion of all fishing trips for the calendar quarter the EM system
will be removed, hard drives replaced and prepared for integration onto another vessel. Video
data will be analyzed by NMFS after retrieval to evaluate operators‟ ability to maintain the EM
system and results will be reported to the Council.
The assignment of EM systems to vessels will not preclude their observation by human
observers. The deployment of EM units onto vessels that carry and do not carry human observers
will allow NMFS to evaluate if the presence of an observer influences catch and discard rates.
Furthermore, to address concerns over misreporting, dockside monitoring will be incorporated
into the study design. For trips that carry a human observer and EM, data from four sources can
be compared: at-sea counts of rockfish from cameras, at-sea counts from observers, dockside
counts from the at-sea observer who follows the catch dockside, and dockside counts from
industry (i.e. landing) reports. Although not simple to accomplish, the FMA has successfully
embarked on this type of study and data comparison in the past (Faunce 2011).
Almost all EM applications in recent years have focused on the use of cameras. The use of
alternative EM units to cameras that are less expensive may provide an opportunity for broader
coverage throughout the fleet. The NMFS intends to develop non-camera systems that would
collect set and haul positions, skipper estimates of discard and catch per set using a paper log or
an electronic logbook that is currently in development. In addition, non-camera systems may
include passive monitoring techniques such as GPS and sensors such as data loggers to
determine fishing effort and location. Development of these systems will be entirely dependent
upon funding that has yet been identified.

25
2.8 Acknowledgements
This work originates from a September 5, 2012 draft version that was produced by the
Observer Restructure Analysis Group (ORAnG). The ORAnG was formed in July 2011 to
provide analytical guidance and support towards the effective and efficient deployment of
observers in the North Pacific. The group is comprised of (in alphabetical order): Teresa Amar
(AFSC/ Resource Ecology and Fisheries Management Division, REFM), Jennifer Cahalan
(Pacific States Marine Fisheries Commission and AFSC/FMA), Craig H. Faunce (lead,
AFSC/FMA), Jason Gapser (core member, AKRO), Sandra Lowe (AFSC/REFM), Jennifer
Mondragon (AKRO), Farron Wallace (core member, AFSC/FMA) and Ray Webster (IPHC).
Additional review and guidance on the deployment of dockside observers was provided by
Martin Loefflad (Director, AFSC/FMA) and Patti Nelson (Deputy Director, AFSC/FMA).
ODDS programming is being performed by AFSC/FMA staff members Paul Packer and Martin
Park with testing and documentation by Glenn Campbell under the management of Doug
Turnbull, with consultation from Craig Faunce and Farron Wallace.
2.9 Literature Cited
Allen, M., Kilpatrick, D., Armstrong, M., Briggs, R., Perez, N. and Course, G. 2001. Evaluation
of sampling methods to quantify discarded fish using data collected during discards
project EC 95/094 by Northern Ireland, England and Spain. Fisheries Research, 49: 241-
254.
Cahalan, J., Mondragon, J., and Gasper, J. 2010. Catch sampling and estimation in the federal
groundfish fisheries off Alaska. NOAA Technical Memo NMFS-AFSC-205: 51 pp.
Cochran, W. G. 1977. Sampling techniques. John Wiley and Sons, Inc. New York. 428 p.
Cotter, A. J. R., Course, G., Buckland, S., and Garrod, C. 2002. A PPS sample survey of English
fishing vessels to estimate discarding and retention of North Sea cod, haddock, and
whiting. Fisheries Research, 55: 25-35.
Environmental Defense Fund. 2012. Electronic monitoring: Lessons learned and
recommendations for further development. A Review of EM Pilot Studies Relevant to
U.S. Groundfish Fisheries. Accessed on 8/28/12 from http://www.pcouncil.org/wp
content/uploads/I4d_SUP_PC2_APR2012BB.pdf.
Dorn, M. W., Aydin, K., Barbeaux, S. J., Guttormsen, M., Spalinger, K., and Palsson, W. 2011.
Assessment of the Walleye Pollock stock in the Gulf of Alaska. In Stock assessment and
fishery evaluation report for the groundfish resources of the Gulf of Alaska, pp. 33-148.
Alaska Fisheries Science Center, Seattle.
Faunce, C. H. 2011. A comparison between industry and observer catch compositions within the
Gulf of Alaska rockfish fishery. ICES Journal of Marine Science, 68: 1769-1777.
MRAG Americas, Inc. 2004. Evaluation and analysis of current field sampling used in North
Pacific Groundfish fisheries Annex to the report of Task 1: Report on the second series of
field trials to test proposed alternative sampling methods. 46 pp. Available from the
Alaska Fisheries Science Center, Fisheries Monitoring and Analysis Division, Seattle.
NMFS (National Marine Fisheries Service). 2012. Chinook salmon prohibited species catch in
the Gulf of Alaska Pollock Fishery. February 2012 Final Environmental Assessment/
Regulatory Impact Review/ Initial Regulatory Flexibility Analysis for Amendment 93 to
the Fishery Management Plan for Groundfish of the Gulf of Alaska. 296 pp. plus

26
Appendices. Accessed on August 23, 2012 at
http://www.fakr.noaa.gov/sustainablefisheries/amds/93/amd93earirirfa0212.pdf
NMFS 2010. 2011 Observer Sampling Manual. Accessed on July 30, 2012 at
http://www.afsc.noaa.gov/FMA/Manual_pages/MANUAL_pdfs/manual2011.pdf.
NOAA (National Oceanic and Atmospheric Administration) 2012a. Groundfish Fisheries of the
Exclusive Economic Zone off Alaska and Pacific Halibut Fisheries; Observer Program 50
CFR Part 679 [Docket No. 110831549–2180–01]. Federal Register / Vol. 77, No. 75 /
Wednesday, April 18, 2012 / Proposed Rules. Accessed on April 20, 2012 at
http://alaskafisheries.noaa.gov/prules/77fr23326.pdf.
NOAA (National Oceanic and Atmospheric Administration) 2012b. Fisheries of the exclusive
economic zone off Alaska; Chinook salmon bycatch management in the Gulf of Alaska
pollock fishery; Amendment 93 50 CFR Parts 679-680 [Docket No. 110627357-2209-
03]. Federal Register / Vol. 77, No. 140 / Friday, July 20, 2012 / Rules and Regulations.
Accessed on August 30th
, 2012 at http://www.gpo.gov/fdsys/pkg/FR-2012-07-
20/pdf/2012-17289.pdf
NPFMC (North Pacific Fisheries management Council). 2010. Council Final Motion on
Observer Restructuring BSAI Amendment 86/GOA Amendment 76, October 8, 2010.
Accessed on 8/30/12 at
http://www.fakr.noaa.gov/npfmc/PDFdocuments/conservation_issues/Observer/
ObserverMotion1010.pdf
NPFMC (North Pacific Fishery Management Council) and NOAA. 2011. Environmental
Assessment/Regulatory Impact Review/Initial Regulatory Flexibility Analysis for
Proposed Amendment 86 to the Fishery Management Plan for Groundfish of the Bering
sea/Aleutian Islands Management Area and Amendment 76 to the Fishery Management
Plan for Groundfish of the Gulf of Alaska Restructuring the Program for Observer
Procurement and Deployment in the North Pacific, Secretarial Review Draft. March
2011. Accessed on August 30th
2012 at
http://www.fakr.noaa.gov/analyses/observer/A86%20and%2076%20ea_rir_irfa.ea.pdf.
Pella, J. J., and H.J. Geiger, H. J. 2009. Sampling considerations for estimating geographic
origins of Chinook salmon bycatch in the Bering Sea Pollock fishery. ICES Document,
Alaska Department of Fish and Game, Special Publication No. 09-08, Anchorage.
R Development Core Team (2011). R: A language and environment for statistical computing. R
Foundation for Statistical Computing, Vienna, Austria. ISBN 3-900051-07-0, URL
http://www.R-project.org.
Thompson, S. K., and Lauth, R. R. 2011. Assessment of the Pacific cod stock in the Eastern
Bering Sea and Aleutian Islands Area. In Stock Assessment and Fishery Evaluation
Report for the Bering Sea and Aleutian Islands, pp. 269-476. Alaska Fisheries Science
Center, Seattle.

27
2.10 Tables
Table 2.1. Coverage strata for the 2013 ADP. Table is organized by vessel type for non-CDQ
fisheries (A), and by target for CDQ fisheries (B).
Zero Coverage Partial-Vessel Selection
Partial-Trip Selection
Full Coverage
A. Non-CDQ Fisheries Vessel type
CV Jig gear State GHL fisheries <40’LOA
between 40’ and 57.5’ LOA
>57.5’ and not in RP or AFA
BS AFA Pollock vessels CGOA RP
CP none none Vessels meeting CP exemption criteria
All non-exempted CPs7
M none none none All
B. CDQ Fishery
Target
Halibut none Hook and line Hook and line None
Sablefish none Hook and line Hook and line None
Sablefish none Pot Pot None
Pollock none none none All trawl gear and motherships
Other groundfish
none Pot Pot All trawl and hook-and-line
7 Includes jig gear.

28
Table 2.2 Symbols used in calculations in the order they appear.
Symbol Definition
r Rate (selection probability in simulations).
N Trips.
NCV13 N trips taken in the CV partial coverage fleet according to 2013 (ADP) definitions.
S Simulated trips sampled from NCV13.
ci Cost for trip i.
Q Calendar quarter.
V Vessel, v=1,...V vessels.
B Base cost rate ($ day-1) from contract between NMFS and the selected observer provider(s).
I A random draw from a distribution of CV invoice incidental costs ($ day-1).
D Calendar days.
NQV N trips taken in vessel v in quarter Q.
CV13 Catcher vessel data defined by 2013 observer deployment rules.
X Number of biological tissues. In 2.5.3- Includes lengths, ageing structures (otoliths, spines and vertebrae), sexual maturity assessments, and stomachs. In 2.5.4 includes only lengths and genetic samples).
CP13 Catcher processor/Mothership data defined by 2013 observer deployment rules.
G 2011 full coverage CP and M sector of the fleet.
P 2011 partial coverage CP and M sector of the fleet.
O Observed in 2011.
U Unobserved in 2011.
J 2011 full coverage CV sector of the fleet due to membership in cooperatives.
Y 2011 partial coverage CV sector of the fleet.
A Simulated number of tissues for a species/FMP area/target.
Δ Change in, difference between.
e Estimated value using 2013 (ADP) definitions.
W Number of salmon.
L Number of GOA pollock offloads.
K Number of king salmon.
H Number of chum salmon.
T Observer working time (hours-1)
F Number of observers.

29
Table 2.3. Summary of length and tissues collected from species by observers in 2011 (labeled as actual) and those estimated to be
collected if 2011 had been sampled according to this ADP (labeled as future) from the Bering Sea and Aleutian Islands. For catcher
vessel data, the mean and upper and lower 95% bounds are provided.
Species Actual Lengths Future Lengths Lower 95% L Upper 95% L Actual ageing Future ageing Lower 95% A Upper 95% A Actual Maturities Future Maturities Lower 95% M Upper 95% M Actual Stomachs Future Stomachs Lower 95% S Upper 95% S
ALASKA PLAICE 14,328 14,335 14,335 14,335 686 686 686 686 - - - - - - - -
ALASKA SKATE 28,766 35,292 35,255 35,332 - - - - - - - - - - - -
ALEUTIAN SKATE 2,552 3,300 3,287 3,314 - - - - - - - - - - - -
ANGULATUS TANNER 676 402 272 544 - - - - - - - - - - - -
ARROWTOOTH FLOUNDER 887 893 893 893 5 5 5 5 346 346 346 346 307 307 307 307
ATKA MACKEREL 20,351 20,361 20,361 20,361 1,976 1,977 1,977 1,977 - - - - - - - -
BAIRDI TANNER CRAB 24,277 21,212 20,639 21,804 - - - - - - - - - - - -
BERING SKATE 3,626 4,681 4,681 4,682 - - - - - - - - - - - -
BIG SKATE 217 249 246 251 - - - - - - - - - - - -
BIGMOUTH SCULPIN 1 1 1 1 - - - - - - - - - - - -
BLUE KING CRAB 234 300 300 300 - - - - - - - - - - - -
BROWN KING CRAB 10,816 9,578 8,347 10,918 - - - - - - - - - - - -
BUTTER SOLE 21 21 21 21 - - - - - - - - - - - -
CHINOOK SALMON 2,634 2,635 2,635 2,636 - - - - - - - - - - - -
CHUM SALMON 6,792 6,802 6,802 6,802 - - - - - - - - - - - -
COHO SALMON 36 37 37 37 - - - - - - - - - - - -
COMMANDER SKATE 521 671 671 671 - - - - - - - - - - - -
COUESI KING CRAB 534 331 243 427 - - - - - - - - - - - -
DARK ROCKFISH 2 2 2 2 - - - - - - - - - - - -
DEEPSEA SKATE 1 1 1 1 - - - - - - - - - - - -
DUSKY ROCKFISH 1,197 1,198 1,198 1,198 36 36 36 36 - - - - - - - -
FLATHEAD SOLE 16,192 16,304 16,303 16,306 877 882 882 882 - - - - - - - -
GIANT GRENADIER 2,799 3,389 3,342 3,440 - - - - - - - - - - - -
GREAT SCULPIN 3,476 3,489 3,488 3,489 - - - - - - - - - - - -
HYBRID TANNER CRAB 25 26 26 26 - - - - - - - - - - - -
KAMCHATKA FLOUNDER 373 373 373 373 - - - - - - - - - - - -
LONGNOSE SKATE 12 14 14 15 - - - - - - - - - - - -
LYRE CRAB UNIDENTIFIED 3 3 3 3 - - - - - - - - - - - -
MUD SKATE 497 551 551 551 - - - - - - - - - - - -
NORTHERN ROCK SOLE 48,778 48,747 48,739 48,754 2,151 2,152 2,152 2,152 - - - - - - - -
NORTHERN ROCKFISH 1,596 1,600 1,600 1,600 469 470 470 470 - - - - - - - -
OCTOPUS UNIDENTIFIED - - - - - - - - - - - - - - - -
OPILIO TANNER CRAB 20,343 22,547 22,449 22,649 - - - - - - - - - - - -
PACIFIC COD 180,900 206,743 205,100 208,398 2,438 2,130 2,113 2,147 1,281 1,134 1,127 1,141 319 316 316 317
PACIFIC HALIBUT 52,908 54,574 54,276 54,885 - - - - - - - - - - - -
PACIFIC OCEAN PERCH 12,109 12,115 12,115 12,115 2,809 2,810 2,810 2,810 - - - - - - - -
PACIFIC SLEEPER SHARK 9 10 10 10 - - - - - - - - - - - -
PARALOMIS MULTISPINA 2 3 3 3 - - - - - - - - - - - -
PINK SALMON 189 189 189 189 - - - - - - - - - - - -
PLAIN SCULPIN 7,064 7,067 7,067 7,068 - - - - - - - - - - - -
POLLOCK 345,971 345,658 345,644 345,672 6,608 6,600 6,599 6,600 4,570 4,567 4,567 4,567 1,673 1,674 1,674 1,674
RED KING CRAB 2,098 2,472 2,471 2,473 - - - - - - - - - - - -
REX SOLE 27 27 27 27 - - - - - - - - - - - -
ROCK SOLE UNIDENTIFIED 1,362 1,363 1,363 1,363 26 26 26 26 - - - - - - - -
ROUGHEYE ROCKFISH 849 1,029 1,025 1,033 177 196 195 197 - - - - - - - -
ROUGHTAIL SKATE 12 16 16 16 - - - - - - - - - - - -
SABLEFISH (BLACKCOD) 13,443 10,577 9,046 12,285 1,919 1,512 1,315 1,726 - - - - - - - -
SALMON SHARK 3 3 3 3 - - - - - - - - - - - -
SHORTRAKER ROCKFISH 1,158 1,502 1,464 1,543 312 397 386 409 - - - - - - - -
SHORTSPINE THORNYHEAD 1,893 2,239 2,239 2,239 528 619 619 619 - - - - - - - -
SOCKEYE SALMON 26 26 26 26 - - - - - - - - - - - -
SOUTHERN ROCK SOLE 119 119 119 119 5 5 5 5 - - - - - - - -
SPINY DOGFISH SHARK 2 3 3 3 - - - - - - - - - - - -
SQUID UNIDENTIFIED 5,775 5,776 5,776 5,776 - - - - - - - - - - - -
TANNERI TANNER 338 213 156 277 - - - - - - - - - - - -
TURBOT (GREENLAND) 7,110 8,359 8,359 8,359 410 465 465 465 - - - - - - - -
WARTY SCULPIN 18 18 18 18 - - - - - - - - - - - -
WHITEBLOTCHED SKATE 1,575 3,222 2,700 3,768 - - - - - - - - - - - -
WHITEBROW SKATE 122 156 156 156 - - - - - - - - - - - -
YELLOW IRISH LORD 8 8 8 8 - - - - - - - - - - - -
YELLOWFIN SOLE 124,293 124,424 124,424 124,424 5,533 5,538 5,538 5,538 - - - - - - - -
Grand Total 971,946 1,007,256 1,000,918 1,013,992 26,965 26,506 26,279 26,750 6,197 6,047 6,040 6,054 2,299 2,297 2,297 2,298

30
Table 2.4. Summary of length and tissues collected from species by observers in 2011 (labeled as actual) and those estimated to be
collected if 2011 had been sampled according to this ADP (labeled as future) in the Gulf of Alaska. Format follows Table 2.2. Species Actual Lengths Future Lengths Lower 95% L Upper 95% L Actual ageing Future ageing Lower 95% A Upper 95% A Actual Maturities Future Maturities Lower 95% M Upper 95% M Actual Stomachs Future Stomachs Lower 95% S Upper 95% S
ALASKA SKATE 154 174 167 183 - - - - - - - - - - - -
ALEUTIAN SKATE 835 1,003 991 1,016 - - - - - - - - - - - -
ARROWTOOTH FLOUNDER 11,315 11,068 10,611 11,533 8 6 6 6 - - - - - - - -
ATKA MACKEREL 473 653 653 653 96 133 133 133 - - - - - - - -
BAIRDI TANNER CRAB 767 888 852 928 - - - - - - - - - - - -
BERING SKATE 459 603 589 618 - - - - - - - - - - - -
BIG SKATE 660 777 748 810 - - - - - - - - - - - -
BLUE KING CRAB 1 1 1 1 - - - - - - - - - - - -
BROWN KING CRAB 6 6 6 6 - - - - - - - - - - - -
BUTTER SOLE 113 73 72 75 15 - - - - - - - - - - -
CHINOOK SALMON 300 1,448 1,446 1,450 - - - - - - - - - - - -
COMMANDER SKATE 6 7 7 7 - - - - - - - - - - - -
COUESI KING CRAB 5 6 5 6 - - - - - - - - - - - -
DARK ROCKFISH 39 54 54 54 2 3 3 3 - - - - - - - -
DOVER SOLE 190 184 180 189 25 23 23 23 - - - - - - - -
DUSKY ROCKFISH 3,550 4,162 4,158 4,168 837 977 973 983 - - - - - - - -
ENGLISH SOLE 1 - - - - - - - - - - - - - - -
FLATHEAD SOLE 2,849 2,161 1,993 2,345 453 253 240 267 - - - - - - - -
GIANT GRENADIER 3,118 4,931 4,524 5,367 - - - - - - - - - - - -
LONGNOSE SKATE 416 531 516 548 - - - - - - - - - - - -
LONGSPINE THORNYHEAD ROCKFISH 2 3 3 3 2 3 3 3 - - - - - - - -
NORTHERN ROCK SOLE 647 521 368 703 65 35 23 50 - - - - - - - -
NORTHERN ROCKFISH 5,121 6,091 6,088 6,094 1,271 1,528 1,525 1,531 - - - - - - - -
OCTOPUS UNIDENTIFIED 2 2 2 2 - - - - - - - - - - - -
OPILIO TANNER CRAB 2 1 1 2 - - - - - - - - - - - -
PACIFIC COD 43,734 34,514 32,641 36,439 3,705 356 340 373 33 34 32 36 27 28 26 29
PACIFIC HALIBUT 9,900 11,179 10,569 11,813 - - - - - - - - - - - -
PACIFIC OCEAN PERCH 9,800 11,246 11,138 11,398 2,224 2,581 2,554 2,620 - - - - - - - -
PACIFIC SLEEPER SHARK 1 1 1 1 - - - - - - - - - - - -
POLLOCK 20,742 6,648 5,741 7,588 3,964 1,114 958 1,273 24 18 15 20 25 18 15 21
REDSTRIPE ROCKFISH 16 16 16 16 5 5 5 5 - - - - - - - -
REX SOLE 3,874 4,257 4,224 4,300 462 356 355 358 - - - - - - - -
ROCK SOLE UNIDENTIFIED 50 13 13 14 16 1 1 1 - - - - - - - -
ROUGHEYE ROCKFISH 993 1,716 1,601 1,840 328 681 624 743 - - - - - - - -
ROUGHTAIL SKATE 2 3 3 4 - - - - - - - - - - - -
SABLEFISH (BLACKCOD) 14,827 25,292 22,944 27,824 2,038 3,159 2,873 3,461 - - - - - - - -
SALMON SHARK 2 2 2 2 - - - - - - - - - - - -
SHORTRAKER ROCKFISH 1,012 1,752 1,611 1,901 380 708 651 771 - - - - - - - -
SHORTSPINE THORNYHEAD 1,719 1,717 1,699 1,737 405 432 427 437 - - - - - - - -
SOUTHERN ROCK SOLE 758 472 360 604 99 19 14 24 - - - - - - - -
SPINY DOGFISH SHARK 6 9 8 11 - - - - - - - - - - - -
TANNERI TANNER 50 71 63 80 - - - - - - - - - - - -
YELLOW IRISH LORD 164 137 89 195 - - - - - - - - - - - -
NON-CHINOOK SALMON 52 85 83 87 - - - - - - - - - - - -
Grand Total 138,733 134,478 126,841 142,615 16,400 12,373 11,731 13,065 57 52 47 56 52 46 41 50
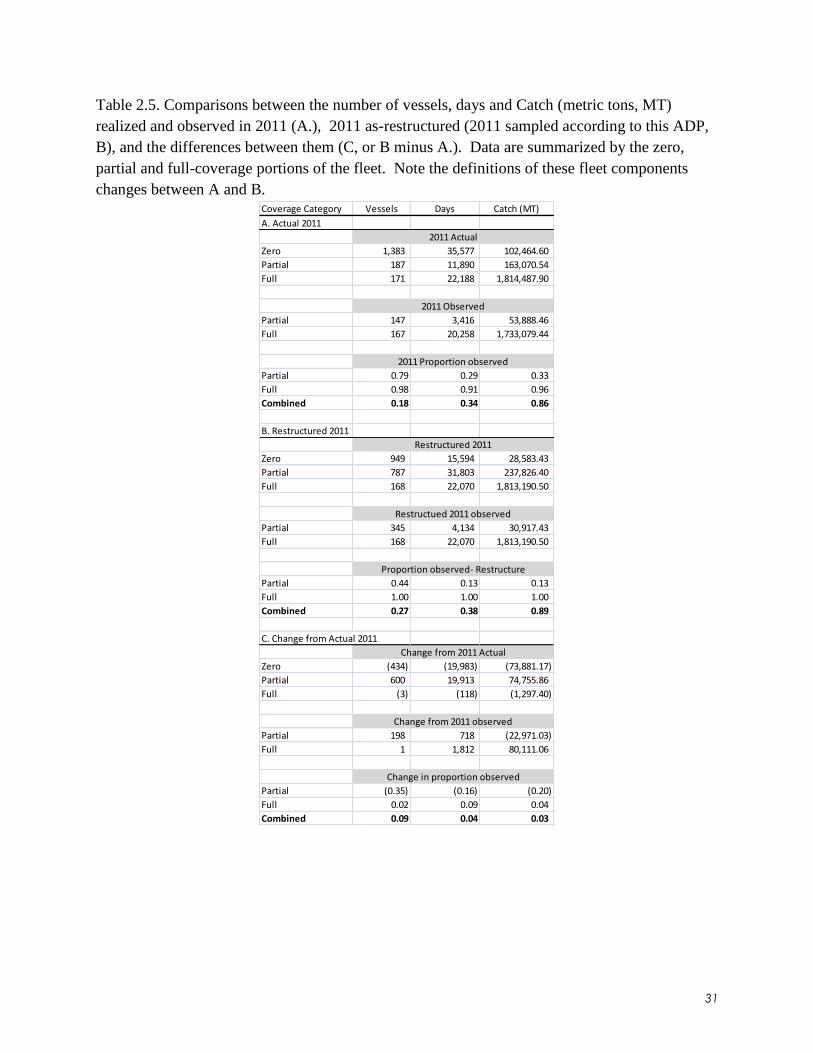
31
Table 2.5. Comparisons between the number of vessels, days and Catch (metric tons, MT)
realized and observed in 2011 (A.), 2011 as-restructured (2011 sampled according to this ADP,
B), and the differences between them (C, or B minus A.). Data are summarized by the zero,
partial and full-coverage portions of the fleet. Note the definitions of these fleet components
changes between A and B.
Coverage Category Vessels Days Catch (MT)
A. Actual 2011
Zero 1,383 35,577 102,464.60
Partial 187 11,890 163,070.54
Full 171 22,188 1,814,487.90
Partial 147 3,416 53,888.46
Full 167 20,258 1,733,079.44
Partial 0.79 0.29 0.33
Full 0.98 0.91 0.96
Combined 0.18 0.34 0.86
B. Restructured 2011
Zero 949 15,594 28,583.43
Partial 787 31,803 237,826.40
Full 168 22,070 1,813,190.50
Partial 345 4,134 30,917.43
Full 168 22,070 1,813,190.50
Partial 0.44 0.13 0.13
Full 1.00 1.00 1.00
Combined 0.27 0.38 0.89
C. Change from Actual 2011
Zero (434) (19,983) (73,881.17)
Partial 600 19,913 74,755.86
Full (3) (118) (1,297.40)
Partial 198 718 (22,971.03)
Full 1 1,812 80,111.06
Partial (0.35) (0.16) (0.20)
Full 0.02 0.09 0.04
Combined 0.09 0.04 0.03
Change from 2011 observed
Change in proportion observed
2011 Proportion observed
2011 Observed
2011 Actual
Restructued 2011 observed
Restructured 2011
Change from 2011 Actual
Proportion observed- Restructure

32
2.11 Figures
Figure 2.1. Histogram of 2000 simulated total annual program costs for a deployment rate of
0.13 The dashed black line is the at-sea budget that 50% of the simulated at-sea program costs
were at or below, the red line is the actual at-sea deployment budget, the blue dashed line is the
at-sea budget that 90% of the simulated at-sea program costs were at or below, and the dashed
yellow line is the at-sea budget that 95% of the simulated at-sea program costs were at or below.
Actual program costs are not depicted.

33
Figure 2.2. Heat map depiction of the number of trips (cell values) and the relative proportion of cell values that were observed in the
2011 NPGOP fleet for vessels that would constitute “trip-selection” and “vessel-selection” strata in the 2013 restructured program
(colors). Row values indicate combinations of gear type (space) FMP (space) Target. Gear abbreviations: HAL=Hook-and-line gear,
POT=Pot gear, TRW=Trawl gear. FMP abbreviations: BSAI=Bering Sea and Aleutian Islands, GOA=Gulf of Alaska. Target
Abbreviations: ATH=Arrowtooth flounder, COD=Pacific Cod, DWF=Deep water flatfish, HAL=Pacific halibut, FSL=Flathead sole,
OTH=Other, POL=Walleye pollock, REX=Rex sole, RCK=Rockfish, SBL=Sablefish, SWF=Shallow-water flatfish.

34
Figure 2.3. Heat map depiction of the number of realized trips in 2011 (cell values) and those that would have been expected to be
observed had the 2011 NPGOP fleet for vessels that would constitute “trip-selection” and “vessel-selection” strata in the 2013
restructured program been observed according to this ADP (colors). Note: although format and abbreviations follow Figure 2.2,
legend values and colors are unique to this figure.
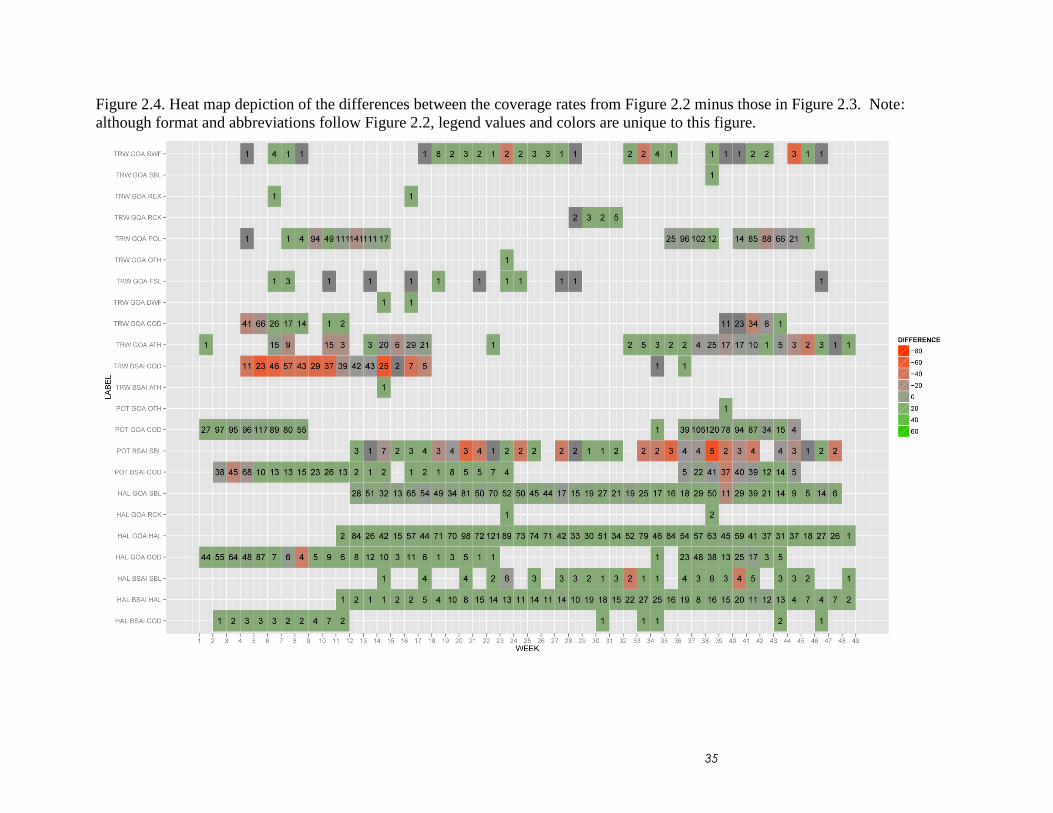
35
Figure 2.4. Heat map depiction of the differences between the coverage rates from Figure 2.2 minus those in Figure 2.3. Note:
although format and abbreviations follow Figure 2.2, legend values and colors are unique to this figure.

36
Figure 2.5. Histograms depicting the number of trips in each relative coverage rate depicted in
Figures 2.2 and 2.3 for the 2013 partial coverage stratum CV fishing hook and line gear within
each FMP (columns) and target (rows). Abbreviations follow Figure 2.2. Median (50 percentile)
values for current (2011 NPGOP) and future (2011 as sampled according to this ADP) are
depicted at horizontal dotted lines.

37
Figure 2.6. Histograms depicting the number of trips in each relative coverage rate depicted in
Figures 2.2 and 2.3 for the 2013 partial coverage stratum CV fishing pot gear within each FMP
(columns) and fisheries (rows). Format follows figure 2.5. Abbreviations follow Figure 2.2.

38
Figure 2.7. Histograms depicting the number of trips in each relative coverage rate depicted in
Figures 2.2 and 2.3 for the 2013 partial coverage stratum CV fishing trawl gear within each FMP
(columns) and fisheries (Rows). Format follows figure 2.5. Abbreviations follow Figure 2.2.

39
Figure 2.8. Difference plots between the number of lengths and tissues that were collected by
NPGOP observers in 2011 compared to the number that would have been expected had 2011
been sampled according to this ADP within each FMP. Point labels are somewhat arbitrary and
are depicted to reflect those species that exhibited the greatest difference values where graphic
space is limited.

40
Appendix 1.1 September 2012 Minutes of the Joint BSAI and GOA Groundfish Plan Teams Craig Faunce (NMFS/AFSC/FMA) presented a draft methods document detailing the 2013 Annual
Deployment Plan (ADP). This ADP was created from the advice and input provided by an Observer
Restructure Analysis Group. Only a draft is available at this time because cost estimates for an observer
day and electronic monitoring are not yet available but are expected by the end of September. Craig
provided a schematic of the hierarchy of the observer sampling design.
The lowest level is TISSUES (age, length, maturity). The next level is INDIVIDUAL SPECIMEN from
which the tissues are taken. Next level is HAULS from which specimens are taken. Next level up is
TRIPS and highest level is SECTOR/FISHERY. Observer restructure only affects the top two levels,
which are TRIPS and SECTOR/FISHERY.
In 2010, the Council designated two classes of vessels that fall within the restructured observer program:
1) catcher-processors (CP) and motherships (M), which will be under a pay-as-you-go funding program
and will have complete coverage of trips; and 2) catcher vessels (CV), which will be assessed a landings
tax of 1.25% (to fund future years) and will have partial coverage of trips at a rate based on available
funds (the first year of the program is paid for by Federal funds).
Two CV partial coverage deployment methods are included:
1) A vessel selection stratum for vessels 0-57.5‟ LOA. All trips in a quarter will be observed for selected
vessels in this stratum. Vessels <40‟ in this stratum have no probability of being selected in 2013.
2) A trip selection stratum for vessels>57.5‟ LOA. Each trip will be logged into an Observer Declare and
Deploy System (ODDS) and is given a probability of being selected for an observer.
3) The number of estimation strata changes from three to four under the restructure. From 1990-2012 the
3 categories were:
1. Zero
2. Partial
3. Full coverage
For 2013 and forward the categories are:
1. Zero
2. Partial (trip-selection)
3. Partial (vessel-selection)
4. Full Coverage
The above pertains to at-sea deployment. Currently, AFA pollock offloads carry a 100% observer
coverage requirement that is funded from industry, and this observer requirement and payment method
will not change in the restructured program. In comparison, non-AFA deliveries of pollock will be fully
monitored (i.e., carry 100% coverage) as well; however, these observers will be paid for with restructure
funds. Summary of changes for 2013:
● All CP vessels become fully observed regardless of size. (Two minor exceptions were
mentioned.)
● In the CV sector, the deployment of observers is randomized and at-sea deployment will be based

41
on trip units and vessel units--not on days or pots per quarter.
● Dockside deployments will be used to monitor salmon bycatch (2013) and will not be based on
metric tons processed.
Evaluation analyses were conducted. First, how much coverage can be afforded in the CV fleet? Analysts
simulated total program costs (with many realizations) using 2011 as the base year of effort, and calculate
the rate that resulted in 90% of the simulated values being less than or equal to the program funds
(=$4.2M). The methodology was established and documented in the ADP.
Second, how would coverage be distributed within the 2013 CV fleet? This was determined by simulating
at-sea deployment for the 2011 year using two rates: 1) the rate that actually occurred, and 2) the rate that
would be expected under the ADP. An example chart (heat map) illustrating actual 2011 trips observed by
FMP/Gear/Target/Week was presented. Heat maps and histograms depicting magnitude of differences
among weeks will be in the final ADP.
The third analysis examined changes to the number of lengths and specimens collected. These were
determined using existing biological specimen collection rates (FMP/Target) projected onto simulated
observed trips from the second evaluation analysis. This was done for length measurements, age
structures, maturity stages, and stomachs from CP/M, CV, and dockside samples for each species. It was
noted that the numbers of lengths and tissues expected from dockside sources were set equal to those
collected from all non-AFA pollock offloads in 2011 (since AFA offloads would be paid for by industry).
Fourth, what is the cost of dockside deployment? The number of observers per day needed will be
determined and translated into costs using contract pay rates.
Finally, what are the differences between what actually occurred in 2011 and what would have occurred
under the restructured program, with respect to number of vessels, number of trip days, and total catch?
Electronic monitoring (EM) is to be incorporated into the 2013 ADP. Camera systems will be used to
monitor compliance with the full retention requirement for demersal shelf rockfish within the IFQ hook-
and-line fleet out of selected SE Alaska ports during the halibut and sablefish season.
Expectations for ADP vs. status quo:
Final evaluation analyses are pending, but it is expected that observer coverage under a randomized
deployment will be more representative of the fleet because:
● Decreased ability and incentive to introduce bias (observer effect)
● Distribution of observed trips should be proportional to fishing effort
Craig asked the Plan Teams to consider how to improve this ADP. For example:
In preparation of the 2013 ADP, 2011 was used as a proxy for effort expected in 2013 (this in turn
determines costs). For 2014 ADP they would like to improve on this assumption. They considered using
1) an average of prior years, 2) predicting future year based on trend in past years, and 3) a model that
incorporates other factors (e.g., TAC). The Plan Teams‟ suggestion was to use a model to predict future
effort, with some members suggesting that interannual variability in effort be evaluated. The Plan Teams
did not have additional advice or criticism relative to the ADP.
42
Appendix 1.2 October 2012 SSC meeting minutes A presentation was given by Craig Faunce (NMFS-AFSC) on the NMFS Annual Deployment Plan (ADP)
for the North Pacific Groundfish Observer Program in 2013. Public testimony was provided by Rachel
Dunkersloot (Alaska Marine Conservation Council), Paul Olson (The Boat Company), Dan Falvey
(Alaska Longline Fishermen‟s Association), and Jon Warrenchuk (Oceana).
The SSC appreciates the extensive work done to finalize the ADP that provides details on the rationale for
the rate of observing to contain program costs, and mechanics of observing catches at sea and dockside
sampling for groundfish fisheries in Gulf of Alaska and Bering Sea/Aleutian Islands. While the ADP is
not a regulatory document, the SSC was asked to provide comments on adequacy of the sampling design
to achieve the multiple goals of the observer program. We primarily focused our comments on methods
and rates of observing the partially-observed strata (trip selection for vessels >57.5‟ and vessel selection
for vessels 40 to 57.5‟) in the ADP since very few changes were made to the 100% observed vessels. Our
general comments on the sampling design are:
The new sampling design for partially-observed vessel types is a significant improvement
over the current sampling design in that a single rate (13%) is applied to all strata and the
selection of either vessels or trips is completely randomized to avoid the observer effect
thought to exist in the current deployment plan. This will greatly increase the likelihood
that statistics derived from observed trips are unbiased with respect to the unobserved
trips.
The sampling design and rate for 2013 represents an initial effort to deploy a completely
randomized design with equal coverage across all partially-observed vessels greater than 40 feet
in length. It is likely that this initial effort will not be optimal with respect to management needs
and cost-benefit. We envision that once these data are collected and analyzed, revisions to the
design and overall ADP will be forthcoming to attempt to optimize the deployment of observers
to meet Council management objectives and priorities, and deliver the highest precision possible
per dollar spent on the observing program.
We also recognize that efforts to optimize the sampling design in the future will require that a set
of performance measures be developed to guide improvements in the face of multiple and
complex management objectives. Performance indicators will need to specify target levels,
control levels, and frequency of evaluation.
Responses to logistical concerns in deploying observers will also have to evolve over time as
newly observed fleets respond to implementation of the 2013 ADP.
As the ADP evolves in future years, we anticipate that sampling rates in each stratum, duration
of observing needed in the trip-selection stratum, and the use of Electronic Monitoring devices
will all change as a result of information acquired from the new sampling design.
The SSC also had the following specific technical suggestions on development of the ADP in the future:
Review the randomization method in the sampling protocols to assess whether there is possible
bias, correlation and autocorrelation among sampling points or data.
Provide rationale for the statement "The rate of sampling will be iteratively adjusted until a set of
C values is achieved such that 90% of them were at or below the $4.2M amount that equates to
2013 start-up funds." In addition, the authors should rerun the simulation with replicates to get the

43
variance of the sampling rate.
Consider use of balanced sampling in order to improve the efficiency of the sampling design with
limited sampling effort.
Consider use of balanced bootstrapping or simulation techniques in the simulation, and/or derive
the parametric distribution analytically. This can help to review and check the simulation results
for bias.
Set and record the seed in the simulation as it can help potential reviewers to repeat and verify the
simulation results.

44
Appendix 1.3 October 6, 2012, Final Council motion
C-3 Observer Program
October 6, 2012
The Council recommends that the 2013 ADP be revised to reflect a priority for monitoring vessels
managed under PSC limits in the trip selection pool. The Council recognizes that this would
necessarily modify the equal probability sampling design such that higher observer coverage rates are
provided in the trip selection pool, and lower rates in the vessel selection pool, compared to what is
currently in the draft ADP.
The Council also asks NMFS to reconsider the continuous 3-month deployment for selected vessels
in the vessel selection pool. NMFS should implement a 2-month deployment for selected vessels.
The Council requests that NMFS provide a strategic planning document for electronic monitoring
(EM) that identifies the Council‟s EM management objective of collecting at-sea discard estimates
from the 40‟ – 57.5‟ IFQ fleet, and the timeline and vision for how the EM pilot project in 2013 and
future years‟ projects will serve to meet this objective, including funding.
The Council forwards the following AP recommendations:
The Council requests that NMFS and the BSAI Pacific cod catcher vessel trawl fleet work together to
develop a mechanism to allow 100% observer coverage for the 2013 season, with the additional costs
to be borne by the vessel owners.
The Council also recommends that all trawl fleets in the Gulf of Alaska have the option to voluntarily
carry 100% observer coverage at some times in the seasons, also with additional costs to be borne by
vessel owners.
1. <Outreach> Recommend that NMFS clarify how a release from observer coverage is granted, if
the observer provider is unable to provide an observer.
2. <Outreach> Recommend that NMFS reconsider the timing requirements for requesting a release
from observer coverage, and inspecting a vessel that has made that request.
3. <First year review> Recommend that NMFS consider that vessels in the vessel selection pool
should either have the option to go into the trip selection pool OR all vessels should be in the trip
selection pool.
4. The Council reaffirms its intent that crew members should not be displaced by the requirement to
have an observer onboard.
5. <First year review> Recommend that the difference between coverage in the vessel and trip
selection pools be evaluated.
6. <First year review> Request that NMFS provide information on catcher vessels that operate as
catcher processors for a portion of the year.
7. <First year review> Recommend that NMFS insert cost effectiveness measures into the
deployment plan, to prevent expensive deployments to remote areas for insignificant amounts of
catch. Council motion - Observer Program, October 2012

45
8. <First year review> Request that NMFS report to the Council on whether there are issues related
to observer availability as a result of this program.
9. <Outreach> Clarify the procedure for releasing and acquiring observers for vessels that turn
around trips on short notice.
10. <First year review> Recommend that NMFS report to the Council on other EM options that may
be appropriate to replace or supplement human observers.
11. <First year review> The Council requests that the agency, during its first year review, identify
detailed programmatic costs, and in addition, that the agency identify possible cost reductions as they
relate to programmatic and deployment options.
The Council requests that the OAC and NMFS provide a discussion of recommended performance
measures for this program.

46
Appendix 1.4 December 2012 NMFS letter to the council

47
48

49
50

51

52

53
Appendix 1.5 Full Coverage Letter for the BSAI Pacific Cod Fleet
EXAMPLE LETTER REQUESTING FULL COVERAGE IN BSAI PACIFIC COD FISHERY
(Include your return mailing address)
(Date your letter)
James W. Balsiger
National Marine Fisheries Service
P.O. Box 21668
Juneau, Alaska 99801
Dear Dr. Balsiger:
We are writing to request that the National Marine Fisheries Service assign the attached list of
vessels with 100% observer coverage for 2013 while these boats are fishing in the Bearing Sea
Aleutian Islands (BSAI) in 2013. This will enable trawl catcher vessels in the BSAI Pacific cod
fishery to take observer coverage in addition to that required for the partial observer coverage
category.
We understand that we will be required to comply with all applicable regulations, including
logging all fishing trips that are not AFA pollock prior to the start of a trip. Trips will be logged
in the Observer Declare and Deploy System (ODDS).
Once the trips are logged, we understand that we will procure an observer through one of the five
certified observer providers and pay for this observer coverage directly to the observer providers.
In addition, we understand that the observer fee liability under §679.55 would continue to apply.
We agree to, and understand, the following:
1. individuals taken over and above existing observer coverage requirements are observers
as defined at §679.2;
2. vessel owners and operators will comply with the prohibitions protecting observers that
are at §679.7(g) and will meet the vessel responsibilities described at §679.51(e);
3. vessel owners and operators are subject to general requirements applicable to observers
described at §600.746;
4. vessel owners or operators must log all fishing trips and follow applicable regulations
when they are in the partial coverage category; and
5. landings will be subject to the observer fee under §679.55.
Sincerely,

54
Vessel Name: ___________
Federal Fisheries Permit Number:
ADF&G Vessel Number:
Printed Name of the vessel owner:
Signature of the vessel owner:
Vessel Name: ___________
Federal Fisheries Permit Number:
ADF&G Vessel Number:
Printed Name of the vessel owner:
Signature of the vessel owner:
Vessel Name: ___________
Federal Fisheries Permit Number:
ADF&G Vessel Number:
Printed Name of the vessel owner:
Signature of the vessel owner:
Vessel Name: ___________
Federal Fisheries Permit Number:
ADF&G Vessel Number:
Printed Name of the vessel owner:
Signature of the vessel owner:

55
Appendix 2.1 Background information
History of the North Pacific Groundfish Observer Program (NPGOP)
Observers are people who collect independent information on the total impact of fishing
operations on natural resources. The deployment of observers onto fishing vessels began in the
Bering sea in 1973 and in the remainder of the North Pacific in 1975 (Wall et al. 1981, Nelson et
al. 1981). Fisheries in the North Pacific were initially prosecuted exclusively by foreign and later
by “joint venture” operations where a developing domestic fleet of catcher vessels delivered to
foreign owned processing vessels. During the foreign and joint venture operations, foreign
vessels carried fisheries observers at their expense, while domestic vessels were exempted from
this “observer coverage”. As foreign vessels‟ rights to fish in the U.S. Exclusive Economic Zone
(EEZ) were reduced over time, it became obvious that observer coverage would be necessary for
the emerging domestic fleet. At the onset of fully domestic fishery operations in 1990, the
NPGOP was established as an interim observer program with rules governing observer coverage
codified in regulations that stand to be amended in 2012.
In summary, the regulations established in 1990 required vessels 60-125 feet in length (overall)
and all vessels fishing pot gear to carry observers at their own cost for 30% of their fishing days
in a calendar quarter plus at least one trip in each fishery they participate in (termed the “30%
fleet”), and vessels greater than 125 feet in length to carry an observer for 100% of their fishing
days at their expense. Vessels less than 60 feet, those fishing jig gear or those fishing with trawl
gear that deliver unsorted cod ends to processing vessels (termed “catcher processors” or CPs if
the vessel also has catching ability and “mothership” or M if the vessel does not) were exempted
from observer coverage. So too were catcher vessels that fished for Pacific halibut (Hippoglossus
stenolepis). For shoreside processors, the rules governing observer coverage were based on the
estimated tonnage processed in a calendar month: plants that processed less than 500 metric tons
(t) a month are exempted from coverage, those that processed between 500 t and 1,000 t a month
were required to be observed for 30% of the calendar days, and those that processed more than
1,000 t a month were required to be observed for each day in the month.
There were several shortcomings that were identified with the establishment of the NPGOP.
First, decisions as to which trips were assigned an observer were made by the vessel
owner/operator. Second, costs to the fleet were inequitable. Vessels required to obtain observer
coverage pay the direct costs of that coverage to an observer provider. Although contracts for
observer coverage were made between a vessel or plant operator and an observer provider, and
costs were largely held in check through an open market for observer provider services, the cost
of an “observer day” was greater than a day of fishing or processing without an observer. Since
the cost of an observer day was fixed, the cost of observer coverage in terms of a day represented
a disproportionately larger cost in terms of daily earnings for smaller entities than for larger ones
(so-called economics of scale). In addition, since observers collect information such as bycatch
(defined here as the catch of non-target species, including “prohibited species catch” (PSC) i.e.
species not allowed to be caught with certain gear types, and protected species such as seabirds
and marine mammals), and monitor for regulatory compliance, observer data are used by NMFS
to constrain fishing operations through fishery closure or enforcement action. For all these
reasons, there have been longstanding concerns that observer data may not represent the true

56
operations of fishers. This so-called “observer effect” has been documented in the NPGOP
(Faunce and Barbeaux 2011).
Towards a restructured observer program
Soon after the establishment of the domestic observer program, efforts were made by
NMFS and the Council to provide NMFS control over where and when observers were deployed.
Lacking that control, managers had no ability to address information needs through the directed
collection of observer information. At issue was the fact that in order for NMFS to gain the
control it desired, a funding mechanism needed to be established, enabling NMFS to enter into
contracts with observer providers; i.e., the NPGOP would have to be “restructured”.
In 1992 the Magnuson Stevens Act was modified to allow for the establishment of a fee-
collection system and a North Pacific Fisheries Observer fund. This system of fee collection was
termed the “Research Plan” and was adopted by the Council in 1992 and implementation
initiated by NMFS in 1994. One year later, after $5.5 M was collected to capitalize the North
Pacific Fisheries Observer Fund, the Council rescinded its support for the Research Plan and
NMFS returned the fees with interest the following year. In 1996 NMFS considered a joint
operating agreement with the Pacific States Marine Fisheries Commission (PSMFC) envisioning
that the PSFMC would serve as an observer provider, but that approach was abandoned over
liability issues in 1998. In 2006 an amendment package was presented to the Council for NMFS
to again levy fees and enter into direct contracts with observer provider companies. However,
uncertainty on the cost implications of the Service Contract Act and Fair Labors Standards Act
led the Council to delay action on the amendment package for another two years. In 2008 the
Council directed NMFS to draft a discussion paper on the status of the 2006 fee obstacles. The
Council drafted a problem statement at its December 2008 meeting that outlined shortcomings of
the existing observer program that included: disproportionate costs to participants, lack of data
on a large portion of the fleet, and the inability for NMFS and the Council to address
management needs through the collection of observer information due to a lack of NMFS control
over when and where observers were deployed. Addressing these shortcomings would form the
basis for a proposed regulatory package implementing Amendment 86 to the FMP of BSAI and
Amendment 76 to the FMP of the GOA.
At the April 2010 Council meeting, staff presented an initial review draft (EA/RIR/IRFA) for
Amendments 86 and 768. The rulemaking analysis described the rationale behind funding
mechanisms for a restructured observer program and proposed a methodology for NMFS to
procure and deploy observers to address the 2008 problem statement. Contained within this
analysis were frequency histograms of fleet vessel sizes that showed large spikes at size
categories just below 60 feet and 125 feet overall that suggested vessels at the maximum size for
the zero and “30%” class of observer coverage were preferred in this fleet. The analysis also
described the allocation of how NMFS would allocate observer coverage in the fleet under
different funding scenarios as well as the acknowledgement that the first year of the program
would be considered a pilot, and the requirements for moving towards a developing and
optimized program were presented. Among the other data presented were a suite of tables
showing the amount of funds required to enact a restructured program according to Council
8 The secretarial review draft of this document can be accessed at
http://www.fakr.noaa.gov/analyses/observer/A86%20and%2076%20ea_rir_irfa.ea.pdf.
57
motion, alternatives whereby some portions of the fleet would be assessed a fee and others would
not. Perhaps most surprising was that the analysis identified that collection of a 2% ex-vessel
value fee (the maximum permissible by the Magnusson-Stevens Act) from all participants would
not adequately fund all of the observer program coverage needs in some years, due largely to
numerous catch-share programs that had been instituted since 2000 which required an observer
for 100% of their operating days and in some cases two observers (termed confusingly as 200%
coverage). These “full-coverage” vessels included the American Fisheries Act (AFA) which
includes catcher vessels and catcher processors that fish walleye pollock (Theragra
chalcogramma) in the BSAI, trawl catcher processors receiving certain groundfish allocations
under Amendment 80, and the GOA Rockfish Program (RP) in the GOA.
In October 2010, the Council received the public review draft of the Amendment package that
contained a requested suite of alternatives whereby various components of the restructured fleet
(based largely on vessel size) would be exempted from paying a fee. Due to projected funding
deficiencies and complex observer requirements intertwined with management of PSC caps
under catch share programs, new regulations divide the fishing participants into two classes:
those requiring observer coverage on all of their operation days (full-coverage), which would be
kept in their current form (contracting directly with observer providers at their expense); and all
other entities that would constitute the “restructured” portion of the fleet and be subject to a fee
(partial coverage). Vessels and plants in the full-coverage category would obtain coverage using
a pay-as-you-go model and contract directly with NMFS-certified observer provider so all trips
are observed and regulations governing coverage requirements are met (e.g., number and type of
observers on each trip). In contrast, the partial coverage portion of the fleet would receive
observers through an observer provider contracted directly with NMFS. Funding for the observer
days on vessels in the partial-coverage category will be obtained through an ex-vessel fee on
landings.
Small vessels present logistical challenges for the deployment of observers and NMFS concluded
in the analysis that vessels sized below 39‟ LOA harvested less fish per trip then larger vessels.
The first few years of the re-structured program will allow NMFS to better assess deployment
needs on smaller vessels. The NMFS proposed an initial “zero-coverage” category to be
comprised of vessels fishing hook-and-line or pot gear that are under 40 feet length overall, and
all jig vessels, subject to modification in future deployment plans. In addition, consistent with
existing regulations, trawl vessels delivering unsorted cod ends to motherships were to be
exempt from coverage. The Council unanimously decided to move forward with the restructured
observer program, and after considering exempting certain vessels from the fee, decided that all
participants in the restructured fleet, whether they were slated for observer coverage or not,
would be subject to a 1.25% fee to fund subsequent years of the observer program. The first
years funding required start-up money from the federal government with a projected need of
$3.8M. Furthermore, the Council specified that NMFS release an observer report by September 1
of each year that contains the proposed strata and coverage rates for the deployment of observers
in the following calendar year (NPFMC 2010). Staff from the Fisheries Monitoring and Analysis
Division (FMA), the body responsible for the training and data quality of observers in the
NPGOP of the Alaska Fisheries Science Center (AFSC) organized an Observer Restructure
Analysis Group (ORAnG) in July 2011 to provide analytical guidance and support towards the
effective and efficient deployment of observers in the North Pacific. In April of 2012, the

58
Council asked for an update on the progress of the observer report, which they received in June
2012. Since it is concerned with the deployment of observers, the observer report in the
Council‟s October 2010 motion was renamed the Annual Deployment Plan (ADP).
Background to the 2013 Innovation
Compared to a human observer, electronic monitoring (EM) technologies offer a way to
obtain independent fishery data onboard vessels where space is limited and/or safety is a
concern. Since vessels pay for human observers on a cost-per-day basis in the current NPGOP, it
has been proposed that EM technologies such as cameras offer cost-savings to fleet members,
although in practice the results of such cost comparisons have been mixed (e.g. Bonney et al.
2009, Cahalan et al. 2010, Dalskov and Kindt-Larson 2009).
As expressed by the Council motion on proposed final regulations, EM is to be integrated into
the restructured observer program (NPFMC, 2011). At the Council‟s Observer Advisory
Committee (OAC) September 15-16, 2011 meeting it was concluded that the initial phase of the
EM program should focus its initial efforts on IFQ vessels 40-57.5‟ in length that are not
managed by real-time data and are not constrained by Prohibited Species Catch (PSC) (OAC,
2011).
One unforeseen limitation to EM implementation by NMFS following the recommendation of
the OAC involves the definition of an IFQ vessel. IFQ is a quota management system where the
right to harvest pacific halibut or sablefish is issued to a permit holder that is an individual.
However, the OAC intent is to deploy EM on IFQ vessels of a certain length. Therefore, the
NMFS is forced to define the EM eligible frame of vessels to those 40-57.5‟ in length that have
an IFQ holder onboard. Unfortunately, an IFQ holder on board is unknown before a fishing trip
begins, and it would be impractical to deploy and then retrieve EM equipment on a trip-by-trip
basis. Since both IFQ halibut and sablefish seasons are open between March and November, and
the deployment duration for vessels in the “vessel-selection” stratum of this ADP is a calendar
quarter for 40-57.5 foot long vessels, IFQ vessels were defined as those in the 2013 “vessel-
selection” stratum that have a history of landing IFQ in prior years during quarters 2-4.
Case-studies of EM in the North Pacific
There are few case studies where video imagery has been used to extract data for catch
estimation. This statement may seem to conflict with the understanding of fishers and their
representatives in the North Pacific. In the development of this ADP between 2010 and 2012,
there have been frequent references to “the Canadian model” without a full appreciation of how
that model works. To clarify, in British Columbia camera systems have been used as an
important monitoring tool in the commercial groundfish hook and line and trap fisheries. These
fisheries are 100% monitored by cameras to capture video footage of hauling that are associated
to Global Positioning System (GPS) and to winch sensors on all boats to identify set and haul
locations. Vessel operators are required to maintain accurate logbook records of catch and
discard and have 100% dockside monitoring of piece counts and weights. Because of the
difficulty in identifying rockfish species and the potential for discard mortality, fishermen are
required to retain and unload all rockfish, and biological data such as length and weight are
collected dockside. A random selection of video data is used to audit fisher‟s self-reported
records of discards and retained pieces to ensure rockfish landed weight and piece count provides

59
an accurate record of total catch. Landed weights are used to track all quota species for each
vessel. It is important to stress here that the management and official catch records for this
system come from the vessels‟ logbook and dockside reports and not from the EM system. This
is an example of an EM-audit system that has been in place since 2006 and appears to be
successfully employed (Stanley et al. 2009; Stanley et al. 2011).
In Alaska, there have been a number of case studies that have explored the potential use of
cameras and video imagery in the halibut longline fishery. The first of these was a feasibility
study to monitor bycatch of short-tail albatross in the GOA (Geernaert et. al. 2001). In 2002, EM
video imagery was successfully used to detect and monitor streamer line deployment and
endangered seabird bycatch, but additional work was needed on species identification from the
video (Ames et al. 2005). Two additional studies conducted in 2002 and 2004 onboard volunteer
chartered vessels examined the accuracy of fishing effort and catch composition data collected
by EM relative to the traditional at-sea observer methods (Ames 2005; Ames et al. 2007). A
number of improvements based on the 2002 study results were incorporated into the 2004 study
design and agreement between the EM data and the observer data increased. Species
identification limitations were still evident in the later study, but the studies suggest EM
technology for longline fisheries may have a potential role within a monitoring program.
In 2007, Cahalan et al. (2010) conducted a study on four volunteer commercial longline halibut
fishing vessels during normal fishing operations to compare bycatch (numbers of fish) resulting
from an observer census, a complete review of EM video, and standard NPGOP sampling.
Although both EM and observer data sources were found to have lapses in data collection, EM
data lapses tended to encompass large portions or entire trips. Comparison of species
identification of catch between monitoring methods indicated statistically unbiased estimates and
acceptable comparability for most species except for those such as shortraker (Sebastes borealis)
and roughgeye (Sebastes aleutianus) rockfish that could not be identified beyond the species
grouping levels using EM. Similarly, the estimated species-specific abundance (numbers) of fish
between EM and observer collected data showed few statistically significant differences. Based
on the results of this limited study, it was determined that this EM design could be used as an
additional tool for catch monitoring in the commercial halibut fishery. However, the authors
cautioned that EM is not an alternative to observers for collecting biological samples and the
potential uses of EM would first need to be tailored to monitoring requirements and management
needs9.
The Northeast Fisheries Science Center (NEFSC) began a multi-year pilot program in 2010 to
test EM technology to collect catch and fishing effort data aboard commercial vessels. The goal
of the study was to evaluate the potential of EM to monitor retained and discarded catch on a
real-time basis in the Northeast groundfish sector fleet (NOAA, 2011). This study identified a
number of deficiencies that would first need to be addressed before EM technology could be
considered in lieu of at-sea observers in the Northeast multispecies fishery. Recommendations to
improve data quality included the development of a more reliable EM system and modifications
to how discarded catch was handled by the crew. The NEFSC stated that further research would
9 For example, EM camera systems lack the ability to captured mean weights of discarded species, which are the
basis for catch estimation and would require untested assumptions as would mixed species groups where like species
cannot be identified using video imagery.

60
also required to improve the accuracy and reliability of species identification and to reliably
monitor weights of discard by species, and identified the need to analyze multiple data sources to
improve their ability to validate and identify discrepancies between observer and EM collected
data. Given the issues identified under the first year of this pilot project, EM was not
incorporated as a monitoring strategy in the 2012 fishing year by the NEFSC.
Most recently, the Alaska Longline Fishermen‟s Association (ALFA) received funding through a
grant from the National Fish and Wildlife Foundation for 2011 and 2012 to focus on EM
integration logistics for the small vessel fixed gear fleet in southeast Alaska. ALFA have
developed an approach and successfully integrated camera based EM systems on multiple
vessels and fishing configurations. The final report and results will be given at the September,
2012 OAC meeting10
. FMA staff provided initial technical review of the electronic monitoring
information obtained by this study in 2011 and 2012. At the end of that time, many of the data
quality issues identified by earlier studies described in this section were still present. These
include lapses of EM video data, poor video quality that degraded during a trip unless camera
lenses were clean periodically, and difficulty with identification of some fishes to species level11
.
Literature Cited
Ames, R. T. 2005. The efficacy of electronic monitoring systems: a case study on the
applicability of video technology for longline fisheries management. International Pacific
Halibut Commission Scientific Report No. 80., Seattle.
Ames, R. T., Williams, G. H., and Fitzgerald, S. M. 2005. Using digital video monitoring
systems in fisheries: Application for monitoring compliance of seabird avoidance devices
and seabird mortility in pacific halibut longline fisheries. ICES Document NMFS-AFSC-
152. 93 pp.
Ames, R. T., Leaman, B. M., and Ames, K. L. 2007. Evaluation of video technology for
monitoring of multispecies longline catches. North American Journal of Fisheries
Management, 27: 955-964.
Bonney, J. , Kinsolving, A., and McGauley, K. 2009. Continued assessment of an electronic
monitoring system for quantifying at-sea halibut discards in the Central Gulf of Alaska
rockfish fishery. EFP 08-01 Final report. Accessed on 7/31/12 at
http://www.fakr.noaa.gov/sustainablefisheries
/efp/efp08-01_halibutdiscards_rpt.pdf.
Cahalan, J., Leaman, B. M., Williams, G. H., Mason, B. H., and Karp, W. A. 2010. Bycatch
characterization in the Pacific Halibut Fishery: a field test of electronic monitoring.
NOAA Technical Memo NMFS-AFSC-213: 66.
Dalskov, J., and Kindt-Larson, L. 2009. Final report on fully documented fishery. Technical
University of Denmark, National Institute of Aquatic Resources. 49 pp.
Faunce, C. H., and Barbeaux, S. J. 2011. The frequency and quantity of Alaskan groundfish
catcher-vessel landings made with and without an observer. ICES Journal of Marine
Science, 68: 1757-1763.
Geernaert, T. O., H. L. Gilroy, S. M. Kaimmer, G. H. Williams, and R. J. Trumble. 2001. A
feasibility study that investigates options for monitoring bycatch of the Short-tailed
10
Dan Falvey, personal communication. 11
Farron Wallace and Paul McClusky, FMA staff, personal communication

61
albatross in the Pacific halibut fishery off Alaska. Int‟l. Pac. Halibut Comm., Seattle,
WA.
Nelson Jr., R., French, R., and Wall, J. 1981. Sampling by U.S. observers on foreign fishing
vessels in the eastern Bering Sea and Aleutian Island region, 1977-78. Marine Fisheries
Review, 43: 1-19.
NOAA (National Oceanic and Atmospheric Administration). 2011. 2010 Northeast Multispecies
fishery electronic monitoring pilot study. Letter dated 19 August 2011 in response to the
report by Pria, M. J., Bryan, J. and McElderry, H. entitled New England electronic
monitoring project 2010 annual report. Available at
http://www.nefsc.noaa.gov/fsb/ems/2010_EM_REPORT_FINAL.pdf
NPFMC (North Pacific Fisheries management Council). 2011. Council motion. Observer
restructuring (GOA Am.76/BSAI Am. 86) draft proposed rule and regulations. October 2,
2011. Accessed on 7/31/12 at http://www.fakr.noaa.gov/
npfmc/PDFdocuments/conservation_issues/Observer/observer_motion1011.pdf.
NPFMC. 2010. Council Final Motion on Observer Restructuring BSAI Amendment 86/GOA
Amendment 76, October 8, 2010. Accessed on 8/30/12 at
http://www.fakr.noaa.gov/npfmc/PDFdocuments/conservation_issues/Observer/
ObserverMotion1010.pdf
OAC (NPFMC / Observer Advisory Committee). 2011. Observer Advisory Committee –
Meeting Report
September 15 - 16, 2011. Accessed on August 30th, 2012 at
http://www.fakr.noaa.gov/npfmc/
PDFdocuments/conservation_issues/Observer/911_OACreport.pdf.
Stanley, R. D., McElderry, H., Mawani, T., and Koolman, J. 2011. The advantages of an audit
over a census approach to the review of video imagery in fishery monitoring. ICES
Journal of Marine Science, Volume 68, number 8, 1621-1627.
Stanley, R. D., Olsen, N., and Fedoruk, A. 2009. Independent validation of the accuracy of
Yelloweye rockfish catch estimates from the Canadian Groundfish Integration Pilot
Project. Marine and Coastal Fisheries: Dynamics, Management, and Ecosystem Science,
1: 354-362.
Wall, J., French, R., and Nelson Jr., R. 1981. Foreign fisheries in the Gulf of Alaska, 1977-78.
Marine Fisheries Review, 43: 20-35.

62
Appendix 2.2 Effort Calculations
Problem statement
This document outlines the rationale, process, and decisions used to estimate fishing
effort (E) in terms of days and trips. Since it has been proposed that catcher processors and
motherships will carry an observer for 100% of their trips and pay for their observers using
status quo methods, these effort calculations are only concerned with the catcher vessel fleet.
These estimates were necessary to generate potential at-sea and dockside sampling rates that
could be afforded by the National Marine Fisheries Service (NMFS) as part of the 2013 Annual
Deployment Plan.
Available data
Since the regulatory authority of the NMFS Observer program does not extend to State
managed Guideline Harvest Level (GHL) fisheries, there is need to identify which trips occurred
in each in GHL vs. non-GHL fisheries. In addition, since rules governing which trips belong in
each selection stratum are based on gear and vessel size, these fields are necessary as well.
Finally, these information need to be relevant to the unit of deployment, i.e, the trip.
Data for effort analyses come from several sources. The Alaska Regional Office‟s (AKRO)
Catch Accounting System (CAS) contains the necessary tables to examine the enumeration
(weight), identification (species), and disposition (retained vs. discarded) catch of Fishery
Management Plan (FMP) defined groundfish and prohibited species as well as the relevant
landing information such as vessel, port, date fishing began, date of landing, port of landing, gear
type, management program, and NMFS statistical area in which the catch was made. In 2010 the
Fisheries Monitoring and Analysis Division of the Alaska Fisheries Science Center (FMA) began
to include the field linking eLandings to the observer records (report id) on their offload forms as
part of their debriefing data requests for observers. This field is obtained from catcher vessel
landing reports, and provides a link between the observer database NORPAC and the CAS,
facilitating the identity as to which trips were observed for 2010 and 2011. In addition, since
observer data represent independent information, decisions as to the validity of self-reported
landing data can be assessed for observed trips.
Data limitations
Just as financial advisors warn their clients that “past performance does not guarantee
future results”, there is no guarantee that trends identified in the fishing effort of past years will
adequately reflect future effort, especially if changes to the allocation of quotas occurs during the
period between last available landings and observer data and the year of planned deployment.
There are limitations to broadly applying observer information to categorize the behavior and
characteristics of all catcher vessel fishing operations. For example, prior to this ADP, observers
were not deployed onboard catcher vessels fishing with jig or troll gear, or vessels that are less
than 60‟ LOA. In addition, the proportion of observer coverage that occurs within each fishery
(based on predominant species caught), NMFS statistical area, and gear type will greatly vary
depending on the size of vessels and the type of management program they are fishing in. For
example, there were three broad rules governing observer coverage requirements for catcher
vessels. First, observers were to be deployed on 30% of the fishing days per quarter for catcher
vessels 60-125‟ fishing hook and line or trawl gear, and 100% of fishing days per quarter for
larger vessels. However, vessels over 60‟ LOA fishing pot gear retained 30% coverage based on
63
gear. Second, any trip that a vessel fished under a cooperative management structure (e.g., AFA,
RP, Amendment 80), was to be observed. Third, a vessel was required to obtain observer
coverage for one trip in each fishery (defined by target species from landings) the vessel
participated in each quarter. Vessel operators had control over which fishing operations were
observed and not all ports vessels land catch at shore had been visited by observers.
Methods
A graphical representation of the process through which the fishing effort and trip definitions
were determined is depicted in Figure A2.3-1. Since the electronic dockside reporting system for
catcher vessels (eLandings) and current North Pacific Groundfish Observer Program (NPGOP)
at-sea sampling and database structures were implemented in 2008, the three most recent years
of information (2009-2011) were chosen as the time frame for investigation.
Defining a trip
Two options were examined to define a trip. The first was to concatenate a vessel‟s
permit number and the “landing date” field on the landing report to generate a “trip label”. The
second was to treat each landing report (an auto-generated unique 6-digit number) as a separate
trip. The first method is conservative in terms of total trips, and attempts to “correct” for the
possibility that multiple landing reports are filed for the same trip while ignoring the possibility
of multiple landings in a day, while the second method has the opposite assumptions. The first
method is most problematic for small CDQ trips. To evaluate which definition would be
appropriate for ADP evaluation analyses, the relative rates of “duplicate trips” were determined
for the identifiers Program Management Code, NMFS area code, FMP area, Processor
identification, and trip target separately for each trip definition by summing the number of
duplicated trips and dividing by the total number of trips. Trip definitions based on landing
report identification number was preferred because (1) the duplication rate was lower for this
method than for the vessel and date method, (2) it is easy to match with observer records, and (3)
the assumption that a report id was equivalent to a trip would at maximum, overestimate the
number of true trips by 3-4%, which would in turn act as a buffer for NMFS against the risk of
“over deploying”, i.e. running out of observer funds due to deploying observers into trips at a
rate that results in a greater number of observed trips than that afforded by available funds (last
column of Table A2.2-1).
Creation of the OBSFRAME
The dataframe “DATAFRAME_OUT” was used to create a dataframe of landings
information that corresponds to a sampling frame for years 2009-2011 following the proposed
2013 Annual Sampling Plan (OBSFRAME_OUT). Both DATAFRAME_OUT and
OBSFRAME_OUT have an additional flag identifying whether a trip had been observed that
was facilitated using the common field “landing report id” between landings source data and the
observer database NORPAC. It is apparent that FMP Area and Processor ID are fields that are
duplicated within a Report ID. The former of these is expected, while the latter is evidence of
“split deliveries” in which a vessel made one landing, but completed two landing reports.
Interestingly, when the landing report definition of a trip was applied to only those trips that
would belong in a restructured observer program, duplication rates were greater than those when
calculated across all CV trips (the last three rows of Table A2.2-1). It seems logical that larger

64
vessels (i.e. those in the OBSFRAME_OUT) would have a greater proportion of split deliveries
than vessels < 40‟ and those fishing jig or other gear.
Calculating trip duration
Accurate accounting of fishing effort in terms of days is very important because it
translates effort into costs since traditionally observer providers have contracted with vessels at a
“daily rate”12
. While landing reports have the fields describing the date when gear was first put
into the water during a trip (date fishing began) and the date fish were landed (date of landing),
the difference between these two times may not adequately reflect trip duration because it does
not contain the span of time from departure (i.e. leaving the dock) to the date fishing began. In
addition, for split deliveries, it is unclear whether the vessel reported the date of landing for the
first delivery or of the last and in some cases (particularly IFQ) the date fishing began may
reflect the date a vessel left a dock. Finally, for the purposes of observer coverage, a trip in
which fishing began and landing date were the same would not be free, yet it would be a “zero-
day” trip if one were to simply subtract the two dates on the landing report. To help alleviate
some of these issues, for any given landing report, the minimum “date fishing began” and the
maximum “date of landing” were labeled as START DATE (START) and END DATE (END)
respectfully and used in duration calculations.
Although limited, there exists observer data from catcher vessels that can be used to gauge the
relative difference between trip duration, defined as the difference between the two dates in the
landings reports and the “Embark date” and “Disembark date” reported in NORPAC. Unlike the
duration on landing reports, the duration using the fields above should reflect the true duration of
the trip from cast-off to tie-on of the dock. Trips used for comparisons were constrained to those
that would have defined and constituted the 2013 trip-selection deployment strata that occurred
during 2010 and 2011.
Time data from NORPAC fishing trips are specific to the second, whereas data from
“OBSFRAME_OUT” (and ultimately eLandings) is specific only to the day (times default to
midnight). A total of 713 and 842 trips in the OBSFRAME_OUT dataframe were recorded as
observed during 2010 and 2011 respectfully (the eLandings report id was not required in
NORPAC until 2010), from a total of 166 unique vessels during that period (147 in 2010 and 151
in 2011) ranging from 60 to 176‟ in length.
Two different methods were used to calculate the duration of an OBSFRAME trip using landings
source fields: (1) the difference between START and END with time removed (dates only,
labeled as Tix), and (2) the same as #1 but with an additional day added (labeled as Tix round).
Similarly, the duration of an OBSFRAME trip using NORPAC source fields was defined in two
ways: (1) rounded durations to the nearest day (labeled as Obs) and (2) durations with an
additional half day added (labeled as Obs round). Only a half day was added to NORPAC
source durations because these trips had a greater specificity, and many trips that ended in the
morning would not account for that day of observer coverage.
12
Personal communication and e-mail correspondence between Heather Weikart and Craig Faunce (both of FMA)
during January-March 2012.
65
Three differences were calculated between NORPAC and eLandings source durations: The first
was calculated from Obs – Tix, the second was Obs Round – Tix and the third was Obs round –
Tix round. From these comparisons, difference values greater than zero indicated longer
durations from NORPAC source data than landings source data, while negative difference values
indicated the opposite condition. Difference values of zero were desired. From the distribution
plots of differences, it appears that the addition of one full day to landing durations matches well
with the observer durations with an additional half day (Figure A2.2-1). Thus trip durations from
landings were adjusted to be defined as 1+(END minus START) rounded to the nearest whole
day.
Enumerating yearly effort
The total fishing effort in terms of days was calculated by summing the total trip duration
in terms of days for each unique landing report within each year that was contained within the
dataframe OBSFRAME (Table A2.2-2).

66
Tables and Figures.
Table A2.2-1. Summary of duplication rate for trips defined by two methods (vessel ID + Start date or by
report id). Duplication rates are expressed as the percent value from each year (2009-2011). The Report
column refers to the percentage the total number of trips defined by vessel and date that had duplicate
report ids. Application of the Report ID trip definition to trips that would constitute a restructured
sampling frame for the CV sector of the fleet in 2011 are depicted in the last three rows of the table.
Method Year Mgt. Code
Area FMP Processor Target Report
Vessel + Date 2009 0.874 8.037 0.496 0.362 0.400 3.903
Vessel + Date 2010 0.635 7.042 0.419 0.237 0.370 3.961
Vessel + Date 2011 0.877 8.956 0.529 0.245 0.264 4.407
Report ID 2009 0.588 7.492 0.475 0 0.028 NA
Report ID 2010 0.461 6.571 0.381 0 0.046 NA
Report ID 2011 0.553 8.484 0.491 0 0.043 NA
Report ID (OBSFRAME)
2009 0.794 9.453 0.836 0 0.056 NA
Report ID (OBSFRAME)
2010 0.621 7.947 0.494 0 0.051 NA
Report ID (OBSFRAME)
2011 0.700 8.757 0.788 0 0.050 NA

67
Table A2.2-2. Total number of trip duration days calculated for each year within what would constitute
the 2013 partial coverage CV sampling frame.
Year Days
2009 30,402
2010 32,306
2011 31,803

68
Figure A2.2-1. Violin and scatter plot of differences in the duration of trips defined in three different
ways (see text for details). The width of the violin plots corresponds to the amount of data, so that
wider positions have more data. Similarly, the appearance of the scatter points behind each violin plot
is more intense (darker in color) where more data occur.

69
Appendix 2.3. Abbreviated methods
This section depicts the workflow, including source (input) and sink (output) files used in this
document. It is intended to serve as a quick reference guide to the methods used to produce the
ADP and supporting appendices. Input database tables and output file names are denoted as
circles, while specific processes (the task performed on the data) are depicted in boxes.
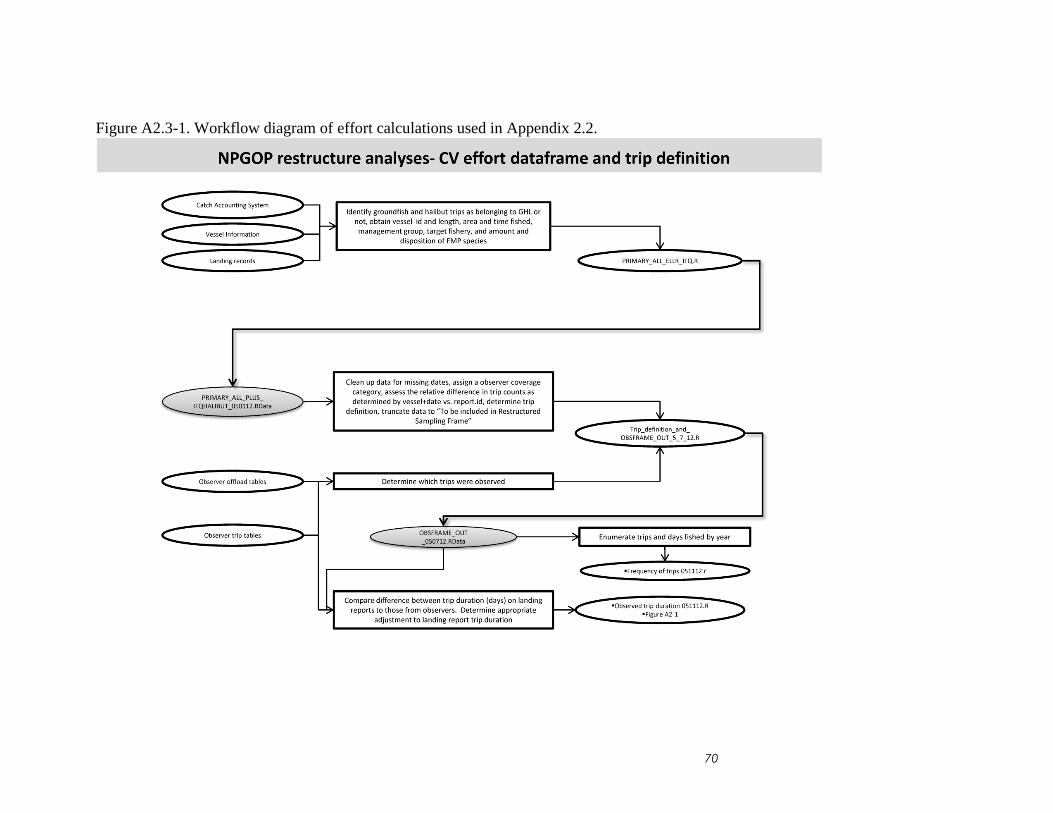
70
Figure A2.3-1. Workflow diagram of effort calculations used in Appendix 2.2.
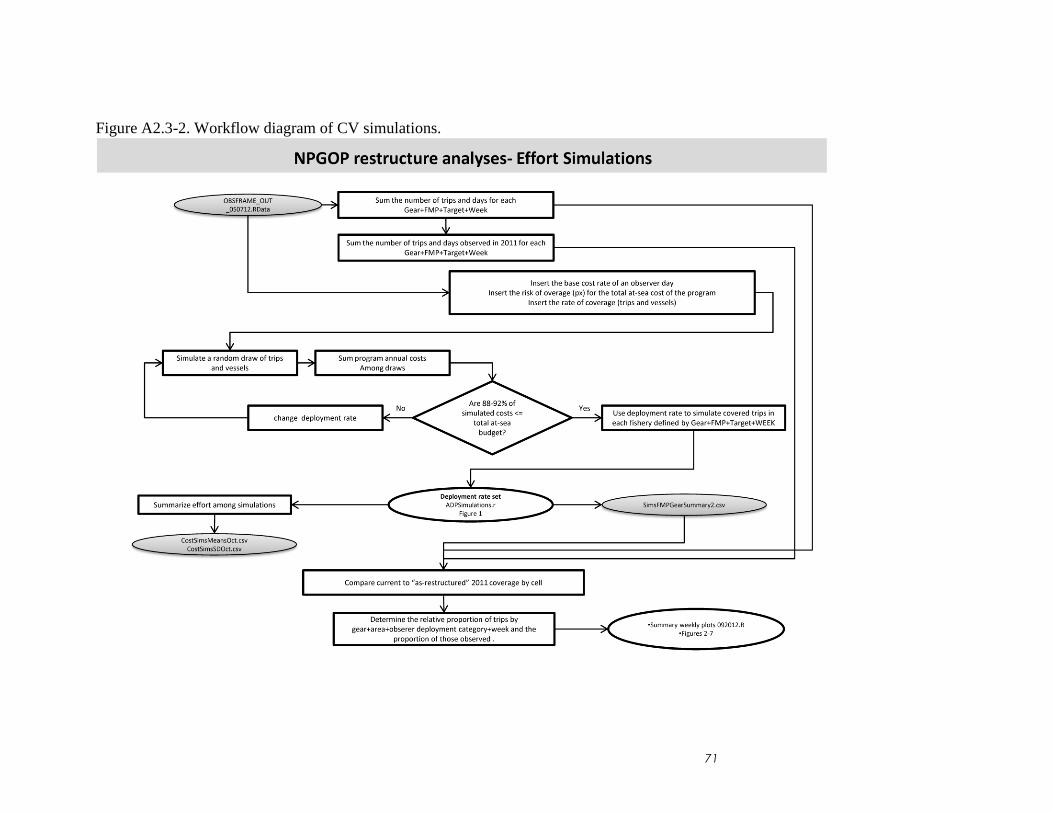
71
Figure A2.3-2. Workflow diagram of CV simulations.

72
Figure A2.3-3. Workflow diagram of length and tissue simulations.

73
Figure A2.3-4. Workflow diagram of GOA salmon cost estimate.

74
Figure A2.3-5. Workflow diagram of total program changes.

75
Appendix 2.4 ORAnG analysis of Council motion
Analysis of Council Motion on observer restructure dated October 6, 2012 by the Observer
Restructure Analysis Group (ORAnG)
Craig Faunce (AFSC FMA), Farron Wallace (AFSC FMA), Jennifer Cahalan (PSMFC & AFSC FMA), Jennifer
Mondragon (AKRO SF), Jason Gasper (AKRO SF), Sandra Lowe (AFSC REFM) and Ray Webster (IPHC)
Our group was formed in July 2011 to provide analytical guidance and support towards the
effective and efficient deployment of observers in the North Pacific. As authors of the September
5th
draft of the 2013 ADP, we appreciate the opportunity to comment on this Council Motion as
it pertains to the quantity and quality of observer data that may result from changes to the NMFS
ADP.
1. The Council asks NMFS to reconsider the continuous 3-month deployment for selected
vessels in the vessel selection pool. NMFS should implement a 2-month deployment for
selected vessels.
We simulated observer sampling of the actual 2011 catcher vessel landings data to evaluate this
recommendation. Our results indicate that the number of unique vessels observed during the
year would increase from 95 if sampled quarterly (that is as proposed under the NMFS ADP) to
106 under a 2-month deployment schedule. An increase in the number of vessels sampled may
improve data quality since NMFS would sample across a wider selection of vessels with varying
participation in fisheries, areas, and times. Implementing two-month durations of observer
coverage also conforms more closely with fishery openings than quarterly durations of coverage.
While it is recognized that shortening the time period that a vessel must take an observer may
increase the ability of vessel operators to “game the system”, these risks are potentially offset by
the increase in the number of vessels observed during the year. We support the Council
recommendation that the 3-month deployment duration for selected vessels in the vessel
selection pool be reduced to 2-months. We recommend that analyses be performed to identify
the magnitude of departures from this deployment schedule and to identify, to the extent
possible, the factors contributing to these departures.
2. The Council asked NMFS to work with industry on two areas where there are requests
for additional observer coverage:
a. NMFS and the BSAI Pacific cod catcher vessel trawl fleet work together to develop
a mechanism to allow 100% observer coverage for the 2013 season, with the
additional costs to be borne by the vessel owners;
b. All trawl fleets in the Gulf of Alaska have the option to voluntarily carry 100%
observer coverage at some times in the seasons, also with additional costs to be
borne by vessel owners.
These requests have the potential to improve catch and bycatch estimates by increasing the
amount of observer data that is available in particular fisheries. In addition, they could reduce
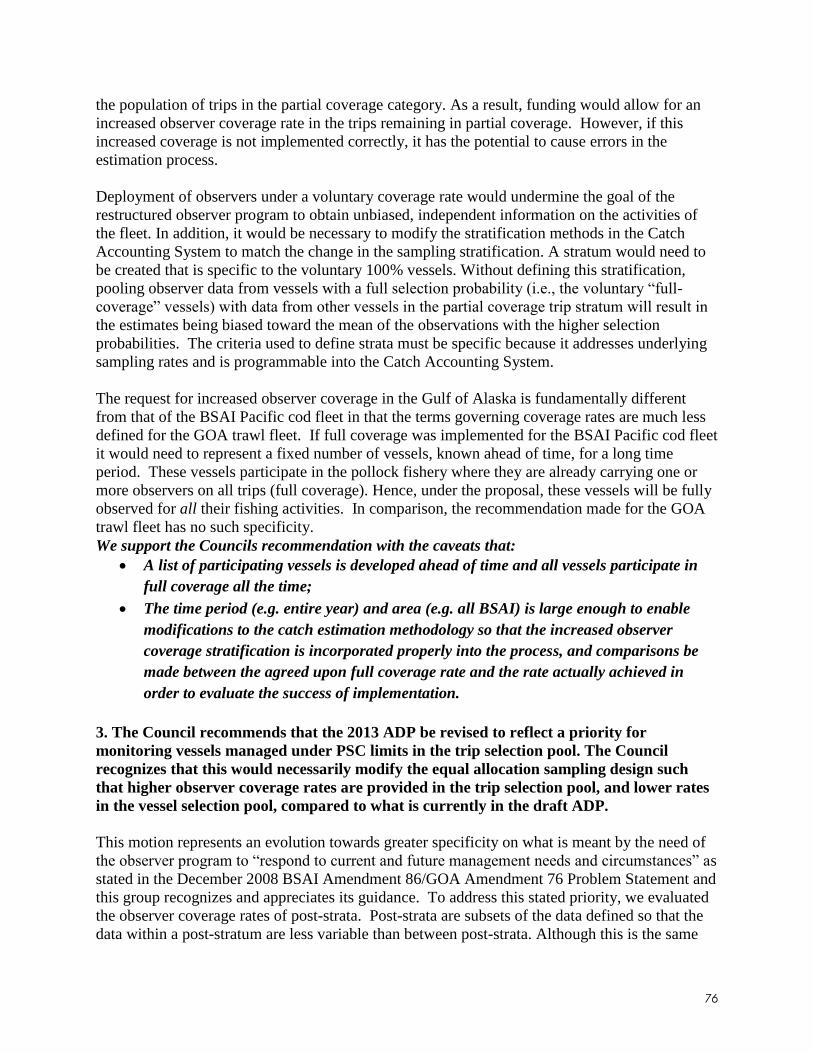
76
the population of trips in the partial coverage category. As a result, funding would allow for an
increased observer coverage rate in the trips remaining in partial coverage. However, if this
increased coverage is not implemented correctly, it has the potential to cause errors in the
estimation process.
Deployment of observers under a voluntary coverage rate would undermine the goal of the
restructured observer program to obtain unbiased, independent information on the activities of
the fleet. In addition, it would be necessary to modify the stratification methods in the Catch
Accounting System to match the change in the sampling stratification. A stratum would need to
be created that is specific to the voluntary 100% vessels. Without defining this stratification,
pooling observer data from vessels with a full selection probability (i.e., the voluntary “full-
coverage” vessels) with data from other vessels in the partial coverage trip stratum will result in
the estimates being biased toward the mean of the observations with the higher selection
probabilities. The criteria used to define strata must be specific because it addresses underlying
sampling rates and is programmable into the Catch Accounting System.
The request for increased observer coverage in the Gulf of Alaska is fundamentally different
from that of the BSAI Pacific cod fleet in that the terms governing coverage rates are much less
defined for the GOA trawl fleet. If full coverage was implemented for the BSAI Pacific cod fleet
it would need to represent a fixed number of vessels, known ahead of time, for a long time
period. These vessels participate in the pollock fishery where they are already carrying one or
more observers on all trips (full coverage). Hence, under the proposal, these vessels will be fully
observed for all their fishing activities. In comparison, the recommendation made for the GOA
trawl fleet has no such specificity.
We support the Councils recommendation with the caveats that:
A list of participating vessels is developed ahead of time and all vessels participate in
full coverage all the time;
The time period (e.g. entire year) and area (e.g. all BSAI) is large enough to enable
modifications to the catch estimation methodology so that the increased observer
coverage stratification is incorporated properly into the process, and comparisons be
made between the agreed upon full coverage rate and the rate actually achieved in
order to evaluate the success of implementation.
3. The Council recommends that the 2013 ADP be revised to reflect a priority for
monitoring vessels managed under PSC limits in the trip selection pool. The Council
recognizes that this would necessarily modify the equal allocation sampling design such
that higher observer coverage rates are provided in the trip selection pool, and lower rates
in the vessel selection pool, compared to what is currently in the draft ADP.
This motion represents an evolution towards greater specificity on what is meant by the need of
the observer program to “respond to current and future management needs and circumstances” as
stated in the December 2008 BSAI Amendment 86/GOA Amendment 76 Problem Statement and
this group recognizes and appreciates its guidance. To address this stated priority, we evaluated
the observer coverage rates of post-strata. Post-strata are subsets of the data defined so that the
data within a post-stratum are less variable than between post-strata. Although this is the same

77
way that strata are defined, the assignment of data to a post-stratum occurs after the fishing event
is completed (and therefore cannot be used to define deployment strata). Observer data collected
from the fleet are assigned to post-strata at different levels that are defined by factors including:
NMFS statistical area, calendar week, and trip target species (Cahalan et. al, 2010)13
. If
information is not available to estimate catch at one level of post-stratification (aggregation),
then data from adjacent post-strata are pooled together in the estimation process, introducing
potential biases and increasing variance of the catch estimates. For this reason, higher
proportions of post-strata that have observer coverage lead to better estimates of catch overall.
The proportion of post-strata observed was used as a performance indicator to evaluate nine
combinations of sampling rates between the vessel and trip selection portions of the partial
coverage fleet. Similar to the methods used in the NMFS ADP, we simulated the sampling of
trips within each deployment stratum using the 2011 catcher vessel landings database (this
dataset of trips represents the 2011 “as-restructured” partial coverage fleet), with several
modifications. We assumed that the AFA eligible vessels in the BSAI FMP would not be part of
the partial coverage category, used a two-month observation period of vessels in the vessel-
selection pool, and repeated our simulated deployments one hundred times for each evaluation
rate combination. We started our evaluations with the equal deployment rates proposed in the
NMFS ADP, and sequentially decreased the deployment rate in the vessel-selection pool in
single percentage point (1%) increments. Since the total number of observer days is constrained
by available funds, a decrease in the vessel-selection deployment rate of 1% resulted in an
increase in the trip-selection deployment rate of a certain percent. However, recalling that the
total number of fishing trips (and therefore fishing days) differs between the two deployment
pools, a 1% drop in the deployment rate for vessel-selection does not mean that the resulting trip-
selection deployment rate would increase by the same percentage. The deployment rate and
performance indicators were also calculated for the 2011 actual observer program for
comparison with our 2011 “as-restructured” simulated values.
Results were summarized using box plots for each coverage rate/deployment strata combination.
Box plots are used to show the distribution (the centering and the range) of the data. The center
box shows the inter-quartile range (the center 50% of the data), the horizontal line in the box
indicates the median of the data (half the data points are below and half above this line), and the
lines show the range of values that account for approximately 99% of the outcomes. From the
simulation exercise, there is one observation (data point) output for each simulation trial (100
total within each deployment strata for a given deployment rate) depicting the proportion of post-
strata with at least one observed trip. This proportion was summarized over (1) all post-strata
where fishing occurred (“all-post-strata”) and (2) over only those post-strata where the fishery
would be limited by PSC caps (“PSC-only post-strata”). In this manner, the effects of
adjustments to sampling rates could be evaluated in terms on impacts to catch estimates overall
as well as those in PSC limited fisheries.
Results indicate that sampling 2011 “as-restructured” according to the NMFS ADP would have
substantially improved observer coverage of all post-strata as well as post-strata where PSC
limits apply, relative to 2011 actual values. In 2011, 15% of all trips were observed across what
13
Cahalan, J., Mondragon, J., and Gasper, J. 2010. Catch sampling and estimation in the federal groundfish fisheries
off Alaska. NOAA Technical Memorandum NMFS-AFSC-205: 51p.

78
would be the trip-selection stratum of the NMFS ADP compared to the proposed 13% coverage
in the NMFS ADP. However due to disproportionate coverage rates across post-strata in the
current system, in 2011 27% of trip-selection equivalent post strata were sampled compared to
an estimated 39% of post-strata that would have been sampled if observers had been deployed
according to the NMFS ADP (a 44% increase from 2011 actual) - this despite having a 2% lower
deployment rate (Figure A2.4-1 left). Furthermore, 36% of the trip-selection equivalent post
strata where PSC limits apply were sampled in 2011 compared to an estimated 43% that would
have been sampled under the NMFS ADP (a 19% increase from 2011 actual; Figure A2.4-1
right).
Comparisons of deployment rate combinations revealed that reducing the deployment rate in the
vessel selection pool by 1% resulted in a much steeper decline in the estimated coverage of all
post-strata coverage and PSC post-strata coverage relative to the trip selection pool (i.e. there
appear to be greater relative losses than gains). These trends were evident across all changes in
deployment rates examined (vessel selection rates from 6% to 13%). There is no real difference
in the results for all post-strata and PSC post-strata comparisons because of the similarity in the
number of post-strata to number of trips ratio for the vessel-selection and trip-selection pools
(Figure A2.4-2 left); this relationship holds true for PSC post-strata as well (Figure 2.4-2 right).
From these results we concluded that changes in deployment rates between the vessel and trip
selection pools would bring only marginal benefits to the precision and accuracy of bycatch
estimates in fisheries with PSC limits within the trip selection stratum (the Council‟s priority),
and if implemented would result in substantial pooling of data across post-strata within the vessel
selection pool relative to the 2013 NMFS ADP proposed sampling design.
Since (1) the coverage of PSC post-strata expected to be achieved as a result of the NMFS ADP
represents an improvement over the 2011 actual, (2) the coverage of PSC post-strata in the vessel
selection pool at proposed rates of deployment in the NMFS ADP would already be lower than
those achieved in 2011 for vessels over 60‟, and (3) there is a disproportionate loss in observer
coverage of PSC post-strata in the vessel selection pool compared to the increase in observer
coverage of PSC post-strata in the trip selection pool, we recommend that the deployment rates
for observers into the trip and vessel selection pools for 2013 remain unchanged from those
presented in the NMFS ADP and reiterate the support of this plan by the SSC at their October
2012 meeting.
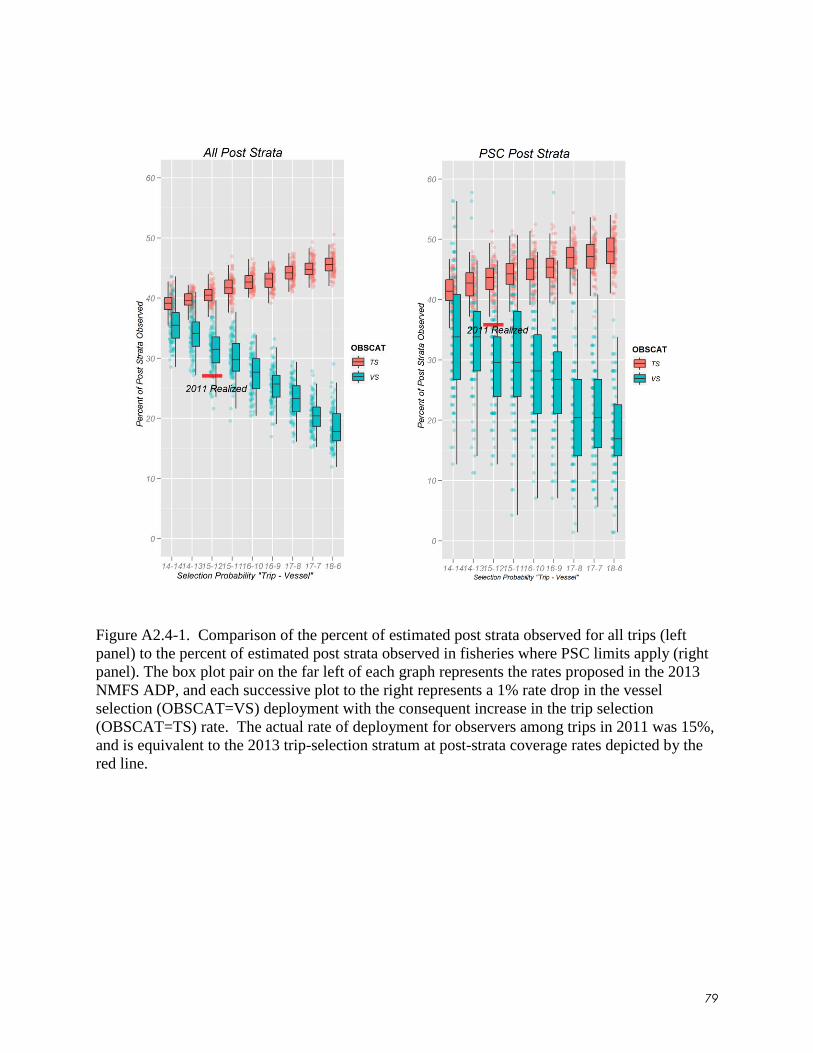
79
Figure A2.4-1. Comparison of the percent of estimated post strata observed for all trips (left
panel) to the percent of estimated post strata observed in fisheries where PSC limits apply (right
panel). The box plot pair on the far left of each graph represents the rates proposed in the 2013
NMFS ADP, and each successive plot to the right represents a 1% rate drop in the vessel
selection (OBSCAT=VS) deployment with the consequent increase in the trip selection
(OBSCAT=TS) rate. The actual rate of deployment for observers among trips in 2011 was 15%,
and is equivalent to the 2013 trip-selection stratum at post-strata coverage rates depicted by the
red line.
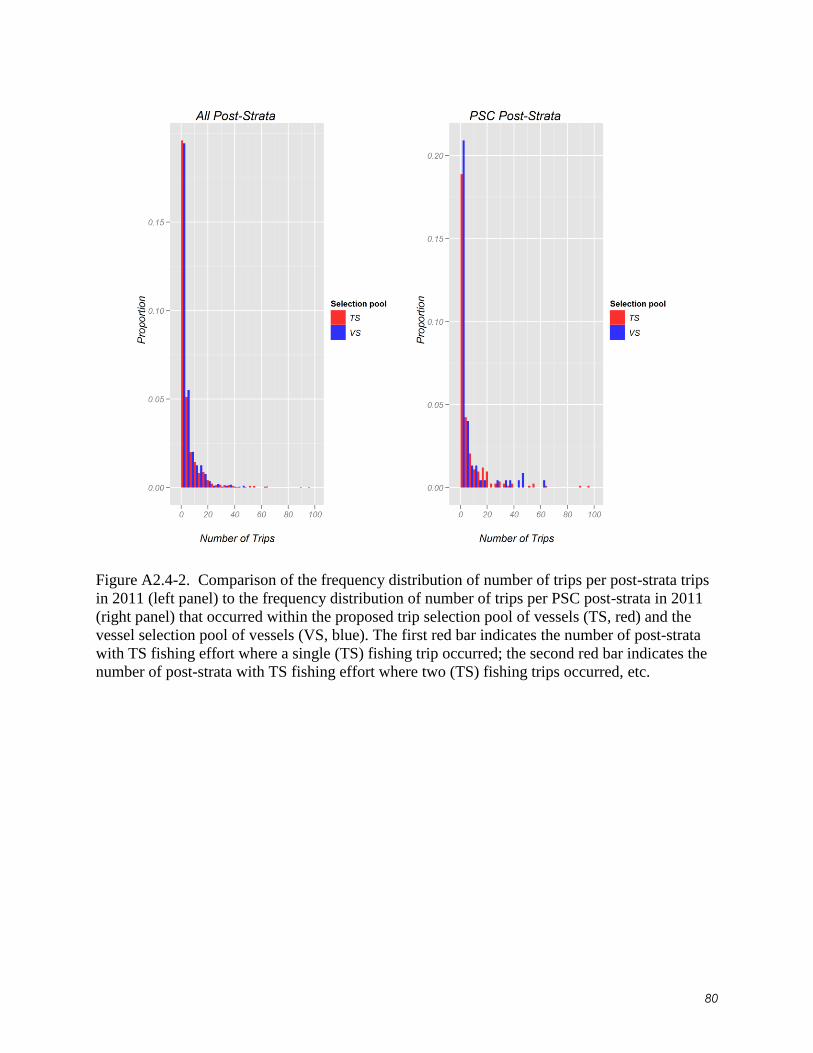
80
Figure A2.4-2. Comparison of the frequency distribution of number of trips per post-strata trips
in 2011 (left panel) to the frequency distribution of number of trips per PSC post-strata in 2011
(right panel) that occurred within the proposed trip selection pool of vessels (TS, red) and the
vessel selection pool of vessels (VS, blue). The first red bar indicates the number of post-strata
with TS fishing effort where a single (TS) fishing trip occurred; the second red bar indicates the
number of post-strata with TS fishing effort where two (TS) fishing trips occurred, etc.