Embed Size (px)
Citation preview

1 Glanbia plc 2013 half year results
Half year results
Global performance nutrition and ingredients group
2013
Wednesday, 21 August 2013

2 Glanbia plc 2013 half year results
11% growth in adjusted earnings per share in the first half
Continued good growth in Global Performance Nutrition and Global Ingredients
Reiterating positive 2013 full year outlook
21 August 2013 - Glanbia plc (“Glanbia”, the “Group”, the “plc”), the global performance nutrition and
ingredients group, announces its results for the six months ended 29 June 2013.
2013 half year results highlights
Good first half operating and financial performance delivered 13% revenue growth, split 8% volume
growth and 5% price growth. Adjusted EPS grew 11% on a constant currency basis;
Global Performance Nutrition continued to outpace market growth rates delivering a 14% increase in
revenue, 20% growth in EBITA and a 50 basis points improvement in EBITA margin to 10.5%;
Global Ingredients also delivered a good performance. Revenue increased 17% and EBITA grew 8%.
EBITA margin declined 90 basis points to 10.7% mainly due to lower margins, as expected, in the
Ingredient Technologies business unit;
Dairy Ireland’s performance was impacted by a very difficult first half in Consumer Products and
EBITA and EBITA margin were lower than prior year;
The Group’s two major strategic Joint Ventures & Associates, Glanbia Ingredients Ireland and
Southwest Cheese in the USA had a steady first half overall;
The full year outlook for the Group remains positive with forecast growth in adjusted EPS of between
8% and 10%, on a constant currency basis.
2013 half year results pre exceptional Constant Currency1 Reported Currency
€m HY 2013 Change2 HY 2013 Change2
Wholly owned businesses Revenue 1,246.8 +13.6% 1,236.3 +12.6%
EBITA 103.6 +5.9% 102.3 +4.6%
EBITA margin 8.3% - 60 bps 8.3% - 60 bps
Joint Ventures and Associates3 Revenue 431.1 +11.5% 426.8 +10.3%
EBITA 20.3 +9.1% 19.9 +7.0%
EBITA margin 4.7% - 10 bps 4.7% - 10 bps
Total Group
Revenue 1,677.9 +13.0% 1,663.1 +12.0%
EBITA 123.9 +6.4% 122.2 +5.0%
EBITA margin 7.4% - 40 bps 7.3% - 50 bps
Adjusted earnings per share 30.69c +11.3% 30.39c +10.2%
Commenting today John Moloney, Group Managing Director, said:
“The Group’s first half performance was driven by Global Performance Nutrition and Global Ingredients.
These two business segments now represent over 70% of Group EBITA and are our core platforms for
future growth. We expect little change in the external operating environment in the second half and with
clear challenges remaining in Dairy Ireland we are maintaining our 2013 full year guidance of adjusted
earnings per share growth of between 8% and 10%, on a constant currency basis. Our recently
announced management changes put in place an excellent team to continue to drive the business forward
and to evolve the long term strategy that will deliver the next phase of growth. Overall, Glanbia is in a
strong position to capitalise on its unique portfolio of global businesses, development opportunities and
strong balance sheet.”
1 Constant currency is based on translating HY 2013 results at the HY 2012 average market exchange rate (€1 = $1.297). The reported average exchange rate for HY 2013 was €1 = $1.313. 2 2012 results have been restated to reflect the adoption of the revised IAS 19 pension accounting standard (see Note 3 for detail). 3 Glanbia disposed of a 60% interest in Glanbia Ingredients Ireland Limited (“GIIL”) in November 2012. GIIL, previously part of the Dairy Ireland segment, is now a 40% associate. 2012 half year results have been restated to show GIIL on the same basis.
3 Glanbia plc 2013 half year results
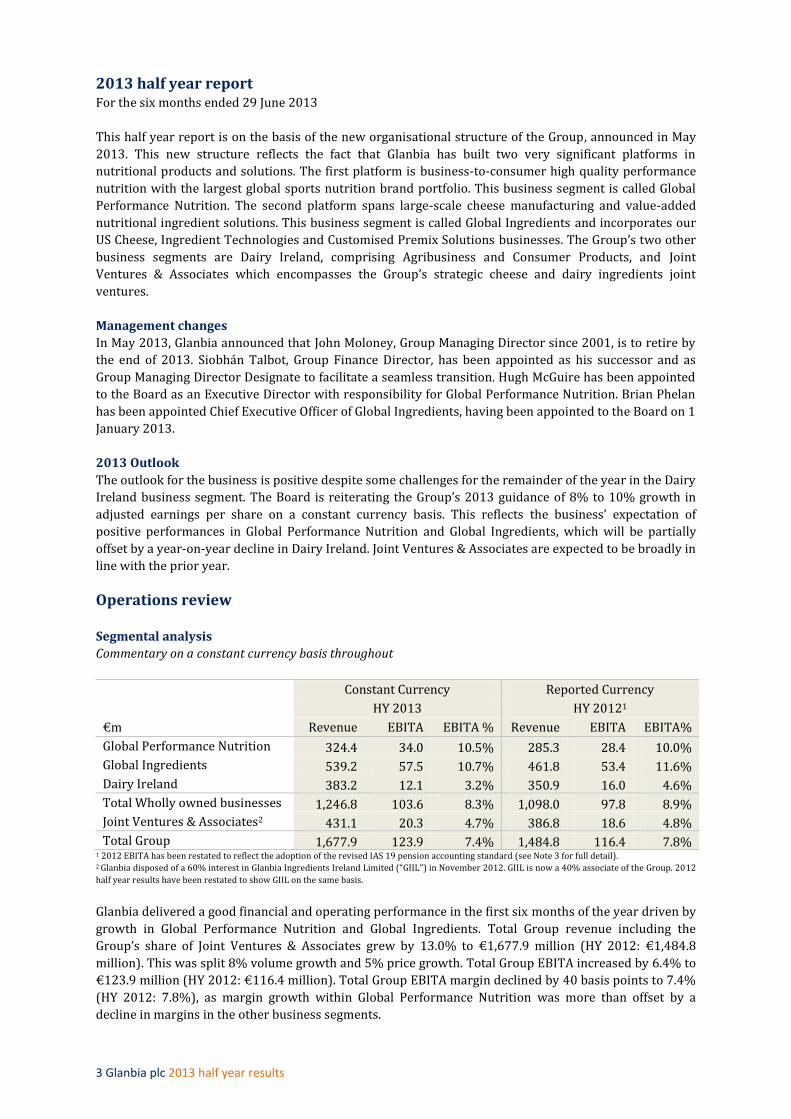
2013 half year report For the six months ended 29 June 2013
This half year report is on the basis of the new organisational structure of the Group, announced in May
2013. This new structure reflects the fact that Glanbia has built two very significant platforms in
nutritional products and solutions. The first platform is business-to-consumer high quality performance
nutrition with the largest global sports nutrition brand portfolio. This business segment is called Global
Performance Nutrition. The second platform spans large-scale cheese manufacturing and value-added
nutritional ingredient solutions. This business segment is called Global Ingredients and incorporates our
US Cheese, Ingredient Technologies and Customised Premix Solutions businesses. The Group’s two other
business segments are Dairy Ireland, comprising Agribusiness and Consumer Products, and Joint
Ventures & Associates which encompasses the Group’s strategic cheese and dairy ingredients joint
ventures.
Management changes
In May 2013, Glanbia announced that John Moloney, Group Managing Director since 2001, is to retire by
the end of 2013. Siobhán Talbot, Group Finance Director, has been appointed as his successor and as
Group Managing Director Designate to facilitate a seamless transition. Hugh McGuire has been appointed
to the Board as an Executive Director with responsibility for Global Performance Nutrition. Brian Phelan
has been appointed Chief Executive Officer of Global Ingredients, having been appointed to the Board on 1
January 2013.
2013 Outlook
The outlook for the business is positive despite some challenges for the remainder of the year in the Dairy
Ireland business segment. The Board is reiterating the Group’s 2013 guidance of 8% to 10% growth in
adjusted earnings per share on a constant currency basis. This reflects the business’ expectation of
positive performances in Global Performance Nutrition and Global Ingredients, which will be partially
offset by a year-on-year decline in Dairy Ireland. Joint Ventures & Associates are expected to be broadly in
line with the prior year.
Operations review
Segmental analysis
Commentary on a constant currency basis throughout
Constant Currency Reported Currency
HY 2013 HY 20121
€m Revenue EBITA EBITA % Revenue EBITA EBITA%
Global Performance Nutrition 324.4 34.0 10.5% 285.3 28.4 10.0%
Global Ingredients 539.2 57.5 10.7% 461.8 53.4 11.6%
Dairy Ireland 383.2 12.1 3.2% 350.9 16.0 4.6%
Total Wholly owned businesses 1,246.8 103.6 8.3% 1,098.0 97.8 8.9%
Joint Ventures & Associates2 431.1 20.3 4.7% 386.8 18.6 4.8%
Total Group 1,677.9 123.9 7.4% 1,484.8 116.4 7.8% 1 2012 EBITA has been restated to reflect the adoption of the revised IAS 19 pension accounting standard (see Note 3 for full detail). 2 Glanbia disposed of a 60% interest in Glanbia Ingredients Ireland Limited (“GIIL”) in November 2012. GIIL is now a 40% associate of the Group. 2012
half year results have been restated to show GIIL on the same basis.
Glanbia delivered a good financial and operating performance in the first six months of the year driven by
growth in Global Performance Nutrition and Global Ingredients. Total Group revenue including the
Group’s share of Joint Ventures & Associates grew by 13.0% to €1,677.9 million (HY 2012: €1,484.8
million). This was split 8% volume growth and 5% price growth. Total Group EBITA increased by 6.4% to
€123.9 million (HY 2012: €116.4 million). Total Group EBITA margin declined by 40 basis points to 7.4%
(HY 2012: 7.8%), as margin growth within Global Performance Nutrition was more than offset by a
decline in margins in the other business segments.
4 Glanbia plc 2013 half year results
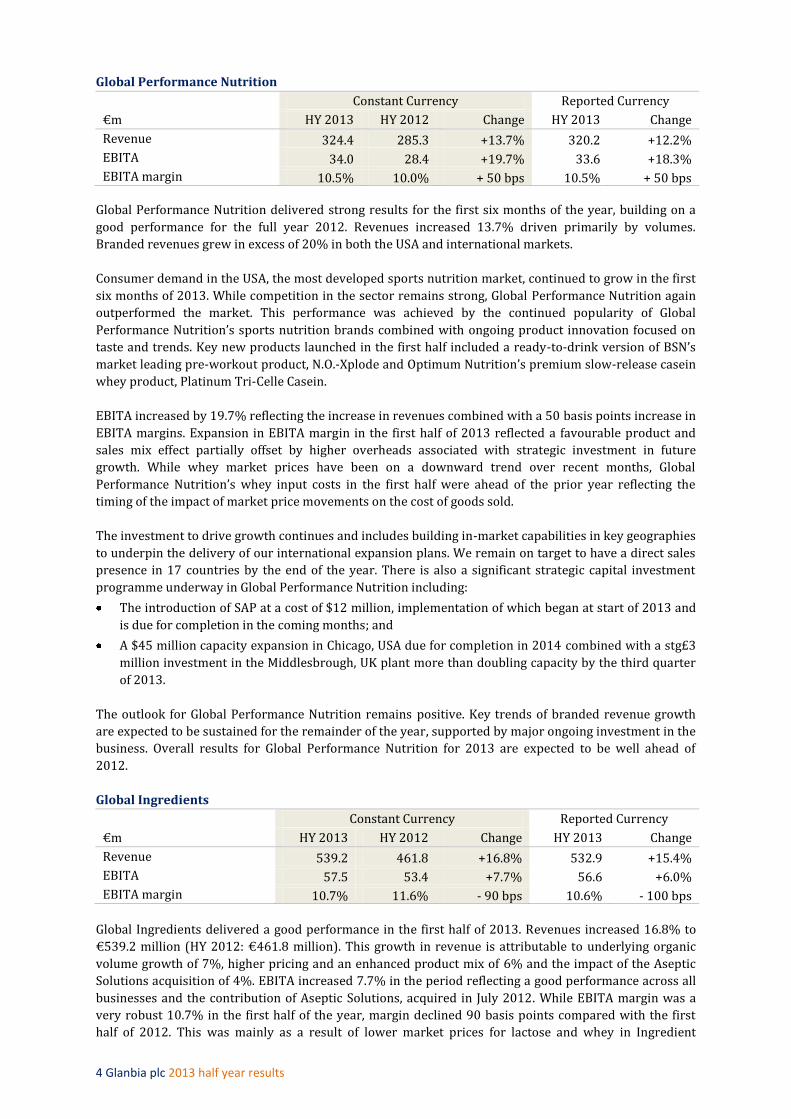
Global Performance Nutrition
Constant Currency Reported Currency
€m HY 2013 HY 2012 Change HY 2013 Change
Revenue 324.4 285.3 +13.7% 320.2 +12.2%
EBITA 34.0 28.4 +19.7% 33.6 +18.3%
EBITA margin 10.5% 10.0% + 50 bps 10.5% + 50 bps Global Performance Nutrition delivered strong results for the first six months of the year, building on a
good performance for the full year 2012. Revenues increased 13.7% driven primarily by volumes.
Branded revenues grew in excess of 20% in both the USA and international markets.
Consumer demand in the USA, the most developed sports nutrition market, continued to grow in the first
six months of 2013. While competition in the sector remains strong, Global Performance Nutrition again
outperformed the market. This performance was achieved by the continued popularity of Global
Performance Nutrition’s sports nutrition brands combined with ongoing product innovation focused on
taste and trends. Key new products launched in the first half included a ready-to-drink version of BSN’s
market leading pre-workout product, N.O.-Xplode and Optimum Nutrition’s premium slow-release casein
whey product, Platinum Tri-Celle Casein.
EBITA increased by 19.7% reflecting the increase in revenues combined with a 50 basis points increase in
EBITA margins. Expansion in EBITA margin in the first half of 2013 reflected a favourable product and
sales mix effect partially offset by higher overheads associated with strategic investment in future
growth. While whey market prices have been on a downward trend over recent months, Global
Performance Nutrition’s whey input costs in the first half were ahead of the prior year reflecting the
timing of the impact of market price movements on the cost of goods sold.
The investment to drive growth continues and includes building in-market capabilities in key geographies
to underpin the delivery of our international expansion plans. We remain on target to have a direct sales
presence in 17 countries by the end of the year. There is also a significant strategic capital investment
programme underway in Global Performance Nutrition including:
The introduction of SAP at a cost of $12 million, implementation of which began at start of 2013 and
is due for completion in the coming months; and
A $45 million capacity expansion in Chicago, USA due for completion in 2014 combined with a stg£3
million investment in the Middlesbrough, UK plant more than doubling capacity by the third quarter
of 2013.
The outlook for Global Performance Nutrition remains positive. Key trends of branded revenue growth
are expected to be sustained for the remainder of the year, supported by major ongoing investment in the
business. Overall results for Global Performance Nutrition for 2013 are expected to be well ahead of
2012.
Global Ingredients
Constant Currency Reported Currency
€m HY 2013 HY 2012 Change HY 2013 Change
Revenue 539.2 461.8 +16.8% 532.9 +15.4%
EBITA 57.5 53.4 +7.7% 56.6 +6.0%
EBITA margin 10.7% 11.6% - 90 bps 10.6% - 100 bps
Global Ingredients delivered a good performance in the first half of 2013. Revenues increased 16.8% to
€539.2 million (HY 2012: €461.8 million). This growth in revenue is attributable to underlying organic
volume growth of 7%, higher pricing and an enhanced product mix of 6% and the impact of the Aseptic
Solutions acquisition of 4%. EBITA increased 7.7% in the period reflecting a good performance across all
businesses and the contribution of Aseptic Solutions, acquired in July 2012. While EBITA margin was a
very robust 10.7% in the first half of the year, margin declined 90 basis points compared with the first
half of 2012. This was mainly as a result of lower market prices for lactose and whey in Ingredient
5 Glanbia plc 2013 half year results
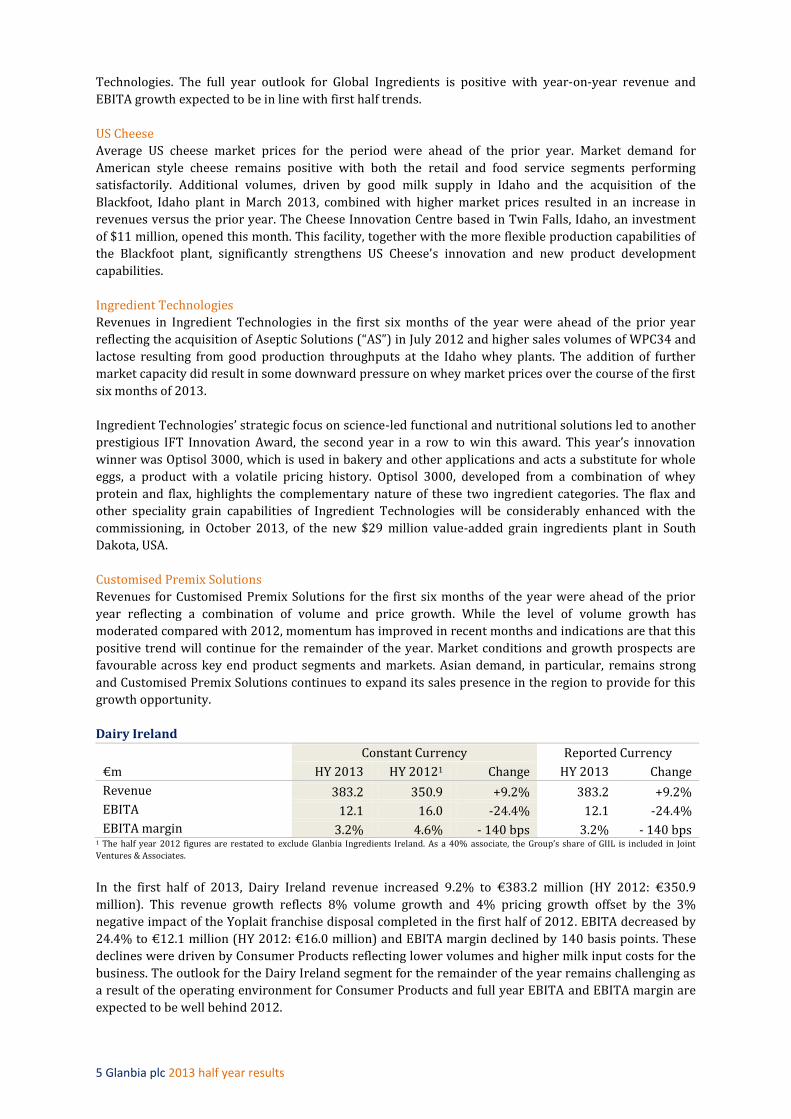
Technologies. The full year outlook for Global Ingredients is positive with year-on-year revenue and
EBITA growth expected to be in line with first half trends.
US Cheese
Average US cheese market prices for the period were ahead of the prior year. Market demand for
American style cheese remains positive with both the retail and food service segments performing
satisfactorily. Additional volumes, driven by good milk supply in Idaho and the acquisition of the
Blackfoot, Idaho plant in March 2013, combined with higher market prices resulted in an increase in
revenues versus the prior year. The Cheese Innovation Centre based in Twin Falls, Idaho, an investment
of $11 million, opened this month. This facility, together with the more flexible production capabilities of
the Blackfoot plant, significantly strengthens US Cheese’s innovation and new product development
capabilities.
Ingredient Technologies
Revenues in Ingredient Technologies in the first six months of the year were ahead of the prior year
reflecting the acquisition of Aseptic Solutions (“AS”) in July 2012 and higher sales volumes of WPC34 and
lactose resulting from good production throughputs at the Idaho whey plants. The addition of further
market capacity did result in some downward pressure on whey market prices over the course of the first
six months of 2013.
Ingredient Technologies’ strategic focus on science-led functional and nutritional solutions led to another
prestigious IFT Innovation Award, the second year in a row to win this award. This year’s innovation
winner was Optisol 3000, which is used in bakery and other applications and acts a substitute for whole
eggs, a product with a volatile pricing history. Optisol 3000, developed from a combination of whey
protein and flax, highlights the complementary nature of these two ingredient categories. The flax and
other speciality grain capabilities of Ingredient Technologies will be considerably enhanced with the
commissioning, in October 2013, of the new $29 million value-added grain ingredients plant in South
Dakota, USA.
Customised Premix Solutions
Revenues for Customised Premix Solutions for the first six months of the year were ahead of the prior
year reflecting a combination of volume and price growth. While the level of volume growth has
moderated compared with 2012, momentum has improved in recent months and indications are that this
positive trend will continue for the remainder of the year. Market conditions and growth prospects are
favourable across key end product segments and markets. Asian demand, in particular, remains strong
and Customised Premix Solutions continues to expand its sales presence in the region to provide for this
growth opportunity.
Dairy Ireland
Constant Currency Reported Currency
€m HY 2013 HY 20121 Change HY 2013 Change
Revenue 383.2 350.9 +9.2% 383.2 +9.2%
EBITA 12.1 16.0 -24.4% 12.1 -24.4%
EBITA margin 3.2% 4.6% - 140 bps 3.2% - 140 bps 1 The half year 2012 figures are restated to exclude Glanbia Ingredients Ireland. As a 40% associate, the Group’s share of GIIL is included in Joint
Ventures & Associates.
In the first half of 2013, Dairy Ireland revenue increased 9.2% to €383.2 million (HY 2012: €350.9
million). This revenue growth reflects 8% volume growth and 4% pricing growth offset by the 3%
negative impact of the Yoplait franchise disposal completed in the first half of 2012. EBITA decreased by
24.4% to €12.1 million (HY 2012: €16.0 million) and EBITA margin declined by 140 basis points. These
declines were driven by Consumer Products reflecting lower volumes and higher milk input costs for the
business. The outlook for the Dairy Ireland segment for the remainder of the year remains challenging as
a result of the operating environment for Consumer Products and full year EBITA and EBITA margin are
expected to be well behind 2012.

6 Glanbia plc 2013 half year results
Consumer Products
Consumer Product revenues declined in the period driven primarily by the sale of the Yoplait franchise.
The business continues to be impacted by the challenging Irish retail environment. Consumers are heavily
focused on price while retailers are focused on cost. As a result, promotional volumes continue to rise and
private label products continue to gain market share at the expense of branded products. Furthermore,
the increase in global dairy market prices over the first six months of the year resulted in a significant
increase in input costs for the business, with only partial price recovery.
Agribusiness
Agribusiness revenues were ahead of the same period last year as a result of higher pricing and increased
demand for fertilizer and feed. One of the key drivers of this higher demand was the unseasonably cold
weather which prevailed for much of the first half of the year. Construction of the new oatmeal milling
facility, which will cater for the recently signed supply contract with Sturm Foods in the USA, is running
on time and on budget with commissioning due by the end of 2013.
Joint Ventures & Associates (Glanbia Share)
Constant Currency Reported Currency
€m HY 2013 HY 20121 Change HY 2013 Change
Revenue 431.1 386.8 +11.5% 426.8 +10.3%
EBITA 20.3 18.6 +9.1% 19.9 +7.0%
EBITA margin 4.7% 4.8% - 10 bps 4.7% - 10 bps 1 Glanbia disposed of a 60% interest in Glanbia Ingredients Ireland Limited (“GIIL”) in November 2012. GIIL is now a 40% associate of the Group. 2012
half year results have been restated to show GIIL on the same basis.
Revenue for the first six months of the year from Joint Ventures & Associates increased 11.5% to €431.1
million (HY 2012: €386.8 million). This growth was split 6% volume and 6% price. Glanbia Ingredients
Ireland, Southwest Cheese and Glanbia Cheese all achieved positive revenue growth due to higher global
dairy market prices as poor weather conditions in a number of the key exporting regions resulted in
reduced supply and, consequently, higher dairy prices. This was partially offset by a decline in revenues
in Nutricima. EBITA increased by 9.1% to €20.3 million (HY 2012: €18.6 million) and EBITA margins
were down slightly reflecting higher input costs across each of the four business units.
Construction of Glanbia Ingredients Ireland’s new €150 million dairy processing facility is progressing
well while a decision on the potential development of lactose production capacity in Southwest Cheese is
expected to be made by the end of the year.
The expectation is for a more challenging environment for the remainder of the year resulting in a
broadly similar performance for Joint Ventures & Associates for the full year when compared with 2012.
7 Glanbia plc 2013 half year results
Finance review
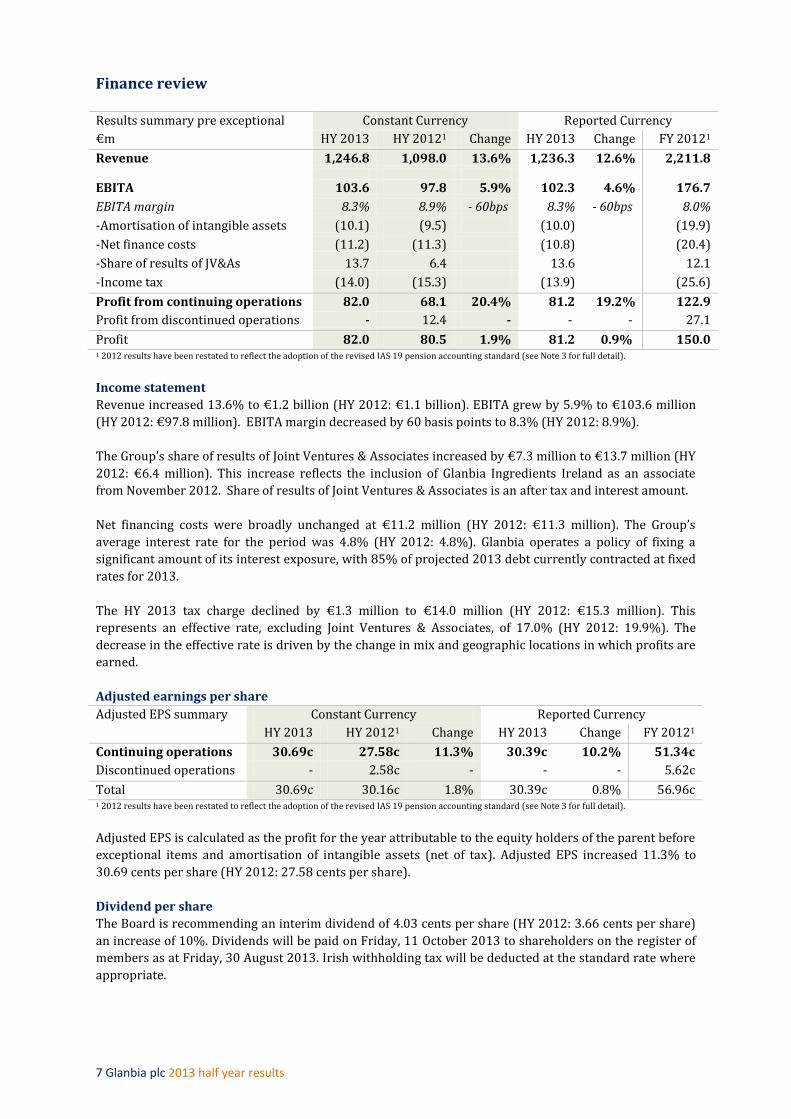
Results summary pre exceptional Constant Currency Reported Currency
€m HY 2013 HY 20121 Change HY 2013 Change FY 20121
Revenue 1,246.8 1,098.0 13.6% 1,236.3 12.6% 2,211.8
EBITA 103.6 97.8 5.9% 102.3 4.6% 176.7
EBITA margin 8.3% 8.9% - 60bps 8.3% - 60bps 8.0%
-Amortisation of intangible assets (10.1) (9.5) (10.0) (19.9)
-Net finance costs (11.2) (11.3) (10.8) (20.4)
-Share of results of JV&As 13.7 6.4 13.6 12.1
-Income tax (14.0) (15.3) (13.9) (25.6)
Profit from continuing operations 82.0 68.1 20.4% 81.2 19.2% 122.9
Profit from discontinued operations - 12.4 - - - 27.1
Profit 82.0 80.5 1.9% 81.2 0.9% 150.0 1 2012 results have been restated to reflect the adoption of the revised IAS 19 pension accounting standard (see Note 3 for full detail).
Income statement
Revenue increased 13.6% to €1.2 billion (HY 2012: €1.1 billion). EBITA grew by 5.9% to €103.6 million
(HY 2012: €97.8 million). EBITA margin decreased by 60 basis points to 8.3% (HY 2012: 8.9%).
The Group’s share of results of Joint Ventures & Associates increased by €7.3 million to €13.7 million (HY
2012: €6.4 million). This increase reflects the inclusion of Glanbia Ingredients Ireland as an associate
from November 2012. Share of results of Joint Ventures & Associates is an after tax and interest amount.
Net financing costs were broadly unchanged at €11.2 million (HY 2012: €11.3 million). The Group’s
average interest rate for the period was 4.8% (HY 2012: 4.8%). Glanbia operates a policy of fixing a
significant amount of its interest exposure, with 85% of projected 2013 debt currently contracted at fixed
rates for 2013.
The HY 2013 tax charge declined by €1.3 million to €14.0 million (HY 2012: €15.3 million). This
represents an effective rate, excluding Joint Ventures & Associates, of 17.0% (HY 2012: 19.9%). The
decrease in the effective rate is driven by the change in mix and geographic locations in which profits are
earned.
Adjusted earnings per share
Adjusted EPS summary Constant Currency Reported Currency
HY 2013 HY 20121 Change HY 2013 Change FY 20121
Continuing operations 30.69c 27.58c 11.3% 30.39c 10.2% 51.34c
Discontinued operations - 2.58c - - - 5.62c
Total 30.69c 30.16c 1.8% 30.39c 0.8% 56.96c 1 2012 results have been restated to reflect the adoption of the revised IAS 19 pension accounting standard (see Note 3 for full detail).
Adjusted EPS is calculated as the profit for the year attributable to the equity holders of the parent before
exceptional items and amortisation of intangible assets (net of tax). Adjusted EPS increased 11.3% to
30.69 cents per share (HY 2012: 27.58 cents per share).
Dividend per share
The Board is recommending an interim dividend of 4.03 cents per share (HY 2012: 3.66 cents per share)
an increase of 10%. Dividends will be paid on Friday, 11 October 2013 to shareholders on the register of
members as at Friday, 30 August 2013. Irish withholding tax will be deducted at the standard rate where
appropriate.

8 Glanbia plc 2013 half year results
Net debt
The Group's net debt position at 29 June 2013 decreased by €116.1 million to €444.7 million relative to
the first half of 2012 (HY 2012: €560.8 million). Relative to the year ended 31 December 2012, the
Group’s net debt increased by €68.1 million (FY2012: €376.6 million). The main drivers of the movement
in net debt since the year end include the seasonal increase in working capital of €94.1 million primarily
in the Dairy Ireland business segment and capital expenditure of €46.5 million partially offset by
reported first half EBITDA of €115.3 million.
Group financing
The Group currently has three sources of committed debt finance totalling €755.8 million:
A $325 million (€248.5 million) private placement of senior loan notes, due June 2021;
Bilateral multicurrency revolving loan facilities totalling €468.2 million with eight banks, all maturing
January 2018, which were renewed during 2012 on common terms and conditions; and
Cumulative redeemable preference shares of €39.1 million due for redemption July 2014.
At 29 June 2013, the Group had a net debt to adjusted EBITDA leverage ratio of 2.0 times (HY 2012: 2.3
times) compared to the Group’s banking covenant of 3.7 times. Adjusted EBIT to net financing cost cover
stood at 8.6 times (HY 2012: 6.9 times) compared to the Group’s banking covenant of 3.5 times.
Pension
The Group's net pension liability at 29 June 2013, under IAS 19 (revised) - Employee benefits, before
deferred tax, decreased by €32.6 million to €84.8 million relative to the first half of 2012 (HY 2012:
€117.4 million). The Group’s net pension liability at 29 June 2013 decreased by €13.3 million to €84.8
million (FY 2012: €98.1 million) relative to the year end 2012. This decrease was mainly as a result of a
10 basis point increase in the discount rate applicable to the Irish pension schemes to 3.90% (FY 2012:
3.80%). This arose due to an increase in the AA corporate bond index which is used to value pension
liabilities on an IAS 19R basis. The cash flow requirement for the Irish pension schemes is unchanged as
the schemes remain on target to meet the funding position agreed with the Irish pensions’ regulator. The
fair value of the assets of the pension schemes at 29 June 2013 was €341.6 million (FY 2012: €332.6
million; HY 2012: €420.6 million) and the value of the scheme liabilities was €426.4 million (FY 2012:
€430.7 million; HY 2012: €538 million).
2013 outlook
2013 guidance is for 8% to 10% growth in adjusted earnings per share on a constant currency basis.
Based on the EUR/USD exchange rate as at 29 June 2013 of €1 = US$1.308 prevailing for the remainder of
the year, guidance of 8% to 10% growth in adjusted earnings per share on a constant currency basis for
2013 would equate to 6% to 8% growth on a reported basis.
Principal risks and uncertainties affecting the Group’s performance in 2013
The performance of the Group is influenced by global economic growth and consumer confidence in the
markets in which it operates. In the second half of 2013, the principal risks affecting the Group’s
performance are:
The continued fragile global economic outlook;
The challenging Irish retail environment and the associated management of margins within Dairy
Ireland; and
The effective execution of our growth strategy within both Global Performance Nutrition and Global
Ingredients.
The principal risks and uncertainties are outlined in detail in the 2012 Annual Report.

9 Glanbia plc 2013 half year results
Supplementary information
2012 segmental restatement
For ease of comparison, the below table provides the 2012 full year results restated on the basis of the
new segmentation.
Reported
FY 20121
€m Revenue EBITA EBITA %
Global Performance Nutrition 585.9 57.3 9.8%
Global Ingredients 994.9 98.1 9.9%
Dairy Ireland 631.0 21.3 3.4%
Total Wholly owned businesses 2,211.8 176.7 8.0%
Joint Ventures & Associates2 826.3 37.9 4.6%
Total Group 3,038.1 214.6 7.1% 1 2012 EBITA has been restated to reflect the adoption of the revised IAS 19 pension accounting standard (see Note 3 for full detail). 2 Glanbia disposed of a 60% interest in Glanbia Ingredients Ireland Limited (“GIIL”) in November 2012. GIIL is now a 40% associate of the Group. 2012
half year results have been restated to show GIIL on the same basis.
Reconciliation of EBITA to profit after tax (PAT) for Joint Ventures & Associates
The table below reconciles EBITA with share of results of Joint Ventures & Associates, as reported in the
Income Statement.
€m
Constant Currency Reported Currency
HY 2013 HY 20121 Change HY 2013 Change
Pro forma EBITA 20.3 18.6 1.7 19.9 1.3
Reversal of pro forma adj. for GIIL - (6.7) 6.7 - 6.7
Reported EBITA 20.3 11.9 8.4 19.9 8.0
Finance costs (2.2) (2.6) 0.4 (2.0) 0.6
Income taxes (4.4) (2.9) (1.5) (4.3) (1.4)
Profit after tax 13.7 6.4 7.3 13.6 7.2 1. Glanbia disposed of a 60% interest in Glanbia Ingredients Ireland Limited (“GIIL”) in November 2012. GIIL is now a 40% associate of the Group.
2012 half year results have been restated to show GIIL on the same basis.
Ends
10 Glanbia plc 2013 half year results
Cautionary statement This announcement contains forward-looking statements. These statements have been made by the
Directors in good faith based on the information available to them up to the time of their approval of this
report. Due to the inherent uncertainties, including both economic and business risk factors underlying
such forward looking information, actual results may differ materially from those expressed or implied by
these forward-looking statements. The Directors undertake no obligation to update any forward-looking
statements contained in this announcement, whether as a result of new information, future events, or
otherwise.
Constant Currency
Glanbia uses constant currency as a basis for commentary on its financial results and providing earnings
guidance, as the majority of its earnings are US dollar denominated. Constant currency is based on
translating HY 2013 results at the HY 2012 average exchange rate. The HY 2012 average exchange rate
was €1 = US$1.297 which compares with the reported average exchange rate for HY 2013 of €1 =
US$1.313.
For further information contact
Glanbia plc +353 56 777 2200
Siobhán Talbot, Group Managing Director Designate
Shane Power, Group Investor Relations Manager +353 56 777 2244
Geraldine Kearney, Corporate Communications Director + 353 87 231 9430
11 Glanbia plc 2013 half year results
Responsibility statement
The Directors are responsible for preparing the half yearly financial report in accordance with the Transparency
(Directive 2004/109/EC) Regulations 2007, the related Transparency Rules of the Central Bank of Ireland and with
IAS 34 - Interim Financial Reporting, as adopted by the European Union.
The Directors confirm that, to the best of their knowledge:
The Group condensed financial statements for the half year ended 29 June 2013 have been prepared in
accordance with the international accounting standards applicable to interim financial reporting adopted
pursuant to the procedure provided for under Article 6 of the Regulation (EC) No. 1606/2002 of the European
Parliament and of the Council of 19 July 2002;
The half yearly financial report includes a fair review of the development and performance of the business and
the position of the Group;
The half yearly financial report includes a fair review of the important events that have occurred during the first
six months of the financial year, and their impact on the Group condensed financial statements for the half year
ended 29 June 2013, and a description of the principal risks and uncertainties for the remaining six months;
The half yearly financial report includes a fair review of related party transactions that have occurred during the
first six months of the current financial year that have materially affected the financial position or the
performance of the Group during that period and any changes in the related party transactions described in the
last Annual Report that could have a material effect on the financial position or the performance of the Group in
the first six months of the current financial year; and
The Directors of Glanbia plc are as listed in the Glanbia plc 2012 Annual Report, with the exception of the
following changes in the period:
Kevin Toland resigned on 5 January 2013, Billy Murphy resigned on 1 June 2013 and Robert Prendergast and
Brendan Hayes resigned on 5 June 2013.
Brian Phelan was appointed on 1 January 2013, Donard Gaynor was appointed on 12 March 2013, Hugh McGuire
was appointed on 1 June 2013 and Vincent Gorman was appointed on 27 June 2013.
A list of current directors is maintained on the Glanbia plc website: www.glanbia.com.
On behalf of the Board
John Moloney Siobhán Talbot
Group Managing Director Group Managing Director Designate
20 August 2013

Condensed income statement for the half year ended 29 June 2013
12 Glanbia plc 2013 half year results
Half year 2013 Half year 2012* Year 2012* Pre-
exceptional Exceptional Total Pre-
exceptional Exceptional Total Pre-
exceptional Exceptional Total
2013 2013 2013 2012 2012 2012 2012 2012 2012
Notes €'000 €'000 €'000 €'000 €'000 €'000 €'000 €'000 €'000
(note 8) (note 8) (note 8)
Continuing operations
Revenue 6 1,236,349 - 1,236,349 1,098,040 - 1,098,040 2,211,757 - 2,211,757 Earnings before interest, tax and amortisation (EBITA) 102,269 - 102,269 97,753 4,690 102,443 176,730 1,610 178,340
Intangible asset amortisation (10,020) - (10,020) (9,546) - (9,546) (19,864) - (19,864)
Operating profit 92,249 - 92,249 88,207 4,690 92,897 156,866 1,610 158,476
Finance income 9 1,077 - 1,077 1,791 - 1,791 2,942 - 2,942
Finance costs 9 (11,870) - (11,870) (13,068) - (13,068) (23,370) - (23,370) Share of results of Joint Ventures & Associates 13,580 - 13,580 6,443 - 6,443 12,147 - 12,147
Profit before taxation 95,036 - 95,036 83,373 4,690 88,063 148,585 1,610 150,195
Income taxes 10 (13,847) - (13,847) (15,320) 627 (14,693) (25,611) 1,440 (24,171) Profit for the year from continuing operations 81,189 - 81,189 68,053 5,317 73,370 122,974 3,050 126,024
Discontinued operations Profit for the period from discontinued operations, net of tax - - - 12,386 - 12,386 27,133 (7,761) 19,372
Profit for the period 81,189 - 81,189 80,439 5,317 85,756 150,107 (4,711) 145,396
Attributable to:
Equity holders of the Parent
80,738 85,324 144,956
Non-controlling interests
451 432 440
81,189 85,756 145,396
Earnings per share from continuing and discontinued operations attributable to the equity holders of the Parent
Basic earnings per share (cents) 12
From continuing operations 27.39 24.83 42.71
From discontinued operations - 4.22 6.59
27.39 29.05 49.30 Diluted earnings per share (cents) 12
From continuing operations 27.22 24.58 42.33
From discontinued operations - 4.17 6.53
27.22 28.75 48.86
*As re-presented to reflect the effect of discontinued operations and the adoption of IAS 19 (revised) – Employee Benefits.

Condensed statement of comprehensive income for the half year ended 29 June 2013
13 Glanbia plc 2013 half year results
Half year Half year* Year*
2013 2012 2012 Notes €’000 €’000 €’000
Profit for the period 81,189 85,756 145,396
Other comprehensive income/(expense)
Items that are not reclassified subsequently to the income statement:
Remeasurements – defined benefit schemes 18 8,512 (76,760) (100,095)
Deferred tax (charge)/credit on remeasurements (1,007) 8,889 10,801
Share of remeasurements – Joint Ventures & Associates 14
1,802 (137) (1,227)
Deferred tax (charge)/credit on remeasurements – Joint Ventures & Associates
(225) 17 169
Items that may be reclassified subsequently to the income statement:
Currency translation differences 17 4,187 17,293 (8,071)
Net investment hedge 17 (588) (2,110) 1,409
Revaluation of available for sale financial assets 17 779 (415) (971)
Fair value movements on cash flow hedges 17 264 (1,181) 3,445
Deferred tax on cash flow hedges and revaluation of available for sale financial assets 17 (292) 301 (172)
Other comprehensive income/(expense) for the period, net of tax 13,432 (54,103) (94,712)
Total comprehensive income for the period 94,621 31,653 50,684
Total comprehensive income attributable to:
Equity holders of the Parent 94,170 31,221 50,244
Non-controlling interests 451 432 440
94,621 31,653 50,684
*As re-presented to reflect the adoption of IAS 19 (revised) – Employee Benefits.

Condensed statement of changes in equity for the half year ended 29 June 2013
14 Glanbia plc 2013 half year results
Attributable to equity holders of the Parent
Share capital and share premium
Other reserves
Retained earnings * Total
Non –controlling
interests Total
Half year 2012 Notes €'000 €'000 €'000 €'000 €'000 €'000
Balance at 31 December 2011 100,962 153,544 261,308 515,814 7,135 522,949
Profit for the period - - 85,324 85,324 432 85,756
Other comprehensive income/(expense)
Remeasurements - defined benefit schemes 18 - - (76,760) (76,760) - (76,760)
Deferred tax on remeasurements - - 8,889 8,889 - 8,889
Share of remeasurements – Joint Ventures & Associates - - (120) (120) - (120)
Fair value movements 17 - (1,596) - (1,596) - (1,596)
Deferred tax on fair value movements 17 - 301 - 301 - 301
Currency translation differences 17 - 17,293 - 17,293 - 17,293
Net investment hedge 17 - (2,110) - (2,110) - (2,110)
Total comprehensive income - 13,888 17,333 31,221 432 31,653
Dividends paid during the period 11 - - (14,550) (14,550) - (14,550)
Cost of share based payments 17 - 1,553 - 1,553 - 1,553
Balance at 30 June 2012 100,962 168,985 264,091 534,038 7,567 541,605
Attributable to equity holders of the Parent
Share capital and
share premium
Other reserves
Retained earnings Total
Non –controlling
interests Total
Half year 2013 Notes €'000 €'000 €'000 €'000 €'000 €'000
Balance at 29 December 2012 102,095 145,289 289,997 537,381 7,275 544,656
Profit for the period - - 80,738 80,738 451 81,189
Other comprehensive income/(expense)
Remeasurements - defined benefit schemes 18 - - 8,512 8,512 - 8,512
Deferred tax on remeasurements - - (1,007) (1,007) - (1,007)
Share of remeasurements - Joint Ventures & Associates - - 1,577 1,577 - 1,577
Fair value movements 17 - 1,043 - 1,043 - 1,043
Deferred tax on fair value movements 17 - (292) - (292) - (292)
Currency translation differences 17 - 4,187 - 4,187 - 4,187
Net investment hedge 17 - (588) - (588) - (588)
Total comprehensive income - 4,350 89,820 94,170 451 94,621
Dividends paid during the period 11 - - (16,009) (16,009) - (16,009)
Cost of share based payments 17 - 2,292 - 2,292 - 2,292
Transfer on exercise, vesting or expiry of share based payments
17 - 6,317 (6,317) - - -
Shares issued 16 36 - - 36 - 36
Premium on shares issued 16 1,529 - - 1,529 - 1,529
Purchase of own shares 17 - (4,642) - (4,642) - (4,642)
Balance at 29 June 2013 103,660 153,606 357,491 614,757 7,726 622,483
*As re-presented to reflect the adoption of IAS 19 (revised) – Employee Benefits. Goodwill previously written off amounting to €93.0 million (HY 2012: €93.0 million) is included in opening and closing retained earnings.

Condensed statement of financial position as at 29 June 2013
15 Glanbia plc 2013 half year results
Half year Half year Year 2013 2012 2012 Notes €'000 €'000 €'000
ASSETS
Non-current assets
Property, plant and equipment 335,108 408,398 309,496
Intangible assets 475,214 471,661 473,016
Investments in associates 76,063 13,112 67,586
Investments in joint ventures 61,758 63,434 58,482
Trade and other receivables 16,436 14,871 16,835
Deferred income tax assets 18,781 20,979 19,963
Available for sale financial assets 8,140 9,125 9,144
Derivative financial instruments - 12 -
991,500 1,001,592 954,522
Current assets
Inventories 281,879 400,256 282,028
Trade and other receivables 397,520 402,723 271,589
Derivative financial instruments 2,090 2,968 1,457
Cash and cash equivalents 14 73,060 164,451 275,572
754,549 970,398 830,646
Total assets 1,746,049 1,971,990 1,785,168
EQUITY
Issued capital and reserves attributable to equity holders of the Parent
Share capital and share premium 16 103,660 100,962 102,095
Other reserves 17 153,606 168,985 145,289
Retained earnings 357,491 264,091 289,997
614,757 534,038 537,381
Non-controlling interests 7,726 7,567 7,275
Total equity 622,483 541,605 544,656
LIABILITIES
Non-current liabilities
Borrowings 14 517,753 724,228 527,046
Derivative financial instruments - 456 -
Deferred income tax liabilities 82,592 102,258 91,057
Retirement benefit obligations 18 84,888 117,432 98,133
Provisions for other liabilities and charges 15 21,803 22,678 22,013
Capital grants 2,577 16,477 2,636
709,613 983,529 740,885
Current liabilities
Trade and other payables 374,476 406,566 345,423
Current tax liabilities 16,646 9,871 7,430
Borrowings 14 - 1,051 125,086
Derivative financial instruments 2,585 6,788 938
Provisions for other liabilities and charges 15 20,246 22,580 20,750
413,953 446,856 499,627
Total liabilities 1,123,566 1,430,385 1,240,512
Total equity and liabilities 1,746,049 1,971,990 1,785,168

Condensed statement of cash flows for the half year ended 29 June 2013
16 Glanbia plc 2013 half year results
Half year Half year* Year* 2013 2012 2012 Notes €'000 €'000 €'000
Cash flows from operating activities
Cash generated from/(absorbed by) operations 21 17,799 (25,848) 128,817
Interest received 332 1,076 2,814
Interest paid (12,238) (12,358) (24,240)
Tax paid (11,974) (4,346) (26,688)
Interest and tax paid – discontinued operations - (3,279) (7,657)
Net cash (outflow)/inflow from operating activities (6,081) (44,755) 73,046 Cash flows from investing activities
Acquisition of subsidiary, net of cash acquired - - (45,365)
Disposal of Yoplait franchise - 18,000 18,000
Disposal of undertaking and investment in associate - - 25,599
Repayment of intercompany balance - - 125,652
Flax processing facility – insurance proceeds - - 8,132
Payment of deferred consideration on acquisition of subsidiaries - (78) (1,104)
Purchase of property, plant and equipment 13 (37,678) (23,946) (65,893)
Purchase of intangible assets 13 (8,800) (2,400) (4,119)
Dividends received from joint ventures 1,524 2,779 13,778
Loans advanced to joint ventures and associates - - (3,275)
Decrease in available for sale financial assets 1,785 1,627 523
Proceeds from sale of property, plant and equipment 104 289 495
Investing cash flows from discontinued operations - (13,662) (23,964)
Net cash (outflow)/inflow from investing activities (43,065) (17,391) 48,459 Cash flows from financing activities
Proceeds from issue of ordinary shares 16 1,565 - 1,133
Purchase of own shares (4,642) - (7,692)
(Decrease)/increase in borrowings (134,088) 8,410 (44,646)
Dividends paid to Company shareholders 11 (16,009) (14,550) (25,327)
Dividends paid to non-controlling interests - - (300)
Capital grants received - - 1,584
Financing cash flows from discontinued operations - (515) (928)
Net cash (outflow) from financing activities (153,174) (6,655) (76,176) Net (decrease)/increase in cash and cash equivalents (202,320) (68,801) 45,329
Cash and cash equivalents at the beginning of the period 275,572 231,373 231,373
Effects of exchange rate changes on cash and cash equivalents (192) 1,879 (1,130)
Cash and cash equivalents at the end of the period 14 73,060 164,451 275,572
Reconciliation of net cash flow to movement in net debt Half year Half year Year
2013 2012 2012
€'000 €'000 €'000
Net (decrease)/increase in cash and cash equivalents (202,320) (68,801) 45,329
Cash movements from debt financing 134,088 (7,895) 47,869 (68,232) (76,696) 93,198
Fair value movement of interest rate swaps 1,106 2,734 2,850
Exchange translation adjustment on net debt (1,007) (6,535) 7,723 Movement in net debt in the period (68,133) (80,497) 103,771
Net debt at the beginning of the period (376,560) (480,331) (480,331) Net debt at the end of the period (444,693) (560,828) (376,560) Net debt comprises:
Borrowings 14 (517,753) (725,279) (652,132)
Cash and cash equivalents 14 73,060 164,451 275,572 (444,693) (560,828) (376,560)
*As re-presented to reflect the effect of discontinued operations and the adoption of IAS 19 (revised) – Employee Benefits.

Notes to the condensed financial statements for the half year ended 29 June 2013
17 Glanbia plc 2013 half year results
1. General information
Glanbia plc (the “Company”) and its subsidiaries (together the “Group”) is an integrated global nutritionals and large scale
global dairy business with its main operations in Ireland, mainland Europe, the USA, Africa and Asia.
The Company is a public limited company incorporated and domiciled in Ireland. The address of its registered office is
Glanbia House, Kilkenny, Ireland. The Group is controlled by Glanbia Co-operative Society Limited (the “Society”), which
holds 41.3% of the issued share capital of the Company and is the ultimate parent of the Group.
The Company shares are quoted on the Irish and London Stock Exchanges.
2. Basis of preparation
The condensed interim financial statements for the six months ended 29 June 2013 and for the six months ended 30 June
2012 have not been audited by the Group’s auditors. The amounts disclosed for the full year ended 29 December 2012
represent an abbreviated version of the Group’s financial statements for that year, which received an unqualified audit
report. The statutory accounts for the financial year ended 29 December 2012 were approved by the Board of Directors on 12
March 2013 and have been filed with the Companies Registration Office.
The Group’s condensed interim financial statements for the six months ended 29 June 2013 have been prepared in
accordance with the Transparency (Directive 2004/109/EC) Regulations 2007, the related Transparency Rules of the Central
Bank of Ireland and with IAS 34 - Interim Financial Reporting. These condensed interim financial statements do not
constitute statutory accounts within the meaning of section 19 of the Companies (Amendment) Act 1986. The condensed
interim financial statements should be read in conjunction with the financial statements for the year ended 29 December
2012, which have been prepared in accordance with IFRS.
The Group meets its day-to-day working capital requirements through its bank facilities. The Group’s forecasts and
projections, taking account of changes in trading performance, show that the Group expects to be able to operate within the
level of its current facilities. After making enquiries, the Directors have a reasonable expectation that the Group has sufficient
resources to continue in operational existence for the foreseeable future. In forming this view, the Directors have reviewed
the Group’s budget for a period of not less than 12 months, the medium term plans as set out in the three year strategic plan,
and have taken into account the cash flow implications of the plans, including proposed capital expenditure, and compared
these with the Group’s committed borrowing facilities and Group financing key performance indicators (KPIs). The Group
therefore continues to adopt the going concern basis in preparing its condensed interim financial statements for the six
months ended 29 June 2013.
3. Accounting policies
The methods of computation and accounting policies adopted in the preparation of the Group’s condensed interim financial
statements are consistent with those applied in the Annual Report for the year ended 29 December 2012 except for the IFRS’
outlined below. The Group’s accounting policies are set out in the financial statements in the 2012 Annual Report.
The following standards and interpretations, issued by the International Accounting Standards Board (‘IASB’) and the
International Financial Reporting Interpretations Committee (‘IFRIC’), are effective for the Group for the first time in the
current financial period and where relevant have been adopted by the Group:
IAS 19 (revised) - Employee Benefits
IFRS 13 - Fair Value Measurement
With the exception of IAS 19 (revised) - Employee Benefits, adoption of the standards above had no significant impact on the
results or financial position of the Group during the period.
IAS 19 (revised) - Employee Benefits amends the accounting for employment benefits. The Group has applied the standard
retrospectively in accordance with the transition provisions of the standard. The impact on the Group’s result is as follows:
The standard replaces the interest cost on the defined benefit obligation and the expected return on plan assets with a net
interest cost which is calculated based on the net defined benefit liability and the discount rate, measured at the beginning of
the year. There is no change to determining the discount rate; this continues to reflect the yield on high-quality corporate

Notes to the condensed financial statements for the half year ended 29 June 2013
18 Glanbia plc 2013 half year results
bonds. In addition, the government pension levy is now reclassified and recognised in other comprehensive income. The
adoption of IAS 19 (revised) - Employee Benefits has resulted in a decrease in the income statement charge for the six months
ended 30 June 2012 and 12 months ended 29 December 2012. This has no effect on total comprehensive income as the
decreased charge in the income statement is offset by an increase in the charge to the statement of other comprehensive
income.
There is a new term - remeasurements. This is made up of actuarial gains and losses and the difference between investment
returns and the return implied by the net interest cost. Remeasurements are reflected in the statement of other
comprehensive income.
The pension deficit, ‘retirement benefit obligations’ as previously reported on the balance sheet has not changed as a result of
the above.
The effect of the change in accounting policy for the continuing Group on the income statement, basic earnings per share and
adjusted earnings per share at 30 June 2012 is as follows:
As reported * IAS 19 impact Restated
Half year Half year Half year
2012 2012 2012
Earnings before interest, tax and amortisation (€’000) 97,163 590 97,753
Income taxes (€’000) (15,247) (73) (15,320)
Profit for the period pre exceptional (€’000) 67,536 517 68,053
Basic earnings per share (cents per share) 24.65 0.18 24.83
Adjusted earnings per share (cents per share) 27.39 0.19 27.58 *As represented to reflect the effect of discontinued operations
The effect of the change in accounting policy for the continuing Group on the income statement, basic earnings per share and
adjusted earnings per share at 29 December 2012 is as follows:
As reported * IAS 19 impact Restated
Full year Full year Full year
2012 2012 2012
Earnings before interest, tax and amortisation (€’000) 175,842 888 176,730
Income taxes (€’000) (25,500) (111) (25,611)
Profit for the year pre exceptional (€’000) 122,197 777 122,974
Basic earnings per share (cents per share) 42.45 0.26 42.71
Adjusted earnings per share (cents per share) 51.02 0.32 51.34 *As represented to reflect the effect of discontinued operations
The change in accounting policy has no impact on the continuing Group statement of cashflows at period end 30 June 2012 or
year end 29 December 2012.
4. Changes in estimates and assumptions
In preparing these condensed interim financial statements, the significant judgements made by management in applying the
Group’s accounting policies and the key sources of estimation uncertainty were the same as those that applied to the
consolidated financial statements for the year ended 29 December 2012, with the exception of changes in estimates outlined
in note 18 – retirement benefit obligations.

Notes to the condensed financial statements for the half year ended 29 June 2013
19 Glanbia plc 2013 half year results
5. Financial risk management
The Group’s activities expose it to a variety of financial risks: market risk, (including currency risk, interest rate risk, price
risk, liquidity and cash flow risk) and credit risk. The interim condensed financial statements do not include all financial risk
management information and disclosures required in the annual financial statements, and should be read in conjunction with
the Group’s annual financial statements in the 2012 Annual Report.
There have been no changes to the risk management procedures or policies since 2012 year end.
Fair value estimation
The fair value of financial instruments traded in active markets (such as available for sale financial assets) is based on quoted
market prices at the reporting date. The quoted market price used for financial assets held by the Group is the current bid
price.
The fair value of financial instruments that are not traded in an active market (for example, over the counter derivatives) is
determined by using generally accepted valuation techniques. The Group uses a variety of methods and makes assumptions
that are based on market conditions existing at each reporting date.
In accordance with IFRS 7 – Financial Instruments: Disclosures, the Group has disclosed the fair value of instruments by the
following fair value measurement hierarchy:
quoted prices (unadjusted) in active markets for identical assets and liabilities (level 1)
inputs, other than quoted prices included in level 1, that are observable for the asset and liability, either directly
(that is, as prices) or indirectly (that is, derived from prices) (level 2)
inputs for the asset or liability that are not based on observable market data (that is, unobservable inputs) (level 3)
The following table presents the Group’s assets and liabilities that are measured at fair value at 29 June 2013 and 29
December 2012:
Level 1 Level 2 Level 3 Total
29 June 2013 €'000 €'000 €'000 €'000
Assets
Derivatives used for hedging - 2,090 - 2,090
Available for sale financial assets
- equity securities 317 1,133 - 1,450
Total assets 317 3,223 - 3,540
Liabilities
Derivatives used for hedging - (2,585) - (2,585)
Total liabilities - (2,585) - (2,585)
Level 1 Level 2 Level 3 Total
29 December 2012 €'000 €'000 €'000 €'000
Assets
Derivatives used for hedging - 1,457 - 1,457
Available for sale financial assets
- equity securities 224 447 - 671
Total assets 224 1,904 - 2,128
Liabilities
Derivatives used for hedging - (938) - (938)
Total liabilities - (938) - (938)

Notes to the condensed financial statements for the half year ended 29 June 2013
20 Glanbia plc 2013 half year results
Valuation techniques used to derive level 2 fair values
Level 2 trading and hedging derivatives comprise foreign exchange contracts. These foreign exchange contracts have been
fair valued using forward exchange rates that are quoted in an active market. The effects of discounting are generally
insignificant for Level 2 derivatives.
Level 2 debt investments are fair valued using a discounted cash flow approach, which discounts the contractual cash flows
using discount rates derived from observable market prices of other quoted debt instruments of the counterparties. Level 2
equity securities are based on observable quoted prices that are directly available.
Group’s valuation process
The Group’s finance department includes a team that performs the valuations of financial assets required for financial
reporting purposes, including level 3 fair values. The Group did not hold any level 3 financial assets at 29 June 2013, 29
December 2012 or 30 June 2012. This team reports directly to the Group Finance Director who in turn reports to the Audit
Committee. Discussions of valuation processes and results are held between the Group Finance Director and the Audit
Committee.
Changes in level 2 fair values are analysed at each reporting date. As part of this discussion, the valuation team presents a
report that explains the reasons for the fair value movements.

Notes to the condensed financial statements for the half year ended 29 June 2013
21 Glanbia plc 2013 half year results
6. Segment information
During 2013, following an internal financial reporting reorganisation and in accordance with IFRS 8 – Operating Segments,
the Group moved from three to four operating segments. The four segments are as follows: Global Performance Nutrition,
Global Ingredients, Dairy Ireland and Joint Ventures & Associates. These segments align with the Group’s revised internal
financial reporting system and the way in which the Chief Operating Decision Maker now assesses performance and allocates
the Group’s resources. A segment manager is responsible for each segment and is directly accountable for the performance of
that segment to the Glanbia Operating Executive Committee which acts as the Chief Operating Decision Maker for the Group.
Each segment derives its revenues as follows: Global Performance Nutrition earns its revenue from sports nutrition
solutions; Global Ingredients earns its revenue from the manufacture and sale of cheese, whey protein and other customised
solutions; Dairy Ireland earns its revenue from the manufacture and sale of a range of consumer products and farm inputs
and Joint Ventures & Associates revenue arises from the manufacture and sale of cheese, whey proteins and dairy consumer
products. Each segment is reviewed in its totality by the Chief Operating Decision Maker. The Glanbia Operating Executive
Committee assesses the trading performance of operating segments based on a measure of earnings before interest, tax,
amortisation and exceptional items.
Comparatives for the 2012 half year and full year are restated to reflect the revised segments and adoption of IAS 19
(revised) - Employee Benefits.
As outlined in note 8 – exceptional items, the Group sold 60% of Glanbia Ingredients Ireland Limited during 2012. 100% of
the trade and activities of this business are shown below under the Discontinued Operations segment.
Global Performance
Nutrition Global
Ingredients Dairy
Ireland JVs &
Associates
Group including JVs & Associates
Half year 2013 €'000 €'000 €'000 €'000 €'000
Total gross segment revenue (a) 320,202 550,048 383,247 426,797 1,680,294
Inter-segment revenue - (17,148) - - (17,148)
Segment external revenue 320,202 532,900 383,247 426,797 1,663,146
Segment earnings before interest, tax, amortisation and exceptional items (b) 33,606 56,636 12,027 19,907 122,176
Segment assets (c) 562,496 585,989 357,879 154,257 1,660,621
Segment liabilities (d) 111,959 207,975 207,454 - 527,388
Included in external revenue are related party sales between Global Ingredients and Joint Ventures & Associates of €7.5 million and related
party sales between Dairy Ireland and Joint Ventures & Associates of €6.6 million.
6.1(a) Segment revenue is reconciled to reported external revenue as follows:
€'000
Segment revenue 1,680,294
Inter-segment revenue (17,148)
Joint Ventures & Associates revenue (426,797)
Reported external revenue 1,236,349
Notes to the condensed financial statements for the half year ended 29 June 2013
22 Glanbia plc 2013 half year results
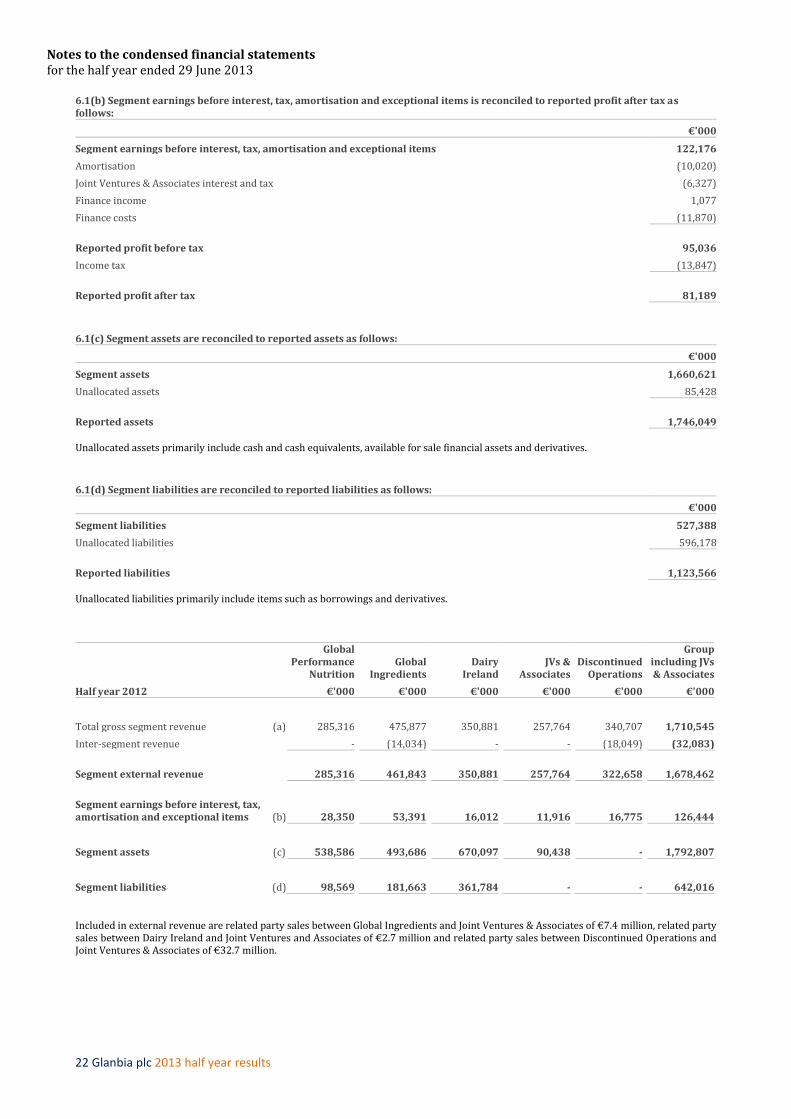
6.1(b) Segment earnings before interest, tax, amortisation and exceptional items is reconciled to reported profit after tax as follows:
€'000
Segment earnings before interest, tax, amortisation and exceptional items 122,176
Amortisation (10,020)
Joint Ventures & Associates interest and tax (6,327)
Finance income 1,077
Finance costs (11,870)
Reported profit before tax 95,036
Income tax (13,847)
Reported profit after tax 81,189
6.1(c) Segment assets are reconciled to reported assets as follows:
€'000
Segment assets 1,660,621
Unallocated assets 85,428
Reported assets 1,746,049
Unallocated assets primarily include cash and cash equivalents, available for sale financial assets and derivatives.
6.1(d) Segment liabilities are reconciled to reported liabilities as follows:
€'000
Segment liabilities 527,388
Unallocated liabilities 596,178
Reported liabilities 1,123,566 Unallocated liabilities primarily include items such as borrowings and derivatives.
Global Performance
Nutrition Global
Ingredients Dairy
Ireland JVs &
Associates Discontinued
Operations
Group including JVs & Associates
Half year 2012 €'000 €'000 €'000 €'000 €'000 €'000
Total gross segment revenue (a) 285,316 475,877 350,881 257,764 340,707 1,710,545
Inter-segment revenue - (14,034) - - (18,049) (32,083)
Segment external revenue 285,316 461,843 350,881 257,764 322,658 1,678,462
Segment earnings before interest, tax, amortisation and exceptional items (b) 28,350 53,391 16,012 11,916 16,775 126,444
Segment assets (c) 538,586 493,686 670,097 90,438 - 1,792,807
Segment liabilities (d) 98,569 181,663 361,784 - - 642,016 Included in external revenue are related party sales between Global Ingredients and Joint Ventures & Associates of €7.4 million, related party sales between Dairy Ireland and Joint Ventures and Associates of €2.7 million and related party sales between Discontinued Operations and Joint Ventures & Associates of €32.7 million.

Notes to the condensed financial statements for the half year ended 29 June 2013
23 Glanbia plc 2013 half year results
6.2(a) Segment revenue is reconciled to reported external revenue as follows:
€'000
Segment revenue 1,710,545
Inter-segment revenue (32,083)
Joint Ventures & Associates revenue (257,764)
Revenue from Discontinued Operations (322,658)
Reported external revenue from continuing operations 1,098,040 6.2(b) Segment earnings before interest, tax, amortisation and exceptional items is reconciled to reported profit after tax as follows:
€'000
Segment earnings before interest, tax, amortisation and exceptional items 126,444
Discontinued Operations – earnings before interest, tax, amortisation and exceptional items (16,775)
Amortisation (9,546)
Exceptional items 4,690
Joint Ventures & Associates interest and tax (5,473)
Finance income 1,791
Finance costs (13,068)
Reported profit before tax from continuing operations 88,063
Tax (14,693)
Reported profit after tax from continuing operations 73,370
6.2(c) Segment assets are reconciled to reported assets as follows:
€'000
Segment assets 1,792,807
Unallocated assets 179,183
Reported assets 1,971,990 Unallocated assets primarily include cash and cash equivalents, available for sale financial assets and derivatives.
6.2(d) Segment liabilities are reconciled to reported liabilities as follows:
€'000
Segment liabilities 642,016
Unallocated liabilities 788,369
Reported liabilities 1,430,385 Unallocated liabilities primarily include items such as borrowings and derivatives.
Notes to the condensed financial statements for the half year ended 29 June 2013
24 Glanbia plc 2013 half year results
Global Performance
Nutrition Global
Ingredients Dairy
Ireland JVs &
Associates Discontinued
Operations
Group including JVs & Associates
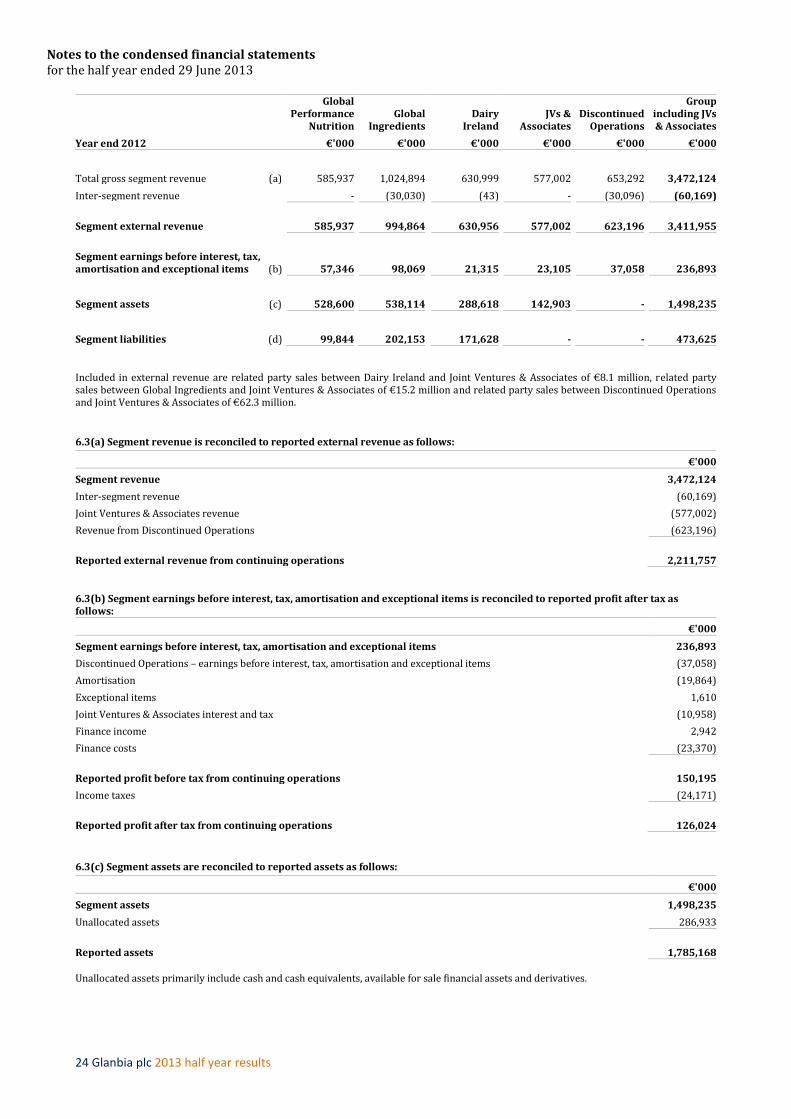
Year end 2012 €'000 €'000 €'000 €'000 €'000 €'000
Total gross segment revenue (a) 585,937 1,024,894 630,999 577,002 653,292 3,472,124
Inter-segment revenue - (30,030) (43) - (30,096) (60,169)
Segment external revenue 585,937 994,864 630,956 577,002 623,196 3,411,955
Segment earnings before interest, tax, amortisation and exceptional items (b) 57,346 98,069 21,315 23,105 37,058 236,893
Segment assets (c) 528,600 538,114 288,618 142,903 - 1,498,235
Segment liabilities (d) 99,844 202,153 171,628 - - 473,625 Included in external revenue are related party sales between Dairy Ireland and Joint Ventures & Associates of €8.1 million, related party sales between Global Ingredients and Joint Ventures & Associates of €15.2 million and related party sales between Discontinued Operations and Joint Ventures & Associates of €62.3 million.
6.3(a) Segment revenue is reconciled to reported external revenue as follows:
€'000
Segment revenue 3,472,124
Inter-segment revenue (60,169)
Joint Ventures & Associates revenue (577,002)
Revenue from Discontinued Operations (623,196)
Reported external revenue from continuing operations 2,211,757 6.3(b) Segment earnings before interest, tax, amortisation and exceptional items is reconciled to reported profit after tax as follows:
€'000
Segment earnings before interest, tax, amortisation and exceptional items 236,893
Discontinued Operations – earnings before interest, tax, amortisation and exceptional items (37,058)
Amortisation (19,864)
Exceptional items 1,610
Joint Ventures & Associates interest and tax (10,958)
Finance income 2,942
Finance costs (23,370)
Reported profit before tax from continuing operations 150,195
Income taxes (24,171)
Reported profit after tax from continuing operations 126,024
6.3(c) Segment assets are reconciled to reported assets as follows:
€'000
Segment assets 1,498,235
Unallocated assets 286,933
Reported assets 1,785,168 Unallocated assets primarily include cash and cash equivalents, available for sale financial assets and derivatives.

Notes to the condensed financial statements for the half year ended 29 June 2013
25 Glanbia plc 2013 half year results
6.3(d) Segment liabilities are reconciled to reported liabilities as follows:
€'000
Segment liabilities 473,625
Unallocated liabilities 766,887
Reported liabilities 1,240,512 Unallocated liabilities primarily include items such as borrowings and derivatives.
7. Seasonality Elements of the business, particularly within the Dairy Ireland segment reflect the seasonal nature of the Irish agricultural industry. This seasonality was one of the main factors driving the increase in working capital in the period of €96.0 million (HY 2012: €135.2 million)
8. Exceptional items
Half year Half year Year
2013 2012 2012
Notes €'000 €'000 €'000
Exceptional items - continuing operations
Sale of Yoplait franchise (a) - 4,690 6,109
Rationalisation costs (b) - - (3,810)
Flax processing facility (c) - - 4,401
Property write down (d) - - (5,090)
Total exceptional credit before tax - 4,690 1,610
Exceptional tax credit - 627 1,440
Net exceptional credit - 5,317 3,050
Exceptional items - discontinued operations
Glanbia Ingredients Ireland Limited - 60% disposal (e) - - (8,095)
Total exceptional (charge) - discontinued operations - - (8,095)
Exceptional tax credit - discontinued operations - - 334
Net exceptional (charge) - discontinued operations - - (7,761)
Total exceptional (charge) - - (4,711)
(a) During 2012, following a strategic review of its Consumer Products business the Group agreed new terms to its
relationship with Yoplait, the owner of the global Yoplait yogurt business. Under the new agreement, Yoplait
reacquired the franchise for Ireland from Glanbia plc for €18.0 million. This gain was offset by a related write down
in property, plant and equipment and rationalisation costs totalling €11.9 million (€5.7 million of which was a non
cash cost).
(b) During 2012, rationalisation costs primarily relate to redundancy in the Dairy Ireland segment.
(c) During 2012, the flax processing facility operated by the Group in Canada suffered fire damage. The exceptional
gain of €4.4 million reflected the minimum insurance proceeds receivable less the net book value of assets written
down.
(d) The Group reviewed its property portfolio during 2012 which resulted in a write down of €5.1 million.
(e) In November 2012, the Group reached an agreement with Glanbia Co-operative Society Limited (the “Society”)
whereby the Society acquired a 60% interest in the Dairy Ingredients business, Glanbia Ingredients Ireland Limited.
With effect from 25 November 2012, the Group’s 40% shareholding in Glanbia Ingredients Ireland Limited has been
treated as an associate undertaking and accounted for using the equity method in accordance with IAS 28 -

Notes to the condensed financial statements for the half year ended 29 June 2013
26 Glanbia plc 2013 half year results
Investment in Associates. In accordance with IFRS 5 - Non Current Assets Held for Sale and Discontinued
Operations, the disposal of the Group’s interest is considered to be a discontinued operation. In line with IFRS 5, a
loss on disposal of €8.1 million was recognised in the income statement. This includes the recycle of €1.0 million
cumulative foreign currency translation gains which were previously recognised in equity. The loss on this
transaction arose as follows:
Discontinued operations
11 months
2012
€'000
100% disposal of Glanbia Ingredients Ireland Limited (84,470)
40% equity interest retained in Glanbia Ingredients Ireland Limited 33,788
Total cash consideration received in respect of 60% disposal 49,289
Disposal related costs (5,026)
Currency translation gain previously recognised in equity 1,001
(5,418)
Discontinued finance costs - cancellation of interest rate swaps (2,677)
Exceptional loss (8,095)
The revenue and results of 100% of the Group’s discontinued operations for the six months to 30 June 2012 and eleven months to 24 November 2012 are as follows:
Half year 11 months
2012 2012
€'000 €'000
Revenue 322,658 623,196
Expenses (306,187) (586,627)
Operating profit 16,471 36,569
Net finance costs (2,103) (5,100)
Profit before taxation 14,368 31,469
Income taxes (1,982) (4,336)
Profit for the period from discontinued operations 12,386 27,133
The cash flows of the Group’s discontinued operations for the six months to 30 June 2012 and eleven months to 24 November 2012 are as follows:
Half year 11 months
2012 2012
€'000 €'000
Operating cash flows
Profit before taxation 14,368 31,469
Depreciation 5,968 10,960
Amortisation 306 489
Interest expense 2,103 5,100
Amortisation of government grants received (564) (1,031) Cash generated from discontinued operations before changes in working capital 22,181 46,987
Increase in working capital (15,651) (42,889) Operating cash flows generated from discontinued operations 6,530 4,098

Notes to the condensed financial statements for the half year ended 29 June 2013
27 Glanbia plc 2013 half year results
Half year 11 months
2012 2012
€'000 €'000
Operating cash flows generated from discontinued operations
Cash generated from operating activities 6,530 4,098
Interest paid* (2,103) (5,100)
Tax paid* (1,176) (2,557)
Operating net cash inflow/(outflow) from discontinued operations 3,251 (3,559)
Cash flows from investing activities
Purchase of property, plant and equipment (13,662) (23,964)
Investing cash (outflow) from discontinued operations (13,662) (23,964)
Cash flows from financing activities
Finance lease principal payments (515) (928)
Financing cash (outflow) from discontinued operations (515) (928)
Cash (absorbed) at the end of the six/eleven month period (10,926) (28,451) *Estimated allocation of the Group’s interest and tax costs to discontinued operations
9. Finance income and costs
Half year Half year Year
2013 2012 2012
€'000 €'000 €'000
Finance income
Interest income 1,077 1,762 2,913
Interest income on deferred consideration - 29 29
Total finance income 1,077 1,791 2,942
Finance costs
- Bank borrowings repayable within five years (3,982) (5,112) (9,434)
- UK pension provision (58) (60) (121)
- Finance lease costs - (72) (131)
- Interest rate swaps, transfer from equity - (896) (1,059)
- Interest rate swaps, fair value hedges - 1,093 1,764
- Fair value adjustment to borrowings attributable to interest rate risk - (1,093) (1,764)
- Finance cost of private debt placement (6,492) (6,857) (13,376)
- Finance cost of preference shares (1,338) (2,174) (4,349)
Total finance costs (11,870) (15,171) (28,470)
Net finance costs (10,793) (13,380) (25,528)
From continuing operations (10,793) (11,277) (20,428)
From discontinued operations - (2,103) (5,100)

Notes to the condensed financial statements for the half year ended 29 June 2013
28 Glanbia plc 2013 half year results
10. Income taxes
The Group’s income tax charge of €13.8 million (HY 2012: €14.7 million) has been prepared based on the Group’s
best estimate of the weighted average tax rate that is expected for the full financial year.
11. Dividends
A final dividend in respect of the year ended 29 December 2012 of 5.43 cents per share was paid during the period.
On 20 August 2013, the Directors declared the payment of an interim dividend for 2013 of 4.03 cents per share (2012
interim dividend: 3.66 cents per share). The interim dividend will be reflected in the financial statements for the full
year 2013 in line with IAS 10 - Events After the Reporting Period.
Notes to the condensed financial statements for the half year ended 29 June 2013
29 Glanbia plc 2013 half year results
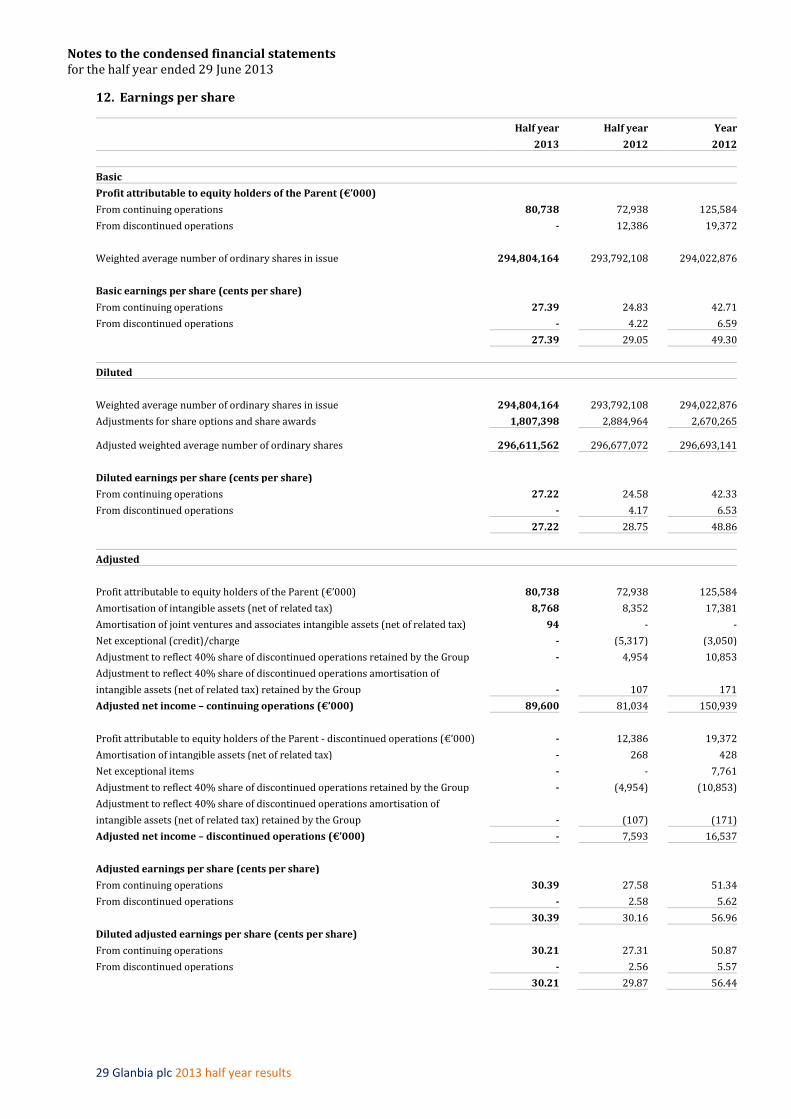
12. Earnings per share
Half year Half year Year
2013 2012 2012
Basic
Profit attributable to equity holders of the Parent (€’000)
From continuing operations 80,738 72,938 125,584
From discontinued operations - 12,386 19,372
Weighted average number of ordinary shares in issue 294,804,164 293,792,108 294,022,876
Basic earnings per share (cents per share)
From continuing operations 27.39 24.83 42.71
From discontinued operations - 4.22 6.59
27.39 29.05 49.30
Diluted
Weighted average number of ordinary shares in issue 294,804,164 293,792,108 294,022,876
Adjustments for share options and share awards 1,807,398 2,884,964 2,670,265 Adjusted weighted average number of ordinary shares 296,611,562 296,677,072 296,693,141
Diluted earnings per share (cents per share)
From continuing operations 27.22 24.58 42.33
From discontinued operations - 4.17 6.53
27.22 28.75 48.86
Adjusted
Profit attributable to equity holders of the Parent (€’000) 80,738 72,938 125,584
Amortisation of intangible assets (net of related tax) 8,768 8,352 17,381
Amortisation of joint ventures and associates intangible assets (net of related tax) 94 - -
Net exceptional (credit)/charge - (5,317) (3,050)
Adjustment to reflect 40% share of discontinued operations retained by the Group - 4,954 10,853
Adjustment to reflect 40% share of discontinued operations amortisation of
intangible assets (net of related tax) retained by the Group - 107 171
Adjusted net income – continuing operations (€’000) 89,600 81,034 150,939
Profit attributable to equity holders of the Parent - discontinued operations (€’000) - 12,386 19,372
Amortisation of intangible assets (net of related tax) - 268 428
Net exceptional items - - 7,761
Adjustment to reflect 40% share of discontinued operations retained by the Group - (4,954) (10,853)
Adjustment to reflect 40% share of discontinued operations amortisation of
intangible assets (net of related tax) retained by the Group - (107) (171)
Adjusted net income – discontinued operations (€’000) - 7,593 16,537
Adjusted earnings per share (cents per share)
From continuing operations 30.39 27.58 51.34
From discontinued operations - 2.58 5.62
30.39 30.16 56.96
Diluted adjusted earnings per share (cents per share)
From continuing operations 30.21 27.31 50.87
From discontinued operations - 2.56 5.57
30.21 29.87 56.44
Notes to the condensed financial statements for the half year ended 29 June 2013
30 Glanbia plc 2013 half year results
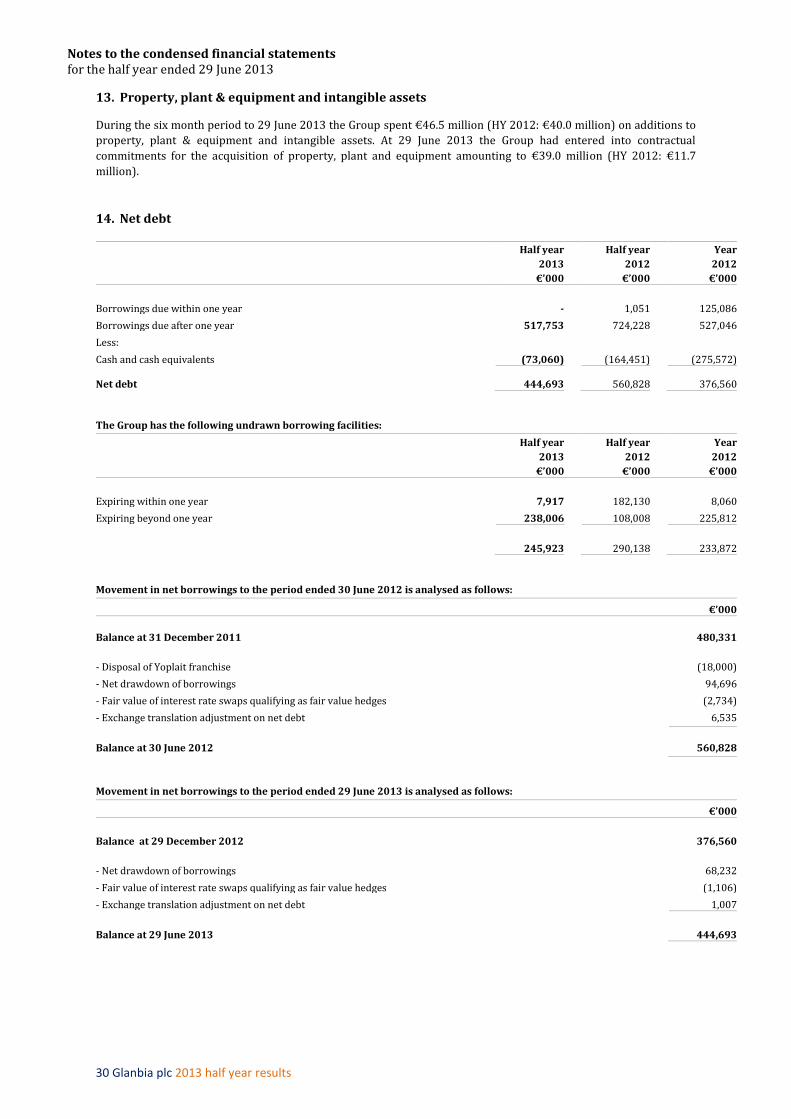
13. Property, plant & equipment and intangible assets
During the six month period to 29 June 2013 the Group spent €46.5 million (HY 2012: €40.0 million) on additions to
property, plant & equipment and intangible assets. At 29 June 2013 the Group had entered into contractual
commitments for the acquisition of property, plant and equipment amounting to €39.0 million (HY 2012: €11.7
million).
14. Net debt
Half year Half year Year
2013 2012 2012
€’000 €’000 €’000
Borrowings due within one year - 1,051 125,086
Borrowings due after one year 517,753 724,228 527,046
Less:
Cash and cash equivalents (73,060) (164,451) (275,572) Net debt 444,693 560,828 376,560
The Group has the following undrawn borrowing facilities:
Half year Half year Year
2013 2012 2012
€’000 €’000 €’000
Expiring within one year 7,917 182,130 8,060
Expiring beyond one year 238,006 108,008 225,812
245,923 290,138 233,872
Movement in net borrowings to the period ended 30 June 2012 is analysed as follows:
€’000
Balance at 31 December 2011 480,331
- Disposal of Yoplait franchise (18,000)
- Net drawdown of borrowings 94,696
- Fair value of interest rate swaps qualifying as fair value hedges (2,734)
- Exchange translation adjustment on net debt 6,535
Balance at 30 June 2012 560,828
Movement in net borrowings to the period ended 29 June 2013 is analysed as follows:
€’000
Balance at 29 December 2012 376,560
- Net drawdown of borrowings 68,232
- Fair value of interest rate swaps qualifying as fair value hedges (1,106)
- Exchange translation adjustment on net debt 1,007
Balance at 29 June 2013 444,693

Notes to the condensed financial statements for the half year ended 29 June 2013
31 Glanbia plc 2013 half year results
15. Provisions for other liabilities and charges
Restructuring UK pension Legal claims
Property & lease
commitments Operational Total
€'000 €'000 €'000 €'000 €'000 €'000
note (a) note (b) note (c) note (d) note (e)
At 29 December 2012 10,021 18,555 4,951 1,559 7,677 42,763
Provided in the period - - 1,147 - 1,541 2,688
Utilised in the period (1,945) (246) (390) (50) - (2,631)
Exchange differences - (869) 26 (15) 28 (830)
Unwinding of discounts - 59 - - - 59
At 29 June 2013 8,076 17,499 5,734 1,494 9,246 42,049
Non-current - 16,554 - 1,262 3,987 21,803
Current 8,076 945 5,734 232 5,259 20,246
8,076 17,499 5,734 1,494 9,246 42,049
(a) The restructuring provision relates to the rationalisation programme that the Group is currently undertaking. The provision, which
relates mainly to termination payments is expected to be fully utilised within the year.
(b) The UK pension provision relates to administration and certain costs associated with pension schemes attached to businesses
disposed of in prior years. This provision is expected to be fully utilised over the next 30 years.
(c) The legal claims provision relates to legal claims brought against the Group. The amounts provided for in the year are recognised
in the income statement within administrative expenses. The balance at 29 June 2013 is expected to be utilised within the next
year. In the opinion of the Directors, after taking appropriate legal advice, the outcome of these legal claims will not give rise to any
significant loss beyond the amounts provided for at 29 June 2013.
(d) The property and lease commitments provision relates to onerous leases in respect of two properties where the Group has a
present and future obligation to make lease payments. It is expected that €0.2 million will be utilised within the next year and the
balance will be fully utilised over the next 4 years.
(e) It is expected that €5.3 million of this operational provision will be utilised within the next year. Due to the nature of these items,
there is some uncertainty around the amount and timing of payments.
16. Share capital and share premium
Number of
shares Ordinary
shares Share
premium Total
Half year 2012 (thousands) €'000 €'000 €'000
At 31 December 2011 and at 30 June 2012 294,533 17,672 83,290 100,962
Number of
shares Ordinary
shares Share
premium Total
Half year 2013 (thousands) €'000 €'000 €'000
At 29 December 2012 294,956 17,697 84,398 102,095
Shares issued 600 36 1,529 1,565
At 29 June 2013 295,556 17,733 85,927 103,660
During the period ended 29 June 2013 600,000 of the 2002 Long Term Incentive Plan (‘the 2002 LTIP’) shares were exercised
with exercise proceeds of €1.6 million. The related weighted average exercise price was €2.60 per share.
The total authorised number of ordinary shares is 306 million shares (HY 2012: 306 million shares) with a par value of €0.06
per share (HY 2012: €0.06 per share). All issued shares are fully paid.
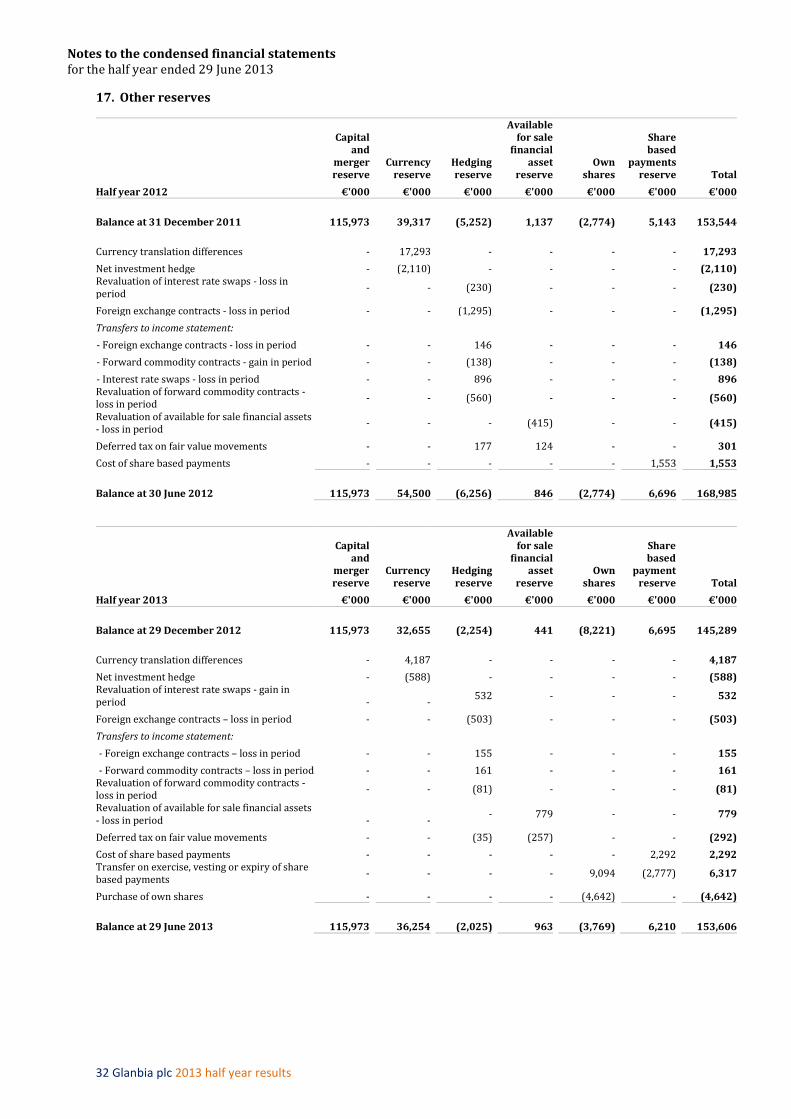
Notes to the condensed financial statements for the half year ended 29 June 2013
32 Glanbia plc 2013 half year results
17. Other reserves
Capital and
merger reserve
Currency reserve
Hedging reserve
Available for sale
financial asset
reserve Own
shares
Share based
payments reserve Total
Half year 2012 €'000 €'000 €'000 €'000 €'000 €'000 €'000
Balance at 31 December 2011 115,973 39,317 (5,252) 1,137 (2,774) 5,143 153,544
Currency translation differences - 17,293 - - - - 17,293
Net investment hedge - (2,110) - - - - (2,110) Revaluation of interest rate swaps - loss in period
- - (230) - - - (230)
Foreign exchange contracts - loss in period - - (1,295) - - - (1,295)
Transfers to income statement:
- Foreign exchange contracts - loss in period - - 146 - - - 146
- Forward commodity contracts - gain in period - - (138) - - - (138)
- Interest rate swaps - loss in period - - 896 - - - 896 Revaluation of forward commodity contracts - loss in period
- - (560) - - - (560)
Revaluation of available for sale financial assets - loss in period
- - - (415) - - (415)
Deferred tax on fair value movements - - 177 124 - - 301
Cost of share based payments - - - - - 1,553 1,553
Balance at 30 June 2012 115,973 54,500 (6,256) 846 (2,774) 6,696 168,985
Capital and
merger reserve
Currency reserve
Hedging reserve
Available for sale
financial asset
reserve Own
shares
Share based
payment reserve Total
Half year 2013 €'000 €'000 €'000 €'000 €'000 €'000 €'000
Balance at 29 December 2012 115,973 32,655 (2,254) 441 (8,221) 6,695 145,289
Currency translation differences - 4,187 - - - - 4,187
Net investment hedge - (588) - - - - (588) Revaluation of interest rate swaps - gain in period
-
- 532 - - - 532
Foreign exchange contracts – loss in period - - (503) - - - (503)
Transfers to income statement:
- Foreign exchange contracts – loss in period - - 155 - - - 155
- Forward commodity contracts – loss in period - - 161 - - - 161 Revaluation of forward commodity contracts - loss in period
- - (81) - - - (81)
Revaluation of available for sale financial assets - loss in period
-
- - 779 - - 779
Deferred tax on fair value movements - - (35) (257) - - (292)
Cost of share based payments - - - - - 2,292 2,292 Transfer on exercise, vesting or expiry of share based payments
- - - - 9,094 (2,777) 6,317
Purchase of own shares - - - - (4,642) - (4,642)
Balance at 29 June 2013 115,973 36,254 (2,025) 963 (3,769) 6,210 153,606
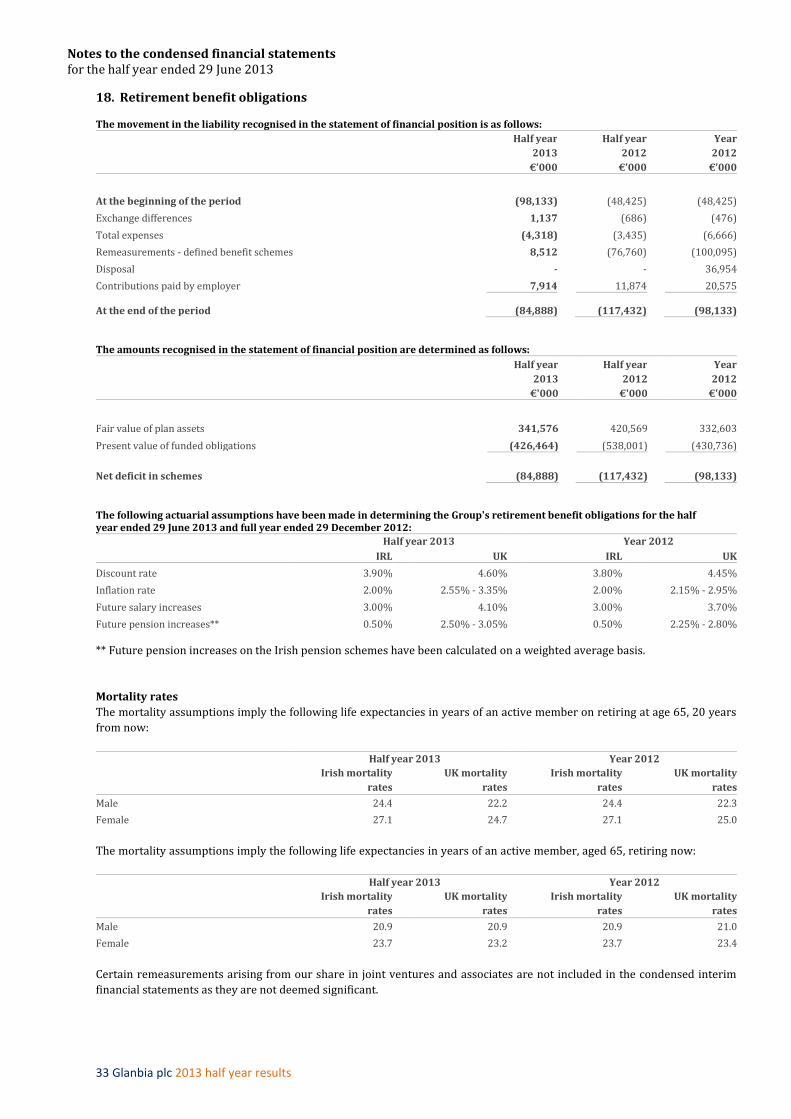
Notes to the condensed financial statements for the half year ended 29 June 2013
33 Glanbia plc 2013 half year results
18. Retirement benefit obligations
The movement in the liability recognised in the statement of financial position is as follows:
Half year Half year Year
2013 2012 2012
€’000 €’000 €’000
At the beginning of the period (98,133) (48,425) (48,425)
Exchange differences 1,137 (686) (476)
Total expenses (4,318) (3,435) (6,666)
Remeasurements - defined benefit schemes 8,512 (76,760) (100,095)
Disposal - - 36,954
Contributions paid by employer 7,914 11,874 20,575 At the end of the period (84,888) (117,432) (98,133)
The amounts recognised in the statement of financial position are determined as follows:
Half year Half year Year
2013 2012 2012
€'000 €'000 €'000
Fair value of plan assets 341,576 420,569 332,603
Present value of funded obligations (426,464) (538,001) (430,736)
Net deficit in schemes (84,888) (117,432) (98,133)
The following actuarial assumptions have been made in determining the Group's retirement benefit obligations for the half year ended 29 June 2013 and full year ended 29 December 2012:
Half year 2013 Year 2012
IRL UK IRL UK
Discount rate 3.90% 4.60% 3.80% 4.45%
Inflation rate 2.00% 2.55% - 3.35% 2.00% 2.15% - 2.95%
Future salary increases 3.00% 4.10% 3.00% 3.70%
Future pension increases** 0.50% 2.50% - 3.05% 0.50% 2.25% - 2.80%
** Future pension increases on the Irish pension schemes have been calculated on a weighted average basis.
Mortality rates
The mortality assumptions imply the following life expectancies in years of an active member on retiring at age 65, 20 years
from now:
Half year 2013 Year 2012
Irish mortality UK mortality Irish mortality UK mortality
rates rates rates rates
Male 24.4 22.2 24.4 22.3
Female 27.1 24.7 27.1 25.0
The mortality assumptions imply the following life expectancies in years of an active member, aged 65, retiring now:
Half year 2013 Year 2012
Irish mortality UK mortality Irish mortality UK mortality
rates rates rates rates
Male 20.9 20.9 20.9 21.0
Female 23.7 23.2 23.7 23.4
Certain remeasurements arising from our share in joint ventures and associates are not included in the condensed interim
financial statements as they are not deemed significant.

Notes to the condensed financial statements for the half year ended 29 June 2013
34 Glanbia plc 2013 half year results
19. Related party transactions
The Group is controlled by Glanbia Co-Operative Society Limited (the “Society") which holds 41.3% of the issued
share capital of Glanbia plc (the “Company”) and is the ultimate parent of the Group.
During the six months to 29 June 2013, sales to related parties amounted to €16.1 million (HY 2012: €44.0 million),
purchases from related parties amounted to €68.9 million (HY 2012: €10.4 million) and net balances owed to related
parties were €24.7 million (HY 2012: €4.5 million). The related party transactions relate primarily to trading
between the Group, Southwest Cheese Company, LLC, Glanbia Ingredients Ireland Limited, Milk Ventures (UK)
Limited and the Society.
In the opinion of the Directors, there have been no related party transactions, or changes therein, since the year
ended 29 December 2012, that have materially affected the Group’s financial position or performance during the six
months ended 29 June 2013.
20. Contingent liabilities
Group bank guarantees amounting to €2.1 million (HY 2012: €2.5 million) are outstanding at 29 June 2013, mainly in
respect of the payment of EU subsidies. The Group does not expect any material loss to arise from these guarantees.
21. Cash generated from operations
Half year Half year* Year*
2013 2012 2012
€'000 €'000 €'000
Profit before taxation – continuing operations 95,036 88,063 150,195
Development costs capitalised - - (4,339)
Write-off of intangibles - - 3,996
Non-cash exceptional (gain) - - (1,610)
Exceptional (credit) - (4,690) -
Share of results of Joint Ventures & Associates (13,580) (6,443) (12,147)
Depreciation 13,108 12,098 25,012
Amortisation 10,020 9,546 19,864
Cost of share based payments 2,292 1,553 3,209
Difference between pension charge and cash contributions (3,596) (8,439) (13,909)
(Profit) on disposal of property, plant and equipment (102) (30) (146)
Interest income (1,077) (1,791) (2,942)
Interest expense 11,870 13,068 23,370
Amortisation of government grants received (110) (126) (247)
Cash generated from continuing operations before changes in working capital 113,861 102,809 190,306
Changes in net working capital:
- Decrease/(increase) in inventory 862 (15,323) (54,341)
- (Increase) in short term receivables (124,567) (104,656) (93,078)
- Increase/(decrease) in short term liabilities 29,496 (14,051) 87,752
- (Decrease) in provisions (1,853) (1,157) (5,920)
Cash generated from/(absorbed by) continuing operations 17,799 (32,378) 124,719
Cash generated from discontinued operations - 6,530 4,098
Total cash generated from/(absorbed by) all operations 17,799 (25,848) 128,817
*As re-presented to reflect the effect of discontinued operations and the adoption of IAS 19 (revised) – Employee Benefits.

Notes to the condensed financial statements for the half year ended 29 June 2013
35 Glanbia plc 2013 half year results
22. Events after the reporting period
There have been no material events subsequent to the end of the interim period 29 June 2013 which require
disclosure in this report.
23. Information
Copies of this half yearly financial report are available for download from the Group’s website at www.glanbia.com.