Embed Size (px)
Citation preview

Rhode Island
Renewable Energy Standard (RES)
Annual RES Compliance Report
For Compliance Year 2013
February 2015
Rhode Island Public Utilities Commission
89 Jefferson Boulevard
Warwick, Rhode Island 02888
i
Table of Contents Executive Summary ...........................................................................................................................................1 I. Introduction to the Renewable Energy Standard ...........................................................................................5 II. Compliance Year 2013: Obligation and Sources of Compliance ................................................................7 III. 2013 RES Compliance by Fuel Type and Geographic Location ..............................................................12 IV. Renewable Energy Standard – Future Obligations ...................................................................................16 V. Authorized Rate Increases and RES Compliance Costs ............................................................................18 VI. Renewable Energy Standard Implementation in New England ...............................................................21 VII. Conclusion ...............................................................................................................................................28 Appendix 1: Certified New Renewable Energy Resources .............................................................................29 Appendix 2: Certified Existing Renewable Energy Resources .......................................................................32 Appendix 3: Alternative Compliance Payments ..............................................................................................33 Appendix 4: Rhode Island RES 2013 Compliance Summary .........................................................................34 Appendix 5: Historical Breakdown of Compliance Sources ...........................................................................35 Appendix 6: Voluntary Clean Energy Programs .............................................................................................40 Table 1: Composition of 2013 REC Compliance ............................................................................................. 1 Table 2: Estimated Rate Impact for 2012 RES Compliance ............................................................................. 3 Table 3: Summary of National Grid's 2013 REC Compliance Costs ............................................................... 4 Table 4: RES Targets, by compliance year, for both new and existing resources ............................................ 5 Table 5: Obligated Entities Submitting 2013 REC Compliance Filings to the PUC........................................ 7 Table 6: Summary of 2013 REC Compliance ................................................................................................ 10 Table 7: Forecast of RES MWh, by compliance year, for both New and Existing resources ........................ 17 Table 8: Authorized Rate and Renewable Energy Charge Billings ................................................................ 18 Table 9: National Grid's RES Compliance Costs, 2007 - 2013 ...................................................................... 19 Table 10: Summary of New England States' New Renewable RPS Targets (%) ........................................... 25 Table 11: Projection of New England States' New Renewable RPS Demand (GWh) ................................... 25 Figure 1: Distribution of Sources for Compliance with 2013 New RES Obligations ...................................... 8 Figure 2: Distribution of Sources for Compliance with 2013 Existing RES Obligations ................................ 9 Figure 3: Total Annual Alternative Compliance Payments ............................................................................ 11 Figure 4: Distribution of Settled 2013 New RES Certificates by Fuel Type .................................................. 12 Figure 5: Distribution of Settled 2013 New RES Certificates by State and Fuel Type .................................. 13 Figure 6: REC Source vs. Compliance Year .................................................................................................. 14 Figure 7: Distribution of Settled 2013 Existing RES Certificates by State .................................................... 15 Figure 8: Cost Rate of RES Compliance to National Grid Energy Supply Customers .................................. 20 Figure 9: Forecast of New England States' New RES Obligations ................................................................ 26 Figure 10: 2013 Composition of Aggregate RES Demand in New England ................................................. 26 Figure 11: Projection of 2017 Composition of Aggregate RES Demand in New England ............................ 27
1
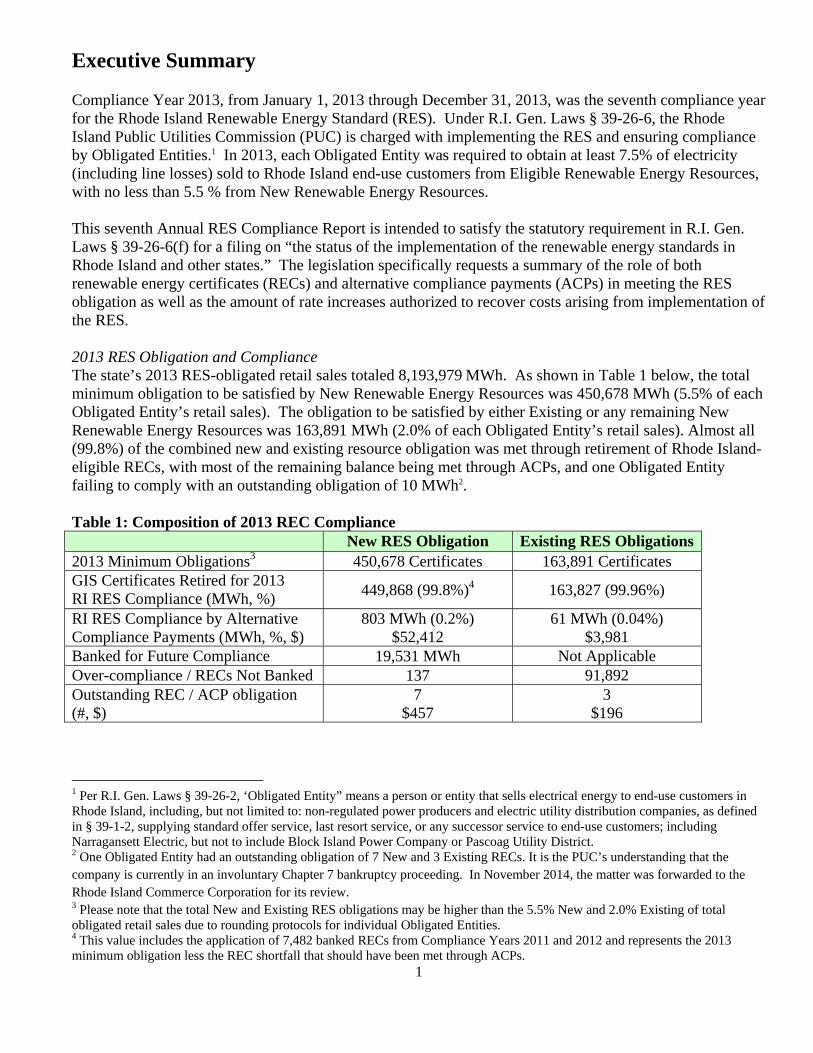
Executive Summary Compliance Year 2013, from January 1, 2013 through December 31, 2013, was the seventh compliance year for the Rhode Island Renewable Energy Standard (RES). Under R.I. Gen. Laws § 39-26-6, the Rhode Island Public Utilities Commission (PUC) is charged with implementing the RES and ensuring compliance by Obligated Entities.1 In 2013, each Obligated Entity was required to obtain at least 7.5% of electricity (including line losses) sold to Rhode Island end-use customers from Eligible Renewable Energy Resources, with no less than 5.5 % from New Renewable Energy Resources. This seventh Annual RES Compliance Report is intended to satisfy the statutory requirement in R.I. Gen. Laws § 39-26-6(f) for a filing on “the status of the implementation of the renewable energy standards in Rhode Island and other states.” The legislation specifically requests a summary of the role of both renewable energy certificates (RECs) and alternative compliance payments (ACPs) in meeting the RES obligation as well as the amount of rate increases authorized to recover costs arising from implementation of the RES. 2013 RES Obligation and Compliance The state’s 2013 RES-obligated retail sales totaled 8,193,979 MWh. As shown in Table 1 below, the total minimum obligation to be satisfied by New Renewable Energy Resources was 450,678 MWh (5.5% of each Obligated Entity’s retail sales). The obligation to be satisfied by either Existing or any remaining New Renewable Energy Resources was 163,891 MWh (2.0% of each Obligated Entity’s retail sales). Almost all (99.8%) of the combined new and existing resource obligation was met through retirement of Rhode Island-eligible RECs, with most of the remaining balance being met through ACPs, and one Obligated Entity failing to comply with an outstanding obligation of 10 MWh2. Table 1: Composition of 2013 REC Compliance New RES Obligation Existing RES Obligations2013 Minimum Obligations3 450,678 Certificates 163,891 Certificates GIS Certificates Retired for 2013 RI RES Compliance (MWh, %) 449,868 (99.8%)4 163,827 (99.96%)
RI RES Compliance by Alternative Compliance Payments (MWh, %, $)
803 MWh (0.2%) $52,412
61 MWh (0.04%) $3,981
Banked for Future Compliance 19,531 MWh Not Applicable Over-compliance / RECs Not Banked 137 91,892 Outstanding REC / ACP obligation (#, $)
7 $457
3 $196
1 Per R.I. Gen. Laws § 39-26-2, ‘Obligated Entity” means a person or entity that sells electrical energy to end-use customers in Rhode Island, including, but not limited to: non-regulated power producers and electric utility distribution companies, as defined in § 39-1-2, supplying standard offer service, last resort service, or any successor service to end-use customers; including Narragansett Electric, but not to include Block Island Power Company or Pascoag Utility District. 2 One Obligated Entity had an outstanding obligation of 7 New and 3 Existing RECs. It is the PUC’s understanding that the company is currently in an involuntary Chapter 7 bankruptcy proceeding. In November 2014, the matter was forwarded to the Rhode Island Commerce Corporation for its review. 3 Please note that the total New and Existing RES obligations may be higher than the 5.5% New and 2.0% Existing of total obligated retail sales due to rounding protocols for individual Obligated Entities. 4 This value includes the application of 7,482 banked RECs from Compliance Years 2011 and 2012 and represents the 2013 minimum obligation less the REC shortfall that should have been met through ACPs.

2
In 2013, New England Power Pool Generation Information System Certificates (NEPOOL GIS Certificates), also referred to more generally as RECs5, were used to meet more than 99% of Rhode Island’s New RES obligation. The total number of New RECs procured by Obligated Entities was 469,743 6, including 7,482 Certificates banked from 2011 or 2012. This represented a 4.3% surplus compared to the state’s 2013 New RES obligation for all Obligated Entities. This surplus marks a change in REC market conditions from last compliance year (2012), when there was a 6.1% deficit between New RECs procured for compliance and the 2012 RES obligation. An even greater deficit of 26.3% existed in Compliance Year 2011. This change in the Rhode Island New REC market conditions, from a deficit to a surplus, reflects an increase in regional renewable energy supply through the construction of additional capacity, the retrofit of existing resources for RPS compliance in other regional RPS markets, and a significant increase in the quantity of RES-eligible imports during this period. While Compliance Year 2013 did not appear to face the New REC shortage conditions felt in 2011 and 2012, the cost that the Narragansett Electric Company d/b/a National Grid (National Grid) incurred while procuring RECs has increased significantly, for a third year in a row. More information on compliance costs can be viewed below in Tables 2 and 3 and in Section V of this report. The remaining New RES obligation (810 MWh) was met through approximately $52,411.81 in ACPs, with one Obligated Entity leaving an outstanding obligation of 7 New RECs. An additional 19,531 New RECs were retired by Obligated Entities and banked for Rhode Island compliance in either Compliance Year 2014 or 2015. Also as shown in Table 1, Existing RECs retired by Obligated Entities to meet Rhode Island’s Existing 2013 renewable energy supply requirements totaled 163,827 MWh. This represents nearly 100% of the state’s 2013 Existing RES obligations (163,891). The remaining Existing RES obligation (64 MWh) was met through $3,981.47 in ACPs, with one Obligated Entity having an outstanding obligation of 3 Existing RECs. After meeting their respective obligations, Obligated Entities also combined to procure an excess of 91,892 RECs above the 2013 Existing RES requirement, a 56.1% surplus. Banking of Existing RECs is not allowed under Rhode Island’s Renewable Energy Standard Rules and Regulations. A total of 864 MWh of the 2013 obligations, including New and Existing, were met through ACPs. Compared to Compliance Year 2012, this marks a major decrease in the obligations met through ACP by nearly 34,333 MWh (98%). At the 2013 rate of $65.27 per MWh of compliance, these ACPs resulted in total payments of $56,393.28 to the Rhode Island Commerce Corporation consistent with the requirements of R.I Gen. Laws §§ 39-26-4(c) to (e). This is down substantially from $2.25 million in 2012 and $5.24 million in 2011. Twenty-two7 load-serving entities had RI RES obligations during the Compliance Year 2013.8 Fourteen of these entities met their entire New and Existing RES obligations with GIS Certificates, as compared to Compliance Year 2012 when only twelve of nineteen entities met their obligations entirely with RECs.
5 As explained on its website, NEPOOL GIS “issues and tracks certificates for each MWh of generation produced in the ISO New England control area, including imports from adjacent control areas, and all load served.” The terms “GIS Certificate” and “Renewable Energy Certificate,” or “REC,” are often used interchangeably in the marketplace. While REC is the more general term used to denote a generator’s descriptive characteristics (i.e. fuel type, vintage and geographic location) it is the settlement of GIS Certificates within the Obligated Entity’s NEPOOL GIS account that substantiates RES compliance. 6 These RECs represent the newly procured RECs from CY 2013 (462,261) and the 7,482 banked RECs used towards 2013 obligations from 2011 or 2012. 7 One load-serving entity did not file an Annual Compliance Report due to bankruptcy. Their portion of the total Rhode Island load (10 MWh) has been included throughout the report. However, this load obligation was not met through ACP or REC procurement. 8 See Table 5 for a complete list of load-serving entities filing Annual Compliance Reports.

3
Seven competitive suppliers met a portion of their 2013 individual RES obligations by making ACPs to the Rhode Island Commerce Corporation. Of these, two competitive suppliers met all of their New RES obligations by making ACPs; of those two, one also utilized ACPs to meet their entire Existing RES obligations. Nine Obligated Entities utilized some of their authorized Banked Compliance in 2013. Collectively, they applied 7,482 RECs, which had been banked in either 2011 or 2012, towards their respective 2013 obligations. Eleven Obligated Entities banked 2013 RECs for use in 2014 or 2015. 2013 REC Resources Most of New RECs (51.6%) were generated at facilities fueled with biomass, followed by landfill gas (23.9%), wind (15.1%), hydro (6.2%), digester gas (2.8%), and solar photovoltaic (0.5%). In terms of location, 36.4% were generated in New Hampshire; 27.9% in Maine; 18.6% in Rhode Island; 12.1% were imported from New York; and the remaining 5% were generated in Massachusetts, Vermont, and Connecticut. All of the Existing RECs were generated at hydro facilities in Maine, Massachusetts, Vermont and New Hampshire. Additional information on the composition of 2013 RES compliance by fuel type and geographic location is provided in Section III of this report.9 2013 Compliance Costs National Grid is the only Obligated Entity for which the PUC collects data on the charges to ratepayers for complying with the RES. Early in a calendar year, National Grid proposes a RES charge designed to collect the costs of compliance during the upcoming compliance year, outstanding costs for the remainder of the current compliance year, and to true up any outstanding under- or over-collection made during the previous calendar year.10 As shown in Table 2, in April 2013 the RES charge to National Grid customers increased from $0.00253 per kWh to $0.00512 per kWh. This increase was due mostly to a significant increase in National Grid’s projected cost for 2013 New RECs, the increase in the New RES obligation (i.e., 5.5%), and some under-recovery of 2012 compliance costs. In April 2014, the rate was reduced to $0.00480 per kWh; the lower rate reflects that although projected 2014 REC procurement costs were up compared to 2013 (Table 2, Column 2), the additional factor for under-recovery during 2013 was significantly smaller than the factor used for under-recovery in 2012 (Table 2, Column 3). Table 2: Estimated Rate Impact for RES Compliance to Standard Offer Service Customers
Effective Date Projected REC Procurement
Cost (per kWh)
Adder for previous and current costs
(per kWh)
Authorized RES Charge (per kWh)
Monthly/ Annual Cost to 500
kWh Ratepayer April 2014 – Report Date
$0.00430 $0.00050 $.00480 $2.40/$28.80
April 2013 – March 2014
$0.00371 $0.00141 $0.00512 $2.56 / $30.72
January 2013 – March 2013
$0.00209 $.00044 $0.00253 $1.265 / $15.18
9 This summary of New and Existing RES compliance excludes RECs retired for the purpose of substantiating renewable energy claims associated with end-use customer voluntary purchases above and beyond the RES. Voluntary clean energy programs are summarized in Appendix 6 of this Report. 10 RECs are generated during a compliance year in real time, but trading for a compliance year runs from July through June. Thus, Compliance Year 2013 runs from July 2013 through June 2014.

4
National Grid is also the only Obligated Entity for which the PUC collects cost-of-compliance data. Table 3 shows that National Grid incurred costs of $18.96 million (estimated) to meet its 2013 New and Existing RES obligations. This represented a 48% increase above those costs incurred to comply with 2012 RES targets ($12.8 million). In late 2011, underlying market conditions changed dramatically. A shortage of certified renewable energy supply relative to regional demand (driven primarily by renewable portfolio standards like Rhode Island’s RES) caused REC prices to increase substantially toward the end of 2011 and remain at elevated levels throughout 2012. During this time, RPS obligations increased at a faster rate than the construction of new renewable energy supply – which was delayed in part due to the challenges of permitting power generation projects in New England. Table 3: Summary of National Grid's 2013 REC Compliance Costs
Compliance Year
Total RES Costs
New REC Costs
Existing REC Costs
ACP Costs
Obligated Load
(MWh) 2013 $18.96 million* $18.9 million $0.06 million N/A 5,541,409 2012 $12.8 million $12.75 million $0.05 million N/A 5,272,388 2011 $8.43 million $3.85 million $0.05 million 4.53 million 5,554,272
*Filed on February 23, 2015 In 2013, the gap between RPS-eligible supply and demand began to close as new capacity, retrofits, and a sharp increase in qualified imports delivered supply to the regional market in excess of incremental demand. While REC prices remained elevated due to the continued overall shortage, the amount of RI RES compliance achieved through ACPs dropped sharply. This is an important metric in the evaluation of any renewable energy standard. As a result, this analysis concludes that the state’s Renewable Energy Standard continues to operate successfully. The number of Rhode Island-eligible generating units continues to grow, including facilities located within the state, as does the number of new renewable energy projects proposed throughout the region and adjacent control areas. As noted above, this data only represents charges incurred by Standard Offer Service customers of National Grid, which account for approximately 66.5% of all retail load statewide. The remaining 33.5% of statewide electric load is serviced by competitive suppliers for whom the PUC does not have access to compliance cost data. 2013 Conclusions The PUC remains cautiously optimistic that the supply of Rhode Island-eligible New Renewable Energy Resources will continue to grow and that Obligated Entities will be able to source RECs in a balanced marketplace over the next several years, with continued reduced reliance on ACPs. However, continued economic stagnation, various project-specific permitting issues, uncertainty over the long-term availability of federal incentives, and other factors impacting investment decisions all have the potential to delay the large pipeline of projects currently under development. As a result, it is difficult to predict in which years supply will balance with demand.
5
I. Introduction to the Renewable Energy Standard
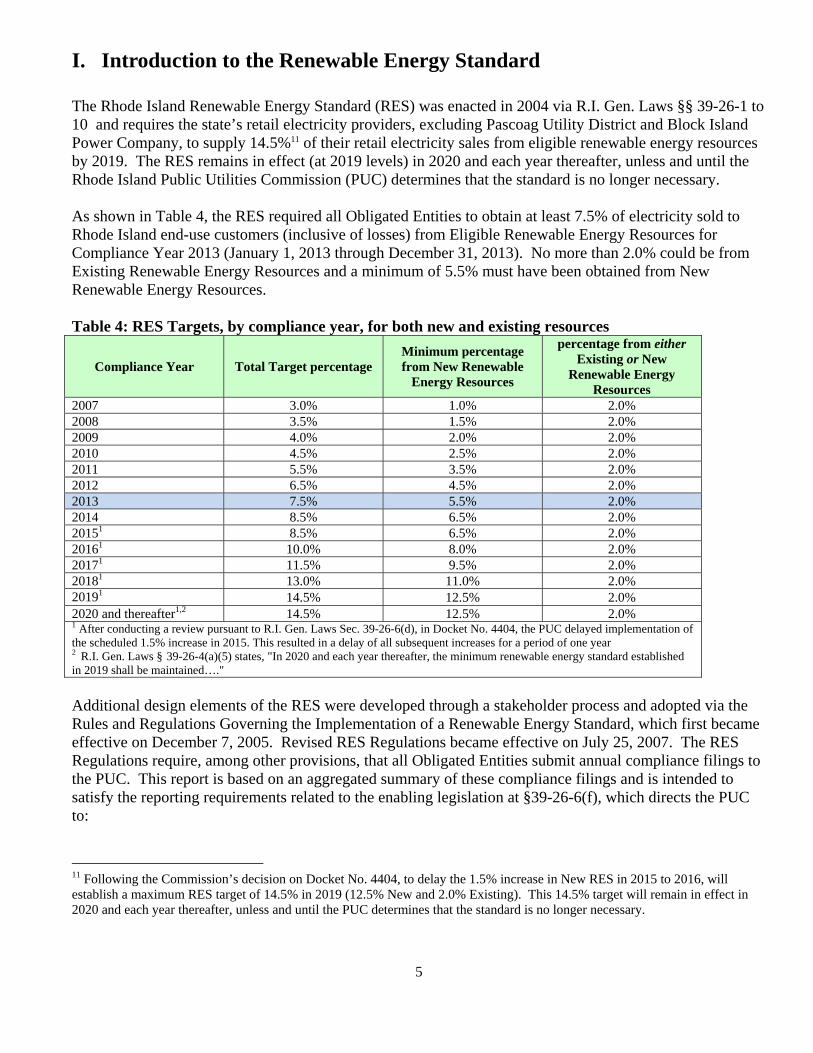
The Rhode Island Renewable Energy Standard (RES) was enacted in 2004 via R.I. Gen. Laws §§ 39-26-1 to 10 and requires the state’s retail electricity providers, excluding Pascoag Utility District and Block Island Power Company, to supply 14.5%11 of their retail electricity sales from eligible renewable energy resources by 2019. The RES remains in effect (at 2019 levels) in 2020 and each year thereafter, unless and until the Rhode Island Public Utilities Commission (PUC) determines that the standard is no longer necessary. As shown in Table 4, the RES required all Obligated Entities to obtain at least 7.5% of electricity sold to Rhode Island end-use customers (inclusive of losses) from Eligible Renewable Energy Resources for Compliance Year 2013 (January 1, 2013 through December 31, 2013). No more than 2.0% could be from Existing Renewable Energy Resources and a minimum of 5.5% must have been obtained from New Renewable Energy Resources. Table 4: RES Targets, by compliance year, for both new and existing resources
Compliance Year Total Target percentage Minimum percentage from New Renewable
Energy Resources
percentage from either Existing or New
Renewable Energy Resources
2007 3.0% 1.0% 2.0% 2008 3.5% 1.5% 2.0% 2009 4.0% 2.0% 2.0% 2010 4.5% 2.5% 2.0% 2011 5.5% 3.5% 2.0% 2012 6.5% 4.5% 2.0% 2013 7.5% 5.5% 2.0% 2014 8.5% 6.5% 2.0% 20151 8.5% 6.5% 2.0% 20161 10.0% 8.0% 2.0% 20171 11.5% 9.5% 2.0% 20181 13.0% 11.0% 2.0% 20191 14.5% 12.5% 2.0% 2020 and thereafter1,2 14.5% 12.5% 2.0% 1 After conducting a review pursuant to R.I. Gen. Laws Sec. 39-26-6(d), in Docket No. 4404, the PUC delayed implementation of the scheduled 1.5% increase in 2015. This resulted in a delay of all subsequent increases for a period of one year 2 R.I. Gen. Laws § 39-26-4(a)(5) states, "In 2020 and each year thereafter, the minimum renewable energy standard established in 2019 shall be maintained…." Additional design elements of the RES were developed through a stakeholder process and adopted via the Rules and Regulations Governing the Implementation of a Renewable Energy Standard, which first became effective on December 7, 2005. Revised RES Regulations became effective on July 25, 2007. The RES Regulations require, among other provisions, that all Obligated Entities submit annual compliance filings to the PUC. This report is based on an aggregated summary of these compliance filings and is intended to satisfy the reporting requirements related to the enabling legislation at §39-26-6(f), which directs the PUC to:
11 Following the Commission’s decision on Docket No. 4404, to delay the 1.5% increase in New RES in 2015 to 2016, will establish a maximum RES target of 14.5% in 2019 (12.5% New and 2.0% Existing). This 14.5% target will remain in effect in 2020 and each year thereafter, unless and until the PUC determines that the standard is no longer necessary.

6
Report, by February 15, 2006, and by February 15 each year thereafter, to the governor, the speaker of the house and the president of the senate on the status of the implementation of the renewable energy standards in Rhode Island and other states, and which report shall include in 2009, and each year thereafter, the level of use of renewable energy certificates by eligible renewable energy resources and the portion of renewable energy standards met through alternative compliance payment.
The RES statute defines eligible New and Existing Renewable Energy Resources at §39-26-5. All Renewable Energy Resources must be certified by the PUC (and maintain this certification) in order to participate in the RES program. Lists of New and Existing Renewable Energy Resources currently certified by the PUC are provided as Appendices 1 and 2, respectively. An up-to-date status of all approved and pending eligibility applications can be found on the PUC website at www.ripuc.org/utilityinfo/res.html. All Renewable Energy Resources must also establish and maintain an account with the NEPOOL Generation Information System (NEPOOL GIS). NEPOOL GIS maintains a record of each generator’s monthly production, as well as the generator’s descriptive characteristics such as generator location, fuel type, and actual emissions. One GIS Certificate is created for each MWh of energy production generated within, or imported into, the ISO New England (ISO-NE) control area, which encompasses Rhode Island. A single GIS Certificate for one MWh of eligible renewable energy generation is also commonly known as a Renewable Energy Certificate (REC)12. The GIS Certificate is the currency used to demonstrate compliance with the RES, as well as mandatory renewable energy requirements in other states, and voluntary renewable energy transactions throughout the ISO-NE control area. Through the use of GIS Certificates, which are created and transferred exclusively within the NEPOOL GIS, and the annual submission of RES compliance reports, the PUC ensures that a GIS Certificate used for RES compliance has not also been used to satisfy another obligation in Rhode Island or any other jurisdiction. In this way, the PUC rules guards against any “double counting” of RECs.
12 As explained on its website, NEPOOL GIS “issues and tracks certificates for each MWh of generation produced in the ISO New England control area, including imports from adjacent control areas, and all load served.” The terms “GIS Certificate” and “Renewable Energy Certificate,” or “REC,” are often used interchangeably in the marketplace. While REC is the more general term used to denote a generator’s descriptive characteristics (i.e. fuel type, vintage and geographic location) it is the settlement of GIS Certificates within the Obligated Entity’s NEPOOL GIS account that substantiates RES compliance.

7
II. Compliance Year 2013: Obligation and Sources of Compliance Compliance Year 2013 (from January 1, 2013 through December 31, 2013)13 was the seventh compliance year for Rhode Island’s RES. Each Obligated Entity was required to obtain at least 7.5% of electricity (including line losses) sold to Rhode Island end-use customers from Eligible Renewable Energy Resources, with no less than 5.5% from New Renewable Energy Resources. Rhode Island’s actual 2013 RES-obligated retail sales totaled 8,193,979 MWh. As a result, the aggregate minimum New RES obligation (5.5%) was 450,678 MWh, while the aggregate New or Existing RES obligation (2.0%) was 163,891 MWh.14 Obligated Entities were required to meet the RES either through the purchase and retirement of GIS Certificates or through the provision of Alternative Compliance Credits, obtained by making Alternative compliance payments (ACPs) to the Rhode Island Commerce Corporation. The Rhode Island Commerce Corporation sets these funds aside in the Renewable Energy Development Fund, established under R.I. Gen. Laws § 39-26-7, to support investments in renewable energy. In 2013, the ACP rate was $65.27 per MWh of obligation. The rate is the same for both New and Existing RES obligations. See Appendix 3 for additional information regarding ACPs. Table 5: Obligated Entities Submitting 2013 REC Compliance Filings to the PUC Distribution Utilities The Narragansett Electric Company d/b/a National Grid Competitive Retail Providers Ambit Northeast, LLC Liberty Power Holdings, LLC Consolidated Edison Solutions, Inc. Mint Energy, LLC Constellation New Energy, Inc. NextEra Energy Services Rhode Island, LLC
(Gexa Energy LLC) Devonshire Energy, LLC Noble Americas Energy Solutions LLC
(Sempra Energy Solutions LLC) Direct Energy Business, LLC North American Power and Gas First Point Power, LLC SJH Energy LLC (St. Joseph Health Services) Glacial Energy of New England, Inc. South Jersey Energy Company Gulf Oil Limited Partnership TransCanada Power Marketing, LLC Hess Corporation Westerly Hospital Energy Company LLC Integrys Energy Services, Inc. XOOM Energy, LLC In total, twenty-one entities submitted RES Compliance Filings to the PUC for 2013 including National Grid and twenty competitive electricity providers, as shown in Table 5. One entity failed to submit an RES Compliance Filing.15 Appendix 4 lists all entities from whom Compliance Filings were received and
13 RECs are issued about seven months after they are generated. Thus, January 2013 RECs are issued June 15, 2013. Because of this lag, trading for 2013-vintage RECs, and the costs incurred by Obligated Entities for Compliance Year 2013, continued through June 15, 2014.
14 Note that the total New and Existing RES obligations are slightly higher than the 5.5% New and 2.0% Existing of total obligated retail sales due to rounding protocols for individual Obligated Entities. 15 Although twenty-two Obligated Entities in total served load in Rhode Island during 2013, one of these load serving entity did not file an Annual Compliance Report, and is in a bankruptcy proceeding. Their portion of the total Rhode Island load has been included throughout the report; however this load obligation (10 MWh) was not met through ACP or REC procurement and thus is not included in the total of twenty-one entities that submitted RES Compliance Filings to the Commission for 2013.

ps FNeCmo F
A0f
1
fid
provides a desummary for
Fourteen of tNational Grientities met aCorporation.making ACPobligations.
Figure 1: Di
As shown in 0.2% being mflexibility me
6 The limited c
filings. Thus, cdentification o
etailed summr competitive
the state’s Od, met all ofa portion of Of these co
Ps and one of
istribution o
Figure 1 abmet by ACPechanism in
competitive supcompetitive supof proprietary b
mary of RESe retail electr
Obligated Entf their respectheir individompanies, twf these two e
of Sources f
ove, 99.8% s. Nine of th2013. Unde
pplier data prespplier informat
business activit
S compliancericity provid
tities that subctive New andual RES oblwo competitientities utiliz
for Complia
of New REShe state’s Ober the RES r
sented in Appetion within thisties.
8
e for Nationaders.16
bmitted Annnd Existing Rligations by ive supplierszed ACPs to
ance with 20
S compliancebligated Entirules, Obliga
endix 4 is a ress report is only
al Grid Com
nual CompliaRES obligatimaking AC
s met all of t meet their e
013 New RE
e was met wities made uated Entities
sult of the Comy presented in a
mpany along
ance Filingsions with GIPs to the Rhtheir New REentire New a
ES Obligatio
with GIS Ceruse of the Ba
are allowed
mmission’s cona summarized f
with a more
s to the PUCIS Certificathode Island CES obligatioand Existing
ons
rtificates, witanked Compld to bank exc
nfidential treatmfashion to avoi
limited
, including tes. Seven Commerce ons by
RES
th the other liance cess
ment of their id the potentiall
cyt2o F
Aoo9U
1
cR
compliance (year’s obligatheir respecti2013-vintageobligations.
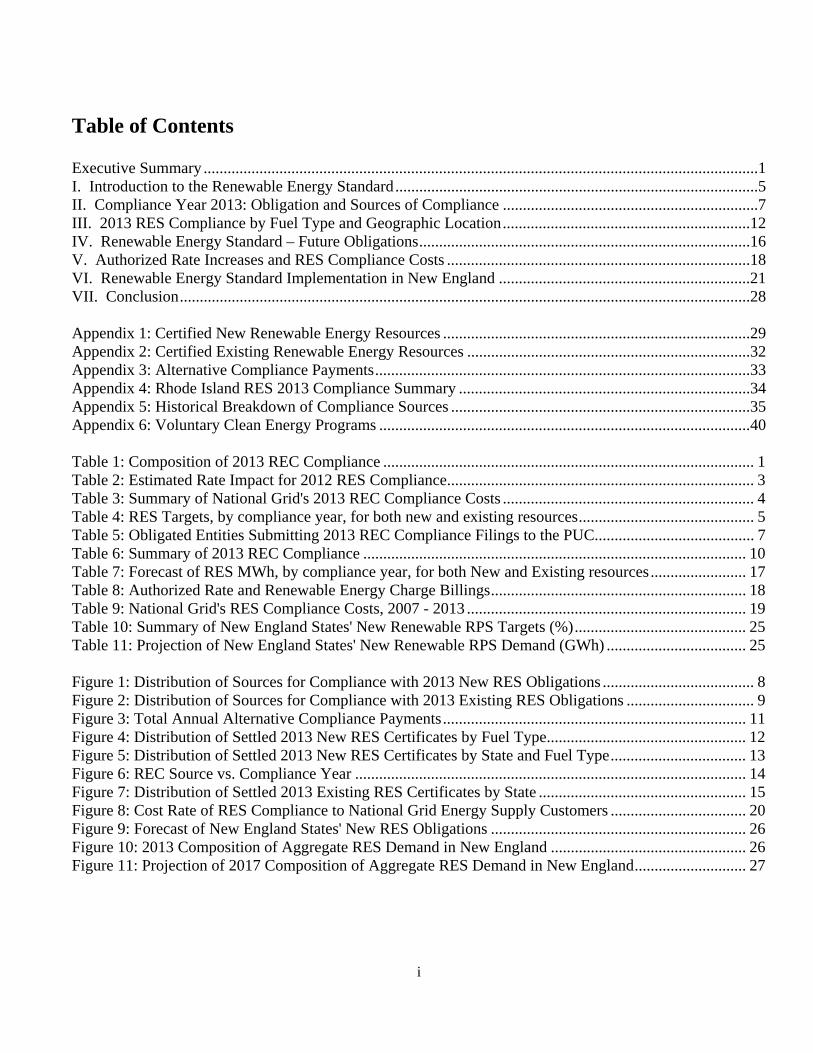
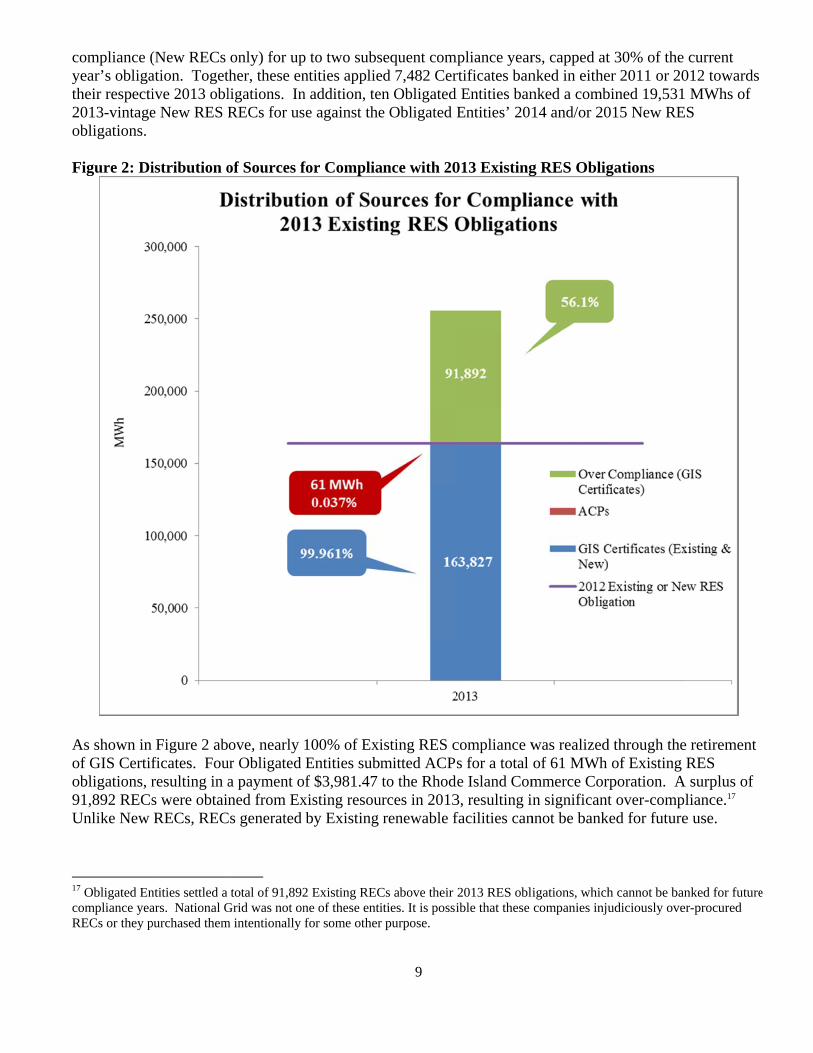
Figure 2: Di
As shown in of GIS Certifobligations, r91,892 RECsUnlike New
7 Obligated En
compliance yeaRECs or they p
(New RECs ation. Togetive 2013 oble New RES R
istribution o
Figure 2 abficates. Fouresulting in as were obtainRECs, REC
ntities settled a ars. National Gpurchased them
only) for upther, these enligations. InRECs for us
of Sources f
ove, nearly ur Obligated a payment oned from Ex
Cs generated
total of 91,892
Grid was not onm intentionally
p to two subsntities applien addition, tese against the
for Complia
100% of ExiEntities submf $3,981.47
xisting resouby Existing
2 Existing RECne of these entifor some other
9
sequent comed 7,482 Ceren Obligatede Obligated E
ance with 20
isting RES cmitted ACPto the Rhod
urces in 2013renewable f
Cs above their ities. It is possir purpose.
mpliance yearrtificates band Entities banEntities’ 201
013 Existing
compliance ws for a total
de Island Com3, resulting infacilities can
2013 RES obliible that these
rs, capped atnked in eithenked a comb14 and/or 20
g RES Oblig
was realizedof 61 MWh mmerce Corn significant
nnot be bank
igations, whichcompanies inju
t 30% of the er 2011 or 20bined 19,531015 New RE
gations
d through theof Existing
rporation. At over-comp
ked for future
h cannot be banudiciously ove
current 012 towards MWhs of
ES
e retirement RES
A surplus of liance.17 e use.
nked for futureer-procured
e

10
The ACPs made for 2013 obligations resulted in total payments of $56,393 to the Rhode Island Commerce Corporation, 92.9% of total payments going toward New RES obligations and 7.1% of payments going toward Existing obligations. The use of ACPs decreased dramatically compared to Compliance Year 2012 and 2011 when ACPs totaled $2,253,312 and $5,244,083 respectively. The ACPs made for calendar year 2013 are more in line with the APCs made in earlier years of the RES program when supply and demand were more closely balanced. For example, in 2008, retail electricity providers relied on ACPs to meet just 0.13% of their total New and Existing obligations, resulting in payments of $21,792 to the Rhode Island Commerce Corporation. This limited use of ACPs for New RES compliance continued into the 2009 ($122) and 2010 ($21,813) compliance years. A summary of 2013 RES Compliance, including information on ACPs and banked certificates, is presented in Table 6. Figure 3 shows how 2013 ACPs compare to previous years. Table 6: Summary of 2013 REC Compliance Results for Compliance Year 2013 (MWh)* A 2013 RES Obligated Retail Sales 8,193,979
A.1 National Grid 5,451,409 A.2 Competitive Suppliers (20 in total submitting filings) 2,742,570
New RES Obligations and New Renewable Energy Certificates
B Total 2013 New RECs Settled in Rhode Island** 469,743 B.1 2013 New RECs Purchased 462,261 B.2 Banked 2011 and 2012 New RECs Applied 7,482
C New RES Obligations (5.5% of “A”) 450,678 C.1 Banked RECs Applied to 2013 New Obligations (from B.2) 7,482 C.2 2013 New RECs Applied to 2013 New Obligations (Subset of B.1) 442,386 C.3 Alternative Compliance Payment Credits Applied to 2013 New RES Obligations 803 C.4 Outstanding Obligation (RECs or ACPs) 7
D Banked RECs Available for Compliance Year 2014 or 2015 D.1 Remaining RECs Available after Meeting Obligations 19,668 D.2 2013 New RECs applied to 2013 Existing RES Obligations 207 D.3 RECs banked for future use in Compliance Years 2014 or 2015 19,531
D.4 2013 New RECs purchased above 30% banking cap (not eligible for banking)
137
Existing RES Obligations and Existing Renewable Energy Certificates
E Existing RES Obligations (2.0% of “A”) 163,891 E.1 2013 Existing RECs applied to 2013 Existing RES Obligations 163,620 E.2 2013 New RECs applied to 2013 Existing RES Obligations 207 E.3 Alternative Compliance Payment Credits Applied to 2013 Existing RES Obligations 61 E.4 Outstanding Obligation (RECs or ACPs) 3
F Total 2013 Existing RECs Settled in Rhode Island1 255,512
F.1 2012 Existing/New RECs applied to 2013 Existing RES Obligations (E.1 plus E.2) 163,827
F.2 2012 Existing RECs purchased above 2012 RES Obligations (not eligible for banking)
91,892
* Values may not be additive due to rounding protocol with individual Obligated Entities.** Does not include RECs purchased on behalf of end-use customers for voluntary clean energy programs. See Appendix 6 for details on RECs purchased for voluntary programs.

11
Figure 3: Total Annual Alternative Compliance Payments

I IwO(2io2(C F
Ao
1
o
III. 2013
In 2013, RESwind, hydroeObligated En(23.9%) faci2012, this repn 2011), but
obligations. T2013). Small(0.1% in 201Compliance
Figure 4: Di
As shown in of the New R
8 Charts in Sec
of any voluntar
3 RES C
S compliancelectric, digentities for Colities througpresents a sit a noted decThe percental growth in R12 v. 0.5% inYear 2013.
istribution o
Figure 5 beRECs retired
ction III of thisry clean energy
omplianc
e was fulfillester gas, andompliance Yhout New Eignificant inccrease in winage of RECsREC generatn 2013), and
of Settled 20
low, renewad for 2013 ob
s report do not y programs. Vo
ce by Fue
led by six typd solar photo
Year 2013 wengland and tcrease in thend RECs (59s generated btion from Hy
d Digester Ga
013 New RE
able energy fbligations, a
include any REoluntary RECs
12
el Type a
pes of renewovoltaic. Asere primarilythe adjacent e utilization o9.2% in 2012by landfill gaydro (4.3% ias (0.7% in 2
ES Certifica
facilities locamajor increa
ECs purchaseds are summariz
and Geog
wable energys shown in Fy generated bcontrol area
of RECs gen2 v. 15.1% inas remained in 2012 v. 6.2012 v. 2.8%
ates by Fuel
ated within Rase from the
d by Obligated zed in Appendi
graphic L
y generators:Figure 4, Newby biomass (a of New Yonerated by bin 2013) usedsteady (23.72% in 2013)
% in 2013) a
l Type
Rhode Islane 1.2% repor
Entities on behix 6 of this repo
Location
: biomass, law RECs pur(51.5%) and
ork.18 Compaiomass facild for New RE7% in 2012 v), Solar Phot
also occurred
d accountedrted in 2012
half of their cuort.
andfill gas, chased by
d landfill gasared to ities (12.0%ES v. 23.9% in tovoltaic d in
d for 18.6% and 1.5% in
ustomers as par
rt

2w( F
NiR( RRf MRM(f
2011. Thesewind (2.7%) (27.9%), New
Figure 5: Di
New RECs rncluded biom
Rhode Island(55.7%) follo
Renewable eRECs in 201from landfill
MassachusetRhode IslandMassachuset(70.2%), follfrom hydro (
e Rhode Islanand solar (2
w York (12.
istribution o
retired for Rhmass (98.9%d obligationsowed by win
energy certif3, down from
l gas (48.3%
tts (3.4%), Vd obligationstts-based RElowed by lan(93.1%), alon
nd-based gen2.5%). The o1%), Massac
of Settled 20
hode Island %), wind (0.8s were also gnd (36.8%),
ficates imporm over half ), wind (32.
Vermont (1.3s, but totaled
ECs retired inndfill gas (28ng with som
nerating faciother settledchusetts (3.4
013 New RE
obligations f8%) and hydgenerated bydigester gas
rted from Ne(53%) in 201%), digeste
3%) and Cond a much lown 2013 for us8.3%) and w
me small amo
13
ilities were fd New RECs 4%), Vermon
ES Certifica
from New Hdro (0.3%) gey facilities in
(5.5%) and
ew York wer012. In 2013er gas (10.7%
nnecticut (0.3wer percentagse in Rhode
wind (1.5%).ounts from w
fueled by lancame from
nt (1.3%) an
ates by State
Hampshire (3eneration fac
n Maine (27.9a small amo
re greatly red3 the importe%) and hydro
3%) based Rge of total reIsland large Vermont ba
wind (6.9%).
ndfill gas (91New Hamps
nd Connectic
e and Fuel T
36.4% of all cilities. New9%), compriount of hydro
duced to 12.ed New Yorko facilities (9
RECs were aetired 2013 Nely came fromased RECs w Additionall
1.8%), hydroshire (36.4 %cut (0.3%).
Type
settled Neww RECs retirised mostly o (2.1%).
.1% of settlek RECs wer9.0%).
also retired toNew RECs. m hydro facwere predomly, for the fir
o (3.0%), %), Maine
w RECs) red for of biomass
ed New e derived
o meet ilities
minately rst time,

14
Connecticut based RECs were retired to meet Rhode Island obligations. All the Connecticut based RECs were generated by hydro facilities (100%). The historical view of the amount of New RECs procured from all jurisdictions is shown below in Figure 6, along with ACPs for comparison.19 While this chart does not show exactly which RECs were used for compliance, and which were banked for future compliance, this view does help illustrate that a sharp increase in the procurement of RECs from Rhode Island, Maine, and New Hampshire may have reduced the procurement of RECs imported from New York and ACPs in 2013. Figure 6: REC Source vs. Compliance Year
As in 2009, 2010, 2011, and 2012, all of the RECs used to fulfill Existing RES obligations in 2013 were attributable to hydroelectric generators. As shown in Figure 7, more than 40% of these RECs came from facilities located in Maine (42%). Massachusetts hydro facilities generated 22.7% of the Existing RECs, followed by Vermont (18.5%) and New Hampshire (16.7%).
19 Appendix 5 contains another view of historical data for the distribution of New and Existing RECs by fuel type and location for 2007 through 2013.

FFigure 7: Diistribution oof Settled 20013 Existing
15
g RES Certi
ificates by SState

16
IV. Renewable Energy Standard – Future Obligations The RES enabling legislation at §39-26-4 establishes annual targets for both New and Existing RES obligations through 2019. At § 39-26-4(a)(3), the enabling legislation provides for an “additional one percent (1%) of retail electricity sales in each of the following compliance years 2011, 2012, 2013, 2014, provided that the commission has determined the adequacy, or potential adequacy, of renewable energy supplies to meet these percentage requirements.” At § 39-26-4(a)(4), the legislation provides for an additional 1.5% per year through 2019 with the same PUC requirement to determine the adequacy of supply. Finally, at § 39-26-4(a)(5), the enabling legislation states that in “2020 and each year thereafter, the minimum renewable energy standard established in 2019 shall be maintained unless the commission shall determine that such maintenance is no longer necessary for either amortization of investments in new renewable energy resources or for maintaining targets and objectives for renewable energy.” The manner in which the PUC fulfilled the requirement to determine supply adequacy, as well as the timing and implications of the PUC’s decision-making authority, is clearly articulated in the RES Regulations under § 39-26-6(d). By statute, the PUC was directed to determine on or before January 1, 2014 the adequacy or potential adequacy of renewable energy supplies to meet the increase in the RES targets scheduled for 2015. In a January 2010 Order for Docket 4050, the PUC determined that adequate renewable energy supplies existed to meet the RES target increase scheduled for 2011. Additional information on this proceeding and the PUC’s complete Order can be found at the PUC website.20 In a February 2014 Order for Docket 4404, the PUC determined there was potential inadequacy of renewable energy supply to meet the target increase of 1.5% scheduled for 2015. The result of this determination was to delay this scheduled increase in the RES by a period of one year, thereby capping the escalation of the New RES target at 12.5% rather than 14.0%. Additional information on this proceeding and the PUC’s complete Order can be found at the PUC website.21 The percentage targets shown in Table 4 earlier in this report, and the calculated future RES obligations in Table 7 below, are adjusted to reflect the PUC’s one-year delay of the original 2015 1.5% RES increase to Compliance Year 2016 and the resulting New RES target cap of 12.5%. The quantity (in MWhs) of future years’ RES obligations are estimated by multiplying the forecasted value of total obligated sales in Rhode Island by the RES target for each year. The forecast of Rhode Island’s obligated sales is based on Forecast Data File of the ISO-NE’s 2014 Capacity, Energy, Loads, and Transmission (“CELT”) Report22 and the exemption of both Pascoag Utility District and Block Island Power Company.23
20 For additional information, refer to materials filed in Commission Docket 4050 at: www.ripuc.org/eventsactions/docket/4050page.html 21 For additional information, refer to materials filed in Commission Docket 4404 at: http://www.ripuc.org/eventsactions/docket/4404page.html. In particular, Commission Report and Order No. 21353 can be viewed at: http://www.ripuc.org/eventsactions/docket/4404-RES-Adequacy-Ord21353_2-10-14.pdf. 22 ISO-NE 2014 CELT Forecast Data: See tab 2, column P – Annual Energy Net Passive Demand Response 23 The exempt load of Block Island and Pascoag is based on http://www.eia.gov/electricity/data/eia826/.

17
Table 7: Forecast of RES MWh, by compliance year, for both New and Existing resources
Compliance Year
Actual/Forecasted RES-Obligated
Retail Sales (MWhs)
Minimum MWhs from New
Renewable Energy Resources
(per Table 4 targets)
MWhs from either New or Existing
Renewable Energy Resources
(2.0%) 2007 (Actual) 8,335,706 83,357 166,715 2008 (Actual) 8,279,006 124,190 165,584 2009 (Actual) 7,910,112 158,212 158,212
2010 (Actual) 8,242,937 206,082 164,866 2011 (Actual) 8,157,796 285,531 163,165 2012 (Actual) 8,123,025 365,5451 162,4691 2013 (Actual) 8,193,979 450,678 163,891 2014 8,151,791 529,867 163,036 20152 8,067,476 524,386 161,350 20162 8,004,984 640,399 160,100 20172 7,985,145 758,589 159,703 20182 7,934,556 872,802 158,692 20192 7,873,055 984,132 157,462 20202,3 7,811,555 976,445 156,232 20212,3 7,756,998 969,625 155,140 2022 2,3 7,711,368 963,921 154,228 2023 and thereafter2,3,4 7,667,723 958,466 153,355 1Please note that the total New and Existing RES obligations are slightly higher than the % New and % Existing of total obligated retail sales due to rounding protocols for individual Obligated Entities. 2After conducting a review pursuant to R.I. Gen. Laws § 39-26-6(d), in Docket No. 4404, the PUC delayed implementation of the scheduled 1.5% increase in 2015. This resulted in a delay of all subsequent increases for a period of one year. 3Duration of continuation after 2020 is subject to PUC determination. 4The 2014 CELT forecast ends in 2023.

18
V. Authorized Rate Increases and RES Compliance Costs R.I. Gen. Laws § 39-26-6(f) states that the annual report shall include “the amount of rate increases authorized pursuant to subsection (b)” where subsection (b) of R.I. Gen. Laws § 39-26-6 reads that the PUC shall “[a]uthorize rate recovery by electric distribution companies of all prudent incremental costs arising from the implementation of this chapter, including, without limitation, the purchase of NE-GIS certificates, the payment of alternative compliance payments, required payments to support the NE-GIS, assessments made pursuant to §39-26-7(c) and the incremental costs of complying with energy source disclosure requirements.” The only electric distribution company that qualifies as an Obligated Entity is National Grid, as the definition of “Obligated Entity” in Section 3.25 of the RES Rules and Regulations specifically excludes Block Island Power Company and the Pascoag Utility District. Table 8 provides data on the authorized RES charge (per kWh) billed to National Grid’s customers from 2007 through the report date, as well as the resulting total estimated revenues and average ratepayer impact by month and year. Please note that National Grid typically files for rate change to the Renewable Energy Charge in late winter for effect on April 1st. Table 8: Authorized Rate and Renewable Energy Charge Billings
Through a regulatory ratemaking and reconciliation procedure, National Grid recovered from its customers the estimated cost associated with the 2013 RES obligation year and the estimate of the remaining cost
24 This data is based upon the distribution utility’s (Narragansett Electric) RES revenue reported in its Renewable Energy Standard Reconciliation filings. Narragansett Electric’s customers represent approximately 66.5% of the total retail load delivered in Rhode Island. For more information, see http://www.ripuc.org/eventsactions/docket/4393-NGrid-RES-Reconciliation-Filing(2-20-14).pdf. 25 As of April 1, 2012 26 As of April 1, 2011
Effective Date Auth. RES
Charge/kWh Renewable Energy Charge Revenue 24
Average Monthly/ Annual Ratepayer Impact (500 kWh)
April 2014 – Report Date
$0.00480 Not Yet Filed $2.40/$28.80
April 2013 - March 2014
$0.00512 $18,903,824 $2.56 / $30.72
January 2013 - March 2013
$0.00253 $3,219,214 $1.265 / $15.18
2012 $0.0025325 $8,268,285 $1.265 / $15.18
2011 ($0.00031)26 $827,727 ($0.155) / ($1.86)
2010 $0.00123 $6,209,689 $0.615 / $7.38
2009 $0.00093 $5,161,420 $0.465 / $5.58
2008 $0.00084 $5,483,351 $0.42 / $5.04
2007 $0.00062 $3,956,114 $0.31 / $3.72

19
associated with the 2012 RES obligation year. Thus, the charge of $0.00512 per kWh throughout most of 2013 and into 2014 indicates that National Grid estimated the company under-collected revenues during the previous year due to changes in a complex set of assumptions designed to project future obligations. These assumptions include projected market conditions, anticipated REC pricing, and estimates of electricity consumption. As these variables change from month to month and the electric distribution utility incurs costs to procure RECs or make ACPs relative to their realized obligations, the amount of revenue collected must ultimately be reconciled to actual costs. As of April 1, 2013, National Grid determined that their compliance costs through the end of 2012 were greater than they had originally projected, resulting in an increase to the RES charge in 2013 that allowed for the recovery of those under-collections. As noted below, contributing factors to this scenario were primarily driven by an increase in REC market prices due to a continued shortfall of REC supply in the New England region since 2011, an increase in RI RES obligations, and an increase in RI eligible New REC prices at $62.75 which is slightly below the ACP level of $65.2727. The reconciling nature of this charge ensures that any over-collections charged to ratepayers are ultimately returned and that the electric distribution company can recover under-collections when compliance costs are higher than anticipated. While the rate impact of the RES mandate is important, a more accurate and complete picture of compliance costs can be seen through the lens of REC procurement expenses. In order to meet its 2013 New and Existing RES obligations, National Grid incurred $18.96 million (estimated) in compliance costs. As indicated in Table 9, this represented an increase of 48% above those costs incurred to comply with 2012 RES targets ($12.8 million)28 and a two-fold increase from 2011 costs ($8.43 million). Table 9: National Grid's RES Compliance Costs, 2007 - 2013
Compliance Year
Total RES Costs
New REC Costs
Existing REC Costs
ACP Costs
Obligated Load
(MWh) 2013* $18.96 million $18.9 million $0.06 million N/A 5,451,409 2012 $12.8 million $12.75 million $0.05 million N/A 5,272,388 2011 $8.43 million $3.85 million $0.05 million $4.53 million 5,554,272 2010 $2.07 million $2.02 million $0.05 million N/A 5,695,951 2009 $5.51 million $5.28 million $0.22 million N/A 5,902,667 2008 $5.21 million $5.02 million $0.19 million N/A 7,123,559 2007 $3.97 million $3.79 million $0.19 million N/A 7,177,538
*Filed on February 23, 2015 The historical RES compliance cost per kWh to customers who purchase their energy supply from National Grid is shown in Figure 7. The combined effect of the increase in compliance-year costs (Table 9, Column 2) and the decrease in supply load to spread this cost over (Table 9, Column 6) has caused a sharp increase in cost per kWh to National Grid energy supply customers through 2013. Since 2010, the cost rate has increased approximately 0.10 cents/kWh every year.
27 For additional information, refer to materials filed in Commission Docket 4513 at: http://www.ripuc.org/eventsactions/docket/4315page.html. In particular, National Grid’s “2013 Renewable Energy Standard Charge and Reconciliation” filing can be viewed at: http://www.ripuc.org/eventsactions/docket/4315-NGrid-RES-Reconcile(2-25-13).pdf. 28 At a high level, the increase in compliance costs between 2012 and 2013 continues to be partially attributed to an increase in REC market prices and decreased renewable generation resulting from lower cost natural gas fired generation.
20
Figure 8: Cost Rate of RES Compliance to National Grid Energy Supply Customers
Finally, it should be recognized that the true cost of RES compliance for all electric supply customers in Rhode Island is difficult to calculate. While National Grid accounted for approximately 66.5% of total electric load in Compliance Year 2013, twenty-one competitive suppliers combined to service the rest. Their costs to procure the required RECs and/or make ACPs are proprietary, but are similarly recovered through the rates they charge their contracted customers throughout the Ocean State.

21
VI. Renewable Energy Standard Implementation in New England The RES enabling legislation requests a report on “the status of the implementation of the renewable energy standards in Rhode Island and other states” [emphasis added]. This section provides an update on the implementation of similar programs- known as Renewable Portfolio Standards (“RPS”) outside of Rhode Island – in the other five New England states. Four of the remaining five New England states have active Renewable Portfolio Standards. While Vermont has legislated renewable energy goals, these goals are voluntary and do not constitute a binding RPS comparable with the rest of New England. As of the end of 2013, each of the established RPS programs has multiple tiers – also referred to as classes – used to distinguish compliance requirements associated with New and Existing renewables, and sometimes other energy-related objectives, including combined heat and power, energy efficiency, or others. Class I requirements (equivalent to Rhode Island’s “New” obligation) focus on supply that has either been constructed after a specified date or which meets maximum emissions thresholds, as well as other eligibility criteria. “Existing” requirements29 generally focus on supply that was in operation prior to the creation of the applicable state’s RPS program, and compliance targets are generally intended to provide the minimum amount of additional revenue believed to be necessary to keep these existing renewable energy facilities in operation. To this end, RPS requirements for existing resources are intended to maintain the current fleet rather than spur the development of new generating facilities. Several states have additional requirements beyond the “New” and “Existing” convention. For example, Massachusetts and New Hampshire both have solar-specific RPS requirements. In Massachusetts, the solar obligation is calculated annually and subtracted from the Class I requirement. This is referred to as a solar “carve-out.”30 New Hampshire’s solar requirement stands alone and is referred to as its Class II obligation. Connecticut has a Class III requirement for conservation and load management resources, as well as combined heat and power (CHP). In addition to its primary Class II requirement, Massachusetts also has a secondary Class II requirement dedicated to Waste-to-Energy (WTE), as well as an Alternative Energy Portfolio Standard (APS) for CHP, flywheel storage, coal gasification and efficient steam technologies. In 2011, Connecticut also established incentive programs for zero and low emission distributed energy systems as well as a residential solar rebate program. While not explicitly within the RPS, these new programs effectively create solar and fuel cell “carve-outs” within the Connecticut RPS. Finally, Vermont’s Sustainably Priced Energy Enterprise Development (“SPEED”) long-term (standard offer) contracting program effectively creates a policy carve-out for a specified quantity of renewable distributed generation facilities of 2.2 MW or less. The remainder of this section focuses exclusively on the Class I portion of each state’s RPS requirement, including the interaction between Class I and other Classes in certain limited circumstances. Massachusetts has the longest-running RPS; the first compliance year was 2003. Through the use of Early Compliance in 2002 (a one-time opportunity to use all qualifying generation in 2002 toward the 2003 obligation), Massachusetts’ RPS supply met demand in 2003. As demand grew more quickly than supply in the RPS market’s early years, Massachusetts fell short of RPS compliance by 35% in 2004 and 2005, and by 25% in 2006. For Compliance Years 2007 through 2010, the Massachusetts RPS market had been in
29 Including Class II in MA, CT and ME; Class III in NH; Class IV in NH; and “Existing” in RI. 30 Massachusetts is currently drafting a regulation that would create a separate long-term carve-out to support new emerging technologies.
22
approximate equilibrium. Since RECs were not evenly distributed among Obligated Entities, however, several suppliers made ACPs in years when the market had an overall surplus. Class 1 ACPs in Massachusetts totaled approximately $9,000 in 2003;31 $13.6 million in 2004; $19.6 million in 2005; $17.8 million in 2006; $620,000 in 2007; $70,000 in 2008, $0 in 2009, and $240,000 in 2010. In 2011, the MA RPS market returned to shortage conditions, with $6.6 million in ACPs. ACPs totaled $16.35 million for Compliance Year 2012. At the time this report was drafted, Massachusetts had not yet released its 2013 Compliance Report. After qualifying over 658 MW of solar capacity in a program designed to support 400 MW, the Massachusetts Department of Energy Resources (“DOER”) launched the second phase of the Class I Solar Carve-Out (SREC-II) program, which is intended to move Massachusetts to 1,600 MW of installed solar PV by 2020. Together, Phase I and Phase II of the program will be capped at 1,600 MW – all of which will count towards achieving Class I RPS compliance. DOER is also implementing a legislative mandate for long-term renewable energy contracts with newly developed, small and emerging renewable energy technologies that are qualified as Class I resources. The mandate is for 0.4% of distribution company load from 2013 through 2016. In October, 2014 the Department released the final determination of eligible technologies that would include biogas, biomass, hydrokinetic energy, emerging run-of-river hydroelectric, fuel cells, small-scale or emerging wind technologies, solar thermal electric, and geothermal electric technologies. The program requires that prior to the end of 2016, distribution companies must individually solicit proposals for long-term PPAs with eligible generation facilities, with each utility organizing its own competitive procurement. The distribution companies are expected to release the Request for Proposals in early 2015. In July 2014, the Massachusetts legislature enacted Chapter 251, which adds “useful thermal energy” resources to the RPS. Useful thermal energy resources eligible for the RPS include any facilities that generate useful thermal energy using sunlight, biomass, bio-gas, liquid bio-fuel or naturally occurring temperature differences in ground, air or water. Additionally, the DOER adopted revised Class II regulations in June 2014, with changes targeting to reduce reliance on ACP and to address a persistent shortage of supply relative to demand targets, and mitigate retail rate impacts resulting from these persistent shortages. The regulations reduce the MA RPS Class II target from 3.6% each year to 1.75% for 2014, 2% for 2015, and for each compliance year thereafter the DOER will determine the target based on historic electricity sales and compliance.32 The regulations also increase the nameplate capacity of hydro facilities eligible for MA RPS Class II from 5 MW to 7.5 MW. Further, under the revised regulations, excess RPS Class II Waste Energy Generation Attributes are not available as Banked Compliance in 2014 and 2015. In 2016, Class II Waste Energy Generation Attributes cannot exceed 5% of the RPS Class II Waste Energy Generation Attributes needed by retail Electric Suppliers for compliance with the RPS Class II Waste Energy Minimum Standard in the year they were generated. Connecticut had its first RPS compliance year in 2004. Due to variations in its RPS eligibility standards compared to the rest of the region, Connecticut has historically had access to a larger pool of eligible supply.
31 An Early Compliance provision qualifying renewable energy produced in 2002 for the 2003 RPS requirement almost entirely alleviated the need for ACPs. 32 The MA RPS Class II Minimum Standard for Compliance Year 2016 and thereafter must not exceed 3.6% of total electrical energy sales by retail electricity suppliers to end-use customers.

23
As a result, no Penalty Payments (Connecticut did not formally adopt the term ACP) were required in either Compliance Year 2004 or 2005. In 2006, both investor-owned utilities plus one competitive supplier made Penalty Payments totaling nearly $3.5 million to compensate for an overall shortfall of renewable energy supply compared to RPS demand. Thereafter, Penalty Payments – for Class I only – totaled $115,335 in 2007; $60,240 in 2008; and $46,850 in 2009. In 2010, as the regional market began to trend towards REC shortage, the differential between Connecticut’s Penalty Payment (fixed at $55) and the other New England states’ ACP ($60.93 in 2010, escalating each year with the Consumer Price Index) caused available RECs to seek higher value markets outside of Connecticut (when eligibility allowed), leaving Connecticut load-serving entities to rely on alternative compliance mechanisms to fulfill their RPS obligations – ultimately making payments of $3,035,624 for the Compliance Year 2010; $21,699,670 for Compliance Year 2011; and $39,362,675 for Compliance Year 201233. The Connecticut Public Utilities Regulatory Authority (PURA, formerly known as the DPUC) has not yet released a comprehensive RPS compliance report for 2013. In June 2013, the Connecticut Legislature passed Public Act 13-303. Through the Act, Connecticut made several changes to its RPS. A “large scale hydropower” definition34 was added. Such hydro supply is not specified as a Class I resource, due in part to the legislative requirement that the production be “verifiable” and the Canadian provinces are currently without a REC tracking system. Large hydro facilities may become eligible, under limited circumstances, if both the verification and insufficiency of other Class 1 supply criteria are met. The legislation also requires the Connecticut Department of Energy and Environmental Protection (DEEP) to establish a “biomass and landfill gas phase-down” that would reduce (but not eliminate) the number of RECs per MWh granted to Class I biomass and landfill gas resources. Further, the legislation modified the definition of Class I renewable energy source to specifically state that generation counted towards another state’s RPS targets or renewable energy goals cannot be counted toward the Connecticut RPS. PURA is currently conducting an investigation to determine whether RECs generated from resources eligible for Vermont’s SPEED program used toward Connecticut RPS Class I compliance constitute a “double-counting” risk pursuant to the Act and whether such resources should be disqualified from Connecticut Class I. Connecticut regulators are also in the process of developing a 2014 Integrated Resource Plan (IRP). In the IRP, DEEP will establish a schedule for the biomass and landfill gas phase-down based on future resource adequacy. It will also develop a procurement strategy that benefits ratepayers and supports the state’s RPS targets. DEEP had not yet released the 2014 IRP at the time this report was drafted.
Maine’s first compliance year for its Class 1 RPS35 requirement was 2008. While there was eligible supply sufficient to meet the 1%requirement, an uneven distribution of REC ownership led to the payment of $693,103 in ACPs. ACPs decreased to $319,233 in 2009 and remained constant at $319,252 for Compliance Year 2010. ACPs declined drastically to $54,680 in 2011 and again to approximately $2,000 for Compliance Year 2012. ACPs for 2013 are not yet available. In the 2013 legislative session, Maine’s Governor proposed a Bill to remove the current 100 MW capacity cap on qualifying RPS Class I resources, which would allow large hydro to satisfy the state’s RPS. This 33 According to PURA’s Preliminary Findings on the Annual Review of Connecticut Electric Suppliers’ and Electric Distribution Companies Compliance with Connecticut’s Renewable Energy Portfolio Standards in the Year 2013, issued September 15, 2014. 34 The definition states: A hydropower facility that has a generating capacity of more than 30 megawatts and is located in ISO New England, adjacent control areas, or Newfoundland and Labrador. 35 Maine has had an “Existing” RPS requirement since 2000. An abundance of qualifying in-state supply has enabled the state to easily satisfy this requirement each year.

24
Bill, which had also been introduced in 2012, was ultimately carried over to the 2014 session. The bill did not pass the 2014 legislative session. Maine has also approved several applications from biomass plants seeking to qualify as Class I RPS resources under the refurbishment and resumed operations provisions of the Vintage section of their existing regulations. Certification of these facilities has likely relieved Maine of the need to build new generation in order to satisfy the Class I RPS targets for the foreseeable future. New Hampshire’s first compliance year for Class I was 2009. It was reported that no ACPs were made for Class I RPS compliance due to market surplus. In 2010, $26,321 in ACPs were made, reflecting a similar trend as Massachusetts, in which modest shortage conditions returned to the market. In 2011, the New Hampshire Public Utilities Commission (“NHPUC”) received a record $19.1 million in ACPs. ACPs for 2012 and 2013 totaled $9.1 million and $17.2 million respectively. However, these payments primarily resulted from a chronic shortage in the state’s Class III market (which targets existing biomass facilities). In June 2014, the NHPUC ordered a Class III target reduction from 1.5% to 0.5% in order to stem these payments. The NHPUC noted in its order that it has no plan to make similar adjustments to targets in other years or classes. Instead, it plans to investigate the possibility of aligning the NH Class III ACP price with those of neighboring states, such as Connecticut and Massachusetts. In September 2014, the New Hampshire Office of Energy and Planning (“OEP”) issued a 10-Year State Energy Strategy. The Strategy calls to strengthen and stabilize the NH RPS by (i) avoiding frequent changes, (ii) adjusting the state’s ACP prices to align with other New England states, and (iii) evaluating and, if necessary, adjusting the RPS targets to align with each RPS technology’s potential. Vermont’s Sustainably Priced Energy Enterprise Development (“SPEED”) program includes voluntary goals for 2012, 2017 and 2020, as well as a Standard Offer contracts program to provide long-term price certainty to small renewable energy projects. Until a binding RPS is implemented, Vermont utilities will be allowed to sell the Renewable Energy Credits associated with their electricity purchases to Obligated Entities in other New England states. Connecticut PURA is addressing how this practice interacts with Connecticut’s Public Act 13-303 “double-counting” provision, as discussed above. In the 2014 legislative session, the Vermont Legislature enacted Act 99. The legislation directs the Vermont Department of Public Service to, by the end of 2014, conduct a study and produce a report on the environmental and economic costs and benefits of (i) achieving the 2017 SPEED goal and (ii) adopting a RPS. While the report is not yet available, the Vermont legislature is expected to introduce RPS legislation in the 2015 session. The legislature anticipates that, if passed, a Vermont RPS will commence in 2017. Table 10 provides a summary of renewable energy standard annual percentage targets throughout New England, while Table 11 provides an estimate of the corresponding GWh RPS demand through 2021. The forecasted RPS obligations are based upon ISO-NE’s forecast of “Annual Energy Net of Passive Demand Resources,” found in their May 2014 CELT Report36 and adjusted to exclude any public or other utility exempted from a state’s RPS. For example, both Pascoag Utility District and Block Island Power Company have been removed from the forecast of Rhode Island REC demand.
36 The ISO-NE 2014 CELT Report is available at: http://www.iso-ne.com/system-planning/system-plans-studies/celt
25
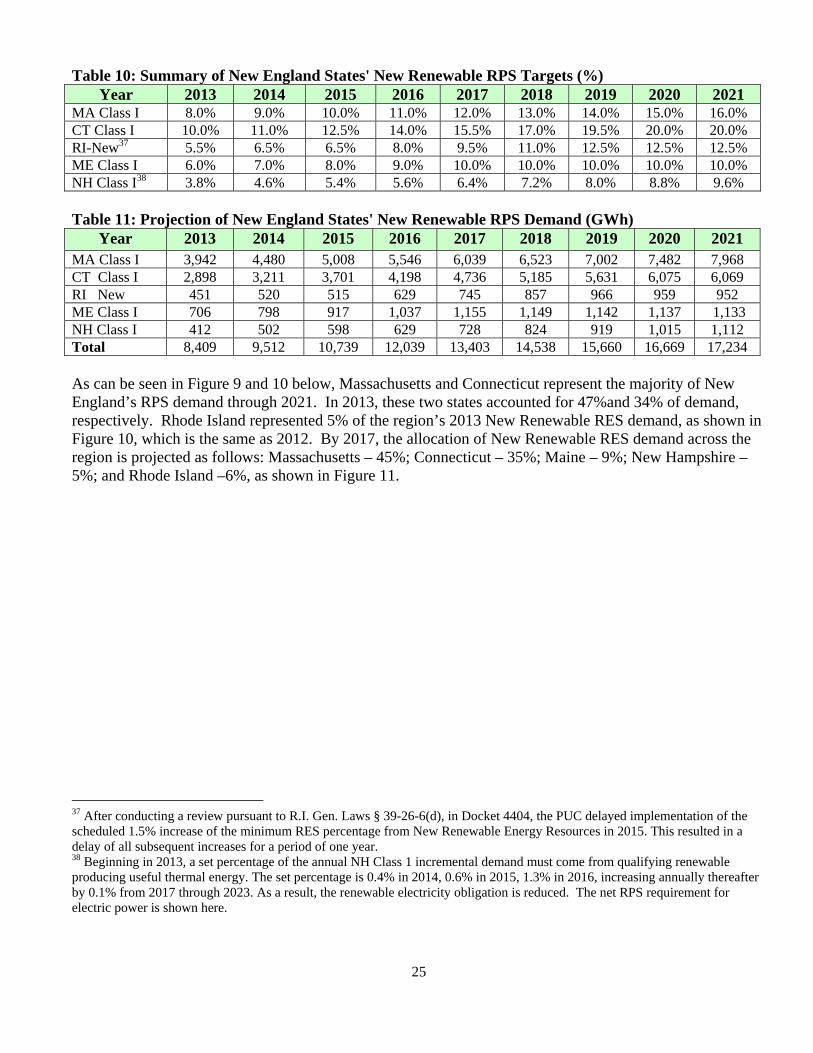
Table 10: Summary of New England States' New Renewable RPS Targets (%)
Year 2013 2014 2015 2016 2017 2018 2019 2020 2021 MA Class I 8.0% 9.0% 10.0% 11.0% 12.0% 13.0% 14.0% 15.0% 16.0% CT Class I 10.0% 11.0% 12.5% 14.0% 15.5% 17.0% 19.5% 20.0% 20.0% RI-New37 5.5% 6.5% 6.5% 8.0% 9.5% 11.0% 12.5% 12.5% 12.5% ME Class I 6.0% 7.0% 8.0% 9.0% 10.0% 10.0% 10.0% 10.0% 10.0% NH Class I38 3.8% 4.6% 5.4% 5.6% 6.4% 7.2% 8.0% 8.8% 9.6% Table 11: Projection of New England States' New Renewable RPS Demand (GWh)
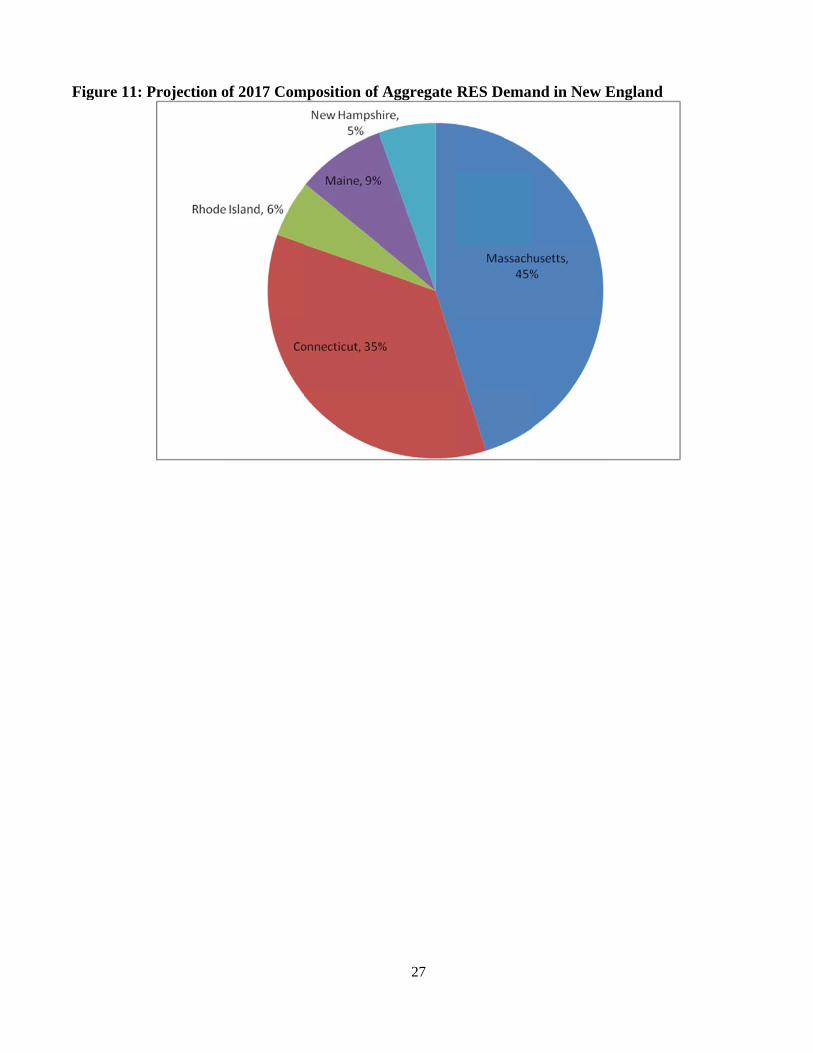
Year 2013 2014 2015 2016 2017 2018 2019 2020 2021 MA Class I 3,942 4,480 5,008 5,546 6,039 6,523 7,002 7,482 7,968 CT Class I 2,898 3,211 3,701 4,198 4,736 5,185 5,631 6,075 6,069 RI New 451 520 515 629 745 857 966 959 952 ME Class I 706 798 917 1,037 1,155 1,149 1,142 1,137 1,133 NH Class I 412 502 598 629 728 824 919 1,015 1,112 Total 8,409 9,512 10,739 12,039 13,403 14,538 15,660 16,669 17,234 As can be seen in Figure 9 and 10 below, Massachusetts and Connecticut represent the majority of New England’s RPS demand through 2021. In 2013, these two states accounted for 47%and 34% of demand, respectively. Rhode Island represented 5% of the region’s 2013 New Renewable RES demand, as shown in Figure 10, which is the same as 2012. By 2017, the allocation of New Renewable RES demand across the region is projected as follows: Massachusetts – 45%; Connecticut – 35%; Maine – 9%; New Hampshire – 5%; and Rhode Island –6%, as shown in Figure 11.
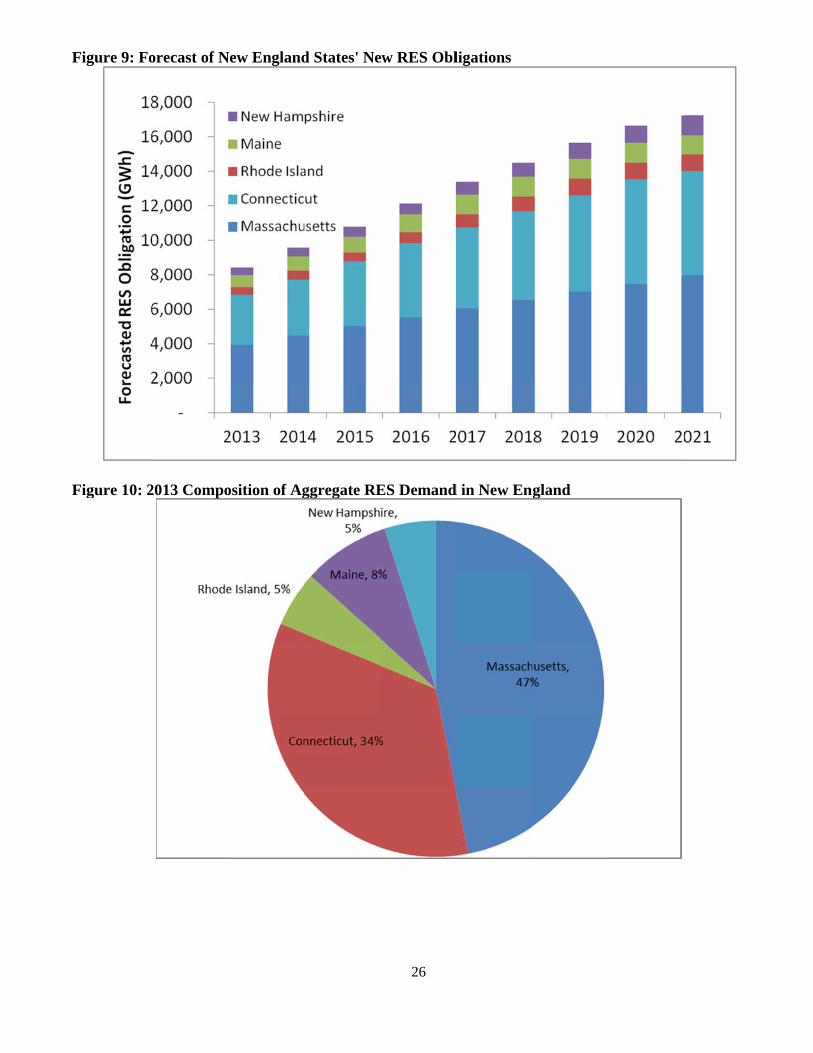
37 After conducting a review pursuant to R.I. Gen. Laws § 39-26-6(d), in Docket 4404, the PUC delayed implementation of the scheduled 1.5% increase of the minimum RES percentage from New Renewable Energy Resources in 2015. This resulted in a delay of all subsequent increases for a period of one year. 38 Beginning in 2013, a set percentage of the annual NH Class 1 incremental demand must come from qualifying renewable producing useful thermal energy. The set percentage is 0.4% in 2014, 0.6% in 2015, 1.3% in 2016, increasing annually thereafter by 0.1% from 2017 through 2023. As a result, the renewable electricity obligation is reduced. The net RPS requirement for electric power is shown here.
F
F
Figure 9: Fo
Figure 10: 2
orecast of N
2013 Compo
New England
osition of Ag
d States' Ne
ggregate RE
26
ew RES Obl
ES Demand
ligations
d in New England
FFigure 11: PProjection oof 2017 Commposition of
27
Aggregate RES Demannd in New EEngland

28
VII. Conclusion Based upon the PUC’s analysis of regulated utility data and general market trends, a shortage of New/Class 1 RECs may have persisted in Compliance Year 2013, although if such a shortage existed, it was at much reduced levels compared to 2011 and 2012. This evidence for a decreasing REC shortage manifested itself through the dramatically reduced reliance on ACPs for RES compliance – which was reduced to just 2% of 2012 payments. In addition, the number of 2013 RECs banked for future compliance years (19,531) greatly exceeded the total of ACPs (803) plus the RECs banked from 2011 and 2012 (7,482). This suggests that the market may once again be approaching equilibrium of supply and demand, and that the use of ACPs and REC banking in 2013 had more to do with an individual entity’s market analysis and hedging strategy than with a systemic REC shortage. As new capacity comes on-line and renewable energy imports increase, there is potential for this trend to continue. Implementation of long-term contracting policies, financing of new renewable supply and the increased interest in distributed generation all demonstrate progress toward achieving RES objectives. The number of facilities and the amount of potential generation certified under the Rhode Island RES also continues to increase. Since January 1, 2013, the PUC has approved or conditionally approved 60 renewable energy facilities for RES certification – 42 New, 13 Existing, and 5 units with split eligibility, comprised of both New and Existing generation. These generators combined for 939.7 MW of additional certified nameplate capacity. Facility certifications in 2014 (23 in total) fell short of those qualified in 2013 (32 in total). While there were fewer units qualified in 2014 than in 2013, there were still many more than in 2012 (12 in total). Overall, as of December 31, 2014, there were 158 qualified renewable energy resource facilities approved or conditionally approved under the Rhode Island RES, accounting for nearly 1,965 MW of renewable energy nameplate capacity. Growth should continue as new policy initiatives supporting the renewable energy industry take hold, and local and regional economic conditions improve. The PUC will continue to examine and report on these trends in future compliance reports. The success of the state’s Renewable Energy Standard and growth in the number of qualified renewable energy facilities since 2007 leaves the PUC cautiously optimistic that the RES and similar programs throughout New England will continue to spur renewable energy development in the region. It is important to note, however, that the continued availability of long-term contracts and access to renewable energy financing are important to sustaining regional RPS success. Based on recent policies established and revised within Rhode Island, including long-term contracting statutes and the Renewable Energy Growth program, the state remains a leader in this critical area of policy support. Elsewhere in New England, a shortage of long-term contracting appetite compared to the pipeline of renewable energy supply necessary to meet RES targets may affect New England’s collective ability to meet established renewable energy standards in the mid- and long-term. Continuing efforts by all states (either jointly or separately) to implement and/or expand long-term contracting policies throughout New England is important to the success of each state’s renewable energy objectives. While the PUC regards the Compliance Year 2013 a success, it also recognizes the rising costs associated with fulfilling this and other renewable energy mandates, and remains concerned about their impact on Rhode Island’s ratepayers. In the coming year, the PUC will continue to monitor the regional renewable energy marketplace and the state’s ability to achieve its established targets in a just and reasonable manner.

29
Appendix 1: Certified New Renewable Energy Resources
The following pages list generating units that have been approved by the Rhode Island Public Utilities PUC, either in whole or in part, as New Renewable Energy Resources (as of December 31, 2014). To view the most current RES applications status report, please visit: www.ripuc.org/utilityinfo/res.html. Table A1: Approved New Renewable Energy Resources as of December 31, 2014
Unit Name Location: City, State Fuel Type Nameplate Capacity
(MW)
% of output approved as
New
Year Approved
Johnston Landfill Expansion Phase 1 Johnston, RI LFG 2.4 100% 2007Johnston Landfill Expansion Phase 2 Johnston, RI LFG 6 100% 2007Pawtucket Hydropower Pawtucket, RI Hydro 1.35 47% 2007Portsmouth Abbey Wind Rurbine Portsmouth, RI Wind 0.67 100% 2007North Hartland Hydroelectric Project Hartland, VT Hydro 4.664 25.60% 2007Schiller Station Unit 5 Portsmouth, NH Biomass 50 100% 2007Pioneer Hydro Electric Co., Inc. Ware, MA Hydro 1.6 50.40% 2007Coventry Landfill Units 1 - 3 Coventry, VT LFG 4.8 100% 2008Coventry Landfill Unit 4 & 5 Coventry, VT LFG 3.2 100% 2008Attleboro Energy - QF Attleboro, MA LFG 1.5 100% 2008Pepperell Hydro East Pepperell, MA Hydro 1.92 53.20% 2008Woronoco Hydro Russell, MA Hydro 2.7 37.40% 2008Quarry Energy Project Quincy, MA LFG 0.6 100% 2008UNH Power Plant Durham, NH LFG 4.6 100% 2009Portsmouth Wind Portsmouth, RI Wind 1.5 100% 2009Lempster Wind Lempster, NH Wind 24 100% 2009Pine Tree Landfill Hampden,ME LFG 3.17 100% 2009Fitchburg Landfill Westminster, MA LFG 4.8 100% 2009Crossroads Norridgewock,ME LFG 3.2 100% 2009Thundermist Hydopower Woonsocket, RI Hydro 1.1 25.90% 2009Seaman Energy LLC Gardner, MA LFG 1.62 100% 2010Bay Center Providence, RI Solar 0.02 100% 2010Rhode Island LFG Genco* Johnston, RI LFG 33.4 100% 2010Stetson Wind Farm Stetson Mountain, ME Wind 57 100% 2011Stetson II Wind Farm Stetson Mountain, ME Wind 25.5 100% 2011Toray Solar #1 North Kingstown, RI Solar 0.405 100% 2011Sheffield Wind Plant Sheffield, VT Wind 40 100% 2012Putts Bridge Project Ludlow, MA Hydro 3.9 19.19% 2012Red Bridge Project Wilbraham, MA Hydro 4.5 20.06% 2012Berkshire Wind Power Lanesborough, MA Wind 15 100% 2012Record Hill Wind Roxbury, ME Wind 50.6 100% 2012Granite Reliable Wind Project Coos County, NH Wind 99 100% 2012Sandywoods Farm 275kW Vergnet Turbine Tiverton, RI Wind 0.275 100% 2012Orono B Hydroelectric Project* Orono, ME Hydro 3.75 100% 2012Exeter Agri-Energy Exeter, ME Biomass 0.98 100% 2012Ipswich Wind I Ipswich, MA Wind 1.6 100% 2012
The following generators are located within ISO-NE:
* Conditionally approved.
Shading indicates newly approved facility since last compliance report

30
Table A1: Approved New Renewable Energy Resources as of December 31, 2014 (Continued)
Unit Name Location: City, State Fuel Type Nameplate Capacity
(MW)
% of output approved as
New
Year Approved
Ice House Partners, Inc. Ayer, MA Hydro 0.28 100% 2013Hopkinton Hydro Project Contocook, NH Hydro 0.25 42.75% 2013Kingdom Community Wind Lowell, VT Wind 63 100% 2013WED NK GREEN North Kingstown, RI Wind 1.5 100% 2013Georgia Mountain Community Wind Milton, VT Wind 10 100% 2013Narragansett Bay Commission Field's Point Wind Turbines
Providence, RI Wind 4.5 100% 2013
Camelot Wind Plymouth, MA Wind 1.5 100% 2013Newport Hydro Newport, VT Hydro 4 22% 2013ACP Solar I Middletown, RI Solar 0.49 100% 2013West Greenwich Solar West Greenwich, RI Solar 2.158 100% 2013North Hartland Bypass Flow Turbine North Hartland, VT Hydro 0.138 100% 2013Covanta West Enfield West Enfield, ME Biomass 27.2 80% 2013Wyre Wynd Hydroelectric Project Jewett City, CT Hydro 2.78 20% 2013CMS Solar Jamestown, RI Solar 0.1283 100% 2013Comtram Cable Plant Cumberland, RI Solar 0.49838 100% 2013Pemwigas-Indeck Alexandria Alexandria, NH Biomass 15.2 100% 2013Verso Bucksport LLC-TG5 Bucksport, ME Biomass 24 100% 2013CCI New England 500 kW (DC) Solar PV Portsmouth, NH Solar 0.498 100% 2013West Davisville Solar North Kingstown, RI Solar 2 100% 2013Forbes Street Solar Riverside, RI Solar 3 100% 2013Orange #1 and Orange #2 (Mini-Watt Hydro) Orange, MA Hydro 0.455 37% 2013
Burgess Biopower Berlin, NH Biomass 76.5 100% 2014
Dean's Warehouse I Cumberland, RI Solar 0.4992 100% 2014
Re-Migio Providence, RI Solar 0.29185 100% 2014
Dean's Warehouse II Cumberland, RI Solar 0.4999 100% 2014
Little Bag Providence, RI Solar 1.4997 100% 2014
CCI New England 181 kW (DC) Solar PV West Warwick Solar 0.181 100% 2014
Maplehurst Farm Methane Greensboro, VT Biogas 0.15 100% 2014
Golden Ale Realty LLC 406 kW (DC) Solar PV Cranston, RI Solar 0.406 100% 2014
West Charleston Hydro West Charleston, VT Hydro 0.675 100% 2014
All American Solar, LLC North Kingstown, RI Solar 0.33 100% 2014
Richmond Solar * Richmond, RI Solar 0.499 100% 2014
T.E.A.M. Inc. Solar Woonsocket, RI Solar 0.128 100% 2014
Steere Electric, LLC * Chepachet, RI Solar 0.0918 100% 2014
Newport Vineyard and Winery LLC Middletown, RI Solar 0.0518 100% 2014
Troy Hydro Project Troy, VT Hydro 0.816 100% 2014
NextSun Energy North Smithfield Smithfield, RI Solar 0.85 100% 2014
SER Solar Facility 23 Appian Way Smithfield, RI Solar 0.05247 100% 2014
The following generators are located within ISO-NE:
* Conditionally approved.
Shading indicates newly approved facility since last compliance report

31
Table A1: Approved New Renewable Energy Resources as of December 31, 2014 (Continued)
Unit Name Location: City, State Fuel Type Nameplate Capacity
(MW)
% of output approved as
New
Year Approved
Higley Hydro Colton, NY Hydro 6.2 100% 2006Colonie Cohoes, NY LFG 4.8 100% 2007Model City Youngstown, NY LFG 5.6 100% 2007Modern Youngstown, NY LFG 6.4 100% 2007DANC Rodman, NY LFG 4.8 100% 2007Mill Seat Landfill Bergen, NY LFG 6.4 100% 2008Chaffee Landfill Chaffee, NY LFG 4.8 100% 2008Hyland Landfill Angelica, NY LFG 4.8 100% 2008Clinton Landfill Morrisonville, NY LFG 4.8 100% 2008High Acres I Fairport, NY LFG 3.2 35.80% 2009High Acres II Fairport, NY LFG 6.4 100% 2009Madison County Canastota, NY LFG 1.6 100% 2009Cohocton & Dutch Hill Wind Farm Cohocton, NY Wind 125 100% 2011Synergy Biogas, LLC Wyoming, NY Biomass 1.426 100% 2012Steuben Landfill Bath, NY LFG 3.2 100% 2013Noble Altona Windpark Altona, NY Wind 97.5 100% 2013Noble Wethersfield Bliss, NY Wind 126 100% 2013Noble Chateaugay Churubusco, NY Wind 106.5 100% 2013Gouldtown Development Lyondsdale, NY Hydro 2 100% 2013Howard Wind Farm Hornell, NY Wind 55.35 100% 2013Noble Clinton Windpark I Churubusco, NY Wind 100.5 100% 2014Noble Ellenburg Windpark Churubuso, NY Wind 81 100% 2014Noble Bliss Windpark Bliss, NY Wind 100.5 100% 2014
The following generators are located in control areas adjacent to ISO-NE:
* Conditionally approved.
Shading indicates newly approved facility since last compliance report
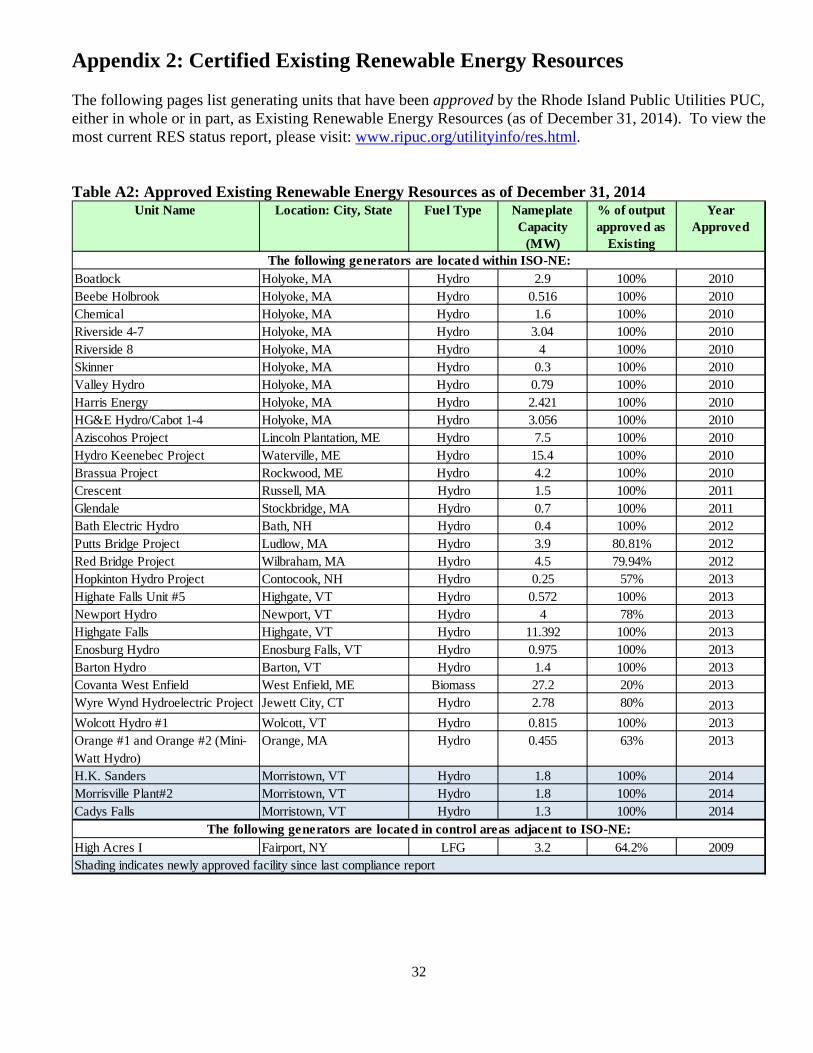
32
Appendix 2: Certified Existing Renewable Energy Resources The following pages list generating units that have been approved by the Rhode Island Public Utilities PUC, either in whole or in part, as Existing Renewable Energy Resources (as of December 31, 2014). To view the most current RES status report, please visit: www.ripuc.org/utilityinfo/res.html. Table A2: Approved Existing Renewable Energy Resources as of December 31, 2014
Unit Name Location: City, State Fuel Type Nameplate Capacity
(MW)
% of output approved as
Existing
YearApproved
Boatlock Holyoke, MA Hydro 2.9 100% 2010Beebe Holbrook Holyoke, MA Hydro 0.516 100% 2010Chemical Holyoke, MA Hydro 1.6 100% 2010Riverside 4-7 Holyoke, MA Hydro 3.04 100% 2010Riverside 8 Holyoke, MA Hydro 4 100% 2010Skinner Holyoke, MA Hydro 0.3 100% 2010Valley Hydro Holyoke, MA Hydro 0.79 100% 2010Harris Energy Holyoke, MA Hydro 2.421 100% 2010HG&E Hydro/Cabot 1-4 Holyoke, MA Hydro 3.056 100% 2010Aziscohos Project Lincoln Plantation, ME Hydro 7.5 100% 2010Hydro Keenebec Project Waterville, ME Hydro 15.4 100% 2010Brassua Project Rockwood, ME Hydro 4.2 100% 2010Crescent Russell, MA Hydro 1.5 100% 2011Glendale Stockbridge, MA Hydro 0.7 100% 2011Bath Electric Hydro Bath, NH Hydro 0.4 100% 2012Putts Bridge Project Ludlow, MA Hydro 3.9 80.81% 2012Red Bridge Project Wilbraham, MA Hydro 4.5 79.94% 2012Hopkinton Hydro Project Contocook, NH Hydro 0.25 57% 2013Highate Falls Unit #5 Highgate, VT Hydro 0.572 100% 2013Newport Hydro Newport, VT Hydro 4 78% 2013Highgate Falls Highgate, VT Hydro 11.392 100% 2013Enosburg Hydro Enosburg Falls, VT Hydro 0.975 100% 2013Barton Hydro Barton, VT Hydro 1.4 100% 2013Covanta West Enfield West Enfield, ME Biomass 27.2 20% 2013Wyre Wynd Hydroelectric Project Jewett City, CT Hydro 2.78 80% 2013Wolcott Hydro #1 Wolcott, VT Hydro 0.815 100% 2013Orange #1 and Orange #2 (Mini-Watt Hydro)
Orange, MA Hydro 0.455 63% 2013
H.K. Sanders Morristown, VT Hydro 1.8 100% 2014Morrisville Plant#2 Morristown, VT Hydro 1.8 100% 2014Cadys Falls Morristown, VT Hydro 1.3 100% 2014
High Acres I Fairport, NY LFG 3.2 64.2% 2009
The following generators are located within ISO-NE:
The following generators are located in control areas adjacent to ISO-NE:
Shading indicates newly approved facility since last compliance report

33
Appendix 3: Alternative Compliance Payments
Section 7.3 of the Rhode Island Rules and Regulations Implementing a Renewable Energy Standard (RES Rules) permits Obligated Entities to meet the RES either through the purchase and retirement of NEPOOL GIS Certificates or through the provision of Alternative compliance payments (ACPs), obtained by making payment to the Rhode Island Commerce Corporation, now known as the Rhode Island Commerce Corporation. The Rhode Island Commerce Corporation sets these funds aside in the Renewable Energy Development Fund to support renewable energy development. The ACP rate is the same for both New and Existing obligations. Section 3.2 of the RES Rules states that ACPs must be made at a rate of $50 per MWh of renewable energy obligation, in 2003 dollars, adjusted annually by the annual change in the United States Bureau of Labor Statistics’ Consumer Price Index. Additionally, Section 7.9 of the Rules states that the PUC will publish the ACP rate by January 31 of each Compliance Year. For Compliance Year 2013, the ACP rate was $65.27 per MWh of obligation. Table A3.1: Historical ACP Rate
Compliance
ACP Rate Year
2007 $57.12
2008 $58.58
2009 $60.92
2010 $60.93
2011 $62.13
2012 $64.02
2013 $65.27
2014 $66.16 Connecticut, Maine, Massachusetts, and New Hampshire all have similar ACP mechanisms – although New Hampshire passed legislation in 2012 to adjust the 2013 ACP downward to $55.00 with subsequent escalations of only one-half of the Consumer Price Index thereafter. The Table below shows the 2013 ACP rates used by other New England states for the various REC classes defined in each state.
Table A3.1: Regional ACP Rates for Compliance Year 2013 2013 ACP
Rates CT ME MA NH
Class I $55 $65.28 $65.27 $55.00
Class II $55 N/A $26.79 $55.00
Class III $31 N/A N/A $31.50
Class IV N/A N/A N/A $26.50

34
Appendix 4: Rhode Island RES 2013 Compliance Summary39 Table A4: 2013 Compliance Summary by Obligated Entity
39 Please note that data for individual competitive suppliers is confidential and not subject to public release.
Retail Sales (from filing)
Banked "New" RECs for Future
Compliance
Load (MWh) 5.5% "New" Obligation
2.0% "Existing" Obligation
"New" RECs
Banked from 2011
or 2012
Total "New" RECs
"Existing" RECs
"New" Applied to Existing
"New" (MWh)
"Existing" (MWh)
RECs Eligible for 2014 or 2015
Inputs 5.5% of column C 2% of column CDistribution CompaniesNarragansett 5,451,409 299,828 109,029 297,402 4,592 301,994 109,029 0 0 0 2,166
Competetive SuppliersAmbit Northeast, LLCConEdison SolutionsConstellation NewEnergy, Inc.Devonshire Energy, LLCDirect Energy Business, LLCFirst Point Power (BP Energy Company)Gexa Energy, LLCGlacial Energy of New England, Inc.Gulf Oil Limited PartnershipHess CorporationIntegrys Energy Services (Narragansett WPS Load)Liberty Power Holdings LLCMint Energy, LLCNoble Americas Gas & Power Corp.North American Power and GasSJH Energy LLC (Freedon Energy Logistics, LLC)South Jersey Energy Co. (Halifax American Operating Co. and Emera Energy)TransCanada Power Marketing Ltd.Westerly Hospital Energy Company LLC (Freedom Energy Logistics, LLC)XOOM Energy, LLC
subtotal 2,742,570 150,850 54,862 164,859 2,890 167,749 146,483 207 803 61 17,365
Totals 8,193,979 450,678 163,891 462,261 7,482 469,743 255,512 207 803 61 19,531
Obligated Entity
RES Obligations (MWh) NEPOOL GIS Certificates Alternative Compliance Payments

A
Tp F
Ilwr
Appendix
The charts bepurchased by
Figure A5.1
In 2013 therelast two comwhich encomremained ste
x 5: Histo
elow providey Rhode Isla
: Historical
e was a signimpliance yearmpassed 59.2eady making
orical Br
e additional and’s Obligat
l New REC
ificant incrers. There wa2% of settled
up 23.9% o
3
reakdown
detail on theted Entities
Source by F
ase in the reas also a majod New RECsf settled New
35
n of Com
e breakdownfor the perio
Fuel Type
liance on bioor decrease is in 2012 andw RECs in 2
mpliance
n of New andod 2007-201
omass generin reliance od only 15.1%2013 and 23.
Sources
d Existing R3.
ration, compon wind gene% in 2013. L.7% in 2012
RECs
pared to the eration, Landfill Gas.
s

F
I2HnIi
Figure A5.2
In 2013, Rho2013 18.6% Hampshire anotable dropIn 2012 Newn 2013.
: Historical
ode Island emof A notable
accounted forin the settle
w York based
l New REC
merged as a e increase inr 36.4% of s
ed New RECd RECs acco
3
Source by L
producer of n New Hampsettled New RCs coming froounted for 53
36
Location
f based RECspshire based RECs in 201om New Yo3% of settled
s emerged asRECs occur
13, up from ork (Imports)d New RECs
s settled Newrred in 201314.1% in 20) also occurrs, but droppe
w RECs. In . New
012. A red in 2013. ed to 12.1%

T
Table A5.1:
2007
2008
2009
2010
2011
2012
2013
Historic UtNe
MWh
3,563
295
1
192
84,402
35,195
803
Figure
tilization of ew
$
203,51
17,28
61
11,699
5,243,8
2,253,1
52,412
A5.3: Histo
3
f Alternative
M
19 2
1 7
9 1
96
84
2 6
orical Existi
37
e ComplianExisting
MWh
227
77
1
166
3
2
61
ing REC So
ce Payment
$
12,966
4,511
61
10,114
186
128
3,981
ource by Fu
ts (ACPs) Tota
MWh
3,790
372
2
358
84,405
35,197
864
uel Type
al
$
$216,485
$21,792
$122
$21,813
$5,244,083
$2,253,312
$56,393
3
2
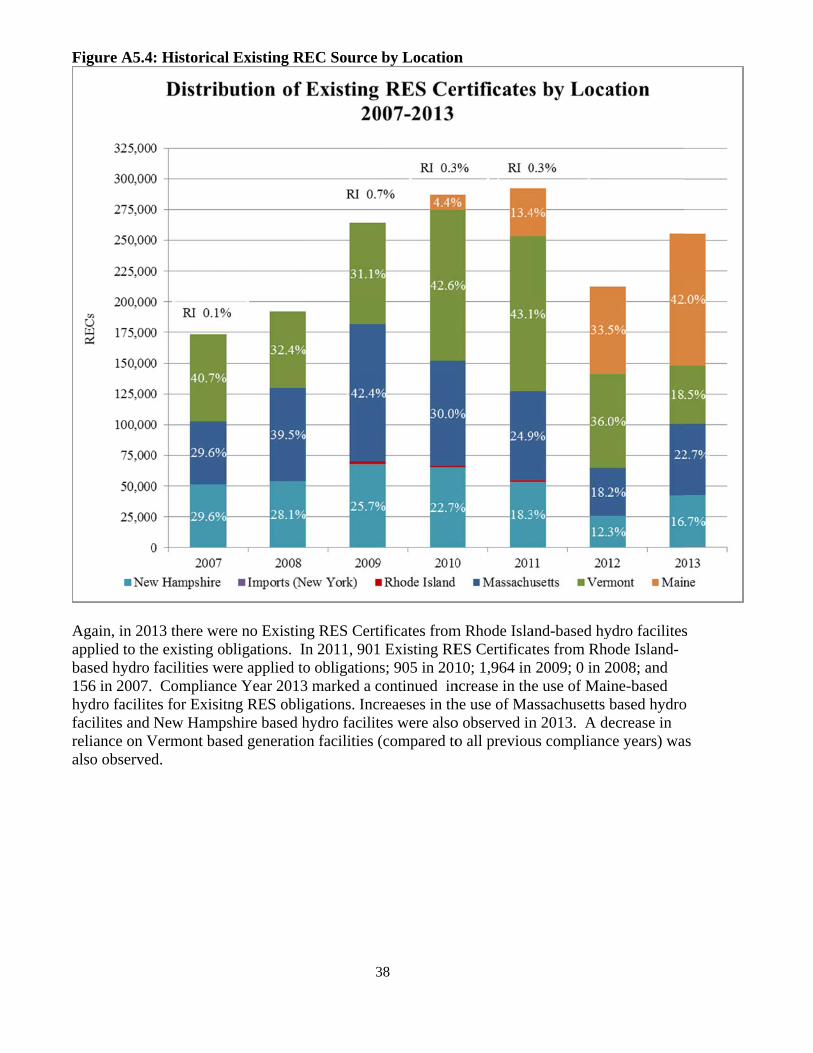
F
Aab1hfra
Figure A5.4
Again, in 20applied to thbased hydro 156 in 2007.hydro facilitefacilites and reliance on Valso observed
: Historical
13 there were existing obfacilities we Compliances for ExisitnNew Hamps
Vermont basd.
l Existing R
re no Existinbligations. Iere applied toce Year 2013ng RES oblishire based hed generatio
3
REC Source
ng RES CertiIn 2011, 901o obligations3 marked a cigations. Incrhydro faciliton facilities (
38
by Location
ificates from Existing REs; 905 in 201
continued inreaeses in thes were also(compared to
n
m Rhode IslaES Certificat10; 1,964 in
ncrease in thehe use of Mao observed ino all previou
and-based hytes from Rho2009; 0 in 2
e use of Maiassachusetts n 2013. A dus complianc
ydro facilitesode Island-2008; and ine-based based hydroecrease in ce years) wa
s
o
as

F
Figure A5.5: Historicall Banking of
3
f New RECs
39
s for Futuree Use

40
Appendix 6: Voluntary Clean Energy Programs
As a competitive retail electricity market, Rhode Island provides load serving entities with the opportunity to offer customized electric supply options to both their existing and prospective retail customers. One example of such an offer is for the voluntary purchase of renewable energy resources above and beyond the state’s minimum RES requirements. Collectively, the offers of such products are known as voluntary clean energy programs or as the voluntary green power market.40 National Grid’s “GreenUp” program is just one example. For Compliance Year 2013, National Grid and one competitive supplier reported the purchase of RECs on behalf of end-use customers as part of voluntary clean energy programs. The table below provides a summary of the quantities of voluntary REC purchases made on behalf of customers. Table A6.1 History of Voluntary REC Purchases on Behalf of RI Customers
New RECs 2008 2009 2010 2011 2012 2013
A Total New RECs settled in Rhode Island on behalf of end-use customers for voluntary clean energy programs
5,350 7,480 6,642 3,750 689 111
A.1 New Voluntary RECs – National Grid 5,161 6,833 4,366 1,474 689 111
A.2 New Voluntary RECs – All Competitive Suppliers
189 647 2,276 2,276 0 0
Existing RECs 2008 2009 2010 2011 2012 2013
B Existing RECs settled in Rhode Island on behalf of end-use customers for voluntary clean energy programs
7,624 2,603 0 0 538 2,181
B.1 Existing Voluntary RECs – National Grid
7,624 2,603 0 0 338 1,181
B.2 Existing Voluntary RECs – Competitive Suppliers
0 0 0 0 200 1,000
The NEPOOL GIS Certificate, or REC, is the currency used to demonstrate compliance not only with the mandatory RES, but also with voluntary renewable energy transactions. Through the use of GIS Certificates, which are created and transferred exclusively within the NEPOOL GIS, and the annual submission of RES compliance reports, the PUC ensures that a NEPOOL GIS Certificate used for RES compliance has not also been used to satisfy another obligation in
40 By comparison, the RES is referred to as the “mandatory” or “compliance” renewable energy market.

41
Rhode Island or any other jurisdiction. For example, National Grid hosts voluntary renewable energy programs in both Rhode Island and Massachusetts. The use of NEPOOL GIS Certificates and the annual review of RES Compliance Reports ensure that each MWh of renewable energy production is used to meet only one obligation. This prohibition on double-counting is codified at Section 7.10(iii)(e) of the RES Rules, which states:
Assurances satisfactory to the [PUC] that the New or Existing Renewable NEPOOL GIS Certificates have not otherwise been, nor will be, sold, retired, claimed or represented as part of electrical energy output or sales, or used to satisfy obligations in jurisdictions other than Rhode Island.
While voluntary markets represent only a small fraction of NEPOOL GIS Certificates, it is nonetheless important to the integrity of both programs that all certificates are tracked and settled appropriately.