Embed Size (px)
Citation preview
NERC | 2013 Special Reliability Assessment: Increasing Dependence on Natural Gas for Electric Power, Phase II | March 2013
2013 Special Reliability Assessment:
Accommodating an Increased Dependence on Natural Gas for Electric Power Phase II: A Vulnerability and Scenario Assessment for the North American Bulk Power System
May 2013
3353 Peachtree Road NE Suite 600, North Tower
Atlanta, GA 30326 404-446-2560 | www.nerc.com

NERC | 2013 Special Reliability Assessment: Accommodating an Increasing Dependence on Natural Gas for Electric Power | May 2013
Acknowledgements Apart from the efforts of NERC Staff, the success of any reliability assessment depends
largely on the guidance and input of many others. NERC wishes to take this opportunity to express appreciation for the organizations, stakeholders, and subject‐matter experts that have been instrumental
in the successful completion of this special reliability assessment. This includes:
NERC Board of Trustees NERC Members Representative Committee Members
NERC Planning Committee Members NERC Operating Committee Members
NERC Reliability Assessment Subcommittee Members The Interstate Natural Gas Association of America
The Natural Gas Supply Association The Electric Power Supply Association
ICF International, Inc. Energy Ventures Analysis
NERC also expresses appreciation to the regional study groups across North America that have spearheaded robust regional
analysis efforts to better understand the gas and electric interface and associated risks.

NERC | 2013 Special Reliability Assessment: Accommodating an Increased Dependence on Natural Gas for Electric Power | May 2013
Table of Contents Executive Summary ..................................................................................................................................................................... 1 Chapter 1—Introduction .............................................................................................................................................................. 7 Chapter 2—Interface Between Two Industries ......................................................................................................................... 11 Chapter 3—Gas Supply Vulnerabilities ...................................................................................................................................... 26 Chapter 4—Scenario Reliability Assessments ............................................................................................................................ 35 Chapter 5—Methods for Analyzing Natural Gas Demand and Infrastructure for Electric Power Needs .................................. 41 Chapter 6—Enhancing Resource Adequacy Assessments ......................................................................................................... 59 Chapter 7—Performance Analysis of Generator Outages ......................................................................................................... 71 Chapter 8—Risk Assessment for Electric Reliability .................................................................................................................. 76 Chapter 9—Key Findings and Recommendations ...................................................................................................................... 87 Appendix I: Consolidation of Reports and Studies ..................................................................................................................... 94 Appendix II: Regional Analysis of Generator Outages ............................................................................................................. 105 Appendix III: Terms Used in This Report .................................................................................................................................. 114

NERC | 2013 Special Reliability Assessment: Accommodating an Increasing Dependence on Natural Gas for Electric Power | May 2013 1 of 114
Executive Summary A comprehensive understanding of the complexity of the changing bulk power system is key to developing prompt industry
actions that achieve effective reliability outcomes. NERC Reliability Assessments provide a technical platform for important
policy discussions on challenges facing the interconnected North American bulk power system. The trends identified in
previous Long‐Term Reliability Assessments have highlighted significant increases in gas‐fired generation to meet increasing
electric demand as well as replace retiring coal‐fired generation. By identifying and quantifying the risks of emerging
reliability issues, NERC is able to provide risk‐informed recommendations and support a learning environment for industry
to pursue improved reliability performance.
NERC’s statutory role is to conduct periodic, independent assessments of the reliability and adequacy of the BPS. NERC’s
2011 and 2012 Long‐Term Reliability Assessments identified that increased dependency on gas‐fired generation can amplify
the exposure of the BPS to disruptions in fuel supply, fuel transportation, and delivery. In light of NERC’s effort to
incorporate gas–electric interdependencies into its periodic reliability assessments, this report (1) determines the different
risks that can affect BPS reliability, (2) identifies ways to minimize vulnerabilities, and (3) identifies areas where coordinated
interindustry efforts could provide enhanced system reliability.
The combination of growth in natural gas demand within the electricity sector and its changing status among the gas‐
consuming sectors continues to significantly increase the interdependencies between the gas and electricity industries. As a
result, the interface between the two industries has become the focus of industry discussions and policy considerations. In
its effort to maintain and improve the reliability of North America’s bulk power system (BPS), NERC examined this issue in
detail and developed recommendations for the power industry. These recommendations will help improve existing
coordination between the gas and electricity sectors and facilitate the reliable operation of the two industries. NERC
approached this issue solely from a reliability point of view.
Addressing interdependence issues requires a coordinated approach for minimizing the risks and vulnerabilities on bulk
power and gas systems. This report focuses on the electric industry’s dependence on natural gas and offers
recommendations for reducing BPS exposure to increasing natural gas dependency risks. As described in NERC’s 2011
Special Assessment Report: A Primer of the Natural Gas and Electric Power Interdependency in the United States, the key
findings and recommendations presented in this report apply to natural gas used for power generation for several reasons:
1. Over the past decade, natural gas‐fired generation rose significantly from 17 percent to 25 percent of U.S. power
generation and is now the largest fuel source for generation capacity. Gas use is expected to continue to increase
in the future, both in absolute terms and as a share of total power generation and capacity.
2. Unlike coal and fuel oil, natural gas is not easily stored on‐site. As a result, real‐time delivery of natural gas through
a network of pipelines and bulk gas storage is critical to support electric generators.
3. Natural gas is widely used outside the power sector, and the demand from other sectors—particularly coincident
end‐user gas peak demand during cold winter weather—critically affects the ability to deliver interruptible
transportation service in the power sector. Additionally, demand for natural gas is expected to grow in other
sectors (e.g., transportation, exports, and manufacturing).
4. While extremely rare, disruptions in natural gas supply and/or transportation to power generators have prompted
industry to seek an understanding of the reliability implications associated with increasing gas‐fired generation.
Contracts for firm natural gas supply and transportation affect the risk profile of each power plant (or group of
power plants); therefore, a framework for analysis is needed to understand the cumulative impacts of an area’s
gas‐fired capacity.

Executive Summary
NERC | 2013 Special Reliability Assessment: Accommodating an Increasing Dependence on Natural Gas for Electric Power | May 2013 2 of 114
5. Natural gas is expected to play a growing role in offsetting the variability and uncertainty associated with
renewable resources, mainly wind generation. As variable generation increases, swings in variable generation may
call for dispatch of gas‐fired generation at a larger and less predictable rate.
The electricity sector’s growing reliance on natural gas raises concerns from Independent System Operators (ISOs), Regional
Transmission Organizations (RTOs), market participants, industrial electricity and gas consumers, national and regional
regulatory bodies, and other government officials regarding the ability to maintain electric system reliability when the
capacity to deliver natural gas supplies to power generators is constrained. The extent of these concerns vary from region
to region; however, they are most acute in areas where power generators rely on interruptible gas pipeline transportation
and where the growth in gas use for power generation is growing the fastest.
Accordingly, this has refocused gas supply and infrastructure adequacy concerns in some areas, causing industry and
policymakers to refocus attention on gas–electric interactions. Several regional efforts have been made—including NERC’s
own—to analyze the potential problem and to consider fuel supply and transportation adequacy as a formal part of electric
reliability assessments.
NERC assesses reliability concerns based on fundamental principles: BPS reliability must be maintained, regardless of the
generation mix and all generation must contribute to system reliability within its physical capabilities. Therefore, solution
sets that are implemented in the future should consider the reliability concepts presented in this report. Additionally, a
constant theme throughout this report is the need for inter‐industry coordination be focused at the regional level, because of both significant differences in operational characteristics as well as regulatory rules and market environments.
NERC will determine if further action on this issue is necessary by using an advisory committee for strategic guidance. This
includes organizing a group of subject matter experts, allowing for technical committee reviews, and prioritizing risks. Risk
management is inherent in the electricity industry’s role in providing reliable power to its customers. However, it is
important to acknowledge that reliability comes at a cost, and the electricity industry must be positioned to maintain
reliability taking into account future changes to the resource mix. Policymakers and regulators should address the issue of
cost and find the right balance between electric reliability and the increased costs associated with it.
This report is an effort to explain the main analytic issues, offer suggestions on how natural gas supply and pipeline
adequacy can be measured, and incorporate those results into both short‐term and long‐term resource adequacy
assessments that are conducted by the electricity industry. When analyzing and discussing risks from gas dependencies, it is
essential that vulnerabilities and associated impacts are distinctly discussed—those that are related to unexpected
disruptions to natural gas facilities (leading to natural gas curtailments) and those that are related to gas transportation
interruptions.
The degree of industry response and action is dependent on the region‐specific challenges. In regions where this issue is
emerging on a broader scale, enhancements to planning processes that integrate gas availability into resource planning
analyses will likely be the first course of action. Through comprehensive analysis, vulnerabilities can be identified in the
planning stages (1 to 10 years) and risks can effectively be managed. These studies provide the foundation for state,
federal, and provincial regulators, policymakers, and system planners to implement changes and send accurate signals to
the electricity market for future needs of the bulk power system. Additionally, these studies allow for solution sets to be
measurable and achievable. Accurate representations of potential vulnerabilities through comprehensive planning studies
are key in aiding risk‐informed policy decisions.
From an operations perspective, seasonal preparations, operational planning, and real‐time operating procedures need to
reflect formalized coordination with the gas pipeline industry, with specific focus on emergency procedures during extreme
events.

Executive Summary
NERC | 2013 Special Reliability Assessment: Accommodating an Increasing Dependence on Natural Gas for Electric Power | May 20133 of 114
Key Findings and Recommendations NERC’s key findings in this report are categorized into two planning and operating timeframes: Long‐ and Short‐Term
Planning and Operational Planning and Operations. The recommendations presented below are intended to provide a
platform for further technical and policy input. More details on the key findings and recommendations can be found in
Chapter 9.
Long- and Short-Term Planning Summary Key Finding: Risk‐based approaches are needed to study the impact and regional challenges associated with an
increasing dependence on natural gas.
The power sector’s growing reliance on natural gas has raised concerns by ISOs, RTOs, market participants, national and
regional regulatory bodies and other government officials regarding the ability to maintain electric system reliability when
natural gas supplies to power generators are constrained. The extent of these concerns varies from region to region;
however, concerns are most acute in areas where power generators rely on interruptible gas pipeline transportation and
where the growth in gas use for power generation is growing the fastest. Because it typically takes three to four years to
build pipeline infrastructure, solution sets that call for increased pipeline capacity must be developed as quickly as possible
so the electric industry is well postured to manage the regional challenges and emerging risks associated with an increasing
dependence on natural gas.
Recommendations:
Implement advanced modeling and analysis approaches. NERC recommends the Three‐Layer approach or
similar advanced probabilistic techniques.
Enhance the NERC Generator Availability Data System (GADS) to increase the effectiveness of trending
gas‐fired generator outages and causes related to fuel issues.
Key Finding: Enhancements to reliability and resource assessments should reflect risks to gas‐fired generation as a result
of various fuel disruptions.
Natural gas is a reliable fuel source that is expected to fire electric generation serving more than 50 percent of the electric
peak demand in North America by 2015. However, because natural gas is largely delivered on a just‐in‐time basis,
vulnerabilities in gas supply and transportation from a planning perspective must be sufficiently evaluated to inform BPS
operators about credible contingencies and flexibility options. Resource planning and adequacy assessments in some areas
do not fully account for the risk of disruptions in the natural gas and other fuel supply chains.
For example, electric system impacts due to a single point of failure within the natural gas fuel supply chain can impact
electric generators downstream from the disruption. Impacts of potential wide‐spread common‐mode failure events, such
Long‐ and Short‐Term Planning Findings
•Reliability assessment and resource adequacy studies
•Gas supply and fuel security
•Transportation expectations
•Generator availability
•Back‐up fuel and fuel‐switching capabilities
Operational Planning and Operations Findings
•Seasonal and day‐ahead observability
•Coordinated operational procedures
•Coordinated outage schedules
•Increasing flexibility
•Information sharing and situation awareness•Emergency operating procedures

Executive Summary
NERC | 2013 Special Reliability Assessment: Accommodating an Increasing Dependence on Natural Gas for Electric Power | May 2013 4 of 114
as a major failure along an interstate gas pipeline or major supply source, although rare, must be well understood to foster
enhanced planning and design insights.
Pipelines are able to operate with temporary supply disruptions, provided the gas pressures are maintained within
acceptable limits. However, within a relatively short time, a major failure could result in a loss of electric generating
capacity that could exceed the electric reserves available to compensate for these losses. The likelihood of pipeline failures
occurring during electric peak periods, however, is extremely low.
By integrating these risks into planning studies, potential generator outages due to natural gas interruptions and
curtailments can be better understood. Through rigorous analysis, vulnerabilities can be identified in the planning stages (1
to 10 years) and risks can effectively be minimized. These studies provide the foundation for state, federal, and provincial
regulators, policymakers, and system planners to implement changes and send accurate signals to the electricity market for
future needs of the bulk power system. Additionally, these studies allow for solution sets to be measurable and achievable.
Recommendations:
Incorporate natural gas fuel availability or natural gas‐fired generation availability into the NERC Long‐
Term Reliability Assessment and Seasonal Reliability Assessments.
Identify how risk assessments are performed in different regions and use this information to develop
recommendations for a uniform seasonal and long‐term reliability assessment process for consideration
by NERC Planning Committee.
Improve Generator Owner procedures and methods to maintain fuel switching capabilities.
Enhancements to market products supporting higher levels of fuel certainty should be considered (i.e.,
adequate level of fuel inventories and functional capability testing and/or firm natural gas transportation).
NERC should support further studies for enhancing planning processes that relate to fuel availability and
resource adequacy.
Key Finding: Regional solutions will likely include a mix of mitigating strategies, increased gas and/or electric
infrastructure, and dual or back‐up fuel capability.
Dual‐fuel capabilities and a variety of storage options may help bridge the gap between the uncertainties of gas availability
during extreme events and maintaining a reliable source of operable capacity available to meet seasonal peak demands.
Based on the reserve margin scenario assessments performed as part of this report’s efforts, many of the NERC assessment
areas have sufficient reserve margins to mitigate the loss of a significant portion of their gas‐fired generation.
Electric transmission increases the bulk power system’s flexibility and resilience to various disruptions. Efforts to manage
gas supply and transportation disruptions should consider the benefits of electric transmission.
Although generators may have contractual obligations to perform, performance incentives, particularly in competitive
wholesale electricity markets, may not be strong enough to incentivize generators to procure firm or otherwise reliable fuel
supplies (natural gas supply and transportation, oil, or other mitigating strategies).
Risks to gas supply shortages can largely be mitigated or reduced with the abundance and geographic diversification of
shale plays across North America. With unconventional shale gas production spread across the continent, vulnerabilities in
gas supply due to weather events can be mitigated or reduced by increasing production in unaffected areas.
Recommendations:
Policymakers and regulators should consider developing solutions that provide the right balance between
electric reliability and the increased costs associated with it.

Executive Summary
NERC | 2013 Special Reliability Assessment: Accommodating an Increasing Dependence on Natural Gas for Electric Power | May 2013 5 of 114
Key Finding: Enhancements to data sharing and planning coordination can provide insights through additional studies
and scenario analysis.
There is no compiled statistical data on gas system outages that would be the equivalent to NERC GADS databases.
Therefore, outage data would have to be estimated from various surrogate sources, including pipeline bulletin board
notices, accident reports filed with government agencies, surveys of pipeline and distribution companies in the study
region, and maintenance and repair information from equipment manufacturers and service companies. This type of
information is important for complex analyses that rely on past performance to achieve an acceptable level of prediction
and certainty. Increased coordination and information exchange for planning purposes could aid in developing confidence
around a distribution of potential scenarios.
Recommendations:
Work jointly with the natural gas industry to identify data requirements that can be used for electric
reliability analysis.
Planning Coordinators and/or Reliability Coordinators should identify critical gas‐fired electric generation
to ensure “critical generators” have the ability to mitigate or reduce the risks associated with fuel
disruptions and curtailments.
Operations and Operational Planning Key Finding: Sharing information for operational planning purposes is essential to fully understanding generator
availability risks in the season ahead.
While Generator Owners are generally able to schedule and secure gas during the summer to meet seasonal peak demand,
this flexibility decreases during winter months when pipeline use tend to peak and firm transportation customers have
scheduled their full entitlements. Cold weather can also be responsible for increased infrastructure and supply disruptions,
which are generally caused by freezing. Risks to gas wellheads, generators, and pipeline infrastructure due to freezing can
expose the electric industry to significant capacity shortages. While firm gas transportation significantly decreases the
likelihood that fuel delivery will be curtailed, extreme events, such as wellhead freeze‐offs causing decreased gas
production (a force majeure event), could potentially lead to common‐mode failures of a significant amount of gas‐fired
generators. The expected increases in gas‐fired generation on the BPS will increase the amount of operational uncertainty
that the system operator must factor into operating decisions.
Recommendations:
Increased situation awareness of the natural gas supply and pipeline system enhances the electric system
operator’s ability to make risk‐informed decisions.
In preparation for summer and winter extreme conditions, electric system operators need enhanced
observability of pipeline conditions, capacity availability, supply concerns, and potential issues affecting
fuel for gas‐fired generation.
Key Finding: Formalized communication and coordination with the gas pipeline and supply industry during extreme
events is needed.
Information on daily fuel supply adequacy and less probable contingencies on the gas pipeline or compressor stations which
could result in loss of multiple gas‐fired units should be provided to electric system operators with as much notice as
possible.
Both industries have stated that there are sufficient coordination practices at this time and enhancements planned for the
future. Based on these practices, operational procedures should include formalized coordination with the gas supply and
pipeline industry, as well as emergency procedures during extreme events. Timely information sharing is most important

Executive Summary
NERC | 2013 Special Reliability Assessment: Accommodating an Increasing Dependence on Natural Gas for Electric Power | May 2013 6 of 114
when natural gas suppliers and pipeline operators can determine that a potential shortages or interruptions may occur due
to usage and transportation outages.
Recommendations:
System operators should re‐examine interindustry communication protocols that apply during periods of
stress
Key Finding: System operators will need access to sufficient flexible resources to mitigate the added uncertainty
associated with natural gas fuel risks, including those introduced by interruptible gas transportation service.
Operating criteria, forecasting, commitment, scheduling, dispatch and balancing practices, procedures and tools should
consider fuel risks and risk mitigation measures to assist operators in maintaining bulk power system reliability. Enhanced
operator training should be considered in light of the increasing need for electric and pipeline operator communication and
coordination. Training crosses a number of areas, some of which are specific to each industry, while others likely represent
interindustry efforts.
A projection of flexibility can also provide additional observability to the system operator in order to maintain operational
reliability; however, this can only be made with enhanced coordination with gas‐fired generators and the natural gas
pipeline operators. In response to gas disruptions, electric system operators should be able to identify vulnerable capacity,
determine if reserve capacity is available, dispatch the appropriate resources, implement any operating procedures, and
minimize any impacts caused by fuel disruptions.
Recommendations:
NERC should leverage its stakeholder groups to identify best practices in areas currently most vulnerable
to gas dependency risks and taking immediate actions for improvement, such as New England. Such an
effort could lead to insights for enhanced operator training and table‐top exercises.
Joint industry drills or table‐top exercises with the key players of both gas, electric, and various state
commissions would foster enhanced coordination and harmonize cross‐industry issues, response plans,
and mitigation measures.

NERC | 2013 Special Reliability Assessment: Accommodating an Increasing Dependence on Natural Gas for Electric Power | May 2013 7 of 114
Chapter 1—Introduction For a variety of reasons, including (a) the adoption of efficient natural gas‐fired combined‐cycle and combustion turbine
technology by the electric power industry and (b) the emergence of shale gas, both of which have altered the relative
economics of gas‐fired generation, the natural gas and electric power industries have become significantly more
interdependent. The trends in fuel‐mix changes highlighted in NERC’s 2012 Long‐Term Reliability Assessment (see Figure 1)
identify gas‐fired generation as the primary choice for new generation capacity. Continued high levels of dependence on
natural gas for electricity generation have increased the BPS’s exposure to interruptions in fuel supply, transportation, and
delivery. Efforts to address this dependence must be sustained and expanded in order to analyze potential risks in the
future.
Figure 1: NERC‐Wide Planned Capacity Additions
Current 2022 Planned 2022 Planned & Conceptual
Capacity Share Capacity Share Change Capacity Share Change
Coal 307,201 29.78% 290,915 26.86% ‐16,286 278,775 22.61% ‐28,426
Petroleum 52,498 5.09% 51,954 4.80% ‐544 51,377 4.17% ‐1,121
Gas 397,464 38.53% 429,462 39.65% 31,998 529,328 42.94% 131,863
Nuclear 113,821 11.03% 123,525 11.41% 9,704 136,361 11.06% 22,540
Other/Unknown 271 0.03% 5,840 0.54% 5,569 12,683 1.03% 12,412
Renewables 160,420 15.55% 181,311 16.74% 20,891 224,235 18.19% 63,815
TOTAL 1,031,676 100.00% 1,083,007 100.00% 51,332 1,232,759 100.00% 201,083
While there are a number of positive impacts from increased natural gas use by the electricity industry, the emergence of
this interdependency issue has made the power sector more vulnerable to adverse events that may occur within the
natural gas industry (e.g., curtailment of gas supplies due to line breaks and well freeze‐offs). Similarly, the system reliability
of the gas industry can be impacted by events that occur in the electricity industry (e.g., loss of electric compression in the
field, at processing plants, or for transportation systems).
This report, which builds on an earlier NERC report regarding gas use within the electric industry,5 addresses the need to
further improve coordination that will lead to enhanced electric system reliability. Coordinated approaches with
collaborative interindustry activities will provide enhanced system reliability beyond independent efforts of each industry. A
constant theme throughout this report is the need for interindustry coordination to be focused at the regional level due to
existing significant operational differences, regulatory rules, and market structures.
5 NERC, 2011 Special Assessment Report: A Primer of the Natural Gas and Electric Power Interdependency in the United States: http://www.nerc.com/files/Gas_Electric_Interdependencies_Phase_I.pdf.
‐20
‐10
0
10
20
30
40
50
60
70
2013 2014 2015 2016 2017 2018 2019 2020 2021 2022
Gigaw
atts (G
W)

Chapter 1—Introduction
NERC | 2013 Special Reliability Assessment: Accommodating an Increasing Dependence on Natural Gas for Electric Power | May 2013 8 of 114
This report examines gas‐electric interdependency as a long‐term resource adequacy issue and therefore excludes specific
discussions of best practices for day‐to‐day operation, and emergency planning between the electric and gas industries. The
issue of what additional natural gas infrastructure may be needed nationally or in any given region is not addressed. Finally,
this report contains no policy recommendations for changes in market design or regulation that supports any one solution.
Instead, the report includes hypothetical case studies and recommendations for general analytic techniques. The report is
structured as follows:
Chapter 1—Introduction
The introduction provides an overview of each chapter in this report and describes the goals and objectives, as
well as the parameters of focus.
Chapter 2—Interface Between Two Industries
This chapter provides an overview of the key attributes of the natural gas loads within the power industry that are
challenging for the gas industry to accommodate, as well as the major differences in the planning systems for the
two industries. In addition, this chapter briefly summarizes historical efforts to both analyze and facilitate
increased coordination between the two industries.
Chapter 3—Gas Supply Vulnerabilities
The power industry’s recent increased reliance on gas‐fired generation and the expected further growth of gas‐
fired capacity has elevated concerns over fuel supply and delivery. Although small in number, there have been
interruptions of gas supply and delivery to both electric generators, as well as consumers within other demand
sectors. This chapter highlights several of these historical incidents and potential implications for the power
industry.
Chapter 4—Scenario Reliability Assessments
In this chapter, NERC analyzes hypothetical scenarios and describes the corresponding impact of rare pipeline
disruptions. Calculations and estimates of the risk exposure are incorporated in these scenarios. The resource
adequacy scenario assessment is intended to illustrate the impacts to planning reserve margin projections due to
reduced gas‐fired capacity.
Chapter 5—Methods for Analyzing Natural Gas Demand and Infrastructure
In this chapter, NERC recommends a three‐layered approach to the analysis of natural gas demand and
infrastructure. Layer 1 is to assess the regional capacity of the gas infrastructure under normal operating
conditions, and compare that capacity to the gas load by developing daily and hourly gas load duration curves for a
specific set of weather conditions. Layer 2 is to compare the same gas load duration curves to gas infrastructure
capacity under assorted gas transportation contingencies, such as a compressor station outage. Layer 3 is to
perform a Monte Carlo simulation analysis, which examines a wide range of weather and gas supply conditions to
determine how often the existing and projected natural gas infrastructure cannot serve generation needed for
power system reliability.
Chapter 6—Enhancing Resource Adequacy Assessments
This chapter describes how the fuel supply availability analysis would be factored into conventional electric system
resource adequacy studies. The section is organized under three subsections. The first section provides a brief
description of the resource adequacy concept within the electric power sector. The second section introduces
standard resource adequacy modeling approaches. The third section introduces NERC’s recommended approach
for integrating fuel availability within resource adequacy modeling efforts.
Chapter 1—Introduction
NERC | 2013 Special Reliability Assessment: Accommodating an Increasing Dependence on Natural Gas for Electric Power | May 2013 9 of 114
Chapter 7—Performance Analysis of Generator Outages
This chapter examines the NERC Generating Availability Data System (GADS), a series of databases that tracks the
performance of electric generating stations in North America. Using the information gathered in GADS, NERC
performed an analysis on generator outages due to “lack of fuel.” The analysis provides a means for the power
industry to track and trend potential issues that may cause concern in the long term.
Chapter 8—Risk Assessment for Electric Reliability
The initial sections of this report highlight that natural gas is a reliable fuel source for electric generators; however,
during high electric demand, some electric generators are subject to interruptions, which in turn have the
potential to adversely impact overall system reliability. This chapter discusses, from several different perspectives,
how the risk from this potential vulnerability can be addressed and managed.
Chapter 9—Key Findings and Recommendations
This chapter provides key findings and recommendations for short‐ and long‐term electric system planning,
operational planning, and operations.
Appendix I: Consolidation of Reports and Studies
Appendix II: Regional Analysis of Generator Outages
Appendix III: Terms Used in This Report
Coordination of gas and electric service was first discussed more than a decade ago by the North American Energy
Standards Board (NAESB), the Natural Gas Council, and existing and prospective shippers—including shippers that would
serve generation. At that time, however, various factors in natural gas markets allowed generators to use available pipeline
capacity, largely through interruptible service and released capacity. Drivers for these conditions included:
The development of the first wave of pipeline capacity turn‐back by shippers as alternative transportation paths
for natural gas delivery
Pipelines were originally constructed and paid for by Local Distribution Companies (LDCs) to serve near peak
winter heating loads. Power plants were able to use underutilized capacity in the summer and shoulder months.
A period of high gas prices that moderated gas demand within the industrial sector, thereby freeing up existing
pipeline capacity available to power generators, often on an interruptible basis
The economic recession of 2001, which created further “slack” capacity on many interstate pipelines
Over time, the market for pipeline capacity within some Regions has tightened, changing the ability of generators to reliably
obtain interruptible pipeline capacity during higher electricity demand hours.
Natural gas pipeline facilities have been designed and constructed based on peak day firmly contracted capacity. Firm
pipeline customers usually contract close to 100 percent of the capacity on a pipeline since capacity is not built to serve
interruptible customers. This practice presents issues for gas‐fired generators that prefer interruptible transportation
service due to variability in volumetric requirements as well as economics.
Over the past several years, the subject of the interdependency of gas and electric service reliability has intensified in many
forums. As the amount and dispatch of gas‐fired generation increases, the interaction between the electric grid and the gas
network can become stressed. These stresses highlight the similarities and differences in the structure, operation, business
practices, and communication between the two industries.
In August 2012, the Federal Energy Regulatory Commission (FERC) recognized the need for coordination between natural
gas and electricity markets and held technical conferences on coordination between natural gas and electricity markets

Chapter 1—Introduction
NERC | 2013 Special Reliability Assessment: Accommodating an Increasing Dependence on Natural Gas for Electric Power | May 2013 10 of 114
around the United States. The conferences covered issues such as coordination and information sharing, scheduling, market
structures, and reliability concerns. These issues are a reflection of a request for comment from industry participants
regarding pressing issues concerning gas–electric integration. Many participants also asserted that issues differ
considerably by Region. In recent years, a number of studies have attempted to assess the gas–electric reliability issues. A
summary of the findings can be found in Appendix 1. FERC also hosted the Technical Conference titled Coordination
between Natural Gas and Electricity Markets on February 13, 2013, where the Commissioners, FERC staff, and
representatives of both industries shared concerns related to gas–electric coordination and the BPS reliability challenges
presented by the interruptible natural gas supply and/or transportation contracts used by power generators.6
6 Industry members have submitted comments to FERC related to this issue under Docket No. AD12‐12‐000.

NERC | 2013 Special Reliability Assessment: Accommodating an Increasing Dependence on Natural Gas for Electric Power | May 2013 11 of 114
Chapter 2—Interface Between Two Industries
There are many differences between the natural gas and electricity industries. The two sectors have very different
structures, physical attributes, regulatory processes, and cost recovery mechanisms. The core of these differences is
represented by centralized and market driven—to a point—natural gas transportation compared to the more centralized,
reliability driven electric transmission development mechanisms.
There are also differences between the two industries in terms of planning and operating practices. For example, the
planning process for a new natural gas pipeline and storage infrastructure is based on an underpinning of contracts for firm
service entitlements for the contracting party. New or expanded pipeline capacity is only constructed with long‐term (at
least 10 years) contractual commitments from gas shippers; however, in some cases, suppliers will fund pipeline
development to bring their product to a liquid trading hub (i.e., market push). Gas suppliers are often unable to obtain the
required certificate for new capacity without these contracts. Within this model, no capacity is constructed specifically to
serve interruptible service requirements.
Under average annual operating conditions, most pipelines have some level of capacity that is not used by firm customers
and is therefore available for non‐firm (interruptible) loads, including gas generators with non‐firm contracts. If the
requirements for non‐firm deliveries are communicated to the pipeline within the nomination cycle timeline, the pipeline
can use facilities to allow for delivery of gas requested up to the physical capabilities the system can allow. This is the
normal procedure for interruptible transportation service or capacity release from firm shippers.
The structure within the electric industry is fundamentally different. Generation capacity expansions are driven by a
combination of resource adequacy requirements and market forces. Planning for transmission infrastructure is triggered by
reliability criteria under stressed system conditions; therefore, there is an implicit level of reserve capacity available in the
transmission and generation systems to accommodate contingencies or above‐normal weather conditions. Furthermore,
from an operating perspective, power plant generation follows load to serve the hourly needs of the system. The
generating units that are primarily required for reliability during peak conditions tend to run for a very limited number of
hours and as a result, generator owners may prefer interruptible gas services. Firm gas transportation services—purchased
with fixed reservation fees that do not provide a customer time‐of‐day use rates and do not vary based upon the volume of
gas delivered—may not be cost‐effective when considering the annual amount of gas required for these peaking gas
facilities.
In some power markets or regions where there is excess gas pipeline capacity available, these low‐capacity factor units can
rely upon interruptible service with a reasonable degree of certainty that service will be available. As growth in gas system
requirements in a region reaches the point where new pipeline capacity is required or when market conditions result in
simultaneous peak electricity and gas demand, the differences in the structures of the two industries can result in a
mismatch between the availability of gas delivery services and gas demand for electricity generation. This can be
particularly challenging in areas where a significant amount of the generation capacity, or more importantly reserve
capacity is susceptible to gas transportation interruptions and the resulting generator outages.
Additionally, within the electric industry, regulated utilities have cost recovery mechanisms for fuel supplies and
transportation procurement. These mechanisms have incorporated overall cost into the rate case. However, in deregulated
markets, accurate price signals reflecting reliability needs and incorporating acceptable risks are vital to maintaining a risk‐
averse resource portfolio.
Chapter 2—Interface Between Two Industries
NERC | 2013 Special Reliability Assessment: Accommodating an Increasing Dependence on Natural Gas for Electric Power | May 2013 12 of 114
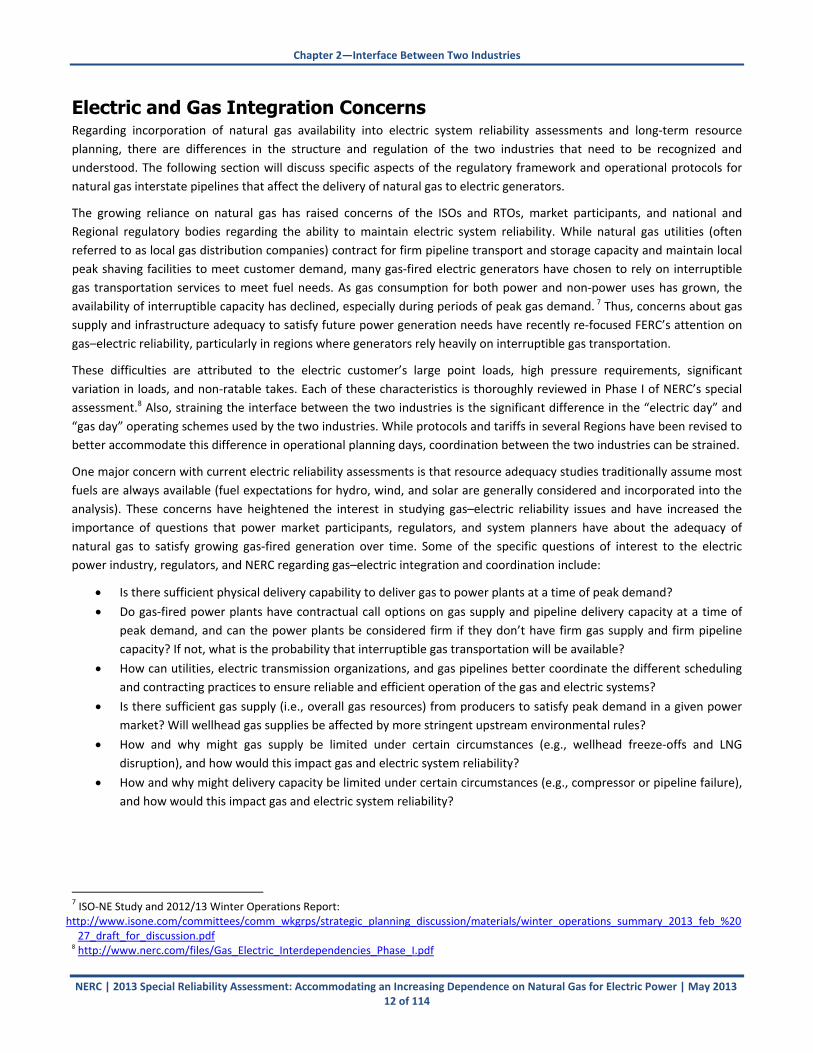
Electric and Gas Integration Concerns Regarding incorporation of natural gas availability into electric system reliability assessments and long‐term resource
planning, there are differences in the structure and regulation of the two industries that need to be recognized and
understood. The following section will discuss specific aspects of the regulatory framework and operational protocols for
natural gas interstate pipelines that affect the delivery of natural gas to electric generators.
The growing reliance on natural gas has raised concerns of the ISOs and RTOs, market participants, and national and
Regional regulatory bodies regarding the ability to maintain electric system reliability. While natural gas utilities (often
referred to as local gas distribution companies) contract for firm pipeline transport and storage capacity and maintain local
peak shaving facilities to meet customer demand, many gas‐fired electric generators have chosen to rely on interruptible
gas transportation services to meet fuel needs. As gas consumption for both power and non‐power uses has grown, the
availability of interruptible capacity has declined, especially during periods of peak gas demand. 7 Thus, concerns about gas
supply and infrastructure adequacy to satisfy future power generation needs have recently re‐focused FERC’s attention on
gas–electric reliability, particularly in regions where generators rely heavily on interruptible gas transportation.
These difficulties are attributed to the electric customer’s large point loads, high pressure requirements, significant
variation in loads, and non‐ratable takes. Each of these characteristics is thoroughly reviewed in Phase I of NERC’s special
assessment.8 Also, straining the interface between the two industries is the significant difference in the “electric day” and
“gas day” operating schemes used by the two industries. While protocols and tariffs in several Regions have been revised to
better accommodate this difference in operational planning days, coordination between the two industries can be strained.
One major concern with current electric reliability assessments is that resource adequacy studies traditionally assume most
fuels are always available (fuel expectations for hydro, wind, and solar are generally considered and incorporated into the
analysis). These concerns have heightened the interest in studying gas–electric reliability issues and have increased the
importance of questions that power market participants, regulators, and system planners have about the adequacy of
natural gas to satisfy growing gas‐fired generation over time. Some of the specific questions of interest to the electric
power industry, regulators, and NERC regarding gas–electric integration and coordination include:
Is there sufficient physical delivery capability to deliver gas to power plants at a time of peak demand?
Do gas‐fired power plants have contractual call options on gas supply and pipeline delivery capacity at a time of
peak demand, and can the power plants be considered firm if they don’t have firm gas supply and firm pipeline
capacity? If not, what is the probability that interruptible gas transportation will be available?
How can utilities, electric transmission organizations, and gas pipelines better coordinate the different scheduling
and contracting practices to ensure reliable and efficient operation of the gas and electric systems?
Is there sufficient gas supply (i.e., overall gas resources) from producers to satisfy peak demand in a given power
market? Will wellhead gas supplies be affected by more stringent upstream environmental rules?
How and why might gas supply be limited under certain circumstances (e.g., wellhead freeze‐offs and LNG
disruption), and how would this impact gas and electric system reliability?
How and why might delivery capacity be limited under certain circumstances (e.g., compressor or pipeline failure),
and how would this impact gas and electric system reliability?
7 ISO‐NE Study and 2012/13 Winter Operations Report: http://www.isone.com/committees/comm_wkgrps/strategic_planning_discussion/materials/winter_operations_summary_2013_feb_%2027_draft_for_discussion.pdf
8 http://www.nerc.com/files/Gas_Electric_Interdependencies_Phase_I.pdf

Chapter 2—Interface Between Two Industries
NERC | 2013 Special Reliability Assessment: Accommodating an Increasing Dependence on Natural Gas for Electric Power | May 2013 13 of 114
What are the costs of supporting new transmission pipeline infrastructure? What are the benefits of constructing
new natural gas pipelines? Is local high‐pressure natural gas storage a viable option?
What are the costs and feasibility of on‐site storage (e.g., LNG/CNG9 storage) and dual‐fuel capability as solutions
to these problems? Is on‐site or portable liquefaction a viable option for peaking facilities? Can LNG be delivered
by truck or rail for needed peak facilities that operate a few days a year?
What are the costs of other solutions, such as coal must‐run backup, demand response, or more electric
transmission?
Further, a future surge in electricity sector gas demand is expected to occur in response to recent and pending
Environmental Protection Agency (EPA) regulations. The latter likely will result in more than 70 GW of coal‐fired capacity
being retired; much of the reduction in coal‐fired generation will be replaced by additional gas‐fired generation, demand
response, and energy efficiency. While there will be significant variations among the Regions, a critical aspect of the power
industry’s further dependence on gas‐fired generation is that for some electric utilities, gas generation will begin to serve
baseload, intermediate load, and peaking load requirements, whereas historically gas‐fired generation has been used
almost exclusively for intermediate and peaking loads. This shift, which already has occurred in ERCOT, FRCC, and NPCC, is
expected to cause a change in the demand for natural gas transportation services, from the historical reliance on
interruptible transportation services to more firm transportation services.
Because it typically takes three to four years to build pipeline infrastructure, solution sets that call for increased pipeline
capacity must be developed as quickly as possible so the electric industry is well postured to manage the challenges and
emerging risks associated with increasing dependence on natural gas.
Differences in G as and Electric Industry Structures and Coordination Issues There are several differences in the structure and regulation of the natural gas and electric industries that need to be
recognized and understood when considering the coordination and interdependencies of the two industries. These
differences affect both the planning and the operating areas. Operational coordination concerns between electric systems
and natural gas pipelines include:
Coordinated business day and bidding/nomination schedules
Notification procedures (Order 587‐V)
Coordinated emergency response procedures
Coordinated planned outages for routine maintenance and repairs
Market‐clearing times for natural gas and electricity pricing
Lack of flexibility in gas transportation services and scheduling
Transparency reporting
Gas supply disruption due to extreme weather
Regulatory coordination between state and federal agencies regarding coal‐to‐gas‐fired conversions, gas
supply growth, and infrastructure investment
Temperature design limits of plants (to recognize the impact of low outside temperatures on loss or duration
of capacity)
Impact of winterization of plants to limit winter‐related capacity losses
9 http://www.oscomp‐systems.com/

Chapter 2—Interface Between Two Industries
NERC | 2013 Special Reliability Assessment: Accommodating an Increasing Dependence on Natural Gas for Electric Power | May 2013 14 of 114
Regulatory and Contractual Context of the Natural Gas Infrastructure
Certification of Interstate Natural Gas Pipelines Section 7 (c) of the Natural Gas Act of 1938 grants FERC the authority to issue a certificate of public convenience and
necessity to natural gas companies upon demonstrating that an interstate pipeline is in “the public” interest.10 Interstate
pipelines cannot construct facilities or provide gas transportation service without a Section 7 certificate. FERC (and FERC’s
predecessor, the Federal Power Commission) grants a certificate when service is needed. The certificate is important
because it grants the power of eminent domain to the pipeline.
The definition of “need” has evolved over time. Originally, a pipeline company needed to demonstrate both the market
need and the presence of sufficient supply to ensure that the pipeline would be sufficiently utilized. Prior to the
restructuring of the natural gas industry in the 1980s and ’90s, a pipeline company would be required to have 20‐year gas
purchase contracts to demonstrate that there was sufficient supply to fill the pipeline.
With restructuring, FERC regulations evolved to rely on contractual commitments by the shippers on the pipeline as a
demonstration of market need—along with the co‐existence of supply. The contractual commitments of pipeline
customers—known as shippers—is considered a superior method to evaluating need in a competitive market setting,
compared to a review of competing projects conducted by regulators.
The evaluation of need requires that the pipeline bring to FERC legally binding precedent agreements showing that the
pipeline will be fully or nearly fully subscribed11 for a minimum of 10 years. Contracts for interruptible service are not
included in the demonstration of market need. Only contracts for firm service are included within that evaluation. As
discussed later in this section, the rates charged for firm service, which include fixed, monthly reservation, or “demand”
charges to reserve the capacity, are often higher than non‐firm charges and can present challenges to any pipeline
customer wishing to receive gas transportation service during a limited number of hours each month.
Firm Transportation Service and Primary and Secondary Rights As noted above, firm service contracts with shippers underpin the economic regulation and cost recovery for natural gas
pipelines. The firm service contract grants the shipper certain rights to utilize the capacity that has been contracted
according to the published pipeline tariff.
Under FERC Order 636,12 FERC created a framework to allocate capacity and property rights to the shippers on the pipeline.
One of the objectives of Order 636 was to increase the economic efficiency within the pipeline network. To do that, FERC
directed the pipeline industry to establish a system with primary and secondary rights under the firm service contract.
Each firm service contract specifies a primary receipt point(s) where gas can be received by the pipeline for transport on the
system, and a primary delivery point(s) where the gas is removed from the pipeline and delivered to the shipper’s facility
(e.g., a local distribution company, power generator, industrial plant, etc.) or to another gas pipeline for continued
transport. “Primary” firm service has the highest priority for service and will not be disrupted, barring a significant force
majeure event or mandatory maintenance.
In addition to the rights of primary service, Order 636 instructed pipeline contracts to include a system of secondary rights.
The details of the system of secondary rights differ somewhat from one pipeline to the next. The implementation
requirements were dictated by the physical configuration of each pipeline. All FERC‐regulated pipelines, however, have a
system that allows a shipper to deliver gas to them for transport at an alternative receipt point or remove gas at an
alternative delivery point. By requiring this flexibility, FERC created a system where a shipper could generate some
10 15 USC 717h. “U.S. Natural Gas Act of 1938,” section 7. 11 FERC requires that a vast majority of the capacity is under contract prior to certificating the project. 12 Order 636 Final Rule, Pipeline Service Obligations and Revisions to Regulations Governing Self‐Implementing Transportation Under Part 284 of the Commission's Regulations, Issued April 8, 1992

Chapter 2—Interface Between Two Industries
NERC | 2013 Special Reliability Assessment: Accommodating an Increasing Dependence on Natural Gas for Electric Power | May 2013 15 of 114
economic value from holding a firm service contract during the time that the shipper did not require a full quantity of
pipeline capacity to be reserved under the contract.
Order 636 also required each pipeline to institute a Capacity Release program whereby shippers could resell the firm
contracted capacity to other shippers on the pipeline. The ability to designate alternative receipt and delivery points is a
necessary element that creates economic value for a shipper buying capacity from the primary contact holder (in this case
the shipper is known as a “replacement shipper”). Additionally, FERC required the pipelines to allow shippers to “segment”
the capacity held under contract. For example, if a shipper holds capacity on a pipeline that runs from Louisiana to New
York, the shipper could, on a single day, deliver gas to the pipeline in Louisiana for delivery in Kentucky and deliver gas to
the pipeline in Pennsylvania for delivery to New York. A variation of this example would be to sell the capacity downstream
of Pennsylvania in the capacity release market while still delivering the contract volume to New York with gas sourced from
Pennsylvania.
Gas service provided to shippers under these secondary rights to firm service is given a lower priority than the right granted
to primary firm service. The secondary rights, however, are granted a higher priority for service than those granted to
interruptible service. Some pipelines have created additional levels of priority for secondary firm service rights. For
example, some pipelines may have a priority category for secondary service that is “in the primary service path” that has a
higher priority than secondary firm service that is “out of the primary service path.”
Interruptible Transportation Service Under “average annual operating” conditions, most pipelines have some level of capacity that is not used by firm customers
and is therefore available for non‐firm loads. If the requirements for non‐firm deliveries are communicated to the pipeline
within the nomination cycle timeline, the pipeline can use facilities to allow for delivery of gas requested up to the physical
capabilities of the system. Pipelines may suspend, reduce or not schedule interruptible transportation services in
accordance with the pipeline’s tariff and FERC policy.
As noted earlier, the planning process for new natural gas pipeline and storage infrastructure has developed based on an
underpinning of contracts for firm service entitlements for the contracting party. Pipeline owners do not construct new or
expanded capacity without long‐term (at least 10 years) contractual commitments from gas shippers. FERC will not grant
the required certificate for new capacity without the firm service contracts discussed earlier. Within this model, capacity is
not constructed to serve interruptible service demand.
Unlike firm service, which has a fixed monthly reservation fee paid to reserve capacity, interruptible service is priced solely
on a volumetric basis. The shipper only pays for the volume of transportation service that it receives. This is an attribute
that is often desirable for power generation customers of the pipeline, particularly those that have relatively low annual
capacity factors.
Interruptible service, however, comes with the lowest service priority. As a result, interruptible service is the first to be
restricted or reduced during periods where the pipeline is highly used, maintenance is occurring, or force majeure is in
effect. It is not uncommon for interruptible service to be unavailable during winter peak periods, particularly in constrained
gas‐delivery areas such as New England.
Nomination, Confirmation and Scheduling, and the “Gas Day” Whereas electricity control areas and utilities in North America operate on various wholesale market “electric days,” every
natural gas pipeline in North America operates on a common “gas day” for the transportation (flow) of gas. The gas day
commences at 9:00 a.m. Central. The pipeline must offer at least four nomination opportunities as required by NAESB and
FERC regulation. For each “nomination cycle,” there is a schedule for the communication between the shippers and the
pipeline.

Chapter 2—Interface Between Two Industries
NERC | 2013 Special Reliability Assessment: Accommodating an Increasing Dependence on Natural Gas for Electric Power | May 2013 16 of 114
The communications process is divided into three steps: nomination, confirmation, and scheduling. The nomination step
involves a shipper indicating to the pipeline the amount of service being requested for the next gas day or for the next
cycle. During the nomination process, all parties request service including firm, secondary firm, segmented capacity,
interruptible transportation, etc. The pipeline then fills those requests based on priority of service. The confirmation
process involves communication between the shipper and a producer to ensure the pipeline has gas supply and can be
delivered to the pipeline at a specific receipt point. The scheduling process involves the pipeline communicating to the
shippers whether it can “confirm” that the shipper’s requested volume of gas can be removed at the delivery point based
on the producers’ confirmation of the supply point and volume.
Despite the fact that natural gas generally moves at no more than 30 miles an hour through the pipeline, a shipper removes
gas at the delivery point simultaneously with the gas being delivered to the pipeline at the receipt point, which may be
1,000 miles upstream. The nomination, confirmation and scheduling process in conjunction with the gas control center
ensures the operation and pressure requirements for reliable service.
Figure 2 presents the timeline for nomination, confirmation, and scheduling for the minimal level of nomination cycles that
a pipeline must provide. Figure 3 compares the gas day cycle to that of the electric day.
Figure 2: Pipeline Nomination Cycles (CPT)13
Nomination Cycle Nomination
Deadline
Third‐Party Confirmation
Deadline
Pipeline Scheduled
Quantity Deadline Flow Time
Timely (Cycle 1) 11:30 a.m. (The day
before the gas flows)
3:30 p.m. (The day before
the gas flows)
4:30 p.m. (The day before
the gas flows) 9:00 a.m. (The next day)
Evening (Cycle 2) 6:00 p.m. (The day
before the gas flows)
9:00 p.m. (The day before
the gas flows)
10:00 p.m. (The day
before the gas flows) 9:00 a.m. (The next day)
Intraday 1 (Cycle 3) 10:00 a.m. (The Gas
Day) 1:00 p.m. (The Gas Day) 2:00 p.m. (The Gas Day) 5:00 p.m. (The same day)
Intraday 2 (No
Bump‐ Cycle 4)
5:00 p.m. (The Gas
Day) 8:00 p.m. (The Gas Day) 9:00 p.m. (The Gas Day) 9:00 p.m. (The same day)
When the pipeline operator receives a request for service, the total amount of service requested must be considered, along
with the priority of service requested. Primary firm service is scheduled first. Secondary firm, including any differentiation
within the category, is scheduled next. Interruptible capacity, which is often used by gas generators, is scheduled at a lower
priority. Other services, such as “park and loan,” may have the lowest priority.
If there is insufficient capacity to meet all of the service requested within a priority category, the pipeline schedules the
service on a pro‐rated basis within the lowest priority category that is granted service. If all firm customers are using their
full contractual entitlements, there may be insufficient capacity to meet the demands of interruptible transportation
customers. Scheduling is done pursuant to the pipeline’s tariff and based on specific segments of the pipeline. As a result,
interruptible capacity may be available on some segments of the pipeline but not all segments.
The focal point of these differences is a multi‐hour gap in the timing between the two days, which increases the difficulty of
providing the needed services to gas‐fired generation.14 For example, the electric day, in essence, completes its planning for
the next day by 6:00 p.m. of the current day. While the completed electric utility plan identifies which electric units will run
the next day (which in turn provides the basic information to project the next day’s fuel consumption), the pipeline
deadlines for nominations historically have been at 10:00 a.m. of the current day. Thus, there is a six‐or‐more‐hour gap of
incompatibility between the two traditional approaches to planning and scheduling.
13 http://www.naesb.org/ 14 See Chapter 7 of NERC’s A Primer on the Natural Gas Industry and its Interface with the Electric Power Industry, 2011, for a complete assessment of both the electric day and the gas day.

Chapter 2—Interface Between Two Industries
NERC | 2013 Special Reliability Assessment: Accommodating an Increasing Dependence on Natural Gas for Electric Power | May 2013 17 of 114
Figure 3 : Description of the Interaction of Gas‐Day and Electric‐Day Planning Cycles
The net result of this scheduling gap is that electric generator nominations, with their relatively large gas loads, are based
upon estimates by the individual fuel planners of each Generator Owner (GO) between 24 and 36 hours in advance. The
issue could be magnified when scheduling on a Friday, since gas markets are closed for the weekend. This can result in
significant differences between nominations and actual gas requirements (see Figure 3). The nominating and scheduling
process provides an opportunity for each Generator Owner to manage and effectively minimize its risk exposure. However,
the amount of firm pipeline capacity needed, either through firm capacity entitlements or capacity release, should reflect
the best possible estimate of actual gas requirements; although, inherent risk with estimates poses additional threats.
Power producers have expressed concerns about the lack of liquidity in the gas market after the nominations are confirmed
and the gas flows are scheduled. After the scheduling is completed, power generators have difficulty procuring additional
gas and often are unable to move gas procured for other facilities to the facility in need due to lack of pipeline capacity.
Furthermore, sudden weather and system events can exacerbate these differences. When such differences occur, a
pipeline may not be able to accommodate changes between previous nominations and actual delivery requirements
depending on how other customers have nominated to use their contractual rights on the system. In addition, if a
generator goes out of balance for a prolonged period or withdraws gas faster than the tariff permits, then the generator
may be subject to a number of imbalance penalties required under the pipeline tariffs.
While there are regional nuances to the above portrayal of the gas day and the electric day (i.e., the electric day is not
standardized across different power markets), within each Region there is basic incompatibility between the two planning
days. In addition, while the example above assesses the traditional gas and electric days, over the last decade, each industry
has made steps to accommodate the other—at least to a degree. For example, many, but not all, pipeline tariffs have been
revised to include additional mechanisms for revising gas quantity nominations. Similarly, some GOs are refining their
planning and scheduling protocols so that information becomes available a few hours earlier in the traditional electric day.
The latter can facilitate the refining of intraday volume adjustments. Nevertheless, these improvements are not sufficient
to close the gap between the electric and gas day and ensure that generators would be able to procure sufficient gas
supplies during peak hours. This issue was most recently exposed in New England during the January through February
2013 operating period.15
15 Winter Operations Summary: January – February 2013: http://www.iso‐ne.com/committees/comm_wkgrps/strategic_planning_discussion/materials/winter_operations_summary_2013_feb_%2027_draft_for_discussion.pdf
Chapter 2—Interface Between Two Industries
NERC | 2013 Special Reliability Assessment: Accommodating an Increasing Dependence on Natural Gas for Electric Power | May 2013 18 of 114
Imbalances, Penalties, and Unauthorized Overruns All shippers experience some variability in the hourly and intra‐hour rate that gas is required. Residential and commercial
gas requirements, for example, generally increase in the morning hours as homeowners awake, turn up the thermostat,
and increase hot water requirements. The gas load tends to peak around 8:00 or 9:00 a.m. and decline as people go to
work. A second relative peak generates within the day as people return home from work.
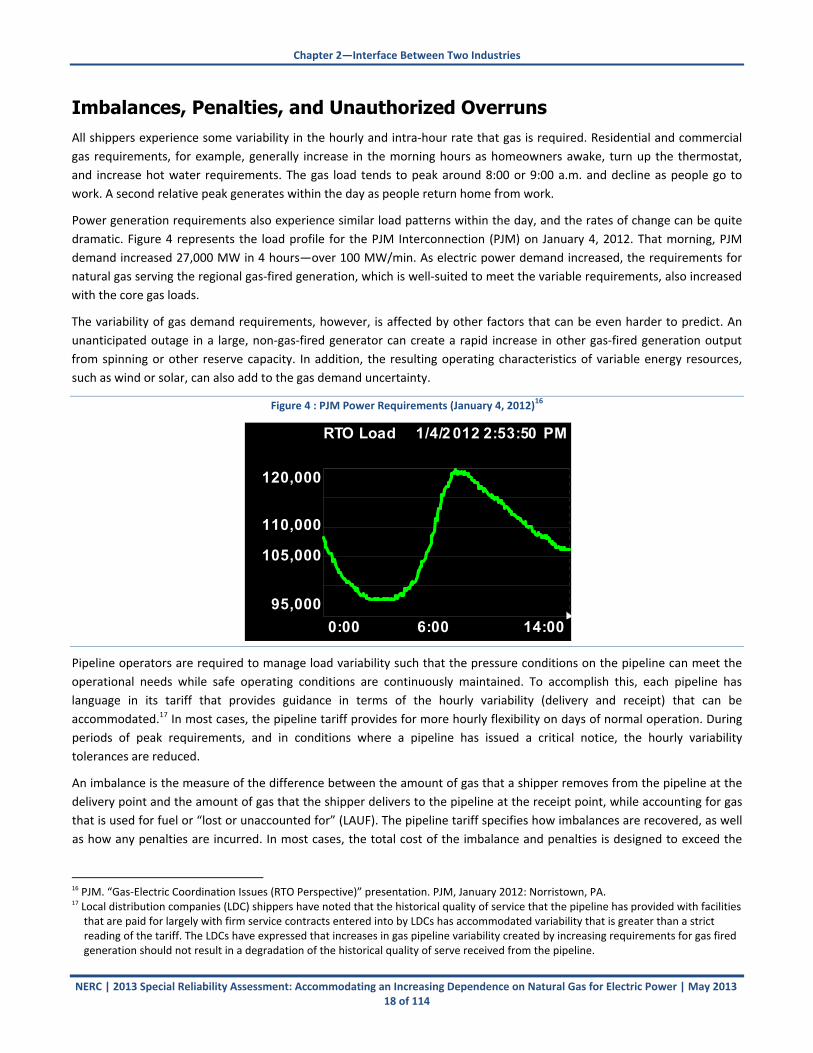
Power generation requirements also experience similar load patterns within the day, and the rates of change can be quite
dramatic. Figure 4 represents the load profile for the PJM Interconnection (PJM) on January 4, 2012. That morning, PJM
demand increased 27,000 MW in 4 hours—over 100 MW/min. As electric power demand increased, the requirements for
natural gas serving the regional gas‐fired generation, which is well‐suited to meet the variable requirements, also increased
with the core gas loads.
The variability of gas demand requirements, however, is affected by other factors that can be even harder to predict. An
unanticipated outage in a large, non‐gas‐fired generator can create a rapid increase in other gas‐fired generation output
from spinning or other reserve capacity. In addition, the resulting operating characteristics of variable energy resources,
such as wind or solar, can also add to the gas demand uncertainty.
Figure 4 : PJM Power Requirements (January 4, 2012)16
Pipeline operators are required to manage load variability such that the pressure conditions on the pipeline can meet the
operational needs while safe operating conditions are continuously maintained. To accomplish this, each pipeline has
language in its tariff that provides guidance in terms of the hourly variability (delivery and receipt) that can be
accommodated.17 In most cases, the pipeline tariff provides for more hourly flexibility on days of normal operation. During
periods of peak requirements, and in conditions where a pipeline has issued a critical notice, the hourly variability
tolerances are reduced.
An imbalance is the measure of the difference between the amount of gas that a shipper removes from the pipeline at the
delivery point and the amount of gas that the shipper delivers to the pipeline at the receipt point, while accounting for gas
that is used for fuel or “lost or unaccounted for” (LAUF). The pipeline tariff specifies how imbalances are recovered, as well
as how any penalties are incurred. In most cases, the total cost of the imbalance and penalties is designed to exceed the
16 PJM. “Gas‐Electric Coordination Issues (RTO Perspective)” presentation. PJM, January 2012: Norristown, PA. 17 Local distribution companies (LDC) shippers have noted that the historical quality of service that the pipeline has provided with facilities that are paid for largely with firm service contracts entered into by LDCs has accommodated variability that is greater than a strict reading of the tariff. The LDCs have expressed that increases in gas pipeline variability created by increasing requirements for gas fired generation should not result in a degradation of the historical quality of serve received from the pipeline.
14:00 6:00 0:00
1/4/2 012 2:53:50 PMRTO Load
95,000
105,000
110,000
120,000

Chapter 2—Interface Between Two Industries
NERC | 2013 Special Reliability Assessment: Accommodating an Increasing Dependence on Natural Gas for Electric Power | May 2013 19 of 114
cost or value of the gas flowing on the pipeline. If this were not the case, there could be significant incentives to increase
imbalances intentionally or to behave in a way that does not minimize the size of imbalances.
Imbalance management is accounted for each day. Although there have been discussions about the possibility of creating
imbalance managements systems that operate on an hourly basis or for periods that match the nomination cycles, to date
no interstate pipeline has instituted such a system. As a result, a shipper that has taken more gas off the pipeline in one
nomination cycle than was delivered to the pipeline (or alternatively, took less gas off than was put on) is not penalized as
long as imbalance is eliminated by the end of the gas day. Because of this, the pipeline must be prepared to operate with
variation in the amount of gas being delivered to the pipeline and the gas being removed within each day.
The integrity of the pipeline is the pipeline’s preeminent obligation. In some instances, a pipeline may allow a customer to
take more gas off the pipeline than a pipeline’s imbalance service, if it does not compromise the operational integrity of the
pipeline. When the pipeline is able to allow an overrun, it generates additional transportation revenue (which is
subsequently shared among “non‐offending” shippers) from providing the additional service. Authorized overruns are
therefore accommodated by pipelines whenever possible.
In order to protect the operational integrity of the system, pipelines install flow control valves at various locations.
Increasingly, these valves have been installed at delivery points where large volumes of gas are removed from the pipeline.
Using these valves, the pipeline can physically reduce the volume of gas flowing to a facility that is taking more gas than it is
entitled.
Most pipelines, however, have been reluctant to take such actions. The shipper is, after all, the customer of the pipeline,
and the pipeline prefers to accommodate its customers’ needs so that the customer does not consider contracting their
loads to a competing pipeline. As a result, shutting the valve on a customer that is taking more gas than scheduled is
considered a “last resort” and rarely occurs. Rather than closing the valve, many pipelines will attempt to regulate the flow
to align deliveries with the contracted volume and rate.
In markets where there is excess gas pipeline capacity available, low‐capacity‐factor gas‐fired power plants can rely upon
interruptible service with a reasonable degree of certainty that service will be available. As growth in gas system
requirements in a region reaches the point where new pipeline capacity is required or when market conditions result in
simultaneous peak in electricity and gas demand, the differences in the structures of the two industries can result in a
mismatch between the requirements for gas delivery service and requirements for gas‐fired electric generation.
Even on non‐peak flow days, gas‐fired generation requires high‐volume, high‐pressure loads with large load swings that
pipelines may not have been designed to accommodate. Pipelines need to align a slow‐moving product (gas) with a fast‐
moving product (electricity) that is subject to large variations (gas‐fired generators come on‐ or off‐line on short notice).
The sudden demand swings from generators may cause pipeline pressure drops that could reduce the quality of service to
all pipeline customers. The main issues are whether the requirements for the gas are predictable within the gas pipeline
nomination cycle, if supplies are available and confirmed, if the pipeline is sized to handle the load variation, what the
proximity to storage is, and whether volumes are taken in excess of confirmed nominations, including specified allowances
for hourly swings.
If the requirements for the gas are not known within the gas pipeline nomination cycle and the available capacity for
interruptible loads is factored into the pipeline operating plans, or if hourly swings are excessive, a pipeline would need to
allocate, reserve, or build facilities on the pipeline to provide service for the intra‐cycle requirements. This may involve the
creation of pipeline services that do not exist. While pipelines are capable of adding capacity in the form of more pipe,
compression, or market‐area storage deliverability, they are unlikely to do so without a cost recovery mechanism, which is
traditionally in the form of a contract for that service.

Chapter 2—Interface Between Two Industries
NERC | 2013 Special Reliability Assessment: Accommodating an Increasing Dependence on Natural Gas for Electric Power | May 2013 20 of 114
In a number of market locations, some gas‐fired generation units rely on gas pipeline capacity above the level that has been
nominated, scheduled, and confirmed with the pipeline. The gas nomination cycle is not synchronized to day‐ahead or real‐
time operations of generation facilities, which results in a potential disconnect in usage versus nomination. While these gas
volumes are ultimately replaced through balancing provisions, the timing of the replacement does not prevent pressure
transients that threaten delivery pressures along the pipeline and harm to other pipeline customers.
Delivery of unscheduled volumes lowers pressure on the pipeline in proximity to the delivery point and at locations
upstream and downstream of that point. This is particularly critical if it occurs at periods of peak pipeline use. Given the
coincidental winter peak for gas Local Distribution Companies (LDCs) and gas‐fired generation serving electric load, this is a
significant risk in regions like New England that do not have excess aggregate pipeline capacity. Weather is the key variable
affecting LDCs’ gas loads and, subsequently, the availability of gas supply to electric generators.
In the context of unanticipated loss of a facility, the natural gas and electric systems operate in fundamentally different
manners. At its most severe condition, a mechanical or other physical failure in electric infrastructure can result in the
immediate loss of service from an entire generating unit or transmission line that can, under some conditions, produce
cascading loss of firm load. The nature of these events and the required instantaneous response of system operators have
generally served as an impetus for electric system planners to employ both resource adequacy review and reliability
(system security contingency) review to assess infrastructure requirements. The result of these reviews allows the bulk
power system to be operated in a manner that is resilient to disruptions.
By contrast, most mechanical or physical failures of gas pipeline or storage facilities result in reductions in the amount of
pipeline capacity rather than a complete loss of service—largely do the physical attributes of electrons compared to
molecules of gas. The exception is a complete failure of a pipe segment or third‐party damage to a single line pipe segment
through improper excavation in the pipeline right‐of‐way. Both of these are rare events. Even when a pipe segment is
completely disrupted, some level of service in the downstream markets is usually maintained via the diversion of gas
through other delivery routes. Many, but not all, pipelines have some ability to re‐route gas along their main transmission
backbones.
As a result, outages in the gas industry are addressed by allocating reductions in capacity that result from a contingency
event, consistent with the priority of contract‐based customers. Low‐priority services such as interruptible and park and
loan services are curtailed first, followed by firm service to secondary delivery points, and finally firm service to primary
points. If the event is sufficient to require reductions in firm service rights, best efforts are made to retain service to
“human needs” customers; that is, residential customers and other buildings, such as hospitals and nursing homes, where
people reside. Therefore, in the event of a severe outage there is the potential that electric generators with firm
transportation service could be curtailed.
FERC Orders Defining Information Posting and Exchange of Information
FERC Order 587 In 1996, FERC issued Order 587, “Standards for Business Practices of Interstate Natural Gas Pipelines.”18 It was based on
natural gas pipeline standards developed by the Gas Industry Standards Board (GISB), the predecessor to NAESB. The
original and subsequent orders included critical conditions (i.e., those that pertain to Transportation Service Providers (TSP)
that affect scheduled gas flow) and non‐critical notices (i.e., general information) that were required to be posted on the
TSP’s designated website and were provided to applicable parties’ choices for Electronic Notice Delivery mechanisms. In
18 18 CFR Part 284, issued July 17, 1996.
Chapter 2—Interface Between Two Industries
NERC | 2013 Special Reliability Assessment: Accommodating an Increasing Dependence on Natural Gas for Electric Power | May 2013 21 of 114
addition, the order defined 12 notice types, several of which are listed below, that are specified in electronic
correspondence:19
Capacity Constraints – capacity constraints resulting from situations other than Operational Flow Order,
Curtailment, or Force Majeure
Capacity Discount – firm capacity offered at rate less than maximum tariff rate
Customer Service Update – general customer service information
Gas Quality – warnings of gas quality issues
Intraday Bump – warnings of bumping scheduled interruptible transactions
Maintenance – scheduled repairs/maintenance that may impact service
Operational Flow Order – issued to alleviate conditions that may impact safe operation.
Since 1996, FERC Order 58720 has undergone a series of modifications, which are listed in alphabetical order above. The
most recent modification was made on July 19, 2012, and the current order is listed as FERC Order 587‐V. 21 The current
order incorporates the latest version (Version 2.0) of certain business practice standards adopted by the Wholesale Gas
Quadrant (WGQ) of NAESB. That version of the standard includes:
Standards to support gas–electric coordination;22
Standards created for Capacity Release redesign due to the elimination of Electronic Data Interchange (EDI) for Capacity Release Upload information;
Standards to support the Electronic Delivery Mechanism (EDM);
Standards to support the Customer Security Administration (CSA) Process;
Standards for pipeline postings of information regarding waste heat; and
Minor technical maintenance revisions designed to more efficiently process wholesale natural gas transactions.
The previous order, 587‐U, issued on March 24, 2010, incorporated Version 1.9 of NAESB’s Standard Business Practices of
the WGQ. On March 4, 2011, NAESB filed a report informing FERC that it had adopted and ratified Version 2.0 of its
business practice. The filing process at FERC initiated steps to incorporate these business practice modifications to become
mandatory and enforceable by FERC.
NAESB’s role is limited to creating consensus for business practices, rather than making policies or policy recommendations.
Thus, FERC Order 587 and its modifications reference NAESB practices, which attempt to standardize and simplify
procedures for interstate natural gas pipelines. Ongoing gas–electric interdependency efforts include FERC’s regional
technical conference series to discuss issues with key market players (e.g., ISOs and RTOs) and NAESB’s Board Committee
on Gas–Electric Harmonization Committee Report, presented to the NAESB Board of Directors in September 2012. In
19 Ibid. 20 A similar FERC Order issued in 2007 that focuses on gas‐electric interdependency issues, based on NAESB business practices. The order arose from cold weather conditions in the northeastern part of the country in the winter of 2003 which led to short‐term reliability issues and high gas and electric prices.
21 FERC Order 587‐V: Final Rule: http://www.ferc.gov/whats‐new/comm‐meet/2012/071912/G‐1.pdf 22 A description of the roles and responsibilities under the Gas/Electric Operational Communication Standards circulated in FERC Order 698; These provisions gave more details on each notice, created 15 new notice types for use in Notices section of pipelines’ websites for public utilities to more easily identify relevant pipeline system conditions and for shippers and interested parties of intraday pumps, operational flow orders, and other critical information electronically.

Chapter 2—Interface Between Two Industries
NERC | 2013 Special Reliability Assessment: Accommodating an Increasing Dependence on Natural Gas for Electric Power | May 2013 22 of 114
addition, FERC is conducting market assessments with pre‐ and post‐seasonal reporting for ISO‐NE, MISO, and other
Regions, and NERC is examining gas–electric interdependencies with a viewpoint on the reliability of the BPS.
FERC Order 698 FERC Order 698 is similar to FERC Order 587 in that it addresses gas–electric interdependency issues.23 Order 698 arose
from the stressful conditions and high gas and electricity prices that resulted from a cold snap in New England in January
2004.24 Order 698, issued in 2007, incorporated certain standards (by reference) of NAESB’s WGQ and the WEQ25 after
NAESB established a gas–electric coordination subcommittee to assess the relationship between the gas and electric
industries, as well as to identify areas to improve coordination through standardization. As with Order 587, NAESB provided
business standards rather than policy or policy recommendations to FERC.
FERC Order 698 requires a Power Plant Operator (PPO) to coordinate natural gas deliveries with the TSP directly connected
to the PPO’s facility. As a result, TSPs now publish on their websites material changes that may impact hourly flow rate to
their PPOs (i.e., critical notices and planned service outages).
The order requires interstate natural gas pipelines and PPOs, Transmission Owners (TOs) and Transmission Operators
(TOPs), independent Balancing Authorities (BAs), and Regional Reliability Coordinators to improve communications for the
coordination of gas transportation scheduling and the operations of gas‐fired generators.
Critical notices and planned service outages pertain information on Transportation Service Provider conditions that affect
scheduling or adversely affect scheduled gas flow. PPOs are required to sign up to receive operational flow orders and other
critical notices from TSPs. TSPs communicate operational flow orders and other critical notices by posting them on their
website. TSPs also publish non‐critical notices, which do not adversely affect scheduled gas flow and typically include bid
awards, annual or monthly meeting notices, and tariff changes.
Example:26 Northwest will communicate material changes in its circumstances that may impact hourly flow rates for PPOs
by issuing a critical notice. Critical notices can be accessed by: 1) Northwest’s website; 2) Northwest’s proprietary system,
Northwest Passage, after completing an Access Agreement located in the download section on the Northwest Informational
Posting website; or 3) email or fax after completing a Business Associate form located in the download section on the
Northwest Informational Posting website.27
Issues for Balancing Authorities and Reliability Coordinators At this time, it is not clear whether the electric BAs and Reliability Coordinators (RCs) have an adequate understanding of
the information that was made available to them following FERC’s Order 587‐V. A first step is for the BAs and RCs to identify
the gas‐fired generators—and their pipeline sources—that affect conditions in their areas. This is done by identifying the
specific pipeline or LDC “Meter ID” that is associated with delivering gas to the specific power plant or station. While the
generators’ fuel managers may understand the critical and non‐critical notices, the information may not be readily
communicated or understood well enough by the BAs or RCs. A second step would be for the electric reliability practices to
include a basic understanding of the need to receive and understand the information contained in critical notices.
Currently, the pipeline is considered compliant if the information is sent to BAs only if requested by the BA. If the BA does
23 FERC. (2012) Standards for Business Practices of Interstate Natural Gas Pipelines. 18 CFR Part 284. Docket No. RM96‐1‐037; Order No. 587‐V <www.ferc.gov/whats‐new/comm‐meet/2012/071912/G‐1.pdf>
24 North American Energy Standards Board (NAESB). “Order 698 Effort.” NAESB, 10 September 2007: Houston, TX. Available at: www.naesb.org/pdf3/update091207w5.doc
25 The standards for the Wholesale Electric Quadrant are: Gas/Electric Coordination Standards WEQ‐001‐0.1 through WEQ‐011‐0.3 and
WEQ‐011‐1.1 through WEQ‐011‐1.6. The standards for the Wholesale Gas Quadrant are: Additional Standards, Definitions 0.2.1 through 0.2.3 and Standards 0.3.11 through 0.3.15. 26 Welcome to Northwest Pipeline: www.northwest.williams.com/Files/Northwest/10192007WelcometoNorthwestPipelinefinal_4_.pdf Accessed 14 Nov. 2012.
27 www.northwest.williams.com

Chapter 2—Interface Between Two Industries
NERC | 2013 Special Reliability Assessment: Accommodating an Increasing Dependence on Natural Gas for Electric Power | May 2013 23 of 114
not request notification (and therefore does not receive the information), the pipeline is still compliant. On the other hand,
BAs are not required to request this information, but some of them do in order to facilitate their planning and operations
process.
RCs, BAs, ISOs, and RTOs should work to increase their understanding of the information in Order 587‐V and be able to
incorporate it into their hourly and real‐time operations. The ability to interpret the informational postings is critical for the
reliability of the BPS, and the electric industry should be able to take advantage of it. During the last FERC technical
conference on this issue in February 2013, some ISOs noted that they were unable to make full use of the informational
postings so far. Additionally, Generator Owners and Operators should be well coordinated with pipeline operators in this
information exchange. NERC is in the process of evaluating this problem and will work with industry members to address it,
where necessary. NERC could leverage its stakeholder groups to identify best practices in areas that are currently most
vulnerable to gas dependency risks and are taking immediate actions for improvement, such as New England. Such an effort
could lead to insights for enhanced operator training and table‐top exercises.
Differences of Contingency Events in the Gas and Electric Industries Natural gas and electric infrastructures are fundamentally different in the manner in which their integrated systems
operate, particularly in the context of the unanticipated loss of a facility. A mechanical or other physical failure in electric
infrastructure can result in the immediate loss of service from an entire generating unit or transmission line that can, under
some extreme conditions, produce cascading loss of service to electric customers.28 The nature of these events and the
required instantaneous response of system operators has generally served as an impetus for electric system planners to
employ both resource adequacy review and reliability (system security contingency) review to assess infrastructure
requirements—a requirement of NERC TPL Standards.29
By contrast, most mechanical or physical failures of gas pipeline or storage facilities result in reductions in the amount of
capacity of the pipeline rather than a complete loss of service. The exception to this is a complete failure of a pipe segment
or an incident of third‐party damage to a pipe segment through improper excavation in the pipeline right‐of‐way. Even in
the instances where a pipe segment is completely disrupted, some level of service in the downstream markets is usually
maintained via the diversion of gas through other delivery routes and/or storage.
As a result, outages in the gas industry are addressed by allocating reductions in capacity that result from a contingency
event consistent with the priority of contracts‐based customers. Interruptible service is curtailed first, followed by firm
service to secondary delivery points, and finally firm service to primary points.
Because of these differences, as well as the various probabilities of contingency events, the planning and operation of
facilities to address unanticipated outages and other contingencies differ markedly between the two industries.
Other Factors Historically, the average capacity factors for non‐peaking gas‐fired units have been about 25 percent, with peaking units
having average capacity factors of five percent or less. In addition, the period of greatest use for these units was during the
summer season, when electric loads peaked because of air conditioning demand. As a result, the power industry used, and
continues to use, interruptible transportation in an effort to minimize production costs. The gas industry was able to adapt
to this use of interruptible transportation services, because the gas used for generation loads at the time accounted for a
lower percentage of the total pipeline loads, and the pipelines had economic incentive to provide these interruptible
transportation services. However, more recently, many electric generator loads have shifted from being peak and
intermediate load providers to being base, intermediate, and peak load providers. This shift has caused average capacity
28 If an electric grid were operated below N‐1 criteria, a loss of a single component can cause cascading failure of that grid. 29 NERC Reliability Standard TPL‐002‐0b: http://www.nerc.com/files/TPL‐002‐0b.pdf

Chapter 2—Interface Between Two Industries
NERC | 2013 Special Reliability Assessment: Accommodating an Increasing Dependence on Natural Gas for Electric Power |May 2013 24 of 114
factors30 of combined‐cycle generation to approach 50 percent and, in some Regions, exceed 60 percent (Figure 5).
However, there are significant regional differences in this evolving phenomenon, with some Regions still only utilizing their
non‐peaking gas‐fired units only 20 percent of the time. Average gas‐turbine capacity factors are generally below 12
percent across all Regions—almost 25 percent in ERCOT.
Figure 5: 2012 NERC US Actual Weighted Average Capacity Factors for Combined Cycle vs. Combustion Turbine Gas‐Fired Generators31
Due to this shift in gas loads, interruptible transportation services may be best suited for generators with low‐capacity
factors, and firm transportation services may be more appropriate for generators with high‐capacity factors. However,
given a larger portfolio of gas‐fired generation and tighter reserve margins in some cases, for reliability, more firm fuel
service may be necessary to manage potential risks. Obtaining firm transportation services represents a significant
challenge for the electric power industry and to consumers, due to the higher costs associated with these services. Dual‐
fuel and a variety of storage options can bridge the gap between the uncertainties of gas availability during extreme events
and maintaining a reliable source of capacity available to meet seasonal peak demands. Ultimately, the right balance of firm
pipeline capacity, dual‐fuel capabilities, and a variety of storage and no‐notice options will depend on the region and the
individual generation facilities. Factors such as market structure, geography, fuel mix, and pipeline infrastructure will all
determine the extent of gas dependency risks and the available options and solution sets for reducing this risk.
Lastly, gas quality (or gas composition) can also be a relatively important issue for the power industry, as well as for other
gas consumers. Every natural gas field in the world is unique, some types of natural gas in particular (e.g., coal‐bed
methane, sour vs. sweet gas, and man‐made LNG). This uniqueness of natural gas supplies can be problematic for some
users, depending on the design of their equipment and appliances. For example, natural gas with a high British thermal unit
(Btu) level (i.e., from excessive ethane, propane, and other heavier hydrocarbons) can burn too hot in low‐nitrogen oxide
(NOx) burners, which could impact both the efficiency and environmental performance of these units. Also, natural gas with
excessive heavy hydrocarbons under low temperature conditions can solidify and accumulate as a slug in a pipeline or other
equipment, which can lead to undesirable results, including pipeline blockage, equipment failure, and fuel quality issues.
Specifically, combined‐cycle gas‐fired units with low NOx burners can be sensitive to unanticipated, transient changes in
natural gas heat content32 (+/‐ 5 percent Btu/cu‐ft), which could trigger automatic control‐action to avoid unit shutdown
and equipment damage.33 In cases where a number of gas‐fired units obtain their fuel from the same pipelines, changes in
30 Regional capacity factors are weighted by summer rated capacity of each gas‐fired generator. 31 Source: EIA‐860 and EIA‐923, US Only 32 See http://www.beg.utexas.edu/energyecon/lng/documents/NGC_Interchangeability_Paper.pdf and http://www.ferc.gov/industries/lng/indus‐act/issues/gas‐qual/lng‐interchangeability‐rpt.pdf for more background. 33 FERC Docket RP08‐374‐000, June 11, 2008, page 5, item 12: “Casco Bay states that in 2006 it experienced a unit trip due to a “lean blow out” condition… attributed to backhauling gas from alternate supply during a Sable outage.”
0%
10%
20%
30%
40%
50%
60%
70%
CC GT CC GT CC GT CC GT CC GT CC GT CC GT CC GT
ERCOT FRCC MRO NPCC RFC SERC SPP WECC
0
10,000
20,000
30,000
40,000
50,000
60,000
70,000
Summer Rated Cap
acity (M
W)
Cap
acity Factor (%
)
Weighted Average of Seasonal Capacity Factor Summer Capacity

Chapter 2—Interface Between Two Industries
NERC | 2013 Special Reliability Assessment: Accommodating an Increasing Dependence on Natural Gas for Electric Power | May 2013 25 of 114
natural gas heat content can result in multiple unit trips at nearly the same time, which threatens BPS operating reliability.34
LNG presents the most notable challenges due to its diverse origins and compositions; however, unconventional natural gas
production can also present similar fuel quality concerns. Furthermore, units are not only susceptible to full outages, but
they may experience the inability to modulate power output, since one mitigation strategy is to fix the output of units at
constant power output until a fuel quality disruption subsides. This strategy may affect both operational flexibility and
resource adequacy. While fuel quality and composition risks associated with the increased penetration of unconventional
and liquefied natural gas remain relatively low, the potential reliability impacts should be studied further.
Over the last decade, the industry—largely through FERC proceedings—has carefully examined the issues surrounding gas
interchangeability.35 This has caused the pipelines to carefully review their specifications for pipeline quality gas and to
clearly note these specifications within their pipeline tariffs. While no two pipeline tariffs for gas quality are identical
because of differences in gas fields across the nation, they are all relatively similar. Largely because of prior actions taken by
regulators and the industry, this issue has not been a significant problem for electric generators so far.
Critical Incidents Historical incidents illustrate that with increasing interdependency between the natural gas and electric power industries,
an event caused by either sector can affect the system reliability of both. This, in turn, has created a need for greater
interindustry coordination. There already have been a number of studies on how the coordination between the two
industries can be enhanced. As a first step to enhancing the coordination between the two industries and reducing the
vulnerabilities of the electric industry, NERC tabulated the observations, insights, and recommendations of these reports in
Appendix I.
As an aid to completing this critical first step, Appendix I identifies several of the major historical reports on the topic and
summarizes their findings and recommendations. The historical reports cover nearly every aspect of the complex issue of
interindustry coordination and identify the barriers against accomplishing such coordination. Limitations on fuel switching,
limitations caused by environmental restrictions, the vulnerabilities of each industry to the other, the need for adequate
incentives to ensure BPS reliability, and the importance of working with third parties to ensure system reliability are among
the issues identified. Several of these historical assessments also cite the need for interindustry coordination at a regional
level, as a universal solution to this complex issue does not exist, particularly in light of the unique characteristics of each
region.
While relatively few in number and limited to specific regions, there have been interruptions to the delivery of gas supply to
gas‐fired units, as well as to consumers within the other demand sectors. As illustrated by the review of selected historical
service interruption incidents in Chapter 3, none of the incidents directly affected overall system reliability. In some cases,
the gas industry was able to either respond quickly or resort to alternatives. However, some historical incidents have
contributed to the degradation of system reliability, and similar incidents that could easily threaten regional system
reliability are possible.
34 ISO‐NE January 29, 2009 letter, “Summary of Events Related to the January 26, 2008 Sable Island Production Disturbance, 1,470 MW lost in New England – (No OP4 declared) but shows loss of Sable can be disruptive. 35 Probably the most significant proceedings in the past have been (1) the Natural Gas Pipeline proceeding in 2005 (Docket No. RP01‐503‐002 and 003) on the appropriate permanent safe‐harbor hydrocarbon dew point figure (below 15° F); and (2) the Washington Gas Light and Cove Point LNG proceeding concerning the interchangeability and LNG (i.e., Docket No. PL‐04‐3‐000). Concerning the latter, FERC determined the issue specific to Washington Gas Light was an increase in operating pressure and the use of hot tar as a method of corrosion protection. Also, see Chapter 7 of NERC’s A Primer on the Natural Gas Industry and its Interface with the Electric Power Industry, 2011, for a discussion of the Wobbe Index.

NERC | 2013 Special Reliability Assessment: Accommodating an Increasing Dependence on Natural Gas for Electric Power | May 2013 26 of 114
Chapter 3—Gas Supply Vulnerabilities As shown in previous NERC assessments, reliability challenges are more likely to occur during the winter season.36 It is
important to understand that while firm gas transportation significantly decreases the likelihood that fuel delivery will be
curtailed, extreme events, such as wellhead freeze‐offs causing decreased gas production,37 could potentially lead to
common‐mode failures of multiple gas‐fired generators. Additionally, non‐interstate pipeline customers with gas use
designated as “human use” (typically local distribution companies and some commercial customers at the state‐regulated
level) always receive priority over electric generation, which during emergencies and restoration efforts can have an impact
on gas‐fired generation—even with pipelines that have firm capacity rights.
Extreme Winter Weather Impacts Disruption of natural gas supplies during extreme and prolonged weather conditions identified are vulnerabilities that
should be sufficiently studied and assessed. Most recently, the reductions in supply during the February 2011 Southwest
cold weather event were comparable in magnitude to the production shut‐ins during interruptions caused by past major
hurricanes.38
Figure 6 : U.S. Dry Gas Production
Extreme and prolonged winter weather is clearly a high‐risk period, and while weather conditions cannot be controlled,
preparations and sufficient planning could help minimize the effective impact to BPS reliability. Cold weather is the primary
driver for gas and electric use during winter months. While electric generation owners and operators are generally able to
schedule gas during the summer to meet seasonal peak demand, this flexibility usually decreases during winter months
when pipelines peak and firm transportation customers schedule their full entitlements. Cold weather can also be
responsible for increased infrastructure and supply disruptions, which are generally caused by freezing.
Historical Gas Supply Disruptions Historically, large curtailments of natural gas to both electric generation and consumers within other demand sectors are
generally considered rare events. The natural gas industry is considered by most industry observers to be relatively safe and
to offer a high degree of reliable service. However, incidents leading to curtailments do occur. In addition, there are
instances of upstream gas supply loss. Regions that depend heavily upon gas‐fired generation can be particularly sensitive
to such incidents, as they can impair electric reliability and cause regional wholesale prices to increase for a short period of
time.
36 2011 Special Assessment Report: A Primer of the Natural Gas and Electric Power Interdependency in the United States, http://www.nerc.com/files/Gas_Electric_Interdependencies_Phase_I.pdf
37 Force majeure clauses in fuel contracts relieve the lessee from liability for breach if the party's performance is impeded as the result of a natural cause that could not have been anticipated or prevented. Force majeure events must completely prevent performance and must be unanticipated.
38 http://www.nerc.com/files/SW_Cold_Weather_Event_Final_Report.pdf

Chapter 3—Gas Supply Vulnerabilities
NERC | 2013 Special Reliability Assessment: Accommodating an Increasing Dependence on Natural Gas for Electric Power | May 2013 27 of 114
While several of the pipeline incidents noted below were caused by either acts of nature or third‐party actions, there are
other causes of pipeline interruptions.39 In several of these incidents, the gas industry took advantage of pipeline looping,
interconnects with other pipelines, storage, and other inherent redundancies, and was able to recover services relatively
quickly. However, for the electric industry, which tends to operate in almost a millisecond environment, such a rapid
recovery can still result in system reliability problems, particularly when significant fuel switching capability does not exist
within that region or could not be operational within a sufficient time frame.
Below is a list of several interruption events and their impact on the gas and electric industries.
El Paso Natural Gas: An explosion on El Paso’s southern system in 2000 forced the curtailment of 500–700 MMcfd
for at least two weeks. Full service was not returned for months. The outage had a significant impact on the entire
region and forced some consumers to make withdrawals from storage in a period when regional storage injections
were already well behind the historical benchmarks.40
Florida Gas Transmission: A lightning strike at the Perry compressor station in 1998 melted all three of the main
lines on the Florida Gas Transmission system, which forced the curtailment of 1.5 Bcfd. Regional electric utilities
were able to avoid rolling blackouts by switching from gas to residual fuel oil and requesting voluntary
curtailments (increasing air conditioning thermostats 10oF and not using dishwashers). Electric service to a few
commercial customers was interrupted (i.e., demand response) in return for compensation.
Algonquin Gas Transmission: In 1995, as a result of damage to the Algonquin system caused by a bulldozer
operated by a third party, Algonquin began to lose line pressure, which forced the 489 MW Manchester Street
power plant in Rhode Island offline. Because of its fuel‐switching capabilities, the plant was able to later come back
online and burn oil, which it did for 11 hours before gas pipeline service was restored.
TransCanada: During the 1995–1997 period, there were five explosions or fires on the TransCanada pipeline,
which is a major transporter of gas into the New England region. The most significant of these occurred in July
1995 near Rapid City, Manitoba, where an explosion took out all six parallel pipelines that make up the
TransCanada system and two electric generators at a nearby compressor station. While two lines were back online
the same day as the incident, it took over a week to get three of the remaining lines online, and it was not until
mid‐August before the last line and one unit at the compressor station were back in service. This incident forced
TransCanada to curtail 32 percent of its firm supplies, or 1.75 Bcfd. All interruptible service was interrupted.41
Sable Island: On Saturday, January 26, 2008, a mechanical component failure at the Sable Offshore Energy Project
(Sable Island) located off the Nova Scotia coast resulted in a significant loss of natural gas supply to northern New
England generating resources. The ISO New England control room received direct notification of the disturbance at
10:00 a.m. By 2:00 p.m., New England had lost 1,040 MW of New England‐wide gas fired generation, 808 MW of it
in northern New England. By 6:00 p.m., those numbers had grown to 1,470 MW and 1,116 MW respectively. In
response, 570 megawatts of oil‐fired replacement generation was brought on‐line for the peak. At 5:00 p.m.,
39According to the database provided by the U.S. Pipeline and Hazardous Materials Safety Administrator (PHMSA), which covers the period from 2005 to 2010, (1) 25 percent of the pipeline incidents were due to material, welding, or equipment failure; (2) 23 percent was due to corrosion; (3) 19 percent was due to natural causes; (4) nine percent was due to damage from outside forces (i.e., third parties); (5) 6.8 percent was due to excavation damage; and (6) approximately 14 percent was due to miscellaneous or unknown causes. About 70 incidents occurred per year over this timeframe.
40 In addition, environmental limits in southern California, (e.g., for NOx emission), resulted in some gas‐fired generation being shifted to less efficient generating units adding additional stress to the electric system: http://docs.cpuc.ca.gov/published/comment_decision/41366‐02.htm
41The other incidents occurred on April 15, 1996, September 30, 1996, December 11, 1996, and December 2, 1997. For the most part, these incidents only impacted one of the six lines on the TransCanada system, and since the pipeline was not at peak capacity, supplies were rerouted in order to avoid curtailing firm contracts.

Chapter 3—Gas Supply Vulnerabilities
NERC | 2013 Special Reliability Assessment: Accommodating an Increasing Dependence on Natural Gas for Electric Power | May 2013 28 of 114
resources were postured to maintain operating reserve.42 Repairs to Sable Island were completed early on January
28, 2008 with gas production returning to normal levels later that day.43
The Sable Offshore Energy Project was the only source of supply for the Maritimes and Northeast (M&NE) Pipeline,
prior to the commercialization of the Canaport LNG facility. In the summer of 2009, which is a period of peak
power demand, there was a planned production outage at the Sable Island gas field. The resulting loss of gas
supply was problematic for the New England region and, in particular, the number one consumer of regional gas
supplies at that time: the power industry. Fortunately, the Canaport LNG re‐gasification terminal (started in July
2009) prevented an extreme incident. However, the difficulties that materialized clearly illustrate the need for
increased communication between the two industries, as well as improvements for internal coordination.
Pacific Gas and Electric (PG&E): In 2010 and 2011, three incidents involved the rupture of an old section of cast
iron pipe. The most significant involved the rupture of a 36” diameter section on Line 132 of the pipeline system.44
This section of pipe was 55 years old.45 In the case of the PG&E incident, there was a significant loss of service due
to pressure reductions required by regulators following the incident. This limited the pipeline system’s ability to
adapt to changes in load requirements, particularly for power plants, because of the reduction in line pack.
Following the accident, PG&E took many actions ordered by the California Public Utility Commission, including
reducing the operating pressure on Line 132 to 20 percent below the operating pressure.46
Southwest: In February 2011 the Southwest experienced both rolling blackouts and significant gas curtailments as
the result of extreme winter weather conditions. A similar event occurred in the region in a 1989 incident.47 While
the primary cause of both the blackouts and curtailments was extreme weather conditions,48 there have been
investigations into the need for more integration within both industries. About 52 percent of the over 250 electric
generating units that experienced outages and 67 percent of the approximate 1.2 TWh lost were directly weather‐
related. However, about 15 percent of the lost units and 12 percent of the lost energy were either due to gas
supply problems or attempts to switch from gas to alternative fuels.
With respect to these gas supply problems and the interdependency of the two industries, pipeline companies
were not significantly affected by the electric outages, because they typically had gas‐fired pipeline compression or
backup power supplies on critical equipment. However, further upstream within the gas industry, the loss of
electricity did affect the performance of gas producers, gas processing plants and storage facilities, and some
electric‐driven compressors. While the majority of the gas curtailments were attributed to well freeze‐offs,
approximately 29 percent of the gas supply in the Permian basin and 27 percent in the Fort Worth (Barnett) basin
occurred as a result of shutting down electric pumping units or compressors on gathering lines. Similarly, while
processing plants suffered a number of mechanical failures, loss of electricity also contributed to performance
problems. Storage facilities with electric compressors were not able to provide the requested storage withdrawals
during this period of unprecedented peak gas demand for the region due to the electric supply disruptions.
42 No electric load was interrupted. Operating Procedure #4 and Master/Local Control Center Procedure #2 were not implemented. 43 From ISO‐NE correspondence dated January 29, 2008.
44 The other two incidents involved 12” diameter distribution lines for LDCs (UGI Utilities in Allentown, PA, and Philadelphia Gas Works). 45 Since the initial PG&E incident, there have been three other failures of legacy pipeline on the PG&E system (October 24, November 3, and November 6). All three of these additional incidents occurred during hydrostatic testing of the lines at pressures between 525 and 998 psig. The October incident occurred in a section of pipe in PG&E’s Line 300B (part of the backbone of the PG&E system).
46 Pacific Gas and Electric Company Natural Gas Transmission Pipeline Rupture and Fire San Bruno, California September 9, 2010: www.ntsb.gov/doclib/reports/2011/PAR1101.pdf
47 See NERC’s A Primer on the Natural Gas Industry and its Interface with the Electric Power Industry, 2011; see Appendix A for a discussion of the 1989 incident.
48 Weather conditions caused frozen sensing lines, frozen equipment, frozen water lines, frozen valves, blade icing, low temperature cutoff limits, well freeze‐offs, icy roads that prevented the deployment of maintenance crews, etc.

Chapter 3—Gas Supply Vulnerabilities
NERC | 2013 Special Reliability Assessment: Accommodating an Increasing Dependence on Natural Gas for Electric Power | May 2013 29 of 114
While the majority of the problems for both industries during the February 2011 events were directly related to
weather conditions; rolling blackouts resulted in reduced upstream gas supplies, which in turn resulted in less gas‐
fired generation. As a result of this incident, there is an investigation into whether critical downstream electric
loads in the gas industry should be deemed “human needs” customers and thus be exempted or given special
consideration for the purposes of electric load shedding. In some local areas, critical electric loads in the gas
industry are already being identified for special consideration in electric load shedding and restoration plans,
ensuring that compressor stations are on protected circuits.
As described above, some of the pipeline incidents were the results of acts of nature. While it is not possible to fully protect
any system against acts of nature, contingency plans can and should be prepared and constantly reviewed prior to and
during the events to ensure system adequacy. When new, unforeseen incidents occur, contingency plans can be adapted as
appropriate to incorporate the major lessons learned from such incidents, even if they occur in another region.
Even for incidents that are not directly caused by acts of nature, implementing a lessons learned approach to reliability is
likely to reduce vulnerabilities. The following issues are based on NERC’s evaluation of prior gas and electric incidents.
Pressure Reductions: While in most instances regional gas flows were restored rather quickly, in at least two cases
gas flow was affected for longer periods of time. In such cases, pipeline pressures could be reduced. Gas‐fired
electric generation units, in particular, are very sensitive to such pressure reductions because of their unique
requirements for high burner‐tip pressures. In such instances, having access to on‐site booster compression for
certain (critical) gas‐fired units within the region could enhance overall system reliability.
Cast Iron Pipe: Cast iron pipeline sections are largely confined to the distribution systems of gas LDCs and are
virtually nonexistent on the interstate pipeline system.49 While most newer gas‐fired power plants are not directly
connected to LDC systems, there are many exceptions (e.g., New York Facility System). A key contributing cause of
ruptures in cast iron pipeline sections is steadily increased or transient pressures, which is an inherent
incompatibility with gas‐fired generators’ high‐pressure demands. While replacement of the legacy pipes
continues, acceleration of these efforts could decrease the likelihood of another large disruption.
Wellheads Freeze‐Offs: The natural phenomenon of freezing is a common occurrence in the operation of a natural
gas pipeline system. Freezing is a potential and serious problem that starts at the production wellhead and
continues through the last point in the customer delivery system. Production and gathering systems are typically
laden with water vapor, which increases the likelihood of freezing problems. Gas producers use a wide variety of
measures to prevent or minimize freezing impacts, such as adding chemicals and other heating systems to prevent
freezing. Producers use different weatherization techniques for wells. For example, producers use methanol
injection or drip in their wells, they use cold weather barriers, and they increase hauling of fluids from tanks, anti‐
freeze fluids, heat tracing, hot oil trucks, insulation, burial of lines, and heaters.
Pipelines are usually less likely to be affected by freezing temperatures since the gas has typically been through a
treatment facility and a majority of the natural gas liquids have been subsequently removed. The water allowance
for typical pipeline tariff gas quality is around 7 lbs. per million standard cubic feet (scf) (roughly 1 U.S. gallon),
which is considered to be relatively dry gas and therefore less likely to lead to freezing concerns. Within the normal
LDC, the problems associated with freezing should be almost nonexistent.50
49 At the beginning of 2010 there were approximately 35,600 miles of cast iron pipe and 48,100 miles of unprotected base steel pipe, which represented about three percent of the nation’s pipeline infrastructure. LDCs have programs to replace legacy pipes. For example, during the 2004–2009 period, only 5,900 miles of pipe was replaced, while Atlanta Gas Light (AGL) is near the end of a program they started in the mid‐1990s to replace their legacy pipe.
50 Freeze Protection for Natural Gas Pipeline Systems and Measurement Instrumentation, David J. Fish. 2005

Chapter 3—Gas Supply Vulnerabilities
NERC | 2013 Special Reliability Assessment: Accommodating an Increasing Dependence on Natural Gas for Electric Power | May 2013 30 of 114
Gas Supply Source Outages and Contingencies Gas supply sources, gas processing plants, and LNG import terminals may also be modeled using scheduled and
unscheduled outage scenarios. For wellhead supplies, the most common form of significant forced outages are freeze‐offs
caused by extremely cold weather, and hurricanes that lead to abandonment and shut‐down of offshore production
platforms and damage to various kinds of onshore and offshore production facilities. As an illustration, the effect of
hurricanes is discussed below.
Atlantic hurricanes have a long history of passing into the Gulf of Mexico and making landfall along the coast of the United
States, as shown in Figure 7. With decreases in Gulf of Mexico production and increases in shale production in regions less
impacted by hurricanes, this is less of a concern today.
When hurricanes pass into the Gulf of Mexico, they often disrupt oil and gas production from offshore platforms and in
coastal areas. Disruption can be caused by production shut‐ins due to the evacuation of personnel from the production area
or by damages to production facilities or transmission pipelines that require replacement or repair. Table 1 lists the storms
that have disrupted production since 1992 in the Gulf of Mexico. In 11 of the past 21 years, there have been hurricane‐level
storms that could disrupt Gulf of Mexico oil and gas production. In 6 of 21 years, two or more hurricanes have entered the
Gulf. The two most recent high hurricane activity years in the Gulf of Mexico are 2005, which had hurricanes Katrina and
Rita, and 2008, which had hurricanes Gustav and Ike. The impact on electric generators is somewhat difficult to assess,
because some generators were flooded, and transmission was down due to winds.
Figure 7: Continental United States Hurricane Strikes 1950‐2011*51
51 http://www.ncdc.noaa.gov/

Chapter 3—Gas Supply Vulnerabilities
NERC | 2013 Special Reliability Assessment: Accommodating an Increasing Dependence on Natural Gas for Electric Power | May 2013 31 of 114
Table 1: Storms Causing Disrupted Production Since 1992 in the Gulf of Mexico (Gulf)
Year Storms in Gulf
Category 3+ Storms in Gulf
Description Estimated Gulf Gas Production
Lost (Bcf)
1992 1 1 Andrew hit S. FL as a Cat 5 and LA as a Cat 3 N/A
1995 2 1 Erin hit E. FL as a Cat 1, crossed into gulf and hit FL panhandle as a Cat 2; Opal
landed as a Cat 3 on FL panhandle 19
1997 1 0 Danny came across central gulf and LA tip and landed in Mobile Bay as Cat 1
1998 1 0 Georges hit Cuba but was down to a Cat 1 when it hit MS
1999 1 1 Bret hit S. TX as a Cat 3, Irene hit S. FL as a Cat 1
2002 2 0 Isidore and Lili both Cat 1 76
2003 2 0 Tropical Storm Bill, Claudette Cat 1, and Erika 8
2004 2 2 Charlie Cat 4 hit SW FL and Ivan Cat 3 hit AL/FL border 196
2005 5 3 Cindy Cat 1 hit LA, Dennis Cat 3 hit FL panhandle, Katrina Cat 3 hit LA, and Rita
Cat 3 hit TX/LA border 899
2007 0 0 Dean and Felix hit southern Mexico
2008 3 2 Dolly in late July, Gustav Cat 2 in late August, and Ike Cat 2 in early September 441
2009 1 0 Ida in early November
2010 0 0 Alex crossed Mexico in June
The hurricane probability curve in Figure 8 shows actual hurricane disruptions over the past 20 years that have shut in or
damaged production. Based on historical events, there is a 40% chance of no hurricane disruption each year, a 29% chance
of having multiple Gulf hurricanes, and only a 5% chance of having a very active storm year (like 2005 or worse).
Table 2 lists the assumptions of monthly disruptions behind each point on the probability curve shown in Figure 8.
Hurricanes Gustav and Ike disrupted about 5.5 Bcfd out of 8.0 Bcfd (69%) of the Gulf of Mexico’s gas production in
September 2008. Hurricane damage kept some production out of service for the rest of the year, with some facilities not
resuming production until April 2009. The total production loss for 2008 was about 1.0 Bcfd (13%) of the possible 8.0 Bcfd
of annual Gulf gas production, and only about 1.4% of total U.S. and Canadian production in 2008. In 2012, Gulf of Mexico
offshore production was about 5.2 Bcfd out of about 81 Bcfd of U.S. and Canadian gas production.
The probability assumptions for a Gulf hurricane should still be valid for reliability assessment purposes, but the size of the
disruption should be scaled down to the current level of Gulf offshore production that is caused by unconventional gas
production within regional shale plays. Natural gas storage also can significantly help mitigate these supply disruptions.
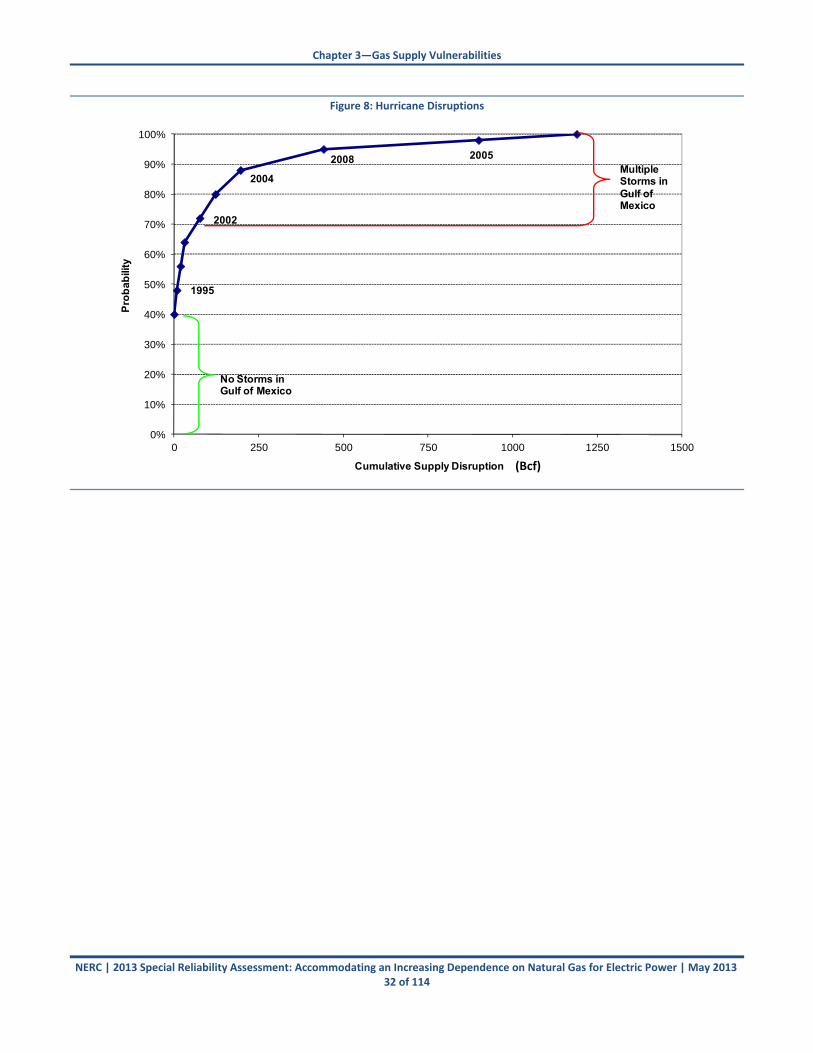
Chapter 3—Gas Supply Vulnerabilities
NERC | 2013 Special Reliability Assessment: Accommodating an Increasing Dependence on Natural Gas for Electric Power | May 2013 32 of 114
Figure 8: Hurricane Disruptions
0%
10%
20%
30%
40%
50%
60%
70%
80%
90%
100%
0 250 500 750 1000 1250 1500
Pro
ba
bili
ty
Cumulative Supply Disruption
No Storms in Gulf of Mexico
2005
2004
2002
1995
Multiple Storms in Gulf of Mexico
2008
(Bcf)

Chapter 3—Gas Supply Vulnerabilities
NERC | 2013 Special Reliability Assessment: Accommodating an Increasing Dependence on Natural Gas for Electric Power | May 2013 33 of 114
Table 2: Monthly Disruption Assumptions Hurricane Disruption Type (Point on Curve in Figure 7)
0 1 2 3 4 5 6 7 8 9
Disruption Pattern Based on Historical Hurricanes in Year
Multiple Years
2003 Bill, Claudette, &
Erica 1995 Opal
ICF Generic Outage
Assumed in all forecast
years
2002 Isidore & Lili
Not Historical, ICF Made up Disruption
2004 Bonnie, Charlie,
Frances, & Ivan
2008 Gustav & Ike
2005 Cindy, Dennis, Emily,
Katrina, & Rita
Not Historical, ICF Worst Case
Description of Disruption No
Hurricanes in Gulf
Minor storms early in the season, no damage
Minor late‐season
storm, no damage
One or two storms in Sep or Oct, no damage
Two strong late‐season storms in Gulf. Minor damage from second storm
Two major storms: one early and one late. Minor damage in both storms
Active year. Last storm caused
damage that took several months to repair
Two major storms at end of summer. Outages
carried into the next year
Heavy activity through
summer and fall.
Extensive damage into the next year
Worst hurricane year in 100
years. Massive damage
offshore and onshore
Probability of Disruption (%) 40% 8% 8% 8% 8% 8% 8% 7% 3% 2%
Cumulative Probability (%) 40% 48% 56% 64% 72% 80% 88% 95% 98% 100%
Cumulative Disruption (Bcf) 0 ‐8 ‐19 ‐31 ‐76 ‐122 ‐196 ‐441 ‐899 ‐1189
Offshore Disruption (%) 100% 100% 100% 100% 100% 100% 100% 100% 75% 65%
Onshore Disruption (%) 0% 0% 0% 0% 0% 0% 0% 0% 25% 35%
Offshore Disruption (Bcf) 0 ‐8 ‐19 ‐31 ‐76 ‐122 ‐196 ‐441 ‐674 ‐773
Onshore Disruption (Bcf) 0 0 0 0 0 0 0 0 ‐225 ‐416
Days Month Monthly Disruption (Bcfd)
31 July 0.00 ‐0.25 0.00 0.00 0.00 ‐1.50 0.00 0.00 ‐0.85 ‐2.00
31 August 0.00 ‐0.01 0.00 0.00 0.00 ‐0.50 ‐0.13 ‐0.29 ‐1.10 ‐4.00
30 September 0.00 0.00 0.00 ‐0.50 ‐0.53 ‐2.00 ‐1.90 ‐5.45 ‐6.10 ‐7.00
31 October 0.00 0.00 ‐0.61 ‐0.50 ‐1.93 0.00 ‐1.66 ‐2.77 ‐6.20 ‐6.50
30 November 0.00 0.00 0.00 0.00 0.00 0.00 ‐1.04 ‐1.92 ‐4.00 ‐5.00
31 December 0.00 0.00 0.00 0.00 0.00 0.00 ‐0.60 ‐1.44 ‐2.70 ‐3.50
31 January 0.00 0.00 0.00 0.00 0.00 0.00 ‐0.57 ‐1.10 ‐2.00 ‐3.00
28 February 0.00 0.00 0.00 0.00 0.00 0.00 ‐0.30 ‐0.85 ‐1.70 ‐2.00
31 March 0.00 0.00 0.00 0.00 0.00 0.00 ‐0.14 ‐0.50 ‐1.60 ‐2.00
30 April 0.00 0.00 0.00 0.00 0.00 0.00 ‐0.10 ‐0.25 ‐1.30 ‐1.50
31 May 0.00 0.00 0.00 0.00 0.00 0.00 0.00 0.00 ‐1.10 ‐1.50
30 June 0.00 0.00 0.00 0.00 0.00 0.00 0.00 0.00 ‐0.90 ‐1.00

Chapter 4—Scenario Reliability Assessments
NERC | 2013 Special Reliability Assessment: Accommodating an Increasing Dependence on Natural Gas for Electric Power | May 2013 34 of 114
Gas Shales Reduce Risk from Weather-Related Supply Shortages Perhaps the most important factor in assessing gas supply risks is abundance of gas shale plays across North America
(Figure 9), which reduce the risk of supply shortages. As described in the previous chapter, historical gas supply shortages
have been due largely to hurricane or cold weather disruptions across the Gulf of Mexico. With shale gas production
spreading geographically across the continent, single points of failure in gas supply due to weather events can be somewhat
mitigated by increasing production in other unaffected areas. For example, increased Marcellus shale production could aid
the mitigation of supply disruptions in the Gulf of Mexico. However, without transportation, mitigation through these
alternative supply sources can be limited. Additionally, a higher risk of wellhead freeze‐offs should also be considered
within these types of mitigation strategies.
Figure 9: North American Shale Plays Reduce Risk of Weather‐Related Vulnerabilities to Gas Supply
From 2010 to 2012, hurricanes such as Irene and Sandy had minimal impact on gas supply. Despite shutting in on more than
one occasion, the Gulf of Mexico region had almost no impact on the national supply because of the new sources of gas
such as the Marcellus fields in western Pennsylvania. Marcellus now produces almost 6 Bcfd and greatly decreases northern
regions’ dependence of gas transportation from southern regions.
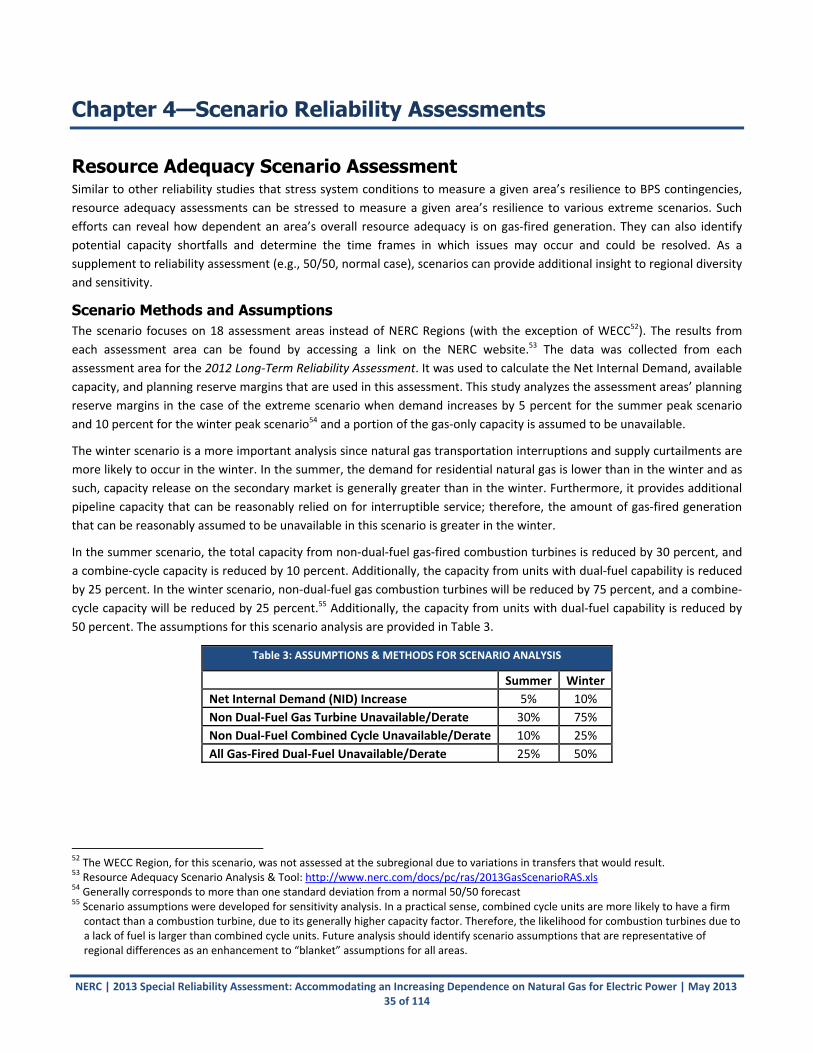
NERC | 2013 Special Reliability Assessment: Accommodating an Increasing Dependence on Natural Gas for Electric Power | May 2013 35 of 114
Chapter 4—Scenario Reliability Assessments
Resource Adequacy Scenario Assessment Similar to other reliability studies that stress system conditions to measure a given area’s resilience to BPS contingencies,
resource adequacy assessments can be stressed to measure a given area’s resilience to various extreme scenarios. Such
efforts can reveal how dependent an area’s overall resource adequacy is on gas‐fired generation. They can also identify
potential capacity shortfalls and determine the time frames in which issues may occur and could be resolved. As a
supplement to reliability assessment (e.g., 50/50, normal case), scenarios can provide additional insight to regional diversity
and sensitivity.
Scenario Methods and Assumptions The scenario focuses on 18 assessment areas instead of NERC Regions (with the exception of WECC52). The results from
each assessment area can be found by accessing a link on the NERC website.53 The data was collected from each
assessment area for the 2012 Long‐Term Reliability Assessment. It was used to calculate the Net Internal Demand, available
capacity, and planning reserve margins that are used in this assessment. This study analyzes the assessment areas’ planning
reserve margins in the case of the extreme scenario when demand increases by 5 percent for the summer peak scenario
and 10 percent for the winter peak scenario54 and a portion of the gas‐only capacity is assumed to be unavailable.
The winter scenario is a more important analysis since natural gas transportation interruptions and supply curtailments are
more likely to occur in the winter. In the summer, the demand for residential natural gas is lower than in the winter and as
such, capacity release on the secondary market is generally greater than in the winter. Furthermore, it provides additional
pipeline capacity that can be reasonably relied on for interruptible service; therefore, the amount of gas‐fired generation
that can be reasonably assumed to be unavailable in this scenario is greater in the winter.
In the summer scenario, the total capacity from non‐dual‐fuel gas‐fired combustion turbines is reduced by 30 percent, and
a combine‐cycle capacity is reduced by 10 percent. Additionally, the capacity from units with dual‐fuel capability is reduced
by 25 percent. In the winter scenario, non‐dual‐fuel gas combustion turbines will be reduced by 75 percent, and a combine‐
cycle capacity will be reduced by 25 percent.55 Additionally, the capacity from units with dual‐fuel capability is reduced by
50 percent. The assumptions for this scenario analysis are provided in Table 3.
Table 3: ASSUMPTIONS & METHODS FOR SCENARIO ANALYSIS
Summer Winter
Net Internal Demand (NID) Increase 5% 10%
Non Dual‐Fuel Gas Turbine Unavailable/Derate 30% 75%
Non Dual‐Fuel Combined Cycle Unavailable/Derate 10% 25%
All Gas‐Fired Dual‐Fuel Unavailable/Derate 25% 50%
52 The WECC Region, for this scenario, was not assessed at the subregional due to variations in transfers that would result. 53 Resource Adequacy Scenario Analysis & Tool: http://www.nerc.com/docs/pc/ras/2013GasScenarioRAS.xls 54 Generally corresponds to more than one standard deviation from a normal 50/50 forecast 55 Scenario assumptions were developed for sensitivity analysis. In a practical sense, combined cycle units are more likely to have a firm contact than a combustion turbine, due to its generally higher capacity factor. Therefore, the likelihood for combustion turbines due to a lack of fuel is larger than combined cycle units. Future analysis should identify scenario assumptions that are representative of regional differences as an enhancement to “blanket” assumptions for all areas.

Chapter 4—Scenario Reliability Assessments
NERC | 2013 Special Reliability Assessment: Accommodating an Increasing Dependence on Natural Gas for Electric Power | May 2013 36 of 114
Scenario Results Based on the methods and assumptions described in the previous section, results are provided by assessment area in
Figures 13 (summer peak) and 14 (winter peak). Overall results indicate that for both summer and winter peak periods, with
a 5 and 10 percent increase in peak demand, respectively, most areas have sufficient resources to cover the assumed gas‐
fired generator outages. However, the capability to fuel gas‐fired generators with alternate fuels (e.g., oil) plays an
important role within this assessment. In this scenario, the assumption is that only a portion of dual‐fuel generators are
able to perform on their secondary fuel within appropriate timeframes to offset additional impacts. Without this dual‐fuel
capability, the reductions in generator availability for gas turbines and combined‐cycle generators would be more
significant. With the exception of ERCOT in the summer and SaskPower in the winter, scenario projections do not show
significant concerns in the 2015 and 2017 seasonal peaks. The scenario points out that over the projected ten‐year period,
region‐wide resource adequacy concerns may not be a significant risk to the BPS; however, it shows that more granular
analysis is needed in areas with known operating and emerging issues as a result of increasing gas‐fired generation—such
as New England. The following chapters describe the type of analysis that can support a more detailed, risk‐based analysis.
Figure 10: Anticipated Reserve Margin Scenario (from 2012LTRA) with 5% Demand Increase – Summer
Figure 11 : Anticipated Reserve Margin Scenario (from 2012LTRA) with 10% Demand Increase – Winter
Alternative Analysis Because the assumptions in the scenario assessment would be most accurately applied if based on a regional risk profile—
versus a more widely applicable assumption—an alternative approach to understanding the resource adequacy risk is to
determine how much gas capacity could be lost in an assessment before planning reserve margins fall to zero. The analysis
‐30%
‐10%
10%
30%
50%
70%
90%
Scenario Case ‐Anticipated
Reserve M
argin
2015 2017 2022
‐30%
‐10%
10%
30%
50%
70%
90%
Scenario Case ‐Anticipated
Reserve M
argin
2015 2017 2022

Chapter 4—Scenario Reliability Assessments
NERC | 2013 Special Reliability Assessment: Accommodating an Increasing Dependence on Natural Gas for Electric Power | May 2013 37 of 114
provided in Figure 12 identifies the amount of gas‐fired capacity reduced so that the resulting planning reserve margin is
equal to zero percent. This is calculated for both summer and winter peak hours in absolute terms, as a percent of non‐
dual‐fuel gas‐fired capacity, and as a percent of the total gas‐fired capacity. Analysis for the forecast years of 2013, 2015,
2017, and 2022 is shown by assessment area. Areas with lower percentage values are more vulnerable to gas supply or
transportation disruptions since negative values indicate a deficit from zero without the loss of any capacity.
Figure 12 : Stress Test Analysis on Extreme Demand Scenario Case (10 % Increase)
Note: "-" for %NDF indicates that the area can lose all Non-Dual-Fuel gas and still remain above a zero percent planning reserve margin. Likewise, a "-" for % ∑Gas indicates that the area can lose all gas-fired capacity and still remain above a
zero percent planning reserve margin
X MW % NDF % ∑Gas X MW % NDF % ∑Gas X MW % NDF % ∑Gas X MW % NDF % ∑Gas
ERCOT 2,234 7% 6% (2,856) ‐9% ‐7% (4,730) ‐14% ‐11% (9,891) ‐29% ‐23%
FRCC 7,477 ‐ 29% 8,277 ‐ 32% 6,467 79% 23% 6,387 47% 19%
MISO 9,660 59% 34% 8,237 51% 29% 8,903 55% 31% 5,789 36% 20%
MAPP 949 ‐ 89% 781 ‐ 73% 507 71% 48% 21 3% 2%
New England 5,973 49% 43% 5,084 41% 37% 2,747 22% 20% 1,876 15% 14%
New York 5,061 61% 35% 4,511 54% 31% 4,072 ‐ 28% 2,224 27% 15%
PJM 25,103 ‐ 48% 15,509 ‐ 31% 11,165 85% 21% 2,857 22% 5%
SERC‐E 6,285 ‐ 39% 5,633 89% 33% 5,642 89% 33% 5,864 65% 29%
SERC‐N 5,831 ‐ 34% 5,695 ‐ 34% 4,556 ‐ 27% 2,746 92% 16%
SERC‐SE 9,417 ‐ 35% 8,764 ‐ 33% 10,672 ‐ 40% 6,067 70% 23%
SERC‐W 6,819 ‐ 31% 6,785 ‐ 31% 6,294 ‐ 28% 4,910 ‐ 22%
SPP 5,664 27% 19% 5,970 28% 20% 5,370 25% 18% 2,857 13% 9%
Manitoba 1,066 ‐ ‐ 1,416 ‐ ‐ 1,334 ‐ 555 ‐ ‐
SaskPower 125 9% 9% 52 4% 4% 291 16% 16% 273 13% 13%
Maritimes 3,182 ‐ ‐ 3,110 ‐ ‐ 3,119 ‐ 3,056 ‐ ‐
Ontario 6,308 ‐ 96% 4,580 73% 69% 2,219 37% 36% (2,995) ‐55% ‐52%
Québec 9,680 ‐ ‐ 10,440 ‐ ‐ 11,658 ‐ 12,292 ‐WECC‐TL 23,443 46% 26% 24,197 44% 26% 21,794 39% 23% 8,532 16% 9%
Summer Scenario Case: Amount of Gas Capacity Causing the Planning Reserve Margin to Equal 0%
Assessment
Area
2013 2015 2017 2022
X MW % NDF % ∑Gas X MW % NDF % ∑Gas X MW % NDF % ∑Gas X MW % NDF % ∑Gas
ERCOT 21,626 68% 53% 19,758 59% 47% 17,709 50% 40% 13,735 39% 31%
FRCC 10,875 ‐ 39% 10,897 ‐ 37% 10,911 ‐ 33% 11,372 72% 29%
MISO 32,832 ‐ ‐ 27,107 ‐ 90% 27,890 ‐ 93% 25,036 ‐ 83%
MAPP 1,330 ‐ ‐ 1,259 ‐ ‐ 931 ‐ 82% 371 48% 33%
New England 14,326 ‐ 92% 14,218 ‐ 91% 12,756 91% 82% 13,081 93% 84%
New York 15,462 ‐ 96% 13,922 ‐ 86% 13,812 ‐ 85% 14,335 ‐ 89%
PJM 51,649 ‐ 99% 44,662 ‐ 88% 41,723 ‐ 78% 36,193 ‐ 68%
SERC‐E 8,466 ‐ 52% 7,864 ‐ 44% 7,987 ‐ 45% 8,192 96% 39%
SERC‐N 20,802 ‐ ‐ 19,756 ‐ ‐ 18,614 ‐ 98% 17,488 ‐ 92%
SERC‐SE 15,332 ‐ 53% 15,126 ‐ 52% 17,223 ‐ 60% 12,416 ‐ 43%
SERC‐W 21,225 ‐ 70% 21,334 ‐ 70% 20,549 ‐ 67% 19,556 ‐ 64%
SPP 16,115 82% 58% 16,625 85% 60% 16,291 81% 58% 14,788 72% 51%
Manitoba 868 ‐ ‐ 911 ‐ ‐ 794 ‐ (127) ‐ ‐32%
SaskPower 187 12% 12% 133 7% 7% 227 11% 11% 212 9% 9%
Maritimes 1,192 ‐ ‐ 1,151 ‐ ‐ 1,125 ‐ 1,048 ‐ ‐
Ontario 7,649 ‐ ‐ 7,388 ‐ ‐ 5,330 86% 82% 3,176 55% 52%
Québec 300 ‐ ‐ 941 ‐ ‐ 1,890 ‐ 1,194 ‐WECC‐TL 36,665 69% 39% 38,554 68% 40% 37,628 66% 39% 25,672 46% 27%
Winter Scenario Case: Amount of Gas Capacity Causing the Planning Reserve Margin to Equal 0%
Assessment
Area
2013/2014 2015/2016 2017/2018 2022/2023
KeyX MW Capacity needed to reduce an area's reserve margin to 0%% NDF X MW divided by the total non-dual fuel gas available in an assessment area
% ∑Gas X MW divided by the total gas available in an assessment area (non-dual fuel + dual fuel)

Chapter 4—Scenario Reliability Assessments
NERC | 2013 Special Reliability Assessment: Accommodating an Increasing Dependence on Natural Gas for Electric Power | May 2013 38 of 114
Pipeline Disruption Scenario In addition to evaluating the gas–electric interface through a series of historical disruptions, there are other factors that
should be considered when assessing regional BPS reliability. As discussed in NERC’s Primer report,56 a key attribute of
pipeline flexibility is line pack. Line pack is the amount of gas held in the pipeline at any given time and represents a
localized form of short‐term storage that pipeline operators can use to meet fluctuating demand of firm customers. Most
pipelines use line pack as a resource to help manage the load fluctuations on their systems, building up line pack during
periods of decreased demand and drawing it down during periods of increased demand. This feature of pipeline operations
historically has enabled the pipeline to adapt to unexpected or abrupt changes in load requirements. However, gas‐fired
generator reliance on pipeline line pack to respond to unexpected events, such as weather or unplanned outages of other
units, is of limited value. Pipelines use line pack to ensure nondiscriminatory service to all firm customers and is not
designed or utilized to mitigate large contingency events.
Also discussed below is the possibility of expanding the detailed contingency planning studies to include extreme‐case
scenarios for the possible disruption of regional gas supplies; for example, a single point of failure. While the fuel supply
dynamics for each electric generator and region are unique, two simplified examples (a loss of critical compressor station
and pipeline break) are presented to illustrate potential extreme‐case scenarios for interruptions in the delivery of gas
supplies to that region.
While each pipeline’s line pack dynamics are unique, NERC’s Primer report57 presented typical examples of the use of line
pack to meet unexpected increases in electric power load requirements. For example, an unexpected weather event
impacts the gas load requirements of several gas‐fired power plants connected to the same pipeline. The conclusion drawn
from the examples reviewed in the NERC Primer is that pipeline line pack at best represents a limited buffer and should not
be expected to reliably mitigate gas supply or transportation disruptions.
Primarily because of the inability to store electricity, electric utilities perform extensive contingency analysis for their
systems at both the local and regional levels. These assessments are conducted most often by analyzing the capability of
the electric system to operate in the event that any single part of the system were suddenly to fail. For example, the single‐
largest contingency in New England that the ISO must be ready for is the nearly 1,900 MW that could be lost due to the
failure of the Hydro Quebec Phase II transmission line. Since failures propagate nearly instantaneously throughout the
electric system, grid operators must maintain power supplies that can respond instantaneously in the event of a
contingency. In addition, if a contingency were to occur, the electric system operators must replenish “instantaneous”
operating reserves within a short period of time, usually 10 or 30 minutes, in order to be postured for the next potential
contingency.
As gas‐fired generation increases, both industries may find it valuable to perform a similar set of contingency assessments
on pipeline systems. Such contingency assessments would enable the power industry, if not both industries, to uncover
means of being better prepared to handle a contingency event involving the loss of delivered gas supply to gas‐fired units
within a region and mitigate the potential resulting domino effect.
Two such possible contingency assessments are outlined below for a hypothetical gas and electric system,58 which is highly
dependent on gas generation but has limited access to gas supplies. These examples are intended to serve as an illustration
of a possible contingency assessment and may not be representative of actual pipeline and gas‐fired generator
interconnections. Since the primary purpose of these examples is to be illustrative, steady‐state or transient hydraulic flow
56 See Chapter 7 of NERC’s A Primer on the Natural Gas Industry and its Interface with the Electric Power Industry, 2011. 57 See Chapter 7 and Appendix F of NERC’s A Primer on the Natural Gas Industry and its Interface with the Electric Power Industry, 2011. 58 A hypothetical system was developed for this analysis using hypothetical pipeline and system topological information such as pipeline diameter, pipeline lengths, generator locations, and generator pressure requirements. The total electric system capacity is 3,500 MW which is made up of generators of various sizes and capabilities.
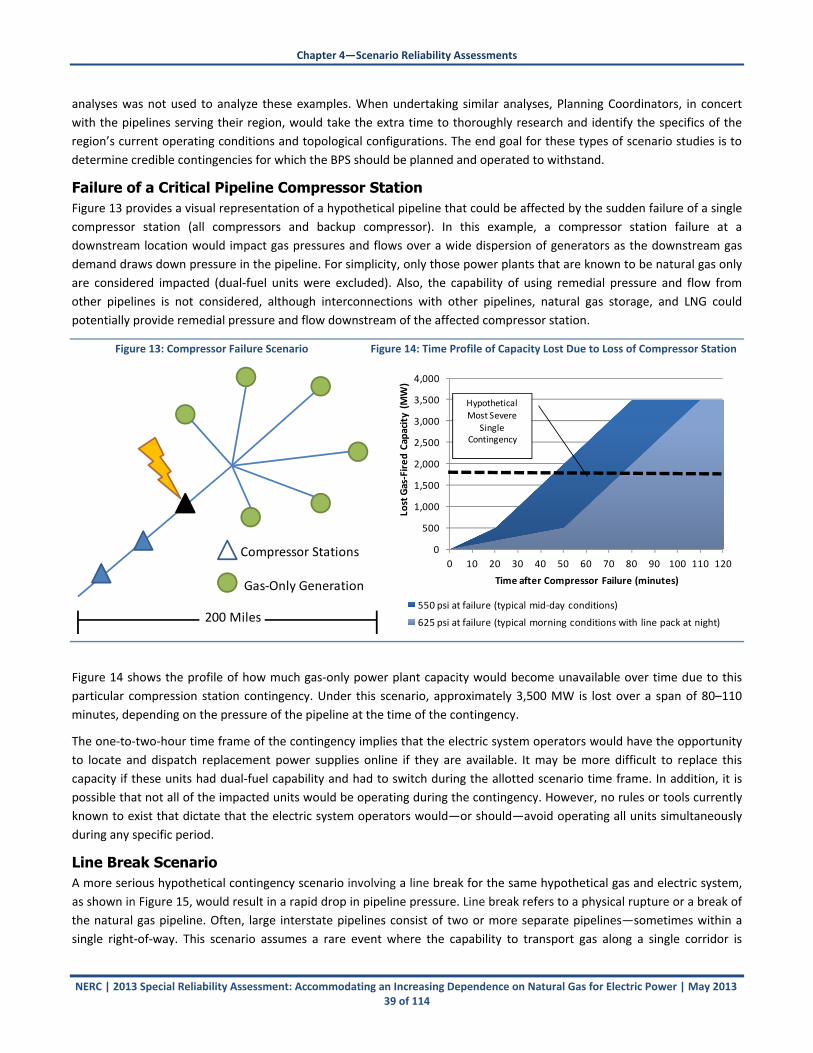
Chapter 4—Scenario Reliability Assessments
NERC | 2013 Special Reliability Assessment: Accommodating an Increasing Dependence on Natural Gas for Electric Power | May 2013 39 of 114
analyses was not used to analyze these examples. When undertaking similar analyses, Planning Coordinators, in concert
with the pipelines serving their region, would take the extra time to thoroughly research and identify the specifics of the
region’s current operating conditions and topological configurations. The end goal for these types of scenario studies is to
determine credible contingencies for which the BPS should be planned and operated to withstand.
Failure of a Critical Pipeline Compressor Station Figure 13 provides a visual representation of a hypothetical pipeline that could be affected by the sudden failure of a single
compressor station (all compressors and backup compressor). In this example, a compressor station failure at a
downstream location would impact gas pressures and flows over a wide dispersion of generators as the downstream gas
demand draws down pressure in the pipeline. For simplicity, only those power plants that are known to be natural gas only
are considered impacted (dual‐fuel units were excluded). Also, the capability of using remedial pressure and flow from
other pipelines is not considered, although interconnections with other pipelines, natural gas storage, and LNG could
potentially provide remedial pressure and flow downstream of the affected compressor station.
Figure 13: Compressor Failure Scenario Figure 14: Time Profile of Capacity Lost Due to Loss of Compressor Station
Figure 14 shows the profile of how much gas‐only power plant capacity would become unavailable over time due to this
particular compression station contingency. Under this scenario, approximately 3,500 MW is lost over a span of 80–110
minutes, depending on the pressure of the pipeline at the time of the contingency.
The one‐to‐two‐hour time frame of the contingency implies that the electric system operators would have the opportunity
to locate and dispatch replacement power supplies online if they are available. It may be more difficult to replace this
capacity if these units had dual‐fuel capability and had to switch during the allotted scenario time frame. In addition, it is
possible that not all of the impacted units would be operating during the contingency. However, no rules or tools currently
known to exist that dictate that the electric system operators would—or should—avoid operating all units simultaneously
during any specific period.
Line Break Scenario A more serious hypothetical contingency scenario involving a line break for the same hypothetical gas and electric system,
as shown in Figure 15, would result in a rapid drop in pipeline pressure. Line break refers to a physical rupture or a break of
the natural gas pipeline. Often, large interstate pipelines consist of two or more separate pipelines—sometimes within a
single right‐of‐way. This scenario assumes a rare event where the capability to transport gas along a single corridor is
Compressor Stations
Gas‐Only Generation
200 Miles
0
500
1,000
1,500
2,000
2,500
3,000
3,500
4,000
0 10 20 30 40 50 60 70 80 90 100 110 120
Lost Gas‐Fired Capacity (M
W)
Time after Compressor Failure (minutes)
550 psi at failure (typical mid‐day conditions)
625 psi at failure (typical morning conditions with line pack at night)
Hypothetical Most Severe
Single Contingency

Chapter 4—Scenario Reliability Assessments
NERC | 2013 Special Reliability Assessment: Accommodating an Increasing Dependence on Natural Gas for Electric Power | May 2013 40 of 114
completely lost. In this scenario, natural gas could not continue to flow to downstream consumers, as was the case in a
compressor failure. Downstream gas pressure was lost more rapidly as natural gas was released quickly from the ruptured
pipeline to the atmosphere. For this contingency, there is no benefit gained through existing interconnections with other
pipelines.
Calculations of how fast and how much of the gas‐only capacity would be lost under this scenario are shown in Figure 11.
Figure 16 also shows that within 16 minutes, as much as 3,500 MW could be lost.
Figure 15: Line Break Scenario Figure 16: Time Profile of Capacity Lost Due To Line Break
The impact on the electric system is similar in magnitude to the compressor failure scenario. However, the period of time
after the event during which this pipeline capacity is lost is much shorter, leaving less time for execution of emergency
plans. During times of high electric and natural gas demand, flexibility of pipeline interconnections and dual‐fuel capabilities
could be minimal and may not provide sufficient mitigation. Joint study of these scenarios present the opportunity for gas
and electric entities to develop an assessment that could help identify credible contingencies to study, determine
constraints on both systems, and develop potential mitigation strategies should these events manifest.
Compressor Stations
Gas‐Only Generation
200 Miles
0
500
1,000
1,500
2,000
2,500
3,000
3,500
4,000
0 5 10 15 20
Lost Gas‐Fired Capacity (M
W)
Time after Compressor Failure (minutes)
550 psi at failure (typical mid‐day conditions)
625 psi at failure (typical morning conditions with line pack at night)
Hypothetical
Most Severe
Single Contingency

NERC | 2013 Special Reliability Assessment: Accommodating an Increasing Dependence on Natural Gas for Electric Power | May 2013 41 of 114
Chapter 5—Methods for Analyz ing Natural Gas Demand and Infrastructure for Electric Power Needs
The natural gas system is designed to serve its firm load customers, yet much of the electric power industry‐‐particularly in
wholesale electric markets—depends on interruptible service. This chapter describes recommended techniques for
analyzing the natural gas demand characteristics in a given area and for assessing the adequacy of natural gas infrastructure
to meet non‐power and power demands. This study addresses how planners can estimate the number of days in which gas‐
fired power generators will not be able to procure natural gas supplies and thus may not be available to supply power. The
results could be incorporated into the electric power resource adequacy models to more accurately estimate the key
adequacy metrics, such as Loss‐of‐Load Expectation (LOLE), Loss‐of‐Load Hours (LOLH), and Expected Unserved Energy
(EUE). An important feature of integrating these suggested analyses with existing tools is the ability to incorporate existing
operational solutions into the planning models (e.g., demand response, voltage reduction, public appeals, etc.). By
incorporating results from a natural gas fuel and infrastructure assessment into probability‐based resource adequacy
models, an accurate representation of risk can be quantified and then translated into risk‐based planning solutions. The
results of this analysis also could serve as information for generators to determine the appropriate level of natural gas
service to meet their reliability needs and, upon a generator making contractual commitments, for pipelines to determine if
additional infrastructure is necessary to meet that demand.
Because of the complexities and extensive data requirements involved in assessing the impact of fuel availability on electric
system reliability, NERC recommends a three‐layered approach to this analysis. The first step (Layer 1) is to assess the
capacity of the gas infrastructure under normal operating conditions, and compare that capacity to the gas load by
developing daily gas load duration curves for a specific set of weather conditions (e.g., 50/50 or 90/10 probabilities of
forecast load). This provides an indication of the potential for fuel‐related outages if the gas system is fully operational. The
second step (Layer 2) is to compare the same gas load duration curves to gas infrastructure capacity under selected gas
transportation contingencies, such as a compressor station outage or mainline capacity reduction. This provides an
indication of the additional incremental fuel outages that could be caused by potential large disruptions with the regional
gas system.
While Layer 1 and Layer 2 provide an initial assessment of the potential severity of fuel‐related outages, they do not fully
quantify the probability that demand for gas will not be met. The third step (Layer 3) is to perform a Monte Carlo analysis,
which examines a wide range of weather and gas supply and/or transportation conditions to determine how often expected
power sector gas demand cannot be served and the resulting threat of potentially lost electric loads. A more detailed
description of each of the three layers to this approach is provided below. Figure 17 highlights how Layer 3 (Monte Carlo
analysis) differs from the analysis performed in Layers 1 and 2. The key difference is that the Monte Carlo analysis would
provide a probabilistic assessment of the impacts of weather and contingencies on electric system reliability.

Chapter 5—Methods for Analyzing Natural Gas Demand and Infrastructure for Electric Power Needs
NERC | 2013 Special Reliability Assessment: Accommodating an Increasing Dependence on Natural Gas for Electric Power | May 2013 42 of 114
Figure 17: Features of Each Layer of Analysis
Scenario Layer 1: Compare Gas
Infrastructure Capacity to Gas Load Duration Curves
Layer 2: Assessing the Impact of Gas Supply
Contingencies
Layer 3: Monte Carlo Analysis of Gas and Electric Systems
Weather Scenarios
Limited number of scenarios examining average (50/50)
and extreme (90/10) weather
Limited number of scenarios examining average (50/50) and
extreme (90/10) weather
Full weather probability Monte Carlo cases with hundreds of combinations made consistent with actual weather patterns
among regions
Gas System Contingencies
Not considered Used to adjust gas supply
capability, but no probabilistic analysis
Can be incorporated as probability distributions within Monte Carlo analysis and
can be correlated to weather
Electric System Contingencies
Not considered Not considered Can be incorporated as probability
distributions within Monte Carlo analysis and can be correlated to weather
Regional Detail Limited to examining larger
regions Limited to examining larger
regions Finer level of detail to examine intraregional
constraints
Time Steps for Analysis Daily over forecast year Daily over forecast year Hourly over forecast year
Plant Dispatch and Interregional Electricity Flows
Static Static Includes dynamic plant re‐dispatch to move generation among control areas based on
electric and gas contingencies
Gas Flows Into and Out Of Region
Endogenously calculated based on weather case
Endogenously calculated based on weather case and
contingencies
Endogenously calculated based on weather case and contingencies
Integration of Results into Electric Reliability Calculations (e.g., LOLE)
Not considered Not considered
Provides quantification of probabilities of fuel supply interruptions. This could be directly input into electric reliability estimation
processes in different ways.

Chapter 5—Methods for Analyzing Natural Gas Demand and Infrastructure for Electric Power Needs
NERC | 2013 Special Reliability Assessment: Accommodating an Increasing Dependence on Natural Gas for Electric Power | May 2013 43 of 114
Layer 1: Comparing Gas Infrastructure Capacity to Gas Load Duration Curves There are three basic steps to this layer of the analysis:
1. Define the boundaries for the region being analyzed and assess the current and projected natural gas supply and
transportation capabilities under normal operating conditions for the region.
2. Assess the current and projected power and non‐power gas loads for the region based on weather conditions and
seasonal diversity.
3. Compare the supply capabilities to the total projected gas load to determine the amount of unmet gas demand in
the region.58
The first step is to define the boundaries of the region of the
dispatch area being analyzed. The region could be as large as a
single ISO or RTO, or could be a smaller area, such as a market
zone. Within this region, the characteristics of the gas system
must be quantified to assess the current supply capabilities.
The current gas supply capabilities for a region include
inbound pipeline capacity, less the amount of capacity firmly
contracted by downstream customers, plus other supply
sources within the node, such as underground storage,
LNG/CNG and propane‐air peak shaving storage, and LNG
import capabilities. Pipeline system capacity can be
determined by assessing the physical capability of the systems
(number of lines, line diameter and operating pressure), as
well as data posted on the pipeline’s bulletin board, such as
design capacity, operationally available capacity, and the
pipeline’s index of customers. The FERC index of customer
data can be used to assess the daily volumes of firm
pipeline transportation capacity contracted within a given
region and the amounts contracted by customers further
downstream (of the study area) to determine the net
pipeline capacity available for the region under consideration.
To create scenarios for the region’s future gas supply and transportation capabilities, it is necessary to account for any
planned change to existing infrastructure that would have a significant impact on the region’s gas market, such as:
New pipelines or incremental capacity increases on existing systems
Planned abandonments or conversion of existing gas pipelines that may reduce capacity
New storage facilities or storage field abandonments
Impact of new facilities or changes in the operation of existing facilities:
Local gas peak shaving facilities
LNG import terminals, operations, and supply contracts
58 By design, the gas system is planned and operated to serve only its firm load customers.
Questions Answered in Layer 1 Analysis
What are the characteristics of the current natural
gas infrastructure? How much supply capability
currently exists in different markets?
How much pipeline capacity is contracted in
different markets?
What are the locations and the sizes of gas‐fired
generating units within the region? What type of
gas transportation contracts do they hold?
How does weather impact both power and non‐
power daily gas loads?
How do daily load swings affect the assessment of
gas supply?
What impact does dual‐fuel capacity have on
power gas loads and electric system reliability?
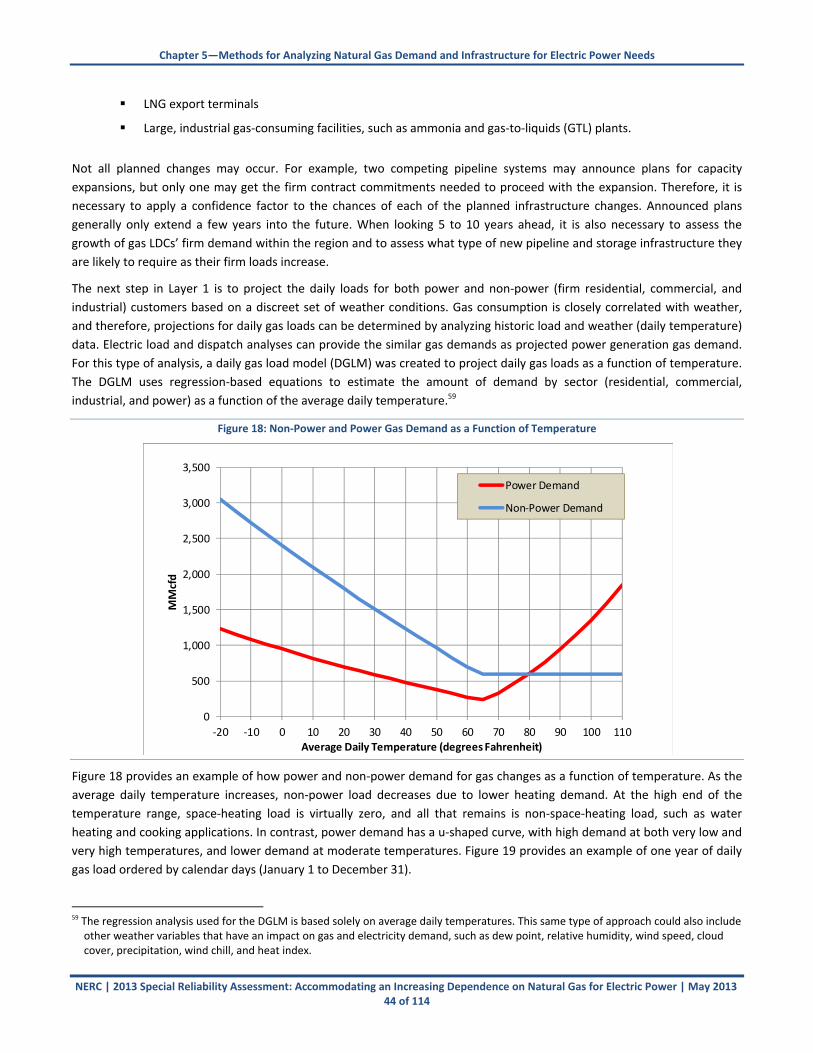
Chapter 5—Methods for Analyzing Natural Gas Demand and Infrastructure for Electric Power Needs
NERC | 2013 Special Reliability Assessment: Accommodating an Increasing Dependence on Natural Gas for Electric Power | May 2013 44 of 114
LNG export terminals
Large, industrial gas‐consuming facilities, such as ammonia and gas‐to‐liquids (GTL) plants.
Not all planned changes may occur. For example, two competing pipeline systems may announce plans for capacity
expansions, but only one may get the firm contract commitments needed to proceed with the expansion. Therefore, it is
necessary to apply a confidence factor to the chances of each of the planned infrastructure changes. Announced plans
generally only extend a few years into the future. When looking 5 to 10 years ahead, it is also necessary to assess the
growth of gas LDCs’ firm demand within the region and to assess what type of new pipeline and storage infrastructure they
are likely to require as their firm loads increase.
The next step in Layer 1 is to project the daily loads for both power and non‐power (firm residential, commercial, and
industrial) customers based on a discreet set of weather conditions. Gas consumption is closely correlated with weather,
and therefore, projections for daily gas loads can be determined by analyzing historic load and weather (daily temperature)
data. Electric load and dispatch analyses can provide the similar gas demands as projected power generation gas demand.
For this type of analysis, a daily gas load model (DGLM) was created to project daily gas loads as a function of temperature.
The DGLM uses regression‐based equations to estimate the amount of demand by sector (residential, commercial,
industrial, and power) as a function of the average daily temperature.59
Figure 18: Non‐Power and Power Gas Demand as a Function of Temperature
Figure 18 provides an example of how power and non‐power demand for gas changes as a function of temperature. As the
average daily temperature increases, non‐power load decreases due to lower heating demand. At the high end of the
temperature range, space‐heating load is virtually zero, and all that remains is non‐space‐heating load, such as water
heating and cooking applications. In contrast, power demand has a u‐shaped curve, with high demand at both very low and
very high temperatures, and lower demand at moderate temperatures. Figure 19 provides an example of one year of daily
gas load ordered by calendar days (January 1 to December 31).
59 The regression analysis used for the DGLM is based solely on average daily temperatures. This same type of approach could also include other weather variables that have an impact on gas and electricity demand, such as dew point, relative humidity, wind speed, cloud cover, precipitation, wind chill, and heat index.
0
500
1,000
1,500
2,000
2,500
3,000
3,500
‐20 ‐10 0 10 20 30 40 50 60 70 80 90 100 110
MMcfd
Average Daily Temperature (degrees Fahrenheit)
Power Demand
Non‐Power Demand

Chapter 5—Methods for Analyzing Natural Gas Demand and Infrastructure for Electric Power Needs
NERC | 2013 Special Reliability Assessment: Accommodating an Increasing Dependence on Natural Gas for Electric Power | May 2013 45 of 114
Figure 19: Natural Gas Daily Load Profile Example
Another way to examine this data is to order the demand days from highest to lowest, as shown in Figure 20. LDCs contract
for supply and interstate pipeline transporation and design their distribution systems according to firm customer demands
on a very cold winter day, usually equal to the coldest day observed in the past 30 years. In the example load curve below,
the peak day is based on the gas LDC “design day” specification, and the total demand over the course of the winter is
based on a 90th percentile (1‐in‐10 probability) winter temperatures.
Figure 20: Natural Gas Load Duration Curve Example
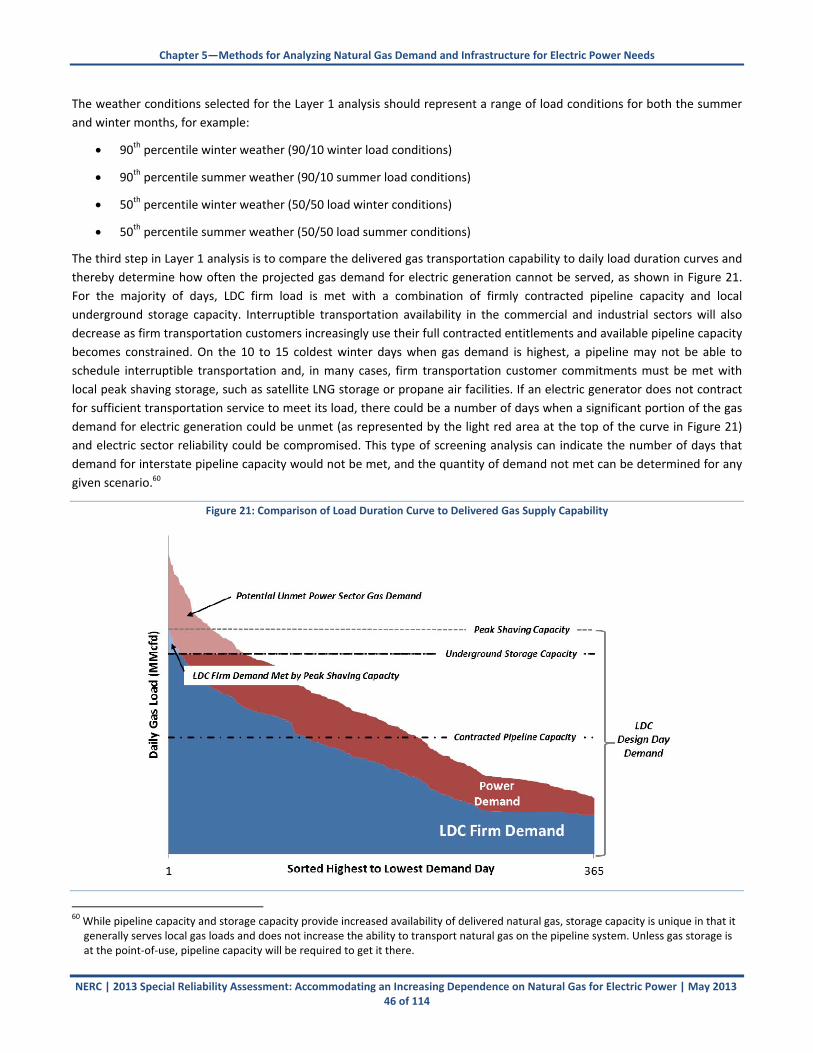
Chapter 5—Methods for Analyzing Natural Gas Demand and Infrastructure for Electric Power Needs
NERC | 2013 Special Reliability Assessment: Accommodating an Increasing Dependence on Natural Gas for Electric Power | May 2013 46 of 114
The weather conditions selected for the Layer 1 analysis should represent a range of load conditions for both the summer
and winter months, for example:
90th percentile winter weather (90/10 winter load conditions)
90th percentile summer weather (90/10 summer load conditions)
50th percentile winter weather (50/50 load winter conditions)
50th percentile summer weather (50/50 load summer conditions)
The third step in Layer 1 analysis is to compare the delivered gas transportation capability to daily load duration curves and
thereby determine how often the projected gas demand for electric generation cannot be served, as shown in Figure 21.
For the majority of days, LDC firm load is met with a combination of firmly contracted pipeline capacity and local
underground storage capacity. Interruptible transportation availability in the commercial and industrial sectors will also
decrease as firm transportation customers increasingly use their full contracted entitlements and available pipeline capacity
becomes constrained. On the 10 to 15 coldest winter days when gas demand is highest, a pipeline may not be able to
schedule interruptible transportation and, in many cases, firm transportation customer commitments must be met with
local peak shaving storage, such as satellite LNG storage or propane air facilities. If an electric generator does not contract
for sufficient transportation service to meet its load, there could be a number of days when a significant portion of the gas
demand for electric generation could be unmet (as represented by the light red area at the top of the curve in Figure 21)
and electric sector reliability could be compromised. This type of screening analysis can indicate the number of days that
demand for interstate pipeline capacity would not be met, and the quantity of demand not met can be determined for any
given scenario.60
Figure 21: Comparison of Load Duration Curve to Delivered Gas Supply Capability
60 While pipeline capacity and storage capacity provide increased availability of delivered natural gas, storage capacity is unique in that it generally serves local gas loads and does not increase the ability to transport natural gas on the pipeline system. Unless gas storage is at the point‐of‐use, pipeline capacity will be required to get it there.

Chapter 5—Methods for Analyzing Natural Gas Demand and Infrastructure for Electric Power Needs
NERC | 2013 Special Reliability Assessment: Accommodating an Increasing Dependence on Natural Gas for Electric Power |May 2013 47 of 114
The example above excludes the impact on interstate pipeline demand from fuel switching at dual‐fuel units. If gas/oil
switchable generating capacity is available, as shown in Figure 22, the amount of unmet interstate pipeline demand could
be reduced or eliminated. This approach can be used to calculate the reduction in on‐peak gas demand due to functional
fuel switching, and the positive impacts on electric system reliability (temporary reduction in operable capacity).
In addition to fuel‐switching capabilities, some gas‐fired generators hold some form of firm contracts for fuel supplies. The
degree of “firmness” of a generator’s gas supply depends on the type and number of contracts held. The generator may
have a pipeline capacity contract securing supplies directly from the wellhead or from a liquid trading point on the regional
gas system. The generator may only have firm pipeline capacity on the lateral spur that serves it off the mainline. The
generator may have a contract on a single pipeline system, or contracts on multiple systems. Determining the firmness of
fuel supplies, both firm gas production and firm pipeline transportation, is an important consideration in determining the
non‐firm demand and thus the vulnerabilities on a given electric system.
Figure 22: Daily Gas Load Curve Including Fuel Switching
The load duration curve analysis described above is based on a daily cycle. It treats the sum of 24 hours of loads as
“demand” and average daily pipeline, storage, and peak shaving capacities as “supply.” Layer 3, which is discussed in a later
section, extends the daily analysis to hourly analysis to determine the likelihood that hourly gas loads cannot be served,
even if the daily analysis shows the market to be in balance. An example of the load duration curve using actual pipeline
data is shown in Figure 23.

Chapter 5—Methods for Analyzing Natural Gas Demand and Infrastructure for Electric Power Needs
NERC | 2013 Special Reliability Assessment: Accommodating an Increasing Dependence on Natural Gas for Electric Power | May 2013 48 of 114
Figure 23: Operating Capacity and Final Scheduled Volume – Example Pipeline
Layer 2: Assessing the Impact of Gas Supply Contingencies Most areas in the United States and Canada are served by many different pipeline systems that are relied on to transport
gas into and out of each area. The North American natural gas pipeline network is a highly integrated system, with many
interconnects that allow for the transfer of gas between the different pipeline systems. In addition, there are numerous
interconnects with gas utilities and gas‐fired
power plants that receive gas. In many cases,
multiple interconnects from multiple pipelines
create both flexibility and reliability in gas
deliveries. Further, underground gas storage is
connected to the pipelines, creating reliability in
gas delivery. Market area gas storage makes it
possible for firm peak month and peak day
deliveries to be satisfied with a greater degree of
certainty and reliability. Gas utilities further
augment underground storage supplies with
storage from above‐ground facilities, most notably
LNG peak shaving and propane‐air facilities. In
short, the gas infrastructure is extensive and
diverse, making the system for serving firm loads
very reliable. Nevertheless, contingencies that
negatively impact gas service can and do occur.
On rare occasions these contingencies threaten
firm service. More often, these contingencies
may reduce the capacity available for interruptible
service, which the pipeline has no contractual
obligation to provide and only is available when
firm shippers are not using their capacity.
Questions Answered in Layer 2 Analysis
What are the potential contingency cases in which natural gas
systems lose their ability to provide their total expected service
capacity?
How much capacity loss or range of capacity losses would be
expected from each of these specific contingencies?
What causes these gas system contingences, and what data
exist to help predict the frequency, severity, and duration with
which they might be expected to occur?
How do the occurrences of these gas system contingencies
correlate to severe weather or other types of natural events?
How much gas‐fired electric generating capacity would be
estimated to lose interruptible or firm gas service under each
specific contingency?
What are the connections between electric service reliability
and natural gas end use markets and natural gas infrastructure,
and to what extent could electric outages affect operational
gas system capacities?

Chapter 5—Methods for Analyzing Natural Gas Demand and Infrastructure for Electric Power Needs
NERC | 2013 Special Reliability Assessment: Accommodating an Increasing Dependence on Natural Gas for Electric Power | May 2013 49 of 114
The purpose of this layer of the analysis is to identify and characterize potential contingencies on the gas system that could
adversely impact gas supplies and thereby adversely impact electric reliability. The recommended approach to Layer 2 can
be broken down in to three steps:
1. Identify potential gas system contingencies and their frequency of occurrence.
2. Assess the impacts for each of the identified contingencies, in terms of duration and amount of gas supply
disrupted.
3. Apply the contingency disruptions to the gas supply capabilities (determined in the Layer 1 analysis) to calculate
the impact on total gas supplies and, more specifically, the amount of gas available to electric generators.
First, it is necessary to identify the types of contingencies that can occur in the natural gas system’s infrastructure and to
compile data on their frequencies, duration, and consequences that can be used in reliability assessments. There are a wide
range of events that could result in the loss of gas service, including physical/operational, technical/cyber, natural, and
man‐made causes. A list of some of the potential gas system vulnerabilities includes:
Physical/Operational
o Mechanical or operational malfunction of a specific gas system equipment, such as a compressor station
o Pipeline leakage or burst due to stress or corrosion cracking
o Storage well degradation or failure due to scaling, water penetration, or other factors
o Pipeline capacity outages due to scheduled construction, maintenance, and testing
Technical/Cyber
o SCADA system malfunction
o Electrical failure of supporting computer and control systems
o Database corruption
o Hacking or tampering with supporting software and information for control systems
o Failure or malfunction of operational flow control systems
Natural
o Damage to compressor stations from flooding
o Damage to pipelines due to flooding, erosion, river scouring
o Damage to facilities due to hurricanes or high winds
o Well freeze‐offs in production and storage systems
o Damage to facilities due to earthquakes
o Other high‐impact, low‐frequency (HILF) events (e.g., solar storms)
Man‐made
o Damage resulting from terrorist activities
o Pipeline damage due to excavation
o Damage due to negligence
Fully assessing these vulnerabilities requires a review of existing studies and historical data (e.g., pipeline bulletin board
data and well‐level production histories), as well as consultation with the gas industry to establish the frequencies,
duration, and consequences of the types of events listed above. Specific data could be compiled on the number of
occurrences of events such as:
Large‐scale wellhead disruptions (freeze‐offs, hurricanes, floods)
Gathering line/field compressor problems
Chapter 5—Methods for Analyzing Natural Gas Demand and Infrastructure for Electric Power Needs
NERC | 2013 Special Reliability Assessment: Accommodating an Increasing Dependence on Natural Gas for Electric Power | May 2013 50 of 114
Outages of gas processing plants (scheduled outages, hurricanes or floods, loss of electricity service, physical
attack)
Pipeline outages (scheduled outages for pipeline integrity surveys, pigging, etc.; integrity failures; failures to
control systems; accidents or damage from external forces; earthquakes; loss of cover by ground erosion, scouring
of river beds, physical attack, cyber attack)
Prime mover or compressor outages (scheduled outages; failures of prime mover;61 hurricanes or floods; loss of
electricity service to electric‐drive compressors)
An analysis of “nominal design capacity” and “operationally available capacity” information—which pipelines routinely post
to meet FERC requirements—may provide a valuable baseline to assess the availability of gas pipeline transportation
services. The “operationally available capacity” information provides data on pipeline and prime mover/compressor
outages. Pipelines could provide a characterization of the type of events that affect capacity to inform such an analysis.
It also may be useful to develop correlation coefficients or other scenario‐building assumptions that will be used to
represent how different types of events are related to each other. To accomplish this, it is necessary first to determine what
variables need to be considered (temperature, wind speeds, precipitation, etc.) in an analysis of probabilities of natural gas
disruptions and electricity market events. NERC and the Regions, along with industry Planning Coordinators (PCs), have
already studied some of these statistical relationships for their electric reliability analysis and planning functions (e.g., how
wind speeds correlate to temperatures and electric loads), and additional data will be required, such as weather data from
the National Oceanic and Atmospheric Administration (NOAA), pipeline incident reports from the U.S. Department of
Transportation (DOT), and infrastructure outage data from the DOE. Further statistical analysis will also be required to
determine frequency and severity of events and the correlation between events and time of year. The results of the
correlation analysis could ultimately be applied within the Monte Carlo analysis in Layer 3 (discussed below) or within the
Layer 2 analysis to develop scenarios. As stated above, interstate pipeline service availability can be measured by analyzing
the difference between interstate pipeline “nominal design capacity” and pipeline “operationally available capacity’ at
certain points on the pipeline system. Pipelines can then characterize or identify why capacity was reduced on the system.
The next step in the analysis would be to estimate how different contingency events would affect the normal operational
capacities identified in the Layer 1 analysis. Events range from compressor failures (which would generally cause the loss of
some, but not all of the capacity on a system) to a complete pipeline failure and loss of all capacity. This data would be used
to create a comprehensive list of contingencies including information regarding the locations, event type, and amount of
lost capacity. In prior studies of disruptions of natural gas infrastructure, estimated impacts on gas supplies using hydraulic
models and simpler hydraulic calculations were completed. For example, in a recent study for ISO‐New England, ICF
employed a set of hypothetical gas sector contingencies, which were incorporated into various reliability calculations and
analyses.62 These contingency cases examined reductions in available gas supplies when either one or two elements of the
regional gas system were not available on the peak winter and peak summer days.
Once the impact on gas supplies is identified for each of the contingency cases, these supply reductions can be applied to
the gas supply capability estimates to arrive at the change in total gas supply from any individual contingency (N‐1) or
combination of contingencies (N‐1‐1). The impact of these changes in total gas supply capability could then be compared to
the load duration curves (as discussed above in Layer 1) to determine the impact on gas supplies available to electric
generators (i.e., how much fuel supply (in Btu), capacity (in MW) and generation (in MWh) would be reduced by the
contingency).
61 The failure of a component/station affecting output will be noted by the publically available “Critical Notice” on the pipeline’s website 62 http://www.iso‐ne.com/committees/comm_wkgrps/prtcpnts_comm/pac/reports/2012/gas_study_public_slides.pdf

Chapter 5—Methods for Analyzing Natural Gas Demand and Infrastructure for Electric Power Needs
NERC | 2013 Special Reliability Assessment: Accommodating an Increasing Dependence on Natural Gas for Electric Power |May 2013 51 of 114
Layer 3: Monte Carlo Analysis of Gas and Electric Systems The Layer 1 and Layer 2 analyses described above are designed to assess the impact of fuel availability on electric system
reliability under a limited set of weather conditions and gas supply contingencies for the region modeled as a whole or
single system. The analysis does not take into account localized constraints that may develop within the region, or how the
natural gas system may respond to these changes (e.g., redirection of pipeline flows). While the first two layers quantify the
potential extent of gas supply shortages to electric generators on a regional basis, they do not provide an indication of how
often these fuel shortages might occur and what specific areas within the region may be affected by the shortfall.
For Layer 3, NERC recommends a Monte Carlo analysis using an
integrated gas and electric system network model to quantify the
probabilities and correlations among various types of gas and
electric contingencies, weather events, generation, and electric
loads in order to better understand how often shortfalls in gas
supplies may occur. A Monte Carlo analysis would provide a robust
method of analyzing how frequently various combinations of events
can occur, particularly events that can be correlated to each other.
In this integrated approach, gas fuel supply availability will be
modeled inside the sequential Monte Carlo algorithm and tested
hourly, as opposed to the daily load duration curve approach.
Integrated modeling provides a more accurate representation of the
gas–power infrastructure and therefore provides better
understanding of impact and likelihood.
Considerations of Hourly Loads and Line Pack The gas supply and demand assessments described so far have been for average daily values. To assess hourly availability of
pipeline capacity requires an estimation of the potential impact from line pack. To assess the impact of line pack on gas
supplies, one could use a method similar to the approach developed by ICF as part of their “Market Clearing Engine” (MCE).
ICF has used the MCE for the last 16 years to manage Southern Australia’s gas system operations, including the hourly
supply scheduling of gas pipeline and storage injections and withdrawals. The MCE model estimates available line pack
based on the physical dimensions of the pipeline systems and assumed variations in average pipeline pressures that could
be managed throughout a day. The amount of line pack is calculated as a function of the diameter, length, and average
pressure of the pipeline. When a gas pipeline is operated at the maximum allowed operating pressure (MAOP) throughput
volumes at a steady state, the pressure at the compressor inlet might be around 760 pounds per square inch (psi), and the
pressure at the compressor outlets might be close to 1,000 psi. This way, the pressure in the pipeline goes from 1,000 psi of
the outlet of one compressor down to 760 psi at the inlet of the next compressor located about 70 miles downstream.
Using this example, the average pressure would be about 880 psi. At that pressure, a 36” diameter line would hold about
2.2 million cubic square feet of gas per mile length. If the average pipeline pressures were allowed to go up during the low‐
demand overnight period, additional gas could be stored in the pipeline during evening hours. During a given day, the
pressure could be reduced allowing for the delivery of more gas. For example, using standard hydraulic calculations, the
daily swing capacity available for a 36” pipeline could be estimated at 0.3 MMcf per mile if the loads are predictable.
Pipelines operating near maximum design capacity have no available linepack‐‐it is only available when a pipeline is partially
loaded and pressures are below the maximum allowable operating pressure. Pipelines that operate through significant
swings must leave some linepack available to maintain pipeline operating requirements.
Questions Answered in Layer 3 Analysis
What is the probability of gas supply loss?
How does this probability change under
different weather conditions?
What plants within a region are most likely
to be affected by gas supply shortages?
How does the gas system respond in a
contingency event? Can the gas
infrastructure be used differently to reduce
supply shortfalls?

Chapter 5—Methods for Analyzing Natural Gas Demand and Infrastructure for Electric Power Needs
NERC | 2013 Special Reliability Assessment: Accommodating an Increasing Dependence on Natural Gas for Electric Power | May 2013 52 of 114
These estimations could be verified by consulting with pipeline companies and determining if additional hourly swing
capacity is available through storage deliverability that is dedicated to maintaining system pressures and reliability. The
most important factors determining hourly swing capacity available through management of line pack are:
Physical dimension of the pipeline (diameter and length)
Normal steady‐state operating pressure profile
MAOP
Minimum operating pressure needed to deliver gas to customers
Ability to fully re‐pressurize the pipeline for the next day’s cycle
The hourly analysis NERC suggests for the Layer 3 modeling is not a full hydraulic modeling of hourly gas flows into and out
of the gas system. Rather, it represents an approximate analysis that compares the hourly patterns (specifically the hourly
swing requirement, or the volume of hourly gas load above the daily average load) against the available hourly swing
capacity made up mostly of pipeline line pack available to a region (see Figure 24). These values can then be converted into
an hourly swing index by dividing the hourly swing requirement in MMcf by the available the hourly swing (line pack)
capacity in MMcf. An hourly swing index value above 1.0 would indicate hourly gas loads that are greater than what can be
provided by line pack and indicate potential problems in serving those specific loads; the higher the index, the more severe
the problems would be. An estimate of the amount of potential lost hourly load can also be computed as the hourly swing
requirement minus available hourly swing capacity.
Figure 24: Example of Hourly Winter Gas Load Swings
Regional Definition and Boundary Conditions The first step in conducting the Monte Carlo analysis is to construct a network representation of the natural gas and electric
infrastructure within the region under examination. The network model would consist of a series of nodes, which represent
gas supply resources and demands within the region, and arcs, which represent either gas pipeline capacity or electric
transmission capacity between the nodes. The division of the region into nodes would be based on an assessment of

Chapter 5—Methods for Analyzing Natural Gas Demand and Infrastructure for Electric Power Needs
NERC | 2013 Special Reliability Assessment: Accommodating an Increasing Dependence on Natural Gas for Electric Power | May 2013 53 of 114
pipeline receipt and delivery points within the region, the location of interconnects between different pipeline systems or
between a pipeline system and storage field, LDC services, and electricity dispatch zones within the region. The goal is to
create a network representation of the region that is simple enough to solve relatively quickly, but also has sufficient detail
to indicate where gas supply constraints may develop. Depending on the region’s size and complexity of its gas pipeline
systems, a network of between 5 and 15 nodes should be sufficient. In an aggregated nodal system, electric generators
could be grouped together by type (e.g., gas‐only combustion turbines, gas/distillate switchables, etc.) within each region.
However, assuming sufficient information on pipeline capacities and receipt and delivery points is available, it is possible to
construct a nodal network with much greater detail, and even represent gas consumption at individual power plants. Non‐
power demand would be represented by the same type of algorithms used in a daily gas load model (discussed in the
previous section) to determine gas demand as a function of weather.
Sensitivity of Electric and Natural Gas Loads to Weather Based on past studies and analysis on the subject and current practices of electric market participants, hourly and daily
electric load models are most often a function of weather, seasonal and calendar factors, time of day factors, and other
autoregressive components. It is also a common practice to generate separate models for each distinct seasonal or daily
interval in order to capture unique dynamics of that period.
The most used weather variables in load models are linear and non‐linear components of temperature, wind speed,
humidity, cloud cover, and precipitation, with temperature having the largest impact among these variables. Seasonal and
calendar factors include months, weekday or weekend distinctions, day of the week, and holiday dummy variables. Time of
day factors include variables capturing specific dynamics associated with hourly load differences, which could include
specific hours or simply off‐peak and on‐peak classifications. Finally, there are a number of variations of autoregressive
components that tend to explain all other factors not captured by the above‐mentioned independent variables. These
factors are most often captured through autoregressive lags of different lengths but can also be captured with moving
average lags, depending on specific time‐series dynamics.
There are also common structural form variations among different hourly and daily electric load models. It is a common
practice to build separate models for each season or month, and even each day of the week or hour in order to capture
unique dynamics of these distinct periods. Alternatively, seasonally or otherwise differenced autoregressive integrated
moving average (ARIMA) models can capture these dynamics in a single model. Similarly, models can oftentimes capture
these distinct dynamics with dummy variables.
Twelve separate hourly load curve equations could be used to capture unique monthly electric load dynamics for each of
the examined regions. The models could include level, squared, and cubed temperature variables in order to capture non‐
linear relationships between temperature and load. The resulting model will also include day‐of‐the‐week‐and‐month
variables, holiday variables, and time‐of‐day variables to capture other variations associated with these periods. The model
will also include autoregressive components based on the unique structure of regional load lags.
The finalized monthly load curve equations will be used in the simulation process in order to generate hourly load
requirements based on assumed hourly weather scenarios and aggregate monthly load level assumptions. The aggregate
monthly load level assumptions will be calculated through independent load forecasts based on historical load growth and
expected future economic activity levels for each examined region.
Modeling weather scenarios should be based on future weather expectations calculated by historical weather trends in the
regions of interest. This is a difficult task, because historical weather patterns have not reverted around a single, long‐term
mean. Instead, weather tends to persist at its short‐term pattern for prolonged periods of time before returning to its long‐
term trend. Figure 25 and Figure 26 show annual heating and cooling degree days (HDD and CDD) by year for the past 42
years, and 20‐year normal degree days. Since 1980 the 20‐year average of HDDs has declined 7 percent, while the 20‐year
average for CDDs has increased almost 12 percent.

Chapter 5—Methods for Analyzing Natural Gas Demand and Infrastructure for Electric Power Needs
NERC | 2013 Special Reliability Assessment: Accommodating an Increasing Dependence on Natural Gas for Electric Power | May 2013 54 of 114
Figure 25: U.S. Lower 48 Heating Degree Days63
Figure 26: U.S. Lower 48 Cooling Degree Days64
The trend toward warmer temperatures in the summer and cooler temperatures in the winter could lead the electric
industry away from considering long‐term, 30‐year historical periods and toward shorter, 10‐year historical periods when
identifying weather normal conditions. For all reliability analyses, system planners could identify “normal weather year”65
by selecting a year for which temperatures deviate least from average temperatures over the last decade.
63 U.S. Lower 48 heating degree days for calendar year as computed by NOAA for each census region and weighted by population using 2010 census data (excluding Alaska and Hawaii).
64 Ibid. 65 A normal weather year is the year with the lowest sum of squared monthly deviations from 10‐year monthly averages.
3,500
3,700
3,900
4,100
4,300
4,500
4,700
4,900
US HDD Average of Previous 20 Years HDD
800
900
1,000
1,100
1,200
1,300
1,400
1,500
US CDD Average of Previous 20 Years CDD

Chapter 5—Methods for Analyzing Natural Gas Demand and Infrastructure for Electric Power Needs
NERC | 2013 Special Reliability Assessment: Accommodating an Increasing Dependence on Natural Gas for Electric Power | May 2013 55 of 114
Since the region is being examined independently from the rest of the North American market, it is also necessary to define
the boundary conditions for each case; that is, the movement of gas supplies into and out of the region as a whole, as well
as where gas supplies enter and exit the region. Under normal operations, the boundary conditions are a function of
weather, which impacts demand upstream and downstream. The boundary conditions can also be considered in the Monte
Carlo model, for example, by considering contingencies such as hurricanes that disrupt gas supplies available to the region.
Monte Carlo Modeling The Monte Carlo cases would be driven by probability assumptions for weather and forced outages of elements of the gas
and electric systems. The weather would determine non‐power demand for natural gas and demand for electricity. The
probability assumptions for weather would include temperatures but could also include other variables that have an impact
on demand, such as wind speed, cloud cover, humidity, and precipitation. Based on correlation analysis of historical data,
weather would also affect the forced outage rates on both the gas and electric infrastructure (e.g., low temperatures
increase probability of wellhead freeze‐offs, while high winds increase the probability of transmission line outages). The
probability of forced outages would also be a function of mean‐time‐between‐failures for each system component and the
duration of the outage based on a mean time to repair each component. Scheduled maintenance outages on the gas and
electric system, such as compressor station maintenance, pipeline inspections, and power plant maintenance, would follow
a fixed schedule for all cases, based on typical maintenance schedules for each system element.
For Monte Carlo analysis, several options exist, such as a resource adequacy model known as the Stochastic Resource
Adequacy Model (SRAM).66 SRAM is a probabilistic resource adequacy model used to analyze the impact of uncertainties in
load forecasts, generator‐forced outages, and variable energy resources on system reliability. It employs an hourly,
sequential Monte Carlo algorithm to quantify the risks associated with supply‐and‐demand‐related uncertainties. The
random variables accounted for in the standard SRAM model include the forced outage rate of generators, wind turbine
dispatch profiles, and load uncertainty. SRAM or similar models could be expanded to add an overlay of the natural gas
infrastructure to allow the examination of gas supply availability as a separate, dynamic variable within the model.
Once the set of Monte Carlo cases is defined, SRAM (with a gas‐infrastructure overlay) could be run for each case over the
forecast year, and the model would solve for the network’s response to weather conditions and forced outages in the gas
and electric systems. Figure 27 provides a flow diagram of the Monte Carlo modeling process.
Figure 27: Flow Diagram of Monte Carlo Modeling Process
66 Developed by ICF, International
Electric System Infrastructure: Generation Assets and Transmission Capacity
Natural gas system infrastructure including pipelines, storage, and delivery constraints
Locational
Consumption
Behavior as a
function of weather
and other factors
with provisions for
interruptible load
Probability
Distributions for
weather and system
outages at the
pipeline, storage,
transmission, and
generation asset level
Monte Carlo analysis of generation and pipeline dispatch
Ability to meet load under alternative weather and outage conditions
Chapter 5—Methods for Analyzing Natural Gas Demand and Infrastructure for Electric Power Needs
NERC | 2013 Special Reliability Assessment: Accommodating an Increasing Dependence on Natural Gas for Electric Power | May 2013 56 of 114
The key outputs from each of the Monte Carlo cases would be:
Loss‐of‐Load Expectation (LOLE): Expected number of days (or hours) to identify that the available capacity is
insufficient to serve the peak demand.
Loss‐of‐Load Hours (LOLH): The number of hours in the forecast year that the available generation was incapable
of meeting firm (non‐interruptible) load due to lack of gas supplies.
Expected Unserved Energy (EUE): The total MWh in a year that could not be met, as either an absolute value or as
a percentage of annual Net Energy for Load (normalized EUE).
The Monte Carlo analysis described above estimates resource adequacy through metrics such as LOLE for the assumed gas
and electric system infrastructure in place for the forecast year. The Monte Carlo analysis does not identify new
infrastructure additions. The need for new infrastructure would have to be ascertained by examining results for those cases
with significant loss of electric load and determining what new infrastructure (pipeline capacity, storage capacity, fuel‐
switching capability) could alleviate the problems. If multiple infrastructure solutions are possible, the options could be
evaluated by comparing the cost of each option to how often they would be relied upon to avoid loss of electricity loads.
For example, if a gas supply‐related loss of load event is expected to occur 50 days or more per year, additional pipeline
capacity may be the best solution. Adding fuel‐switching capability may be the best option for short‐duration loads,
especially where underground gas storage is not feasible or in a scenario with relatively low oil prices. The duration of the
need for additional fuel volumes (and related infrastructure needs) necessary to increase electric system reliability will be
driven primarily by the growth in power and non‐power demand for natural gas, but will also be greatly influenced by
weather patterns and gas and electric system contingencies.
Gas System Scheduled Outages and Contingencies for Layer 3 Gas Infrastructure Analyses The Layer 3 Monte Carlo model would represent various components of the natural gas infrastructure in terms of the
overall topology (what other components each component directly connects to) and the capacity of each component. Given
certain assumed scheduled outages and forced outage rates for each component, the reliability of the overall system in
terms of serving a single power plant or a group of power plants in an area would be computed by a Monte Carlo
simulation. Because there can be several pathways for natural gas to move to any given location or region, it is important to
model the exact topology of the system and to use a network flow model to determine how the outage of any given
component or set of components affects the ability to serve the demand for natural gas.
The types of natural gas infrastructure components represented in the Layer 3 model could include:
Sources of production (gas wells and oil wells, synthetic natural gas plants)
Gas processing plants
Gas transmission or gathering lines and compressor stations
LNG import terminals
Underground gas storage fields
Gas distribution systems
Peak shaving plants (full‐cycle LNG plants or propane‐air plants)
The Layer 3 Monte Carlo model would represent scheduled outages and contingencies in natural gas infrastructure in much
the same way that it would represent scheduled outages and contingencies for electric generation and transmission
infrastructure:
Scheduled outages would be represented by a frequency and a duration for each type of scheduled outage, and

Chapter 5—Methods for Analyzing Natural Gas Demand and Infrastructure for Electric Power Needs
NERC | 2013 Special Reliability Assessment: Accommodating an Increasing Dependence on Natural Gas for Electric Power | May 2013 57 of 114
Forced outages would be represented by a probability of occurrence and a probability density function for the
duration of each forced outage.
Unfortunately, there is no compiled statistical data on gas system outages that would be the equivalent to NERC GADS
databases. Therefore, outage data would have to be estimated from various surrogate sources, including pipeline bulletin
board postings, including “nominal design capacity” and “operationally available capacity” postings, accident reports filed
with government agencies, surveys of pipeline and distribution companies in the study region, and maintenance and repair
information from equipment manufacturers and service companies.
As discussed in more detail below, NERC suggests that for modeling purposes these outage rates be specified separately for
gas pipelines, compressor units in each station, and single‐line pipeline “segments,” which are distinguished based on
components of the gas infrastructure system (e.g., two adjacent compressor stations). Thus, the Layer 3 model would
simulate for each Monte Carlo case the operating state and available capacity at each compressor station and for each
pipeline segment.
Definition of Contingency (Forced Outage) The NERC Glossary of Terms defines contingency as “the unexpected failure or outage of a system component, such as a
generator, transmission line, circuit breaker, switch or other electrical element.” Solely for the purpose of this report and
associated analysis, NERC is using a parallel definition for natural gas system contingencies (i.e., forced outages):
“A natural gas contingency is an unexpected failure or outage of a system component that renders
some part of the natural gas infrastructure unable to produce, process, transport, or store natural gas
up to its rated capacity and serve firm customers.”
For example, cold weather is not considered a contingency just because it increases gas demand and makes interruptible
pipeline capacity less available. As long as the system is able to perform up to its rated capacity and firm customers are
served, there is no contingency event under this definition.
Compressor Outages Major gas infrastructure components in the Layer 3 Monte Carlo model would have scheduled outages specified in terms of
frequency and duration. For example, a gas compressor unit (prime mover, gear box, and compressor) might have
scheduled outages of:
Eight 4‐hour outages per year for offline cleaning
Two 3.5‐day outages per year for inspection and maintenance
One 28‐day outage every three years for overhaul
This is an average of 18 scheduled outage days per year, or about 5 percent of the days in a year. Stated in other terms, the
single compressor unit would have 95 percent scheduled availability for the year. Given that a pipeline will schedule long
maintenance outages during months of low throughput, the scheduled availability of the compressor unit would be near
100 percent during peak gas demand months.
Contingencies or forced outages for a gas compressor unit could be represented by data for:
Mean‐time‐between‐failures (MTBF), which might be expected to be several hundreds of days for well‐maintained
compressor units
Mean‐time‐to‐repair (MTTR), which might be expected to be on the order of several days
Distribution of repair days, which could range from under one day to months for a major failure, such as a cracked
drive shaft

Chapter 5—Methods for Analyzing Natural Gas Demand and Infrastructure for Electric Power Needs
NERC | 2013 Special Reliability Assessment: Accommodating an Increasing Dependence on Natural Gas for Electric Power | May 2013 58 of 114
For example, assumptions of MTBF=625 days and MTTR=6 days for a single compressor unit would mean that the expected
number of forced outage days per year would be 3.5. Therefore, the chance that a compressor will not be available on any
given day due to forced outages is about 1 percent.
The values given above refer to a single compressor unit made up of one prime mover, one gear box, and one compressor.
Natural gas pipeline compressor stations typically are comprised of several individual compressor units. Table 3 below
shows one such possible configuration for a compressor station on a 1 Bcf/D pipeline.
Table 4: Example Compressor Station Configuration on 36”, 1 Bcf/D pipeline
Configuration Component Units
Maximum Operated Horsepower (HP) 15,000
Compressors Units (No.) 4
Compressor Size (HP) 5,000
Total Installed (HP) 20,000
Degree of Redundancy (%) 33%
In this example, there is one spare compressor unit that provides 33 percent redundancy. At any one time, all four, three,
two, one, or none of the compressors could be available. If four or three compressor units are available, then the
compression station can supply the full compression needed to maintain the pipeline’s 1 Bcf/D capacity. When only two
compressors are available, then the capacity of the pipeline will be somewhat less. Table 5 below shows the probabilities
for the number of compressors available on days without scheduled outages, and the approximate portion of the pipeline’s
rated capacity that would be available when the number of compressor units is two or fewer. Note that the probabilities
shown assume that the forced outages on the compressor units are independent of each other. This assumption holds true
for most mechanical failures but may not be true if an external event, such as a severe flood, makes the entire compressor
station inoperable. Contingencies on compressors at one station could also be correlated to each other if the prime movers
are electric‐driven and the cause of the failure is lack of electricity.
Table 5: Probabilities for Number of Available Compressors at a Station67 (For days without scheduled maintenance at a station with 4 units and 33% redundancy)
Operable Compressors Percent of Days Days per Year Available Capacity on Pipeline Segment
0 0.00% 0.0 70.4%
1 0.00% 0.0 83.7%
2 0.06% 0.2 92.9%
3 3.88% 14.2 100.0%
4 96.06% 350.6 100.0%
Sum of All Conditions 100.00% 365.0 100.0%
67 Based on all outage percent of 1.0%.
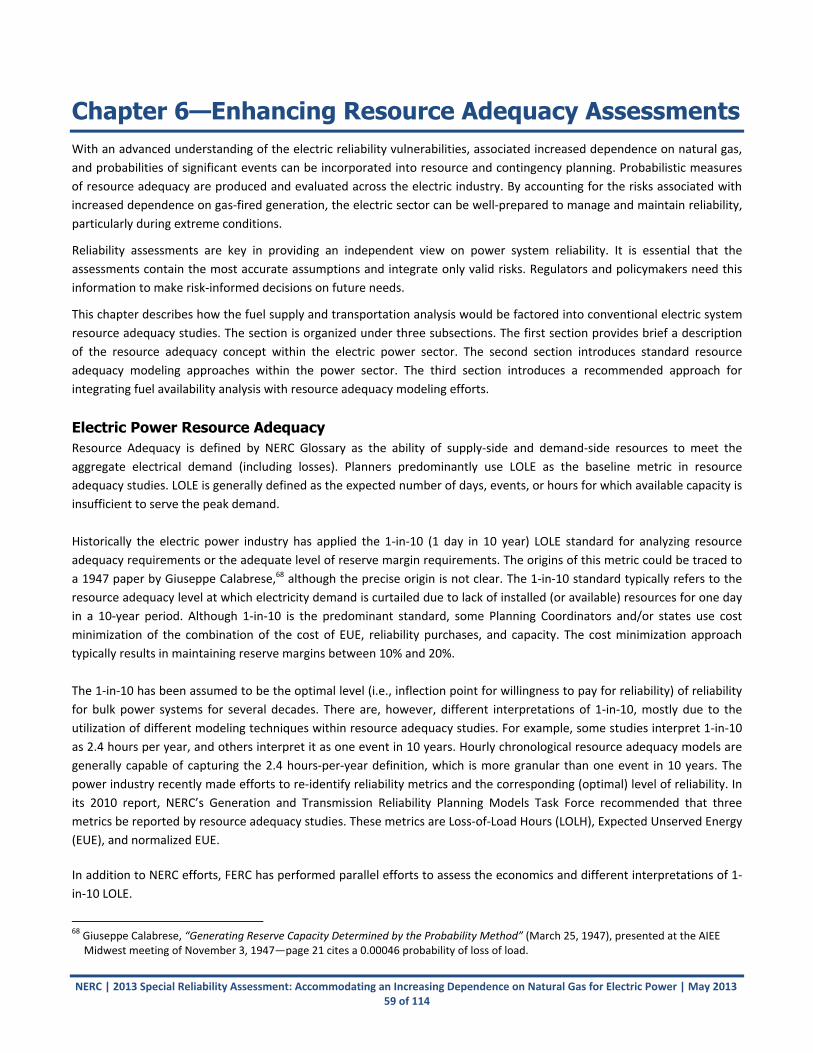
NERC | 2013 Special Reliability Assessment: Accommodating an Increasing Dependence on Natural Gas for Electric Power | May 2013 59 of 114
Chapter 6—Enhancing Resource Adequacy Assessments With an advanced understanding of the electric reliability vulnerabilities, associated increased dependence on natural gas,
and probabilities of significant events can be incorporated into resource and contingency planning. Probabilistic measures
of resource adequacy are produced and evaluated across the electric industry. By accounting for the risks associated with
increased dependence on gas‐fired generation, the electric sector can be well‐prepared to manage and maintain reliability,
particularly during extreme conditions.
Reliability assessments are key in providing an independent view on power system reliability. It is essential that the
assessments contain the most accurate assumptions and integrate only valid risks. Regulators and policymakers need this
information to make risk‐informed decisions on future needs.
This chapter describes how the fuel supply and transportation analysis would be factored into conventional electric system
resource adequacy studies. The section is organized under three subsections. The first section provides brief a description
of the resource adequacy concept within the electric power sector. The second section introduces standard resource
adequacy modeling approaches within the power sector. The third section introduces a recommended approach for
integrating fuel availability analysis with resource adequacy modeling efforts.
Electric Power Resource Adequacy Resource Adequacy is defined by NERC Glossary as the ability of supply‐side and demand‐side resources to meet the
aggregate electrical demand (including losses). Planners predominantly use LOLE as the baseline metric in resource
adequacy studies. LOLE is generally defined as the expected number of days, events, or hours for which available capacity is
insufficient to serve the peak demand.
Historically the electric power industry has applied the 1‐in‐10 (1 day in 10 year) LOLE standard for analyzing resource
adequacy requirements or the adequate level of reserve margin requirements. The origins of this metric could be traced to
a 1947 paper by Giuseppe Calabrese,68 although the precise origin is not clear. The 1‐in‐10 standard typically refers to the
resource adequacy level at which electricity demand is curtailed due to lack of installed (or available) resources for one day
in a 10‐year period. Although 1‐in‐10 is the predominant standard, some Planning Coordinators and/or states use cost
minimization of the combination of the cost of EUE, reliability purchases, and capacity. The cost minimization approach
typically results in maintaining reserve margins between 10% and 20%.
The 1‐in‐10 has been assumed to be the optimal level (i.e., inflection point for willingness to pay for reliability) of reliability
for bulk power systems for several decades. There are, however, different interpretations of 1‐in‐10, mostly due to the
utilization of different modeling techniques within resource adequacy studies. For example, some studies interpret 1‐in‐10
as 2.4 hours per year, and others interpret it as one event in 10 years. Hourly chronological resource adequacy models are
generally capable of capturing the 2.4 hours‐per‐year definition, which is more granular than one event in 10 years. The
power industry recently made efforts to re‐identify reliability metrics and the corresponding (optimal) level of reliability. In
its 2010 report, NERC’s Generation and Transmission Reliability Planning Models Task Force recommended that three
metrics be reported by resource adequacy studies. These metrics are Loss‐of‐Load Hours (LOLH), Expected Unserved Energy
(EUE), and normalized EUE.
In addition to NERC efforts, FERC has performed parallel efforts to assess the economics and different interpretations of 1‐
in‐10 LOLE.
68 Giuseppe Calabrese, “Generating Reserve Capacity Determined by the Probability Method” (March 25, 1947), presented at the AIEE Midwest meeting of November 3, 1947—page 21 cites a 0.00046 probability of loss of load.

Chapter 6—Enhancing Resource Adequacy Assessments
NERC | 2013 Special Reliability Assessment: Accommodating an Increasing Dependence on Natural Gas for Electric Power | May 2013 60 of 114
Resource Adequacy Modeling Almost all resource adequacy metrics are probabilistic in nature, and their calculations require implementing statistical
modeling techniques. Probabilistic resource adequacy models attempt to capture the full range of uncertainty by modeling
demand, forced outages, and variability of renewables as probability distributions. Monte Carlo modeling has emerged as
the industry standard to model the unpredictability of the bulk power systems. Monte Carlo methods are based on
repeated random sampling of input parameters and are especially useful for simulating systems where there is a large set
of possible scenarios. Monte Carlo‐based resource adequacy models test system reliability by creating thousands of
scenarios where demand and supply vary based on defined probability distributions. The most significant outcome of
Monte Carlo simulation is the probability of demand being greater than the probability of supply at any given hour.
The ultimate goal of resource adequacy modeling is to calculate reserve margin requirement (i.e., installed capacity
requirement or planning reserves) that would result in a target reliability level (e.g., 1‐in‐10). To calculate the target reserve
margin requirement, a resource adequacy model is run at different capacity levels until the reliability target is met. When a
new uncertainty (risk) factor is introduced to the system, the amount of reserves required to satisfy reliability goals is
expected to increase. In this context, introduction of power–gas interdependence to resource adequacy modeling may
result in the requirement for higher reserve margins, market tools, or other risk mitigation measures for extreme days or
hours.
One purpose of this report is to recommend a conceptual approach to integrating standard resource adequacy modeling
with fuel availability models or results. This section defines the basic features of a standard resource adequacy model and
introduces their basic components. By doing so, the report sets a foundation for gas–power integrated modeling efforts.
Integrating Fuel Supply Availability with Electric Power Resource Adequacy Models Standard resource adequacy models used by the electric industry generally consider generation and transmission outages
as independent events. From a pure statistical and modeling perspective, increasing positive dependence between
uncertain parameters is typically expected to increase overall uncertainty (risk) of the system. Therefore, resource
adequacy models that do not capture power–gas interdependence may underestimate the probability of loss of load.
Modeling dependencies between random variables and simultaneously capturing the probability of extreme events
occurring is paramount to creating a sound probabilistic resource adequacy model; the sole purpose of a probabilistic
resource adequacy model is the ability to capture the impacts from extreme events. Additionally, the results of these
assessments are used by Planning Coordinators to inform resource planning, to incentivize market participants by sending
accurate price and reliability signals, or for use by state/provincial/local regulators.69
A review of the technical literature indicates no existing resource adequacy model or study explicitly addresses this power–
gas interdependence issue. While the complete understanding and quantification of power–gas interdependence is only
possible by integrating the modeling of power and gas networks, recent experience with the Electric Reliability Council of
Texas (ERCOT) markets shows a dependency exists and is likely to increase with the increasing penetration of gas‐fired
capacity. For example, a recent study70 has shown that ERCOT may lose 24 percent of its gas‐fired generation if the weather
pattern of December 1983 repeats itself.71 However, the ERCOT analysis did not assume any winterization mitigation in
effect that would likely reduce the loss in electric generation capacity. A survey conducted by ERCOT revealed that the
69 NERC 2008 Resource Issues Subcommittee Survey on Resource Adequacy Assessment Criteria: http://www.nerc.com/docs/pc/ris/Planning_Coordinator_Adequacy_Assessment_Practices‐Survey_Responses_08_14_08.xls
70 Black & Veatch, ERCOT Natural Gas Curtailment Risk Study, Prepared for ERCOT, March 2012. http://www.ercot.com/content/news/presentations/2012/BV%20ERCOT%20Gas%20Study%20Report%20March%202012.pdf
71 In 1983, the arctic front barreled through the Dallas–Ft. Worth area on the 18th, and temperatures stayed in the deep freeze for nearly two weeks. There were 295 consecutive hours at or below freezing: 7:00 a.m. Dec 18 to 2:00 p.m. Dec 30, 1983.

Chapter 6—Enhancing Resource Adequacy Assessments
NERC | 2013 Special Reliability Assessment: Accommodating an Increasing Dependence on Natural Gas for Electric Power | May 2013 61 of 114
majority of ERCOT generators reported interconnects with multiple pipelines and access to pipeline capacity in excess of
their peak needs.
The previous section introduced basic structure and components of standard resource adequacy models. To incorporate
fuel system availability into the Monte Carlo framework of the resource adequacy model, one first needs to identify
common risk factors and direction of data flow.
Figure 28 provides the basic scheme of integrated gas–power resource adequacy modeling. Both gas and power demand
uncertainties are mostly driven by weather uncertainty. An integrated model, therefore, needs to have the weather
uncertainty as a common random variable, feeding into both fuel supply and transportation availability and resource
adequacy models. Ultimate output of the fuel supply and transportation availability model would be hourly fuel availability
information for every gas‐fired unit within the power grid. Fuel availability will be another layer of outage information that
will complete the scheduled and forced outage history created within the resource adequacy model.
Figure 28: Integrating Fuel System Availability with Resource Adequacy
Incorporation of a fuel supply availability model into a resource adequacy model will fill two gaps in standard resource
adequacy models:
By modeling the gas supply network, probabilistic resource adequacy models will be able to capture the
dependence between gas supply risk and power outages.
Fuel supply and transportation availability is not factored into the standard forced outage rate assumptions within
standard resource adequacy models. As a result, the fact that significant numbers of gas‐fired power plants do not
have firm fuel supply and transportation contracts is not reflected in the current resource adequacy models.
Integrated modeling will create an opportunity to examine the risks associated with non‐firm fuel supply on the
power grid.
In the previous sections, NERC suggested three options for capturing power generation fuel availability. Layer 1 and Layer 2
analyses use natural gas duration curves to assess fuel availability. Layer 3 includes the representation of a gas network
model inside the resource adequacy models. Incorporation of all three layers into the resource adequacy modeling
framework will require the establishment of a process flow similar to that shown in Figure 28. The following sections
provide a description of the integration of resource adequacy models with different layers of fuel availability analysis.
Weather Uncertainty
Fuel Supply
Availability Model Resource Adequacy
Model Plant Fuel Availability

Chapter 6—Enhancing Resource Adequacy Assessments
NERC | 2013 Special Reliability Assessment: Accommodating an Increasing Dependence on Natural Gas for Electric Power | May 2013 62 of 114
Layers 1 and 2 (Load Duration Curve Approach) The analyses from Layers 1 and 2 include a series of deterministic scenario analyses at different weather confidence levels
(e.g., 50/50, 90/10, etc.) and include profile testing of the supply‐and‐demand balance to calculating the amount of
unserved natural gas demand at different peak levels, such as 0.1 percent peak hours, 1 percent peak hours, etc. The
ultimate output of the load duration curve analysis would be to calculate the functional relationship between weather
temperature and amount of unserved natural gas load within the power sector. The expected nature of this functional
relationship is presented in Figure 29. It is expected that the amount of unserved load will increase during extreme
temperatures, reflecting the correlation created in the power sector due to increased use of natural gas.
Figure 29: Amount of Unserved Natural Gas Load in Power Sector as Function of Weather Temperature and Gas Contingencies72
This functional relationship between temperature and unserved load would then be modeled in a resource adequacy
model. Given that weather temperature is the main driver of load uncertainty, variations in weather temperature are
directly or indirectly captured by the resource adequacy models. Therefore, incorporation of such function into resource
adequacy modeling would not require significant revisions to the existing models. Once the functional relationship is
captured, a resource adequacy model is able to adjust the availabilities of single‐fuel, gas‐fired generation based on the
quotient found by dividing the amount of unserved natural gas by the total demand. Note that availability adjustment
should be made for all single‐fuel, gas‐fired plants in the region.
The load duration curve approach captures gas–power interdependency without requiring robust modeling of the gas
network within the resource adequacy modeling. Note, however, that the load duration curve approach will not be able to
capture the equipment reliability fully, as the contingency analysis will only provide a static view of equipment reliability.
Layer 1 analysis will not have representation of the gas network system. Put another way, load duration curve modeling will
generalize the impact of gas availability on the power system by allocating gas availability to all non‐switchable, gas‐fired
plants equally. Furthermore, the load duration curve approach is not a chronological modeling approach and is therefore
likely to miss the finer details of the natural gas network operations, such as storage—a location‐dependent resource.
72 Note: The term “N‐zero” is read “N minus zero” and refers to the scenario wherein all natural gas infrastructure is operational at its full (equilibrium) capacity. The term “N‐1” is read “N minus one” and refers to a scenario wherein there is loss of one large component of the natural gas infrastructure. Scenarios wherein there is a loss of two large components would be called “N‐1‐1,” and so on.
0
500
1,000
1,500
2,000
2,500
3,000
3,500
‐20 ‐10 0 10 20 30 40 50 60 70 80 90 100 110
MMcfd
Average Daily Temperature (degrees Fahrenheit)
Non‐Power Demand
Power Demand
Unmet Power Demand (N‐1)
Unmet Power Demand (N‐zero)

Chapter 6—Enhancing Resource Adequacy Assessments
NERC | 2013 Special Reliability Assessment: Accommodating an Increasing Dependence on Natural Gas for Electric Power | May 2013 63 of 114
Layer 3 (Fully Integrated Gas–Power Resource Adequacy Modeling) Fully integrated gas–power resource adequacy modeling includes representation of the natural gas network in a standard
resource adequacy modeling. Components of the natural gas network are assigned random outage statistics, and the
supply‐and‐demand balance changes dynamically during simulation. Infrastructure components are a board term that
includes various segments of the natural gas value chain including, production, processing, transportation, distribution,
storage and other elements. Rather than the cascaded modeling defined within Layer 1 and 2 analyses, the integrated
Monte Carlo algorithm simultaneously tests natural gas and power systems under different weather conditions. In the case
of integrated modeling, gas fuel supply availability will be modeled inside the sequential Monte Carlo algorithm and tested
chronologically, as opposed to the load duration curve approach. Integrated modeling reflects more accurate
representation of the gas–power infrastructure interdependencies and, therefore, provides better understanding of
associated risks.
Integrated modeling would have to adhere with the minimum resource adequacy modeling requirements listed in NERC’s
Probabilistic Assessment report73. Furthermore, the model would need to include a simplified merit order dispatch
algorithm for assessment of natural gas demand and economics of reliability.
Expected Outputs and Answers In addition to standard outputs produced from currently available resource adequacy models, integrated resource
adequacy modeling will answer the following questions:
Do variations in available natural gas transportation create additional risk on system reliability?
What is the impact of gas–power interdependence on electric system reliability metrics (e.g., reserve margin)?
o What is the amount of expected unserved energy due specifically to fuel supply and transportation
unavailability?
o What is the number of LOLH and LOLE caused by fuel supply and transportation unavailability?
Does gas–power interdependence create a need for a higher planning reserve margin?
What can be done to “firm up” fuel supplies to meet the reliability goals?
Probabilistic resource adequacy models used by the electric industry to calculate LOLE and other metrics attempt to
capture the full range of uncertainty by modeling demand, forced outages—and variability of renewables—as probability
distributions. Monte Carlo modeling has emerged as the industry standard to model randomness of bulk power systems.
The most significant outcome of Monte Carlo simulation is the probability of demand being greater than supply at any given
hour. The Layer 3 analysis of natural gas markets and infrastructure recommended in this report is intended to mirror and
enhance these existing Monte Carlo methods for electric resource adequacy assessments.
This study described how planners can estimate the numbers of days per period of time that various gas‐fired power
generators would not be able to procure natural gas supplies and thus may not be available to supply power. The results of
such analyses should be incorporated into the electric power resource adequacy models to more accurately estimate the
key adequacy metrics, such as LOLE. The results of the Layer 1 and 2 analyses could be transferred to electric resource
adequacy models in the form of curves showing available gas volumes for power generation on the y‐axis and temperature
on the x‐axis. The curves would be bounds within which Monte Carlo samples could be drawn to adjust the availability of
gas‐fired power plants. The results of the Layer 3 analysis could also be transferred in the form of volume versus
73 http://www.nerc.com/files/2012_ProbA.pdf

Chapter 6—Enhancing Resource Adequacy Assessments
NERC | 2013 Special Reliability Assessment: Accommodating an Increasing Dependence on Natural Gas for Electric Power | May 2013 64 of 114
temperature curves, or the Layer 3 model could be configured to directly output LOLE and other electric resource adequacy
metrics.
The main goal of resource adequacy modeling is to calculate reserve margin requirements that would result in a target
reliability level (e.g., loss of a day or less of load every 10 years). To calculate the target reserve margin requirement, a
resource adequacy model is run at different generating capacity levels until the reliability target is met. When a new
uncertainty (risk) factor is introduced to the system, the result is either a requirement for more reserves to satisfy reliability
goals, or a requirement for other measures, such as bolstering fuel supplies or resolving another source of systemic
weakness. To incorporate the reliability of natural gas supply and transportation into resource adequacy models, any
finding that the lack of available natural gas during the planning horizon will significantly contribute to inadequate electric
supplies may result in suggested mitigation measures to:
Increase natural gas delivery capacity by contracting and building new gas pipeline and storage capacity.
Add new onsite natural gas storage capacity at or near gas‐fired power plants.
Install more alternative fuel capability and onsite (liquid) gas storage at gas‐fired power plants.
Expand use of interruptible electricity contracts to reduce electric loads in periods of constrained fuel supplies.
Expand use of non‐power interruptible gas contracts to reduce gas loads in periods of constrained fuel supplies.
Increase electric transmission capacity into areas expected to have fuel‐related generating constraints.
Build up reserve margins using non‐gas fuel capacity.
Since such measures may involve higher costs, it is important to assure that the natural gas market analysis providing into
to electric resource adequacy studies is accurate; all mitigation measures should be weighed against each other and against
the potential cost of the averted lost load. For similar reasons, it is important to assure that all stakeholders, regulators, and
policy makers understand the reasons that fuel availability would be incorporated into resource adequacy studies and that
they agree with the methods and data used for fuel supply analysis.
Assessment of Regional Pipeline Infrastructure In addition to compressor unit scheduled and forced outages, gas pipeline system operations can be affected by
maintenance requirements and operational problems with other pipeline components. Most pipeline maintenance tasks to
test or clean the line (such as pigging74) usually can be done without curtailing firm pipeline services. It is also possible to
construct new connections to pipelines without stopping services (e.g., hot tapping). However, a pipeline may on occasion
stop service to some customers or reduce its operationally available capacity due to scheduled construction or tie‐in of new
facilities, component replacement (meters, valve, controls, and line pipe), or hydrostatic testing.
Except for those related to compressor units, contingencies on gas pipelines are most often related to problems with the
pipeline leaks caused by third‐party excavation damage, construction contractor damage, corrosion, natural forces, or
mechanical failures, for example. Some, but not all of these incidences are reported to the Department of Transportation’s
Pipeline and Hazardous Materials Safety Administration (PHMSA). Through Title 49 of the Code of Federal Regulations75,
PHMSA requires pipeline operators to submit incident reports within 30 days of a pipeline incident or accident. Title 49
defines accidents and incidents, as well as criteria for submitting reports to the Office of Pipeline Safety. The following is
collected:
Key report information
74 How Does Pipeline Pigging Work: http://www.rigzone.com/training/insight.asp?insight_id=310&c_id=19 75 49 CFR Parts 191, 195

Chapter 6—Enhancing Resource Adequacy Assessments
NERC | 2013 Special Reliability Assessment: Accommodating an Increasing Dependence on Natural Gas for Electric Power | May 2013 65 of 114
In‐depth location information
Facility information
Operating information
Drug and Alcohol information
Cause of the accident/incident
Specific information includes the time and location of the incident, number of any injuries or fatalities; commodity
spilled/gas released, causes of failure, and evacuation procedures. The incident reports are used for identifying long‐ and
short‐term trends at the national‐, state‐, and operator‐specific levels. The frequency, causes, and consequences of the
incidents provide insight into the safety metrics currently used by PHMSA, state regulators, and other pipeline safety
stakeholders, including the pipeline industry and general public. PHMSA also uses the data for inspection planning and risk
assessment.
A reportable incident under PMHSA requirements is triggered by any of the following events:
1. An event that involves a release of gas from a pipeline, or of liquefied natural gas, liquefied petroleum gas,
refrigerant gas, or gas from an LNG facility, and that results in one or more of the following consequences:
a. A death or personal injury necessitating in‐patient hospitalization;
b. Estimated property damage of $50,000 or more, including loss to the operator and others, or both, but
excluding cost of gas lost; and
c. Unintentional estimated gas loss of three million cubic feet or more.
2. An event that results in an emergency shutdown of an LNG facility. Activation of an emergency shutdown system
for reasons other than an actual emergency does not constitute an incident.
3. An event that is significant in the judgment of the operator, even though it did not meet the criteria of paragraphs
1 or 2 of this definition.
Based on the definitions above, incident reports may not always result in service interruptions. However, this may be
determined by analyzing the explanations given in the data, were a system shutdown to occur. It would be necessary to
analyze the incidents that clearly resulted in a system shutdown to determine the cause and duration of the shutdown.
Table 6 indicates that for the United States as a whole, there were 1,848 gas pipeline incidents reported over 20 years. This
comes to roughly 0.0003 incidences per mile of pipeline each year, or 0.021 incidents per year for each 70‐mile pipeline
segment (approximately the distance between compressor stations). The pipeline segment between two compressor
stations might expect to have a reportable incident to PHMSA once in 48 years. Assuming the mean period to repair is two
days, the expected forced outage rate would be 0.042 days per year for a 70‐mile gas pipeline segment.
The highest probability of rupture events of all rupture events is excavation damage. Excavation damage is generally
considered time independent; therefore, hard to predict. However, each rupture cause has a probability of occurrence.
These have been determined and the main focus of continuous improvement within the pipeline industry.
The actual impacts of forced outages were predicted in an ICF study conducted for INGAA in studying the impacts of
outages due to the PHMSA mandated Pipeline Integrity Program. The effect on the market with the multitude of
installation of pigging facilities—with attendant outage times—can be compared with random outages due to pipeline
failures. The correlation between the number of rupture incidents and the market impacts (2006 to present) provides a
more accurate probability of a pipeline rupture affecting the market.

Chapter 6—Enhancing Resource Adequacy Assessments
NERC | 2013 Special Reliability Assessment: Accommodating an Increasing Dependence on Natural Gas for Electric Power | May 2013 66 of 114
Table 6: Probabilities for Types of Gas Pipeline Incidents Reported to PHMSA (Note: These data do not include all types of non‐compressor problems that can lead to forced outages)
Incident Type Incidents Over 20 Years
Incidents per 1 Year
Incidents per Mile per Year
Per 70‐mile 1‐line Segment
Incidents per Year for 70‐
Mile Segment
Assumed Days to
Repair per Incident
Days per Year
Disrupted
Daily Probability of Disruption
Serious (death or hospitalization)
126 6.3 0.00002 0.001 7.0 0.01 0.0028%
Moderate (above property damage threshold)
1,070 53.5 0.00018 0.012 2.0 0.025 0.0067%
Lowest Reportable 652 32.6 0.00011 0.007 1.0 0.007 0.0020%
All Damages to Lines
1,848 92.4 0.00031 0.020 2.0 0.042 0.0116%
Large interstate mainline gas pipelines are often made up of two or more individual lines running parallel. Therefore, the
scheduled or forced outage of one line would not affect all the capacity on the other mainline segment. Table 7 below
shows how the probability of a forced outage might be computed on a mainline segment made up of two lines (L1 and L2).
Each row represents a potential state of being for that pipeline segment. For example, the first line represents the case in
which both L1 and L2 are operable and the capacity of the segment is 100% of its rated capacity. The next two lines
represent states of being when one of the lines is operable while the other is not, and the line segment is at 50% of rated
capacity (assuming the two lines are of equal diameter and operate at the same pressures).
The next row of data (L1=0, L2=0) represents both lines as inoperable with segment capacity at zero. As in the case of
simultaneous outages of individual compressors in one compressor station, it is important to consider what the causes are
for outages on the different lines making up each multi‐line segment. It is also important to consider whether they are
correlated to each other (generally true for mechanical failures) as opposed to those causes that might affect both lines at
once (severe earthquakes or erosion/river scouring). The correlation coefficients used for generating the Monte Carlo case
might be derivable from historical data but are more likely to be based on reasoned judgment.
Table 7: Example Calculation of Forced Outage Probabilities on a Pipeline Segment
Two Lines on a 70‐mile Pipeline Segment
L1 L2 Sum Daily Probability Available Capacity
1 1 2 99.9769% 100.0000%
1 0 1 0.0115% 50.0000%
0 1 1 0.0115% 50.00000
0 0 0 0.0000% 0.0000%

Chapter 6—Enhancing Resource Adequacy Assessments
NERC | 2013 Special Reliability Assessment: Accommodating an Increasing Dependence on Natural Gas for Electric Power | May 2013 67 of 114
Overall Gas Pipeline System Reliability (in Reference to Specific Demands or Locations) Once the scheduled and forced outages of the compressor stations and pipeline segments are specified, it is possible to
analyze the overall system reliability using the Layer 3 Monte Carlo model, which would be represented by each of the
following key components:
Location and type of component (gas sources, gas pipeline segments, compressor stations, etc.)
Rated capacity in MMcf/D or Bcf/D
The scheduled outage requirements (frequency and duration)
Probability of forced outages and probability density function of times to repair
Correlation coefficients among the different kinds of outages (including relations to severe weather events)
Effect of each kind of outage or combination of outages on operable capacity
System topology (what other components connect directly to each component)
In order to reach meaningful results, any measure of gas pipeline reliability has to be defined in terms of specific natural gas
demands or locations. For example, one can refer to the reliability of the overall system in terms of serving a single power
plant or a group of power plants in a defined area. Because there can be several pathways for natural gas to move to any
given location or region, it is important to model the exact topology of the system and to use a network flow model to
determine how the outage of any given component or set of components in the natural gas value chain affects the ability to
service any given demand for natural gas. It is possible that a power plant located somewhere on the gas system with only
one pathway from the supply source might be much closer to the source than power plants located on the system where
there are multiple pathways from various supply sources.
Figure 30 shows how simple gas pipeline topologies might be specified in a Layer 3 Monte Carlo model and how the
reliability of service to an area could be computed. Figure 30 represents a simple 2.0 Bcf/D linear pipeline system for which
there is a single gas source and one mainline route to markets. The mainline is made up to two parallel‐running lines. There
are three single‐line 0.7 Bcf/D laterals running off the end of the mainline, each of which serves a market area. A gas
pipeline’s reliability is computed by estimating how often and for how long outages exist on each pipeline segment and at
each compressor station and what the “operationally available capacity” is for those components. In this example, reduced
capacity at a compressor station or pipeline segment would cause the gas to move only in one direction along the mainline,
therefore reducing capacity at all downstream points.

Chapter 6—Enhancing Resource Adequacy Assessments
NERC | 2013 Special Reliability Assessment: Accommodating an Increasing Dependence on Natural Gas for Electric Power | May 2013 68 of 114
Figure 30: Example of Overall Gas Pipeline System for Reliability Analysis (Linear System with No Interconnects)
Figure 31 is another example of a simple gas pipeline topology. This topology is the same as the previous one except a
second pipeline of 1.0 Bcf/D capacity has been introduced to connect to the three market area laterals to a second source
of supply.
Figure 31: Example of Overall Gas Pipeline System for Reliability Analysis (Linear System with One Interconnect in Market Area)
A Monte Carlo simulation was used to produce 2,000 cases of each topology. In each case, the operable status of each
pipeline component (that is, each pipeline segment and each compressor station) is specified based on the frequency and
duration of scheduled outages, the probability of forced outages, and the probability density function of the time to repair
a forced outage.
The results of this Monte Carlo simulation are shown in Figure 32 with respect to the sum of deliverability into the three
market areas. The x‐axis represents the percent of time that the total deliverability is equal to or less than the capacity (in
MMcf/D) value on the y‐axis. For the first topology with just one pipeline, the maximum deliverability is maintained 95
percent of the time. As expected, the second case with a second pipeline serving the three market areas shows greater
reliability with maximum deliverability being maintained over 99.8 percent of the time.
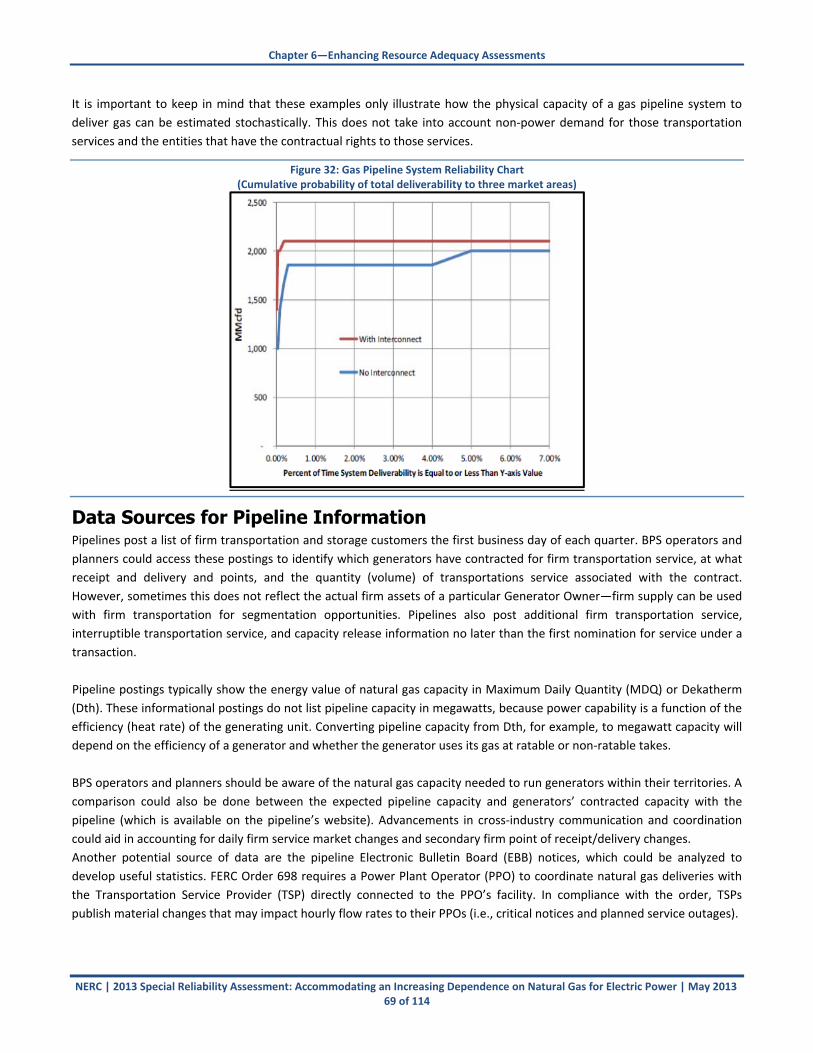
Chapter 6—Enhancing Resource Adequacy Assessments
NERC | 2013 Special Reliability Assessment: Accommodating an Increasing Dependence on Natural Gas for Electric Power | May 2013 69 of 114
It is important to keep in mind that these examples only illustrate how the physical capacity of a gas pipeline system to
deliver gas can be estimated stochastically. This does not take into account non‐power demand for those transportation
services and the entities that have the contractual rights to those services.
Figure 32: Gas Pipeline System Reliability Chart (Cumulative probability of total deliverability to three market areas)
Data Sources for Pipeline Information Pipelines post a list of firm transportation and storage customers the first business day of each quarter. BPS operators and
planners could access these postings to identify which generators have contracted for firm transportation service, at what
receipt and delivery and points, and the quantity (volume) of transportations service associated with the contract.
However, sometimes this does not reflect the actual firm assets of a particular Generator Owner—firm supply can be used
with firm transportation for segmentation opportunities. Pipelines also post additional firm transportation service,
interruptible transportation service, and capacity release information no later than the first nomination for service under a
transaction.
Pipeline postings typically show the energy value of natural gas capacity in Maximum Daily Quantity (MDQ) or Dekatherm
(Dth). These informational postings do not list pipeline capacity in megawatts, because power capability is a function of the
efficiency (heat rate) of the generating unit. Converting pipeline capacity from Dth, for example, to megawatt capacity will
depend on the efficiency of a generator and whether the generator uses its gas at ratable or non‐ratable takes.
BPS operators and planners should be aware of the natural gas capacity needed to run generators within their territories. A
comparison could also be done between the expected pipeline capacity and generators’ contracted capacity with the
pipeline (which is available on the pipeline’s website). Advancements in cross‐industry communication and coordination
could aid in accounting for daily firm service market changes and secondary firm point of receipt/delivery changes.
Another potential source of data are the pipeline Electronic Bulletin Board (EBB) notices, which could be analyzed to
develop useful statistics. FERC Order 698 requires a Power Plant Operator (PPO) to coordinate natural gas deliveries with
the Transportation Service Provider (TSP) directly connected to the PPO’s facility. In compliance with the order, TSPs
publish material changes that may impact hourly flow rates to their PPOs (i.e., critical notices and planned service outages).

Chapter 6—Enhancing Resource Adequacy Assessments
NERC | 2013 Special Reliability Assessment: Accommodating an Increasing Dependence on Natural Gas for Electric Power | May 2013 70 of 114
The June 25, 2007 FERC Order No. 698 require interstate natural gas pipelines, PPOs, TOs, TOPs, independent BAs, and
Regional RCs to establish communication procedures to improve communications for the coordination of gas transportation
scheduling and the operations of gas‐fired generators. Critical notices and planned service outages pertain to information
on TSP conditions that affect scheduling or adversely affect scheduled gas flow. TSPs communicate Operational Flow Orders
(OFO) and other critical notices by posting them on their websites. TSPs will also publish non‐critical notices that don’t
adversely affect scheduled gas flow and that typically include bid awards, annual or monthly meeting notices, and tariff
changes.
In many cases, a historical record of such notices is available on the pipeline website, although the data provided will vary
from system to system. This information typically is removed from these websites within a three‐to‐six‐month time frame.
Prior notices may also be found in the archived Department of Energy’s Office of Energy Assurance daily reports.76 Such
data may be useful in estimating the frequency of various outage types and (where data exists) the degree of the outages
(i.e., how many MMcfd of capacity were lost).
76 http://www.oe.netl.doe.gov/ead.aspx

NERC | 2013 Special Reliability Assessment: Accommodating an Increasing Dependence on Natural Gas for Electric Power | May 2013 71 of 114
Chapter 7—Performance Analysis of Generator Outages The NERC Generating Availability Data System (GADS) is a series of databases used to track the performance of electric
generating stations in North America. This reporting system was initiated by the electric utility industry in 1982 as a way to
expand and extend the data collection procedures established by the industry in 1963. GADS was a voluntary industry
program, open to all members of the Regional Entities and any other organization (domestic or international) that operate
electric generating facilities—GADS became mandatory in 2012. The voluntary GADS database covered 72% of the installed
generating capacity in the United States.
GADS information is used to support reliability and availability analyses and decision‐making processes developed by GADS
subscribers. GADS subscribers can use the data to calculate important performance statistics; they can also support bulk
power trend analysis by referencing GADS information for forced outages, maintenance outages, planned outages, and
deratings.77 The PC, Regional Entity, industry stakeholders, and other GADS users (e.g., World Energy Council) use GADS
data for conducting assessments of generation resource adequacy.
The NERC Board of Trustees approved mandatory GADS reporting criteria in 2011,78 with data collection for conventional
units above 50 MW beginning in 2012. GADS data is collected on a mandatory basis from all Generator Owners (GOs) on
the NERC Compliance Registry under NERC’s Rules of Procedure Section 1600, Requests for Data or Information.79
Mandatory reporting requirements apply to generators with a nameplate generating capacity greater than the specified
threshold of 50 MW. This was extended January 1, 2013, to include conventional generating units of 20 MW and above.
Generating units with less than 20 MW of nameplate capacity are invited to report to GADS on a voluntary basis. These
mandatory reporting requirements do not apply to non‐conventional generation technologies such as wind and solar.80
Additionally, many generators that do not meet the mandatory requirements provide information and data to GADS on a
voluntary basis for benchmarking purposes.
GADS data are compiled and published annually by NERC in the Generating Availability Report (GAR).81 GADS also produces
a Historical Availability Statistics (HAS) report. HAS provides annual performance information from 1982 through the most
current year for each of 63 generator unit groups in the GAR reports.
Generators report fuel unavailability‐related outages to GADS under two different outage (cause) codes:
9130 Lack of fuel (water from rivers or lakes, coal mines, gas lines, etc.) where the operator is not in control of
contracts, supply lines, or delivery of fuels
9131 Lack of fuel (interruptible supply of fuel part of fuel contract)
Outages related to lack of fuel are recorded regardless of a unit’s dispatch. If the unit becomes unavailable due to fuel
unavailability, the event is recorded as an outage in GADS even if the unit is not dispatched. GADS records outage start and
end days and hours by Region, unit type, and utility.
The GADS database is one of the most complete sources of outage data utilized in resource adequacy models. For future
efforts in overlaying an integrated gas–power resource adequacy model, forced outage statistics of gas‐fired generators will
77NERC GADS website: http://www.nerc.com/page.php?cid=4|43|401 78 NERC Board of Trustees minutes for August 4, 2011 meeting: http://www.nerc.com/docs/docs/bot/BOT_08‐11m_complete.pdf 79 North American Electric Reliability Corporation Rules of Procedure Section 1600—REQUESTS FOR DATA OR INFORMATION, Page 88, March 2012 http://www.nerc.com/files/NERC_ROP_Effective_20120315.pdf
80 Non‐conventional generating units are not subject to these mandatory reporting requirements, but they are tracked on a voluntary basis and governed by a separate set of reporting instructions, e.g., http://www.nerc.com/files/GADS_Wind_Turbine_Generation_DRI_042611_FINAL.pdf
81 Generating Availability Data System (GADS): Reports http://www.nerc.com/page.php?cid=4|43|47
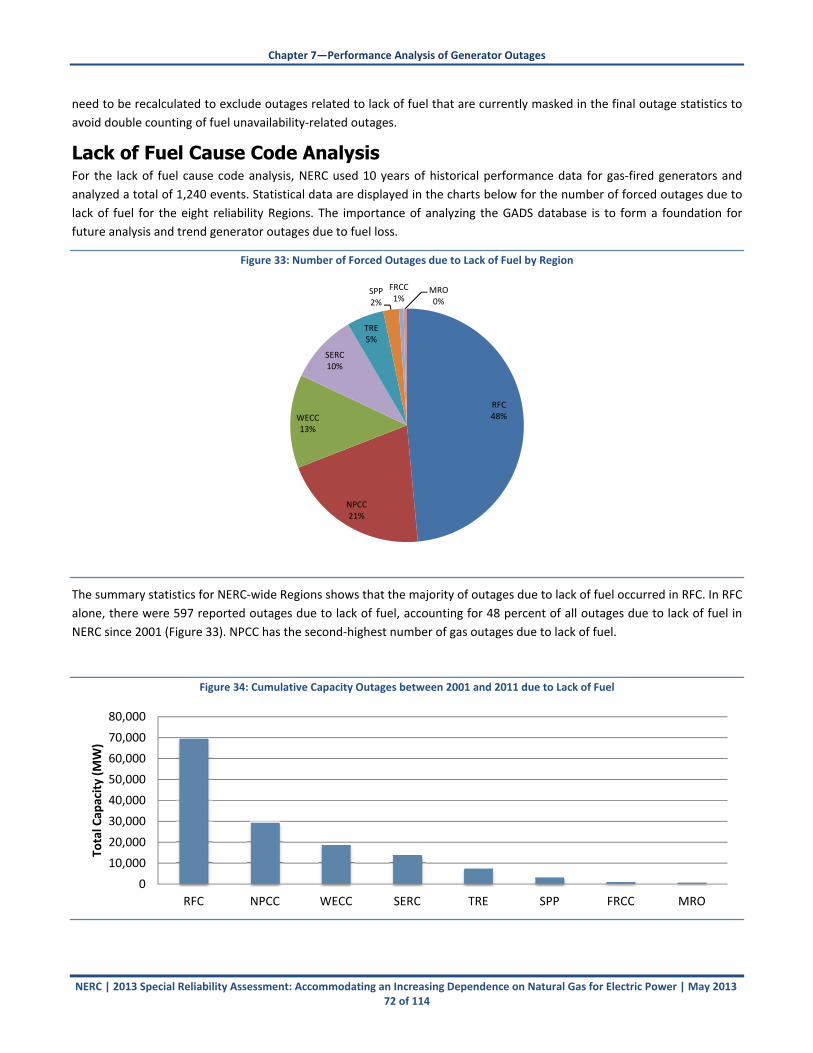
Chapter 7—Performance Analysis of Generator Outages
NERC | 2013 Special Reliability Assessment: Accommodating an Increasing Dependence on Natural Gas for Electric Power | May 2013 72 of 114
need to be recalculated to exclude outages related to lack of fuel that are currently masked in the final outage statistics to
avoid double counting of fuel unavailability‐related outages.
Lack of Fuel Cause Code Analysis For the lack of fuel cause code analysis, NERC used 10 years of historical performance data for gas‐fired generators and
analyzed a total of 1,240 events. Statistical data are displayed in the charts below for the number of forced outages due to
lack of fuel for the eight reliability Regions. The importance of analyzing the GADS database is to form a foundation for
future analysis and trend generator outages due to fuel loss.
Figure 33: Number of Forced Outages due to Lack of Fuel by Region
The summary statistics for NERC‐wide Regions shows that the majority of outages due to lack of fuel occurred in RFC. In RFC
alone, there were 597 reported outages due to lack of fuel, accounting for 48 percent of all outages due to lack of fuel in
NERC since 2001 (Figure 33). NPCC has the second‐highest number of gas outages due to lack of fuel.
Figure 34: Cumulative Capacity Outages between 2001 and 2011 due to Lack of Fuel
RFC48%
NPCC21%
WECC13%
SERC10%
TRE5%
SPP2%
FRCC1%
MRO0%
0
10,000
20,000
30,000
40,000
50,000
60,000
70,000
80,000
RFC NPCC WECC SERC TRE SPP FRCC MRO
Total Cap
acity (M
W)

Chapter 7—Performance Analysis of Generator Outages
NERC | 2013 Special Reliability Assessment: Accommodating an Increasing Dependence on Natural Gas for Electric Power | May 2013 73 of 114
The average amount of capacity lost for outages ranges from 96 MW to 140 MW (Figure 35). The minimum average time
that a unit is out in FRCC is 5 hours and 36 minutes. By contrast, the longest average time for an outage is approximately 47
hours (RFC). The second‐longest average time for an outage occurred in SPP, with an average duration of over 31 hours per
outage. From an energy perspective, loss in energy (Figure 36) NERC‐wide is largely due to energy losses in RFC.
Figure 35: 2001–2011 Average Amount of Capacity Lost (left) and Average Outage Duration per Event due to Lack of Fuel (right)
Figure 36: Total Annual Energy Loss per Year by Region
Figure 37: Number of Outages due to Lack of Fuel Supply from 2001 to 2011
80.00
90.00
100.00
110.00
120.00
130.00
140.00
150.00
MRO WECC RFC SERC FRCC NPCC TRE SPP
Average
Cap
acity Lost (MW)
0.00
5.00
10.00
15.00
20.00
25.00
30.00
35.00
40.00
45.00
50.00
MRO WECC RFC SERC FRCC NPCC TRE SPP
Average
Duration per event
0
20,000
40,000
60,000
80,000
100,000
120,000
FRCC MRO NPCC RFC SERC SPP TRE WECC
Total Energy Lost (GWh)
2001 2002 2003 2004 2005 2006 2007 2008 2009 2010 2011
0
20
40
60
80
100
120
140
160
180
2001 2002 2003 2004 2005 2006 2007 2008 2009 2010 2011
Number of Occurances
FRCC MRO NPCC RFC SERC SPP TRE WECC

Chapter 7—Performance Analysis of Generator Outages
NERC | 2013 Special Reliability Assessment: Accommodating an Increasing Dependence on Natural Gas for Electric Power | May 2013 74 of 114
By linearly trending the aggregated GADS data for all Regions, gas interruptions trends may increase in terms of capacity,
duration, and occurrences. There have been more occurrences throughout the years, but there were fewer in 2011, which
can be explained by 2011’s mild temperatures. The number of occurrences for total capacity lost and outage duration are
shown below. The trend lines for the two graphs follow a similar projected path as Figure 38, which indicates increased
occurrences, total capacity loss, and duration.
Figure 38 : NERC‐Wide Number of Annual Occurrences
Figure 39 : NERC‐Wide Total Annual Capacity Lost
Figure 40 : NERC‐Wide Total Annual Outage Duration
1336
94
5840
69
143
251225
292
192
0
50
100
150
200
250
300
350
2001 2002 2003 2004 2005 2006 2007 2008 2009 2010 2011
Number of Occurrences
0
5,000
10,000
15,000
20,000
25,000
30,000
35,000
2001 2002 2003 2004 2005 2006 2007 2008 2009 2010 2011
Cap
acity (M
W)
0
2,000
4,000
6,000
8,000
10,000
12,000
2001 2002 2003 2004 2005 2006 2007 2008 2009 2010 2011
Total O
utage
Duration
(Hours)

Chapter 7—Performance Analysis of Generator Outages
NERC | 2013 Special Reliability Assessment: Accommodating an Increasing Dependence on Natural Gas for Electric Power | May 2013 75 of 114
Figure 41 : NERC‐Wide Total Annual Energy Loss
Recommendations for Future GADS Analysis Upon finalizing the analysis of GADS data, NERC has identified recommended improvements to GADS cause code definitions
and analysis. NERC suggests that future GADS analysis and trending capabilities focus on the following enhancements:
Perform “deeper dive” analysis to a sample of individual generator outages to determine the cause of the outage.
GADS should be able to identify if generator outages were the result of either fuel contract interruptions or
uncontrolled gas curtailment events.
Overlay GADS outage data on pipeline capacity trends to determine if there is a correlation and identify potential
leading indicators.
Determine natural gas pipeline and supply conditions during times of gas generator outages.
Perform a study to determine approaches where dispatch trends and load duration curves can provide insights to
future generator performance.
Use GADS data for probabilistic adequacy models and develop scenarios around increased forced outage rates
0
50,000
100,000
150,000
200,000
250,000
300,000
2001 2002 2003 2004 2005 2006 2007 2008 2009 2010 2011
Energy Loss (GWh)

NERC | 2013 Special Reliability Assessment: Accommodating an Increasing Dependence on Natural Gas for Electric Power | May 2013 76 of 114
Chapter 8—Risk Assessment for Electric Reliability Prior sections of this report highlighted that for a variety of reasons, including acts of nature, gas supplies to electric
generators are subject to temporary disruptions, and such disruptions can impact overall electric system reliability.
Furthermore, as the dependence of the power sector on the natural gas industry is expected to increase, exposure to this
vulnerability could result in significant gas‐fired generation losses.
This chapter discusses different perspectives on how risks can be identified and vulnerabilities can be addressed and
managed. NERC assessed the benefits of using more firm transportation, as well as where using firm transportation does
not resolve all reliability issues. NERC also offered examples of enhanced transportation services that the two industries
might consider to better support electric generation needs. In addition, a key theme in this chapter is the need to analyze
and address options for improved reliability on this interface at the regional level due to the unique characteristics of each
Region.
As shown in previous chapters, significant improvements in system reliability can be realized from having sufficient backup,
dual‐fuel switching capabilities. Obstacles to achieving such benefits usually include state, federal, and provincial
environmental regulations (which effectively limit the amount of oil that can be burned), and operational preparedness.82
Current policies and rules that regulate backup oil use and emissions for electric generation may need to be re‐evaluated to
ensure dual‐fuel capability can be maintained during emergencies or other extreme conditions.
Economics, however, will drive decision making as solutions are developed and proposed. Additionally, it is important to
recognize that maintaining the reliability of the evolving BPS comes at a cost. The most reliable and cost‐effective solutions
will ultimately be supported by an appropriate risk profile—a desired level of risk that the system is planned to withstand.
Within the competitive wholesale market environments, a significant challenge will be to enhance market incentives and
penalties needed to absorb the increased cost of maintaining system reliability. For regulated utilities, cost recovery of fuel
supplies and transportation procurement is incorporated into the rate case. However, in deregulated markets, accurate
price signals reflecting reliability needs and incorporating acceptable risks are vital to maintaining a risk‐averse resource
portfolio.
Dual‐fuel capabilities and a variety of storage options may help bridge the gap between the uncertainties of gas availability
during extreme events and maintaining a reliable source of operable capacity available to meet seasonal peak demands.
Ultimately, the right balance of firm pipeline capacity, dual‐fuel capabilities, and a variety of storage options will be
regionally dependent. Factors such as market structure, geography, fuel mix, electric transmission, and pipeline
infrastructure will determine the extent of gas dependency risks, as well as what solutions are available.
Improvements in system reliability may be realized from having sufficient back‐up, dual‐fuel switching capabilities.
Obstacles to achieving such benefits include operational preparedness and state, federal, and provincial environmental
regulations, which effectively limit the amount of oil that can be burned. Current policies and rules that regulate backup oil
use and emissions for electric generation may need to be re‐evaluated to ensure that truly functional dual‐fuel capability
can be maintained during emergencies or other extreme conditions. Additionally, planning processes should consider
backup fuel inventories, changes in ramp and unit power capabilities, and the time requirements for fuel switch‐over.
Without considering this information, the amount of available dual‐fuel generation projected to be available may be
overstated. NERC‐wide, 125 GW of gas‐fired generation has dual‐fuel capabilities (approximately 35 percent of gas‐fired
capacity). Of the Regions able to report and determine portfolio‐wide firm contracts, approximately 58 percent of gas‐fired
capacity is tied to firm supply, transportation, and delivery (Figure 42).83
82 The physical plant site and the siting and permitting process is also an important factor of whether liquid fuels can be stored on‐site. 83 Data gathered in supplemental request: http://www.nerc.com/docs/pc/ras/2012LTRA_Supplemental_Request‐Instructions_v2.pdf

Chapter 8—Risk Assessment for Electric Reliability
NERC | 2013 Special Reliability Assessment: Accommodating an Increasing Dependence on Natural Gas for Electric Power | May 2013 77 of 114
Figure 42: 2012 Gas‐Fired Generation Fuel Services and Dual‐Fuel Capabilities by Assessment Area84
Risk Assessment To fully understand the implications of increasing gas‐fired generation on the BPS, a risk assessment is needed to determine
where the power industry should focus its attention. The risk assessment shown in Figure 43 provides a framework for
developing a risk profile. A high‐level risk profile may need to be adjusted for region‐specific considerations; however, given
a common risk of “loss of generation when needed,” a clear path to assessing vulnerabilities and the likelihood of an
associated impact can be ascertained.
The risk assessment in Figure 43 shows that the loss of generation of any magnitude is a resource adequacy concern—not
an operating reliability concern. As such, it is not likely that this risk could lead to an uncontrollable, cascading, or unstable
BPS. Rather, with a high magnitude of generator outages, a capacity deficiency would be the most probable outcome. The
threat of such a risk is directly correlated to conditions on regional pipelines. A disruption to fuel delivery to a gas‐fired
generator, whether it is an interruption or a curtailment—again, depending on the magnitude of generators affected and
time to respond—would likely result in system operators implementing emergency operating procedures (EOPs), firm load
shedding, or rotating outages.
In terms of timing, a significant amount of redundancy and flexibility is already available during off‐peak periods for both
gas and electric systems. The most vulnerable periods to expose these risks happen during electric peak periods and when
firm customers on the pipeline have nominated their full entitlements (i.e., pipeline peak). As the electric system peaks
closer to the pipeline peak and both systems are stressed, the likelihood of a larger impact increases—typically during
extreme winter weather. For many generators, this risk is mitigated through sufficient preparation and planning, which
includes dual‐fuel backup, adequate capacity release on the secondary market, and LNG shipments to injection points or
generator sites.
84 This analysis shows results of where fuel service is known. Areas that did not provide results, and may have unknown fuel service, are not shown.
0
10
20
30
40
50
60
70
80
90
Fuel Service
Dual Fuel
Fuel Service
Dual Fuel
Fuel Service
Dual Fuel
Fuel Service
Dual Fuel
Fuel Service
Dual Fuel
Fuel Service
Dual Fuel
Fuel Service
Dual Fuel
Fuel Service
Dual Fuel
Fuel Service
Dual Fuel
Fuel Service
Dual Fuel
Fuel Service
Dual Fuel
ERCOT FRCC MISO MRO‐MAPP MRO‐SaskPower
NPCC‐New England
NPCC‐Ontario PJM SERC (E,N,SE,W)
SPP WECC‐Total
Gigaw
atts (G
W)
Firm Non‐Firm

Chapter 8—Risk Assessment for Electric Reliability
NERC | 2013 Special Reliability Assessment: Accommodating an Increasing Dependence on Natural Gas for Electric Power | May 2013 78 of 114
Figure 43: Risk Assessment and Decomposition
Figure 44 shows the risk assessment of two distinct vulnerabilities. Vulnerabilities and associated impacts of curtailments
(pipeline or supply disruption) and interruptions (cold weather‐related) are separate and distinct. Curtailments of fuel
supply and transportation occurs because of a disruption either on the pipeline or at the supply source. Interruptions, on
the other hand, generally occur because there is insufficient pipeline capacity. While both of these vulnerabilities can lead
to common‐mode outages, the causes of these occurrences are very different, and so are the risks associated with them.
Figure 44: Risk Assessment of Impacts and Mitigation
Risk
• Loss of Generation When Needed
Risk Type
• Resource Adequacy-Potential Capacity Deficiency
Threat
• Disruption to Fuel Delivery (Interruptions and/or Curtailments)
Impact
• Emergency Procedures, Firm Load Shedding, and Rotating Outages
Vulnerable Period
• Pipeline Peak and Electric System Peak Conditions
Likelihood
• Highly Dependent on Extreme Winter Conditions, Preparations, and Planning
Mitigation Risks
MitigationMeasures
Electric System Impacts
Pipeline Impacts
Vulnerabilities
Risk Loss of Multiple Gas‐Fired Generators;System Highly Dependent on Gas
Natural Gas Pipeline Disruption
Curtailments Near/Around Affected Areas
Curtailment of Firm‐Gas Generation
Reserve Capacity
Reserve Capacity
Unavailable
Extreme Cold Weather
Interruption of Non‐Firm
Gas Generation
Loss of Interruptible Generation
Non‐Gas‐Fired Reserve
Capacity
Reserve Capacity
Unavailable
Backup Fuel
Backup fuel not operational, fuel switching not timely, inadequate preparation,
limited availability (inventory/environmental), reduced rating
Gas Supply Curtailment
Loss of Significant Electric
Generation
Backup FuelNon‐Gas‐
Fired Reserve Capacity
Reserve Capacity
Unavailable

Chapter 8—Risk Assessment for Electric Reliability
NERC | 2013 Special Reliability Assessment: Accommodating an Increasing Dependence on Natural Gas for Electric Power | May 2013 79 of 114
Figure 45 helps visualize the differences between natural gas interruption and curtailment risks. Along the flow chart, each
step will have an associated risk value. Developing a risk profile for a Balancing Authority using this framework can aid in
understanding the impact of each risk.
Figure 45: Operations Flow Chart and Risk Tree for Supply/Transportation Contingency versus Interruption (Initiating Events)
Pipelines are able to operate with temporary supply disruptions, provided the gas pressures are maintained within
acceptable limits. However, within a relatively short time, a major failure along an interstate gas pipeline could result in a
loss of electric generating capacity that could exceed the electric reserves available to compensate for these losses. The
likelihood of pipeline failures occurring during electric peak periods, however, is extremely low. Therefore, efforts should be
focused on preventative maintenance and recovery from these events.
Pipeline Services Historically, the power industry has relied largely upon interruptible transportation services in order to balance costs and
reliability. Because of the relatively low capacity factors of gas‐fired units85 and available secondary transportation capacity
during the summer months, interruptible service is widely used by electric generators. However, reliance on interruptible
service presents an increased risk of fuel interruption, particularly during periods of peak electric and gas demand.
As gas demand for electric generation grows, available pipeline capacity will likely decrease. On high‐demand days, if the
pipeline’s firm customers schedule all of their contracted pipeline capacity, gas loads that have not contracted for firm
capacity may not be able to procure the pipeline capacity necessary to provide delivery of gas supply.
Firm Transportation Services Firm transportation is service offered to customers under schedules or contracts that anticipate no interruptions. While
these services could significantly reduce the generator availability risks, the cost of such services can be economically
prohibitive for generators with low capacity factors or generators within competitive wholesale markets.
85 The average annual capacity factors for gas‐fired generation vary by region as shown in Chapter 2.

Chapter 8—Risk Assessment for Electric Reliability
NERC | 2013 Special Reliability Assessment: Accommodating an Increasing Dependence on Natural Gas for Electric Power | May 2013 80 of 114
However, firm transportation may not alleviate all reliability issues. For example, it does not resolve reliability problems
arising from:
Significant electric load variations that occur from unexpected weather events. Generator gas demand can be
significantly different from the nominated gas volumes (only under traditional firm contracts with non‐ratable
takes).
Reductions in gas pipeline pressures that occur due to an anomalous or man‐made event and cause the high‐
pressure combined‐cycle gas turbine units to trip offline.
Gas curtailments as a common‐mode failure.
The problems that arise from the differences between the ”gas day” and the ”electric day.”
Based on current rules and tariffs, firm transportation services for the gas‐fired peaking units—that have average annual
capacity factors of 10 percent or less—are presently not economical. Peaking units, of which almost all are gas‐fired, are an
integral part of overall system reliability and usually represent the difference between being resource adequate and not.
Proposed enhancements to overall system reliability must extend beyond the focus of any one solution (i.e., requirements
for procuring firm natural gas transportation service is not a guaranteed solution).
In the future, it is likely that more gas‐fired units, particularly combined‐cycle units, will procure firm transportation
services, as these units serve baseload generation requirements at higher capacity factors. With gas‐fired generation
providing more baseload generation, tensions between costs and improved reliability may be reduced.
Similarly, gas transportation strategies may become more complex and require a portfolio of transportation alternatives,
with firm transportation being used for baseload requirements and interruptible transportation used for peaking contracts.
With respect to the potential range of intermediate load requirements, this likely will require intense analysis and result in
a relatively complex set of congestion‐based, option‐based, and derivative‐based transportation contracts. Asset managers
(also referred to as marketers, fuel suppliers, or portfolio managers) will play a much larger role in managing a portfolio of
flexible and diverse transportation contracts for GOs.
Lastly, the power industry’s gas supply contracting practices are likely to change in order to meet this new challenge.
Greater emphasis will be placed on either baseload supply contracts or supply contracts with complex swing capabilities or
options. Potential integration of storage could—at a cost—reduce the complexity of such swing requirements. In addition,
the power industry is likely to place greater emphasis on where gas supplies are sourced in an effort to manage
transportation complexities, supply chain issues, and overall costs.
New Services In addition to the above, the pipeline industry could assist in reducing the potential for system reliability issues that arise as
a result of the growing interdependency of the two industries. Among other things, this could include the development of
new or modified transportation services tailored to the needs of generation customers. Many pipelines have created such
services or have attempted to market these services to their customers, particularly generation customers. Since these
services may be more expensive than firm transportation service (they may require pipelines to reserve capacity for the
subscribed customers in order to provide the service), many generators do no subscribe to such services.
As a result of the location and drilling of shale gas closer to traditional end‐use markets, the industry (in some regions) is
starting to source its gas supplies closer to local production. This, in turn, has initiated a trend in many Regions for a
reduction in long‐haul transportation requirements. While the latter phenomenon reduced the overall cost of firm
transportation for affected customers, it also resulted in a reduction in the capacity factors for sections of the overall gas
pipeline network. A careful evaluation of both phenomena shows it is possible to develop new transportation services that
focus on the reliability needs of the power sector. However, since the ability to offer new services tailored to generators is
contingent upon underutilized capacity being available, new pipeline infrastructure may also be needed.

Chapter 8—Risk Assessment for Electric Reliability
NERC | 2013 Special Reliability Assessment: Accommodating an Increasing Dependence on Natural Gas for Electric Power | May 2013 81 of 114
One example is Texas Gas’s recent adoption of the Enhanced Nominations Service.86 This new service, which is structured
primarily for the needs of the power industry, adds 11 new nomination and confirmation cycles during the gas day. While
this new service does not affect the rights of firm customers, it does provide gas generators priority in interruptible
nominations. With this service, GOs can adapt better to changing gas‐fired generation requirements due to changes in the
weather or variable generation.
However, the gas industry likely cannot proceed down this path entirely by itself, and the power industry would have to
create incentives for GOs to subscribe to these tailored delivery services. Without a joint effort from both industries, the
development of such new services by the gas industry would not be effective or sustainable.
Regional Planning As discussed throughout this report and stressed in previous NERC assessments, there are significant regional differences
within the electric industry, as well as the gas industry. These regional differences include, among other things, differing
degrees of dependency on gas‐fired generation; number and types of pipelines serving the Region; access to storage within
the region; geography; climate; electric infrastructure; and demand. As a result, analysis, reliability assessment, and
associated planning are best done at the regional level.
NERC Reliability Standards provide a layer of protection for transmission planning—utility planners must consider system
backup, or robustness, to cover a scenario called a “single‐contingency situation,” such as the failure of a transformer or
other significant event that causes the outage of a transmission line or large generator (Figure 46).
Figure 46: Four Primary Categories for Normal and Emergency Conditions
Credible contingencies on pipeline systems could be integrated into a similar process designed to study and perform
scenario analysis on the electric system. The assessment is intended to be basic and high‐level. A screen test will be helpful
for prioritizing the various scenarios to help identify credible contingencies and provide a better understanding of risks and
consequences.
86 “TransCanada files new application to expand Eastern Mainline system,” Inside FERC’s Gas Market Report, November 11, 2011, p. 23.

Chapter 8—Risk Assessment for Electric Reliability
NERC | 2013 Special Reliability Assessment: Accommodating an Increasing Dependence on Natural Gas for Electric Power | May 2013 82 of 114
This assessment would then become a basis for contingency planning for a loss of major gas supplies within the Region,
which might be similar to the pipeline break scenario, the key compressor station failure, or the cascading domino effect as
discussed in Chapter 4.
Chapter 4 describes one element of this Region‐specific planning effort that requires an assessment of all the pipelines in
the Region. That assessment includes gas loads being provided by each system to supply gas‐fired generators, as well as the
most vulnerable points for an unplanned interruption or curtailment of supply.
In addition, the tabulation of pipelines serving a Region could be used to establish a Region‐specific coordination and
notification of pipeline maintenance requirements with Regional PCs. Once this initial assessment of the Region’s pipelines
is complete, the electric industry should attempt to work with each of the pipelines within their Regions to structure a joint
assessment of the most vulnerable areas and the best set of contingency plans. One result of that effort might be the ability
to provide the electric coordinators with a better understanding of the capabilities and limitations of the transportation
systems that provide fuel services to their Regions, particularly during periods of stress. The latter could result in a
limitation of the amount of scheduled gas‐fired generation within a Region during periods likely to be of significant stress
(i.e., peak demand periods) or, alternatively, limitations on the amount of standby generation capacity that is gas‐fired.
Lastly, such a joint effort might be dependent on the disclosure of some proprietary information, which would inhibit the
overall process. However, if the overall process were developed only with a small, core group of electrical industry
representatives, this dilemma likely could be resolved. Another option would allow protected sharing of information with
nondisclosure agreements and FERC Standards of Conduct protections that the electric industry has experience with in
protecting proprietary information for the unregulated generation business.
Electric Transmission Electric transmission increases the BPS’s flexibility and resilience. If there is sufficient bulk power transmission, risks can be
managed by obtaining ancillary services and flexible resources from a larger generation base, such as through participation
in wider area balancing management. Transmission planning and operations techniques, including economic interarea
planning methods, should be used for such interarea transmission development to provide access to and sharing of flexible
resources.
When attempting to manage gas supply and transportation disruptions, entities should consider the benefits of electric
transmission. Common‐mode impacts to generators related to a single pipeline may be able to be managed by importing
more power to load pockets.
Flexibility Requirements The need for flexibility is a common theme among technical studies that address electric system impacts due to resource
mix changes. The strong growth in wind power and the lack of cost‐effective electric storage solutions indicates that power
systems will rely heavily on more flexible resources, such as gas turbines, to compensate for wind power variability. Even in
Regions with significant amounts of hydroelectric power (a better technology to compensate for wind power variability),
gas turbines will be required to back up wind power, because environmental regulations limit the minimum and maximum
amount of water a hydroelectric facility can release (termed “run‐of‐river” environmental constraints).
Power systems have many sources of flexibility that are currently needed to maintain the balance of supply and demand in
anticipation of potential changes in system conditions. These changes can be expected and planned. For example, when
morning load increases, it can require a dramatic and prompt increase in generation to follow load. The loss of a large
generating unit that requires fast‐ramping generation or load response to return the system to equilibrium can result in an
unexpected change in the supply‐and‐demand balance. These flexibility needs are known and are anticipated during the
planning process.
Chapter 8—Risk Assessment for Electric Reliability
NERC | 2013 Special Reliability Assessment: Accommodating an Increasing Dependence on Natural Gas for Electric Power | May 2013 83 of 114
While gas‐fired generation has typically been thought of as providing flexibility to the electric grid, absorbing the impacts
from gas interruptions and curtailments may also require flexibility. A number of characteristics must be considered when
identifying system needs for flexible resources. These can be grouped into three main areas:
Magnitude refers to the size of ramp events and their direction. Traditional reserve calculations sometimes
measure the requirements as the size of the first and second contingencies. Incremental flexibility is required at
times of facility outages and net load increases while decremental flexibility is required when net load decreases.
On the supply side, the magnitude is an indicator of the resources needed to respond to the ramp event.
Ramp Response refers to the rate of change of the net load or unit output and the predictability of net load or unit
output. The ramp rate of the resources must be sufficiently large to be available to respond to system ramping
needs. Large ramping events, which happen quickly, will require fast‐acting responsive resources, the
simultaneous movement of a larger number of slower acting resources, or both to meet the ramping needs of the
system. Slower acting ramps, such as seasonal variations, require less responsive resources. Resources that can
respond quickly would be labeled “highly responsive ramping resources,” while resources with slower response
times would be labeled “lower responsive ramping resources.”
Frequency refers to the number of times events of various magnitudes and responsiveness occur. Variable
resources generally increase the number of times flexible resources must be used in response to small or medium‐
sized events. This is usually a cost issue as resources incur an operating cost each time they are used to balance
supply and demand.
During extreme winter weather, electric system operators should maximize the availability of flexible resources and
understand how much flexibility is available at any given time. This can provide the system operator additional observability
of the system to maintain operational reliability. In response to gas disruptions, the electric system operator should be able
to identify vulnerable capacity, determine if reserve capacity is available, dispatch the appropriate resources, implement
any operating procedures, and minimize any impacts by maintaining the integrity of the system.
Confidential Information As discussed in the NERC Primer, the gas and electric industries in some Regions have historically shared significant
information; however, deregulation has resulted in almost every piece of information concerning operations now being
considered proprietary and confidential.87 Most of the industry has adopted this philosophy, and it presents a challenge for
coordinating between the two industries.
While it is a challenge to overcome the treatment of most confidential operating information, these challenges should not
be insurmountable. For example, a recent NERC‐wide effort to request how much electric capacity is backed by firm
transportation led to questions of market‐proprietary information. However, all pipelines post a list of firm transportation
and storage customers the first business day of each quarter. This posting, which is called an Index of Customers and is
required by the Natural Gas Act (NGA),88 includes the name of the shipper, the applicable rate schedule, the effective and
expiration dates of the contract, the maximum daily contract quantity (MDCQ), the receipt and delivery points, and other
information about whether the contract is arranged by an asset manager, whether there are any affiliate relationships, and
whether the contact is a negotiated rate.89
Costs There is no doubt that some gas transportation services are less expensive than others and that the most reliable gas
transportation services are usually the most expensive (e.g., no‐notice firm transportation). This basic relationship creates a
87 ISO‐NE Information Policy located at: http://www.iso‐ne.com/regulatory/tariff/attach_d/index.html 88 18 C.F.R. 284.13. 89This information is publicly available and you can download this information. For example, see Southern Natural Gas Company’s index of customers on its Informational Postings website: http://ixsnp.sonetpremier.com/EbbMasterPage/ebb.aspx
Chapter 8—Risk Assessment for Electric Reliability
NERC | 2013 Special Reliability Assessment: Accommodating an Increasing Dependence on Natural Gas for Electric Power | May 2013 84 of 114
significant tension between two almost equally important objectives within the power industry: (1) minimizing the overall
cost of electricity, and (2) providing the most reliable service possible in an industry that has very limited tolerances for
interruption.
Nevertheless, industries, regulators, and policymakers should work together to minimize this tension and accommodate the
unique services needed for BPS reliability. For peakers and low‐capacity‐factor gas‐fired units, firm transportation services
are not the only solution, but developing alternative forms of interruptible transportation services that can accommodate
the need for added reliability during periods of stress can effectively minimize the risk exposure to the BPS. Short‐haul
transportation alternatives that are starting to evolve within the industry may be part of the solution set. However, it is
important to recognize that while more flexible interruptible transportation services may provide some benefits, the service
is still interruptible. Consequently, it may not be available when firm capacity customers fully utilize their entitlement to
pipeline transportation. Most importantly, PCs and state regulators must understand the risk a generator is taking and
whether that risk is transferred with a compounding effect from multiple generators to the BPS. These risks must be made
clear to regulators and policy makers through assessments and planning studies (i.e., planning assumptions that do not take
into account potential fuel supply and transportation issues, may underestimate potential impacts and reserve
requirements).
With respect to the natural gas industry, it is likely that it will respond to these new challenges for the power industry and
develop new services tailored to meet generation requirements, load profiles, and reliability needs. Such adaptations are
likely to vary significantly between Regions. However, currently, the gas industry has seen low demand for tailored services
from the power industry due to the higher costs associated with them. The demand for tailored gas supply and
transportation contracts is likely to increase as the share of gas baseload generation increases.
Fossil-Fired Capacity Retirements An added perspective to this assessment is that about 70 GW of coal‐fired and oil‐fired capacity are projected to retire
within the next several years, with gas‐fired generation replacing much of this retired capacity. This change of fuel mix is a
key factor behind the growing dependence on natural gas.90 With respect to environmental regulations, an added layer of
uncertainty to future reliability results in regions where future pipeline capacity is expected to be constrained.91
Accommodating High Levels of Variable Generation Renewable generation—and, in particular, wind generation—has increased significantly over the last decade and will
continue to increase in the future. In order to reliably accomodate wind and other variable generation, it is necessary for an
electric system to have adequate backup sources of generation that can come on‐line quickly. While there are several
different methods of providing backup power that comes online rapidly, by far the dominant method is the gas‐fired
combustion turbine. As a result of gas‐fired generation’s ability to provide flexibility to the BPS, gas‐fired generation has
inherited an additional role within the power industry, and this role, which likely will be highly regional, will continue to
increase as wind generation continues to grow.
This added backup requirement to wind generation for gas power plants increases the complexity of gas supply and
transportation strategies for the power industry. In addition, it could have a significant impact on the pipeline segment of
the natural gas industry, as there is the potential for a domino effect. This domino effect is demonstrated by the following
example: (1) a sudden loss of wind generation as a result of a weather event could result in (2) the loss of an electric system
(i.e., rolling blackouts), which could result in (3) electric compressors for both pipelines and field gas compression being
forced offline, which could result in (4) a reduction in pipeline pressure, which could result in (5) gas‐fired units being forced
90 2012 Long‐Term Reliability Assessment: http://www.nerc.com/files/2012_LTRA_FINAL.pdf 91 Extraction from 2011 Long‐Term Reliability Assessment: Potential Impacts of Future Environmental Regulations: http://www.nerc.com/files/EPA%20Section.pdf

Chapter 8—Risk Assessment for Electric Reliability
NERC | 2013 Special Reliability Assessment: Accommodating an Increasing Dependence on Natural Gas for Electric Power | May 2013 85 of 114
offline. The possibility of both regional electric and gas industry reliability being dependent on sudden changes in wind
generation represents an evolving challenge for both industries.
Fuel Switching Historically switching from gas to oil was the most significant means of ensuring system reliability during periods when gas
supplies were either uneconomic or under stress; this capability, for the most part, was stripped when the power industry
transitioned from the less efficient steam generator technology to the more efficient combined‐cycle technology. One
attribute of the older steam generator technology was that many of them were designed to be dual‐fuel units, which could
switch to oil during periods of stress. However, when the industry converted to the combined‐cycle units, the vast majority
of them were built to be gas‐only units,92 as they could not secure permits at the time to be dual‐fuel capable because of
environmental pressure to minimize air emissions.
Economic gas‐to‐oil fuel switching likely is a phenomenon of the past. However, due to the price parity relationship
between natural gas and fuel oil, gas‐to‐oil fuel switching to enhance overall system reliability likely represents the
preeminent means of maintaining system reliability when gas supplies to gas‐fired power units are constrained or
interrupted. One of the key attributes of the gas‐to‐oil fuel switching is that it can be done rather quickly for a properly
designed dual‐fuel unit. Fast fuel switching is associated with some additional costs, including the installation of dual‐fuel
burners, on‐site liquid storage tanks, testing, and monitoring and maintaining viable fuel oil supplies.
However, as a result of the country’s de facto zero tolerance policy for incremental air emissions, the power industry, for
the most part, has been stripped of this capability to fuel switch. The limited number of combined‐cycle units with permits
that allow dual‐fuel capability could affect system reliability in certain situations.
Because of the concern to preserve the reliability of the electric system during periods of significant stress, it could be
beneficial if the electric industry approached both federal and state regulators with a plan that would allow or increase fuel
switching. Such a plan should contain key elements that include the following:
Fuel Switching: an explanation of how gas‐to‐oil fuel switching works, how long it takes to switch a unit’s fuel
(some Regions are capable of doing so in minutes), and the added costs and inherent risks.
Dual‐Fuel Capabilities: GOs should be responsible for the data and information sharing related to each
generator’s functional dual‐fuel capabilities.
Mitigation: RCs and PCs should be responsible for establishing the system‐wide reliability plans for minimizing
BPS impacts due to lack of fuel‐related forced outages. A detailed description and plan is needed, along with
examples of how fuel switching can be used to maintain system reliability and how the added time provided
by fuel switching to allow electric system operators to take other actions (e.g., bring online other units).
Identification of Gas Supply and Transportation Risks: An assessment of regional pipeline infrastructure and
the potential risks of both gas interruptions and curtailments should be performed. For a variety of reasons
(including acts of nature, gas supply and transportation arrangements, and other extreme conditions), outages
of gas‐fired generation due to lack of fuel do occur. Statistic probabilities can be evaluated to determine what
the true risks (likelihood and impact) of gas supply and transportation interruption and curtailments are to
electric system reliability (three‐layer approach).
Resource and Contingency Analysis: RCs and PCs should be responsible for the risk analysis as well as
integrating these risks into resource and contingency planning. These entities should study the effects of
different gas supply and pipeline contingencies and dual‐fuel requirements that may provide system operators
the needed flexibility to maintain reliability during extreme events.
92 From 1998 to 2005 there was a building boom for new gas‐fired combined‐cycle capacity, as approximately 150 GW were brought online during this period. In addition, another 75 GW of simple‐cycle capacity (i.e., peakers) was brought online. See Chapter 4 of NERC’s A Primer on the Natural Gas Industry and its Interface with the Electric Power Industry, 2011.

Chapter 8—Risk Assessment for Electric Reliability
NERC | 2013 Special Reliability Assessment: Accommodating an Increasing Dependence on Natural Gas for Electric Power | May 2013 86 of 114
Case examples that illustrate how the system reliability of both industries can be affected in periods of stress and the joint
advancement of such plans could result in a new regulatory framework that would resolve many of the key issues assessed
in this report. In wholesale market areas, consideration should be given to the development of a market product that offers
incentives for peaking units with dual‐fuel capability. This product could include requirements around fuel reserves and fuel
switch testing.
Lastly, if successful, the power industry would need to take extra steps to ensure sufficient dual‐fuel capability within a
given system, and formal procedures are in place to demonstrate that dual‐fuel capability is fully functional (through audits)
even under severe weather conditions. GOs should provide dual‐fuel considerations to RCs and PCs that may include:
Inventory Assessment: Hours of fuel burned kept on site. This may also include contracts with suppliers to
deliver fuel to the generator site.
Mitigation Plans: Detailed plans on how the generator expects to run (or not) in the event of a fuel supply
disruption.
Response Capability: Description of the unit’s ability to switch over in a timely period, as well as results from
tests performed within an appropriate time period (e.g., capability audits within the past year).
Ratings: Unit rating when fired by an alternate fuel source.
Limitations: A description of other limitations that may affect the performance of the unit, including but not
limited to local, state, and federal environmental regulations, (inter)dependencies on other units located at
the same power plant facility, etc. GOs should also provide any difference in performance characteristics and
the unit’s ability to provide real and reactive power to the transmission that differs from the unit’s
performance when fired by its primary fuel source under normal conditions.

NERC | 2013 Special Reliability Assessment: Accommodating an Increasing Dependence on Natural Gas for Electric Power | May 2013 87 of 114
Chapter 9—Key Findings and Recommendations The combination of growth in natural gas demand within the electricity sector and its changing status among the gas‐
consuming sectors has significantly increased the interdependencies between the gas and electric industries. As a result,
the interface between the two industries has become the focus of industry discussions and policy considerations. In its
effort to maintain and improve the reliability of North America’s BPS, NERC examined this issue in detail, as outlined in the
report, and has developed several recommendations for the power industry. These recommendations could improve the
existing coordination between the gas and electricity sector and foster enhancements in planning and operations. NERC has
approached this issue solely from a reliability point of view and has not examined the potential solutions available through
various market mechanisms.
Regionality In light of the unique characteristics of each region, which significantly impacts the interdependency between the two
industries, integrated assessments should be fine‐tuned to what is applicable to each region. For example, some regions
have adequate levels of natural gas storage that can be relied on during emergency conditions, while others, such as parts
of the Southwest and the Northeast, do not. As a result, more regional gas storage could be developed.
Also, each region may develop different approaches for interacting with critical third parties (e.g., regulatory bodies) on
endorsing new procedures and approaches in order to preclude the loss of system reliability during periods of extreme
stress. These new procedures and approaches might include new definitions of essential gas loads (e.g., beyond human
needs) and greater discretion on granting emissions waivers during emergency conditions (e.g., the use of fuel switching to
preclude rolling blackouts), among other things.
For regions with limited gas‐fired generation, such an effort at present may require long‐term planning solutions to manage
future conditions that could result in the loss of system reliability. Other regions might focus on historical events and, based
on these events, develop specific action plans to minimize the potential loss of system reliability in the future.
Key Findings and Recommendations NERC’s key findings in this report are categorized into two planning and operating timeframes: Long‐ and Short‐Term
Planning and Operational Planning and Operations. The recommendations presented below are intended to provide a
platform for further technical and policy input.
Long‐ and Short‐Term Planning Findings
•Reliability assessment and resource adequacy studies
•Gas supply and fuel security
•Transportation expectations
•Generator availability
•Back‐up fuel and fuel‐switching capabilities
Operational Planning and Operations Findings
•Seasonal and day‐ahead observability
•Coordinated operational procedures
•Coordinated outage schedules
•Increasing flexibility
•Information sharing and situation awareness
•Emergency operating procedures

Chapter 9—Key Findings and Recommendations
NERC | 2013 Special Reliability Assessment: Accommodating an Increasing Dependence on Natural Gas for Electric Power | May 2013 88 of 114
Long- and Short-Term Planning Summary Key Finding: Risk‐based approaches are needed to study the impact and regional challenges associated with an
increasing dependence on natural gas.
The power sector’s growing reliance on natural gas has raised concerns by ISOs, RTOs, market participants, national and
regional regulatory bodies and other government officials regarding the ability to maintain electric system reliability when
natural gas supplies to power generators are constrained. The extent of these concerns varies from region to region;
however, concerns are most acute in areas where power generators rely on interruptible gas pipeline transportation and
where the growth in gas use for power generation is growing the fastest. Because it typically takes three to four years to
build pipeline infrastructure, solution sets that call for increased pipeline capacity must be developed as quickly as possible
so the electric industry is well postured to manage the regional challenges and emerging risks associated with an increasing
dependence on natural gas.
Recommendations:
Implement advanced modeling and analysis approaches. NERC recommends the Three‐Layer approach or
similar advanced probabilistic techniques.
Enhance the NERC Generator Availability Data System (GADS) to increase the effectiveness of trending
gas‐fired generator outages and causes related to fuel issues.
Key Finding: Enhancements to reliability and resource assessments should reflect risks to gas‐fired generation as a result
of various fuel disruptions.
Natural gas is a reliable fuel source that is expected to fire electric generation serving more than 50 percent of the electric
peak demand in North America by 2015. However, because natural gas is largely delivered on a just‐in‐time basis,
vulnerabilities in gas supply and transportation from a planning perspective must be sufficiently evaluated to inform BPS
operators about credible contingencies and flexibility options. Resource planning and adequacy assessments in some areas
do not fully account for the risk of disruptions in the natural gas and other fuel supply chains.
For example, electric system impacts due to a single point of failure within the natural gas fuel supply chain can impact
electric generators downstream from the disruption. Impacts of potential wide‐spread common‐mode failure events, such
as a major failure along an interstate gas pipeline or major supply source, although rare, must be well understood to foster
enhanced planning and design insights.
Pipelines are able to operate with temporary supply disruptions, provided the gas pressures are maintained within
acceptable limits. However, within a relatively short time, a major failure could result in a loss of electric generating
capacity that could exceed the electric reserves available to compensate for these losses. The likelihood of pipeline failures
occurring during electric peak periods, however, is extremely low.
By integrating these risks into planning studies, potential generator outages due to natural gas interruptions and
curtailments can be better understood. Through rigorous analysis, vulnerabilities can be identified in the planning stages (1
to 10 years) and risks can effectively be minimized. These studies provide the foundation for state, federal, and provincial
regulators, policymakers, and system planners to implement changes and send accurate signals to the electricity market for
future needs of the bulk power system. Additionally, these studies allow for solution sets to be measurable and achievable.
Recommendations:
Incorporate natural gas fuel availability or natural gas‐fired generation availability into the NERC Long‐
Term Reliability Assessment and Seasonal Reliability Assessments.

Chapter 9—Key Findings and Recommendations
NERC | 2013 Special Reliability Assessment: Accommodating an Increasing Dependence on Natural Gas for Electric Power | May 2013 89 of 114
Identify how risk assessments are performed in different regions and use this information to develop
recommendations for a uniform seasonal and long‐term reliability assessment process for consideration
by NERC Planning Committee.
Improve Generator Owner procedures and methods to maintain fuel switching capabilities.
Enhancements to market products supporting higher levels of fuel certainty should be considered (i.e.,
adequate level of fuel inventories and functional capability testing and/or firm natural gas transportation).
NERC should support further studies for enhancing planning processes that relate to fuel availability and
resource adequacy.
Key Finding: Regional solutions will likely include a mix of mitigating strategies, increased gas and/or electric
infrastructure, and dual or back‐up fuel capability.
Dual‐fuel capabilities and a variety of storage options may help bridge the gap between the uncertainties of gas availability
during extreme events and maintaining a reliable source of operable capacity available to meet seasonal peak demands.
Based on the reserve margin scenario assessments performed as part of this report’s efforts, many of the NERC assessment
areas have sufficient reserve margins to mitigate the loss of a significant portion of their gas‐fired generation.
Electric transmission increases the bulk power system’s flexibility and resilience to various disruptions. Efforts to manage
gas supply and transportation disruptions should consider the benefits of electric transmission.
Although generators may have contractual obligations to perform, performance incentives, particularly in competitive
wholesale electricity markets, may not be strong enough to incentivize generators to procure firm or otherwise reliable fuel
supplies (natural gas supply and transportation, oil, or other mitigating strategies).
Risks to gas supply shortages can largely be mitigated or reduced with the abundance and geographic diversification of
shale plays across North America. With unconventional shale gas production spread across the continent, vulnerabilities in
gas supply due to weather events can be mitigated or reduced by increasing production in unaffected areas.
Recommendations:
Policymakers and regulators should consider developing solutions that provide the right balance between
electric reliability and the increased costs associated with it.
Key Finding: Enhancements to data sharing and planning coordination can provide insights through additional studies
and scenario analysis.
There is no compiled statistical data on gas system outages that would be the equivalent to NERC GADS databases.
Therefore, outage data would have to be estimated from various surrogate sources, including pipeline bulletin board
notices, accident reports filed with government agencies, surveys of pipeline and distribution companies in the study
region, and maintenance and repair information from equipment manufacturers and service companies. This type of
information is important for complex analyses that rely on past performance to achieve an acceptable level of prediction
and certainty. Increased coordination and information exchange for planning purposes could aid in developing confidence
around a distribution of potential scenarios.
Recommendations:
Work jointly with the natural gas industry to identify data requirements that can be used for electric
reliability analysis.
Planning Coordinators and/or Reliability Coordinators should identify critical gas‐fired electric generation
to ensure “critical generators” have the ability to mitigate or reduce the risks associated with fuel
disruptions and curtailments.

Chapter 9—Key Findings and Recommendations
NERC | 2013 Special Reliability Assessment: Accommodating an Increasing Dependence on Natural Gas for Electric Power | May 2013 90 of 114
Operations and Operational Planning Key Finding: Sharing information for operational planning purposes is essential to fully understanding generator
availability risks in the season ahead.
While Generator Owners are generally able to schedule and secure gas during the summer to meet seasonal peak demand,
this flexibility decreases during winter months when pipeline use tend to peak and firm transportation customers have
scheduled their full entitlements. Cold weather can also be responsible for increased infrastructure and supply disruptions,
which are generally caused by freezing. Risks to gas wellheads, generators, and pipeline infrastructure due to freezing can
expose the electric industry to significant capacity shortages. While firm gas transportation significantly decreases the
likelihood that fuel delivery will be curtailed, extreme events, such as wellhead freeze‐offs causing decreased gas
production (a force majeure event), could potentially lead to common‐mode failures of a significant amount of gas‐fired
generators. The expected increases in gas‐fired generation on the BPS will increase the amount of operational uncertainty
that the system operator must factor into operating decisions.
Recommendations:
Increased situation awareness of the natural gas supply and pipeline system enhances the electric system
operator’s ability to make risk‐informed decisions.
In preparation for summer and winter extreme conditions, electric system operators need enhanced
observability of pipeline conditions, capacity availability, supply concerns, and potential issues affecting
fuel for gas‐fired generation.
Key Finding: Formalized communication and coordination with the gas pipeline and supply industry during extreme
events is needed.
Information on daily fuel supply adequacy and less probable contingencies on the gas pipeline or compressor stations which
could result in loss of multiple gas‐fired units should be provided to electric system operators with as much notice as
possible.
Both industries have stated that there are sufficient coordination practices at this time and enhancements planned for the
future. Based on these practices, operational procedures should include formalized coordination with the gas supply and
pipeline industry, as well as emergency procedures during extreme events. Timely information sharing is most important
when natural gas suppliers and pipeline operators can determine that a potential shortages or interruptions may occur due
to usage and transportation outages.
Recommendations:
System operators should re‐examine interindustry communication protocols that apply during periods of
stress
Key Finding: System operators will need access to sufficient flexible resources to mitigate the added uncertainty
associated with natural gas fuel risks, including those introduced by interruptible gas transportation service.
Operating criteria, forecasting, commitment, scheduling, dispatch and balancing practices, procedures and tools should
consider fuel risks and risk mitigation measures to assist operators in maintaining bulk power system reliability. Enhanced
operator training should be considered in light of the increasing need for electric and pipeline operator communication and
coordination. Training crosses a number of areas, some of which are specific to each industry, while others likely represent
interindustry efforts.
A projection of flexibility can also provide additional observability to the system operator in order to maintain operational
reliability; however, this can only be made with enhanced coordination with gas‐fired generators and the natural gas
pipeline operators. In response to gas disruptions, electric system operators should be able to identify vulnerable capacity,

Chapter 9—Key Findings and Recommendations
NERC | 2013 Special Reliability Assessment: Accommodating an Increasing Dependence on Natural Gas for Electric Power | May 2013 91 of 114
determine if reserve capacity is available, dispatch the appropriate resources, implement any operating procedures, and
minimize any impacts caused by fuel disruptions.
Recommendations:
NERC should leverage its stakeholder groups to identify best practices in areas currently most vulnerable
to gas dependency risks and taking immediate actions for improvement, such as New England. Such an
effort could lead to insights for enhanced operator training and table‐top exercises.
Joint industry drills or table‐top exercises with the key players of both gas, electric, and various state
commissions would foster enhanced coordination and harmonize cross‐industry issues, response plans,
and mitigation measures.
Further Detail on Recommendations Recommendations to Address Long- and Short-Term Planning Risks
Lead Recommendation
NERC GADS Working Group
Review the fuel supply‐related outage data gathered in the GADS system and determine whether the
adequacy and usefulness of the data could be improved to better serve the purposes of fuel supply
analyses. The primary need would be to develop an estimate of generating unit rates excluding fuel
availability issues (to avoid double counting). The second purpose would be to estimate the degree to
which lack of fuel has added to generating unit unavailability in the recent past. Clear definitions for fuel
related outages should include a distinction between those outages caused by supply or transportation
interruptions and those caused by curtailment events.
NERC RAS
Incorporate natural gas fuel availability or natural gas‐fired generation availability into the Long‐Term
Reliability Assessment and Seasonal Reliability Assessments. The RAS should develop a framework and
method to integrate these considerations into future long‐term reliability resource adequacy projections.
NERC and
Planning Coordinators
Modify the recommended Three‐Layer methodology framework—based on feedback from NERC
stakeholders. NERC can leverage stakeholder groups to identify how risk assessments are performed in
different regions and use this information to support an overall strategy for incorporating these methods
into a consistent assessment process. This could be done by supporting data gathering efforts with gas
industry, developing modeling algorithms (e.g., synthetic weather probability generators), cosponsoring
regional case studies, holding workshops, and collaborating on reliability assessment enhancements.
Generator Owners
Improvements to procedures and methods to maintain fuel switching capabilities and improving the
reliability of such capability are needed. In wholesale market areas, enhancements to market products
could be considered to support higher levels of fuel certainty (i.e., adequate level of fuel inventories and
functional capability testing and/or firm natural gas transportation).
Generator Owners and
State, Federal, and Provincial Regulators
Discretionary emission waivers may be needed to obtain authorization and endorsement from third‐
parties to allow some discretion for dual‐fuel gas‐fired generators during periods of stress. Coordination
between Generator Owners and state and federal environmental and electricity regulators may be
needed to facilitate these waiver provisions if necessary.

Chapter 9—Key Findings and Recommendations
NERC | 2013 Special Reliability Assessment: Accommodating an Increasing Dependence on Natural Gas for Electric Power | May 2013 92 of 114
Electric and
Gas Industry
State,
Federal, and
Provincial
Regulators
Consider developing a new category of “essential [natural gas] loads” for “critical generators” and
appropriate cross industry procedures. Planning Coordinators and/or Reliability Coordinators should
identify critical gas‐fired electric generation to ensure “critical generators” have the ability to mitigate or
reduce the risks associated with fuel disruptions and curtailments. These “critical generators” could be
identified and shared with regulators and the gas pipeline industry to be considered as part of emergency
operating procedures.
NERC Support further studies for enhancing planning processes that relate to fuel availability and resource
adequacy. This effort could help identify enhancements to current practices. NERC should also evaluate
best practices that are already offered through existing market practices and generator mitigation
strategies. Furthermore, an evaluation of the reliability assessment process is needed to capture industry
progress.
NERC
Planning
Committee
and
Reliability
Issues
Steering
Committee
(RISC)
NERC should take the lead in tabulating an overall set of observations, insights and recommendations on
this topic and prioritize actions that should be taken by the electricity sector. Further, the advisory
committee could identify where interaction and coordination with natural gas associations as well as with
federal, state, and provincial regulators to foster and implement steps to maintain bulk power system
reliability. Once completed with this initial effort, the same NERC advisory committee could then actively
facilitate the formation of a series of regional subcommittees that revise and tailor the points outlined in
the initial national level committee to the unique attributes of individual regions. Some of these regional
groups already exist. In these cases, a liaison should be identified to coordinate regional and NERC‐wide
initiatives.
Recommendations to Address Operational Planning and Operations Risks
Lead Recommendations
Joint Gas and Electric Industry
While FERC Order 698 establishes the communication protocols between the interstate pipelines and the
power industry (i.e., system operators, transmission owners and transmission operators), it would be
useful for each region to re‐examine their interindustry communication protocols that apply during
periods of stress and during normal operations within either industry to (1) ensure these protocols are
functioning properly; (2) assess whether they need to be updated in light of more recent incidents and (3)
decide whether the same protocols should be used for both emergency and normal operations to ensure
consistency and reliability. Undoubtedly this re‐examination of the best means of achieving interindustry
communication, particularly during periods of stress, will result in an assessment of the proper means, if
any, of transferring proprietary information.
Joint Gas and Electric Industry
RCs, BAs, TOPs, and PCs should work to increase their understanding of the Order 587‐V information and
be able to incorporate it into their hourly and real‐time operations. The ability to interpret the
informational postings is critical for the reliability of the BPS and the electric industry should be able to
take advantage of the information made available.

Chapter 9—Key Findings and Recommendations
NERC | 2013 Special Reliability Assessment: Accommodating an Increasing Dependence on Natural Gas for Electric Power | May 2013 93 of 114
Joint Gas and Electric Industry
The electric industry should assess essential loads, which would allow for maintaining critical components
for both gas and electric loads in the event of rotating outages. These critical components (e.g., electric
compressors and/or gas‐fired generator units), in most instances, represent the core of the interdepen‐
dency of the two industries, and would need to be identified at the regional level. In addition to manual
load shed plans, electric system planners and operators should avoid critical gas component loads in
UVLS/UFLS schemes and identify them as priority loads in restoration plans.
Electric System
Operators
System operators will need access to sufficient flexible resources to mitigate the added uncertainty
associated with natural gas fuel risks, including those introduced by interruptible gas transportation
service. NERC recommends that operating criteria, forecasting, commitment, scheduling, dispatch and
balancing practices, procedures and tools must be enhanced to assist operators in maintaining bulk
power system reliability.
NERC and Gas and Electric System
Operators
Enhanced operator training should be considered in light of the increasing need for electric and pipeline
operator communication and coordination. Training crosses a number of areas, some of which are
specific to each industry, while others likely represent interindustry efforts. Additionally, NERC should
leverage its stakeholder groups to identify best practices in areas currently most vulnerable to gas
dependency risks and taking immediate actions for improvement, such as New England. Such an effort
could lead to insights for enhanced operator training and table‐top exercises. Joint industry drills or table‐
top exercises with the key players of both gas, electric, and various state commissions would foster
enhanced coordination and harmonize cross‐industry issues, response plans, and mitigation measures.
Balancing Authorities
and Reliability
Coordinators
During extreme winter weather, electric system operators should maximize the availability of flexible
resources and understand how much flexibility is available at any given time—particularly gas‐fired
generation as it relates to potential fuel interruptions and oil‐fired backup capability. A projection of
flexibility can also provide additional observability to the system operator in order to maintain
operational reliability; however, this can only be made with enhanced coordination with gas‐fired
generators and the natural gas pipeline operators. In response to gas disruptions, electric system
operators should be able to identify vulnerable capacity, determine if reserve capacity is available,
dispatch the appropriate resources, implement any operating procedures, and minimize any impacts
caused by fuel disruptions.
Next Steps NERC suggests that an action plan be developed by a joint NERC Planning and Operating Committee subgroup to determine
what activities should be pursued by NERC and the technical committees and identify a timeline for its completion.
Observations and action plans for both the North American‐wide and ongoing regional efforts could identify approaches
where coordinated interindustry activities could provide enhanced system reliability and improved efficiency beyond that
attainable by each industry and Region as a separate entity. This report will be submitted to the Reliability Issues Steering
Committee (RISC) to provide additional guidance and prioritization of future technical committee work plans.
NERC | 2013 Special Reliability Assessment: Accommodating an Increasing Dependence on Natural Gas for Electric Power | May 2013 94 of 114
Appendix I: Consolidation of Reports and Studies With the steady growth in the interdependency of the electric and natural gas industries, there have been a number of
studies and reports published on how the coordination between the two industries can be enhanced. As a first step to (1)
further enhancing the coordination between the two industries and (2) reducing the vulnerabilities of the electric industry
to this growing interdependency, a thorough review and tabulation of the observations, insights, and recommendations of
these historical reports should be completed.
As an aid to completing this critical first step, this chapter identifies several of the major historical reports on the topic and
briefly summarizes their major findings and recommendations. This diverse group of historical reports covers nearly every
aspect of the complex issue of interindustry coordination and barriers to accomplishing such coordination. Among the
issues identified are (a) limitations on fuel switching, (b) limitations caused by environmental restrictions, (c) the
vulnerabilities of each industry to the other, (d) the need for adequate incentives to preclude the loss of system reliability,
(e) the importance of working with third parties to ensure system reliability, and (f) other elements. Also cited in several
historical assessments is the need for interindustry coordination at the regional level, as there is no universal solution to
this complex issue, particularly in light of the unique characteristics of each region. Additionally, considering the great
changes that shale gas is having on both the gas and electric sector, many older reports need to be reexamined through the
lens of the new gas paradigm—particulary as they relate to natural gas supply and disruptions of supply in the Gulf of
Mexico.
NERC, along with representatives of the various segments of the natural gas industry, should take the lead on developing an
integrated assessment of the observations, insights, and recommendations of prior reports and expected reports on the
topic. Specific areas of concern for this integrated assessment are highlighted. Finally, it is suggested that a series of
regional groups be formed to fine‐tune this initial integrated, or composite, assessment to the specific characteristics of the
region, as the composite observation will not be universally applicable to each region. It is likely that this regional
mechanism will result in identifying approaches where coordinated interindustry activities could provide enhanced system
reliability and improved efficiency beyond that attainable by each industry as a separate entity.
Past Coordination Efforts In light of this increasing interdependence of the two industries, there is a heightened need to increase coordination
between the two industries in order to facilitate the various interface issues between gas and power and thus, minimize the
risks of significant problems within either industry.
In large part this increased level of coordination can build upon historical efforts to facilitate coordination between the
industries. The following points are included in past coordination efforts:
Ad Hoc Industry Groups: A few ad hoc industry groups were among the earlier efforts to focus on the need for coordination
between the two industries. These groups explored and made recommendations for increased coordination between the
two industries, primarily at the regional level, and some of these recommendations were implemented. Probably the most
notable of these was the regional effort within New England to promote increased gas–electric coordination.93 At least one
other regional group and a national group were functional for a period of time.
Reports: Over the last decade a number of reports have highlighted the need for increased coordination between the two
industries, particularly at this regional level. While it is not practical to note all of these reports, the themes contained
within them are relatively similar, and the reports usually highlighted periods when either or both industries were under
93 See EPRI, Natural Gas and Electric Industry Coordination in New England (TR‐102948), November 1993 for a summary of the two year effort by this New England coordination group and New England’s Electric‐Gas Operations Committee (EGOC) of which information can be found at: http://www.iso‐ne.com/committees/comm_wkgrps/othr/egoc/index.html

Appendix I: Consolidation of Reports and Studies
NERC | 2013 Special Reliability Assessment: Accommodating an Increasing Dependence on Natural Gas for Electric Power | May 2013 95 of 114
stress. Also, New England and ERCOT tend to be referenced most often. The combination of New England’s (1) distance
from the main source of U.S. gas supplies (i.e., the Gulf), (2) potential for severe winter weather, (3) rapid growth in
regional gas demand (which has taxed its regional infrastructure), and (4) lack of regional gas storage has contributed to
increasing risks. With respect to ERCOT, the concern historically has been the curtailment of gas supplies due to well freeze‐
offs.94 ERCOT has its own regional Emergency Electric Curtailment Plan to maintain reliability in the event of natural gas
curtailments. Both of these regions have been highlighted in NERC’s Winter Assessment Reports.95
Within New England, the January 14–16, 2004 severe cold snap (coldest in 20 years) significantly stressed both the region’s
gas and electric industries. While there were neither curtailments of firm transportation service nor regional loss of electric
power, some power plants (i.e., in particular merchant suppliers)lost interruptible gas supplies (by design) and gas prices
were both high (> $50.00 per MMBtu) and very volatile. More importantly, the incident highlighted the vulnerability of the
gas‐electric interface within the region and resulted in an extensive assessment of the incident and the regional interface
between the two industries.96 Recommendations and observations contained in the report of this incident noted (1) a lack
of understanding of and coordination with the gas industry; (2) the need to coordinate timing to allow maximum utilization
of gas infrastructure; (3) the need to provide incentives and signals to ensure electric unit availability; and (4) the need to
establish a regional dialogue about barriers to dual‐fuel capability. Subsequent reports have highlighted how the gas and
electric infrastructure within the region can be stressed under unusual weather conditions and the need for both industries
to continually monitor the adequacy of regional infrastructure.97
Within the power industry, NERC’s 2004 NERC Gas/Electric Interdependencies and Recommendations report98 formalized
the need to improve the gas–electric interface. Among the observations in this report was (1) that either industry can
impact the reliability of the other, (2) a lack of understanding of each other’s businesses by pipeline and system operators
and lack of communications between them, (3) substantial differences in planning and system expansion between the two
industries, (4) the stringent fuel delivery and fuel requirements for combustion turbines can be a challenge for the gas
industry, and (5) firm transportation service is not a viable alternative for peaking facilities.
These observations became the basis for a series of recommendations to increase the joint reliability of the two industries.
Included in these were recommendations for individual NERC regions to increase their awareness and monitoring of gas
transportation infrastructures, including planned and unplanned pipeline outages, contingency planning related to gas
infrastructure, and the establishment of electric unit reliability standards for gas transportation. NERC also recommended
increased communications between pipeline(s) and system operators, as well as at other levels within the two industries.
FERC Order 698: Historical reports and other industry examinations of the critical interface between the two industries
were important precursors to FERC Order 698, which was issued in 2007. Included in other industry examinations were (1)
the DOE Primer, (2) the NRRI Primer, and (3) a report by the NAESB. The latter, in particular, presented detailed
recommendations and analyses concerning natural gas transmission tariffs and services that affected the day‐to‐day
interface between the gas and power industries, as well as other gas consumers. While a complete summary of FERC Order
698 is beyond the scope of this report, this FERC order set out a number of standards that facilitated and clarified the
interaction between the two industries in an effort to improve the communications, operations, and reliability of both.
The most significant element of FERC Order 698 was the establishment of communication protocols between interstate
pipelines and power operators and TOs and TOPs. Included in these protocols were the rapid notifications by the gas
94 See Appendix A of NERC’s A Primer on the Natural Gas Industry and its Interface with the Electric Power Industry, 2011 for a discussion of historical incidents within ERCOT.
95 See NERC 2003/04, 2004/05, and 2012/13 Winter Reliability Assessments 96 See ISO New England, Interim Report on Electricity Supply Conditions in New England During the January 14‐16, 2004 “Cold Snap”, May 10, 2004.
97 See Analysis Group, New England Energy Infrastructure‐Adequacy Assessment and Policy Review, November 2005. 98 See NERC Gas/Electric Interdependencies and Recommendations, June 15, 2004.

Appendix I: Consolidation of Reports and Studies
NERC | 2013 Special Reliability Assessment: Accommodating an Increasing Dependence on Natural Gas for Electric Power | May 2013 96 of 114
industry to the power industry of Operational Flow Orders (OFOs) and Critical Balancing Alerts for their transportation
systems and, similarly, the power industry’s rapid notification to the gas industry of Energy Emergency Alerts.
Other standards included in the FERC order were (1) a requirement to establish new transportation services, such as load‐
following services, (2) a requirement for pipelines to establish formulas for ratable takes, (3) reaffirmation of within‐the‐
path scheduling adopted by FERC Order 637, (4) a requirement to increase the certainty of interruptible transportation,
particularly with respect to eliminating bumping by firm last intraday nominations, and (5) a requirement for increased
communications in changes to hourly flow rates and efforts to resolve such changes. A key result of FERC Order 698 was the
eventual revision to individual pipeline tariffs to incorporate the improved requirements, which took some time to fully
implement.
FERC Order 698, as well as all the assessments preceding it, represents a significant effort to define and clarify many of the
communications, procedures, and standards for gas transportation services. As a result of this order, the interface between
the two industries is more clearly defined, as are the boundaries and operating parameters for both industries. This
increased communication and definition of parameters, while resulting in increased costs in some cases,99 boosts the
reliability of both industries. Nevertheless, the two industries need to continue to strive to increase their coordination,
particularly in times of stress, as each industry can still impact the reliability of the other.
Recent Reports, Studies, and Industry Activities Over the past couple of years, the subject of the interdependency of gas and electric service reliability has intensified in
many forums. As the amount and dispatch of gas‐fired generation increases, the interaction between the electric grid and
the gas network can be stressed. These stresses have highlighted both the similarities and differences in the structure,
operation, business practices, and communications between the two industries.
Recognizing the need for sound integration of natural gas and electricity markets, FERC held technical conferences on
coordination between natural gas and electricity markets around the United States in August 2012. The conferences
covered issues such as coordination and information sharing, scheduling, market structures, and reliability concerns. These
issues are a reflection of a request for comment from industry participants on pressing issues that concern gas and power
integration. Many participants also asserted that issues differ considerably by region. In recent years, a number of studies
have attempted to assess the gas–electric reliability issues.
Other entities also have published reports concerning the interface between the natural gas and electric industries. These
more recent reports by FERC, NERC, ISO New England Inc., and the Interstate Natural Gas Association of America (INGAA)
Foundation, in general, also focus on the need for increased coordination between the two industries. They make similar
observations to those made in the earlier EPRI reports. Key observations, recommendations, and conclusions from these
reports are noted below.
99 A significant area of increased costs for the power industry was the eventual implementation of significant penalties in the event the strict provisions for some transmission services were not followed (e.g., exceeding nominated loads or contracted capacity).

Appendix I: Consolidation of Reports and Studies
Table 8: Summary of Major Gas–Electric Integration and Disruption Contingency Studies
Study Study Summary
ERCOT – Black & Veatch100
Black & Veatch consulting group conducted a study on behalf of the Energy Reliability
Council of Texas (ERCOT) that included a number of gas curtailment scenarios to assess
areas of improvement in gas interruption for power generation. The study found that
freezing weather is the most common gas curtailment incident. It follows that gas
curtailment would not be primarily caused by normal load requirements in the winter
season since ERCOT is a summer peaking region. An important study observation is that the
majority of ERCOT generators reported interconnects with multiple pipelines allowing them
access to pipeline capacity in excess of their peak needs and thus reducing the probability
of gas supply shortages to those generators.
FERC and NERC101
FERC and NERC collaborated on a report summarizing the outages/curtailments that
occurred during the cold weather event in early February 2011 in the U.S. Southwest. The
study found that ERCOT’s fast actions initiating rolling blackouts prevented more
widespread and unanticipated blackouts, transmission operations generally did not identify
natural gas facilities as critical loads, and reliability coordinators did not understand the
temperature design limits of plants (and thus did not recognize the loss in generation when
temperatures dropped). The study also found that the lack of winterization of power plants
impacted loss of load, while generators were generally reactive in making such
preparations.
INGAA/U.S. DOE – ICF102
ICF International conducted a series of studies for both INGAA and DOE focused on
quantifying: 1) the amount of pipeline capacity loss that can be absorbed by “economic
reallocation” of remaining gas supplies in the gas market; and 2) the amount of additional
capacity outage that can be accommodated by shedding all but “essential human needs”
gas load under emergency conditions. To address the first item, ICF used the GMM and
DGLM to look at pipeline outages under a variety of weather scenarios. To address the
second item, ICF surveyed LDCs to determine the amount of nonessential gas load that
could be shed. Regions studied include New England, Mid‐Atlantic, South Atlantic, Midwest,
100 Black & Veatch. “Gas Curtailment Risk Study.” The Electric Reliability Council of Texas (ERCOT), March 2012: Dallas, TX. Available at: http://www.ercot.com/content/news/presentations/2012/BV%20ERCOT%20Gas%20Study%20Report%20March%202012.pdf
101 Federal Energy Regulatory Commission (FERC) and North American Electric Reliability Corporation (NERC). “Report on Outages and Curtailments during the Southwest Cold Weather Event of February 1‐5, 2011.” FERC and NERC, August 2011: Washington, D.C. Available at: http://www.ferc.gov/legal/staff‐reports/08‐16‐11‐report.pdf
102 ICF International. “Natural Gas Pipeline Security Study for the Northeast U.S.” The Interstate Natural Gas Association of America (INGAA) Foundation, February 2003: Washington, D.C.
ICF International. “Analysis of the Ability of Regional Natural Gas Markets to Withstand Loss of Pipeline Capacity.” U.S. Department of Energy, December 2003: Washington, D.C.
ICF International. “Natural Gas Pipeline Security Study for Western Region and the Florida.” U.S. Department of Energy, February 2005: Washington, D.C.
ICF International. “Analysis of the Ability of Regional Natural Gas Markets to Withstand Loss of Pipeline Capacity: Revised Results Including Changes from Peer Review.” U.S. Department of Energy, November 2005: Washington, D.C.
NERC | 2013 Special Reliability Assessment: Accommodating an Increasing Dependence on Natural Gas for Electric Power | May 2013 97 of 114

Appendix I: Consolidation of Reports and Studies
NERC | 2013 Special Reliability Assessment: Accommodating an Increasing Dependence on Natural Gas for Electric Power | May 2013 98 of 114
Table 8: Summary of Major Gas–Electric Integration and Disruption Contingency Studies
Study Study Summary
Gulf Coast, and the Western United States.
ISO‐NE – ICF103
This ICF International analysis focused on the availability of gas supplies to New England
electric generators with interruptible service on peak winter and summer days through
2020 for four alternate generation forecasts. The analysis included 16 contingency
scenarios in which pipeline capacity or other gas supplies (e.g., LNG imports) are disrupted,
and then quantified the impacts in terms of reduced gas supplies to generators and the
resulting available generating capacity.
MISO – EnVision Energy
Solutions104
The Midwest Independent System Operator (MISO) commissioned EnVision Energy
Solutions to conduct a gas and electric interdependency analysis in early 2012. The study
found that nearly all pipelines in the MISO area will have to improve flexibility to be able to
provide delivery service to MISO power generators. Out of 25 pipelines, three do not have
sufficient capacity, and three others do not have enough capacity to support a gas‐fired
combustion turbine plant or combined‐cycle plant. The cost to accommodate increased
supplies could exceed $3 billion. In addition to physical infrastructure expansions needed,
the study found that improving the collaborative process between gas pipelines, power
generators, and regulators is also necessary.
The study was later updated. The pipelines reviewing the study, after the fact, noted
backhaul capacities were not considered. For example, reversing the REX pipeline enabling
it to deliver Marcellus gas to the MISO region could have a net effect of adding billions of
cubic feet of gas to the region at a cost estimated to be much less than $1 billion.
NYS DHSES – ICF105
NYS DHSES commissioned ICF to conduct a supply‐based criticality and vulnerability
analysis of the interstate natural gas and petroleum pipelines supplying New York State.
The natural gas pipelines study consisted of a two‐part modeling effort. The first part
involved a macro criticality assessment of major interstate pipelines relevant to New York.
The macro analysis included roughly 20 different cases of natural gas supply reduction
based on simulated disruptions of each of the major interstate natural gas pipelines
entering New York State using ICF’s GMM. The microanalysis involved simulation of 25
different cases of natural gas supply reduction based on simulated disruptions of specific
natural gas facilities relevant to New York State. The second part of the analysis relied on
ICF’s Regional Infrastructure Assessment Modeling System (RIAMS) to assess the flow and
demand impacts on each day during a peak winter month.
103 ICF International. “Assessment of New England’s Natural Gas Pipeline Capacity to Satisfy Short‐ and Near‐term Power Generation Needs” presentation. New England Independent System Operator (ISO‐NE), 21 June 2012: Holyoke, MA. Available at: http://www.iso‐ne.com/committees/comm_wkgrps/prtcpnts_comm/pac/reports/2012/gas_study_public_slides.pdf
104 EnVision Energy Solutions. “Gas and Electric Infrastructure Interdependency Analysis.” Midwest Independent System Operator (MISO), February 2012: St. Paul, MN. Available at: https://www.midwestiso.org/Library/Repository/Tariff/FERC%20Filings/MISO%20Supp.%20Resp.%20to%20Evid.%20Requests_AD12‐1‐000.pdf
105 New York State Division of Homeland Security and Emergency Services (NYS DHSES). “Interstate Pipeline Supply‐Based Criticality and Vulnerability Analysis Project: Natural Gas and Petroleum Pipelines.” Prepared by ICF International for NYSDHSES, 22 December 2011.

Appendix I: Consolidation of Reports and Studies
NERC | 2013 Special Reliability Assessment: Accommodating an Increasing Dependence on Natural Gas for Electric Power | May 2013 99 of 114
Table 8: Summary of Major Gas–Electric Integration and Disruption Contingency Studies
Study Study Summary
NAESB106
NAESB surveyed industry participants on the development of industry standards. NAESB
then recommended a number of industry standards in June 2012 based on those surveys.
Recommendations include greater flexibility in scheduling gas transportation services and
related requirements, inclusion of market‐clearing times for natural gas and electricity
pricing, transparency reporting, review of NAESB communications protocol standards, and
review of nuclear power plant communications.
Interim Report on Electricity
Supply Conditions in New
England During the January
14–16, 2004 “Cold Snap”
(2004)107
While electric system reliability was not compromised during this cold snap, the extreme
circumstances (coldest period in 20 years) did stress test both regional gas and electric
reliability, with electric system reliability pushed to its limits. The detailed assessment of
this period highlighted the vulnerability of electric system reliability to the dynamics of the
region’s natural gas industry, which also was incurring peak demand requirements. Among
the most critical vulnerabilities was the power industry’s lack of access to adequate gas
pipeline capacity, as gas requirements for the other sectors taxed the region’s pipeline
capacity.
The report also highlighted that, during this period, some members of the electric industry
sold both their gas supplies and pipeline capacity rights to LDCs, which enabled them to
meet heightened levels of demand for home heating. The electric utilities that sold their
gas supplies then fuel switched to distillate in their dual‐fuel units. This particular aspect of
the cold snap illustrates how enlightened coordination between the two industries during
periods of stress can result in limited regional gas supplies being allocated to achieve the
optimum results for all consumers in the region. With respect to the dual‐fuel electric units,
they functioned very well during this stressful period.
Recommendations in the report focused on the need for better understanding of the
interface between the two industries and how the two industries could better coordinate
to allow maximum utilization of the region’s gas infrastructure. The report also cited the
need for adequate incentives to obtain the optimum performance from both merchant and
non‐merchant electric units during critical periods.
Lastly, the report recommended a regional dialogue with regulators and others to remove
the regulatory (environmental) barriers to installing and using dual‐fuel capability.
Gas/Electricity
Interdependencies and
Recommendations (2004)108
This NERC report summarized the findings of its Gas/Electricity Interdependency Task Force
(GEITF). Chief among the GEITF findings was that while the pipelines communicate with the
LDCs serving a generator or with the generator itself, they do not communicate with a
regional reliability coordinator, primarily because of confidentiality restrictions. As a result,
it was recommended that NERC, in concert with other energy industry organizations,
formalize communications between the electric industry and the gas transportation
106 North American Energy Standards Board (NAESB). “Gas‐Electric Harmonization Committee Report.” NAESB, September 2012: Washington, D.C.
107 http://www.iso‐ne.com/pubs/spcl_rpts/2004/interim_report_jan2004_cold_snap.pdf
108 http://www.nerc.com/docs/docs/pubs/Gas_Electricity_Interdependencies_and_Recommendations.pdf

Appendix I: Consolidation of Reports and Studies
NERC | 2013 Special Reliability Assessment: Accommodating an Increasing Dependence on Natural Gas for Electric Power | May 2013 100 of 114
Table 8: Summary of Major Gas–Electric Integration and Disruption Contingency Studies
Study Study Summary
industry for the purposes of education, planning and, most importantly, emergency
response.
Natural Gas Pipeline and
Storage Infrastructure
Projections through 2030
(2009)109
This nationally oriented report by the Interstate Natural Gas Association of America
(INGAA) Foundation, along with another similar report that focused on a single region,110
highlights the importance of adequate gas infrastructure to ensure the delivery of adequate
gas supplies to consumers. This observation is particularly acute for the electricity sector
because of increasing interdependence of the two industries. Also, both reports note that
there is a need to routinely assess the infrastructure capability and future plans to expand
it because of the likely growth in both industries.
Outages and Curtailments
During the Southwest Cold
Weather Event of February 1‐
5, 2011 (2011)111
This report, which was jointly authored by FERC and NERC, examined in detail the factors
that contributed to the loss of regional system reliability for both industries during this
February incident, which was summarized briefly in Chapter 3. The report included
recommendations for both industries in a number of areas, including planning,
interindustry coordination, communications, load shedding and, in particular, winterization.
There have also been a number of resource adequacy studies done on behalf of the electricity sector that have attempted
to identify and remedy current electricity reliability issues. Prominent studies include those listed below.
Table 9: Summary of Probabilistic Electric Reliability Studies
Study Study Summary
Carden et al112
The study discussed the use of the 1‐in‐10 reliability standard frequently used in reliability
planning and highlighted its different interpretations. Typically it is defined as one reliability
event occurring within 10 years and is measured by calculating the LOLE in “events per
year,” or 0.1 LOLE per year. Others, however, define it as in one day (24 hours) of load loss
during a 10‐year period, meaning an LOLE of 2.4. The cost of reliability events rises as
reserve margins decline, meaning the 1‐in‐10 standard interpretations could mean a
difference of over 4% in target reserve margins. The paper asserts that reliability
assessments must include economic reliability modeling of the full range and uncertainty of
outcomes, supplementing physical reliability standards (e.g., 1‐in‐10) and target reserve
margins with other considerations. Other considerations include analysis of both production
and scarcity costs of power above the variable cost of the marginal capacity resource,
realistic distribution of weather, unit performance, economic growth, analysis of
109 http://www.ingaa.org/Foundation/Foundation‐Reports/Studies/7828/9115.aspx
110 Analysis Group, New England Infrastructure – Adequacy Assessment and Policy Review, November 2005. 111 http://www.ferc.gov/legal/staff‐reports/08‐16‐11‐report.pdf 112 Carden, Kevin; Johannes Pfeifenberger; and Nick Wintermantel. “The Value of Resource Adequacy: Why Reserve Margins aren’t just about Keeping the Lights On.” Public Utilities Fortnightly, March 2011: Reston, VA. Available at: http://www.acciongroup.com/file_upload/03012011_ValueResourceAdequacy.pdf

Appendix I: Consolidation of Reports and Studies
NERC | 2013 Special Reliability Assessment: Accommodating an Increasing Dependence on Natural Gas for Electric Power | May 2013 101 of 114
Table 9: Summary of Probabilistic Electric Reliability Studies
Study Study Summary
transmission capabilities, and neighboring systems to assess potential constraints.
NRRI – Astrape Consulting
and the Brattle Group113
The National Regulatory Research Institute (NRRI) commissioned Astrape Consulting and
the Brattle Group to conduct resource adequacy modeling of the power market. The
analysis asserts that supplemental measures, in addition to the historical 1‐in‐10 standard,
must also be included in physical resource adequacy planning. Including economic
simulation of bulk power reliability in resource adequacy planning allows for economically
efficient target reserve margins.
NERC – G&T RPM114
In September 2010, the Generation & Transmission Reliability Planning Models (G&T RPM)
Task Force conducted a reliability report for the NERC Planning Committee. In terms of
probabilistic resource adequacy metrics, the study recommended that each designated
reporting area assess the annual loss‐of‐load‐hours, assess the annual expected unserved
energy, and define its meaning of loss‐of‐load event (e.g., voltage reductions, reduction in
spinning reserves below minimum requirement).
A series of Electric Power Research Institute (EPRI) reports were prepared for the power industry in the early 1990s that
addressed potential natural gas and electric power interdependencies. One of these reports addressed the topic on a
national scale, while the other was more regional in nature. Highlights and major points of emphasis in each report are
noted below.
Table 10: Summary of Major Electric Reliability Studies
Study Study Summary
Natural Gas for Electric
Generation: The Challenge of
Gas and Electric Industry
Coordination (1992)
In addition to highlighting in some detail the unique load characteristics of the power
industry, the report emphasized the following points as a result of the transition to modern
turbine technology:
The growth in power sector demand represented a challenge for both industries.
This growth in demand would result in increased interdependence between the
two industries that would require a much higher level of coordination.
There is no universal solution to interface problems between the two industries;
instead, regional solutions should be sought, as each region has its own unique
113 Carden, Kevin; Johannes Pfeifenberger; and Nick Wintermantel. “The Economics of Resource Adequacy Planning.” The National Regulatory Research Institute (NRRI), April 2011: Silver Spring, MD.
114 Generation & Transmission Reliability Planning Models Task Force for the NERC Planning Committee. “G&T RPM Task Force Final Report on Methodology and Metrics.” North American Electric Reliability Corporation (NERC), September 2010: Princeton, NJ.
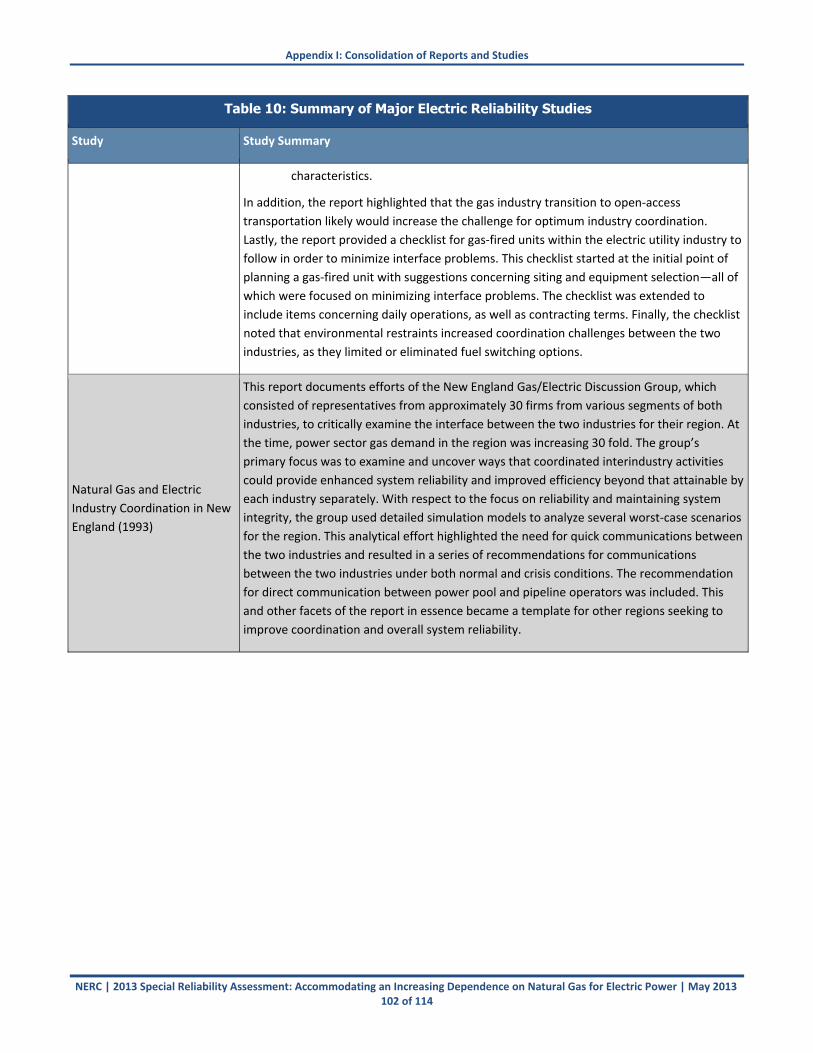
Appendix I: Consolidation of Reports and Studies
NERC | 2013 Special Reliability Assessment: Accommodating an Increasing Dependence on Natural Gas for Electric Power | May 2013 102 of 114
Table 10: Summary of Major Electric Reliability Studies
Study Study Summary
characteristics.
In addition, the report highlighted that the gas industry transition to open‐access
transportation likely would increase the challenge for optimum industry coordination.
Lastly, the report provided a checklist for gas‐fired units within the electric utility industry to
follow in order to minimize interface problems. This checklist started at the initial point of
planning a gas‐fired unit with suggestions concerning siting and equipment selection—all of
which were focused on minimizing interface problems. The checklist was extended to
include items concerning daily operations, as well as contracting terms. Finally, the checklist
noted that environmental restraints increased coordination challenges between the two
industries, as they limited or eliminated fuel switching options.
Natural Gas and Electric
Industry Coordination in New
England (1993)
This report documents efforts of the New England Gas/Electric Discussion Group, which
consisted of representatives from approximately 30 firms from various segments of both
industries, to critically examine the interface between the two industries for their region. At
the time, power sector gas demand in the region was increasing 30 fold. The group’s
primary focus was to examine and uncover ways that coordinated interindustry activities
could provide enhanced system reliability and improved efficiency beyond that attainable by
each industry separately. With respect to the focus on reliability and maintaining system
integrity, the group used detailed simulation models to analyze several worst‐case scenarios
for the region. This analytical effort highlighted the need for quick communications between
the two industries and resulted in a series of recommendations for communications
between the two industries under both normal and crisis conditions. The recommendation
for direct communication between power pool and pipeline operators was included. This
and other facets of the report in essence became a template for other regions seeking to
improve coordination and overall system reliability.

NERC | 2013 Special Reliability Assessment: Accommodating an Increasing Dependence on Natural Gas for Electric Power | May 2013 103 of 114
References Black & Veatch. “Gas Curtailment Risk Study.” The Electric Reliability Council of Texas (ERCOT), March 2012: Dallas, TX.
Available at: http://www.ercot.com/content/news/presentations
/2012/BV%20ERCOT%20Gas%20Study%20Report%20March%202012.pdf
Carden, Kevin; Johannes Pfeifenberger; and Nick Wintermantel. “The Value of Resource Adequacy: Why Reserve Margins
aren’t just about Keeping the Lights On.” Public Utilities Fortnightly, March 2011: Reston, VA. Available at:
http://www.acciongroup.com/file_upload/03012011_ValueResourceAdequacy.pdf
Ibid. “The Economics of Resource Adequacy Planning.” The National Regulatory Research Institute (NRRI), April 2011: Silver
Spring, MD.
EnVision Energy Solutions. “Gas and Electric Infrastructure Interdependency Analysis.” Midwest Independent System
Operator (MISO), February 2012: St. Paul, MN. Available at: https://www.midwestiso.org/Library/Repository/Tariff
/FERC%20Filings/MISO%20Supp.%20Resp.%20to%20Evid.%20Requests_AD12‐1‐000.pdf
Federal Energy Regulatory Commission (FERC). “Order 636 Final Rule, Pipeline Service Obligations and Revisions to
Regulations Governing Self‐Implementing Transportation Under Part 284 of the Commission's Regulations.” FERC, 8
April 1992: Washington, D.C.
Ibid. “Standards for Business Practices of Interstate Natural Gas Pipelines,” 18 CFR Part 284. Docket No. RM96‐1‐037, Order
No. 587‐V. FERC, 2012: Washington, D.C. Available at: www.ferc.gov/whats‐new/comm‐meet/2012/071912/G‐1.pdf
Federal Energy Regulatory Commission (FERC) and North American Electric Reliability Corporation (NERC). “Report on
Outages and Curtailments during the Southwest Cold Weather Event of February 1‐5, 2011.” FERC and NERC, August
2011: Washington, D.C. Available at: http://www.ferc.gov/legal/staff‐reports/08‐16‐11‐report.pdf
Generation & Transmission Reliability Planning Models Task Force for the NERC Planning Committee. “G&T RPM Task Force
Final Report on Methodology and Metrics.” North American Electric Reliability Corporation (NERC), September 2010:
ICF International. “Natural Gas Pipeline Security Study for the Northeast U.S.” The Interstate Natural Gas Association of
America (INGAA) Foundation, February 2003: Washington, D.C.
Ibid. “Analysis of the Ability of Regional Natural Gas Markets to Withstand Loss of Pipeline Capacity.” U.S. Department of
Energy, December 2003: Washington, D.C.
Ibid. “Natural Gas Pipeline Security Study for Western Region and the Florida.” U.S. Department of Energy, February 2005:
Washington, D.C.
Ibid. “Analysis of the Ability of Regional Natural Gas Markets to Withstand Loss of Pipeline Capacity: Revised Results
Including Changes from Peer Review.” U.S. Department of Energy, November 2005: Washington, D.C.
Ibid. “Integrated Outlook.” ICF, 2012 Q2 release: Fairfax, VA.
Ibid. “Assessment of New England’s Natural Gas Pipeline Capacity to Satisfy Short‐ and Near‐term Power Generation
Needs” presentation. New England Independent System Operator (ISO‐NE), 21 June 2012: Holyoke, MA. Available at:
http://www.iso‐ne.com/committees/comm_wkgrps/prtcpnts_comm/pac/reports/2012/gas_study_public_slides.pdf
Lauby, Mark. “Natural Gas and Electric Power Interdependency in the United States” presentation. North American Electric
Reliability Corporation (NERC), January 2012: Washington, D.C.
National Oceanic and Atmospheric Administration (NOAA). “National Climatic Data Center.” NOAA, 2012: Washington, D.C.
Available at: http://www.ncdc.noaa.gov/
Appendix I: Consolidation of Reports and Studies
NERC | 2013 Special Reliability Assessment: Accommodating an Increasing Dependence on Natural Gas for Electric Power | May 2013 104 of 114
New York State Division of Homeland Security and Emergency Services (NYS DHSES). “Interstate Pipeline Supply‐Based
Criticality and Vulnerability Analysis Project: Natural Gas and Petroleum Pipelines.” Prepared by ICF International for
NYSDHSES, 22 December 2011.
North American Energy Standards Board (NAESB). “Order 698 Effort.” NAESB, 10 September 2007: Houston, TX. Available
at: www.naesb.org/pdf3/update091207w5.doc
Ibid. “Generating Availability Data System (GADS): Reports.” NAESB, 2010: Washington, D.C. Available at:
http://www.nerc.com/page.php?cid=4|43|47
Ibid. “Wholesale Electric Quadrant Standards and Implementation Guides.” NAESB, 2010: Washington, D.C. Available at:
http://www.naesb.org/weq/weq_standards.asp
Ibid. “WGQ Contracts Standards and Models.” NAESB, 2010: Washington, D.C. Available at:
http://www.naesb.org/wgq/cont.asp
Ibid. “Corporation Rules of Procedure Section 1600— REQUESTS FOR DATA OR INFORMATION.” NAESB, March 2012:
Washington, D.C. Available at: http://www.nerc.com/files/NERC_ROP_Effective_20120315.pdf
Ibid. “Gas‐Electric Harmonization Committee Report.” NAESB, September 2012: Washington, D.C.
Northwest Pipeline. “Welcome to Northwest Pipeline.” Northwest Pipeline, 2007. Accessed 14 November 2012.Available at:
www.northwest.williams.com/Files/Northwest/10192007WelcometoNorthwestPipelinefinal_4_.pdf
PJM. “Gas‐Electric Coordination Issues (RTO Perspective)” presentation. PJM, January 2012: Norristown, PA.
U.S. Congress. “U.S. Natural Gas Act of 1938,” section 7. 15 USC 717h.
Williams Companies. “WECC Presentation.” Williams, 12 November 2012.
Appendix I: Consolidation of Reports and Studies

NERC | 2013 Special Reliability Assessment: Accommodating an Increasing Dependence on Natural Gas for Electric Power | May 2013 105 of 114
Appendix II: Regional Analysis of Generator Outages The follow series of Regional data represents a statistical analysis of gas‐fired generator outages (reported in the NERC GADS) between 2001 and 2011 caused by a lack of fuel.
First quartile (Q1) = lower quartile = splits lowest 25% of data = 25th percentile
Second quartile (Q2) = median = cuts data set in half = 50th percentile
Third quartile (Q3) = upper quartile = splits highest 25% of data, or lowest 75% = 75th percentile
The following charts show the distribution for all reported outages from 2001 to 2011. The two different graphs show the
capacity loss and duration of each event reported. The distribution shows the variation over time for each Region. If an
event falls outside the tail (Q1 ‐ 1.5 x IQR, Q3 + 1.5 x IQR), the event would be considered an outlier or extreme event.
Continued trending and tracking of this data may uncover leading indicators of system stress and better understand future
risks.
The above “box and whisker” legend applies to all charts in Appendix II

Appendix II: Regional Analysis of Generator Outages
NERC | 2013 Special Reliability Assessment: Accommodating an Increasing Dependence on Natural Gas for Electric Power | May 2013 106 of 114
FRCC Figure 47: FRCC Gas Outage
Figure 48: FRCC Gas Outage Duration
0 50 100 150 200 250 300
2001
2002
2003
2004
2005
2006
2007
2008
2009
2010
2011
Capacity (MW)
0 1 2 3 4 5 6 7 8 9 10
2001
2002
2003
2004
2005
2006
2007
2008
2009
2010
2011
Outage Duration (Hours)

Appendix II: Regional Analysis of Generator Outages
NERC | 2013 Special Reliability Assessment: Accommodating an Increasing Dependence on Natural Gas for Electric Power | May 2013 107 of 114
MRO Figure 49: MRO Gas Outage
Figure 50: MRO Gas Outage Duration
0 50 100 150 200 250 300 350
2001
2002
2003
2004
2005
2006
2007
2008
2009
2010
2011
Capacity (MW)
0 2 4 6 8 10 12
2001
2002
2003
2004
2005
2006
2007
2008
2009
2010
2011
Outage Duration (Hours)

Appendix II: Regional Analysis of Generator Outages
NERC | 2013 Special Reliability Assessment: Accommodating an Increasing Dependence on Natural Gas for Electric Power | May 2013 108 of 114
NPCC Figure 51: NPCC Gas Outage
Figure 52: NPCC Gas Outage Duration
0 100 200 300 400 500 600
2001
2002
2003
2004
2005
2006
2007
2008
2009
2010
2011
Capacity (MW)
0 20 40 60 80 100 120 140 160 180
2001
2002
2003
2004
2005
2006
2007
2008
2009
2010
2011
Outage Duration (Hours)

Appendix II: Regional Analysis of Generator Outages
NERC | 2013 Special Reliability Assessment: Accommodating an Increasing Dependence on Natural Gas for Electric Power | May 2013 109 of 114
RFC Figure 53: RFC Gas Outage
Figure 54: RFC Gas Outage Duration
0.00 100.00 200.00 300.00 400.00 500.00 600.00 700.00 800.00 900.00
2001
2002
2003
2004
2005
2006
2007
2008
2009
2010
2011
Capacity (MW)
0.00 100.00 200.00 300.00 400.00 500.00 600.00
2001
2002
2003
2004
2005
2006
2007
2008
2009
2010
2011
Outage Duration (Hours)

Appendix II: Regional Analysis of Generator Outages
NERC | 2013 Special Reliability Assessment: Accommodating an Increasing Dependence on Natural Gas for Electric Power | May 2013 110 of 114
SERC Figure 55: SERC Gas Outage
Figure 56: SERC Gas Outage Duration
0 100 200 300 400 500 600 700
2001
2002
2003
2004
2005
2006
2007
2008
2009
2010
2011
Capacity (MW)
0 10 20 30 40 50 60 70 80 90 100
2001
2002
2003
2004
2005
2006
2007
2008
2009
2010
2011
Outage Duration (Hours)

Appendix II: Regional Analysis of Generator Outages
NERC | 2013 Special Reliability Assessment: Accommodating an Increasing Dependence on Natural Gas for Electric Power | May 2013 111 of 114
SPP Figure 57: SPP Gas Outage
Figure 58: SPP Gas Outage Duration
0 50 100 150 200 250 300 350 400 450 500
2001
2002
2003
2004
2005
2006
2007
2008
2009
2010
2011
Capacity (MW)
0 50 100 150 200 250
2001
2002
2003
2004
2005
2006
2007
2008
2009
2010
2011
Outage Duration (Hours)

Appendix II: Regional Analysis of Generator Outages
NERC | 2013 Special Reliability Assessment: Accommodating an Increasing Dependence on Natural Gas for Electric Power | May 2013 112 of 114
TRE Figure 59: TRE Gas Outage
Figure 60: TRE Gas Outage Duration
0.00 50.00 100.00 150.00 200.00 250.00 300.00 350.00
2001
2002
2003
2004
2005
2006
2007
2008
2009
2010
2011
Capacity (MW)
0.00 100.00 200.00 300.00 400.00 500.00 600.00
2001
2002
2003
2004
2005
2006
2007
2008
2009
2010
2011
Outage Duration (Hours)

Appendix II: Regional Analysis of Generator Outages
NERC | 2013 Special Reliability Assessment: Accommodating an Increasing Dependence on Natural Gas for Electric Power | May 2013 113 of 114
WECC Figure 61: WECC Gas Outage
Figure 62: WECC Gas Outage Duration
0.0 50.0 100.0 150.0 200.0 250.0 300.0 350.0
2001
2002
2003
2004
2005
2006
2007
2008
2009
2010
2011
Capacity (MW)
0.0 100.0 200.0 300.0 400.0 500.0 600.0
2001
2002
2003
2004
2005
2006
2007
2008
2009
2010
2011
Outage Duration (Hours)

Appendix III: Terms Used in This Report
NERC | 2013 Special Reliability Assessment: Accommodating an Increasing Dependence on Natural Gas for Electric Power | May 2013 114 of 114
Appendix III: Terms Used in This Report
Acronyms Definition Acronyms Definition
AIC Akaike information criterion IESO Independent Electricity System Operator (Ontario)
Bcfd billion cubic per day ISO‐NE New England Independent System Operator
Btu British thermal unit ISO Independent system operators
CDD cooling degree days IT interruptible transportation
CSA Customer Security Administration LAUF lost or unaccounted for
CSAPR Cross‐State Air Pollution Rule LDC local distribution company
DGLM Daily Gas Load Model LNG liquefied natural gas
DOE U.S. Department of Energy LOLE Loss‐of‐Load Expectation
DOT U.S. Department of Transportation LOLH Loss‐of‐Load Hours
Dth Dekatherm MCE Market Clearing Engine
EDI Electronic Data Interchange MDQ Maximum Daily Quantity
EDM Electronic Delivery Mechanism MISO Midwest Independent System Operator
EPA Environmental Protection Agency MMcfd millions of cubic feet per day
ERCOT Electric Reliability Council of Texas MTBF Mean time between failures
EUE Expected Unserved Energy MTTR Mean time to repair
FERC Federal Energy Regulatory Commission
MW Megawatt
G&T RPM Generation & Transmission Reliability Planning Models
MWh Megawatt hour
GADS Generating Availability Data System NAESB North American Energy Standards Board
GAR Generating Availability Report NERC North American Electric Reliability Corporation
GISB Gas Industry Standards Board NOAA National Oceanic and Atmospheric Administration
GTL gas‐to‐liquid NRRI National Regulatory Research Institute
HAPS Hazardous Air Pollution Standard NYISO New York Independent System Operator
HAS Historical Availability Statistics OFO Operational Flow Orders
HDD heating degree days PHMSA Department of Transportation’s Pipeline and Hazardous Materials Safety Administration