Embed Size (px)
Citation preview
2013 Third-Party Logistics Study The State of Logistics Outsourcing
Results and Findings of the 17th Annual Study

2
©2012 C. John Langley, Jr., Ph.D., and Capgemini. All Rights Reserved. No part of this document may be reproduced, displayed, modified or distributed by any process or means without prior written permission from Capgemini. Rightshore® is a trademark belonging to Capgemini.
2013 THIRD-PARTY LOGISTICS STUDY

3
Table of Contents
Executive Summary 4
Current State of the 3PL Market 7
Supply Chain Innovation 15
The IT Gap 20
Supply Chain Disruption 22
Talent Management 28
Strategic Assessment 30
About the Study 34
About the Sponsors 37
Supporting Organizations
A N A L Y T I C S
BriefcaseCEDOL CELSC
Center for Emerging Logistics and Supply Chains
I W L AInternational WarehouseLogistics Association
Transport Intelligence
FreightWatchI N T E R N AT I O N A L
Table of Contents

Current State of the 3PL Market
The success of the third-party logistics industry is evident in the generally high marks given to 3PLs by respondents to a survey as part of the 2013 17th Annual Third Party Logistics Study, which identifies trends and explores how both 3PLs and shippers are using these relationships to improve and enhance their businesses and supply chains. A substantial 2,342 industry executives provided usable responses to the survey, including users and non-users of 3PL services as well as 3PL providers.
Despite challenging business conditions, aggregate global revenues for the 3PL sector continue to rise, and far more shippers (65%) are increasing their use of 3PL services than returning to insourcing (22%) some 3PL services. Nearly three in five (58%) shippers are reducing or consolidating the number of 3PLs they use. Shippers report spending an average 12% of revenues on logistics, and an average 39% of that figure is spent on outsourced logistics services. Outsourcing accounts for 54% of shippers’ transportation spend and 39% of warehouse operations spend. As found in past Annual 3PL Study surveys, transactional, operational, and repetitive activities such as transportation, warehousing, and freight forwarding tend to be the most frequently outsourced.
Both shippers (86%) and 3PL providers (94%) largely view their relationships as successful, with shippers posting some impressive results from outsourcing: just over half (56%) say their use of 3PLs has led to year-over-year incremental benefits. They also report significant savings from logistics cost reductions (15%), inventory cost reductions (8%) and logistics fixed asset reductions (26%). Shippers are more satisfied than 3PLs (71% to 63%) with the openness, transparency and good communication in their relationships, and 67% of shipper respondents judge their 3PLs as sufficiently agile and flexible.
Shippers’ openness to more strategic 3PL-shipper arrangements, including gainsharing and collaboration with other companies, appears to be declining somewhat. The IT Gap appears to have stabilized over the last few years, with 94% agreeing that IT is a necessary element of 3PL capability but just 53% indicating they are currently satisfied with 3PL IT capabilities. Contributors and potential solutions to this disparity are explored in the IT Gap section.
Supply Chain Innovation
Innovation is a critical driver of growth, differentiation, and profitability, but as the logistics industry matures and markets become more global, innovation in this industry is becoming more challenging. The solution lies in evolving toward fundamental changes in 3PL-shipper relationships.
Until recently, 3PLs could demonstrate innovation by introducing process improvements, adding technology, improving execution, or offering new services. But shippers no longer see these as truly innovative, instead seeking disruptive innovation: a new product or service idea that when implemented significantly disrupts a market and/or value chain by simplifying, automating, generating value, or reducing costs.
Many 3PL-shipper relationships are not set up to support innovation. They are tactical rather than strategic, offer insufficient visibility and are limited by metrics, contract terms, and risk mitigation strategies. Most 3PL respondents (89%) believe they are ready to innovate, but just 53% of shippers agree. 3PLs and shippers each see themselves as the largest sources of innovation within their relationships.
Shippers and 3PLs largely agree on the top requirements for innovation, including trusting relationships, talent/right people, and operational excellence. The unifying theme of the results is that it takes truly collaborative
and strategic relationships among all partners to develop the types of disruptive innovations needed to solve the vexing challenges facing today’s supply chains. Current industry consensus is that 3PLs and shippers can facilitate supply chain innovation by leveraging organizational and technology-focused capabilities. Organizational drivers include fostering collaboration through structure, relationship governance, and embedding innovation into the organization. Technology drivers include advanced IT and mobile solutions, big data and analytics, and social media.
Shippers assert that they are willing to pay 3PLs for investments required to drive innovation. Despite its limited use, gainsharing is the most favored method to fund this investment.
The IT Gap
The long-standing gap between the importance shippers assign to 3PLs’ IT capabilities and their satisfaction with 3PLs’ current IT capabilities – which we call the IT Gap – has stabilized at roughly a 40-point delta. The reason may be an ongoing disconnect between how the two groups view 3PL IT investments: 3PLs are more likely to describe their IT investments as aggressive compared to shippers, while shippers are much less likely to call 3PL investments aggressive (12% vs. 23% for 3PLs), and 35% say they’re conservative. Shippers’ relationships with 3PLs’ IT organizations are also less than ideal: 46% call these relationships project-focused, 29% tactical, and 14% are contentious.
Shippers want 3PLs to offer comprehensive and easily integrated solutions. And the good news is that just over half of 3PLs anticipate making large investments in modernizing applications. But 3PLs cannot make the right IT choices until they have a clear picture of their customers’ supply chains, how they function, and the challenges they face. A collaborative approach between partners, featuring a relationship governance structure
Executive Summary
Ti
4 2013 THIRD-PARTY LOGISTICS STUDY

that includes IT, will further improve shipper satisfaction with 3PLs’ IT capabilities, drive increased innovation, and improve 3PL-shipper relationships.
Supply Chain Disruption
Extended supply chains, reduced inventories, and shortened product lifecycles are just some of the factors making disruption of supply chain operations more likely and more costly than ever. Economic losses from supply chain disruptions increased 465% between 2009 and 2011. Shippers report adverse weather as the biggest source of supply chain disruption, followed by extreme volatility in commodity, labor, or energy prices/supply.
Many 3PL and shipper respondents say their organizations are placing a greater focus on supply chain risk and mitigation, with partnerships, business continuity planning, supply chain visibility tools, and employee training/talent management as their top strategies. All are valuable contributors to a comprehensive risk mitigation strategy. Equally notable are the approaches not highly ranked, such as supplier scorecarding and supply chain mapping, essential first steps to identifying and monitoring risk.
The top reason many shippers and 3PLs fall short on their supply chain disruption risk mitigation efforts is a lack of understanding of available mitigation tools. Other common reasons include lack of capital and a belief that current risk mitigation capability is not a problem. Other missteps include: actively monitoring only direct suppliers and not sub-suppliers, and failing to follow through on plans crafted hastily after a disruption.
Companies that have successfully implemented effective supply chain mitigation plans often apply new thinking to traditional mitigation strategies, such as diversifying rather than consolidating suppliers. Clear-eyed assessment of the current state of the network is the first step to understanding the risk, followed by a well-considered plan of attack to both alleviate the biggest sources of vulnerability and respond when disruptions do occur. A sound mitigation strategy can both avoid
costs and help create a competitive advantage.
Talent Management
Several industry surveys have found that CEOs consider talent their most important challenge behind business growth. The right talent is essential to driving innovation and managing potential supply chain disruptors. In last year’s 2012 16th Annual 3PL Study, shippers and 3PLs agreed that having the right people and leadership in place would be the number one driver of their companies’ success over the next five years.
Top tools used by 3PLs and shippers to mitigate supply chain disruptions include employee training, talent management, and internal and external certifications, and many plan to invest accordingly.
Talent is also essential to support the growing demand for logistics innovation. One area where 3PLs are responding to this need is in IT; in recent months many leading 3PLs have been recruiting experienced CIOs and best-in-class IT talent in response to customer demands. Shippers are also taking action; in some organizations the IT function and supply chain organization are being merged based on the strong dependency of logistics on the availability of timely, accurate, and relevant data.
Strategic Assessment
The study team continually monitors current topics in the overall supply chain industry as well as findings that emerge from the research. The following is a brief look at some timely subjects being considered for further exploration in next year’s Annual 3PL Study.
X-shoring: We introduce the term “X-shoring” to address shippers’ moves toward rebalancing supply chains to be more flexible and adaptable, suggesting that shifting global economic conditions may frequently change preferred sourcing locations. The issues shippers confront in making X-shoring decisions to cope with a fluctuating global economy mirror those faced across the enterprise. Making these choices requires better data and improved decision-making strategies,
such as employing total landed cost versus cost of goods sold, assessing risk/quality/service-related costs, and learning to spot “caution flags.” Such insights will enhance shippers’ ability to employ world-class supply chain management to drive profitability.
Global Trade Management: Most companies believe global trade management is essential as they rely more heavily on global trade for growth in a weak economy. However, issues such as shifting trade lanes and new free trade agreements are making global trade more complex. Challenges include maintaining visibility of all purchase part information, coordinating free trade agreement information with suppliers, and ensuring qualification for different trade programs. Shippers that invest time and resources into global trade management best practices will be positioned to transform their global operations into a competitive advantage over their competitors.
Big Data: Growing data volumes (sometimes called Big Data) generated from increased monitoring of more aspects of supply chain operations with greater frequency and granularity has emerged as a disruptive innovation opportunity for shippers and 3PLs. Converting this data into business value is the heart of the challenge and a driver for expanding 3PL relationships. To capitalize on this opportunity, 3PLs must be competent data managers, provide specialized IT tools, facilitate analysis, and adopt a knowledge-centric approach to their relationships with shippers.
5Executive Summary
Companies that have successfully implemented effective supply chain mitigation plans often apply new thinking to traditional mitigation strategies.

6
Aligned Teams Collaborating to New Summits
2013 THIRD-PARTY LOGISTICS STUDY
7
Region 2010 Global
3PL Revenues (US$Billions)
2011 Global 3PL Revenues
(US$Billions)
Percent Change 2010
to 2011
North America $ 149.1 $ 159.9 + 7.2%
Europe 165.1 160.4 - 2.8%
Asia-Pacific 157.6 191.1 + 21.2%
Latin America 27.5 39.5 + 43.6%
Other Regions 42.3 65.2 + 54.0%
Total $ 541.6 $ 616.1 + 13.7%
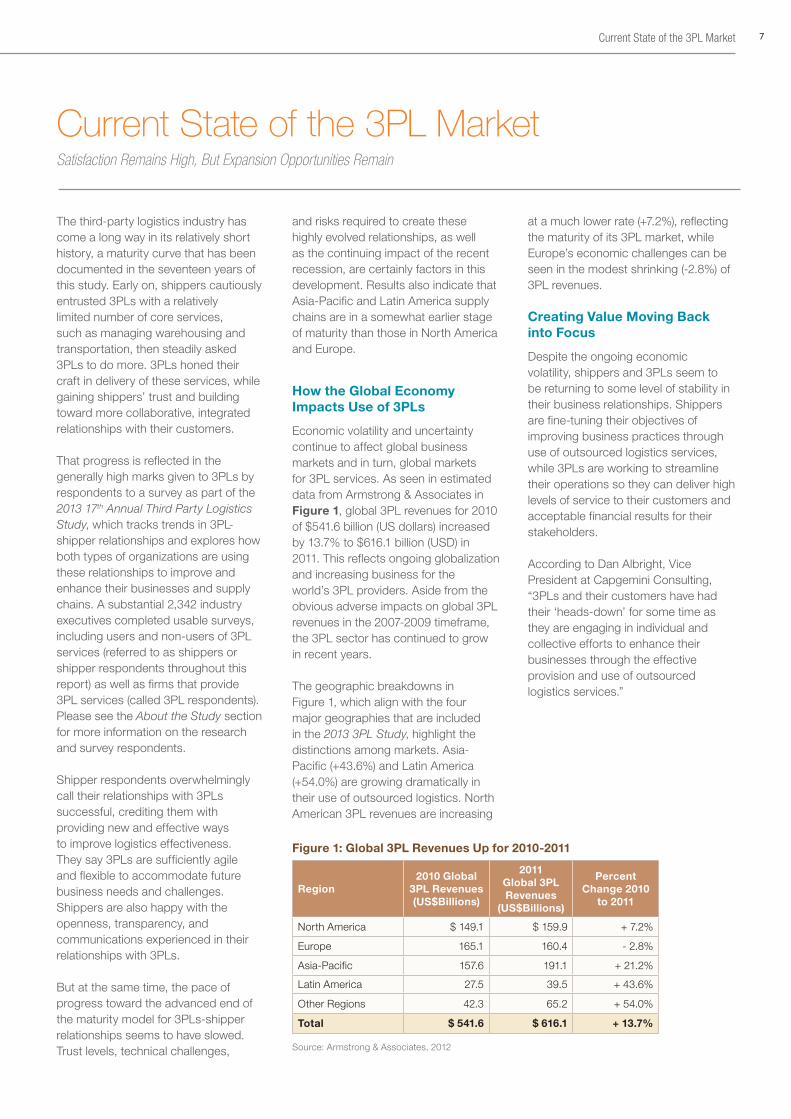
The third-party logistics industry has come a long way in its relatively short history, a maturity curve that has been documented in the seventeen years of this study. Early on, shippers cautiously entrusted 3PLs with a relatively limited number of core services, such as managing warehousing and transportation, then steadily asked 3PLs to do more. 3PLs honed their craft in delivery of these services, while gaining shippers’ trust and building toward more collaborative, integrated relationships with their customers.
That progress is reflected in the generally high marks given to 3PLs by respondents to a survey as part of the 2013 17th Annual Third Party Logistics Study, which tracks trends in 3PL-shipper relationships and explores how both types of organizations are using these relationships to improve and enhance their businesses and supply chains. A substantial 2,342 industry executives completed usable surveys, including users and non-users of 3PL services (referred to as shippers or shipper respondents throughout this report) as well as firms that provide 3PL services (called 3PL respondents). Please see the About the Study section for more information on the research and survey respondents.
Shipper respondents overwhelmingly call their relationships with 3PLs successful, crediting them with providing new and effective ways to improve logistics effectiveness. They say 3PLs are sufficiently agile and flexible to accommodate future business needs and challenges. Shippers are also happy with the openness, transparency, and communications experienced in their relationships with 3PLs.
But at the same time, the pace of progress toward the advanced end of the maturity model for 3PLs-shipper relationships seems to have slowed. Trust levels, technical challenges,
and risks required to create these highly evolved relationships, as well as the continuing impact of the recent recession, are certainly factors in this development. Results also indicate that Asia-Pacific and Latin America supply chains are in a somewhat earlier stage of maturity than those in North America and Europe.
How the Global Economy Impacts Use of 3PLs
Economic volatility and uncertainty continue to affect global business markets and in turn, global markets for 3PL services. As seen in estimated data from Armstrong & Associates in Figure 1, global 3PL revenues for 2010 of $541.6 billion (US dollars) increased by 13.7% to $616.1 billion (USD) in 2011. This reflects ongoing globalization and increasing business for the world’s 3PL providers. Aside from the obvious adverse impacts on global 3PL revenues in the 2007-2009 timeframe, the 3PL sector has continued to grow in recent years.
The geographic breakdowns in Figure 1, which align with the four major geographies that are included in the 2013 3PL Study, highlight the distinctions among markets. Asia-Pacific (+43.6%) and Latin America (+54.0%) are growing dramatically in their use of outsourced logistics. North American 3PL revenues are increasing
at a much lower rate (+7.2%), reflecting the maturity of its 3PL market, while Europe’s economic challenges can be seen in the modest shrinking (-2.8%) of 3PL revenues.
Creating Value Moving Back into Focus
Despite the ongoing economic volatility, shippers and 3PLs seem to be returning to some level of stability in their business relationships. Shippers are fine-tuning their objectives of improving business practices through use of outsourced logistics services, while 3PLs are working to streamline their operations so they can deliver high levels of service to their customers and acceptable financial results for their stakeholders.
According to Dan Albright, Vice President at Capgemini Consulting, “3PLs and their customers have had their ‘heads-down’ for some time as they are engaging in individual and collective efforts to enhance their businesses through the effective provision and use of outsourced logistics services.”
Figure 1: Global 3PL Revenues Up for 2010-2011
Source: Armstrong & Associates, 2012
Current State of the 3PL Market Satisfaction Remains High, But Expansion Opportunities Remain
Current State of the 3PL Market

Two other high priorities for shippers and 3PLs are driving supply chain innovation as well as mitigating or eliminating supply chain disruption. Organizations that do either or both of these successfully create critical differentiation in the marketplace that can drive competitive advantage. The study team explores both of these in-depth as part of this year’s special topics coverage. The report also briefly considers the critical role talent management plays in attaining supply chain innovation and disruption capabilities, as well as the drivers and obstacles behind the ongoing gap between shippers’ expectations and 3PLs’ capabilities when it comes to IT.
What Respondents Spend on Logistics and 3PL Services
Shipper respondents devote an average 12% of their total sales revenues to logistics, and an average 39% of that goes to outsourcing logistics (Figure 2). While the 12% remains constant from previous studies, the 39% devoted to outsourcing is down only slightly from the 42% reported in last year’s study. Total logistics expenditures include transportation, distribution, warehousing, and value-added services. Considering Armstrong & Associates’ estimated and projected increases to global 3PL revenues cited in Figure 1, these percentages support the finding that global markets for 3PL services are expanding.
Figure 2 also shows dramatic differences across geographies in the percentages of transportation and warehousing spend managed by third parties. Shipper respondents report that on average, outsourcing accounts for 54% of transportation spend, but these range from a low of 42% in North America and 45% in Asia-Pacific to 60% in Latin America and 71% in Europe. Asia-Pacific’s 45% is down dramatically from the 60% shippers reported last year, which may be explained by a modest decrease in Asia-Pacific shippers that are reporting increased use of outsourcing logistics services this year.
The percentage of shippers outsourcing warehouse operations is down slightly across all geographies except Europe, where it grew from 42% to 48% this year. This increased outsourcing of warehouse operations may be explained somewhat by the significant economic issues that have recently been impacting European business activity.
Outsourcing Outpaces Insourcing
Similar to other industries, shippers (customers) sometimes revisit their decisions to use 3PLs, even over short periods of time. Overall, however, results of this study suggest that far more companies increase their logistics outsourcing in any given year than
Figure 2: Outsourcing Spending Patterns Persist
12%
39%
54%
36%
10%
33%
42%
31%
12%
55%
71%
48%
12%
31%
45%
32%
15%
39%
60%
30%
0%
10%
20%
30%
40%
50%
60%
70%
80%
All Regions North America Europe Latin America
Total Logistics Expenditures as a Percent of Sales Revenues
Percent of Total Logistics Expenditures Directed
to Outsourcing
Percent of Transportation Spend Managed by
Third Parties
Percent of Warehouse Operations Spend Managed
by Third Parties
Asia-Pacific
those that bring most logistics services back in-house – which helps to explain some of the overall increase in global 3PL revenues discussed earlier. The measurement of these outsourcing/insourcing trends tend to remain fairly stable year over year:
- Outsourcing: 65% of shipper respondents report increases in their use of outsourced logistics services this year, compared with 64% and 65% in the last two years. North American growth lags the other regions by a modest amount. Three-quarters of 3PL respondents see an increase in outsourcing among their shippers.
- Insourcing: Generally, insourcing remains less prevalent, with 22% of global shippers indicating they are returning to insourcing many of their logistics activities. One region that evidences significant change from previous results is Europe, which dropped from 18% last year to 12% this year. 3PL reports of shippers in general returning to insourcing many of their logistics activities remains consistent at 37%.
- Reducing or Consolidating 3PLs: The ongoing trend toward strategic sourcing that is occurring at many shipper firms shows up in the number who report they are reducing or consolidating the number of 3PLs they use, an average 58% globally.
This is consistent with previous years’ findings and remains pretty constant across geographies as well. Interestingly, 3PLs are more likely than shippers (72%) to report that in general they see shippers reducing or consolidating the number of 3PLs they use.
So while rates of change to outsourcing/insourcing appear to remain stable in recent years, the general trend among global shippers is to increase their use of outsourced logistics services.
8 2013 THIRD-PARTY LOGISTICS STUDY
Source: 2013 Third-Party Logistics Study

3PL services has led to year-over-year benefits. The biggest declines are in Asia-Pacific (60% to 51%) and Latin America (63% to 48%) – also indicators that those regions are at a different point in the maturity of 3PL usage than North America and Europe.
The Challenge of Enhancing 3PL-Shipper Relationships
Since this study began including 3PLs with their own version of the survey four years ago, a pattern has emerged just like the one above: 3PLs’ ratings of various aspects of their own capabilities and relationships tend to be higher than those given to them by shippers. Their ratings of shippers, however, are not always quite so high. That certainly applies for these 3PL characteristics:
- Openness, transparency and good communication: Similar to last year the 2013 3PL Study survey showed 71% of shipper respondents are satisfied with 3PLs’ openness, transparency, and communication. But just 63% of 3PLs respondents are satisfied with these characteristics in their customers, creating an opportunity for improvement.
- Agility and flexibility to accommodate current and future business needs and challenges: Nearly all (97%) 3PLs feel that their customers expect these qualities in their 3PLs. But just 67% of shipper respondents judge their 3PLs as sufficiently agile and flexible – another opportunity for enhancement.
A popular topic in 3PL-shipper relationships is the ability for participants in the logistics outsourcing arena to reach the highest levels on the maturity curve when it comes to 3PL-shipper relationships. In the throes of the recession, there were some signs that shippers were becoming more open to newer ideas that would improve efficiency and effectiveness in innovative ways, but issues around trust, risk, and even technical obstacles slowed adoption.
Measurable Satisfaction and Success
3PLs are primarily meeting shippers’ expectations. An average of 86% of shipper respondents view their 3PL relationships as generally successful, compared with 94% of 3PL respondents. Shippers’ ratings are consistent across North America (90%), Europe (90%), and Asia-Pacific (85%). But success ratings for Latin America slipped from 87% last year to 76% this year. Some of this drop may be attributed to the dramatic increase reported earlier in the use of 3PLs by shippers in Latin America. Nearly all (94%) 3PLs respondents view their relationships with shippers as having been successful.
As seen in Figure 3, shippers report impressive results through use of 3PL services, numbers that have remained relatively consistent over time. Where we do see some variation year over year is in order fill rate and order accuracy. While shippers do attribute improvement in these factors to the use of 3PLs, the percentages themselves are somewhat lower than we have reported in the past few years. This may be related in some way to the prevailing global economic uncertainty, a topic that warrants closer examination in future Annual 3PL Studies.
Figure 3: 3PLs Delivering Measurable Benefits to Shippers
ResultsAll
Regions
Logistics Cost Reduction (%) 15%
Inventory Cost Reduction (%) 8%
Logistics Fixed Asset Reduction (%)
26%
Order Fill Rate
Changed From 58%
Changed To 65%
Order Accuracy
Changed From 67%
Changed To 72%
Source: 2013 Third-Party Logistics Study
As with past years, just over half of shipper respondents (56%, down from 60% last year) report their use of 3PLs has led to year-over-year incremental benefits, while 87% of 3PL providers say their customers’ decisions to use
Perhaps for those reasons, as well as some improvement in economic conditions, our research reveals recent declines in the openness of some shippers to more innovative 3PL-shipper arrangements:
• “Gainsharing” between 3PLs and shippers is down. Two years ago, more than half of shippers (56%) reported having engaged in gainsharing arrangements with 3PLs. Last year it fell to 47% and this year it’s 37%. The lower percentages seem to be driven by year-over-year reductions in Asia-Pacific (46% to 35%) and in Latin America (a very striking 54% to 34%). Shippers in these regions appear to be more comfortable with fee-for-service arrangements, rather than incentive-based arrangements. More than half of 3PLs respondents (54%) say they have engaged in gainsharing agreements with customers, consistent with past reports.
• Interest in collaborating with other companies, even competitors, to achieve logistics cost and service improvements is also down. This strategy has not been wildly popular during the years we included it in the survey, with just 41% of shipper respondents this year reporting use of collaboration to achieve logistics cost and service improvements compared to 44% in last year’s study. Our interpretation is
9Current State of the 3PL Market
Our research reveals recent declines in the openness of some shippers to more innovative 3PL-shipper arrangements.

not that shippers regard collaboration as unimportant, but rather that many 3PLs and shippers addressed collaboration first by seeking to establish an industry standard, rather than initially involving only a small number of partners to prove the concept, and subsequently expanding the resulting platform to others.
As indicated in the next section, many shippers prefer 3PL relationships that are tactical and/or operational rather than strategic, making approaches such as gainsharing and collaboration less of a fit with their current methods for managing 3PL relationships.
3PLs’ Advanced Capabilities Less Tapped
Whether it’s disinterest or the difficultly in overcoming trust and risk obstacles that is stalling progress of 3PL-shipper relationships along the maturity curve, the evidence of such stagnation shows up each year in the list of 3PL service offerings and those services shippers used. This year, the two are combined into Figure 4 to reveal the extent of the contrast.
Typically, 3PLs develop a substantial number of services to respond effectively to customers’ logistics needs. Yet each year, we find transactional, operational, and repetitive activities tend to be the most frequently outsourced. These include international and domestic transportation (76%
and 71% across all regions studied), warehousing (63%), freight forwarding (53%), and customs brokerage (52%).
The less-frequently used 3PL services tend to be somewhat more strategic, customer-facing, and IT-intensive, such as order management and fulfillment (16%), IT services (13%), supply chain consultancy services (10%), fleet management (8%), customer service (10%), and LLP/4PL services (8%).
Another little-used 3PL offering is sustainability/green supply chain-related services (6%). Green supply chain has seen varying levels of interest since we studied the topic closely for the 2008 3PL Study. This year, 52% of shippers say fuel efficiency and carbon emissions have become an important part of their 3PL procurement decision
Shipper Percentages 3PL Percentages
Outsourced Logistics ServiceAll
RegionsNorth
AmericaEurope Asia-Pacific Latin America
International Transportation 76% 64% 86% 79% 82% 71%
Domestic Transportation 71 67 81 76 61 88
Warehousing 63 61 72 59 51 83
Freight Forwarding 53 54 60 46 47 64
Customs Brokerage 52 52 57 44 57 54
Reverse Logistics (defective, repair, return) 26 27 31 23 19 60
Cross-Docking 25 29 31 18 19 64
Product Labeling, Packaging, Assembly, Kitting
25 25 31 21 20 65
Transportation Planning and Management 22 24 27 19 15 70
Inventory Management 19 16 15 21 17 64
Freight Bill Auditing and Payment 18 32 13 11 5 34
Order Management and Fulfillment 16 20 18 16 9 65
Information Technology (IT) Services 13 16 16 14 9 50
Service Parts Logistics 12 11 14 12 12 39
Customer Service 10 8 7 17 14 67
Supply Chain Consultancy Services Provided by 3PLs
10 14 7 9 9 56
Fleet Management 8 8 8 8 9 26
LLP (Lead Logistics Provider) / 4PL Services 8 8 17 4 4 39
Sustainability/Green Supply Chain-Related Services
6 3 7 6 6 31
Figure 4: 3PLs Offer More Logistics Services than Most Shippers Use
10 2013 THIRD-PARTY LOGISTICS STUDY
Source: 2013 Third-Party Logistics Study

11
processes. But just 26% of shipper respondents rely on 3PLs to provide visibility to fuel efficiency and carbon emissions information. The biggest changes occurred in Asia-Pacific, where the percentages dropped and are now more aligned with the figures for all regions. In Latin America 60% of shippers now see this data as important, but fewer (15%) are relying on 3PLs to provide this type of information.
3PLs’ IT Underdelivering, but Also Underused
Shippers’ propensity to view 3PLs tactically rather than strategically is also reflected in their views of 3PLs’ IT capabilities. As seen in Figure 5, the IT capabilities shippers feel 3PLs must have relate moreso to execution-oriented activities and processes such as transportation, warehouse/DC management, electronic data interchange, visibility, etc., while capabilities that support more strategic and analytical services are lower-ranked.
For 11 years this study has tracked a measurable difference between shipper’s opinions on whether they feel information technologies are a necessary element of 3PL expertise, and whether they are satisfied with their 3PL providers’ IT capabilities. We have referred to this as the “IT Gap.” Figure 6 reveals that over the long term, this gap has narrowed significantly. However, over the last three years the gap appears to have stabilized to some degree. Interestingly, 70% of 3PL respondents feel their customers are satisfied with the IT services provided by 3PLs. Please see the IT Gap section, which explores some of the drivers behind shippers’ expectations of 3PL capabilities as well as factors that inhibit clear communication between shippers and 3PLs.
Information Technologies
Percentages Reported By
Shippers3PL
Providers
Transportation Management (Execution) 72% 84%
Electronic Data Interchange (Orders, Advanced Shipment Notices, Invoicing)
68 79
Transportation Management (Planning) 67 80
Warehouse/Distribution Center Management 64 78
Visibility (Order, Shipment, Inventory, etc.) 60 75
Web Portals for Booking, Order Tracking, Inventory Management, and Billing
59 72
Bar Coding 50 60
Transportation Sourcing 45 58
Global Trade Management Tools (Customs Processing and Import/Export Document Mgt.)
43 42
Customer Order Management 41 64
Collaboration Tools (SharePoint, Lotus Notes, Video Conferencing, etc.)
32 41
Supply Chain Planning 30 59
Network Modeling and Optimization 30 44
Supply Chain Event Management 26 49
Advanced Analytics and Data Mining Tools 26 39
RFID 24 36
Yard Management 17 28
Figure 5: Shippers Still Prioritize Execution-Oriented 3PL IT Capabilities
Figure 6: The “IT Gap” Stabilizing
89%85%
91% 90% 92% 92% 92%88%
94% 93% 94%
27%33%
42% 40%35%
42% 37%42%
54%54% 53%
0%
20%
40%
60%
80%
100%
02 03 04 05 06 07 08 09 10 11 12
Year
IT Capabilities Necessary Element of 3PL Expertise
Shippers Satisfied with 3PL IT Capabilities
“IT Gap”
Current State of the 3PL Market
Source: 2013 Third-Party Logistics Study
Source: 2013 Third-Party Logistics Study

12
The Alternative View: Thoughts from Non-Users of 3PL Services
The Annual 3PL Study has long invited shippers who classify themselves as non-users of 3PL services to provide some insight into their (current) decision not to outsource. Figure 7 features a seven-year look-back at the percentages of non-users indicating why they are not currently using or considering the use of 3PL services. Top-ranked reasons continue to be a feeling that logistics is a core competency of the organization, a belief that cost reductions would not be realized through outsourcing, and shippers viewing logistics as “too important to consider outsourcing.”
It is interesting to note that the reasons for non-users electing not to use 3PLs have diminished over time. For example, from 2006 to 2008 the percentages of shippers selecting “logistics is a core competency at our firm” as a reason not to outsource were 38%, 37% and 45%, respectively. This contrasts markedly with data for 2010 (19%), 2011 (19%), and 2012 (15%). This suggests two things: First, over time there are fewer reasons why firms choose not to outsource. Second, in the past, non-users had more reason to question 3PLs’ capabilities and competencies. Now, they seem to be conceding that 3PLs have improved – but they still feel they can do it better.
Reason
Most Frequently Occurring
(Yearly Rankings and Percent Shippers Indicating Reason)
2013 2012 2010 2009 2008 2007 2006
Logistics Is a Core Competency At Our Firm 1
(15%)
1
(19%)
1
(19%)
2
(27%)
1
(45%)
1
(37%)
1
(38%)
Cost Reductions Would Not be Experienced 2
(15%)
3
(17%)
2
(15%)
1
(32%)
2
(33%)
2
(36%)
2
(31%)
Logistics Too Important to Consider Outsourcing 3
(12%)
2
(18%)
4
(13%)
3
(25%)
4
(30%)
3
(28%)
6
(17%)
Service-Level Commitments Would Not Be Realized 4
(9%)
6
(12%)
5
(11%)
5
(23%)
5
(22%)
3
(28%)
5
(20%)
Corporate Philosophy Excludes the Use of Outsourced Logistics Providers
5
(8%)
8
(8%)
7
(9%)
7
(16%)
7
(13%)
7
(17%)
7
(16%)
We Have More Logistics Expertise Than Most 3PL Providers 5
(8%)
7
(9%)
6
(10%)
6
(17%)
6
(19%)
6
(21%)
4
(20%)
Control Over the Outsourced Function(s) Would Diminish7
(7%)
5
(13%)
3
(14%)
3
(25%)
3
(31%)
5
(23%)
3
(29%)
Too Difficult to Integrate Our IT Systems with the 3PL’s Systems 7
(7%)
4
(14%)
8
(8%)
10
(8%)- - -
Issues Relating to Security of Shipments9
(6%)
10
(5%)
11
(5%)
12
(7%)
8
(14%)
9
(14%)
9
(5%)
Inability of 3PL Providers to Form Meaningful and Trusting Relationships9
(6%)
12
(3%)
12
(3%)
11
(7%)
9
(11%)
10
(12%)
10
(7%)
Global Capabilities of 3PLs Need Improvement11
(5%)
11
(4%)
9
(6%)
9
(10%)
9
(11%)
8
(16%)
8
(9%)
We Previously Outsourced Logistics, and Chose Not to Continue12
(3%)
9
(6%)
10
(5%)
8
(14%)- - -
Figure 7: Reasons for Not Using 3PLs Change Over Time
The reasons for non-users electing not to use 3PLs have diminished over time.
2013 THIRD-PARTY LOGISTICS STUDY
Source: 2013 Third-Party Logistics Study
13Current state of the 3PL Market
Key Takeaways
Key findings about the Current State of the Market for the 2013 17th Annual 3PL Study include:
• Despite the continuing volatility of global business environments, 3PLs are continuing to improve their business presence and create value for their customers. Aggregate global revenues for the 3PL sector continue to rise, particularly in Asia-Pacific and Latin America. A majority of shipper respondents (65%) are increasing their use of 3PL services, while 22% are returning to insourcing some 3PL services and 58% are reducing or consolidating the number of 3PLs they use.
• Total logistics expenditures remain consistent at 12% of sales revenues for shipper respondents, and they spend on average 39% of their total logistics expenditures on outsourcing. Outsourcing accounts for 54% of shippers’ transportation spend and 39% of warehouse operations spend.
• Similar to last year’s results, most shipper respondents (86%) and most 3PL providers (94%) view their relationships as successful. Shippers report measurable logistics cost, inventory cost and logistics fixed asset reductions, and just over half (56%) say their use of 3PLs has led to year-over-year benefits.
• Shippers are more satisfied than 3PLs (71% to 63%) with the openness, transparency, and good communication in their relationships, and 67% of shipper respondents judge their 3PLs as sufficiently agile and flexible.
• Our measures indicate that the openness of some shippers to more innovative 3PL-shipper arrangements appears to be declining somewhat; “gainsharing” between 3PLs and shippers is down and interest in collaborating with other companies, even competitors, to achieve logistics cost and service improvements has also declined slightly since last year.
• Consistent with the past, transactional, operational, and repetitive activities tend to be the most frequently outsourced, in relatively consistent numbers, while 3PLs’ more strategic capabilities are underused, including IT capabilities.
• Over the long term, the gap has narrowed between the value shippers place on 3PL IT capabilities (94% this year) and how they feel 3PLs are meeting their expectations (53%), but this IT Gap appears to have stabilized somewhat over the last few years.
• The variety of reasons driving the decisions of shippers not currently outsourcing logistics are diminishing; main reasons continue to include a belief that logistics is a core competency of the organization and that cost reductions would not be realized through outsourcing.

14 2013 THIRD-PARTY LOGISTICS STUDY
Bringing Bright Solutions to Supply Chains

15
Supply Chain Innovation Shippers Seek Bold, Disruptive Solutions
Supply Chain Innovation
Innovation is widely viewed as essential to the long-term success of an organization. 3PLs and shippers can’t simply continue to make incremental improvements to what they do now; constant innovation is required to discover new paths to growth and differentiation. But innovation is becoming more challenging as the logistics industry matures and markets become more global. Fundamental changes are required in 3PL-shipper relationships to create a foundation for the innovation shippers need to solve their supply chain challenges.
The Changing Rules of Innovation
Innovation is defined as the creation of better or more effective products, processes, services, technologies, or ideas that are accepted by markets, governments, and society (shippers and 3PLs). New ideas are invented, but it takes innovation to put those new ideas to use in the real world.
“Many 3PLs are too reactive,” said Quentin Tse, Formerly VP Network Strategic Sourcing, Ericsson North America, at the Jersey City Accelerated Solutions Environment. “They need to become more proactive. 3PLs and customers need embedded partnerships where 3PLs are more strategically involved with their customers.”
Until recently, 3PLs could demonstrate innovation by introducing process improvements, adding technology, improving execution, or offering new services such as order management, customer service, or transportation planning. But as seen in Figure 4 in the Current State of the 3PL Market, many such additional services were
not always created in response to true customer demand.
The underlying message: Shippers increasingly believe that these process improvements are not sufficient to drive their supply chains. Innovation needs to be more significant, and 3PLs and shippers need to work on game-changing innovations to compete in today’s environment.
“All of my 3PLs can innovate. This is part of the selection of partners,” says Johan Jemdahl, Vice President, Supply Chain Operations EMEA, at Cisco Systems. “But it’s about disruptive innovation and how providers can help us change the game to improve our supply chain.”
Innovation is the term used in most supply chain discussions – and in the questions put to respondents as part of the survey and used throughout this report. But what these shippers are really seeking is disruptive innovation. A disruptive innovation is a new product or service idea that when implemented significantly disrupts a market and/or value chain by either simplifying, automating, generating value, or reducing costs. It helps create a new market and value network by disrupting an existing market and value network and displacing an earlier product or service. Examples of disruptive innovations include cell phones versus wireline phones, and RFID tagging.
What Is Changing
Shippers are being pressured by multiple factors that must be addressed in their supply chains. Competition and pricing pressures are driving them to
seek lower labor and manufacturing costs around the world while also minimizing the effect of taxes and tariffs. As they are extending to new markets for both sourcing and sales, shippers are also constantly revisiting old sourcing decisions and in some cases pulling production closer to target markets. All of this means supply chains are growing increasingly complicated and more susceptible to disruption.
As a result, shippers are seeking increasingly relevant supply chain innovations that reduce costs as well as add value, supporting needs such as new product marketing, developing market entry, logistics/IT integration, or sustainability initiatives. Several ASE and workshop participants noted that innovation is case-specific. “Innovation for me might not be innovation for others,” said Graham Wilkie, E-Commerce Supply Chain Director at Carrefour, at the study workshop conducted in Paris, France.
But many of today’s 3PL-shipper relationships are not set up in a way that fosters innovation. Shippers commonly engage 3PLs on only a tactical level, so their 3PL partners lack real visibility into their organization and its challenges. Metrics in place internally and between 3PLs and shippers limit or work counterproductively to innovation. Contract duration and risk mitigation strategies also can limit the opportunities for innovation. “Creating long-term governance in a three- to five-year (contract) cycle does not lend itself to investments in innovation,” said Carrefour’s Wilkie.

Some shippers also seem to lack confidence in 3PLs’ ability to operate at the strategic level necessary for disruptive innovation. The majority of 3PL respondents (89%) to the Annual 3PL Study survey believe they are ready to innovate. But just 53% of shippers agree and another 33% are not sure.
“There is a constant pressure on consistent delivery versus time out to innovate,” said one workshop attendee.
As seen in Figure 8, shippers and 3PLs think of themselves as the largest source of innovation, and the other as the second largest source.
The ability for 3PLs to drive innovation is not just important to satisfy shippers’ evolving needs. It is also necessary for 3PLs to remain profitable. At the ASE in Jersey City, NJ, Jim Carey, Senior Vice President Sales & Marketing at Clancy Companies, noted, “Lack of innovation increases the chance of commoditization. It fosters commoditization, stagnancy and in the end, obsolescence.”
Enriching Relationships
Fortunately, shippers and 3PLs agree on the factors it takes to develop infrastructure that supports innovation. Shipper respondents (93%) and 3PL respondents (89%) are nearly unanimous in their belief that 3PLs should have a defined structure for innovation.
Even better, as seen in Figure 9, they also agree on the top drivers for innovation, although the order is slightly different. Shippers regard a trusting relationship as the most important driver, while 3PLs rank this second to talent/right people. Operational excellence, a culture of collaborative continuous improvement, and technology round out the top five.
Figure 8: Shippers, 3PLs See Themselves as Top Innovation Originators
Figure 9: Shippers, 3PLs Relatively Aligned on Top Drivers for Innovation
30%
35%20%
11%
4%
Shippers
36%
28%
3PLs
7%
Where 3PLs Say Innovations Come From
Where Shippers Say Innovations Come From
12%
17%
Consultants OtherIT Companies
12%
13%
13%
25%
26%
27%
28%
31%
33%
33%
41%
44%
47%
14%
44%
21%
36%
52%
43%
42%
47%
55%
57%
71%
62%
67%
0% 10% 20% 30% 40% 50% 60% 70% 80%
Regulations (Government, Industry, etc.)
Exposure to Overall Business Challenges and Drivers
Contractual Framework
Process Integration
Executive Commitment
Financial Incentives (i.e., Gainsharing)
Measurements/Metrics
Communication
Culture of Collaborative Continuous Improvement
Technology
Talent/Right People
Operational Excellence
Relationship and Trust
3PLs Shippers
16 2013 THIRD-PARTY LOGISTICS STUDY
Source: 2013 Third-Party Logistics Study
Source: 2013 Third-Party Logistics Study

The Current State of the 3PL Market section notes a moderate decline of interest in mechanisms that some believe would improve efficiency and effectiveness and drive innovation, such as gainsharing and interest in collaborating with other companies, even competitors. Those results are echoed in these findings: Both shippers and 3PLs gave lukewarm ranking to financial incentives as a driver of innovation. Contractual framework was rated even lower, with only 13% of shippers and 21% of 3PLs calling it a top driver.
“The contract is a framework for our collaboration, but not the actual collaboration,” said Cisco’s Jemdahl. “So much is constantly in motion and happening. There are so many threads of info/input, and as I used to say, ‘Facts aren’t, facts become,’ which tells us that whatever brought us here won’t keep us here. We need talented people to navigate, conceptualize and act on all this. Only humans have that capability. People are responsible, not a ‘project’ nor a ‘contract’ nor a ‘process’.”
Relationships That Foster Innovation
The unifying theme of these results is that it takes true collaborative, strategic relationships among all partners to develop the kind of disruptive innovations it will take to solve the challenges facing today’s supply chains. That represents a considerable change from the way many 3PL-shipper relationships are structured today.
A June 2010 review of current research on logistics service provider innovation by Christian Busse and Carl Marcus Wallenburg, Innovation Management of Logistics Service Providers, found that both 3PLs and shippers can facilitate supply chain innovation by leveraging organizational and technology-focused drivers:
Organizational Drivers:
Fostering Collaboration through Structure: The capacity for 3PLs to innovate is driven by frequent, repeated collaboration with their customers,
because frequent contact builds trust, eases communication, and reduces the instinct for knowledge protection. “More dimensions of relationship bring more opportunity to innovate,” noted a participant at one of the Annual 3PL Study workshops.
For 3PLs this means shifting to a decentralized structure with a seasoned, operations-focused 3PL representative on site at the shipper’s location, where 3PL and shipper can devise tailored solutions free from bureaucracy and standardized approaches. Conversely, the ideal model for a shipper is to create an Innovation Center of Excellence, a think tank focused exclusively on innovation. The success of the Center of Excellence in interacting with internal and external stakeholders to foster and implement innovation is critical for driving disruptive innovation.
Relationship Governance: Simply boosting face time isn’t enough, however. Current 3PL-shipper relationships are too often “single point” and do not bring the right people nor the right relationships into play. A formalized relationship management approach sets the stage for how the partners will drive the business and promote collaboration. Options include:
•A tiered structure that vertically aligns the 3PL’s and shipper’s top management, mid-management, and workforce. Each tier examines the relationship’s tactical, strategic, and transformational performance.
•Horizontal, peer-to-peer mapping that matches employees from both the 3PL and shipper in similar tiers and roles. Once mapped, communications protocols establish how each set of peers can discuss tier-appropriate items. As companies become more global, horizontal integration can support more complex structures and interfaces.
•Embedding Innovation into the Organization: Perhaps the biggest challenge in fostering disruptive innovation is developing a culture that promotes and rewards it. For
3PLs this often means shifting from a physical mindset focused on day-to-day operational delivery to one based on knowledge, including strategy collaboration and innovation. A transformation management process is a valuable means to create an environment that values innovation and embeds it in the vision.
Murphy Ho, Regional Logistics Manager, Asia, of Celestica, noted this at the Hong Kong workshop: “It’s about relationships, relationships between 3PLs and shippers and also the relationships within organizations and between departments.”
Technology drivers
Advanced IT and Mobile Solutions: As noted in the Current State of the 3PL Market section, the “IT gap” has been reduced by 21% over the past half-decade. But even with that improvement, the gap has stabilized in recent years, with just 53% of users saying their 3PL meets expectations. A major frustration is a lack of visibility. Use of SaaS- and cloud-based solutions together with robust, real-time, anywhere access to data enabled by mobile apps and smartphones hold promise for breaking through this barrier.
Big Data and Analytics: Also offering great potential are technologies to gain control of the huge volumes of data generated by today’s multifaceted supply chains. Emerging big data solutions, paired with robust analytics engines, will empower both 3PLs and shippers to find meaningful patterns and trends in data. That visibility is a key ingredient to revealing new opportunities for innovation.
“Managing the balance between visibility and data is critical to 3PLs and shippers,” says Leanne Hill, Vice President, Global Supply Chain, Duty Free Shoppers. “Getting this right can separate high-performing relationships and drive supply chain success, but to be successful in this area requires close collaboration between shippers and 3PLs.”
Supply Chain Innovation 17

18
Social Media: A growing number of companies are learning to leverage social media to enhance communication across the supply chain. According to Social CRM in the Supply Chain, a fall 2011 report from IDC Research Services, logistics companies using social media identified significantly more benefits than non-users, especially around communication and tracking industry trends. A substantial 88% of respondents reported time savings greater than 10% using social media, and 60% said it improved their satisfaction with a supply chain vendor or partner somewhat or to a great extent. Social media can potentially facilitate the previously addressed horizontal integration model for relationship governance.
Israel-based global generic pharmaceuticals leader Teva has used social media tools to create a virtual supply chain community for use by internal operations professionals and external suppliers, according to the IDC report. The spontaneous discussion fostered by social media led to an improvement in upstream supply lead time from 15% to 60%, and operational cycle time improved by 40% in four months.
Funding Innovation
Implementing the cultural and technical infrastructure to create an environment that supports development of disruptive innovation requires considerable investment. As seen in Figure 10, shippers assert that they are willing to pay 3PLs for the required investment. Interestingly, despite its relative unpopularity, shippers cite gainsharing as their chief means to fund this investment (49%), followed by additional business and pay for performance. 3PLs agree that shippers are willing to pay them for innovation, but see additional business as the leading method (43%).
Figure 10: Shippers and 3PLs Agree on Top Funding Source for Innovation
Yes -Additional Business
Yes -Gainsharing
I Am Willing to Pay My 3PL for Innovation Shippers are Willing to Pay 3PL for Innovation
Yes -Bonus for Performance
5%
36%
No
39%
31%
Not sure
Shippers
13%
19%19%
43%
49%
19%
3PLs
Supply Chain Innovation: Key Takeaways
• Fundamental changes are required in 3PL-shipper relationships to create the foundation for truly disruptive innovations shippers need to solve their supply chain challenges.
•Shippers and 3PLs agree on the top drivers for innovation, although in different order. These are relationship and trust, talent/right people, operational excellence, a culture of collaborative continuous improvement, and technology. Arriving at disruptive innovations requires true collaborative, strategic relationships among shippers and 3PLs.
• Shippers and 3PLs can facilitate supply chain innovation by leveraging organizational drivers such as fostering collaboration through structure, relationship governance, and embedding innovation into the organizations as well as technology-focused drivers: advanced IT and mobile solutions, data and analytics, and social media.
•Shippers assert that they are willing to pay 3PLs for the required investment in innovation.
It’s about relationships, relationships between 3PLs and shippers and also the relationships
within organizations and between departments.
2013 THIRD-PARTY LOGISTICS STUDY
Source: 2013 Third-Party Logistics Study

19Supply Chain Innovation

20
The IT Gap
Shippers feel strongly that IT capabilities are at the core of a 3PL’s ability to provide value, as seen in Figure 6 in the Current State of the 3PL Market section. This year’s survey found nearly 25% of 3PLs are responding aggressively to fulfill this need, describing themselves as willing to adopt technologies while they are relatively new and risky — while 52% of 3PLs call their IT investments mainstream and 26% call them conservative.
Yet the difference between what shippers feel is important and their ratings of their 3PLs’ current IT capabilities has stabilized at around a 40-point gap. Shippers are much less likely to call 3PL
investments aggressive (12% vs. 23% for 3PLs), and 35% say they’re conservative. It’s possible that 3PLs are simply not fully informing shippers about their IT capabilities. However, it is more likely that shippers are seeing what they have and finding it lacking.
Similar to the overall 3PL-shipper relationship, shippers are most likely to call their relationship with their 3PL’s IT group project-focused (46%) or tactical (29%), and 14% even describe the relationship as contentious (Figure 11). Just 11% of shippers say it’s strategic, while 3PLs are much more likely (23%) to describe the relationship their IT
department has with their customers as strategic.
Shippers want 3PLs to offer comprehensive and easily integrated solutions. Yet there is an approximately 20% difference between shippers’ satisfaction with basic IT services and 3PLs’ ratings of their own capabilities, such as for IT operations, applications, integration and staffing (Figure 12). The resulting position shows a significant opportunity for 3PLs to improve their technical relationships with shippers. And in fact, 55% of shippers say they want to develop a strategic technical relationship with their 3PLs.
2013 THIRD-PARTY LOGISTICS STUDY

21The IT Gap
Figure 11: Relationship between Shippers and 3PL’s IT Group
Figure 12: Percentage of Response of Above Average or Better Ratings for 3PL Capabilities
11%
Shippers’ Current View
Strategic
Tactical
Project-Focused
Contentious
34%
3PLs’ Current View
Shippers’ Desired view
29%46%
14% 23%
31%
12%
50%
29%
16% 5%
23%
27%
28%
31%
33%
34%
34%
35%
36%
38%
46%
39%
49%
50%
39%
49%
55%
40%
52%
63%
59%
67%
0% 10% 20% 30% 40% 50% 60% 70%
IT Consulting Services
IT Operations
Integration (B2B, Application to Application)
Methodologies and Governance
Support (e.g., Help Desk, Call Center)
Applications
Technical Infrastructure
Information Transparency (e.g., Visibility, Analytics, etc.)
Reliability (e.g., Service Level Compliance)
3PLs Shippers
On-boarding Time & Effort
Staffing - Skills and Talent
Source: 2013 Third-Party Logistics Study
Source: 2013 Third-Party Logistics Study
The good news is that 3PLs are hearing the call. Just over half of 3PL respondents say they are likely to make large investments in modernizing applications, and 65% plan on buying solutions to reduce client on-boarding costs, time, and effort.
But these investments must not be made in a vacuum. 3PLs cannot make the right investments until they have a clear picture of their customers’ supply chains and the challenges they face. Some 3PLs regularly invite their customers to collaborative meetings, where these shippers share the issues they are struggling with and the 3PL develops a solution that they can then go market to other companies, such as developing an execution-based in-transit visibility capability.
A major question is what investment in time and resources is required by both parties to actually develop a strategic IT relationship, and is there enough value realized to justify the investment? These questions challenge the transactional relationship that often exists today, focused on KPIs and cost. More in-depth and timely communication sharing regarding shippers’ challenges and opportunities is required to align 3PLs’ priorities and investments. Ultimately, a collaborative approach to IT planning ensures 3PLs are investing in what shipper’s value, instead of what they think they value. Greater collaboration ensures a more strategic relationship.
As seen in the innovation section, IT remains a key aspect and opportunity to drive innovation. With the right relationship governance structure that includes IT, collaboration between shippers and 3PLs will further improve shipper satisfaction with 3PL IT offerings, driving increased innovation and improving the overall relationship.

22 2013 THIRD-PARTY LOGISTICS STUDY
Responding to and Preparing Against Disruptions
23
Supply Chain Disruption Risk is Increasing, Executive Support and Funding are Lagging
Supply Chain Disruption
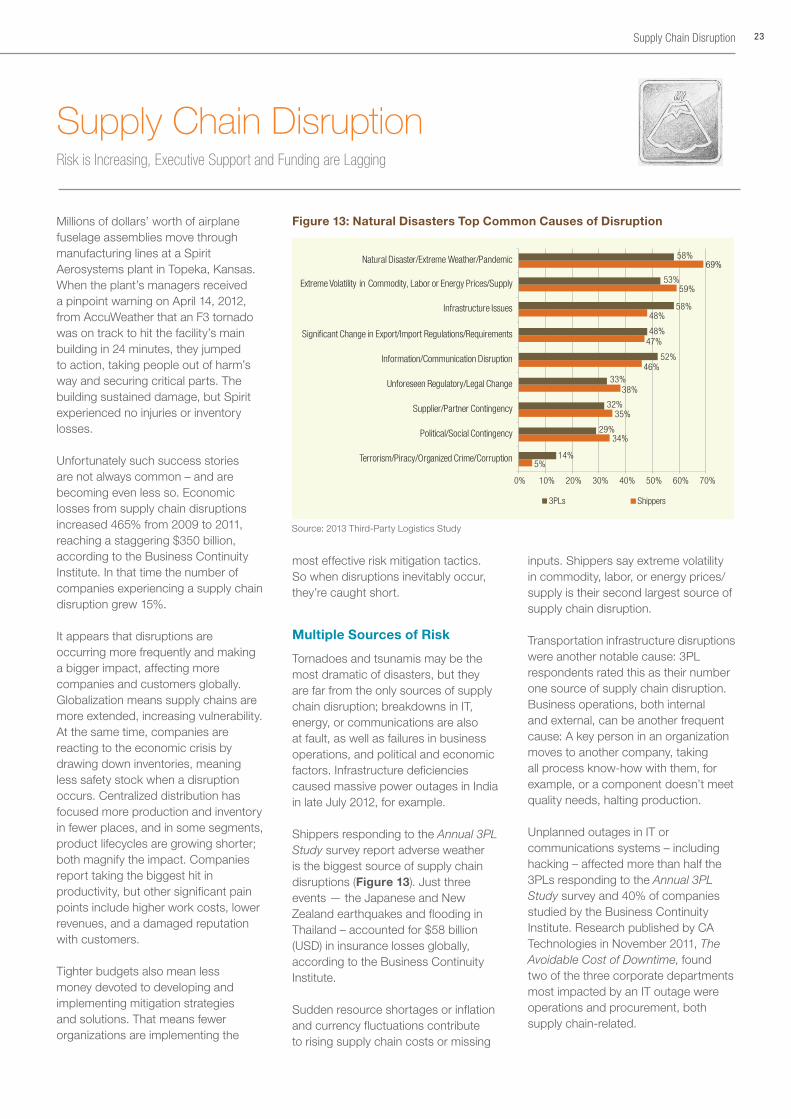
Millions of dollars’ worth of airplane fuselage assemblies move through manufacturing lines at a Spirit Aerosystems plant in Topeka, Kansas. When the plant’s managers received a pinpoint warning on April 14, 2012, from AccuWeather that an F3 tornado was on track to hit the facility’s main building in 24 minutes, they jumped to action, taking people out of harm’s way and securing critical parts. The building sustained damage, but Spirit experienced no injuries or inventory losses.
Unfortunately such success stories are not always common – and are becoming even less so. Economic losses from supply chain disruptions increased 465% from 2009 to 2011, reaching a staggering $350 billion, according to the Business Continuity Institute. In that time the number of companies experiencing a supply chain disruption grew 15%.
It appears that disruptions are occurring more frequently and making a bigger impact, affecting more companies and customers globally. Globalization means supply chains are more extended, increasing vulnerability. At the same time, companies are reacting to the economic crisis by drawing down inventories, meaning less safety stock when a disruption occurs. Centralized distribution has focused more production and inventory in fewer places, and in some segments, product lifecycles are growing shorter; both magnify the impact. Companies report taking the biggest hit in productivity, but other significant pain points include higher work costs, lower revenues, and a damaged reputation with customers.
Tighter budgets also mean less money devoted to developing and implementing mitigation strategies and solutions. That means fewer organizations are implementing the
most effective risk mitigation tactics. So when disruptions inevitably occur, they’re caught short.
Multiple Sources of Risk
Tornadoes and tsunamis may be the most dramatic of disasters, but they are far from the only sources of supply chain disruption; breakdowns in IT, energy, or communications are also at fault, as well as failures in business operations, and political and economic factors. Infrastructure deficiencies caused massive power outages in India in late July 2012, for example.
Shippers responding to the Annual 3PL Study survey report adverse weather is the biggest source of supply chain disruptions (Figure 13). Just three events — the Japanese and New Zealand earthquakes and flooding in Thailand – accounted for $58 billion (USD) in insurance losses globally, according to the Business Continuity Institute.
Sudden resource shortages or inflation and currency fluctuations contribute to rising supply chain costs or missing
inputs. Shippers say extreme volatility in commodity, labor, or energy prices/supply is their second largest source of supply chain disruption.
Transportation infrastructure disruptions were another notable cause: 3PL respondents rated this as their number one source of supply chain disruption. Business operations, both internal and external, can be another frequent cause: A key person in an organization moves to another company, taking all process know-how with them, for example, or a component doesn’t meet quality needs, halting production.
Unplanned outages in IT or communications systems – including hacking – affected more than half the 3PLs responding to the Annual 3PL Study survey and 40% of companies studied by the Business Continuity Institute. Research published by CA Technologies in November 2011, The Avoidable Cost of Downtime, found two of the three corporate departments most impacted by an IT outage were operations and procurement, both supply chain-related.
Figure 13: Natural Disasters Top Common Causes of Disruption
5%
34%
38%
46%
47%
59%
69%
14%
29%
33%
52%
48%
53%
58%
0% 10% 20% 30% 40% 50% 60% 70%
Terrorism/Piracy/Organized Crime/Corruption
35%32%Supplier/Partner Contingency
Political/Social Contingency
Unforeseen Regulatory/Legal Change
Information/Communication Disruption
Significant Change in Export/Import Regulations/Requirements
Extreme Volatility in Commodity, Labor or Energy Prices/Supply
48%58%Infrastructure Issues
Natural Disaster/Extreme Weather/Pandemic
3PLs Shippers
Source: 2013 Third-Party Logistics Study

Political and economic factors are also causes of disruption. For example, in 2011 civil unrest from the “Arab Spring” impacted firms that rely on suppliers in Middle East or North African nations, particularly those that need the rare minerals and fossil fuels found in these regions.
Supply Chain Complexity Increases Risk
Supply chains are more vulnerable than ever before to negative impact from disruptive events. Logistics networks have expanded to new locations for both sourcing and sales; this often leads to increased outsourcing and more partners. A longer geographic reach also increases the odds that at least one location along the supply chain will experience a disruptive event.
In its report, Supply Chain Resilience 2011, The Business Continuity Institute found 61% of supply chain disruptions came from a direct supplier and 39% from a supplier’s supplier. However, 75% of companies only monitor their Tier One suppliers. This means most companies do not have direct communication with the source of two of every five disruptions.
At the 2013 Annual 3PL Study workshops, many participants noted that they typically address an unwieldy number of suppliers and sub-suppliers by assigning responsibility for risk mitigation of supplier’s suppliers to their Tier One suppliers in contracts. But in practice, Tier One supplier compliance with this requirement is rarely verified and audited, and is tested even less frequently. Companies lack a tactical approach to identifying the biggest risks across their supply networks, as well as processes for actively mitigating and monitoring these risks.
In interviews with earthquake-impacted companies in early 2012, the Business Continuity Institute found that 29% recovered within a week, 24% required up to a month and 41% took one to six months to get back to normal operations, according to Global Supply Chain Resilience: Lessons Learned from the 2011 Earthquakes.
Opportunity to Improve Risk Mitigation
Both shippers and 3PLs are sensing the increased risk of disruption. Nearly half of 3PLs and shipper respondents agree that their organizations are putting a greater focus on supply chain risk and mitigation than five years ago, and another 29% of shippers and 27% of 3PLs call the focus significantly greater.
As seen in Figure 14, partnerships, business continuity planning, supply chain visibility tools, and employee training/talent management are the top strategies companies currently use to mitigate their supply chain risk, although shippers and 3PLs rank these in a slightly different order. They are also the top strategies shippers and 3PLs are planning to invest in over the next two years.
All are valuable contributors to a sound risk mitigation strategy. Equally notable are the approaches that are not highly ranked, such as supplier scorecarding and supply chain mapping.
Business continuity planning ranks highly and is a somewhat common risk management solution. However, these plans are often one-time projects for many companies. Groups are formed and plans made in the aftermath of a disruption, but no one is assigned adequate responsibility for maintaining processes and monitoring compliance. Over time the commitment fades, and the company is caught off guard when the next disruption ensues.
A more advanced solution is the development of a risk management organization. This group does not have to be large or overly complex, but should have the skills and experience to define cross-functional solutions. This approach often produces more effective and efficient solutions, not relying solely on procurement or partners to identify and execute. Over time the group also spreads the knowledge of risk management so that in the future more employees consider risk in their everyday decisions.
Vendor Risk Assessment Growing More Comprehensive
Credit worthiness is no longer a sufficient indicator of the risk associated with doing business with a particular vendor. Today best practices in vendor risk management dictate assessing every trading partner against multiple financial and non-financial risk categories. Research conducted by vendor risk detection service provider Briefcase Analytics found that companies’ top goals for vendor risk detection are insuring against risk (48%), avoiding surprises (46%), predicting vendor failure (42%), and gaining leverage in negotiations with vendors (37%).
Looking beyond credit risk helps companies understand how a company has achieved its current financial position as well as its relative risk in multiple dimensions. In addition to financial health, a comprehensive vendor assessment examines risk areas including business integrity; privacy and intellectual property; health, safety, and environment; labor and human rights; and sustainability.
The most-used tools for vendor risk assessment, according to the Briefcase Analytics survey:
•Contract clauses (83%)
•Physical inspections (69%)
•Vendor intelligence data (62%)
•Vendor self-reporting (60%)
•Vendor codes of conduct (49%)
Sources of data on companies of all sizes, both public and private, have expanded considerably over the past seven years. That’s allowing companies to work toward assessing 100 percent of their trading partners, rather than just public companies. Researchers have identified more than 600 publicly available databases reporting vendor risk data for more than 50 countries.
Risk assessment firms such as Briefcase Analytics use advanced technologies and data-mining techniques on a global basis to help companies mitigate their supply chain risk and inform negotiation with suppliers.
24 2013 THIRD-PARTY LOGISTICS STUDY

Figure 14: Shippers and 3PLs Aligned on Current and Future Mitigation Strategies
0% 10% 20% 30% 40% 50% 60% 70%
Disruption News Feeds
Insurance
Decision Support Tools
Supply Chain Mapping
Advanced Enterprise Risk Management Organization
Supplier Scorecarding
Employee Training / Talent Management
Supply Chain Visibility Tools
Business Continuity Planning
Partnerships
3PL Shipper
3PL Shipper
0% 10% 20% 30% 40% 50% 60% 70%
Disruption News Feeds
Insurance
Advanced Enterprise Risk Management Organization
Supply Chain Mapping
Decision Support Tools
Supplier Scorecarding
Business Continuity Planning
Employee Training / Talent Management
Partnerships
Supply Chain Visibility Tools
Current Mitigation Strategies
Future Mitigation Strategies
15%
29%
30%
32%
43%
44%
50%
53%
61%
68%
14%
33%
33%
32%
41%
33%
64%
65%
62%
69%
7%
15%
36%
37%
37%
38%
47%
53%
56%
61%
8%
17%
36%
27%
41%
35%52%
70%
62%
67%
Supply Chain Disruption 25
Fueling the Problem
Despite growing awareness of the risks of supply chain disruption, many companies have not followed through with significant investment in solutions. Figure 15 reveals that 3PLs and shippers largely agree on the most common reasons for underfunding their supply chain disruption mitigation or response:
• Lack of understanding of available mitigation tools. It is apparent that while companies acknowledge the frequency and impact of disruptions, many have done little to investigate the potential tools that are available to manage this risk. In most cases companies depend on partners or business continuity plans for this task.
• Capital unavailable. More than half of shippers (55%) and 3PLs (57%) plan to invest less than $1 million on their supply chain disruption/mitigation response capability, despite the increasing organizational focus they report on risk mitigation. This relates strongly to the fourth-ranked reason for underfunding: lack of executive commitment. It can be tough to sell the leadership on diverting budget to something that might happen when there are so many competing priorities that must or will happen.
• The feeling that current risk mitigation capability is not a problem. Often, this belief is a result of the rather short lifespan of institutional memory. Those who experienced the company’s most recent supply chain disruption first-hand move on, and those who follow do not have the same scars or memories.
Several automakers with experience in managing through the disruptions caused by the September 11th attacks and the volcanic ash cloud were quickly reminded of the value of risk mitigation planning following the March 2011 earthquake and tsunami in Japan. The disaster closed down a factory operated by Merck Chemicals International of Germany that serves as the only source of Xirallic® pigments,
Source: 2013 Third-Party Logistics Study
for three months. As a result, at least six manufacturers lost a key markup opportunity with customers seeking the glittery, more intense and shiny finish the pigments enable, according to a May 2011 report from the Congressional Research Service. Manufacturers with more resilient supply chains were able to quickly obtain replacement colors from other sources, while others took longer. Combined with other parts shortages, the incident impacted second-quarter US production plans by as many as 400,000 units.

From Intent to Action
The Business Continuity Institute Global Supply Chain Resilience report revealed that 70% of companies were making changes to their supply chain strategies in the wake of disruptive incidents, with another 12% making significant changes. Developing a resilient supply chain, one that contains risk while enabling business growth, starts with probing questions, such as:
•Transparency: Do the members of the supply chain network share enough information to deliver value?
•Talent: Does the supply chain network have the talent necessary to innovate and compete in the long run?
•Scalability: Does the supply chain have the ability to increase production based on demand?
•Finance: Do suppliers have any financial constraints that inhibit their ability to fulfill business obligations?
•Geography: Are suppliers located in unsafe places? Do firms or suppliers over-rely on one specific region or channel?
•Reliance: Is the firm relying too much on certain suppliers throughout the supply chain?
•Regulation: Do laws and regulations impact how firms and suppliers operate in certain areas?
A complete mitigation and continuity strategy often includes the following:
Supply Chain Mapping: Supply chain mapping is an essential first step to measuring and monitoring risk; if you don’t know you have a Tier 3 supplier in Thailand, you don’t know that a flood there will impact your business. Mapping identifies the most critical operations and the points of greatest vulnerability.
Partnerships: Companies best equipped to react rapidly to supply chain disruptions are those that take a collaborative approach to managing their supply chains. Third-party logistics companies can be invaluable partners in helping shippers assess their supply chain risks and formulate plans to make them more agile and resilient.
“We are increasingly seeing risk-conscious customers engaging us to map and evaluate their supply chain networks,” says Peter Karel, Global Head of Supply Chain Solutions, Panalpina. “It is not only about monitoring the risk, but also about the resilience and effectiveness of their supply chains. Ensuring a continuous and effective operation of their supply chain is a critical aspect from the board room to shop floor.”
Business Continuity Planning: Business continuity plans – not created once and put up on a shelf, but actively monitored, measured and modified – are on the rise. The Business Continuity Institute’s Global Supply Chain Resilience: Lessons Learned from the 2011 Earthquakes report found an increase in the number of US companies with such plans over the last five years, from 72% to 84%. The lessons learned through interviews with companies impacted by the earthquakes include:
•Suppliers need to have tested continuity plans
•Analysis must extend to Tier 2 and 3 suppliers, when appropriate
•A human behavior-based business continuity approach is essential, in addition to a technical one
Risk Management Organizations: The secret to making a business continuity plan a living document is to assign clear responsibility for it. Risk management organizations work best as specifically trained professionals that work as extensions of the functional teams, rather than as bureaucratic outsiders. They own the plan and work collaboratively with the team and partners to ensure ongoing processes and decisions are in line with its tenets, educating team members and developing a cross-functional risk management culture.
Supply Chain Visibility Tools: Members of the supply chain network must share enough information to ensure complete visibility into status and events.
Just hours after Japan’s 2011 earthquake and tsunami, construction equipment maker Caterpillar was able to determine which containers and inventory had remained in an affected port and which had made it onto a ship and out of harm’s way, and adjust
Figure 15: Shippers and 3PLs Have Many Reasons for Underfunding Mitigation
3PL Shipper
0% 5% 10% 15% 20% 25% 30% 35% 40% 45% 50%
Other
Inability to Build Business Case for Investments
Lack of Executive Support
Lack of Understanding of Available Tools for Supply Chain Disruption Response/Mitigation
Lack of Partnership Support (e.g., Suppliers,Buyers, 3PLs)
Supply Chain Disruption Mitigation/Response Capability has not been a Problem
7%
26%
35%
37%
41%
42%
49%
5%
30%
39%
36%
43%
42%
46%
Future Mitigation Strategies
Lack of Available Capitals
26 2013 THIRD-PARTY LOGISTICS STUDY
Source: 2013 Third-Party Logistics Study

production schedules to keep plants running. Competitors were not so well-prepared and had to shut down production, according to Supply Chain Management.
Supplier Scorecarding is a valuable tool for ensuring compliance with mitigation requirements and collaborating on continuous improvement efforts.
Insurance: Insurance and option/future pricing are increasingly being used to mitigate and recoup losses. For example, companies in the food industry are more often purchasing recall insurance as regulation increases. Another common strategy is requiring suppliers to be sufficiently insured.
Companies that have successfully implemented effective supply chain mitigation solutions often apply new
thinking to traditional mitigation strategies. For example, instead of consolidating suppliers, they may shift to a more diverse set of suppliers that offer varied levels of risk. They may pursue a deep knowledge of suppliers, instead of the basic knowledge they have now. And they may replace a just-in-time strategy for all inventory with one that selectively stockpiles the most critical items and components.
Among the lessons from recent natural disasters is that a victim mentality is not an appropriate response to supply chain disruption. A focused assessment of the current state of the network is the first step to understanding the risk, followed by a well-considered plan of attack to both mitigate the biggest sources of vulnerability and respond when disruptions occur.
The experiences of companies that have successfully managed through disruptions with proactive, disciplined planning prove that a sound mitigation strategy can both avoid costs and create a competitive advantage, making supply chains more resilient without exorbitant costs.
Supply Chain Disruption: Key Takeaways
• The number of companies experiencing a supply chain disruption has increased 15% since 2009, due largely to extended supply chains and just-in-time inventory. Disruptions often result in reduced productivity, higher work costs, lower revenues, and a damaged reputation. In 2011 supply chain losses hit a staggering $350 billion. Disruptions include natural disasters and breakdowns in IT, energy, or communications, as well as failures in business operations and political and economic factors.
•Despite the increased risk, companies are underfunding supply chain disruption mitigation planning. Developing a resilient supply chain that balances risk with growth opportunity starts with a rigorous assessment. Partnerships, business continuity planning, supply chain visibility tools, and employee training/talent management are the top strategies companies currently use to mitigate their supply chain risk. But these are not as effective without the lesser-used strategies, such as supply chain mapping and advanced enterprise risk management.
•Developing a resilient supply chain, one that limits risk while enabling business growth, requires an honest assessment of the current network followed by a well-considered plan of attack to both mitigate the biggest sources of vulnerability and respond when disruptions do occur.
Supply Chain Disruption 27
Quantifying Supply Chain Disruption Risk
Sources of supply chain disruption are well-established. As companies look to investigate and understand potential solutions to supply chain disruption, service providers such as FreightWatch International offer support to companies’ risk mitigation plans, helping them develop real mitigation strategies to quantify the risk. These service providers model a company’s supply chain, assessing risk and quantifying the rate at which shipment delays can be expected. A FreightWatch assessment includes six types of supply chain disruption risk:
Crime: Criminal activity is a major concern for some industries in certain regions of the world. This measure analyzes the rate at which crime can affect the flow of goods based on commodity type and routing.
Terrorism: This assessment predicts the likelihood of a disruption based on historical events and known terrorist groups in a country or region.
Infrastructure: This assesses the state of the infrastructure used to move shipments, and likelihood for disruption.
Government Regulation: This measure provides insight into the potential for delays due to government regulations, such as unpredictable customs procedures.
Labor Unrest: This assessment provides insight into the historical events in a specific region, such as port strikes or protests that cause road closures, and provides a rate at which a shipper can expect delays.
Natural Disasters/Weather: This analysis provides insight into the annual weather patterns of a given region and a rate at which a shipper can expect weather to disrupt the supply chain.
The Monitoring Process
The process starts by documenting the transportation lanes to understand how shipments are moving from origin to destination. This includes identifying routes and modes of transportation, and from there all the possible roads, ports, airports, railroads, and transshipment locations a company’s cargo will pass through. Once this information is gathered, FreightWatch applies the six lenses of supply chain disruption, providing clarity into the likelihood of disruption.

28
Talent Management
agreed that having the right people and leadership in place would be the number one driver of their companies’ success over the next five years. That’s why talent management – the vigorous, systematic process of connecting a clear, well-defined business strategy to the recruitment, retention and development of talent – is increasingly viewed as a strategic agenda item for shippers and 3PLs alike.
“Customer demand for integrated and intuitive systems, tuned to their specific industry and niches, grows louder
every day, in my view,” said Stephen Fraser, former CEO of Horizon Lines and current Board Member, PODS. “Having the right CIO and IT team in place and intimately integrating IT and corporate strategy is essential to meeting demand, retaining customers, and defending/growing market share through differentiation of product and service delivery. This is no longer a matter of IT ‘enabling’ or ‘enhancing’ strategy. IT has become elemental to strategy.”
This commitment is evident in the research for the 2013 Annual 3PL Study. A significant 65% of 3PLs and 50% of shippers indicate that employee training/talent management/internal and external certifications constitute some of the top tools they currently use to mitigate and manage supply chain disruptions. (See Figure 14) A crisis is no time to be dusting off a static action plan and assigning responsibilities.
Companies that make a commitment to talent management ensure the right talent is in place and prepared to execute on those action plans the moment they are required; 70% of 3PLs and 54% of shippers plan to invest heavily in employee training/talent management/internal and external certifications over the next two years to address supply chain disruption (Figure 14).
These companies know that strong leadership and talent is essential to properly drive innovation and respond to potential disruptions. However, as illustrated in Figure 16, recruiting the right people is only the beginning. To sustain a high level of business performance, organizations must be able to continuously adapt and change to deal with today’s volatile, complex, and ambiguous market dynamics. When organizations are able to link their people strategy to their business strategy, they gain the ultimate competitive advantage.
28 2013 THIRD-PARTY LOGISTICS STUDY
Talent has become a key strategic agenda item in many boardrooms, and CEOs in several industry surveys rank talent as the most important challenge behind business growth. Among the many reasons are the increasing attention on driving innovation and managing potential supply chain disruptors. The right talent is essential to both.
Last year’s 2012 16th Annual 3PL Study explored the supply chain talent shortage being experienced by both shippers and 3PLs. Both groups
How to Win the Talent Race
Managing Innovation & Disruption: It takes Talent
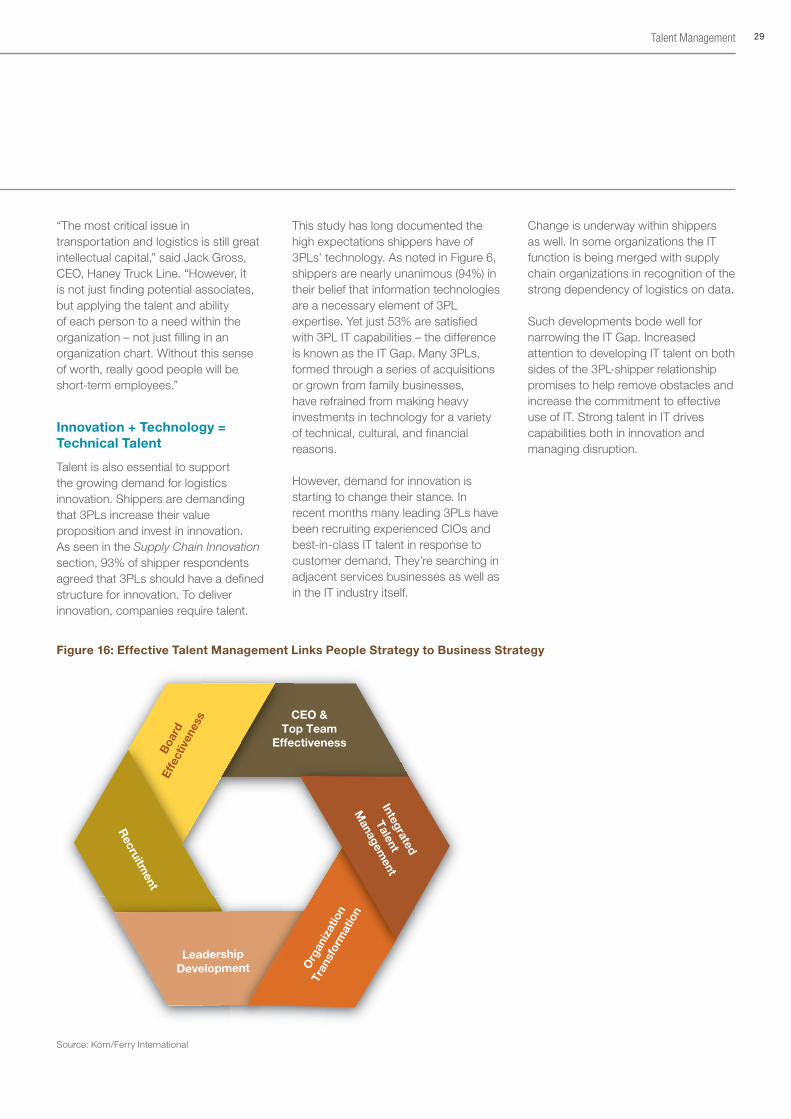
29Talent Management
“The most critical issue in transportation and logistics is still great intellectual capital,” said Jack Gross, CEO, Haney Truck Line. “However, it is not just finding potential associates, but applying the talent and ability of each person to a need within the organization – not just filling in an organization chart. Without this sense of worth, really good people will be short-term employees.”
Innovation + Technology = Technical Talent
Talent is also essential to support the growing demand for logistics innovation. Shippers are demanding that 3PLs increase their value proposition and invest in innovation. As seen in the Supply Chain Innovation section, 93% of shipper respondents agreed that 3PLs should have a defined structure for innovation. To deliver innovation, companies require talent.
Figure 16: Effective Talent Management Links People Strategy to Business Strategy
CEO &Top Team
Effectiveness
Boa
rdEf
fect
iven
ess
Integrated
Talent
Managem
ent
Org
aniz
atio
n
Tran
sfor
mat
ion
LeadershipDevelopment
Recruitm
ent
Source: Korn/Ferry International
This study has long documented the high expectations shippers have of 3PLs’ technology. As noted in Figure 6, shippers are nearly unanimous (94%) in their belief that information technologies are a necessary element of 3PL expertise. Yet just 53% are satisfied with 3PL IT capabilities – the difference is known as the IT Gap. Many 3PLs, formed through a series of acquisitions or grown from family businesses, have refrained from making heavy investments in technology for a variety of technical, cultural, and financial reasons.
However, demand for innovation is starting to change their stance. In recent months many leading 3PLs have been recruiting experienced CIOs and best-in-class IT talent in response to customer demand. They’re searching in adjacent services businesses as well as in the IT industry itself.
Change is underway within shippers as well. In some organizations the IT function is being merged with supply chain organizations in recognition of the strong dependency of logistics on data.
Such developments bode well for narrowing the IT Gap. Increased attention to developing IT talent on both sides of the 3PL-shipper relationship promises to help remove obstacles and increase the commitment to effective use of IT. Strong talent in IT drives capabilities both in innovation and managing disruption.

30 2013 THIRD-PARTY LOGISTICS STUDY
Planning for Future Directions

31
Strategic Assessment
Strategic Assessment
Here is a brief look at some topics triggered by the research and current industry trends that are being considered for a closer look in next year’s Annual 3PL Study.
X-Shoring for Flexibility and Adaptability
The world of global commerce is dynamic and volatile and these are among the factors that are causing many businesses to reassess their sourcing, manufacturing, marketing, and logistics strategies. For example, in early 2011 GE moved production of its energy-efficient water heaters from Chinese contractors to its own factory in Louisville, Ky., to accelerate cycle time and speed new product launches, according to Inbound Logistics magazine. According to MFG.com, the number of North American product manufacturers that actually re-shored production was 22% in Q4 2011, and the number researching bringing production into or closer to North America in Q1 2012 increased by 7% to 33%.
Such initiatives are intended to rebalance the structure and functioning of supply chains to be more flexible and adaptable — qualities recognized as essential to compete effectively in today’s business environments. While “offshoring” involves conducting business activities sometimes at great distances from intended customers in tradeoff for other benefits, other terms such as “near-shoring,” “re-shoring,” and “back-shoring” have emerged to represent activities that typically occur closer to consumption. Thus, this report introduces the term “X-shoring,” which is intended to describe the general shifting/changing nature of locational strategies. Use of the “X” suggests that sometimes it will be appropriate to select locations that bring activities closer to consumption and at other times put them at greater distances from consumption.
Current and recent Annual 3PL Studies have looked in depth at several topics related to X-shoring, including globalization, emerging markets, total landed cost, supply chain innovation, and disruption. Although each of these has broad implications for both business and supply chains, our main focus has been on the perspectives of both users and providers of 3PL services. As these types of organizations prepare for continually changing global business environments, we have observed that the issues and challenges they face are also those faced by businesses as a whole and their trading partners. Given the high stakes that are involved, we feel many questions deserve better answers than are currently available, including the following:
•Overall, what are the pros and cons of shifting manufacturing, planning, strategic sourcing, logistics management and other activities closer to consumption/daily operations?
• There are reasonably complete lists of costs and benefits that need to be quantified in a comprehensive, total landed cost (TLC) analysis. So why are many of today’s X-shoring decisions made on the limited scope of cost of goods sold (COGS) only, or on a limited number of additional relevant costs and benefits?
•What impact does a potential location mean in terms of language support, skill set availability, alignment of working hours, and ample talent pool to support growth and scale?
•One of the premises of making decisions in today’s changing business environment is some version of “change being the only constant.” To the extent that this is true, then how do we commit to X-shoring decisions that will have an intermediate- to longer-term “shelf-life?”
•How do we deal with some of the less-tangible factors that can and should impact significant X-shoring decisions? Examples include: risk/quality/service-related costs, impact on innovation, impact on customer goodwill that may be affected by locational realities, time-zone advantages, and the realities of environmental sustainability including measures such as carbon footprint.
•Previous Annual 3PL Studies have documented that 3PLs are viewed as valuable players in the management of change as it applies to businesses and supply chains. So what can be done to encourage shippers and 3PLs to engage in more collaborative leadership to address changing priorities such as moving to X-shoring?
• The move to X-shoring can generate significant benefits for supply chains and overall businesses, but what are the principal “caution flags” to look for so that one does not replace one set of problems with another?
•While it is likely that globalization will continue as a source of new revenue and cost reduction, to what extent will X-shoring continue to play a role in global supply chain operations?
Insight into these issues will provide some useful ideas into how we can enhance understanding of the principles of supply chain management and help to grow our businesses more profitably through the power of world-class supply chain management.
How do you engage your partners in benefiting from new X-shoring strategies? How do 3PLs and shippers engage each other in developing infrastructures to maximize these changes in strategies?

Global Trade Management: No Longer Just a Differentiator
Recently Global Trade Management has received renewed attention as companies find themselves competing in a business environment marked by expansion of global operations, increased global competitiveness and increased trade complexity. Long considered a strategic differentiator for companies with leading supply chain organizations, Global Trade Management is now viewed by many as essential to remain competitive.
According to the International Monetary Fund (IMF), despite the free fall of 2009, the volume of global trade in goods and services is now 8.2% higher than its 2008 peak. This increase in global trade has been driven by the heightened pressure on companies to compete for elusive profits, as the global economy continues to drag and companies are forced to explore new markets. Many companies now seek to supplement weak domestic demand with sales growth in emerging markets while at the same time relying on global sourcing to help minimize supply chain costs.
At the same time as companies have come to rely more heavily on global trade, the complexities of global trade have increased. Trading lanes continue to shift as the number and scope of Free Trade Agreements (FTA) increase. The United States, which currently maintains 14 FTAs, is in negotiations with eight other countries to finalize the much-publicized Trans-Pacific Partnership (TPP) FTA. China, which currently maintains eight FTAs, is in negotiations to nearly double that number in the coming years. Although each additional FTA presents an opportunity for companies, it also adds to the complexity of their operations and increases the need for effective Global Trade Management.
However, understanding optimal trade lanes and having an optimized FTA portfolio is not sufficient to maximize a company’s global operations – other challenges remain. Last year’s Annual 3PL Study addressed the importance of understanding and keeping up
with FTAs as an opportunity to unlock benefits. Tariffs and non-tariff barriers (for example, technical product regulations) are often a matter of public policy and there is little companies can do to avert this cost. However, understanding and being prepared to address import procedures can create a competitive advantage for companies. For most companies, the challenges of trade compliance include, among others, the following:
•Understanding which FTAs they are eligible for based upon the origin of different purchased parts
•Maintaining visibility of all purchase part information (for example, tariff number, ship date, number of units, mode of transportation)
•Coordinating with suppliers to obtain all required FTA information (certificate of origin, trade program certificate, etc.) to establish compliance with a trade program
•Collecting duty savings by qualifying bills of material of saleable goods for different trade programs
As the trend toward increased global trade, competitiveness, and complexity continues, it is likely that companies will remain focused on Global Trade Management. Those that invest the time and resources into leading practices such as implementation of automated Global Trade Management solutions will find they are able to transform their global operations into a competitive advantage. Companies that are unable or unwilling to make these investments will likely find it more difficult to compete.
How do you handle global trade management today and what would you need to do differently to attain more benefits in the future?
Big Data and the Changing 3PL Role
Growing data volumes (sometimes called Big Data) has emerged as a critical opportunity for improvement for shippers and 3PLs. But is the path towards Big Data a mature rollout of last decade’s technology (web applications and EDI), or in fact a disruptive innovation opportunity for 3PLs? Initial indications indeed show that Big Data is not a linear extension of the data paradigms of the 2000s, but what makes Big Data so… big? Consider, for example, the rapid growth of available data along these lines:
1. Variety: more objects are being measured
2. Frequency: the same object (such as a shipment) is logged more times during its life cycle
3. Breadth: a single record contains more specific information points
4. Accessibility: data is more standardized and more easily accessed by trading partners
5. Accuracy: more data standardization due to “key once, share often,” increasing data quality
The factors above describe how the perception of the supply chain is growing, and as a consequence supply chain leaders are often drowning in data. Converting the data into business value is the heart of the challenge, and a driver for expanded 3PL relationships.
Increased data requirements lead to three clear opportunities for a shift in the 3PL role:
1. The 3PL must be a competent data manager to be a viable partner. Since large and critical parts of the supply chain are only accessible to the 3PL, it is up to that 3PL to ensure
32 2013 THIRD-PARTY LOGISTICS STUDY
Converting the data into business value is the heart of the challenge
data is captured, integrated, and made available to external parties. Part of this job is to provide reliability indicators on the data. Shippers making key decisions need to know to what extent they can trust results from 3PL data.
2. The 3PL needs to be a facilitator to the data consumer. Manual handling of large data sets is awkward and unrealistic, especially in multi-media formats when the data is a mix of text, photos, GPS coordinates, and serial/lot numbers. Likewise, most shippers do not have a system where they centralize every data point prior to analysis. Instead, data analysis is distributed among many small systems and mashed-up with execution and planning systems. In short, making sense of large and complex data requires specialized IT tools, which are becoming part of shippers’ expectations of 3PLs. Beyond just having a system, the differentiation among 3PLs also turns on how deeply embedded the data analysis can be with the execution system. Swivel-chair integration between two systems belonging to the 3PL is considered outdated. As the water level of data rises, shippers want to know if their 3PL will throw them a lifeline and help them navigate or drag them under and slow them down.
3. The 3PL must be aligned in staffing and processes to capitalize on the rich opportunities hiding in the data they have available. Shippers have short patience for a materials-only viewpoint, in which the core function of the 3PL is to “move stuff.” So long as shippers see their own businesses in a broader context, and to the extent that the 3PL is sitting on data which can make a shipper’s business excel, there is a growing need for 3PLs to leverage data instead of just materials. While focusing on moving goods may find incremental handling economies, it will likely miss the game-changing transformational insights which come from better management of big data.
Will Big Data present opportunities or threats to 3PLs? How can 3PLs and shippers work together to manage Big Data?
Strategic Assessment 33
While focusing on moving goods may find incremental handling economies, it will likely miss the game-changing transformational insights which come from better management of big data.

About the Study
In the mid-nineties the 3PL industry was very much in its formative years; Third-party logistics providers were seeking to transition from vendors of individual services to logistics partners offering integrated services and building meaningful, collaborative relationships with their customers. Dr. C. John Langley, now Clinical Professor, Supply Chain and Information Systems and Director of Development, Center for Supply Chain Research at Smeal College of Business at The Pennsylvania State University, initiated this study then as a way to capture and measure this rapidly evolving new service industry.
Today, seventeen years later, the capabilities of both shippers and 3PLs have improved significantly. The Annual 3PL Study has grown as well, becoming a widely anticipated, heavily referenced index on the state of the 3PL industry. It has also become a vital tool for use by shippers and 3PLs in mapping their own logistics relationships.
It now takes a full year to establish topics of interest, develop the survey tool, conduct the research, analyze the results, write this report and present and share the findings. The study has evolved in a number of ways over its history:
Expanded Reach: From its early start as a survey mailed primarily to shippers in North America, the Annual 3PL Study has evolved along with the industry it covers, including its wide geographic reach, reflected in Figure 17. Responses have also expanded to include a wide range of industries, as seen in Figure 18.
Enhanced Accessibility: Several years ago the survey tool became Web-based, enabling response rates to increase dramatically. This year, the survey, which circulated in mid-2012, generated 1,510 usable responses from both users and non-users of 3PL services, as well as responses
to a separate, related version of the survey by 832 respondents from the 3PL sector, for a total of 2,342 usable responses. The study report and additional materials are also presented via a specially available Web site, www.3PLstudy.com.
Additional Topics: In addition to measuring core trends in the 3PL industry, the Annual 3PL Study several years ago began to conduct in-depth examinations of contemporary supply chain topics that affected both users and providers of 3PL services. This year those include the closely intertwined topics of supply chain disruption and supply chain innovation. The study also provides perspectives on talent management and information technology, beyond the coverage of these topics in recent versions of this study.
Contributing Sponsors: As the study has grown, industry organizations have joined Dr. Langley to lend their expertise. Capgemini has jointly owned the study with Dr. Langley for over a decade. Sponsors over the years have included leading firms in the 3PL, information technology and talent management sectors. This year, Panalpina and eyefortransport continue their sponsorship, and are joined by Korn/Ferry International.
Additional Perspectives: Four years ago, the study team began surveying 3PLs about their views, to help compare and contrast the perspectives of both users and providers of outsourced logistics services.
Multiple Research Streams: A distinguishing feature of the Annual 3PL Study is the study team’s use of four streams of research to validate and illuminate the findings in this report. In addition to the annual survey, which is available in English, Spanish, Portuguese, French, and German, the team conducts in-depth interviews
with logistics experts in one-on-one focus interviews related to the special topics. Desk research on study topics conducted by the team as well as Capgemini’s Strategic Research Group further enhances subject matter knowledge. And intensive, one-day facilitated shipper workshops enable the team to work side by side with shippers to explore survey results in the context of overall industry trends to discover deeper implications. This year, for the first time, the team conducted three such interactive workshops, one of which was held at a Capgemini Accelerated Solutions Environment® (ASE) at Capgemini’s NYC Harborside facility in Jersey City, NJ, USA. (See www.capgemini.com/ase for more detail about ASEs.) Facilitated workshops were also conducted in Paris, France and in Hong Kong.
The study team also worked with users and providers of 3PL services at the eyefortransport 3PL Summit and Chief Supply Chain Officer Summit held in Chicago, IL, USA, in June 2012.
Wide Coverage: The Annual 3PL Study is presented and discussed in prominent supply chain industry venues, such as the following:
•Presentations at influential industry conferences such as the Council of Supply Chain Management Professionals (CSCMP), eyefortransport 3PL Summit and Chief Supply Chain Officer Summit.
•Analyst briefings, typically conducted in the weeks following release of the annual study results in the fall of each year.
•Magazine and journal articles in publications such as Supply Chain Management Review, Logistics Management, Inbound Logistics, Logistics Quarterly, and Supply Chain Quarterly.
34 2013 THIRD-PARTY LOGISTICS STUDY
•Webcasts conducted with media and publications such as Supply Chain Management Review, Logistics Management, and others.
Supporting Organizations: Each year a number of supply chain organizations facilitate the research process by asking members and other contacts to respond to the survey, or contribute content for the report. In addition to completing the survey, individual companies help out by enabling executives to participate in focus interviews and facilitated workshops. Please see the Credits page for a listing of these valued contributors.
Definitions: Survey recipients were asked to think of a “third-party logistics (3PL) provider” as a company that provides one or more logistics services for its clients and customers. A “fourth-party logistics (4PL) provider” is one that may manage multiple logistics providers or orchestrate broader aspects of a customer’s supply chain. To ensure confidentiality and objectivity, 3PL users were not asked to name which specific 3PL providers they use.
A Note about the Name: For years the study, unveiled each October, was branded with the year in which it was published. In 2011 the team made a change, instead branding the study with the year in which the results will enjoy the most active and lively discussion. Therefore, this report, published in October 2012, is titled the 2013 Third Party Logistics Study: Results and Findings of the 17th Annual Study.
2013 Third-Party Logistics Study Goals
Research and analysis for the Current State of the Market section sets out to:
•Understand what shippers outsource and what 3PL providers offer.
• Identify trends in shipper expenditures for 3PL services and to recognize key shipper and 3PL perspectives on the use and provision of logistics services.
•Update our knowledge of 3PL-shipper relationships, and to learn how both types of organizations are using these relationships to improve and enhance their businesses and supply chains.
•Quantify the benefits reported by shippers that are attributed to the use of 3PLs.
•Document what types of information technologies and systems are needed for 3PLs to successfully serve customers, and to assess the extent to which IT-related goals are being achieved.
•Examine why customers outsource or elect not to outsource to 3PL providers.
Goals for the Special Topic sections include:
Supply Chain Innovation: Understanding what drives supply chain innovation and assessing the extent to which 3PLs are driving meaningful innovation to assist their shipper-customers in achieving their business objectives. Research also highlights steps that 3PLs can take to be considered innovative contributors to the challenge of achieving customers’ business objectives.
Supply Chain Disruption: Understanding what can be done by 3PLs and their customers to develop strategies and operational capabilities to mitigate or eliminate sources of supply chain disruption. Considering that supply chain disruptions generally come from four main areas (natural factors; physical infrastructure outages; business operations failures; and economic and political factors), it is essential that shippers and their 3PL customers work together effectively to jointly protect their supply chains.
Goals for Additional Material:
• The Talent section briefly explores the critical role of talent as a strategic agenda item in most, if not all, organizations. Additionally, the study looks at the role talent plays in realizing innovation goals, managing supply chain disruption, and ensuring CEO succession.
•Goals for the Information Technology section include determining what drives shippers’ expectations of 3PLs’ technical capabilities and subsequently, where 3PLs can focus to improve this aspect of their overall relationship.
•Based on what was learned from the study process, the team uses the Strategic Assessment to develop a perspective on improving 3PL-shipper relationships.
About the Study 35

About the Respondents
3PL Users: Figure 17 reveals the geographies represented by shipper respondents. These totals include both users and non-users of 3PL services. The non-user responses are useful because they provide valuable perspectives on why they do not currently use 3PLs, as well as on a number of other relevant topics. Shipper respondents are typically managers, directors, VPs and C-suite executives.
Figure 18 reflects the eight largest industries of respondents using 3PL services, accounting for almost two-thirds of the overall respondents.
Figure 19 includes all shipper respondents’ anticipated total sales for 2012. As with last year’s study, 37% of the respondents represent companies in the lowest sales category – a higher percentage than in previous years. We attribute this to a greater percentage of respondents from emerging economies in regions such as Asia-Pacific and Latin America.
3PL Providers: 3PL executives and managers responded to a similar, but separate version of the survey. 3PL respondents represent: 1) a wide spread of operating geographies; 2) an extensive list of industries served (actually quite similar to the shipper-respondent industries); and 3) a range of titles, from managers to presidents/CEOs. Approximately 40% of the 3PL firms expected 2012 company revenues in excess of US $1 billion (approximately €750 million), while about 50% reported revenues of less than US$500 million (approximately €375 million).
Figure 17: Shipper Respondents Represented Several Major Geographies
Figure 18: Eight Largest Industries of Respondents using 3PL Services
Figure 19: Nearly 50% of 3PL User Respondents Anticipated 2012 Sales in Excess of US $1 Billion (€ 750 Million)
Asia-Pacific (212)14%
Europe (331) 22%
Other (172) 11%Latin America (304) 20%
North America (491) 33%
14%11%
Manufacturing
Consumer products
Healthcare
Other
Retail
13%
7%
10%
9%
7%7%
6%
6%
17%
18%
Automotive/Transport Equipment
Healthcare
Food and Beverage
Chemical
Additional
High-Tech and Electronics
US$500 million – less than US$1 billion / €375 million –less than €750 million
US$1 billion – less than US$25 billion / €750 million – less than €20 billion
US$25 billion or more / €20 billion or more
Less than US$500 million / €375 million
37% 33%40% 36%
51%
16%15%
11% 19%
17%
30%34% 33% 27%
19%
17% 18% 18% 18% 13%
0%
10%
20%
30%
40%
50%
60%
70%
80%
90%
100%
All Regions NorthAmerica
Europe Asia Pacific
Latin America
36 2013 THIRD-PARTY LOGISTICS STUDY
Source: 2013 Third-Party Logistics Study
Source: 2013 Third-Party Logistics Study
Source: 2013 Third-Party Logistics Study