Embed Size (px)
Citation preview
2013 Wounded Warrior Project® Survey Report of Findings
Authors
Martha Franklin Wayne Hintze Michael Hornbostel Scott Smith Chris Manglitz Rebecca Noftsinger Jafar Haider Melissa Wilson
July 23, 2013
Prepared for: Wounded Warrior Project®
4899 Belfort Road, Suite 300 Jacksonville, FL 32256
Prepared by: Westat An Employee-Owned Research Corporation® 1600 Research Boulevard Rockville, Maryland 20850-3129 (301) 251-1500
2013 Wounded Warrior Project Survey Results i
EXECUTIVE SUMMARY
This executive summary includes a brief description of the survey purpose, content, and administration as well as top-line findings from the collected data.
ABOUT THE SURVEY
SURVEY OBJECTIVE. The 2013 WWP survey was the fourth of five planned administrations of the survey. The first survey, in 2010, collected baseline data on WWP alumni membership. The subsequent surveys provide updates and allow WWP to identify trends among its alumni, to compare their outcomes with those of other military populations, and to measure the impact and mix of WWP services and programs. The survey is NOT intended to measure the impact of individual WWP programs. WWP will use each set of annual data to determine how it can better serve its members.
SURVEY CONTENT. The survey measures a series of outcome domains within the following general topics about WWP alumni: Background Information (military experiences and demographic data), Physical and Mental Well-Being, and Economic Empowerment.
2013 SURVEY ADMINISTRATION. The survey was fielded via the web to 26,892 alumni in WWP’s member database from March 5 to April 17, 2013 (6 weeks). Email communications included a prenotice message (sent on February 28, 2013), a survey invitation, and six email thank you/reminder messages. In addition to the email communications, a postal reminder was sent by U.S. mail (first class) on March 27 and March 28. Respondents were offered an incentive for completing the survey. Those who submitted a completed survey had the option of providing a mailing address to receive a WWP-branded Under Armour sackpack. The final unweighted 2013 response rate was 51.9 percent (13,956 respondents among 26,886 eligible warriors), an increase from 32.4 percent in 2010, 39.4 percent in 2011, and 42.5 percent in 2012. After data collection, the survey data were weighted to produce estimates representative of the full 2013 survey population.
TOP-LINE FINDINGS
ALUMNI BACKGROUND INFORMATION DEMOGRAPHIC PROFILE. The 2013 demographic profile of alumni is mostly similar to the 2012 and 2011 profiles:
• 88.5 percent are male • 54.8 percent (up from 49.5% in 2012) are younger than 35 years old (mean age is
35½ years) • 64.0 percent are currently married
2013 Wounded Warrior Project Survey Results ii
• 72.7 percent are White, 15.6 percent are Hispanic, 9.6 percent are Black or African American, 4.1 percent are American Indian or Alaska Native, 2.8 percent are Asian, and 1.2 percent are Native Hawaiian or other Pacific Islander.
• About 48 percent live in the South; 24.1 percent live in the West, 14.4 percent in the Northeast, and 13.4 percent in the Midwest.
MILITARY PROFILE. The 2013 military profile of alumni is also similar to that in 2012 and 2011. Alumni represent all four Services and the Coast Guard, including the National Guard and Reserve. Two-thirds have served or currently serve in the Army (66.2%). Most alumni were, or still are, enlisted service members (91.6%). About three-fifths of enlisted alumni achieved the equivalent rank of Sergeant or above (60.6%). Only 4.3 percent of alumni have never deployed. Almost one-third (32.4%) deployed once, 29.1 percent deployed twice, and 34.3 percent deployed three or more times. Primary types of current health insurance include Veterans Affairs (52.7%) and other governmental health plans, such as TRICARE, CHAMPUS, and ChampVA (50.2%).
SERVICE-CONNECTED INJURIES AND HEALTH PROBLEMS. Most alumni (98.7%) sustained serious injuries and health problems during their post-September 11 military service. More than two-thirds (66.8%) reported between three and seven injuries or health problems. The percentage of wounded warriors reporting they are receiving VA disability benefits (62.8%) is similar to that in 2012 (63.3%) but nearly 5 percentage points lower than in 2011 (67.5%). The percentage of alumni saying they have a VA claim pending or on appeal (15.2%) has fluctuated only a little in the past 3 years. Similarly, the percentage reporting a VA disability rating of 80 percent or higher (36.2%) is nearly identical to the 2012 percentage.
The most commonly reported injuries and health problems in 2013 reflect the changes made to that question in this year’s survey. For 2013, the percentages for the three most commonly reported injuries include posttraumatic stress disorder – 75.4 percent, anxiety (new response option) – 73.9 percent, and depression (new response option) – 68.8 percent. The next injury category most commonly reported is also a new response option—severe back, neck, or shoulder problems (57.4%).
Among the group of alumni who reported experiencing injuries or health problems in Iraq or Afghanistan (about 85%), 23.9 percent sustained injuries or health problems only in Afghanistan (up from 15.1% in 2012), and 15.3 percent did so in both Iraq and Afghanistan (up from 9.7% in 2012). The Iraq-only group remained stable at about 60 percent. These percentages reflect the shift in military operations to Afghanistan in recent years.
Sixty-three percent of alumni were hospitalized as a result of their injuries and problems (down from 68.4% in 2012). About 44 percent were assigned to a Warrior Transition Unit (WTU) or a Wounded Warrior Battalion (WWB) for treatment and rehabilitation. Length of stay in the WTU/WWB ranged from less than 6 months (17.9%) to more than 2 years (19.8%). The most commonly reported length was 13 to 24 months (30.6%). More than one-fourth of alumni (26.0%) reported that they need the aid and attendance of another person because of their post 9/11 injuries and health problems. More than one-fourth (25.8%) said they need more than 40 hours of aid per week.
2013 Wounded Warrior Project Survey Results iii
PHYSICAL AND MENTAL WELL-BEING HEALTH. Just under half of alumni (48.1%) rated their health as excellent, very good, or good.
• Excellent – 2.4 percent • Very good – 11.3 percent • Good – 34.4 percent • Fair – 39.0 percent • Poor – 12.9 percent
EFFECTS OF PHYSICAL HEALTH AND MENTAL HEALTH/EMOTIONAL PROBLEMS ON ACTIVITIES. Alumni reported many health-related restrictions on their activities:
• Vigorous activities - 54.2 percent said their health limits them a lot regarding vigorous activities
• Moderate activities – Just over 40 percent are limited a little for three types of activities: (1) moderate activities (43.7%); (2) bending, kneeling, or stooping (43.6%); and (3) lifting or carrying groceries (41.1%).
• Bathing and dressing – 4.7 percent reported they are limited a lot in bathing and dressing themselves, and 22.4 percent said they are limited a little with those activities.
• Physical health issues: o 49.7 percent said their physical health has interfered extremely, quite a bit, or
moderately with normal social activities with family and friends and other support during the past 4 weeks.
o 60.3 percent said that as a result of their physical health problems they had difficulty in performing work or other activities in the past 4 weeks.
o 60.8 percent said their bodily pain interfered with their normal work (work outside the home and housework) moderately, quite a bit, or extremely.
• Emotional problems: o 59.0 percent said emotional issues have interfered extremely, quite a bit, or
moderately with normal social activities with family and friends during the past 4 weeks.
o 55.7 percent said that as a result of emotional problems they had to cut down the amount of time they spent on work or other activities in the past 4 weeks.
o 64.9 percent said that as a result of emotional problems they had accomplished less than they would like during the past 4 weeks.
o 55.0 percent said that as a result of emotional problems they didn’t do their work or other activities as carefully as usual.
HOW THEY HAVE BEEN FEELING. Many wounded warriors’ military experiences are still affecting them in seriously adverse ways. They reported on problems they experienced during the 2 weeks prior to the survey. The results are very similar to 2012 and 2011 findings. The top two issues that affect them nearly every day include:
2013 Wounded Warrior Project Survey Results iv
• Sleep issues – 42.8 percent said they either had trouble falling or staying asleep or they slept too much
• Tiredness – 34.6 percent said they felt tired or had little energy
Other top problems that affect them more than half the days or nearly every day
• 48.8 percent have had either a poor appetite or overate. • 48.3 percent said they had trouble concentrating on things such as reading the newspaper
or watching television. • 43.4 percent had little interest or pleasure in doing things.
In addition, more than two-thirds of alumni said they had a military experience that was so frightening, horrible, or upsetting that they had not been able to escape from memories or the effects of it. For example, 73.9 percent said they thought about the experience when they did not want to.
HEALTH-RELATED MATTERS. Alumni were asked about their use of alcoholic beverages, smoking, importance of a healthy diet, physical activity/exercise, and sleep problems:
Alcoholic Beverages • About one-fifth of alumni (19.5%) said they used more alcohol than they meant to in the
past 4 weeks. • Almost three-fourths of alumni (73.7%) either do not drink alcoholic beverages at all or did
so no more than four times a month during the past 12 months. • Relatively small percentages of alumni who reported drinking alcohol in the past 12 months
said they have six or more drinks on one occasion weekly (11.6%) or daily/almost daily (3.1%)
Tobacco Use • Almost one-third of alumni smoke cigarettes, just over one-fifth said they use smokeless
tobacco products, about 15 percent smoke cigars, and about 3 percent smoke pipes.
Healthy Diet • About 8 of 10 alumni said it is moderately important or very important to maintain a
healthy diet and good nutrition. • The average height and weight of alumni who reported that information is 5’10” and 204
pounds. The average BMI index is 29.4, at the high end of being overweight. About 4 of 10 alumni are obese (40.8%; BMI score of 30.0 or higher), and another 42.0 percent are overweight (BMI score of 25 to 29.9).
2013 Wounded Warrior Project Survey Results v
Physical Activity/Exercise • Frequency of moderate exercise – 43.7 percent do moderate-intensity physical activity or
exercise 3 or more days a week; 36.3 percent of alumni do so less than once a week.
Sleep As noted earlier, sleep is a problem for many alumni. During the 4 weeks prior to the survey:
• About one-fifth (19.8%) said they got enough sleep to feel rested upon waking in the morning a good bit of the time, most of the time, or all of the time.
• A similar low percentage (20.6%) said they got the amount of sleep they needed at least a good bit of the time.
HEALTH CARE SERVICES: ACCESS/RESOURCES. Many wounded warriors have ongoing needs for health care services, but sometimes have difficulty getting services. Among alumni, 55.2 percent said they had visited a professional to get help with issues such as stress, emotional, alcohol, drug or family problems. More than one-third of alumni (34.2%), however, said they had difficulty getting mental health care, or put off getting such care, or did not get the care they needed. The most commonly reported reasons they selected from a list provided in the survey were:
• Inconsistent treatment or lapses in treatment – 40.7 percent. • Did not feel comfortable with existing resources within the DoD or VA – 32.5 percent • Other reasons – 36.2 percent
Some alumni selected reasons related to perceived adverse effects of seeking mental health care treatment:
• Concerned that your future career plans would be jeopardized – 28.1 percent • Would be considered weak – 24.6 percent • Would be stigmatized by your peers or family – 22.3 percent
The top three resources and tools used since deployment for addressing their mental health concerns were:
• Talking with another OEF/OIF veteran – 56.7 percent • VA Medical Center – 54.1 percent • Prescription medicine – 48.2 percent
These three resources were also identified by alumni as the most effective resources in helping them.
SOCIAL SUPPORT. More than half of alumni answered positively about 10 statements about their current relationships with friends, family members, co-workers, community members, and others. And for 8 of the statements, the positive scores ranged from 68.3 percent to 85.5 percent. The three statements with the highest positive scores were:
• There are people I can depend on to help me if I really need it – 85.5 percent agreed or strongly agreed.
2013 Wounded Warrior Project Survey Results vi
• There is a trustworthy person I could turn to for advice if I were having problems – 81.4 percent agreed or strongly agreed.
• If something went wrong, no one would come to my assistance – 80.7 percent disagreed or strongly disagreed.
CURRENT ATTITUDES. Two survey questions addressed current attitudes about resilience in the face of changes or hardships. As in 2012 and 2011, more than half of alumni answered positively:
• 55.3 percent said it is often true or true nearly all the time that they are able to adapt when changes occur.
• 53.0 percent said that is often true or true nearly all the time that they tend to bounce back after illness, injury, or other hardships.
A third question asked alumni to assess the extent to which 13 statements are true in describing their feelings now. For 11 of the 13 statements, at least half of alumni answered positively (range from 50.5% to 71.0%). The percent positive score for “My life has very clear goals and purposes” is 54.2. The three statements with the lowest percent positive scores were:
• “I have feelings inside that I would rather not feel” (43.8%) • “Doing the things I do every day is a source of pleasure and satisfaction” (45.0%) • “I have very mixed feelings and ideas” (50.5%)
ECONOMIC EMPOWERMENT EDUCATIONAL ATTAINMENT. Levels of educational attainment remain similar to those in 2012: 23.3 percent have a bachelor’s degree or higher; 17.1 percent have completed a business, technical, or vocational school (with certificate/diploma) or obtained an associate degree, and 40.8 percent have some college credit but no degree.
PURSUING MORE EDUCATION. Nearly a third of the respondents are now enrolled in school—among them, about 6 of 10 enrollees are pursuing a bachelor’s degree or higher (59.7%, down from 66.3% in 2011); another 22 percent are pursuing an associate degree; and 6.4 percent are enrolled in business, technical, or vocational school training leading to a certificate or diploma.
The two primary benefits they are using to finance their educational pursuits are the same as in 2012 and 2011: Post 9/11 GI Bill and the VA’s Vocational Rehabilitation and Employment Program (VR&E). Of note, the percentage of respondents reporting use of the relatively new Post 9/11 GI Bill continues to increase (54.3 % in 2013, up from 53.0% in 2012 and 46.3% in 2011).
Of 1,783 wounded warriors using the VR&E benefit, more than three-fourths (80.7%, up from 59.1% in 2012 and 54.3% in 2011) are using Employment Through Long Term Services – Training/Education. About 8 percent of school enrollees are using the Montgomery GI Bill to finance their education.
LABOR FORCE/EMPLOYMENT STATUS. Among alumni, 64.1 percent are in the labor force (the labor force includes employed and unemployed warriors). Overall, 45.5 percent of alumni are
2013 Wounded Warrior Project Survey Results vii
employed full time and 7.2 percent part time. Among employed alumni, 4.8 percent are self-employed. The unemployment rate for respondents in the labor force is 17.8 percent (basically unchanged since 2012). Among those who are not employed and who did not actively search for work in the past 4 weeks, the main reasons they reported for not actively looking for work were medical/health reasons (59.2%), enrollment in school or in a training program (23.1%), or retirement (10.1%). In addition, 4.7 percent of them said they would like to work but had become discouraged about finding work.
WAGES/HOURS AND WEEKS WORKED. Median wages, number of weeks worked in the past 12 months, and weekly hours show only minor or no changes from 2012 and 2011. Among those who are employed, the median income is still $800/week for full-time employees but rose $20 to $220/week for part-time employees. Mean number of weeks worked is 44 for full-time employees and 29 weeks for part-time employees. Average weekly hours worked is 43 for full-time employees and 26 hours for part-time employees (up from 24 hours/week in 2012 for part timers, which may partly account for the increase in their weekly income). Alumni reported working in many different industries, but the highest proportions continue to work for the military (36.9%), the federal government (18.2%), and state and local government (8.2%).
JOB SATISFACTION. Full-time employees are more satisfied with their employment than are part-time employees. In 2013, about 53 percent of the full-time employed alumni said they are satisfied, very satisfied, or totally satisfied with their jobs. For part-time employed alumni, the comparable percentage in 2013 is about 29 percent.
BARRIERS TO EMPLOYMENT. Alumni reported many factors that make it difficult for them to obtain employment or change jobs. The top 6 of 17 listed factors in the survey were:
• Mental health issues – 29.7 percent • Not qualified – lack education – 22.1 percent • Not physically capable – 20.9 percent • Pursuing an education – 19.9 percent • Not enough pay – 16.9 percent • I lack confidence in myself and my abilities – 15.3 percent
PARTICIPATION IN TRANSITION ASSISTANCE PROGRAM (TAP). About 40 percent of alumni participated in TAP (39.4%). About 40 percent of TAP participants (38.9%) said the Veterans Benefit Overview was the most beneficial component of TAP. Only 6.5 percent cited the Department of Labor Employment Workshop as the most beneficial component of TAP in assisting them with their transition to work or school.
INCOME. Alumni reported on income they received from work (a category including wages, salary, bonuses, overtime, tips, commissions, profit, second jobs), service in the military Reserve, and rent from roomers or boarders. About half the alumni working full-time (48.5%) reported receiving less than $45,000 in work-related income during the past 12 months. About half of alumni working part-time reported work-related income of less than $15,000 during the past 12 months.
2013 Wounded Warrior Project Survey Results viii
Alumni also reported on money received in the past 12 months from various benefit, cash assistance, and disability programs. About 3 of 10 alumni (29.7%, up from 21.5% in 2012) received $20,000 or more in income from those sources, and 28.6 percent received no income from those sources.
Fifty-seven percent of alumni said they were sharing household expenses with a spouse or partner. Just over half of this group (51.3%) reported spouse/partner income as being less than $25,000, and about one-fourth said their spouse/partner income was at least $25,000 but less than $50,000.
CURRENT LIVING ARRANGEMENT. Among home owners, 43.6 percent currently own their own homes with an outstanding mortgage (down from 48.0% in 2012 and 52.7% in 2011), and 3.1 percent own their homes with no mortgage balance. About one-third of alumni (32.5%) rent their homes. TOTAL DEBT. In 2013, alumni were asked about monthly mortgage payments and monthly payments toward total debt that the wounded warrior and spouse/partner pay. Nearly 70 percent of alumni with mortgage debt (69.7%) pay less than $1,500 a month. Among alumni with other forms of debt, one-third (33.8%) pay less than $1,000 per month on total household debt they owe, and another 40.1 percent make monthly debt payments ranging from $1,000 to less than $2,500. As in previous years of the survey, car loans and credit card debt are the most common forms of debt, followed by home loans/mortgage debt and other household debt. RATIO OF MONTHLY HOUSEHOLD DEBT PAYMENTS TO MONTHLY HOUSEHOLD INCOME. Among alumni who own their homes with outstanding mortgages and who answered the three income questions in the survey (46.1% of alumni), 62.1 percent have a debt-to-income ratio > 41 percent, the general VA mortgage qualification ratio. Among alumni who currently do not own their homes and who answered the income questions (49.4% of alumni), 90.1 percent have a “non-housing” debt-to-income ratio > 8 percent, a common ratio used by commercial mortgage lenders for non-housing-related debt when “housing-related costs” will be about 28 percent of income.
EMERGENCY FUNDS. About 30 percent of alumni (29.8%) said they have an emergency fund. Within this group, 61.5 percent said their fund would cover 3 or more months of household expenses. This group with 3 or more months of “rainy day” savings makes up 18.2 percent of the total alumni survey population.
OVERALL ASSESSMENT OF FINANCIAL STATUS. Alumni were asked whether they would say their financial status (and that of family living with them) is better now, the same, or worse than a year ago. As in 2012, one of five 2013 alumni said it is better now and 39.0 percent said it is worse:
• Worse – 39.0 percent • Same – 37.0 percent • Better now – 19.9 percent • Don’t know – 4.0 percent
2013 Wounded Warrior Project Survey Results ix
Table of Contents Page
Executive Summary .................................................................................................................................................................. i
About the Survey ................................................................................................................................................................. i
Top-Line Findings ............................................................................................................................................................... i
Alumni Background Information .................................................................................................................................. i
Physical and Mental Well-Being ................................................................................................................................. iii
Economic Empowerment .............................................................................................................................................. vi
Wounded Warrior Project ................................................................................................................................................... 1
Wounded Warrior Project Survey .................................................................................................................................... 1
Survey Objective ................................................................................................................................................................ 1
Survey Development and Content .............................................................................................................................. 1
2013 Survey Administration ......................................................................................................................................... 3
2013 Reported Data ......................................................................................................................................................... 3
Organization of Report Findings ................................................................................................................................. 5
Alumni Background Information ...................................................................................................................................... 7
Demographic Profile......................................................................................................................................................... 7
Military Service Experiences ...................................................................................................................................... 14
Offenses/Convictions Since First Deployment .................................................................................................... 30
Internet Use ....................................................................................................................................................................... 30
Physical and Mental Well-Being ...................................................................................................................................... 32
Health and Daily Activities ........................................................................................................................................... 32
How Have You Been Feeling? ..................................................................................................................................... 46
Health-Related Matters ................................................................................................................................................. 49
Health Care Services ....................................................................................................................................................... 58
Social Support ................................................................................................................................................................... 62
Attitudes .............................................................................................................................................................................. 64
Economic Empowerment ................................................................................................................................................... 68
Education ............................................................................................................................................................................ 68
More on Employment .................................................................................................................................................... 70
Participation in the Transition Assistance Program (TAP)............................................................................ 79
2013 Wounded Warrior Project Survey Results x
Income .................................................................................................................................................................................. 79
Current Living Arrangement ....................................................................................................................................... 82
Debt ....................................................................................................................................................................................... 84
Financial Accounts .......................................................................................................................................................... 88
Overall Assessment of Financial Situation ............................................................................................................ 90
Major Themes in Survey Comments ........................................................................................................................... 102
Conclusions ........................................................................................................................................................................... 118
Physical and Mental Health ...................................................................................................................................... 118
Economic Empowerment .......................................................................................................................................... 120
Social Support and Personal Resiliency .............................................................................................................. 123
Closing Comments ........................................................................................................................................................ 123
References ............................................................................................................................................................................. 124
Appendix A: Copies of Survey Communications ..................................................................................................... A-1
Appendix B: Survey Methods and Administration Details ................................................................................. B-1
Survey Population ......................................................................................................................................................... B-1
Questionnaire .................................................................................................................................................................. B-1
Data Collection ................................................................................................................................................................ B-7
Highlights From Google Analytics ....................................................................................................................... B-13
Appendix C: Additional Figures ..................................................................................................................................... C-1
2012/2011 Figures ....................................................................................................................................................... C-1
Figures From 2013 With Additional Information ............................................................................................ C-3
List of Tables
Table 1. Top 10 States With WWP Alumni .................................................................................................................... 9
Table 2. Level of Assistance Needed With Daily Activities (Average Week) ................................................ 30
Table 3. Frequency of Feelings During the Past 4 Weeks ..................................................................................... 45
Table 4. Assessment of Own Health ............................................................................................................................... 46
Table 5. Frequency in the Past 2 Weeks of Being Bothered by Various Types of Problems .................. 49
Table 6. Summary Employment Information, by Full-Time and Part-Time Work Status ....................... 76
Table 7. Overall Assessment of Financial Status by VA Disability Rating ................................................... 103
Table B1a. Differences Between the 2010 and 2011 WWP Survey Questionnaires ............................... B-2
Table B1b. Differences Between the 2011 and 2012 WWP Survey Questionnaires ............................... B-4
2013 Wounded Warrior Project Survey Results xi
List of Tables (Continued) Page
Table B1c. Differences Between the 2012 and 2013 WWP Survey Questionnaires ................................ B-5
Table B2. List of Survey Communications Sent to WWP Alumni ..................................................................... B-7
Table B3. Final Disposition Codes ............................................................................................................................. B-10
Table B4. Response Rates Disaggregated by Information Available for Both Respondents and Nonrespondents ............................................................................................................................................ B-12
Table B5. Characteristics of Base Weights and Adjusted Weights ............................................................... B-12
List of Figures Figure 1. Alumni Breakouts by Gender, Age, and Marital Status ......................................................................... 7
Figure 2. Alumni Breakout by Race/Hispanic Ethnicity .......................................................................................... 8
Figure 3. Regional Distribution (%) of 2013 WWP Alumni ................................................................................... 9
Figure 4. Highest Degree or Level of School Completed........................................................................................ 10
Figure 5. Distribution of Alumni by Active Duty Status and Distribution by Service Branch or Reserve Component .......................................................................................................................................... 16
Figure 6. Highest Pay Grade Attained ........................................................................................................................... 15
Figure 7a. Number of Deployments ............................................................................................................................... 15
Figure 7b. Percentages of Alumni Deployed to Iraq and Afghanistan ............................................................. 18
Figure 8. Experiences During Post 9/11 Deployments .......................................................................................... 17
Figure 9. Injuries and Health Problems During Military Service Since 9/11 ............................................... 19
Figure 10. Place Where Injury or Health Problem Was Experienced .............................................................. 20
Figure 11. Year(s) Sustained Injury ............................................................................................................................... 23
Figure 12. Causes of Injuries/Health Problems ........................................................................................................ 22
Figure 13. Sites Where Hospitalized .............................................................................................................................. 23
Figure 14. Length of Stay in WTU/WWB ..................................................................................................................... 24
Figure 15. Disability Ratings (VA Service-Connected and Military’s PEB) .................................................... 25
Figure 16. Current Types of Health Insurance .......................................................................................................... 27
Figure 17. Average Hours per Week Aid and Attendance Are Needed Among Those Needing Assistance ........................................................................................................................................................... 29
Figure 18. Convictions Since First Deployment for Offenses/Crimes ............................................................. 30
Figure 19. Alumni Who Are Somewhat Willing or Very Willing to Use Internet, by Activity .................. 31
Figure 20. Health Status Assessment ............................................................................................................................ 32
2013 Wounded Warrior Project Survey Results xii
List of Figures (Continued) Page
Figure 21. Health Status Assessment ("Poor" or "Fair"), by Type of Injury .................................................. 33
Figure 22. Physical Activity Limitations ...................................................................................................................... 35
Figure 23. Percentages of Alumni Reporting “Yes”—Physical Health Problems Have Interfered in Last 4 Weeks With Work or Regular Activities ........................................................ 38
Figure 24. Percentages of Alumni Reporting “Yes”—Emotional Problems Have Interfered in Last 4 Weeks With Work or Regular Activities .............................................................................. 39
Figure 25a. Extent to Which Physical Health Has Interfered With Normal Social Activities in Past 4 Weeks ...................................................................................................................................................... 40
Figure 25b. Extent to Which Emotional Problems Have Interfered With Normal Social Activities in Past 4 Weeks ............................................................................................................................ 40
Figure 26a. Amount of Time Physical Health Has Interfered With Normal Social Activities in Past 4 Weeks ............................................................................................................................ 41
Figure 26b. Amount of Time Emotional Problems Have Interfered With Normal Social Activities in Past 4 Weeks ............................................................................................................................ 41
Figure 27. Extent of Bodily Pain in the Past 4 Weeks ............................................................................................. 42
Figure 28. Extent to Which Pain Interfered With Normal Work........................................................................ 42
Figure 29. Percentages Reporting “Yes” to Lingering Effects in the Last Month of Traumatic Military Experiences ....................................................................................................................................... 48
Figure 30. Frequency of Use of Alcoholic Beverages .............................................................................................. 49
Figure 31. Number of Alcoholic Drinks Consumed on a Typical Day .............................................................. 50
Figure 32. Frequency of Having Six or More Drinks With Alcohol on One Occasion ................................ 50
Figure 33. Percentages Using Tobacco Products in the Past 12 Months ........................................................ 52
Figure 34. Packs per Day Smoked by Those Who Have Ever Smoked ............................................................ 52
Figure 35. Importance of Maintaining a Healthy Diet and Good Nutrition ................................................... 53
Figure 36. Frequency of Moderate-Intensity Physical Activity or Exercise in a Typical Week ............. 54
Figure 37. Reported Barriers to Exercising and Doing Sports or Other Physical Activities ................... 57
Figure 38. Frequency During the Past 4 Weeks of Getting Enough Sleep to Feel Rested ........................ 56
Figure 39. Frequency During the Past 4 Weeks of Getting Amount of Sleep Needed ............................... 57
Figure 40. Number of Doctor/Clinic Visits in the Past 3 Months ....................................................................... 59
Figure 41. Top 5 Reasons for Difficulties in Getting Mental Health Care ....................................................... 60
Figure 42. Top 5 Resources and Tools for Coping With Stress or Concerns ................................................. 61
Figure 43. Most Effective Resources and Tools for Coping With Stress or Concerns (Top 5) ............... 62
Figure 44. Percent Positive Responses to Social Support Statements ............................................................. 63
2013 Wounded Warrior Project Survey Results xiii
List of Figures (Continued) Page
Figure 45. Ability to Adapt When Changes Occur .................................................................................................... 67
Figure 46. Ability to Bounce Back After Illness, Injury, or Other Hardships ................................................ 65
Figure 47. Percent Positive Responses to Descriptions of Feelings ................................................................. 69
Figure 48. Degree or Level of Schooling Pursued by School Enrollees ........................................................... 68
Figure 49. VA or Government Benefits Used by School Enrollees .................................................................... 69
Figure 50. Alumni Student Loan Debt ........................................................................................................................... 72
Figure 51. Industries in Which Employees Work .................................................................................................... 72
Figure 52. Level of Satisfaction With Employment, by Full-Time and Part-Time Status......................... 75
Figure 53. Factors Making It Difficult to Obtain Employment or Change Jobs ............................................ 77
Figure 54. Percentage of Alumni by Number of Factors Selected ..................................................................... 78
Figure 55. Parts of TAP That Were Most Beneficial to Alumni……………. ........................................................ 79
Figure 56. Money Received in Past 12 Months From Various Benefit, Cash Assistance, and Disability Programs ........................................................................................................................................ 81
Figure 57. Number in Household Supported by Household Income ............................................................... 82
Figure 58. Current Living Arrangement ....................................................................................................................... 86
Figure 59. Current Forms of Debt ................................................................................................................................... 87
Figure 60. Monthly Home Mortgage Payments ......................................................................................................... 88
Figure 61. Monthly Payments on Total Debt Owed, Excluding Mortgage Debt on Primary Residence......................................................................................................................................................................... 89
Figure 62. Types of Accounts With Banks or Other Financial Institutions .................................................... 88
Figure 63. Current Participation in Savings Plans ................................................................................................... 89
Figure 64. Number of Months That Emergency Fund Will Cover Household Expenses .......................... 93
Figure 65. Financial Situation: Better Now, the Same, or Worse Than a Year Ago? .................................. 91
Figure 66. Overall Assessment of Financial Status by Highest Degree/ Level of Education .................. 95
Figure 67. Overall Assessment of Financial Status by Labor Force Status .................................................... 95
Figure 68. Overall Assessment of Financial Status by Type of Injury .............................................................. 97
Figure B1. Cumulative Number of 2013 WWP Survey Completes Throughout Data Collection ........ B-8
Figure C1. Extent to Which Physical Health or Emotional Problems Have Interfered With Normal Social Activities in Past 4 Weeks ............................................................................................................. C-1
Figure C2. Amount of Time Physical Health or Emotional Problems Have Interfered With Normal Social Activities in Past 4 Weeks ............................................................................................................. C-1
Figure C3. Number in Household Supported by Respondent's Income ........................................................ C-2
2013 Wounded Warrior Project Survey Results xiv
List of Figures (Continued) Page
Figure C4. Current Forms of Debt ................................................................................................................................. C-2
Figure C5. Total Amount of Outstanding Debt, Excluding Mortgage Debt ................................................... C-3
Figure C6. Income Earned From Work in Past 12 Months ................................................................................. C-3
Figure C7. Money Received in Past 12 Months From Various Benefit, Cash Assistance, and Disability Programs ...................................................................................................................................... C-4
Figure C8. Income Spouse or Partner Earned in Past 12 Months .................................................................... C-4
2013 Wounded Warrior Project Survey Results 1
WOUNDED WARRIOR PROJECT Wounded Warrior Project (WWP) plays an important role in improving the lives of severely injured service members through efforts to increase public awareness about this population’s needs, to bring about legislative and policy changes to address those needs, and to augment the services available to them through the Department of Defense (DoD), the Department of Veterans Affairs (VA), and other agencies. WWP offers many services, including benefits, peer and emotional support, as well as support for caregivers. In addition, WWP offers career guidance through Warriors to Work, as well as IT training through the Transition Training Academy (TTA). WWP offers multiple programs to support Wounded Warriors in a comprehensive and holistic programming model. WWP’s work in the legislative arena led to the creation of the Traumatic Injury Protection program (TSGLI), which provides much-needed financial support for severely injured service members, and the creation and passage of the Caregiver Legislation (Caregiver and Veterans Omnibus Health Services Act of 2010). The ultimate goal of the WWP is to foster the most well-adjusted generation of American warriors by supporting their mental health, promoting their physical health, and encouraging their economic empowerment.
WOUNDED WARRIOR PROJECT SURVEY
SURVEY OBJECTIVE WWP maintains a database of wounded warriors registered as WWP alumni. Eligible alumni include service members and veterans who incurred a physical or mental injury, illness, or wound, which was not due to their own misconduct, co-incident to their military service on or after September 11, 2001. WWP designed its survey to assess current alumni demographics, mental and physical well-being, and economic empowerment across a number of outcome domains. WWP plans to conduct this survey annually over 5 years to establish baseline data on its alumni membership and then to identify trends among WWP alumni and compare their outcomes with those of other military populations (the survey was first administered in 2010). The survey is NOT intended to measure the impact of individual WWP programs.
SURVEY DEVELOPMENT AND CONTENT
DEVELOPMENT PROCESS. For the 2010 survey, WWP worked with RAND to develop the outcome domains and survey items. Westat appraised the draft survey to identify potential problems for alumni in understanding and answering the questions, and WWP subsequently approved various revisions to the questionnaire. WWP then recruited four of its alumni and one alumni caregiver to participate in cognitive interviews to pretest selected items from the revised draft survey. Experienced cognitive interviewers at Westat conducted the pretest (three in-person interviews at WWP’s Washington, DC, offices and two telephone interviews in December 2009). WWP and a RAND representative discussed the interview findings and recommendations during a conference call with Westat, and WWP decided on final changes to
2013 Wounded Warrior Project Survey Results 2
the survey. For the 2011 survey, additional questions were asked about active duty status and deployment to a combat area, some of the employment-status questions were revised to align them more closely with employment-status questions in the Current Population Survey, and some response options were added to a few questions. For the 2012 survey, a new response option was added to the list of WWP programs (“WWP Restore”), two WWP program names were revised (changed “Caregivers” to “Family Support” and “WW Disabled Sports Project” to WWP Adaptive Sporting Events”), and the response options for two questions were programmed to allow Alumni to mark all that apply rather than mark one only. Also, two “fill-in” responses were modified to have closed response sets. Finally, the question asking about the year an injury or health problem was experienced was revised to ask about the years injuries or health problems were sustained, to measure sustained total injuries and health problems more accurately.
The 2013 survey has several additional and revised questions about income, debt, and emergency savings.1 These changes were made to provide additional measures to track alumni’s status and progress in achieving economic empowerment. In addition, to gain a better understanding of the differing effects of physical and emotional problems/mental health on alumni activities, WWP revised several questions that asked about the extent to which “physical health or emotional problems (or mental health)” affected alumni activities into two separate questions. Also, new categories of injuries and health problems were added to the question about alumni experience with such problems during their military service after September 11, 2001. Any alumni who marked that they experienced “Other severe physical injuries” or “Other severe mental injuries or problems” during that period of service were asked to specify what those injuries and problems were. A few other questions were added or removed. Survey changes are discussed in the main report and described in Appendix B.
SURVEY CONTENT. The survey measures a series of outcome domains related to the following general topics:
• Background Information about WWP Alumni • Physical and Mental Well-Being • Economic Empowerment
WEB INSTRUMENT. Westat used WebSurveyor (Enterprise Feedback Management) to program the web survey. Project team members tested the web instrument across two platforms (Windows and Mac OSX), multiple browsers/browser versions, and screen resolutions and designed the survey to meet 508 accessibility standards.
1 The income and debt questions in this survey were not pretested with any alumni to determine if they were easy to understand and answer accurately. Also, questions on income and other financial matters are considered sensitive by many survey respondents. Estimates related to these items may be subject to more response error than estimates on other topics.
2013 Wounded Warrior Project Survey Results 3
2013 SURVEY ADMINISTRATION Westat administered the survey to 26,892 alumni in WWP’s member database (up from13,385 in 2012, 5,870 in 2011, and 3,464 in 2010). Data collection continued for 6 weeks, from March 5 to April 17, 2013. Most communications with the wounded warriors were via email and included a prenotice message, a survey invitation, and six email thank you/reminder messages that were sent to survey nonrespondents. A postal mail reminder letter was also sent during the 5th week of data collection (see Appendix A for copies of the email and postal communications). As an incentive to promote higher survey response, those who answered and submitted a 2013 survey could choose to receive an Under Armour sackpack with the WWP logo on it. (Nonmonetary incentives were also offered in 2011 and 2012; no incentive was offered in 2010.)
Westat’s WWP Survey Help Center provided technical assistance to sample members throughout data collection. The final response rate was 51.9 percent (13,956 respondents among the 26,886 eligible sample members in the survey population), up from 32.4 percent in 2010, 39.4 percent in 2011, and 42.5 percent in 2012. Appendix B includes more details on survey methods and administration.
CAREGIVER ASSISTANCE WITH SURVEY. Eighty caregivers (0.6%, unweighted) reported that they completed the survey for their wounded warriors, and 1,247 caregivers (9.6%, unweighted) helped responding alumni to complete the 2013 survey.
2013 REPORTED DATA
WWP SURVEY. New! The estimates provided in the findings section of this 2013 report are weighted data. The survey results were adjusted to reduce bias in survey estimates that might occur when not everyone who was invited to compete the survey did so. Such bias is likely to occur if there is a relationship between response propensity and the values of the survey data. For example, if employment status in nonrespondents was systematically different from the employment status of those who completed the survey, this could have introduced bias.
When calculating weights, statisticians need to have information about both respondents and nonrespondents to determine if the characteristics of respondents are different from those of nonrespondents. In the first 3 years of survey administration, we did not have sufficient information for both survey respondents and nonrespondents that would allow weighting of the survey results. This year, there was sufficient information in the WWP alumni database on military status (active duty versus not active duty), age, and geographic region to use those variables to adjust the collected survey data for survey nonresponse. Thus, the generalizability of the survey estimates in this report to the overall 2013 survey population of WWP alumni is likely better than it was for the estimates from the 2012, 2011, and 2010 surveys. A comparison of many 2013 weighted and unweighted estimates indicated that most differences ranged from .3 to .5 percentage points. For some estimates there no differences, and for some estimates the differences were about 2 percentage points. More details on the weighting process used for the 2013 survey are included in Appendix B: Survey Methods.
2013 Wounded Warrior Project Survey Results 4
The analytic data set includes completed cases for 13,956 alumni. For a survey to be considered “complete” and included in the analytic data set, the respondent had to answer at least 18 of the core demographic questions as well as 22 of the 47 core nondemographic items. Core questions were those that all alumni had a chance to answer (i.e., they were not prevented from answering them because of programmed skips). Whenever percentages were calculated, missing responses were removed from the denominators. Denominators thus vary across questions because warriors could choose to skip any questions they did not want to answer. Missing responses also include items that were skipped according to questionnaire programming.
The data we report represent the findings for WWP alumni surveyed in 2011, 2012, and 2013. Most, but not all, figures and tables include data for all 3 years (some of the charts showing demographic characteristics include only 2013 findings for alumni, and some questions were added or substantively revised in the 2013 survey and there is no comparable data from earlier years ). Please note that the sample size for 2013 was much larger than in 2012 and 2011 (26,892 in 2013 vs. 13,385 in 2012 and 5,870 in 2011). Because the survey populations were not identical across those years, differences in results from one year to the next do not reflect how a specific group of respondents changed between 2011 and 2013. In the text, we highlight changes of 5 percentage points or more between the 2013 and 2012 survey results as well as some patterns of change since 2011. The data do reflect the physical and mental well-being, as well as the economic well-being and demographic characteristics, of WWP alumni in each year. As noted, WWP uses the yearly data when developing and improving its annual strategic plan for WWP programs and services for alumni and their family members.
U.S. BUREAU OF LABOR STATISTICS COMPARISON DATA. The U. S. Bureau of Labor Statistics (BLS) collects data on veterans as part of the Current Population Survey (CPS)—a monthly survey of about 60,000 households—as well as through a monthly supplement on special topics, such as veterans with disabilities. Prior supplements were administered every 2 years, but as of 2010, the supplement is being administered annually (in July 2010 and in August in the following years). Veterans are identified by their service period in the BLS data and reports. In various sections of this report, we include 2012 BLS data on Gulf War-era II veterans—defined as those who have served in the military since September 2001—as well as some BLS comparison data for Gulf War-era I veterans (served August 1990–August 2001), all veterans, and nonveterans. Veterans who served in more than one service period are classified in the most recent one. Note that the WWP survey population includes not just veterans, but also active duty service members who have been injured during military service since September 1, 2011. This difference in survey populations should be kept in mind when reviewing the BLS data.
We also include BLS data on employment statistics for persons with and without a disability in the civilian noninstitutional population, ages 16–64. Sources for BLS data appearing in this report are cited in the text and in the References.
2013 Wounded Warrior Project Survey Results 5
COMPARISON DATA FOR PHYSICAL AND MENTAL HEALTH SCALE SCORES. The primary sources of comparison data on physical and mental health status cited in this report are publications related to RAND’s Invisible Wounds of War study (2008; the study population included returned service members from Operation Enduring Freedom [OEF] and Operation Iraqi Freedom [OIF]), the Department of Defense Millennium Cohort (MC) study (the initial 2001 Cohort population cited in a few places in this report included U.S. service members, many of whom had never been deployed), and the Post-Deployment Health Assessment/ Reassessment (PDHA/PHDRA) study (study population results are reported for Army soldiers who had served in the Iraq War or been deployed to other locations). Other sources of comparison data are cited as well.
RAND provided information on the scales used in the WWP survey, including instructions or programming code for calculating scores, and provided information on sources of comparison data. Caveats are sometimes included in the discussion of scale results to emphasize differences between the scales used in the WWP survey and corresponding scales in the other studies. Citations and references are included for sources of comparison data, which also provide information about study populations and sampling/research methods.
ORGANIZATION OF REPORT FINDINGS The remainder of this report contains the survey results. They are presented as follows:
Overall Alumni Background Information Demographic Profile Military Service Experiences Offenses/Convictions Since First Deployment Internet Use
Physical and Mental Well-Being Health and Daily Activities How Have You Been Feeling? Health-Related Matters Health Care Services Social Support
Economic Empowerment Education Employment Status Participation in the Transition Assistance Program Income Current Living Arrangement Debt Financial Accounts Overall Assessment of Financial Status
Major Themes in Survey Comments
2013 Wounded Warrior Project Survey Results 6
The report closes with an overall summary of findings and conclusions. Report appendices include: Appendix A: Copies of Survey Communications Appendix B: Survey Methods and Administration Details Appendix C: Figures From 2012/2011 and New 2013 Figures With Details
2013 Wounded Warrior Project Survey Results 7
ALUMNI BACKGROUND INFORMATION
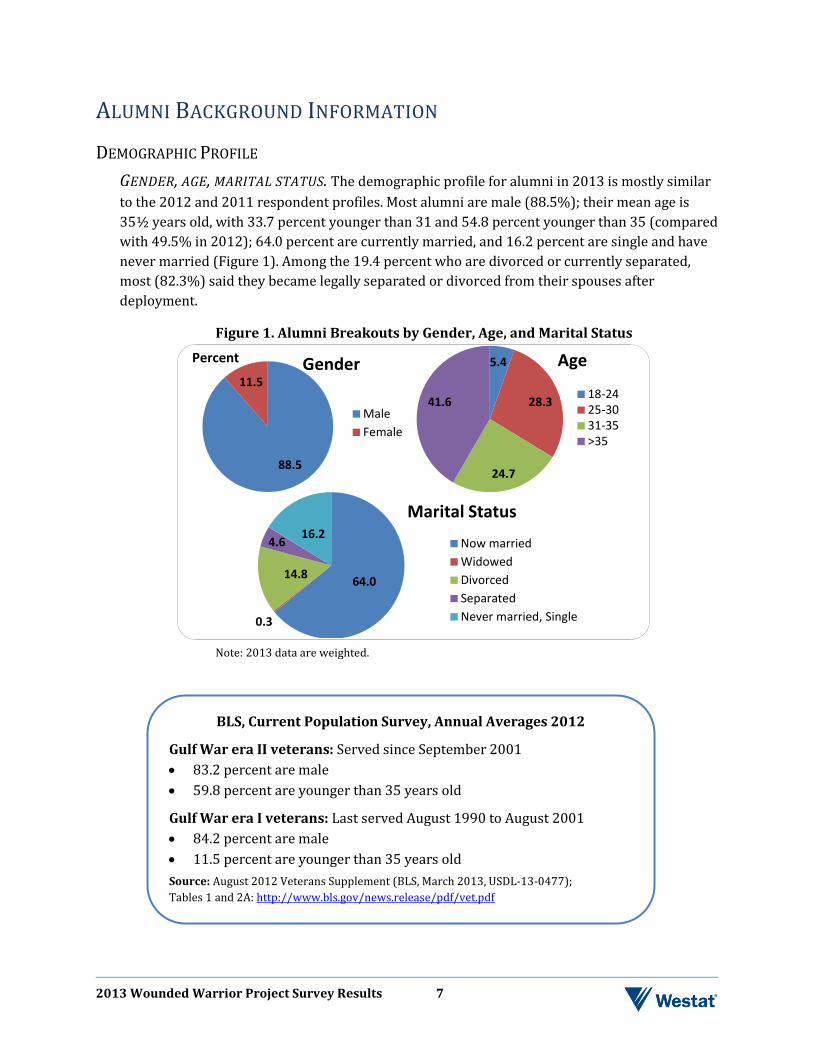
DEMOGRAPHIC PROFILE GENDER, AGE, MARITAL STATUS. The demographic profile for alumni in 2013 is mostly similar to the 2012 and 2011 respondent profiles. Most alumni are male (88.5%); their mean age is 35½ years old, with 33.7 percent younger than 31 and 54.8 percent younger than 35 (compared with 49.5% in 2012); 64.0 percent are currently married, and 16.2 percent are single and have never married (Figure 1). Among the 19.4 percent who are divorced or currently separated, most (82.3%) said they became legally separated or divorced from their spouses after deployment.
Figure 1. Alumni Breakouts by Gender, Age, and Marital Status
Note: 2013 data are weighted.
88.5
11.5 Gender
MaleFemale
Percent 5.4
28.3
24.7
41.6 18-2425-3031-35>35
Age
64.0
0.3
14.8
4.6 16.2 Marital Status
Now marriedWidowedDivorcedSeparatedNever married, Single
BLS, Current Population Survey, Annual Averages 2012
Gulf War era II veterans: Served since September 2001 • 83.2 percent are male • 59.8 percent are younger than 35 years old
Gulf War era I veterans: Last served August 1990 to August 2001 • 84.2 percent are male • 11.5 percent are younger than 35 years old Source: August 2012 Veterans Supplement (BLS, March 2013, USDL-13-0477); Tables 1 and 2A: http://www.bls.gov/news.release/pdf/vet.pdf
2013 Wounded Warrior Project Survey Results 8
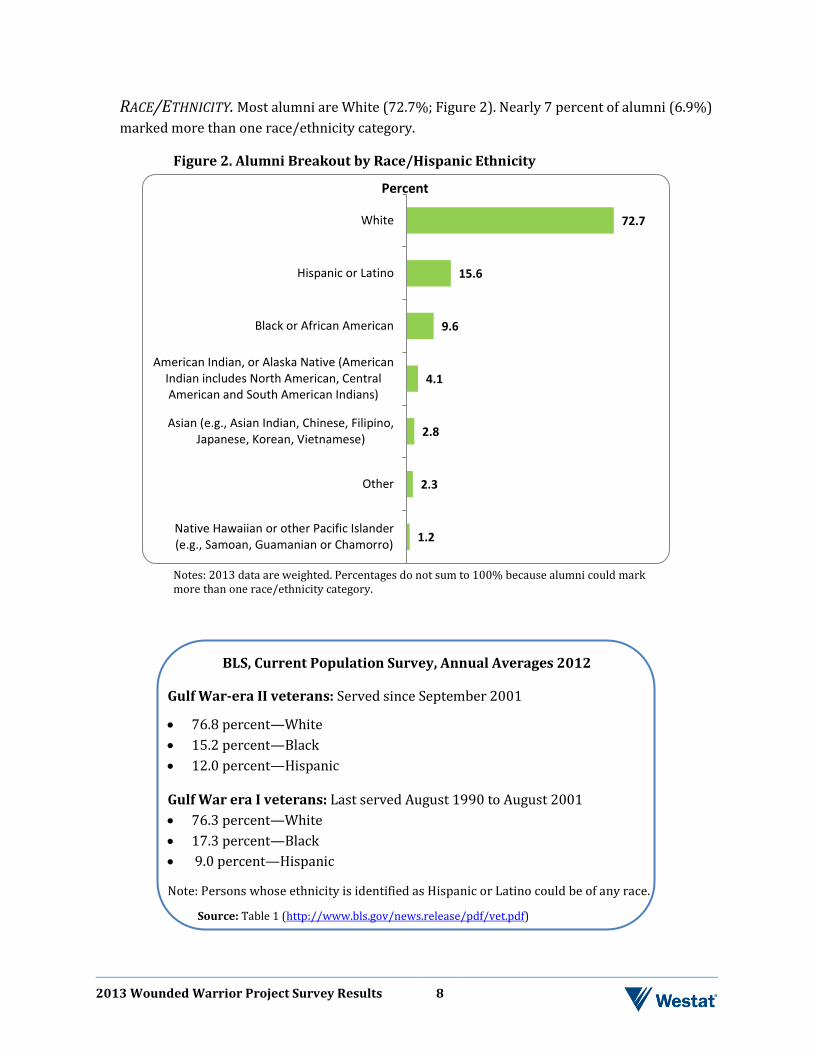
RACE/ETHNICITY. Most alumni are White (72.7%; Figure 2). Nearly 7 percent of alumni (6.9%) marked more than one race/ethnicity category.
Figure 2. Alumni Breakout by Race/Hispanic Ethnicity
Notes: 2013 data are weighted. Percentages do not sum to 100% because alumni could mark more than one race/ethnicity category.
BLS, Current Population Survey, Annual Averages 2012
Gulf War-era II veterans: Served since September 2001
• 76.8 percent—White • 15.2 percent—Black • 12.0 percent—Hispanic
Gulf War era I veterans: Last served August 1990 to August 2001 • 76.3 percent—White • 17.3 percent—Black • 9.0 percent—Hispanic
Note: Persons whose ethnicity is identified as Hispanic or Latino could be of any race.
Source: Table 1 (http://www.bls.gov/news.release/pdf/vet.pdf)
1.2
2.3
2.8
4.1
9.6
15.6
72.7
Native Hawaiian or other Pacific Islander(e.g., Samoan, Guamanian or Chamorro)
Other
Asian (e.g., Asian Indian, Chinese, Filipino,Japanese, Korean, Vietnamese)
American Indian, or Alaska Native (AmericanIndian includes North American, CentralAmerican and South American Indians)
Black or African American
Hispanic or Latino
White
Percent
2013 Wounded Warrior Project Survey Results 9
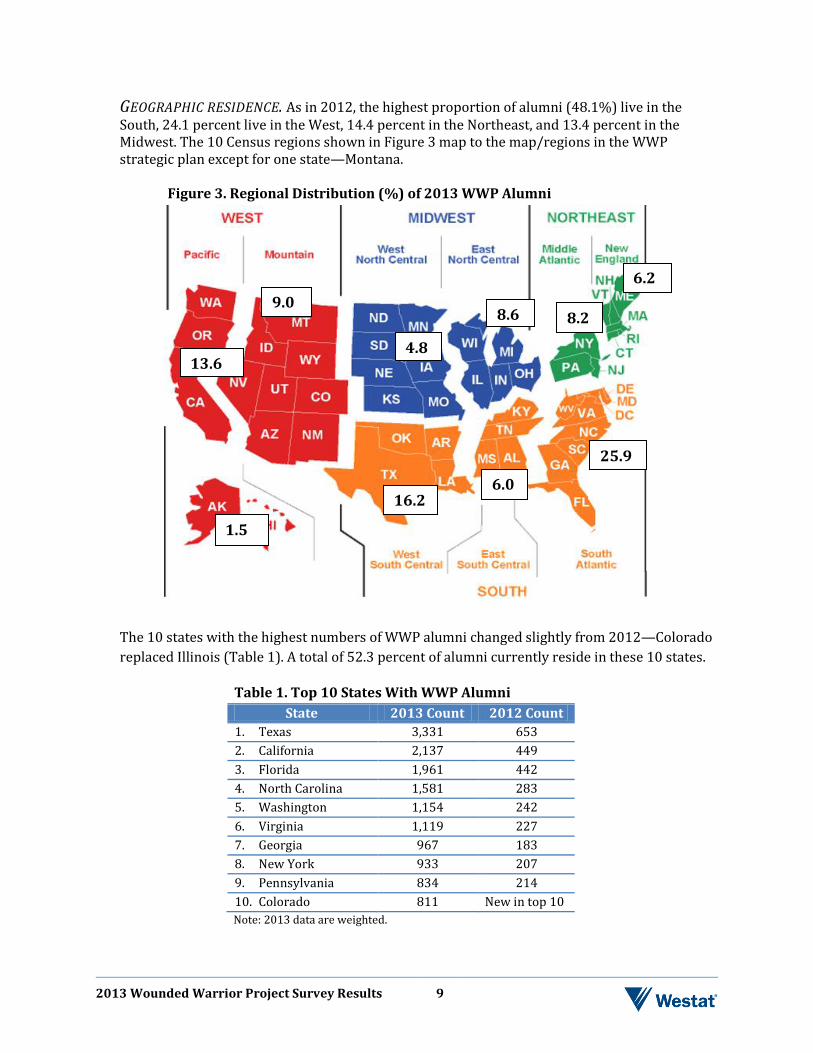
GEOGRAPHIC RESIDENCE. As in 2012, the highest proportion of alumni (48.1%) live in the South, 24.1 percent live in the West, 14.4 percent in the Northeast, and 13.4 percent in the Midwest. The 10 Census regions shown in Figure 3 map to the map/regions in the WWP strategic plan except for one state—Montana.
Figure 3. Regional Distribution (%) of 2013 WWP Alumni
The 10 states with the highest numbers of WWP alumni changed slightly from 2012—Colorado replaced Illinois (Table 1). A total of 52.3 percent of alumni currently reside in these 10 states.
Table 1. Top 10 States With WWP Alumni State 2013 Count 2012 Count
1. Texas 3,331 653 2. California 2,137 449 3. Florida 1,961 442 4. North Carolina 1,581 283 5. Washington 1,154 242 6. Virginia 1,119 227 7. Georgia 967 183 8. New York 933 207 9. Pennsylvania 834 214 10. Colorado 811 New in top 10 Note: 2013 data are weighted.
13.6
9.0
4.8
8.6 8.2
1.5
16.2 6.0
25.9
6.2
2013 Wounded Warrior Project Survey Results 10
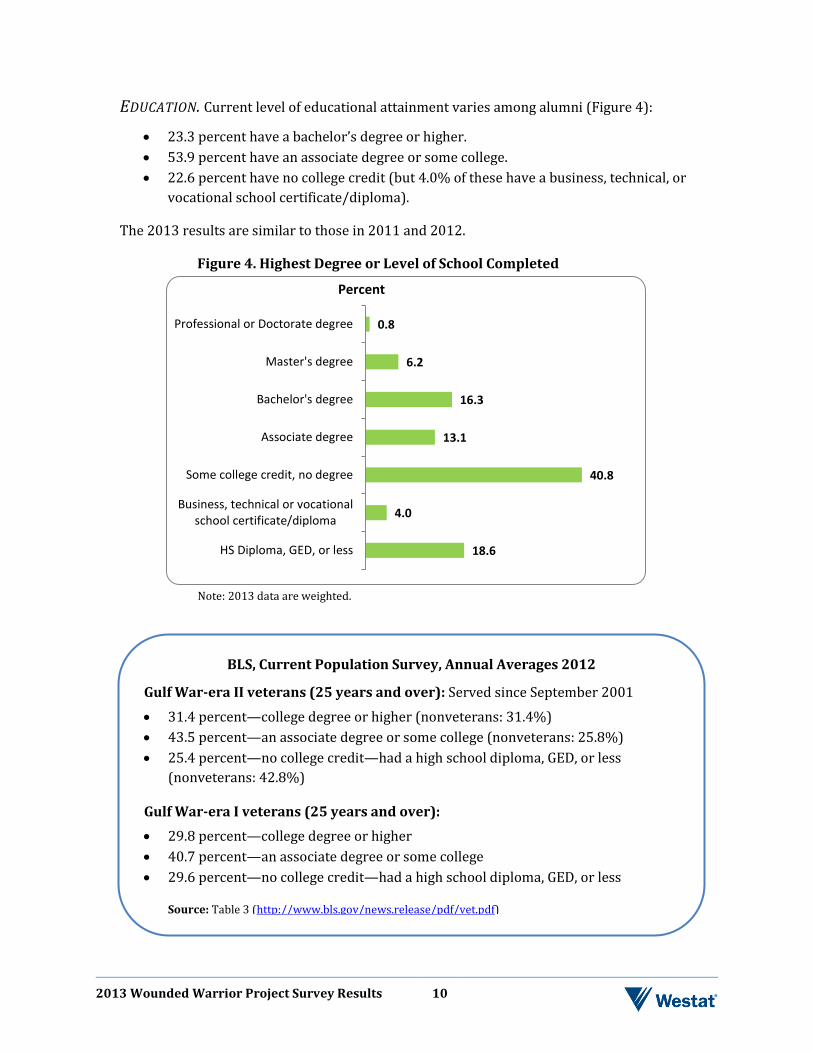
EDUCATION. Current level of educational attainment varies among alumni (Figure 4):
• 23.3 percent have a bachelor’s degree or higher. • 53.9 percent have an associate degree or some college. • 22.6 percent have no college credit (but 4.0% of these have a business, technical, or
vocational school certificate/diploma).
The 2013 results are similar to those in 2011 and 2012.
Figure 4. Highest Degree or Level of School Completed
Note: 2013 data are weighted.
18.6
4.0
40.8
13.1
16.3
6.2
0.8
HS Diploma, GED, or less
Business, technical or vocationalschool certificate/diploma
Some college credit, no degree
Associate degree
Bachelor's degree
Master's degree
Professional or Doctorate degree
Percent
BLS, Current Population Survey, Annual Averages 2012
Gulf War-era II veterans (25 years and over): Served since September 2001
• 31.4 percent—college degree or higher (nonveterans: 31.4%) • 43.5 percent—an associate degree or some college (nonveterans: 25.8%) • 25.4 percent—no college credit—had a high school diploma, GED, or less
(nonveterans: 42.8%)
Gulf War-era I veterans (25 years and over): • 29.8 percent—college degree or higher • 40.7 percent—an associate degree or some college • 29.6 percent—no college credit—had a high school diploma, GED, or less
Source: Table 3 (http://www.bls.gov/news.release/pdf/vet.pdf)
2013 Wounded Warrior Project Survey Results 11
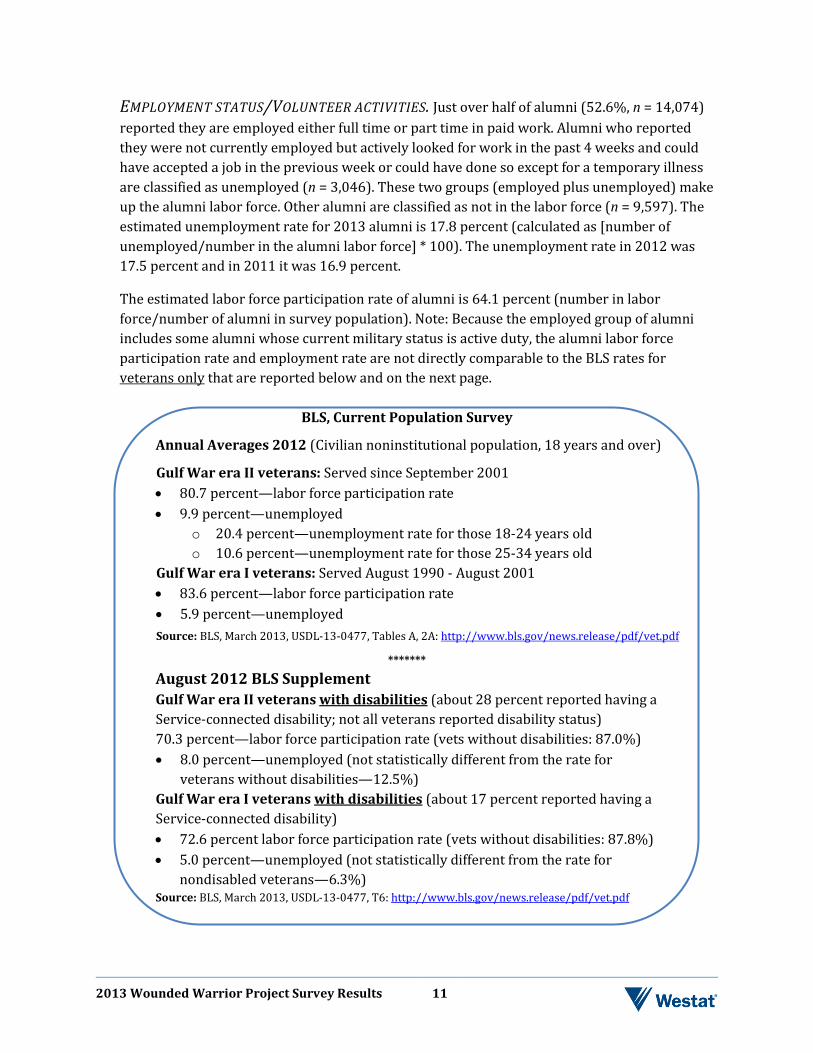
EMPLOYMENT STATUS/VOLUNTEER ACTIVITIES. Just over half of alumni (52.6%, n = 14,074) reported they are employed either full time or part time in paid work. Alumni who reported they were not currently employed but actively looked for work in the past 4 weeks and could have accepted a job in the previous week or could have done so except for a temporary illness are classified as unemployed (n = 3,046). These two groups (employed plus unemployed) make up the alumni labor force. Other alumni are classified as not in the labor force (n = 9,597). The estimated unemployment rate for 2013 alumni is 17.8 percent (calculated as [number of unemployed/number in the alumni labor force] * 100). The unemployment rate in 2012 was 17.5 percent and in 2011 it was 16.9 percent.
The estimated labor force participation rate of alumni is 64.1 percent (number in labor force/number of alumni in survey population). Note: Because the employed group of alumni includes some alumni whose current military status is active duty, the alumni labor force participation rate and employment rate are not directly comparable to the BLS rates for veterans only that are reported below and on the next page.
BLS, Current Population Survey
Annual Averages 2012 (Civilian noninstitutional population, 18 years and over)
Gulf War era II veterans: Served since September 2001 • 80.7 percent—labor force participation rate • 9.9 percent—unemployed
o 20.4 percent—unemployment rate for those 18-24 years old o 10.6 percent—unemployment rate for those 25-34 years old
Gulf War era I veterans: Served August 1990 - August 2001 • 83.6 percent—labor force participation rate • 5.9 percent—unemployed Source: BLS, March 2013, USDL-13-0477, Tables A, 2A: http://www.bls.gov/news.release/pdf/vet.pdf
******* August 2012 BLS Supplement Gulf War era II veterans with disabilities (about 28 percent reported having a Service-connected disability; not all veterans reported disability status) 70.3 percent—labor force participation rate (vets without disabilities: 87.0%) • 8.0 percent—unemployed (not statistically different from the rate for
veterans without disabilities—12.5%) Gulf War era I veterans with disabilities (about 17 percent reported having a Service-connected disability) • 72.6 percent labor force participation rate (vets without disabilities: 87.8%) • 5.0 percent—unemployed (not statistically different from the rate for
nondisabled veterans—6.3%) Source: BLS, March 2013, USDL-13-0477, T6: http://www.bls.gov/news.release/pdf/vet.pdf
2013 Wounded Warrior Project Survey Results 12
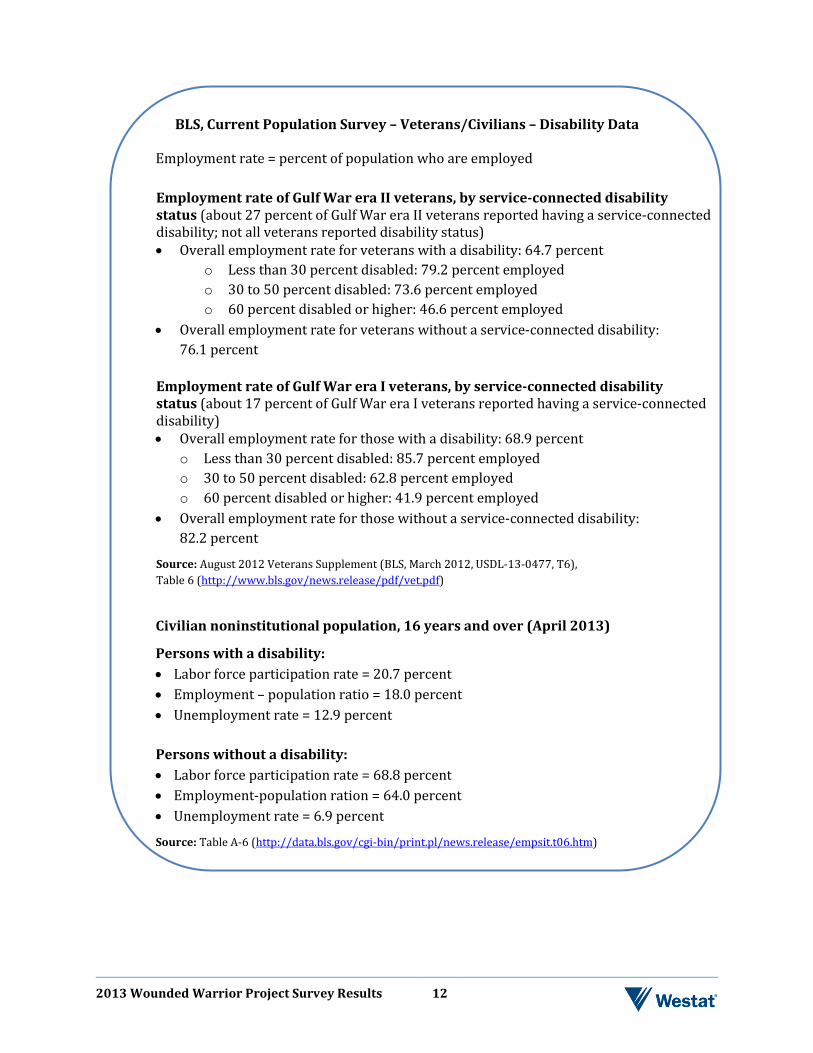
BLS, Current Population Survey – Veterans/Civilians – Disability Data
Employment rate = percent of population who are employed Employment rate of Gulf War era II veterans, by service-connected disability status (about 27 percent of Gulf War era II veterans reported having a service-connected disability; not all veterans reported disability status) • Overall employment rate for veterans with a disability: 64.7 percent
o Less than 30 percent disabled: 79.2 percent employed o 30 to 50 percent disabled: 73.6 percent employed o 60 percent disabled or higher: 46.6 percent employed
• Overall employment rate for veterans without a service-connected disability: 76.1 percent
Employment rate of Gulf War era I veterans, by service-connected disability status (about 17 percent of Gulf War era I veterans reported having a service-connected disability) • Overall employment rate for those with a disability: 68.9 percent
o Less than 30 percent disabled: 85.7 percent employed o 30 to 50 percent disabled: 62.8 percent employed o 60 percent disabled or higher: 41.9 percent employed
• Overall employment rate for those without a service-connected disability: 82.2 percent
Source: August 2012 Veterans Supplement (BLS, March 2012, USDL-13-0477, T6), Table 6 (http://www.bls.gov/news.release/pdf/vet.pdf)
Civilian noninstitutional population, 16 years and over (April 2013)
Persons with a disability: • Labor force participation rate = 20.7 percent • Employment – population ratio = 18.0 percent • Unemployment rate = 12.9 percent
Persons without a disability:
• Labor force participation rate = 68.8 percent • Employment-population ration = 64.0 percent • Unemployment rate = 6.9 percent
Source: Table A-6 (http://data.bls.gov/cgi-bin/print.pl/news.release/empsit.t06.htm)
2013 Wounded Warrior Project Survey Results 13
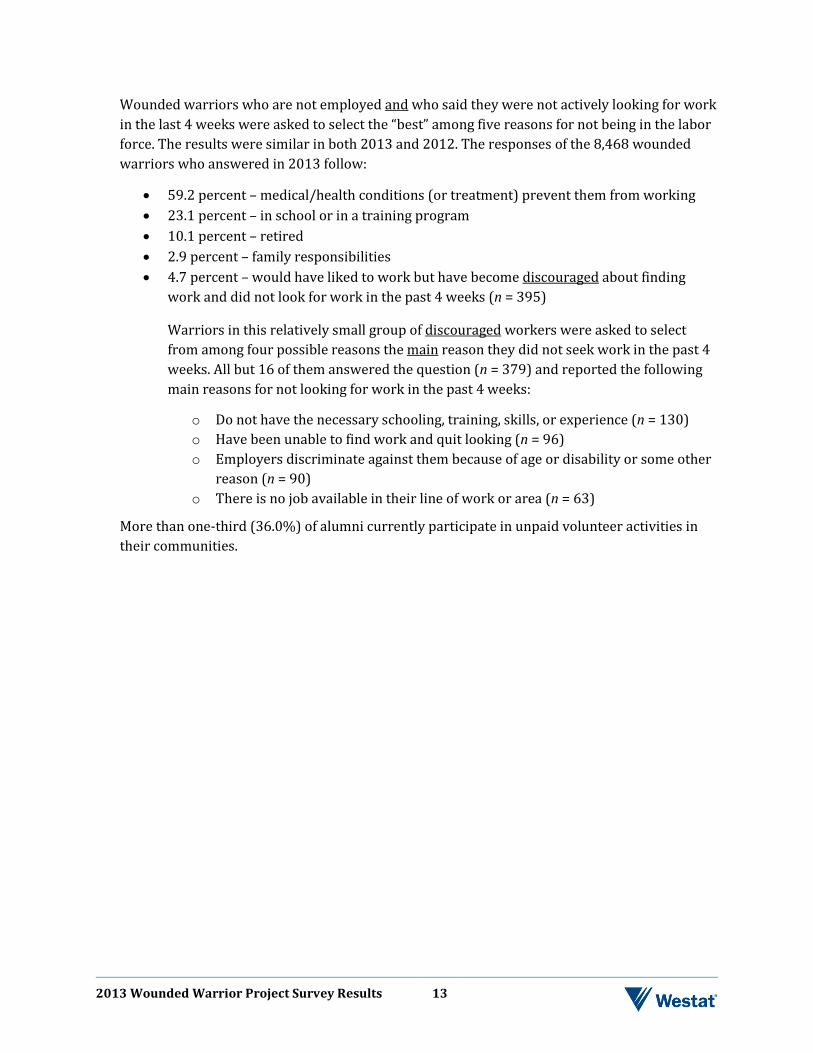
Wounded warriors who are not employed and who said they were not actively looking for work in the last 4 weeks were asked to select the “best” among five reasons for not being in the labor force. The results were similar in both 2013 and 2012. The responses of the 8,468 wounded warriors who answered in 2013 follow:
• 59.2 percent – medical/health conditions (or treatment) prevent them from working • 23.1 percent – in school or in a training program • 10.1 percent – retired • 2.9 percent – family responsibilities • 4.7 percent – would have liked to work but have become discouraged about finding
work and did not look for work in the past 4 weeks (n = 395)
Warriors in this relatively small group of discouraged workers were asked to select from among four possible reasons the main reason they did not seek work in the past 4 weeks. All but 16 of them answered the question (n = 379) and reported the following main reasons for not looking for work in the past 4 weeks:
o Do not have the necessary schooling, training, skills, or experience (n = 130) o Have been unable to find work and quit looking (n = 96) o Employers discriminate against them because of age or disability or some other
reason (n = 90) o There is no job available in their line of work or area (n = 63)
More than one-third (36.0%) of alumni currently participate in unpaid volunteer activities in their communities.
2013 Wounded Warrior Project Survey Results 14
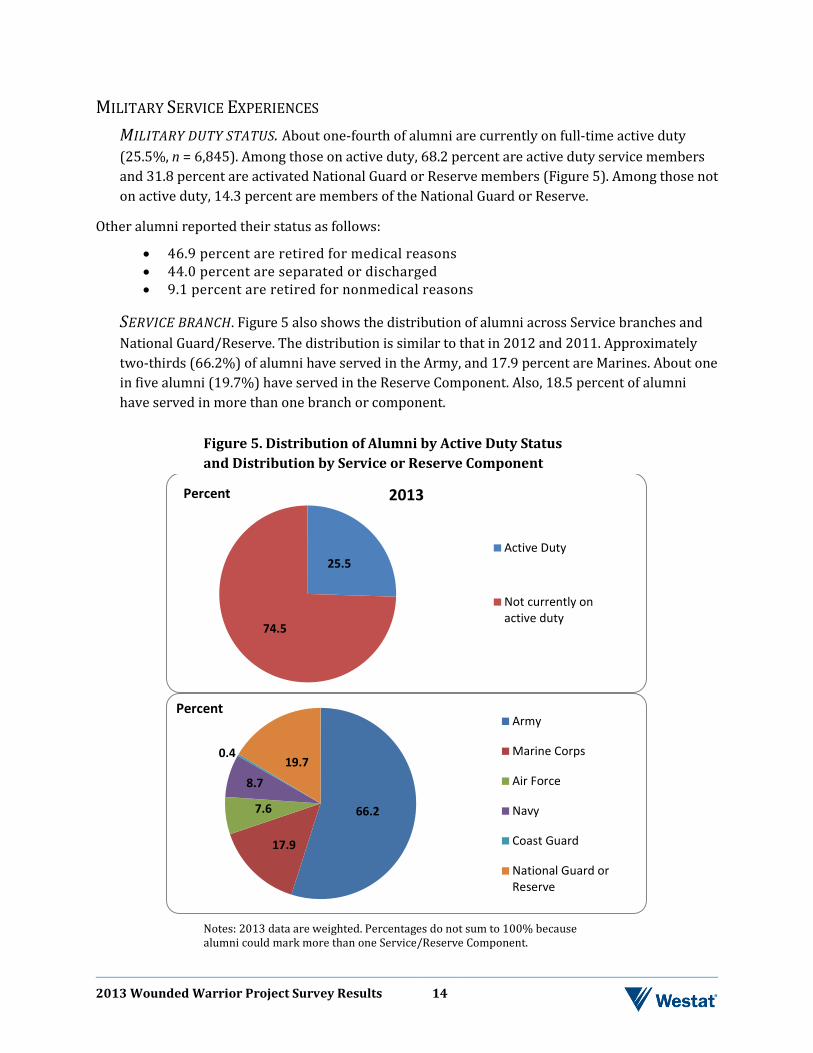
MILITARY SERVICE EXPERIENCES MILITARY DUTY STATUS. About one-fourth of alumni are currently on full-time active duty (25.5%, n = 6,845). Among those on active duty, 68.2 percent are active duty service members and 31.8 percent are activated National Guard or Reserve members (Figure 5). Among those not on active duty, 14.3 percent are members of the National Guard or Reserve.
Other alumni reported their status as follows:
• 46.9 percent are retired for medical reasons • 44.0 percent are separated or discharged • 9.1 percent are retired for nonmedical reasons
SERVICE BRANCH. Figure 5 also shows the distribution of alumni across Service branches and National Guard/Reserve. The distribution is similar to that in 2012 and 2011. Approximately two-thirds (66.2%) of alumni have served in the Army, and 17.9 percent are Marines. About one in five alumni (19.7%) have served in the Reserve Component. Also, 18.5 percent of alumni have served in more than one branch or component.
Figure 5. Distribution of Alumni by Active Duty Status and Distribution by Service or Reserve Component
Notes: 2013 data are weighted. Percentages do not sum to 100% because alumni could mark more than one Service/Reserve Component.
25.5
74.5
2013
Active Duty
Not currently onactive duty
Percent
66.2
17.9
7.6
8.7
0.4 19.7
Army
Marine Corps
Air Force
Navy
Coast Guard
National Guard orReserve
Percent
2013 Wounded Warrior Project Survey Results 15
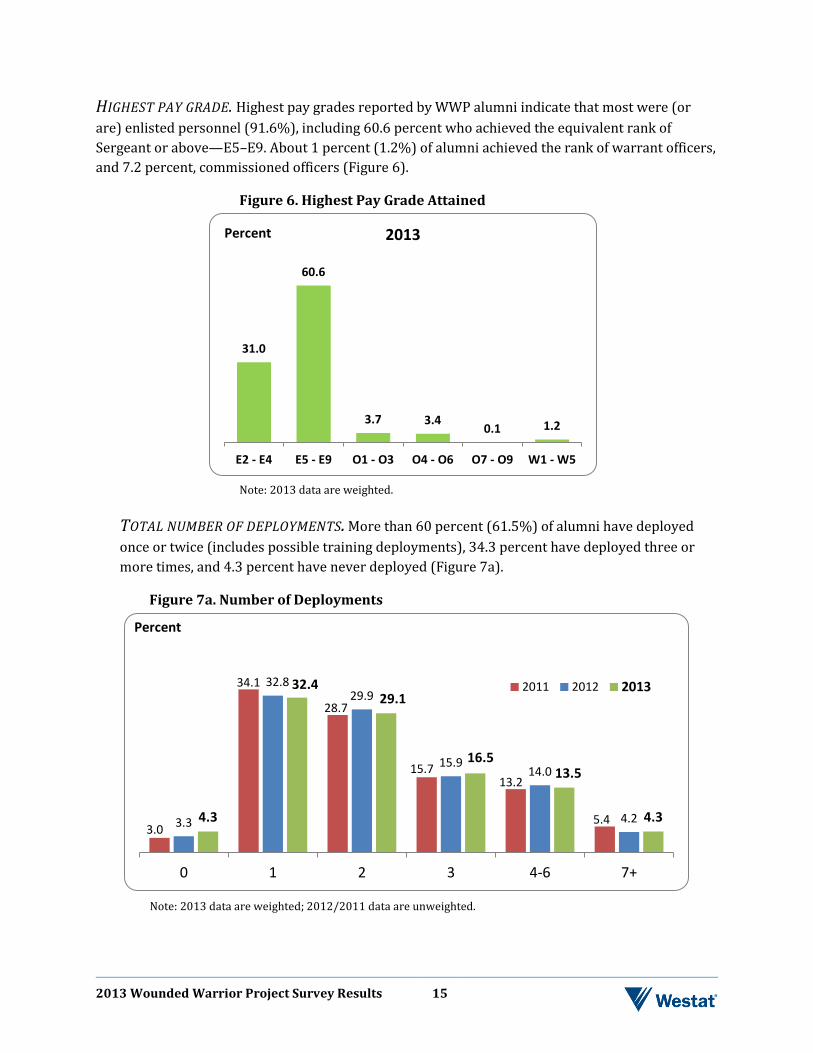
HIGHEST PAY GRADE. Highest pay grades reported by WWP alumni indicate that most were (or are) enlisted personnel (91.6%), including 60.6 percent who achieved the equivalent rank of Sergeant or above—E5–E9. About 1 percent (1.2%) of alumni achieved the rank of warrant officers, and 7.2 percent, commissioned officers (Figure 6).
Figure 6. Highest Pay Grade Attained
Note: 2013 data are weighted.
TOTAL NUMBER OF DEPLOYMENTS. More than 60 percent (61.5%) of alumni have deployed once or twice (includes possible training deployments), 34.3 percent have deployed three or more times, and 4.3 percent have never deployed (Figure 7a).
Figure 7a. Number of Deployments
Note: 2013 data are weighted; 2012/2011 data are unweighted.
31.0
60.6
3.7 3.4 0.1 1.2
E2 - E4 E5 - E9 O1 - O3 O4 - O6 O7 - O9 W1 - W5
2013 Percent
3.0
34.1
28.7
15.7 13.2
5.4 3.3
32.8 29.9
15.9 14.0
4.2 4.3
32.4 29.1
16.5 13.5
4.3
0 1 2 3 4-6 7+
2011 2012 2013
Percent
2013 Wounded Warrior Project Survey Results 16
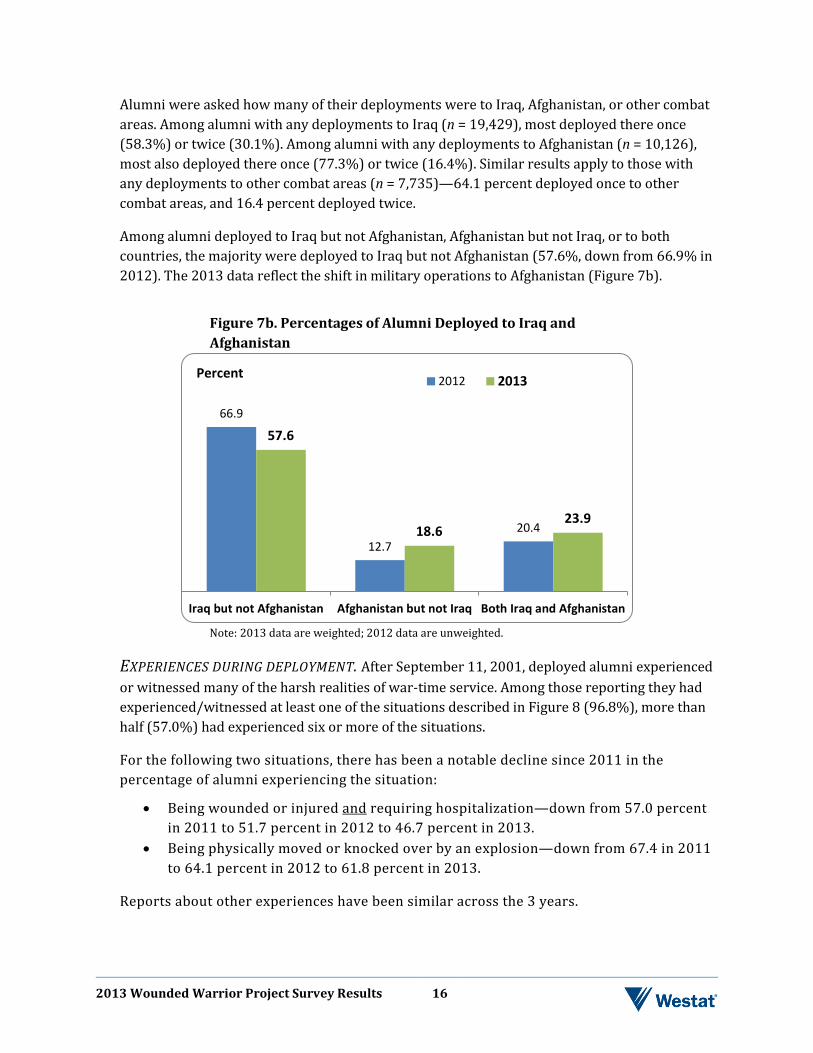
Alumni were asked how many of their deployments were to Iraq, Afghanistan, or other combat areas. Among alumni with any deployments to Iraq (n = 19,429), most deployed there once (58.3%) or twice (30.1%). Among alumni with any deployments to Afghanistan (n = 10,126), most also deployed there once (77.3%) or twice (16.4%). Similar results apply to those with any deployments to other combat areas (n = 7,735)—64.1 percent deployed once to other combat areas, and 16.4 percent deployed twice.
Among alumni deployed to Iraq but not Afghanistan, Afghanistan but not Iraq, or to both countries, the majority were deployed to Iraq but not Afghanistan (57.6%, down from 66.9% in 2012). The 2013 data reflect the shift in military operations to Afghanistan (Figure 7b).
Figure 7b. Percentages of Alumni Deployed to Iraq and Afghanistan
Note: 2013 data are weighted; 2012 data are unweighted.
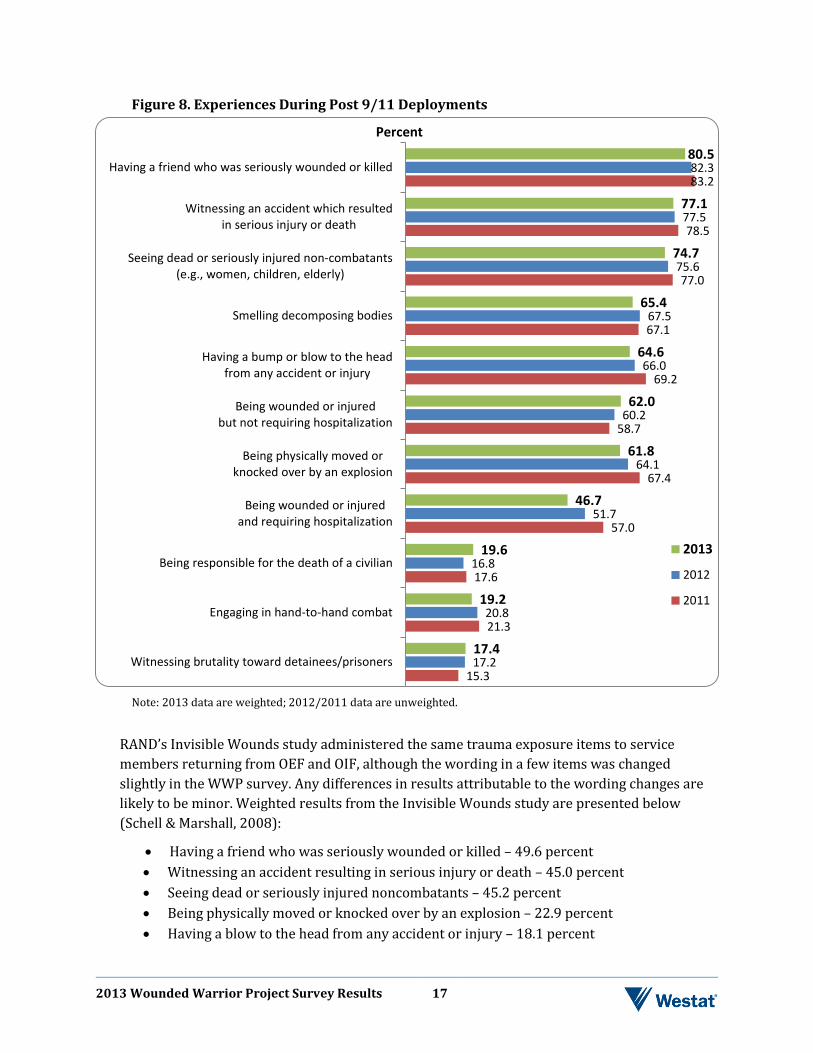
EXPERIENCES DURING DEPLOYMENT. After September 11, 2001, deployed alumni experienced or witnessed many of the harsh realities of war-time service. Among those reporting they had experienced/witnessed at least one of the situations described in Figure 8 (96.8%), more than half (57.0%) had experienced six or more of the situations.
For the following two situations, there has been a notable decline since 2011 in the percentage of alumni experiencing the situation:
• Being wounded or injured and requiring hospitalization—down from 57.0 percent in 2011 to 51.7 percent in 2012 to 46.7 percent in 2013.
• Being physically moved or knocked over by an explosion—down from 67.4 in 2011 to 64.1 percent in 2012 to 61.8 percent in 2013.
Reports about other experiences have been similar across the 3 years.
66.9
12.7 20.4
57.6
18.6 23.9
Iraq but not Afghanistan Afghanistan but not Iraq Both Iraq and Afghanistan
2012 2013Percent
2013 Wounded Warrior Project Survey Results 17
Figure 8. Experiences During Post 9/11 Deployments
Note: 2013 data are weighted; 2012/2011 data are unweighted.
RAND’s Invisible Wounds study administered the same trauma exposure items to service members returning from OEF and OIF, although the wording in a few items was changed slightly in the WWP survey. Any differences in results attributable to the wording changes are likely to be minor. Weighted results from the Invisible Wounds study are presented below (Schell & Marshall, 2008):
• Having a friend who was seriously wounded or killed – 49.6 percent • Witnessing an accident resulting in serious injury or death – 45.0 percent • Seeing dead or seriously injured noncombatants – 45.2 percent • Being physically moved or knocked over by an explosion – 22.9 percent • Having a blow to the head from any accident or injury – 18.1 percent
15.3
21.3
17.6
57.0
67.4
58.7
69.2
67.1
77.0
78.5
83.2
17.2
20.8
16.8
51.7
64.1
60.2
66.0
67.5
75.6
77.5
82.3
17.4
19.2
19.6
46.7
61.8
62.0
64.6
65.4
74.7
77.1
80.5
Witnessing brutality toward detainees/prisoners
Engaging in hand-to-hand combat
Being responsible for the death of a civilian
Being wounded or injuredand requiring hospitalization
Being physically moved orknocked over by an explosion
Being wounded or injuredbut not requiring hospitalization
Having a bump or blow to the headfrom any accident or injury
Smelling decomposing bodies
Seeing dead or seriously injured non-combatants(e.g., women, children, elderly)
Witnessing an accident which resultedin serious injury or death
Having a friend who was seriously wounded or killed
2013
2012
2011
Percent
2013 Wounded Warrior Project Survey Results 18
• Being injured, requiring hospitalization – 10.7 percent • Smelling decomposing bodies – 37.0 percent • Being injured, not requiring hospitalization – 22.8 percent • Engaging in hand-to-hand combat – 9.5 percent • Witnessing brutality toward detainees/prisoners – 5.3 percent • Being responsible for the death of a civilian – 5.2 percent
The percentages of WWP respondents reporting trauma exposures are notably higher than the percentages reported in the Invisible Wounds study. This may be due partly to the self-selection of warriors who have signed up to become WWP alumni and to the fact that many have likely experienced more deployments and injuries than service members in the Invisible Wounds Study did.
INJURIES AND HEALTH PROBLEMS EXPERIENCED DURING MILITARY SERVICE. To gain a better understanding of both other physical and mental injuries experienced by alumni during their military service after September 11, 2001, WWP made several changes in the 2013 survey to the question asking about injuries and health problems alumni experienced during their service after September 11, 2001. Six new injuries or health problems were added to the list of possible injuries or health problems. Also, all alumni marking “Other severe mental injuries” or “Other severe physical injuries” box received a followup question asking them to please specify what those other physical or mental injuries or health problems were. Figure 9 reflects the revised response list and results for the 2013 survey.
Nearly all respondents (98.7%) reported they experienced at least one injury during their post 9/11 military service. Among those reporting multiple injuries or health problems, more than two-thirds (66.8%) reported between three and seven injuries or health problems.
Reports of posttraumatic stress disorder remain high and similar to reports in earlier WWP surveys: three-fourths of alumni (75.4%) reported they experienced this disorder. Reports of traumatic brain injury have declined since 2011 (51.0% in 2011 to 48.8% in 2012 to 44.6% in 2013). More than two-thirds of alumni marked two of the new responses: anxiety (73.9%) and depression (68.8%). Also, 57.4 percent marked the new response of severe back, neck, or shoulder problems, and 52.1% experienced tinnitus.
The drop in percentage of those marking “Other severe physical injuries” is attributed partly to the new response categories added in 2013 and the back coding of “specified” responses to listed response categories when appropriate. Among alumni who specified what “Other severe physical injuries” they had experienced, many external and internal parts of the body were mentioned. Those specified most frequently included injuries to the ankle, foot/feet, hip, hand, head, heart, and lung as well as fractured bones, migraines/other headaches, and cancer.
For the category of “Other severe mental injuries or health problems,” the most frequent problems that alumni specified included nerves, sleep-related problems, nightmares, memory
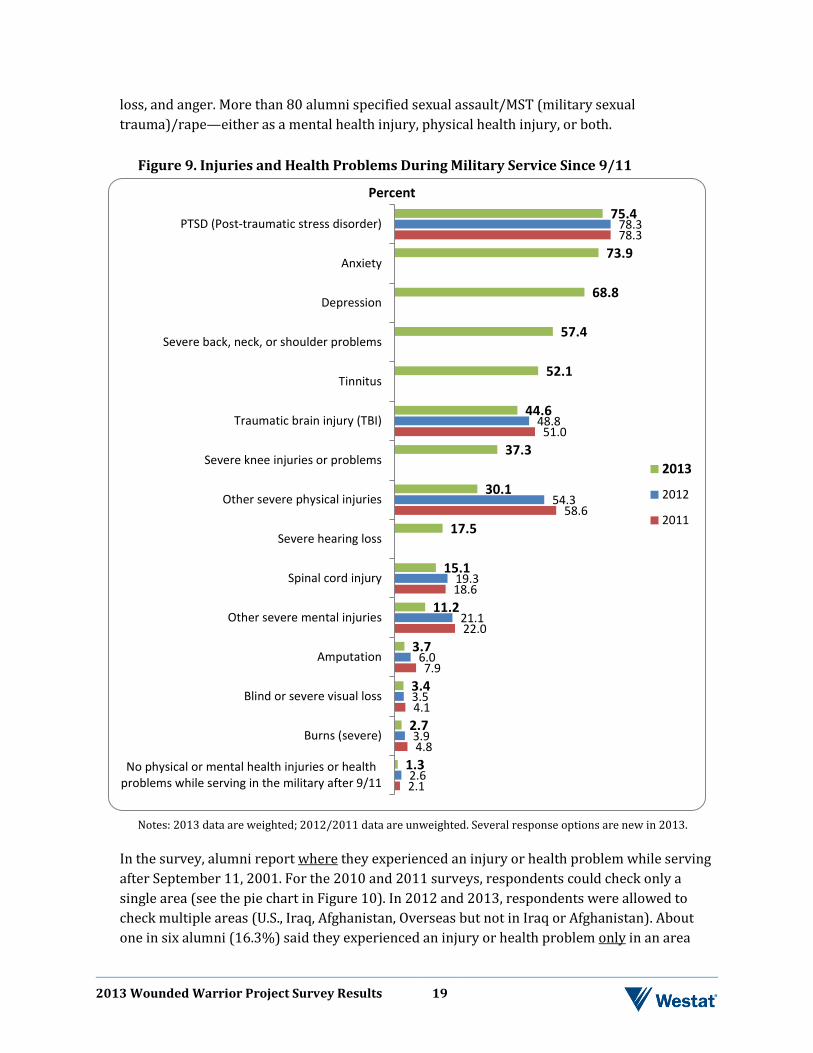
2013 Wounded Warrior Project Survey Results 19
loss, and anger. More than 80 alumni specified sexual assault/MST (military sexual trauma)/rape—either as a mental health injury, physical health injury, or both.
Figure 9. Injuries and Health Problems During Military Service Since 9/11
Notes: 2013 data are weighted; 2012/2011 data are unweighted. Several response options are new in 2013.
In the survey, alumni report where they experienced an injury or health problem while serving after September 11, 2001. For the 2010 and 2011 surveys, respondents could check only a single area (see the pie chart in Figure 10). In 2012 and 2013, respondents were allowed to check multiple areas (U.S., Iraq, Afghanistan, Overseas but not in Iraq or Afghanistan). About one in six alumni (16.3%) said they experienced an injury or health problem only in an area
2.1
4.8
4.1
7.9
22.0
18.6
58.6
51.0
78.3
2.6
3.9
3.5
6.0
21.1
19.3
54.3
48.8
78.3
1.3
2.7
3.4
3.7
11.2
15.1
17.5
30.1
37.3
44.6
52.1
57.4
68.8
73.9
75.4
No physical or mental health injuries or healthproblems while serving in the military after 9/11
Burns (severe)
Blind or severe visual loss
Amputation
Other severe mental injuries
Spinal cord injury
Severe hearing loss
Other severe physical injuries
Severe knee injuries or problems
Traumatic brain injury (TBI)
Tinnitus
Severe back, neck, or shoulder problems
Depression
Anxiety
PTSD (Post-traumatic stress disorder)
2013
2012
2011
Percent
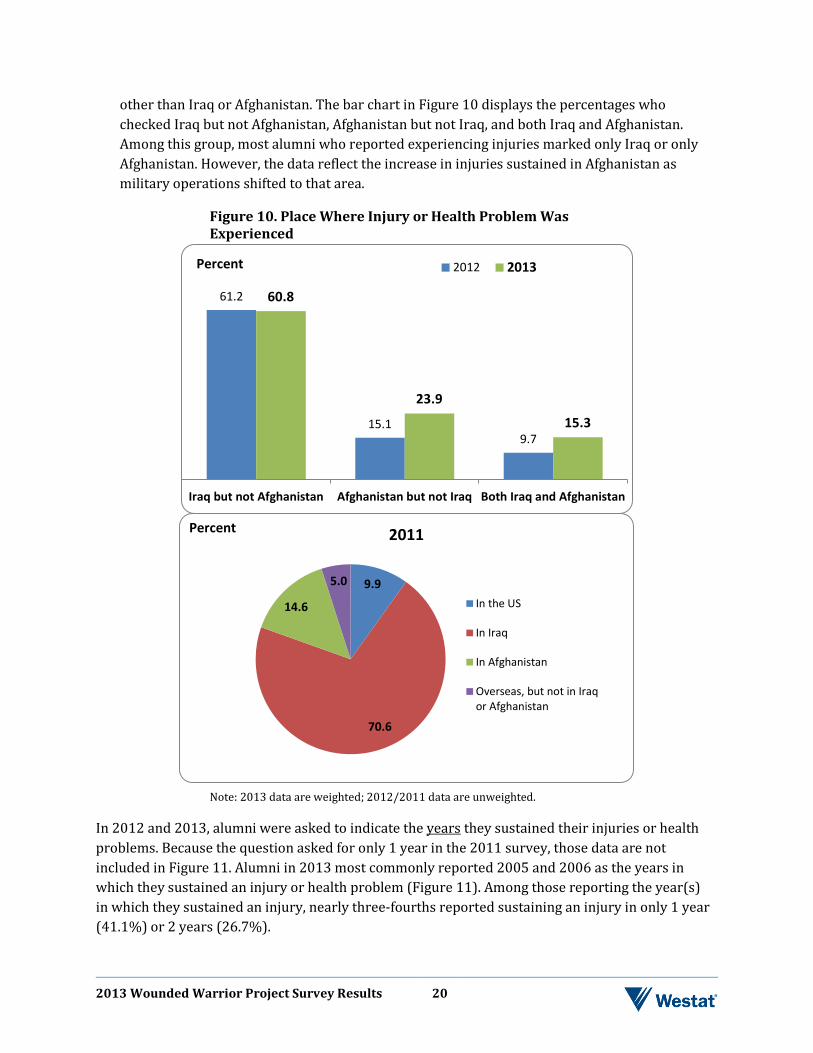
2013 Wounded Warrior Project Survey Results 20
other than Iraq or Afghanistan. The bar chart in Figure 10 displays the percentages who checked Iraq but not Afghanistan, Afghanistan but not Iraq, and both Iraq and Afghanistan. Among this group, most alumni who reported experiencing injuries marked only Iraq or only Afghanistan. However, the data reflect the increase in injuries sustained in Afghanistan as military operations shifted to that area.
Figure 10. Place Where Injury or Health Problem Was Experienced
Note: 2013 data are weighted; 2012/2011 data are unweighted.
In 2012 and 2013, alumni were asked to indicate the years they sustained their injuries or health problems. Because the question asked for only 1 year in the 2011 survey, those data are not included in Figure 11. Alumni in 2013 most commonly reported 2005 and 2006 as the years in which they sustained an injury or health problem (Figure 11). Among those reporting the year(s) in which they sustained an injury, nearly three-fourths reported sustaining an injury in only 1 year (41.1%) or 2 years (26.7%).
61.2
15.1 9.7
60.8
23.9
15.3
Iraq but not Afghanistan Afghanistan but not Iraq Both Iraq and Afghanistan
2012 2013Percent
9.9
70.6
14.6
5.0
2011
In the US
In Iraq
In Afghanistan
Overseas, but not in Iraqor Afghanistan
Percent
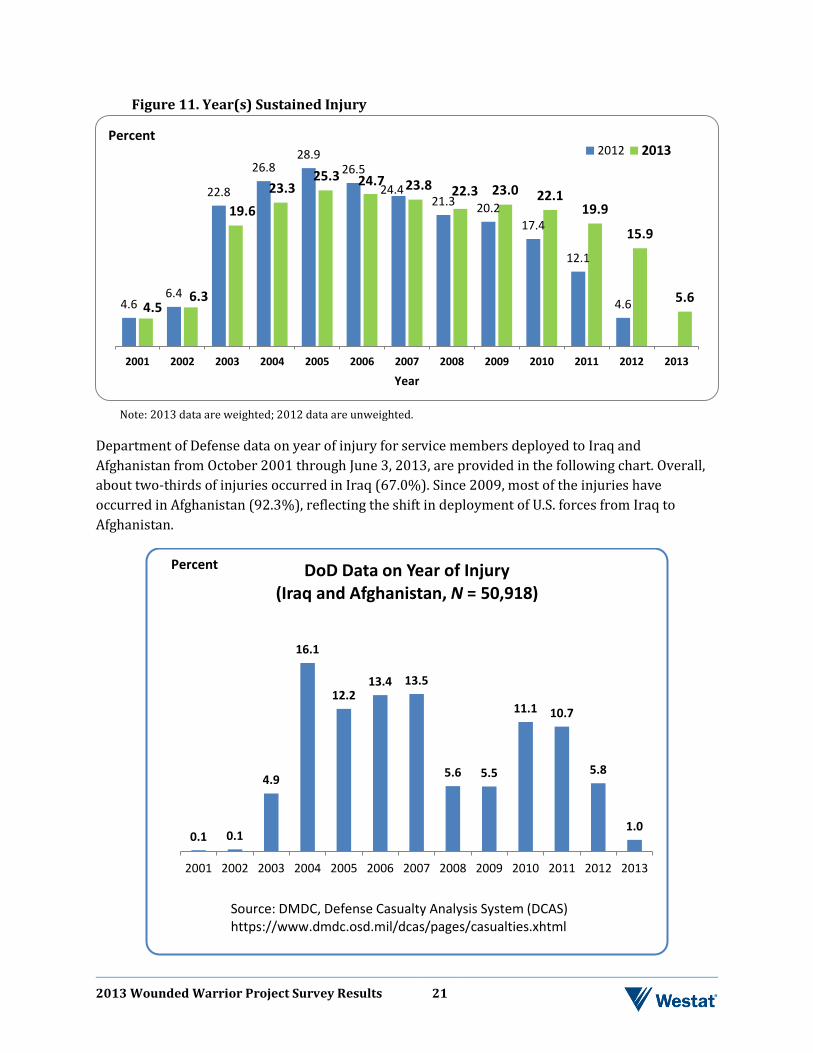
2013 Wounded Warrior Project Survey Results 21
Figure 11. Year(s) Sustained Injury
Note: 2013 data are weighted; 2012 data are unweighted.
Department of Defense data on year of injury for service members deployed to Iraq and Afghanistan from October 2001 through June 3, 2013, are provided in the following chart. Overall, about two-thirds of injuries occurred in Iraq (67.0%). Since 2009, most of the injuries have occurred in Afghanistan (92.3%), reflecting the shift in deployment of U.S. forces from Iraq to Afghanistan.
4.6 6.4
22.8
26.8 28.9
26.5 24.4
21.3 20.2 17.4
12.1
4.6 4.5 6.3
19.6 23.3
25.3 24.7 23.8 22.3 23.0 22.1 19.9
15.9
5.6
2001 2002 2003 2004 2005 2006 2007 2008 2009 2010 2011 2012 2013
Year
Percent 2012 2013
0.1 0.1
4.9
16.1
12.2 13.4 13.5
5.6 5.5
11.1 10.7
5.8
1.0
2001 2002 2003 2004 2005 2006 2007 2008 2009 2010 2011 2012 2013
DoD Data on Year of Injury (Iraq and Afghanistan, N = 50,918)
Source: DMDC, Defense Casualty Analysis System (DCAS) https://www.dmdc.osd.mil/dcas/pages/casualties.xhtml
Percent
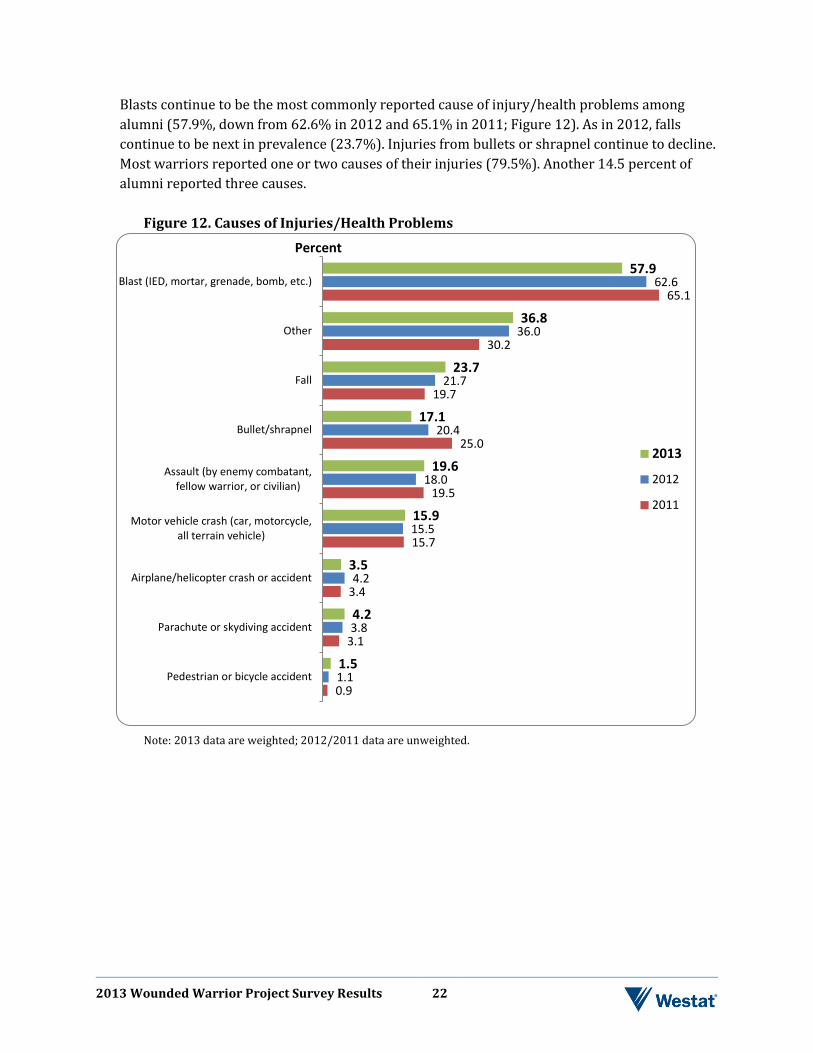
2013 Wounded Warrior Project Survey Results 22
Blasts continue to be the most commonly reported cause of injury/health problems among alumni (57.9%, down from 62.6% in 2012 and 65.1% in 2011; Figure 12). As in 2012, falls continue to be next in prevalence (23.7%). Injuries from bullets or shrapnel continue to decline. Most warriors reported one or two causes of their injuries (79.5%). Another 14.5 percent of alumni reported three causes.
Figure 12. Causes of Injuries/Health Problems
Note: 2013 data are weighted; 2012/2011 data are unweighted.
0.9
3.1
3.4
15.7
19.5
25.0
19.7
30.2
65.1
1.1
3.8
4.2
15.5
18.0
20.4
21.7
36.0
62.6
1.5
4.2
3.5
15.9
19.6
17.1
23.7
36.8
57.9
Pedestrian or bicycle accident
Parachute or skydiving accident
Airplane/helicopter crash or accident
Motor vehicle crash (car, motorcycle,all terrain vehicle)
Assault (by enemy combatant,fellow warrior, or civilian)
Bullet/shrapnel
Fall
Other
Blast (IED, mortar, grenade, bomb, etc.)
2013
2012
2011
Percent
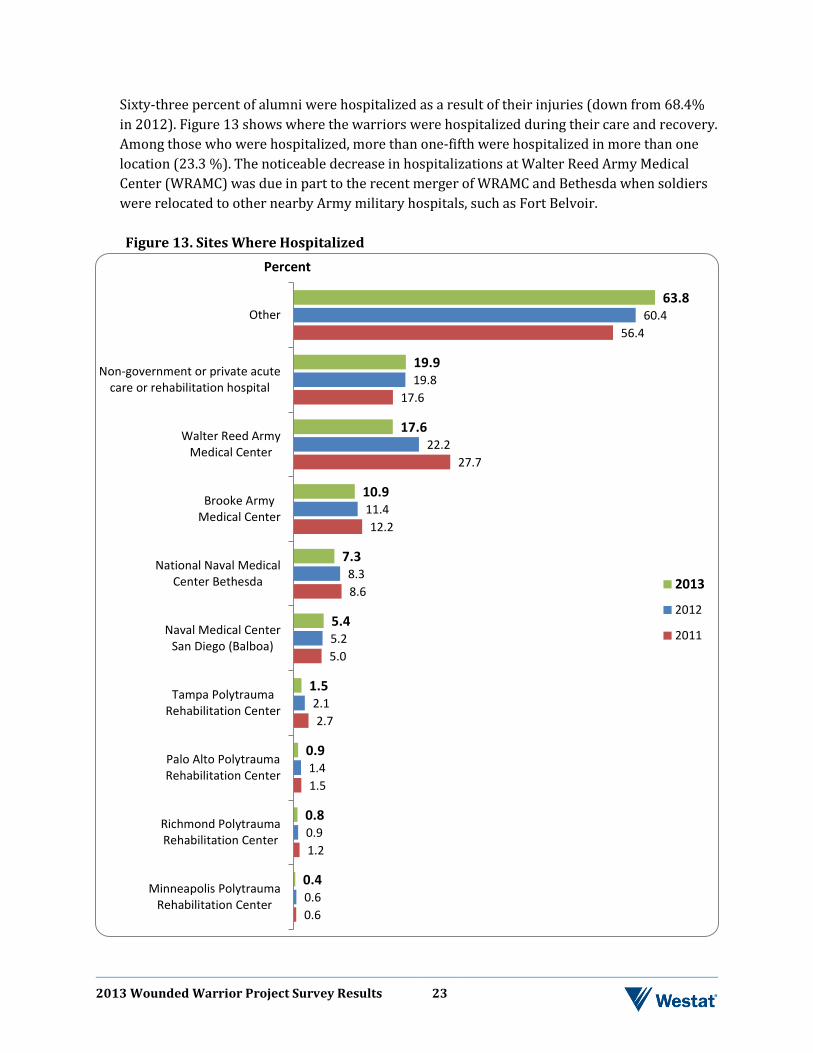
2013 Wounded Warrior Project Survey Results 23
Sixty-three percent of alumni were hospitalized as a result of their injuries (down from 68.4% in 2012). Figure 13 shows where the warriors were hospitalized during their care and recovery. Among those who were hospitalized, more than one-fifth were hospitalized in more than one location (23.3 %). The noticeable decrease in hospitalizations at Walter Reed Army Medical Center (WRAMC) was due in part to the recent merger of WRAMC and Bethesda when soldiers were relocated to other nearby Army military hospitals, such as Fort Belvoir. Figure 13. Sites Where Hospitalized
0.6
1.2
1.5
2.7
5.0
8.6
12.2
27.7
17.6
56.4
0.6
0.9
1.4
2.1
5.2
8.3
11.4
22.2
19.8
60.4
0.4
0.8
0.9
1.5
5.4
7.3
10.9
17.6
19.9
63.8
Minneapolis PolytraumaRehabilitation Center
Richmond PolytraumaRehabilitation Center
Palo Alto PolytraumaRehabilitation Center
Tampa PolytraumaRehabilitation Center
Naval Medical CenterSan Diego (Balboa)
National Naval MedicalCenter Bethesda
Brooke ArmyMedical Center
Walter Reed ArmyMedical Center
Non-government or private acutecare or rehabilitation hospital
Other
Percent
2013
2012
2011
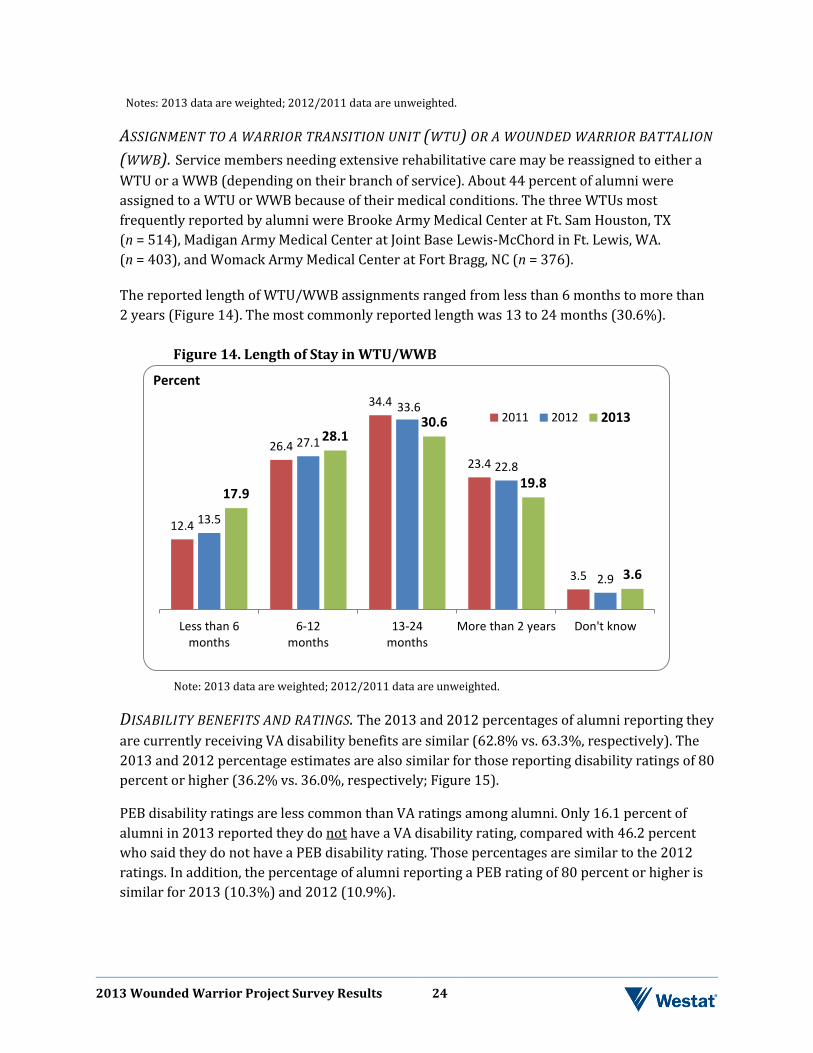
2013 Wounded Warrior Project Survey Results 24
Notes: 2013 data are weighted; 2012/2011 data are unweighted.
ASSIGNMENT TO A WARRIOR TRANSITION UNIT (WTU) OR A WOUNDED WARRIOR BATTALION
(WWB). Service members needing extensive rehabilitative care may be reassigned to either a WTU or a WWB (depending on their branch of service). About 44 percent of alumni were assigned to a WTU or WWB because of their medical conditions. The three WTUs most frequently reported by alumni were Brooke Army Medical Center at Ft. Sam Houston, TX (n = 514), Madigan Army Medical Center at Joint Base Lewis-McChord in Ft. Lewis, WA. (n = 403), and Womack Army Medical Center at Fort Bragg, NC (n = 376).
The reported length of WTU/WWB assignments ranged from less than 6 months to more than 2 years (Figure 14). The most commonly reported length was 13 to 24 months (30.6%).
Figure 14. Length of Stay in WTU/WWB
Note: 2013 data are weighted; 2012/2011 data are unweighted.
DISABILITY BENEFITS AND RATINGS. The 2013 and 2012 percentages of alumni reporting they are currently receiving VA disability benefits are similar (62.8% vs. 63.3%, respectively). The 2013 and 2012 percentage estimates are also similar for those reporting disability ratings of 80 percent or higher (36.2% vs. 36.0%, respectively; Figure 15).
PEB disability ratings are less common than VA ratings among alumni. Only 16.1 percent of alumni in 2013 reported they do not have a VA disability rating, compared with 46.2 percent who said they do not have a PEB disability rating. Those percentages are similar to the 2012 ratings. In addition, the percentage of alumni reporting a PEB rating of 80 percent or higher is similar for 2013 (10.3%) and 2012 (10.9%).
12.4
26.4
34.4
23.4
3.5
13.5
27.1
33.6
22.8
2.9
17.9
28.1 30.6
19.8
3.6
Less than 6months
6-12months
13-24months
More than 2 years Don't know
2011 2012 2013
Percent
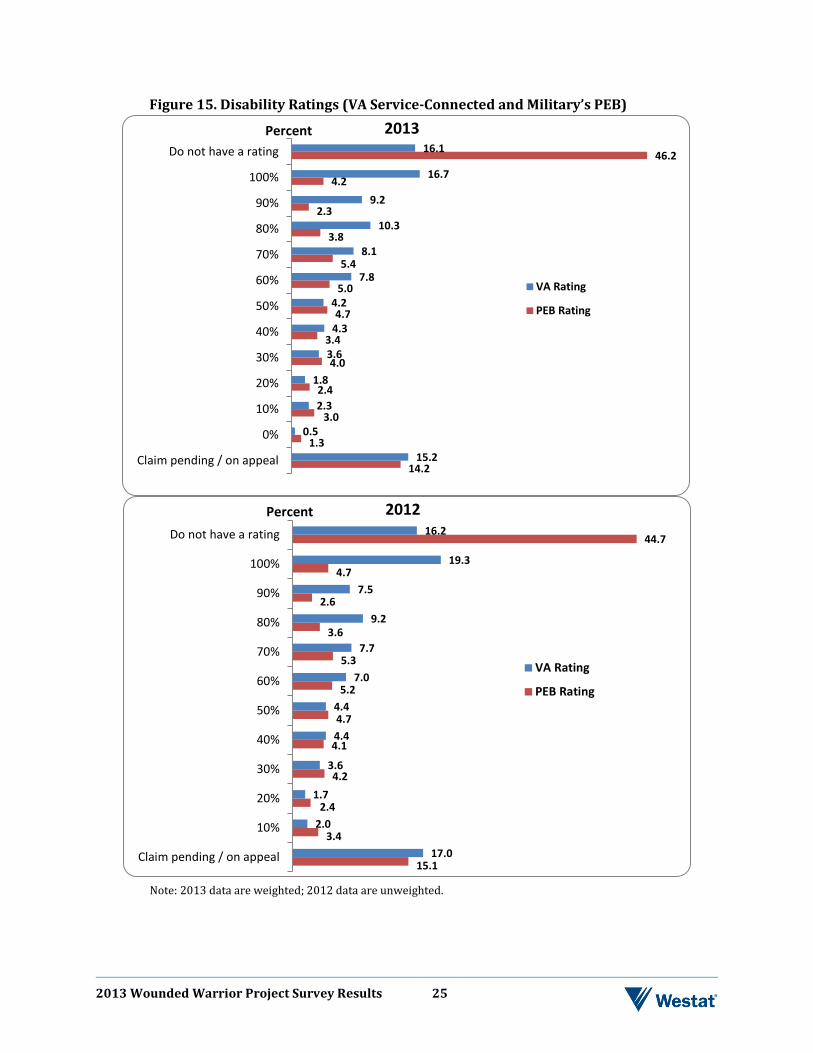
2013 Wounded Warrior Project Survey Results 25
Figure 15. Disability Ratings (VA Service-Connected and Military’s PEB)
Note: 2013 data are weighted; 2012 data are unweighted.
14.2
1.3
3.0
2.4
4.0
3.4
4.7
5.0
5.4
3.8
2.3
4.2
46.2
15.2
0.5
2.3
1.8
3.6
4.3
4.2
7.8
8.1
10.3
9.2
16.7
16.1
Claim pending / on appeal
0%
10%
20%
30%
40%
50%
60%
70%
80%
90%
100%
Do not have a rating
2013
VA Rating
PEB Rating
Percent
15.1
3.4
2.4
4.2
4.1
4.7
5.2
5.3
3.6
2.6
4.7
44.7
17.0
2.0
1.7
3.6
4.4
4.4
7.0
7.7
9.2
7.5
19.3
16.2
Claim pending / on appeal
10%
20%
30%
40%
50%
60%
70%
80%
90%
100%
Do not have a rating
2012
VA Rating
PEB Rating
Percent
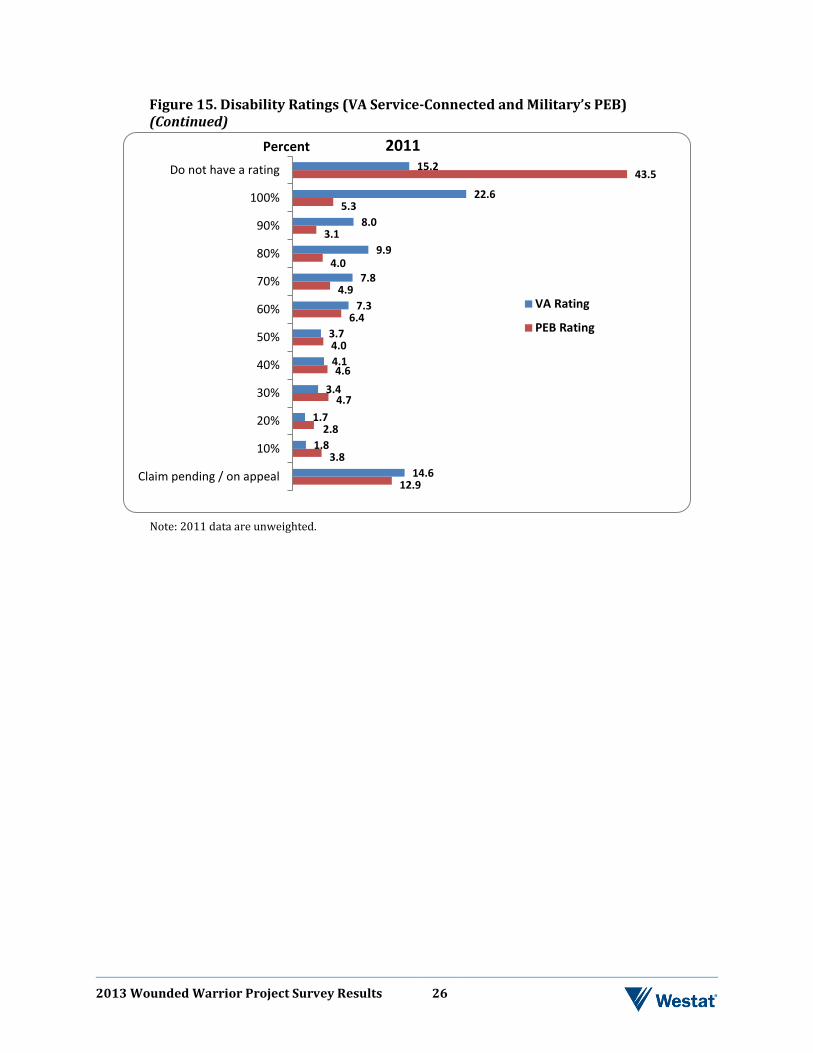
2013 Wounded Warrior Project Survey Results 26
Figure 15. Disability Ratings (VA Service-Connected and Military’s PEB) (Continued)
Note: 2011 data are unweighted.
12.9
3.8
2.8
4.7
4.6
4.0
6.4
4.9
4.0
3.1
5.3
43.5
14.6
1.8
1.7
3.4
4.1
3.7
7.3
7.8
9.9
8.0
22.6
15.2
Claim pending / on appeal
10%
20%
30%
40%
50%
60%
70%
80%
90%
100%
Do not have a rating
2011
VA Rating
PEB Rating
Percent
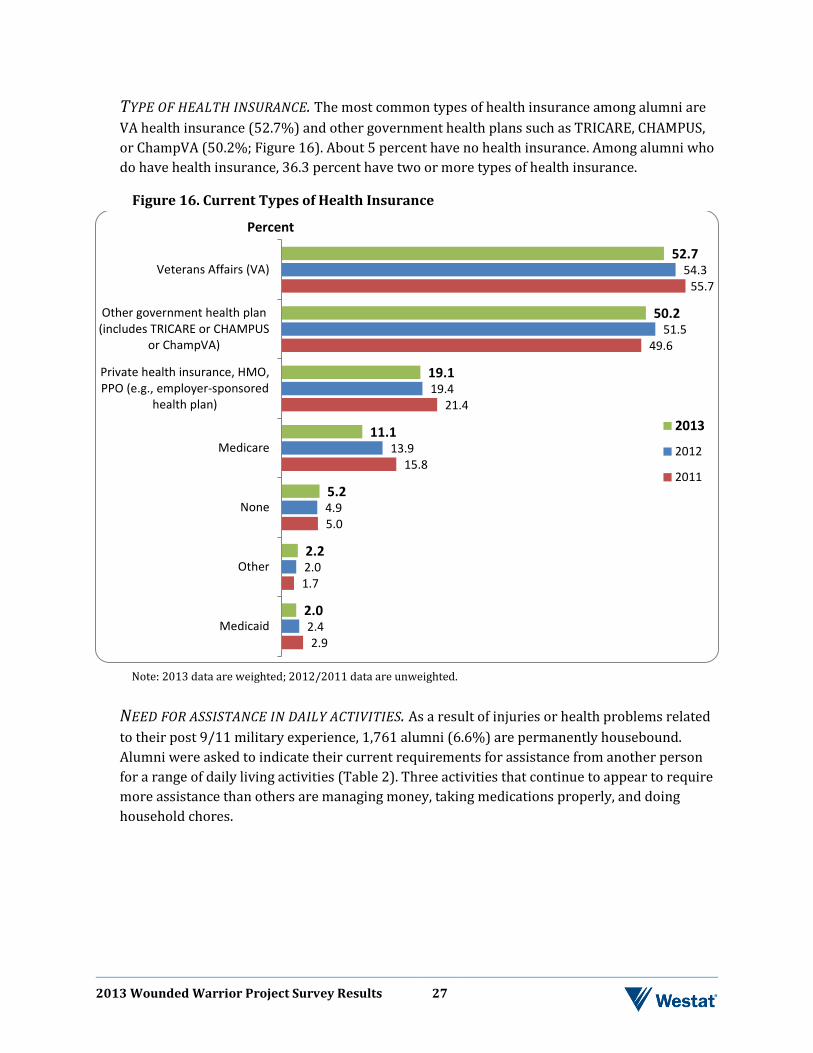
2013 Wounded Warrior Project Survey Results 27
TYPE OF HEALTH INSURANCE. The most common types of health insurance among alumni are VA health insurance (52.7%) and other government health plans such as TRICARE, CHAMPUS, or ChampVA (50.2%; Figure 16). About 5 percent have no health insurance. Among alumni who do have health insurance, 36.3 percent have two or more types of health insurance.
Figure 16. Current Types of Health Insurance
Note: 2013 data are weighted; 2012/2011 data are unweighted.
NEED FOR ASSISTANCE IN DAILY ACTIVITIES. As a result of injuries or health problems related to their post 9/11 military experience, 1,761 alumni (6.6%) are permanently housebound. Alumni were asked to indicate their current requirements for assistance from another person for a range of daily living activities (Table 2). Three activities that continue to appear to require more assistance than others are managing money, taking medications properly, and doing household chores.
2.9
1.7
5.0
15.8
21.4
49.6
55.7
2.4
2.0
4.9
13.9
19.4
51.5
54.3
2.0
2.2
5.2
11.1
19.1
50.2
52.7
Medicaid
Other
None
Medicare
Private health insurance, HMO,PPO (e.g., employer-sponsored
health plan)
Other government health plan(includes TRICARE or CHAMPUS
or ChampVA)
Veterans Affairs (VA)
Percent
2013
2012
2011
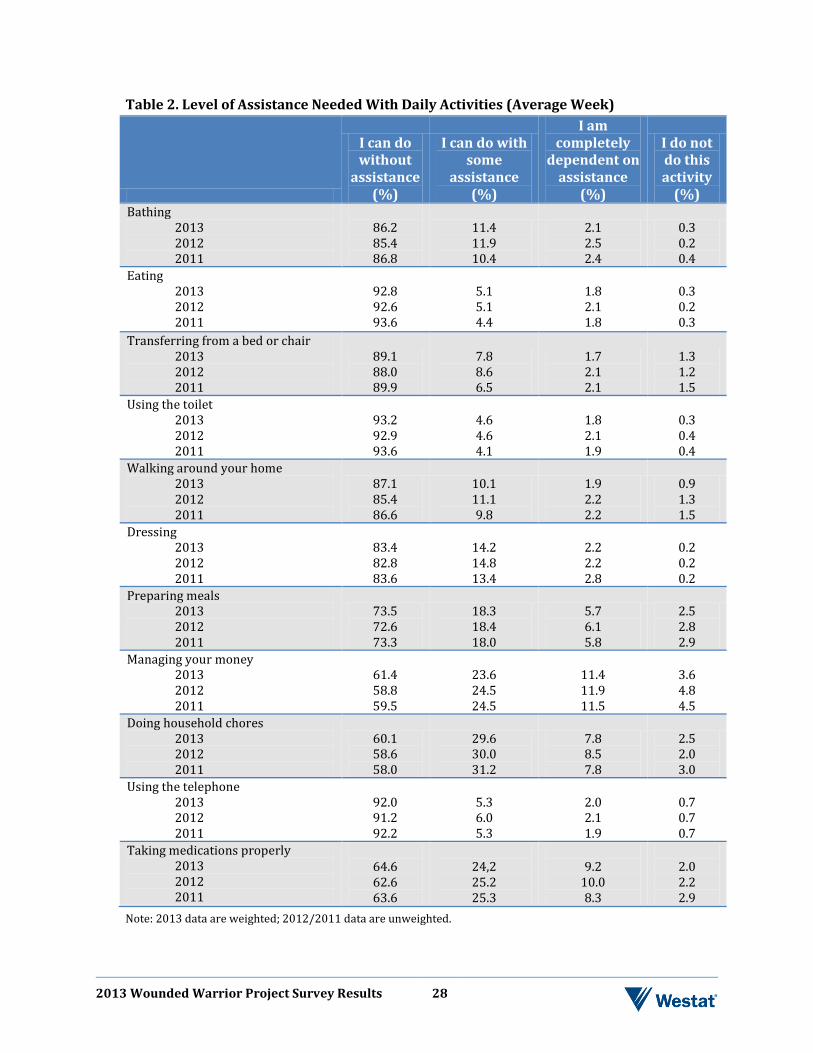
2013 Wounded Warrior Project Survey Results 28
Table 2. Level of Assistance Needed With Daily Activities (Average Week)
I can do without
assistance (%)
I can do with some
assistance (%)
I am completely
dependent on assistance
(%)
I do not do this activity
(%) Bathing 2013 2012 2011
86.2 85.4 86.8
11.4 11.9 10.4
2.1 2.5 2.4
0.3 0.2 0.4
Eating 2013 2012 2011
92.8 92.6 93.6
5.1 5.1 4.4
1.8 2.1 1.8
0.3 0.2 0.3
Transferring from a bed or chair 2013 2012 2011
89.1 88.0 89.9
7.8 8.6 6.5
1.7 2.1 2.1
1.3 1.2 1.5
Using the toilet 2013 2012 2011
93.2 92.9 93.6
4.6 4.6 4.1
1.8 2.1 1.9
0.3 0.4 0.4
Walking around your home 2013 2012 2011
87.1 85.4 86.6
10.1 11.1 9.8
1.9 2.2 2.2
0.9 1.3 1.5
Dressing 2013 2012 2011
83.4 82.8 83.6
14.2 14.8 13.4
2.2 2.2 2.8
0.2 0.2 0.2
Preparing meals 2013 2012 2011
73.5 72.6 73.3
18.3 18.4 18.0
5.7 6.1 5.8
2.5 2.8 2.9
Managing your money 2013 2012 2011
61.4 58.8 59.5
23.6 24.5 24.5
11.4 11.9 11.5
3.6 4.8 4.5
Doing household chores 2013 2012 2011
60.1 58.6 58.0
29.6 30.0 31.2
7.8 8.5 7.8
2.5 2.0 3.0
Using the telephone 2013 2012 2011
92.0 91.2 92.2
5.3 6.0 5.3
2.0 2.1 1.9
0.7 0.7 0.7
Taking medications properly 2013 2012 2011
64.6 62.6 63.6
24,2 25.2 25.3
9.2
10.0 8.3
2.0 2.2 2.9
Note: 2013 data are weighted; 2012/2011 data are unweighted.
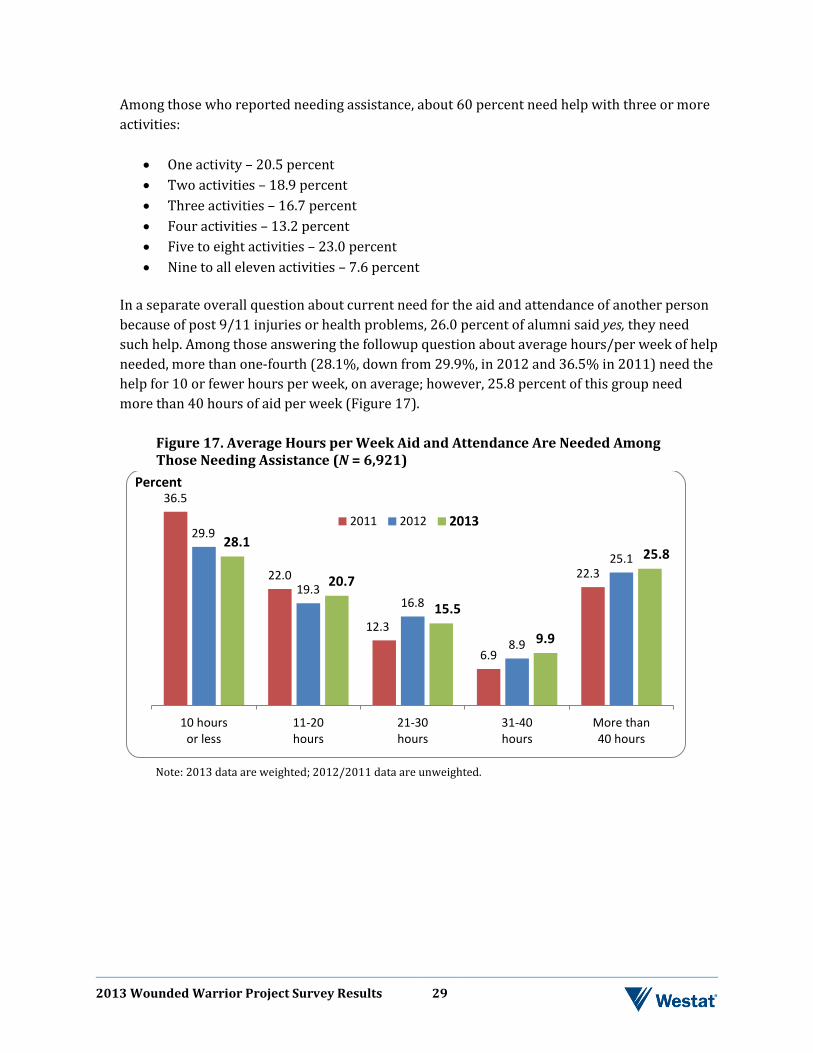
2013 Wounded Warrior Project Survey Results 29
Among those who reported needing assistance, about 60 percent need help with three or more activities:
• One activity – 20.5 percent • Two activities – 18.9 percent • Three activities – 16.7 percent • Four activities – 13.2 percent • Five to eight activities – 23.0 percent • Nine to all eleven activities – 7.6 percent
In a separate overall question about current need for the aid and attendance of another person because of post 9/11 injuries or health problems, 26.0 percent of alumni said yes, they need such help. Among those answering the followup question about average hours/per week of help needed, more than one-fourth (28.1%, down from 29.9%, in 2012 and 36.5% in 2011) need the help for 10 or fewer hours per week, on average; however, 25.8 percent of this group need more than 40 hours of aid per week (Figure 17).
Figure 17. Average Hours per Week Aid and Attendance Are Needed Among Those Needing Assistance (N = 6,921)
Note: 2013 data are weighted; 2012/2011 data are unweighted.
36.5
22.0
12.3
6.9
22.3
29.9
19.3 16.8
8.9
25.1 28.1
20.7
15.5
9.9
25.8
10 hoursor less
11-20hours
21-30hours
31-40hours
More than40 hours
Percent
2011 2012 2013
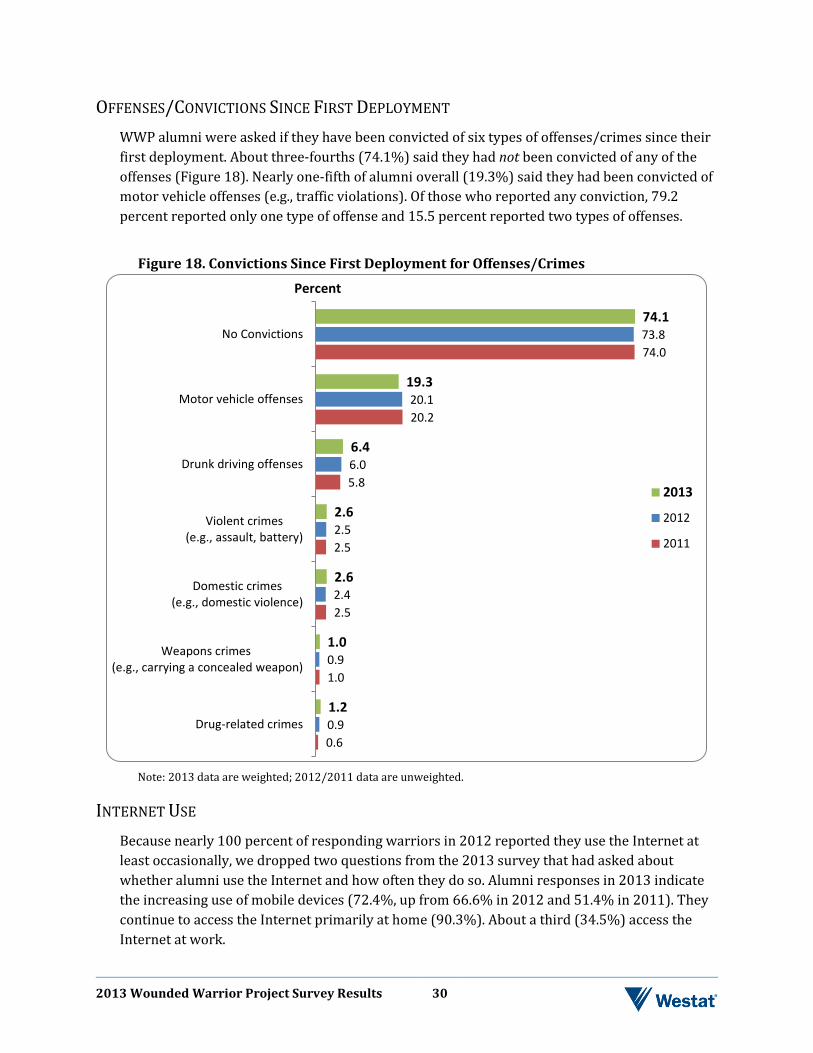
2013 Wounded Warrior Project Survey Results 30
OFFENSES/CONVICTIONS SINCE FIRST DEPLOYMENT WWP alumni were asked if they have been convicted of six types of offenses/crimes since their first deployment. About three-fourths (74.1%) said they had not been convicted of any of the offenses (Figure 18). Nearly one-fifth of alumni overall (19.3%) said they had been convicted of motor vehicle offenses (e.g., traffic violations). Of those who reported any conviction, 79.2 percent reported only one type of offense and 15.5 percent reported two types of offenses.
Figure 18. Convictions Since First Deployment for Offenses/Crimes
Note: 2013 data are weighted; 2012/2011 data are unweighted.
INTERNET USE Because nearly 100 percent of responding warriors in 2012 reported they use the Internet at least occasionally, we dropped two questions from the 2013 survey that had asked about whether alumni use the Internet and how often they do so. Alumni responses in 2013 indicate the increasing use of mobile devices (72.4%, up from 66.6% in 2012 and 51.4% in 2011). They continue to access the Internet primarily at home (90.3%). About a third (34.5%) access the Internet at work.
0.6
1.0
2.5
2.5
5.8
20.2
74.0
0.9
0.9
2.4
2.5
6.0
20.1
73.8
1.2
1.0
2.6
2.6
6.4
19.3
74.1
Drug-related crimes
Weapons crimes (e.g., carrying a concealed weapon)
Domestic crimes(e.g., domestic violence)
Violent crimes(e.g., assault, battery)
Drunk driving offenses
Motor vehicle offenses
No Convictions
2013
2012
2011
Percent
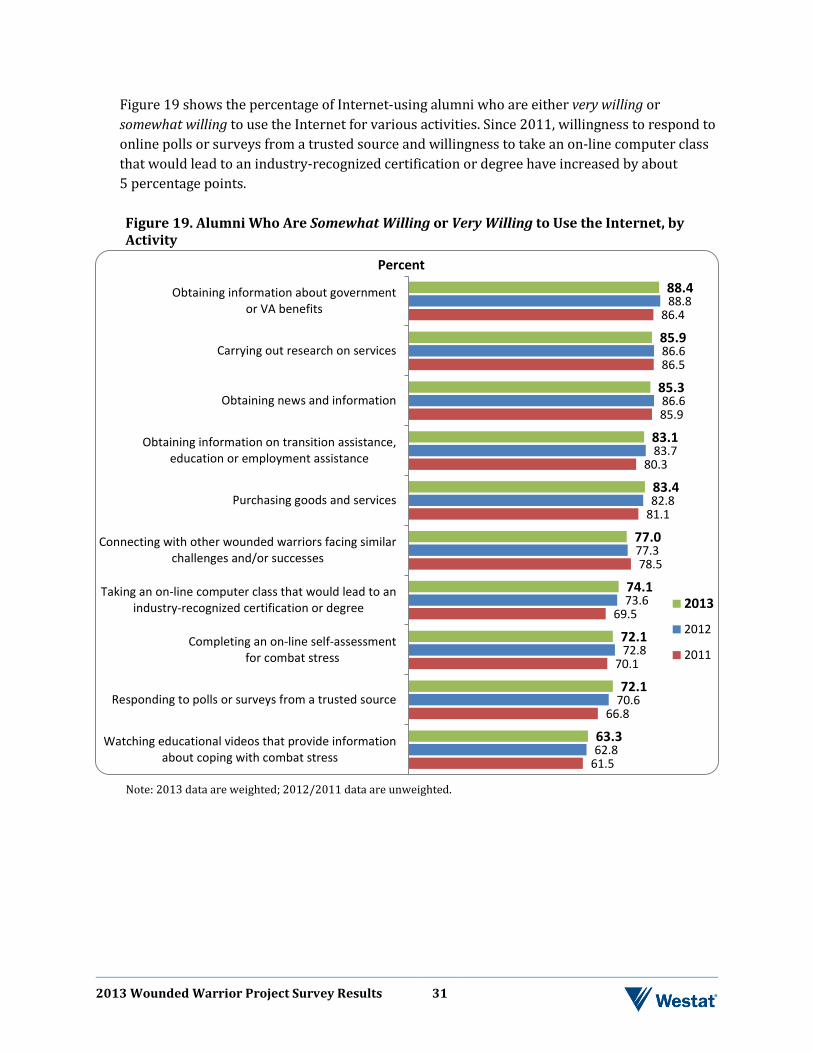
2013 Wounded Warrior Project Survey Results 31
Figure 19 shows the percentage of Internet-using alumni who are either very willing or somewhat willing to use the Internet for various activities. Since 2011, willingness to respond to online polls or surveys from a trusted source and willingness to take an on-line computer class that would lead to an industry-recognized certification or degree have increased by about 5 percentage points. Figure 19. Alumni Who Are Somewhat Willing or Very Willing to Use the Internet, by Activity
Note: 2013 data are weighted; 2012/2011 data are unweighted.
61.5
66.8
70.1
69.5
78.5
81.1
80.3
85.9
86.5
86.4
62.8
70.6
72.8
73.6
77.3
82.8
83.7
86.6
86.6
88.8
63.3
72.1
72.1
74.1
77.0
83.4
83.1
85.3
85.9
88.4
Watching educational videos that provide informationabout coping with combat stress
Responding to polls or surveys from a trusted source
Completing an on-line self-assessmentfor combat stress
Taking an on-line computer class that would lead to anindustry-recognized certification or degree
Connecting with other wounded warriors facing similarchallenges and/or successes
Purchasing goods and services
Obtaining information on transition assistance,education or employment assistance
Obtaining news and information
Carrying out research on services
Obtaining information about governmentor VA benefits
2013
2012
2011
Percent
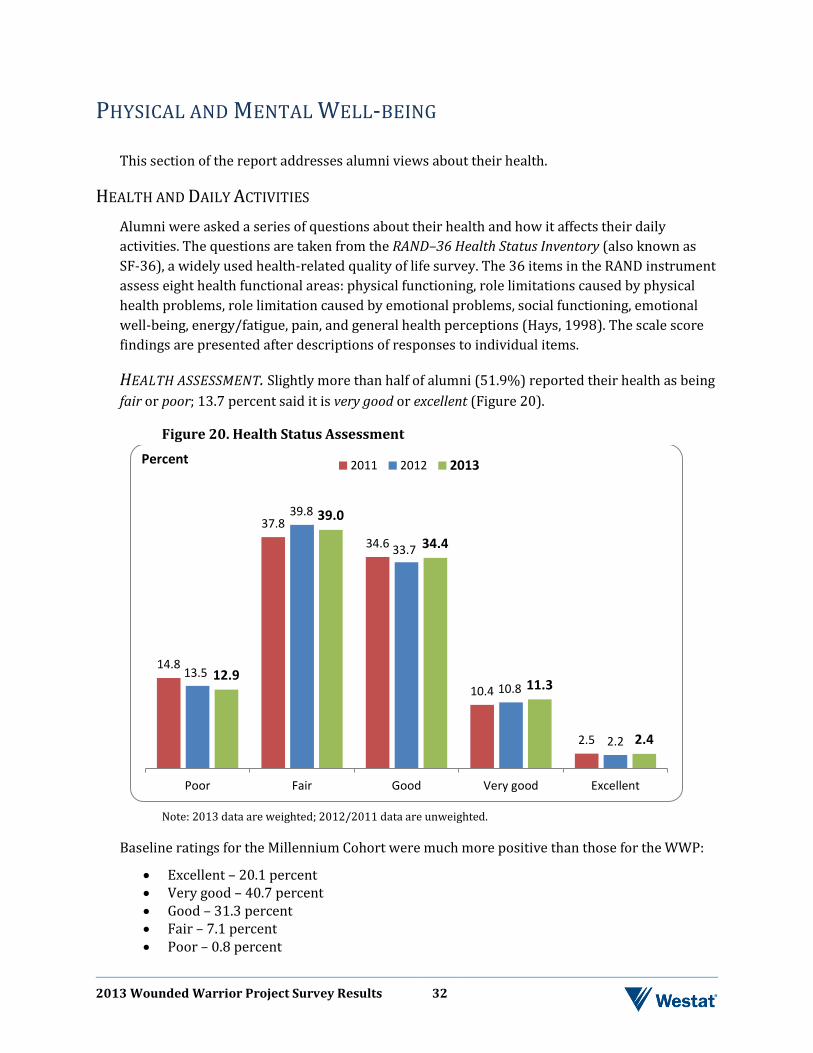
2013 Wounded Warrior Project Survey Results 32
PHYSICAL AND MENTAL WELL-BEING
This section of the report addresses alumni views about their health.
HEALTH AND DAILY ACTIVITIES Alumni were asked a series of questions about their health and how it affects their daily activities. The questions are taken from the RAND–36 Health Status Inventory (also known as SF-36), a widely used health-related quality of life survey. The 36 items in the RAND instrument assess eight health functional areas: physical functioning, role limitations caused by physical health problems, role limitation caused by emotional problems, social functioning, emotional well-being, energy/fatigue, pain, and general health perceptions (Hays, 1998). The scale score findings are presented after descriptions of responses to individual items.
HEALTH ASSESSMENT. Slightly more than half of alumni (51.9%) reported their health as being fair or poor; 13.7 percent said it is very good or excellent (Figure 20).
Figure 20. Health Status Assessment
Note: 2013 data are weighted; 2012/2011 data are unweighted.
Baseline ratings for the Millennium Cohort were much more positive than those for the WWP:
• Excellent – 20.1 percent • Very good – 40.7 percent • Good – 31.3 percent • Fair – 7.1 percent • Poor – 0.8 percent
14.8
37.8 34.6
10.4
2.5
13.5
39.8
33.7
10.8
2.2
12.9
39.0
34.4
11.3
2.4
Poor Fair Good Very good Excellent
2011 2012 2013Percent
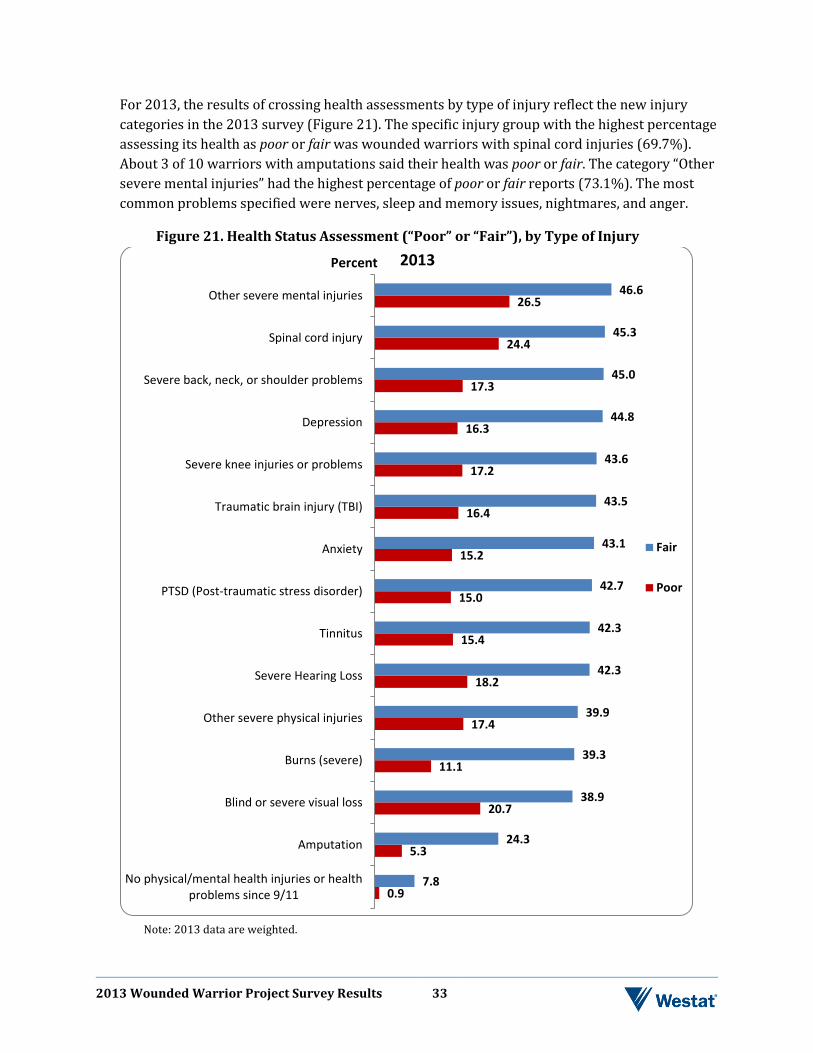
2013 Wounded Warrior Project Survey Results 33
For 2013, the results of crossing health assessments by type of injury reflect the new injury categories in the 2013 survey (Figure 21). The specific injury group with the highest percentage assessing its health as poor or fair was wounded warriors with spinal cord injuries (69.7%). About 3 of 10 warriors with amputations said their health was poor or fair. The category “Other severe mental injuries” had the highest percentage of poor or fair reports (73.1%). The most common problems specified were nerves, sleep and memory issues, nightmares, and anger.
Figure 21. Health Status Assessment (“Poor” or “Fair”), by Type of Injury
Note: 2013 data are weighted.
0.9
5.3
20.7
11.1
17.4
18.2
15.4
15.0
15.2
16.4
17.2
16.3
17.3
24.4
26.5
7.8
24.3
38.9
39.3
39.9
42.3
42.3
42.7
43.1
43.5
43.6
44.8
45.0
45.3
46.6
No physical/mental health injuries or healthproblems since 9/11
Amputation
Blind or severe visual loss
Burns (severe)
Other severe physical injuries
Severe Hearing Loss
Tinnitus
PTSD (Post-traumatic stress disorder)
Anxiety
Traumatic brain injury (TBI)
Severe knee injuries or problems
Depression
Severe back, neck, or shoulder problems
Spinal cord injury
Other severe mental injuries
2013
Fair
Poor
Percent
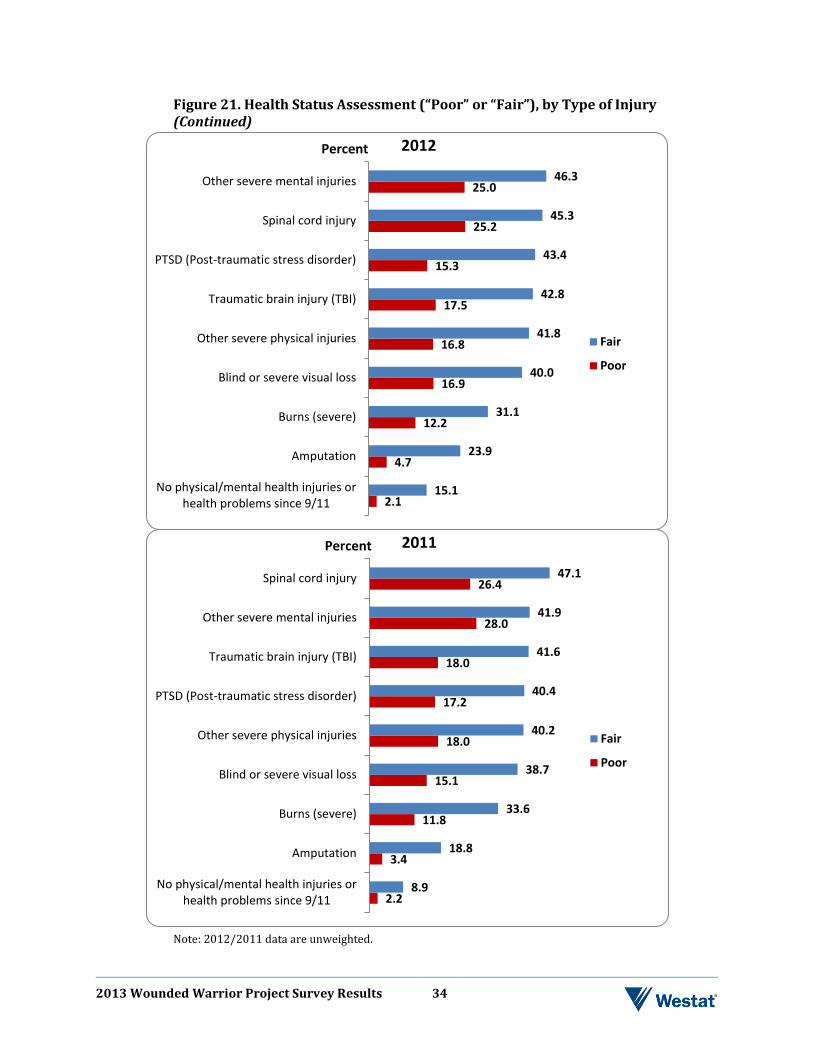
2013 Wounded Warrior Project Survey Results 34
Figure 21. Health Status Assessment (“Poor” or “Fair”), by Type of Injury (Continued)
Note: 2012/2011 data are unweighted.
2.1
4.7
12.2
16.9
16.8
17.5
15.3
25.2
25.0
15.1
23.9
31.1
40.0
41.8
42.8
43.4
45.3
46.3
No physical/mental health injuries orhealth problems since 9/11
Amputation
Burns (severe)
Blind or severe visual loss
Other severe physical injuries
Traumatic brain injury (TBI)
PTSD (Post-traumatic stress disorder)
Spinal cord injury
Other severe mental injuries
2012
Fair
Poor
Percent
2.2
3.4
11.8
15.1
18.0
17.2
18.0
28.0
26.4
8.9
18.8
33.6
38.7
40.2
40.4
41.6
41.9
47.1
No physical/mental health injuries orhealth problems since 9/11
Amputation
Burns (severe)
Blind or severe visual loss
Other severe physical injuries
PTSD (Post-traumatic stress disorder)
Traumatic brain injury (TBI)
Other severe mental injuries
Spinal cord injury
2011
Fair
Poor
Percent
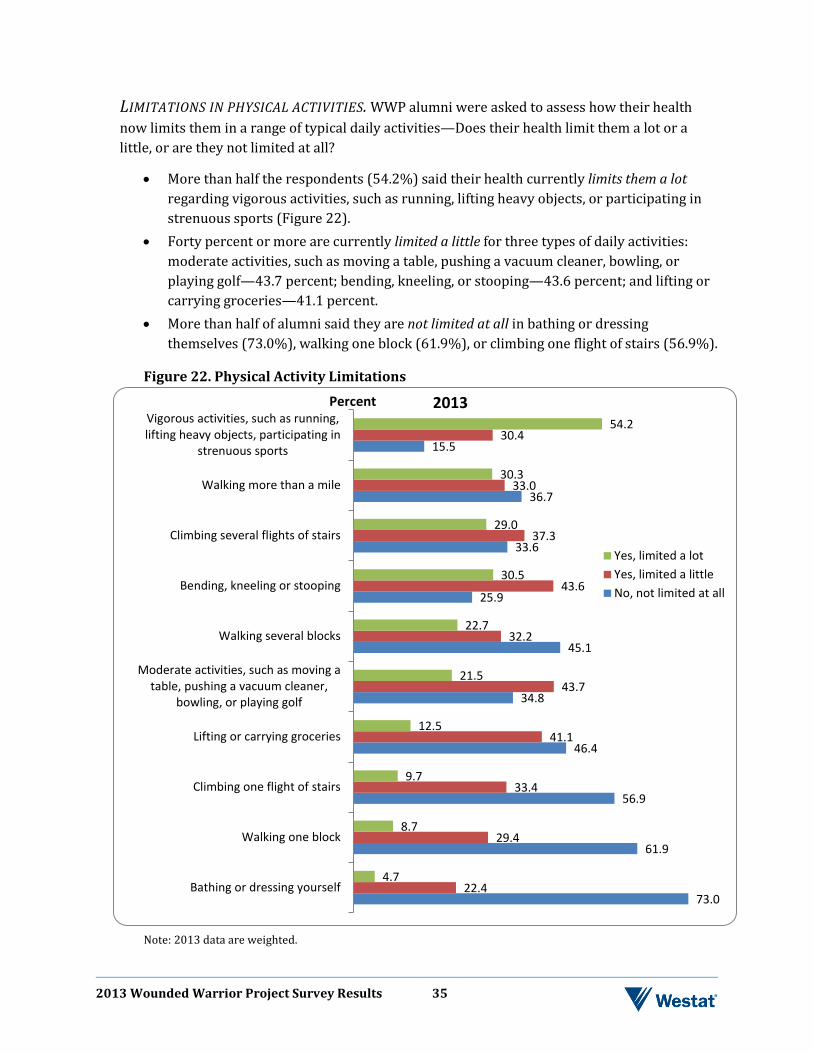
2013 Wounded Warrior Project Survey Results 35
LIMITATIONS IN PHYSICAL ACTIVITIES. WWP alumni were asked to assess how their health now limits them in a range of typical daily activities—Does their health limit them a lot or a little, or are they not limited at all?
• More than half the respondents (54.2%) said their health currently limits them a lot regarding vigorous activities, such as running, lifting heavy objects, or participating in strenuous sports (Figure 22).
• Forty percent or more are currently limited a little for three types of daily activities: moderate activities, such as moving a table, pushing a vacuum cleaner, bowling, or playing golf—43.7 percent; bending, kneeling, or stooping—43.6 percent; and lifting or carrying groceries—41.1 percent.
• More than half of alumni said they are not limited at all in bathing or dressing themselves (73.0%), walking one block (61.9%), or climbing one flight of stairs (56.9%).
Figure 22. Physical Activity Limitations
Note: 2013 data are weighted.
73.0
61.9
56.9
46.4
34.8
45.1
25.9
33.6
36.7
15.5
22.4
29.4
33.4
41.1
43.7
32.2
43.6
37.3
33.0
30.4
4.7
8.7
9.7
12.5
21.5
22.7
30.5
29.0
30.3
54.2
Bathing or dressing yourself
Walking one block
Climbing one flight of stairs
Lifting or carrying groceries
Moderate activities, such as moving atable, pushing a vacuum cleaner,
bowling, or playing golf
Walking several blocks
Bending, kneeling or stooping
Climbing several flights of stairs
Walking more than a mile
Vigorous activities, such as running,lifting heavy objects, participating in
strenuous sports
2013
Yes, limited a lotYes, limited a littleNo, not limited at all
Percent
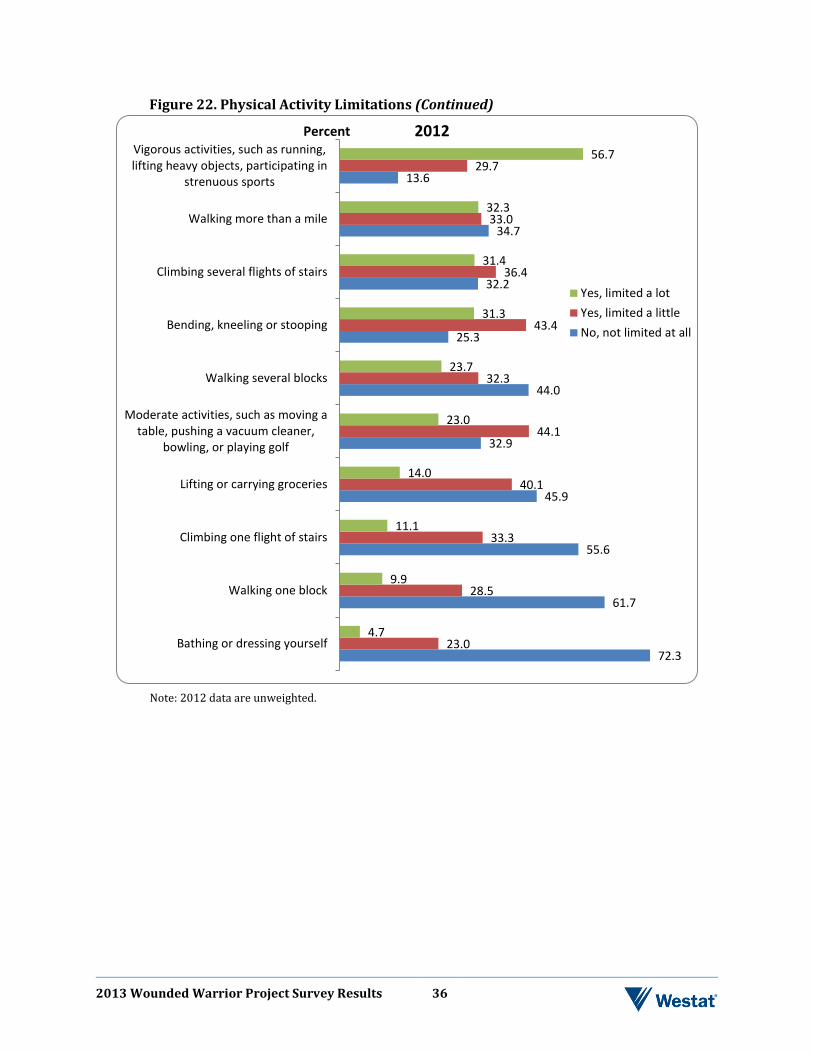
2013 Wounded Warrior Project Survey Results 36
Figure 22. Physical Activity Limitations (Continued)
Note: 2012 data are unweighted.
72.3
61.7
55.6
45.9
32.9
44.0
25.3
32.2
34.7
13.6
23.0
28.5
33.3
40.1
44.1
32.3
43.4
36.4
33.0
29.7
4.7
9.9
11.1
14.0
23.0
23.7
31.3
31.4
32.3
56.7
Bathing or dressing yourself
Walking one block
Climbing one flight of stairs
Lifting or carrying groceries
Moderate activities, such as moving atable, pushing a vacuum cleaner,
bowling, or playing golf
Walking several blocks
Bending, kneeling or stooping
Climbing several flights of stairs
Walking more than a mile
Vigorous activities, such as running,lifting heavy objects, participating in
strenuous sports
2012
Yes, limited a lotYes, limited a littleNo, not limited at all
Percent
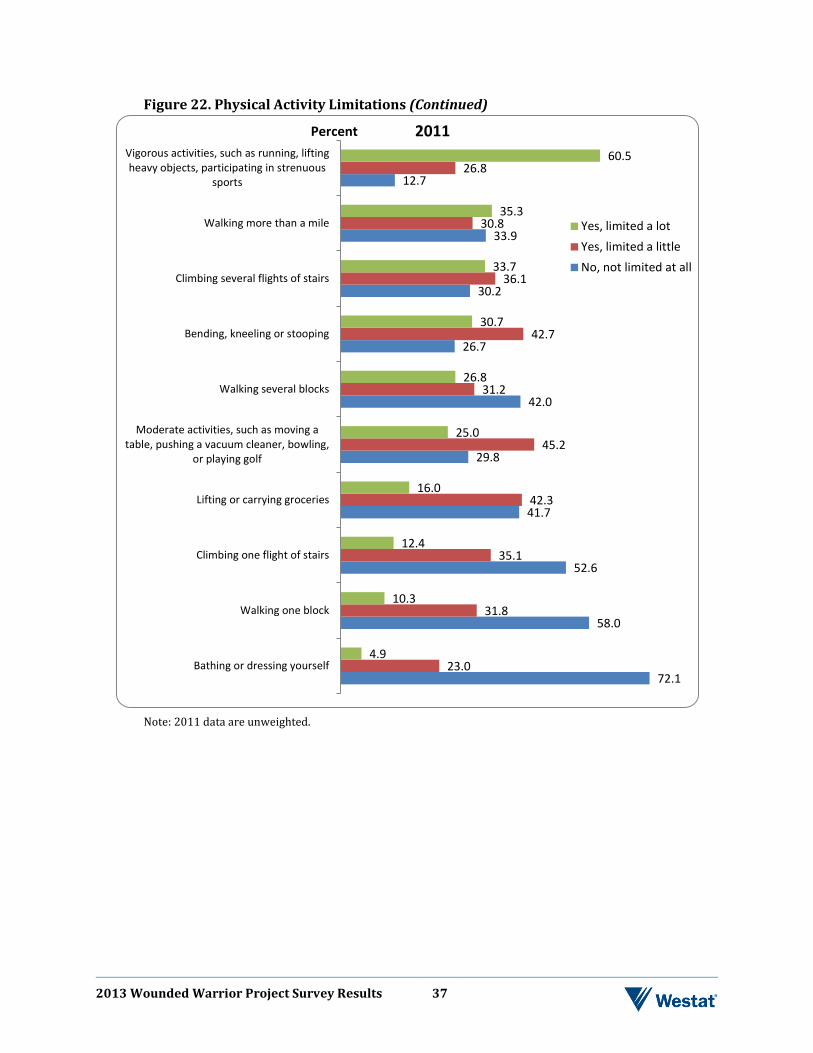
2013 Wounded Warrior Project Survey Results 37
Figure 22. Physical Activity Limitations (Continued)
Note: 2011 data are unweighted.
72.1
58.0
52.6
41.7
29.8
42.0
26.7
30.2
33.9
12.7
23.0
31.8
35.1
42.3
45.2
31.2
42.7
36.1
30.8
26.8
4.9
10.3
12.4
16.0
25.0
26.8
30.7
33.7
35.3
60.5
Bathing or dressing yourself
Walking one block
Climbing one flight of stairs
Lifting or carrying groceries
Moderate activities, such as moving atable, pushing a vacuum cleaner, bowling,
or playing golf
Walking several blocks
Bending, kneeling or stooping
Climbing several flights of stairs
Walking more than a mile
Vigorous activities, such as running, liftingheavy objects, participating in strenuous
sports
2011
Yes, limited a lotYes, limited a littleNo, not limited at all
Percent
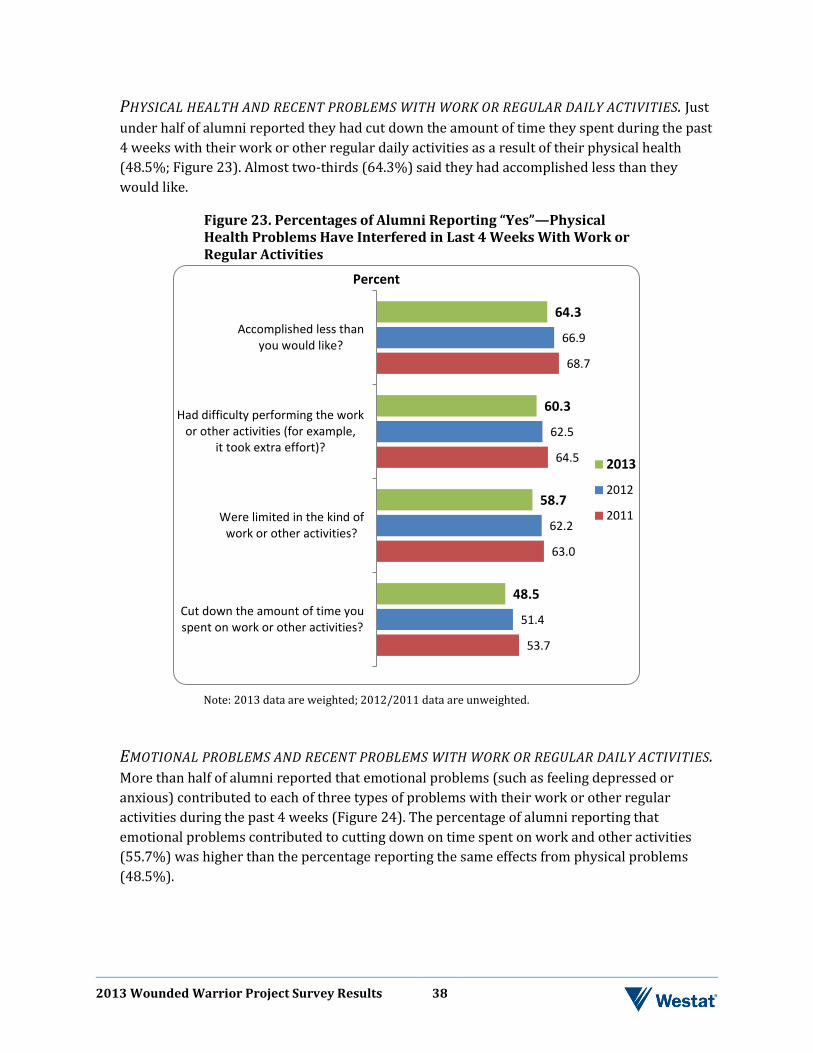
2013 Wounded Warrior Project Survey Results 38
PHYSICAL HEALTH AND RECENT PROBLEMS WITH WORK OR REGULAR DAILY ACTIVITIES. Just under half of alumni reported they had cut down the amount of time they spent during the past 4 weeks with their work or other regular daily activities as a result of their physical health (48.5%; Figure 23). Almost two-thirds (64.3%) said they had accomplished less than they would like.
Figure 23. Percentages of Alumni Reporting “Yes”—Physical Health Problems Have Interfered in Last 4 Weeks With Work or Regular Activities
Note: 2013 data are weighted; 2012/2011 data are unweighted.
EMOTIONAL PROBLEMS AND RECENT PROBLEMS WITH WORK OR REGULAR DAILY ACTIVITIES. More than half of alumni reported that emotional problems (such as feeling depressed or anxious) contributed to each of three types of problems with their work or other regular activities during the past 4 weeks (Figure 24). The percentage of alumni reporting that emotional problems contributed to cutting down on time spent on work and other activities (55.7%) was higher than the percentage reporting the same effects from physical problems (48.5%).
53.7
63.0
64.5
68.7
51.4
62.2
62.5
66.9
48.5
58.7
60.3
64.3
Cut down the amount of time youspent on work or other activities?
Were limited in the kind ofwork or other activities?
Had difficulty performing the workor other activities (for example,
it took extra effort)?
Accomplished less thanyou would like?
2013
2012
2011
Percent
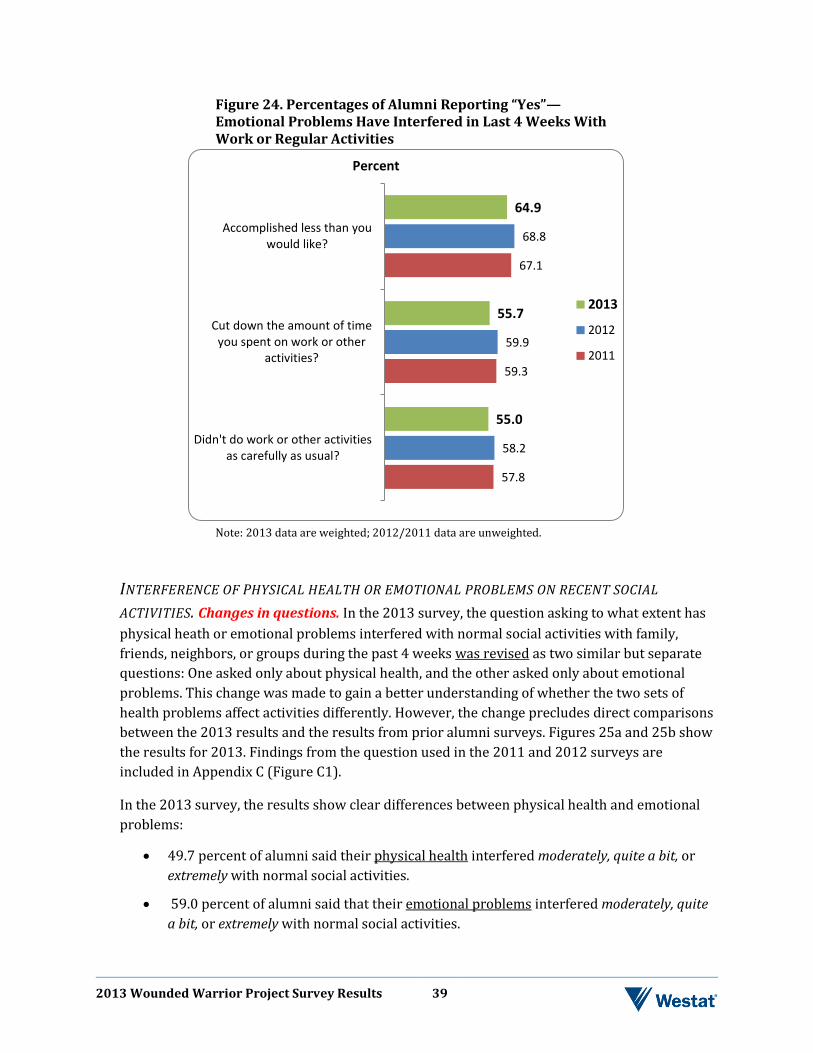
2013 Wounded Warrior Project Survey Results 39
Figure 24. Percentages of Alumni Reporting “Yes”— Emotional Problems Have Interfered in Last 4 Weeks With Work or Regular Activities
Note: 2013 data are weighted; 2012/2011 data are unweighted.
INTERFERENCE OF PHYSICAL HEALTH OR EMOTIONAL PROBLEMS ON RECENT SOCIAL
ACTIVITIES. Changes in questions. In the 2013 survey, the question asking to what extent has physical heath or emotional problems interfered with normal social activities with family, friends, neighbors, or groups during the past 4 weeks was revised as two similar but separate questions: One asked only about physical health, and the other asked only about emotional problems. This change was made to gain a better understanding of whether the two sets of health problems affect activities differently. However, the change precludes direct comparisons between the 2013 results and the results from prior alumni surveys. Figures 25a and 25b show the results for 2013. Findings from the question used in the 2011 and 2012 surveys are included in Appendix C (Figure C1).
In the 2013 survey, the results show clear differences between physical health and emotional problems:
• 49.7 percent of alumni said their physical health interfered moderately, quite a bit, or extremely with normal social activities.
• 59.0 percent of alumni said that their emotional problems interfered moderately, quite a bit, or extremely with normal social activities.
57.8
59.3
67.1
58.2
59.9
68.8
55.0
55.7
64.9
Didn't do work or other activitiesas carefully as usual?
Cut down the amount of timeyou spent on work or other
activities?
Accomplished less than youwould like?
2013
2012
2011
Percent
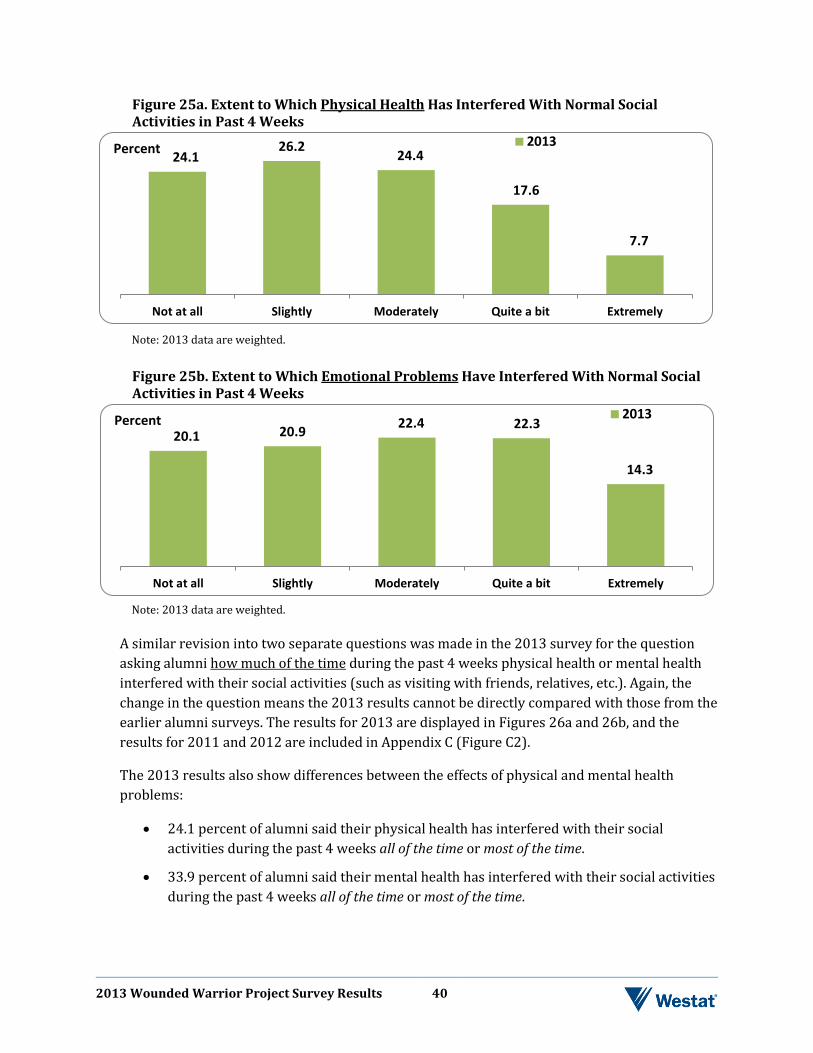
2013 Wounded Warrior Project Survey Results 40
Figure 25a. Extent to Which Physical Health Has Interfered With Normal Social Activities in Past 4 Weeks
Note: 2013 data are weighted.
Figure 25b. Extent to Which Emotional Problems Have Interfered With Normal Social Activities in Past 4 Weeks
Note: 2013 data are weighted.
A similar revision into two separate questions was made in the 2013 survey for the question asking alumni how much of the time during the past 4 weeks physical health or mental health interfered with their social activities (such as visiting with friends, relatives, etc.). Again, the change in the question means the 2013 results cannot be directly compared with those from the earlier alumni surveys. The results for 2013 are displayed in Figures 26a and 26b, and the results for 2011 and 2012 are included in Appendix C (Figure C2).
The 2013 results also show differences between the effects of physical and mental health problems:
• 24.1 percent of alumni said their physical health has interfered with their social activities during the past 4 weeks all of the time or most of the time.
• 33.9 percent of alumni said their mental health has interfered with their social activities during the past 4 weeks all of the time or most of the time.
24.1 26.2 24.4
17.6
7.7
Not at all Slightly Moderately Quite a bit Extremely
2013Percent
20.1 20.9 22.4 22.3
14.3
Not at all Slightly Moderately Quite a bit Extremely
2013Percent
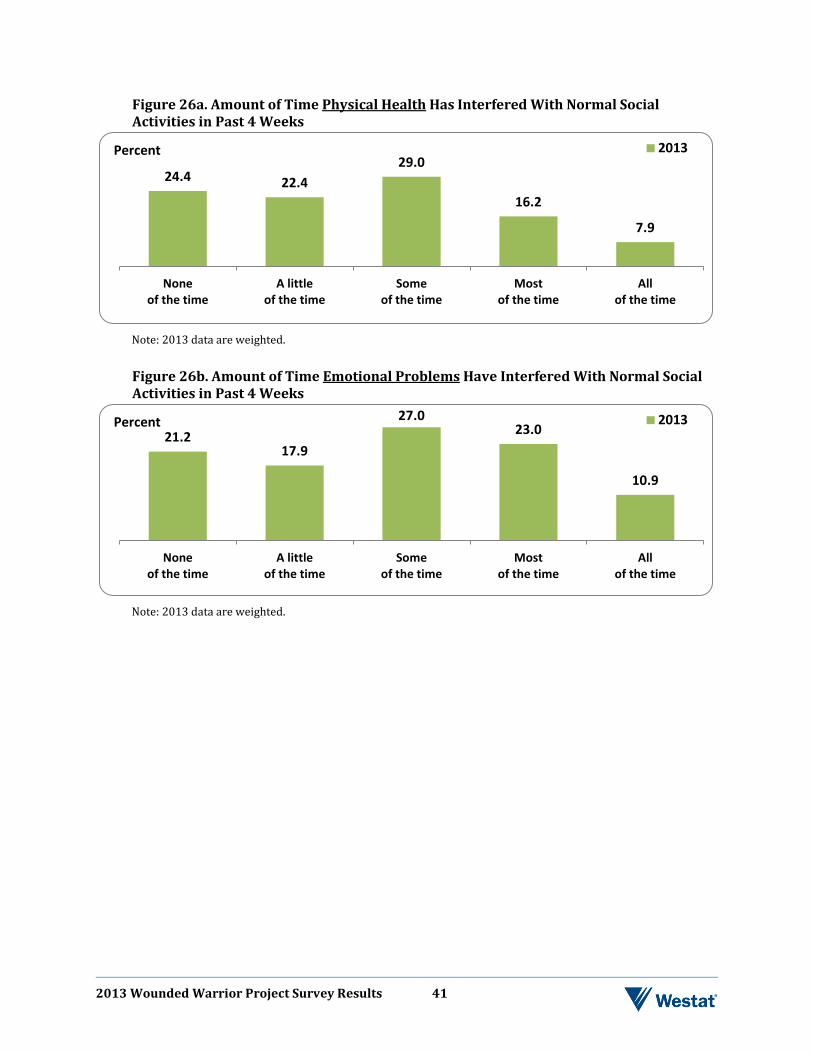
2013 Wounded Warrior Project Survey Results 41
Figure 26a. Amount of Time Physical Health Has Interfered With Normal Social Activities in Past 4 Weeks
Note: 2013 data are weighted.
Figure 26b. Amount of Time Emotional Problems Have Interfered With Normal Social Activities in Past 4 Weeks
Note: 2013 data are weighted.
24.4 22.4 29.0
16.2
7.9
Noneof the time
A littleof the time
Someof the time
Mostof the time
Allof the time
2013Percent
21.2 17.9
27.0 23.0
10.9
Noneof the time
A littleof the time
Someof the time
Mostof the time
Allof the time
2013Percent
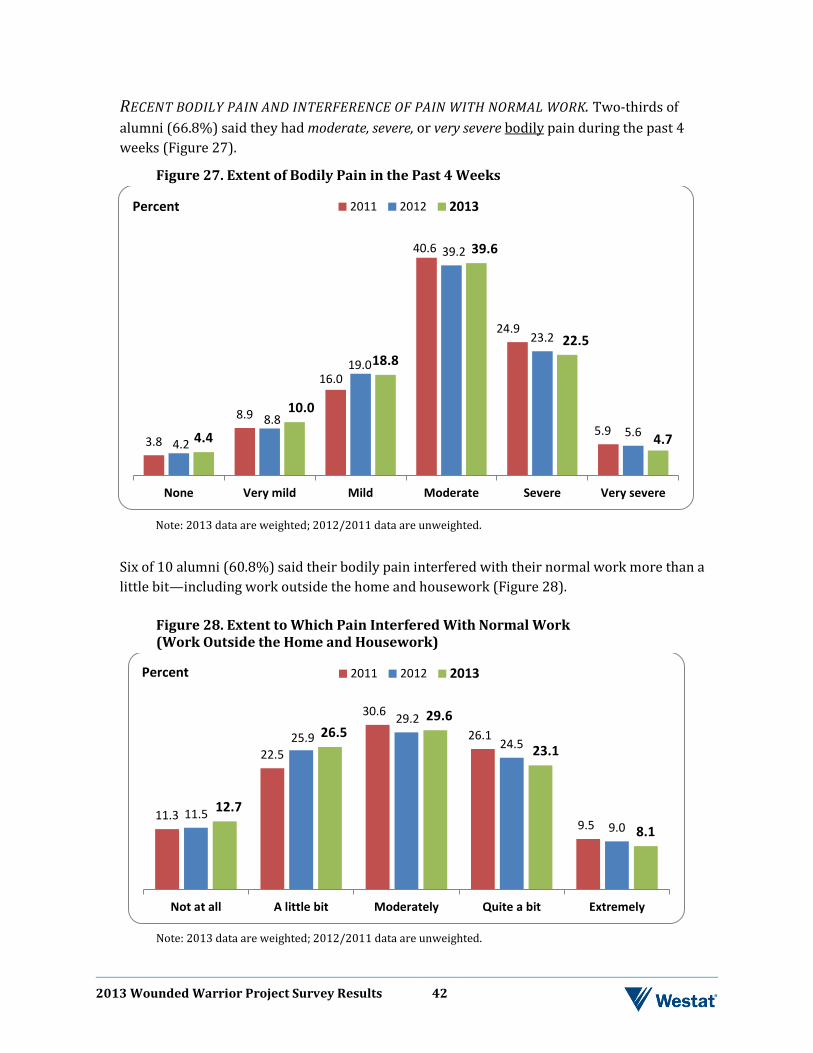
2013 Wounded Warrior Project Survey Results 42
RECENT BODILY PAIN AND INTERFERENCE OF PAIN WITH NORMAL WORK. Two-thirds of alumni (66.8%) said they had moderate, severe, or very severe bodily pain during the past 4 weeks (Figure 27).
Figure 27. Extent of Bodily Pain in the Past 4 Weeks
Note: 2013 data are weighted; 2012/2011 data are unweighted.
Six of 10 alumni (60.8%) said their bodily pain interfered with their normal work more than a little bit—including work outside the home and housework (Figure 28).
Figure 28. Extent to Which Pain Interfered With Normal Work (Work Outside the Home and Housework)
Note: 2013 data are weighted; 2012/2011 data are unweighted.
3.8
8.9
16.0
40.6
24.9
5.9 4.2
8.8
19.0
39.2
23.2
5.6 4.4
10.0
18.8
39.6
22.5
4.7
None Very mild Mild Moderate Severe Very severe
2011 2012 2013Percent
11.3
22.5
30.6
26.1
9.5 11.5
25.9 29.2
24.5
9.0 12.7
26.5 29.6
23.1
8.1
Not at all A little bit Moderately Quite a bit Extremely
2011 2012 2013Percent
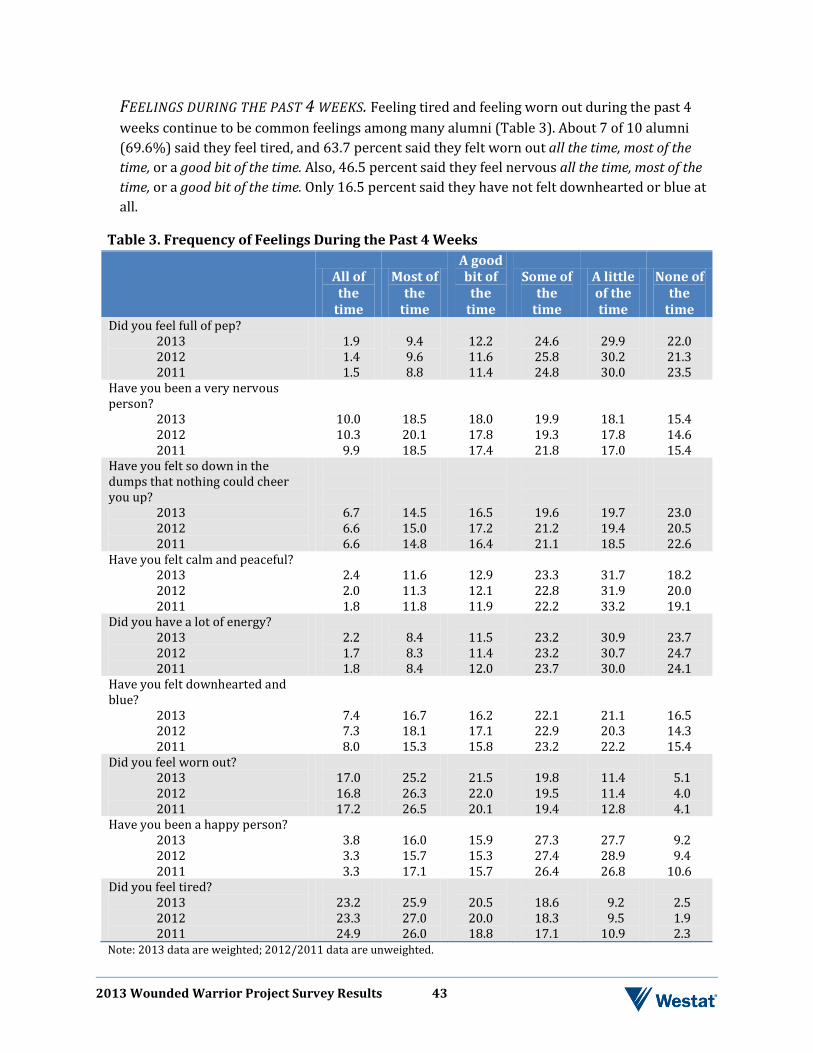
2013 Wounded Warrior Project Survey Results 43
FEELINGS DURING THE PAST 4 WEEKS. Feeling tired and feeling worn out during the past 4 weeks continue to be common feelings among many alumni (Table 3). About 7 of 10 alumni (69.6%) said they feel tired, and 63.7 percent said they felt worn out all the time, most of the time, or a good bit of the time. Also, 46.5 percent said they feel nervous all the time, most of the time, or a good bit of the time. Only 16.5 percent said they have not felt downhearted or blue at all.
Table 3. Frequency of Feelings During the Past 4 Weeks
All of the
time
Most of the
time
A good bit of
the time
Some of the
time
A little of the time
None of the
time Did you feel full of pep?
2013 2012 2011
1.9 1.4 1.5
9.4 9.6 8.8
12.2 11.6 11.4
24.6 25.8 24.8
29.9 30.2 30.0
22.0 21.3 23.5
Have you been a very nervous person? 2013 2012 2011
10.0 10.3 9.9
18.5 20.1 18.5
18.0 17.8 17.4
19.9 19.3 21.8
18.1 17.8 17.0
15.4 14.6 15.4
Have you felt so down in the dumps that nothing could cheer you up? 2013 2012 2011
6.7 6.6 6.6
14.5 15.0 14.8
16.5 17.2 16.4
19.6 21.2 21.1
19.7 19.4 18.5
23.0 20.5 22.6
Have you felt calm and peaceful? 2013 2012 2011
2.4 2.0 1.8
11.6 11.3 11.8
12.9 12.1 11.9
23.3 22.8 22.2
31.7 31.9 33.2
18.2 20.0 19.1
Did you have a lot of energy? 2013 2012 2011
2.2 1.7 1.8
8.4 8.3 8.4
11.5 11.4 12.0
23.2 23.2 23.7
30.9 30.7 30.0
23.7 24.7 24.1
Have you felt downhearted and blue? 2013 2012 2011
7.4 7.3 8.0
16.7 18.1 15.3
16.2 17.1 15.8
22.1 22.9 23.2
21.1 20.3 22.2
16.5 14.3 15.4
Did you feel worn out? 2013 2012 2011
17.0 16.8 17.2
25.2 26.3 26.5
21.5 22.0 20.1
19.8 19.5 19.4
11.4 11.4 12.8
5.1 4.0 4.1
Have you been a happy person? 2013 2012 2011
3.8 3.3 3.3
16.0 15.7 17.1
15.9 15.3 15.7
27.3 27.4 26.4
27.7 28.9 26.8
9.2 9.4 10.6
Did you feel tired? 2013 2012 2011
23.2 23.3 24.9
25.9 27.0 26.0
20.5 20.0 18.8
18.6 18.3 17.1
9.2 9.5 10.9
2.5 1.9 2.3
Note: 2013 data are weighted; 2012/2011 data are unweighted.
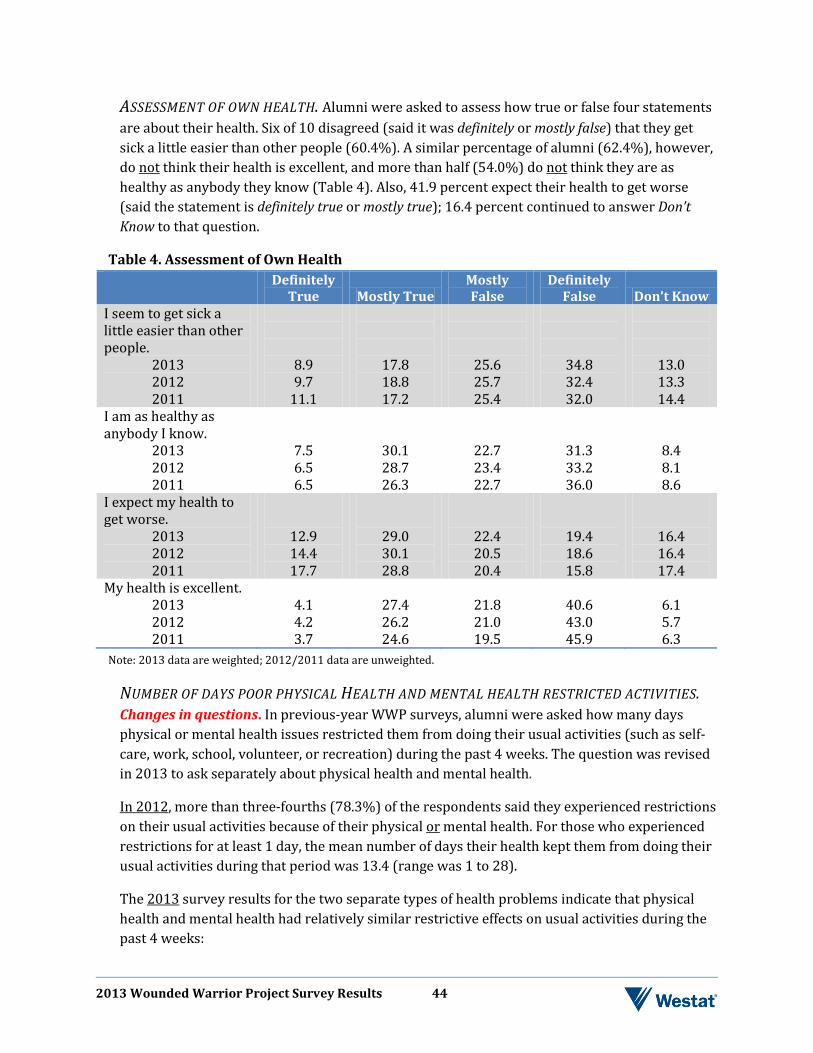
2013 Wounded Warrior Project Survey Results 44
ASSESSMENT OF OWN HEALTH. Alumni were asked to assess how true or false four statements are about their health. Six of 10 disagreed (said it was definitely or mostly false) that they get sick a little easier than other people (60.4%). A similar percentage of alumni (62.4%), however, do not think their health is excellent, and more than half (54.0%) do not think they are as healthy as anybody they know (Table 4). Also, 41.9 percent expect their health to get worse (said the statement is definitely true or mostly true); 16.4 percent continued to answer Don’t Know to that question.
Table 4. Assessment of Own Health Definitely
True Mostly True Mostly False
Definitely False Don’t Know
I seem to get sick a little easier than other people. 2013 2012 2011
8.9 9.7
11.1
17.8 18.8 17.2
25.6 25.7 25.4
34.8 32.4 32.0
13.0 13.3 14.4
I am as healthy as anybody I know. 2013 2012 2011
7.5 6.5 6.5
30.1 28.7 26.3
22.7 23.4 22.7
31.3 33.2 36.0
8.4 8.1 8.6
I expect my health to get worse. 2013 2012 2011
12.9 14.4 17.7
29.0 30.1 28.8
22.4 20.5 20.4
19.4 18.6 15.8
16.4 16.4 17.4
My health is excellent. 2013 2012 2011
4.1 4.2 3.7
27.4 26.2 24.6
21.8 21.0 19.5
40.6 43.0 45.9
6.1 5.7 6.3
Note: 2013 data are weighted; 2012/2011 data are unweighted.
NUMBER OF DAYS POOR PHYSICAL HEALTH AND MENTAL HEALTH RESTRICTED ACTIVITIES. Changes in questions. In previous-year WWP surveys, alumni were asked how many days physical or mental health issues restricted them from doing their usual activities (such as self-care, work, school, volunteer, or recreation) during the past 4 weeks. The question was revised in 2013 to ask separately about physical health and mental health.
In 2012, more than three-fourths (78.3%) of the respondents said they experienced restrictions on their usual activities because of their physical or mental health. For those who experienced restrictions for at least 1 day, the mean number of days their health kept them from doing their usual activities during that period was 13.4 (range was 1 to 28).
The 2013 survey results for the two separate types of health problems indicate that physical health and mental health had relatively similar restrictive effects on usual activities during the past 4 weeks:
2013 Wounded Warrior Project Survey Results 45
• In 2013, 70.9 percent of alumni indicated that their physical health issues restricted them from doing their usual activities for one or more days during the past 4 weeks. The mean number of days reported was 12.2 (range was 1 to 28).
• In 2013, 68.5 percent of alumni indicated that their mental health issues restricted them from doing their usual activities for one or more days during the past 4 weeks. The mean number of days reported was 13.5 (range was 1 to 28).
Another question in the WWP alumni survey during the first 3 survey years asked wounded warriors if they had missed work because of their poor health during the past 4 weeks. That question was also revised in 2013 to ask separately about physical health and mental health. In 2012, the percentage saying their health kept them from going to work in the past 4 weeks was 68.9 percent. The mean number of days they reported missing work during the 4 weeks was 5.0. Among those who reported elsewhere in the survey that they were currently employed and had missed work during the past 4 weeks, the mean number of work days missed was 6.6.
2013 Results for All Alumni
The results for the new questions in the 2013 survey indicate that, on average, among all alumni, physical health problems kept alumni from going to work more often in the past 4 weeks than mental health problems did. The mean number of work days missed was:
o Physical health problems – 6.5 o Mental health problems – 4.2
2013 Results for Employed Alumni
We also analyzed the 2013 responses to the question asking about number of work days missed for the subgroup of alumni who reported elsewhere in the 2013 survey that they were currently employed. For this subgroup, the mean number of work days missed in the past 4 weeks because of physical health problems was similar to the mean number of work days missed because of mental health problems:
o Physical health problems – 6.5 o Mental health problems – 6.9
RAND-36 ITEM SHORT FORM SCALE SCORES. Scale scores for the RAND-36 items were calculated as follows: First, item values were recoded according to RAND’s scoring key; second, total scores were calculated for each item making up a health functional area; third, item scores were averaged together to produce a final mean score for that health functional area. The maximum score for each health functional area is 100. Higher scores represent a more favorable health status. Mean scale scores for the WWP alumni are presented below. The 2013 means scores are similar to most of the 2012 scores:
• Physical Functioning = 60.3 (59.0 in 2012) (WWP Health and Daily Activity items 2a-j). • Bodily Pain = 42.5 (41.1 in 2012) (WWP Health and Daily Activities items 6 and 7). • Energy/Fatigue = 34.5 (34.0 in 2012) (WWP Health and Daily Activities items 8a, e, g, i).
2013 Wounded Warrior Project Survey Results 46
• Emotional Well-Being – 49.4 (48.1 in 2012) (WWP Health and Daily Activities items 8b, c, d, f, h).
• Social Functioning – (WWP Health and Daily Activities survey items 5 and 9). Unable to calculate in 2013 because these items were revised as two questions each in the 2013 survey (the score was 42.9 in 2012).
• General Health Assessment – 46.6 (44.0 in 2012) (WWP Health and Daily Activities items 1, 10a, b, c, d).
• Role Limitations Due to Physical Health – 42.1 (39.3 in 2012) (WWP Health and Daily Activities items 3a, b, c, d).
• Role Limitations Due to Emotional Problems – 41.4 (37.7 in 2012) (WWP Health and Daily Activities items 4a, b, c).
For comparison with the WWP results, mean scores on the RAND Medical Outcomes Study Short Form for Veterans (SF-36V) are presented for the initial Cohort of the Millennium Cohort study sponsored by the Department of Defense (Ryan et al., 2007). The response scales for role limitations due to physical health and role limitations due to emotional problems differed for the two survey populations—a 5-point scale was used in the Millennium Cohort study, whereas a 3-point scale was used in the WWP survey. Thus, the two sets of scores for role limitations are not directly comparable.
• Physical Functioning – 91.0 • Pain – 75.4 • Energy/Fatigue (Vitality) – 62.1 • Emotional Well-Being (Mental Health) – 78.6 • Social Functioning – 87.1 • General Health Assessment – 76.9 • Role Limitations Due to Physical Health – 82.2 • Role Limitations Due to Emotional Problems – 83.7
The comparison indicates less favorable physical and mental health status for WWP alumni. As noted earlier, most of the initial Cohort in the Millennium Cohort study had not been deployed at the time baseline data were collected.
HOW HAVE YOU BEEN FEELING?
The survey included one question on problems that may have bothered alumni in the past 2 weeks and another question on frightening military experiences that affected them in the past month. Clearly, alumni military experiences are currently affecting them in adverse ways.
HOW OFTEN PROBLEMS BOTHER THEM. Among problems bothering respondents nearly every day, the most commonly reported problems for the 4 survey years are various types of sleeping problems (42.8%) and feeling tired or having little energy (34.6%; Table 5). Many other problems bothered them as well during the 2 weeks prior to the survey. Results are similar to those for 2012 and 2011.
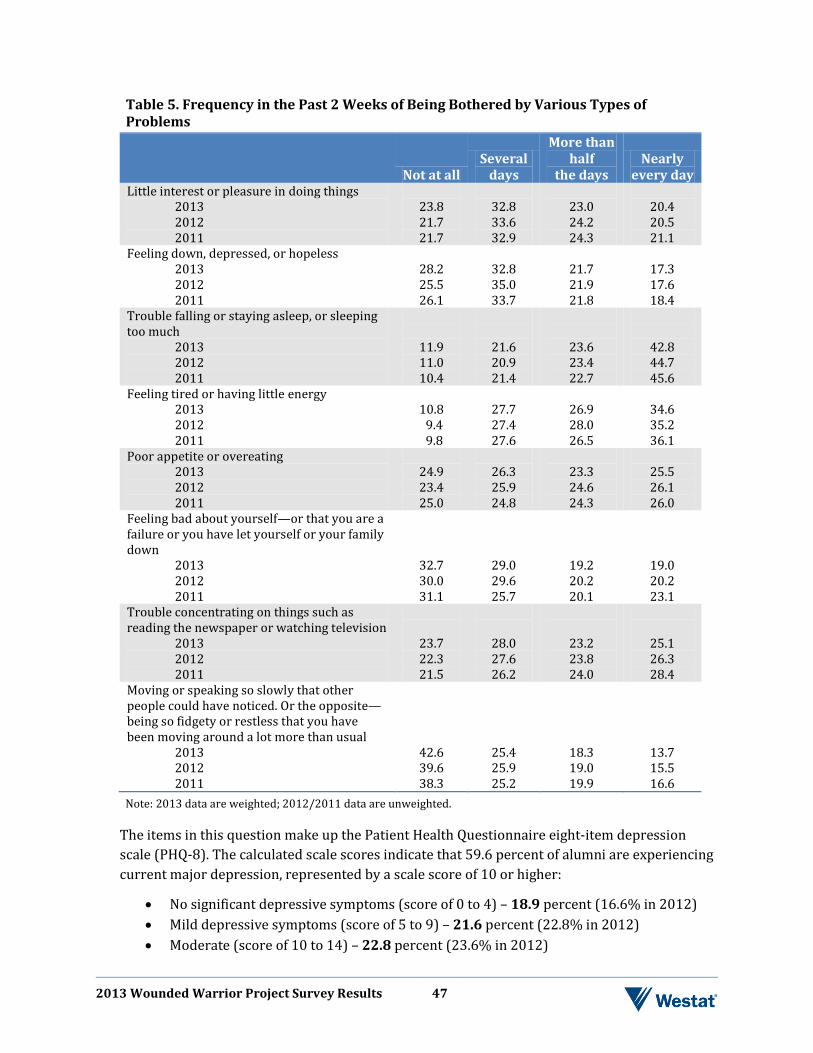
2013 Wounded Warrior Project Survey Results 47
Table 5. Frequency in the Past 2 Weeks of Being Bothered by Various Types of Problems
Not at all
Several days
More than half
the days Nearly
every day Little interest or pleasure in doing things 2013 2012 2011
23.8 21.7 21.7
32.8 33.6 32.9
23.0 24.2 24.3
20.4 20.5 21.1
Feeling down, depressed, or hopeless 2013 2012 2011
28.2 25.5 26.1
32.8 35.0 33.7
21.7 21.9 21.8
17.3 17.6 18.4
Trouble falling or staying asleep, or sleeping too much 2013 2012 2011
11.9 11.0 10.4
21.6 20.9 21.4
23.6 23.4 22.7
42.8 44.7 45.6
Feeling tired or having little energy 2013 2012 2011
10.8 9.4 9.8
27.7 27.4 27.6
26.9 28.0 26.5
34.6 35.2 36.1
Poor appetite or overeating 2013 2012 2011
24.9 23.4 25.0
26.3 25.9 24.8
23.3 24.6 24.3
25.5 26.1 26.0
Feeling bad about yourself—or that you are a failure or you have let yourself or your family down 2013 2012 2011
32.7 30.0 31.1
29.0 29.6 25.7
19.2 20.2 20.1
19.0 20.2 23.1
Trouble concentrating on things such as reading the newspaper or watching television 2013 2012 2011
23.7 22.3 21.5
28.0 27.6 26.2
23.2 23.8 24.0
25.1 26.3 28.4
Moving or speaking so slowly that other people could have noticed. Or the opposite—being so fidgety or restless that you have been moving around a lot more than usual 2013 2012 2011
42.6 39.6 38.3
25.4 25.9 25.2
18.3 19.0 19.9
13.7 15.5 16.6
Note: 2013 data are weighted; 2012/2011 data are unweighted.
The items in this question make up the Patient Health Questionnaire eight-item depression scale (PHQ-8). The calculated scale scores indicate that 59.6 percent of alumni are experiencing current major depression, represented by a scale score of 10 or higher:
• No significant depressive symptoms (score of 0 to 4) – 18.9 percent (16.6% in 2012) • Mild depressive symptoms (score of 5 to 9) – 21.6 percent (22.8% in 2012) • Moderate (score of 10 to 14) – 22.8 percent (23.6% in 2012)
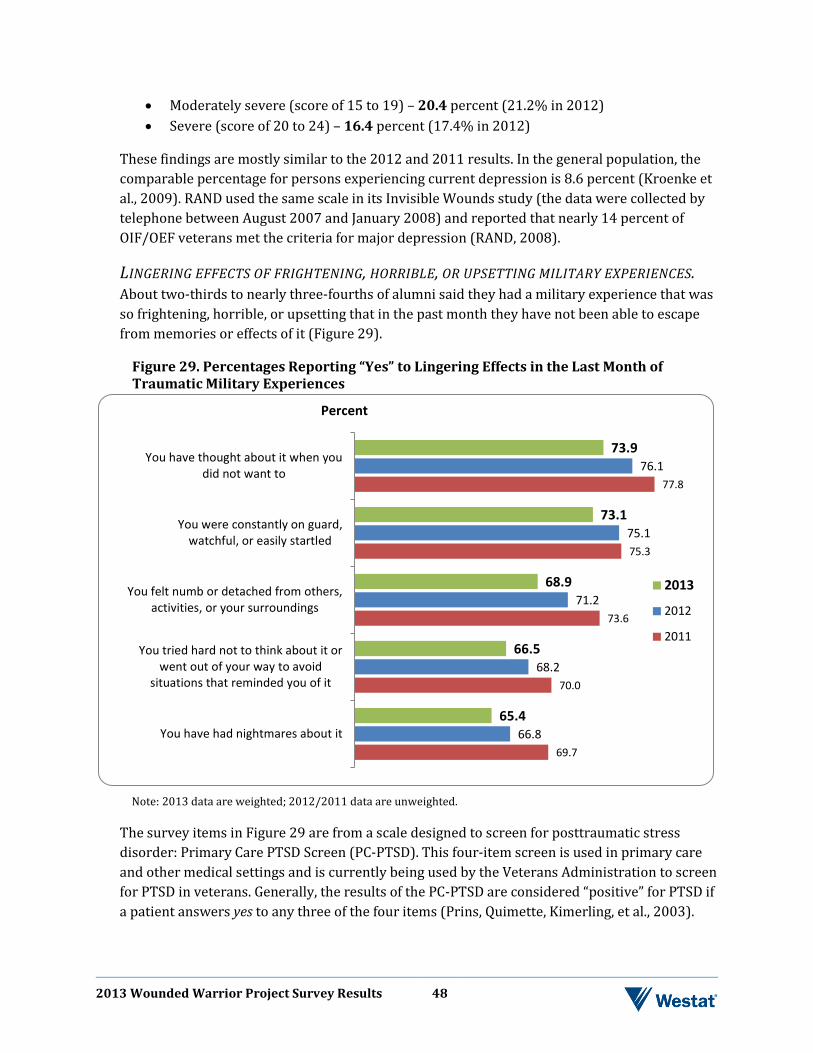
2013 Wounded Warrior Project Survey Results 48
• Moderately severe (score of 15 to 19) – 20.4 percent (21.2% in 2012) • Severe (score of 20 to 24) – 16.4 percent (17.4% in 2012)
These findings are mostly similar to the 2012 and 2011 results. In the general population, the comparable percentage for persons experiencing current depression is 8.6 percent (Kroenke et al., 2009). RAND used the same scale in its Invisible Wounds study (the data were collected by telephone between August 2007 and January 2008) and reported that nearly 14 percent of OIF/OEF veterans met the criteria for major depression (RAND, 2008).
LINGERING EFFECTS OF FRIGHTENING, HORRIBLE, OR UPSETTING MILITARY EXPERIENCES. About two-thirds to nearly three-fourths of alumni said they had a military experience that was so frightening, horrible, or upsetting that in the past month they have not been able to escape from memories or effects of it (Figure 29).
Figure 29. Percentages Reporting “Yes” to Lingering Effects in the Last Month of Traumatic Military Experiences
Note: 2013 data are weighted; 2012/2011 data are unweighted.
The survey items in Figure 29 are from a scale designed to screen for posttraumatic stress disorder: Primary Care PTSD Screen (PC-PTSD). This four-item screen is used in primary care and other medical settings and is currently being used by the Veterans Administration to screen for PTSD in veterans. Generally, the results of the PC-PTSD are considered “positive” for PTSD if a patient answers yes to any three of the four items (Prins, Quimette, Kimerling, et al., 2003).
69.7
70.0
73.6
75.3
77.8
66.8
68.2
71.2
75.1
76.1
65.4
66.5
68.9
73.1
73.9
You have had nightmares about it
You tried hard not to think about it orwent out of your way to avoid
situations that reminded you of it
You felt numb or detached from others,activities, or your surroundings
You were constantly on guard,watchful, or easily startled
You have thought about it when youdid not want to
2013
2012
2011
Percent
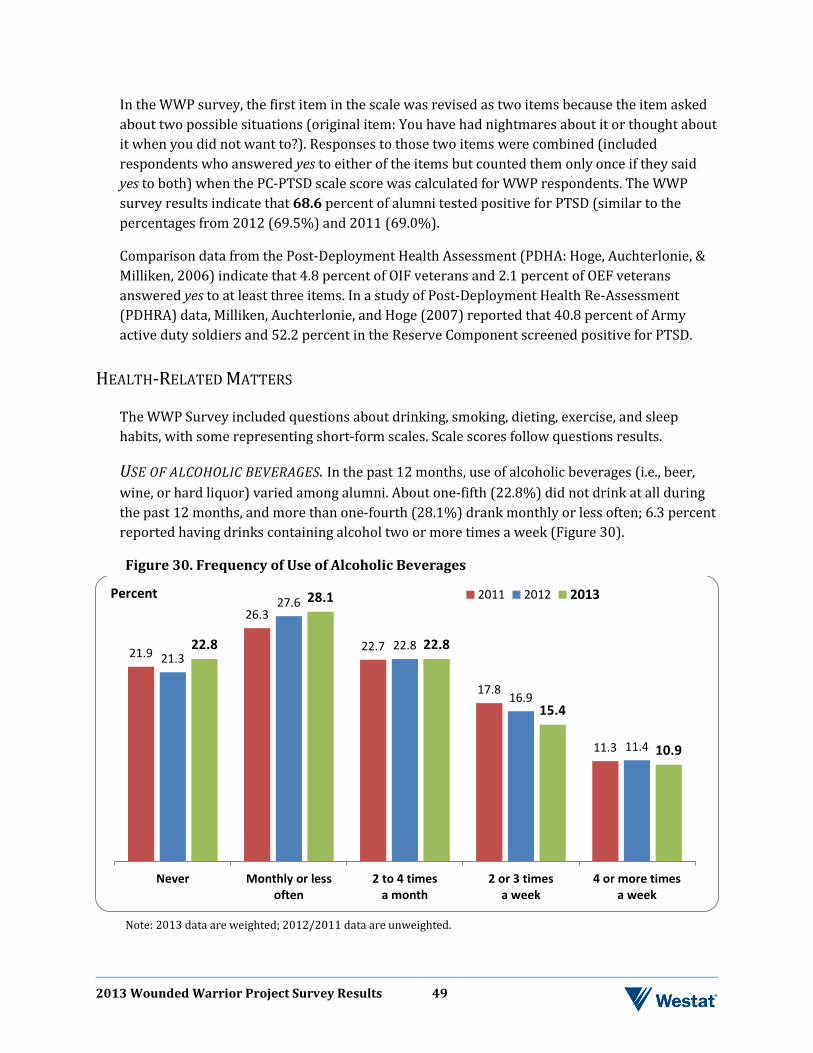
2013 Wounded Warrior Project Survey Results 49
In the WWP survey, the first item in the scale was revised as two items because the item asked about two possible situations (original item: You have had nightmares about it or thought about it when you did not want to?). Responses to those two items were combined (included respondents who answered yes to either of the items but counted them only once if they said yes to both) when the PC-PTSD scale score was calculated for WWP respondents. The WWP survey results indicate that 68.6 percent of alumni tested positive for PTSD (similar to the percentages from 2012 (69.5%) and 2011 (69.0%).
Comparison data from the Post-Deployment Health Assessment (PDHA: Hoge, Auchterlonie, & Milliken, 2006) indicate that 4.8 percent of OIF veterans and 2.1 percent of OEF veterans answered yes to at least three items. In a study of Post-Deployment Health Re-Assessment (PDHRA) data, Milliken, Auchterlonie, and Hoge (2007) reported that 40.8 percent of Army active duty soldiers and 52.2 percent in the Reserve Component screened positive for PTSD.
HEALTH-RELATED MATTERS
The WWP Survey included questions about drinking, smoking, dieting, exercise, and sleep habits, with some representing short-form scales. Scale scores follow questions results.
USE OF ALCOHOLIC BEVERAGES. In the past 12 months, use of alcoholic beverages (i.e., beer, wine, or hard liquor) varied among alumni. About one-fifth (22.8%) did not drink at all during the past 12 months, and more than one-fourth (28.1%) drank monthly or less often; 6.3 percent reported having drinks containing alcohol two or more times a week (Figure 30).
Figure 30. Frequency of Use of Alcoholic Beverages
Note: 2013 data are weighted; 2012/2011 data are unweighted.
21.9
26.3
22.7
17.8
11.3
21.3
27.6
22.8
16.9
11.4
22.8
28.1
22.8
15.4
10.9
Never Monthly or lessoften
2 to 4 timesa month
2 or 3 timesa week
4 or more timesa week
2011 2012 2013Percent
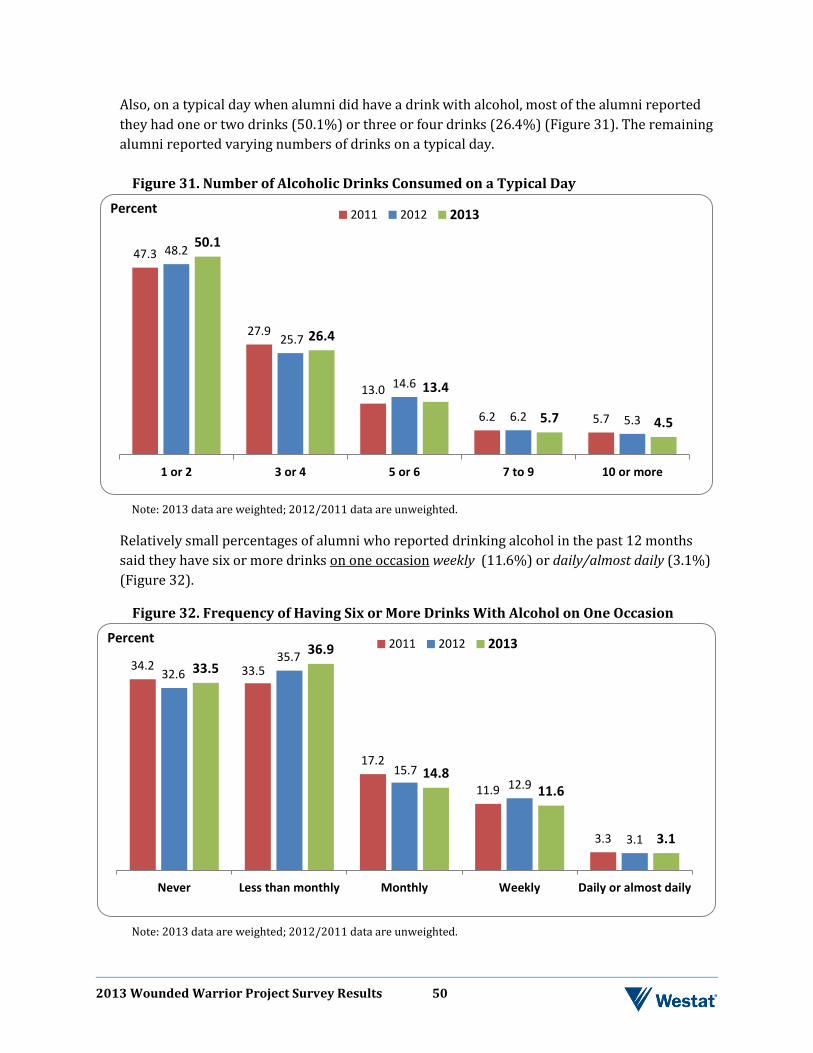
2013 Wounded Warrior Project Survey Results 50
Also, on a typical day when alumni did have a drink with alcohol, most of the alumni reported they had one or two drinks (50.1%) or three or four drinks (26.4%) (Figure 31). The remaining alumni reported varying numbers of drinks on a typical day.
Figure 31. Number of Alcoholic Drinks Consumed on a Typical Day
Note: 2013 data are weighted; 2012/2011 data are unweighted.
Relatively small percentages of alumni who reported drinking alcohol in the past 12 months said they have six or more drinks on one occasion weekly (11.6%) or daily/almost daily (3.1%) (Figure 32).
Figure 32. Frequency of Having Six or More Drinks With Alcohol on One Occasion
Note: 2013 data are weighted; 2012/2011 data are unweighted.
47.3
27.9
13.0
6.2 5.7
48.2
25.7
14.6
6.2 5.3
50.1
26.4
13.4
5.7 4.5
1 or 2 3 or 4 5 or 6 7 to 9 10 or more
2011 2012 2013Percent
34.2 33.5
17.2
11.9
3.3
32.6 35.7
15.7 12.9
3.1
33.5 36.9
14.8 11.6
3.1
Never Less than monthly Monthly Weekly Daily or almost daily
2011 2012 2013Percent
2013 Wounded Warrior Project Survey Results 51
The three questions about alcohol use in the past 12 months are from the AUDIT-C scale. Scores on the AUDIT-C can range from 0 to 12. A score of 4 or higher represents a positive alcohol screen for at-risk drinking for males, and a score of 3 or higher is positive for females (Dawson, Grant, Stinson, & Zhou, 2005). The WWP mean score for male alumni is 3.3, and the mean score for WWP female alumni is 2.2.
The survey included two questions about the use of alcohol in the past 4 weeks. About one-fifth of alumni (19.5%) said they used alcohol more than they meant to in the past 4 weeks. Also, 15.4 percent said that in the past 4 weeks they have felt they wanted to or needed to cut down on their drinking. These two alcohol questions are from the Post-Deployment Health Assessment/Post-Deployment Health Reassessment (PDHA/PDHRA) alcohol screen. An answer of yes to both questions is coded as a positive alcohol screen. The percentage of WWP respondents who said yes to both questions is 12.7 (14.1% in 2012).
The findings from the 2011 Department of Defense Health Related Behaviors Survey of Active Duty Military Personnel (HRB) include data on the prevalence of drinking alcoholic beverages among Army, Navy, Marine Corps, Air Force, and Coast Guard active duty service members (Barlas, Higgins, Pflieger, & Diecker, 2013). The results are not directly comparable to the WWP findings not only because of the differences in survey populations but also because the HRB asks a different set of questions from those asked in the WWP survey and the reference periods for the questions differ. We report the findings, though, because they do provide additional information about active duty service members’ use of alcohol. According to the HRB findings:
• The percentage of active duty personnel reporting they did not drink alcoholic beverages at all in the past 12 months was 15.6 percent (compared with 22.8 percent of WWP alumni).
• Active duty personnel who did drink alcoholic beverages in the past 12 months reported an average of 6.2 drinking days per month.
• Nearly 4 of 10 active duty personnel (39.6%) said they had at least one binge drinking episode in the past 30 days. Binge drinking for the HRB is defined as consuming five or more drinks for males and four or more for females on the same occasion.
USE OF TOBACCO PRODUCTS. About 3 of 10 respondents (31.9%) said they used cigarettes during the past 12 months, and lower percentages of respondents said they used other tobacco products (Figure 33). Findings from the 2011 HRB of active duty personnel indicate that 24.0 percent are current cigarette smokers (Barlas, Higgins, Pflieger, & Diecker, 2013).
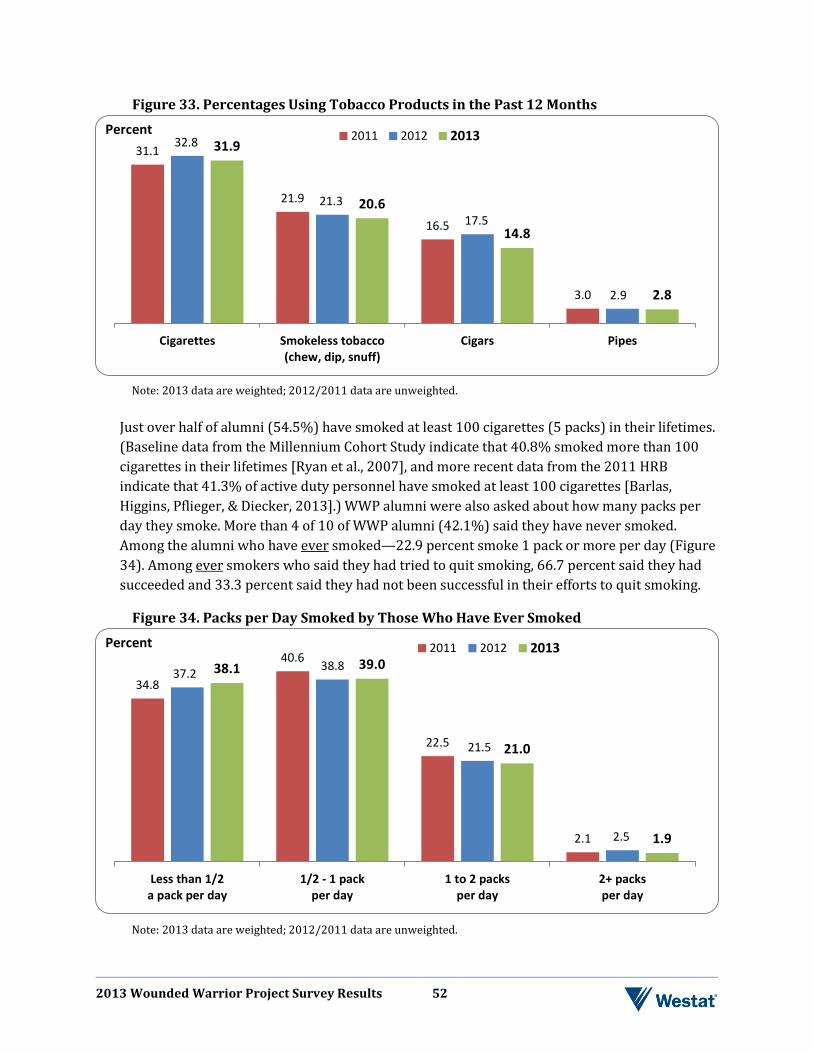
2013 Wounded Warrior Project Survey Results 52
Figure 33. Percentages Using Tobacco Products in the Past 12 Months
Note: 2013 data are weighted; 2012/2011 data are unweighted.
Just over half of alumni (54.5%) have smoked at least 100 cigarettes (5 packs) in their lifetimes. (Baseline data from the Millennium Cohort Study indicate that 40.8% smoked more than 100 cigarettes in their lifetimes [Ryan et al., 2007], and more recent data from the 2011 HRB indicate that 41.3% of active duty personnel have smoked at least 100 cigarettes [Barlas, Higgins, Pflieger, & Diecker, 2013].) WWP alumni were also asked about how many packs per day they smoke. More than 4 of 10 of WWP alumni (42.1%) said they have never smoked. Among the alumni who have ever smoked—22.9 percent smoke 1 pack or more per day (Figure 34). Among ever smokers who said they had tried to quit smoking, 66.7 percent said they had succeeded and 33.3 percent said they had not been successful in their efforts to quit smoking.
Figure 34. Packs per Day Smoked by Those Who Have Ever Smoked
Note: 2013 data are weighted; 2012/2011 data are unweighted.
31.1
21.9
16.5
3.0
32.8
21.3 17.5
2.9
31.9
20.6
14.8
2.8
Cigarettes Smokeless tobacco(chew, dip, snuff)
Cigars Pipes
2011 2012 2013Percent
34.8
40.6
22.5
2.1
37.2 38.8
21.5
2.5
38.1 39.0
21.0
1.9
Less than 1/2a pack per day
1/2 - 1 packper day
1 to 2 packsper day
2+ packsper day
2011 2012 2013Percent
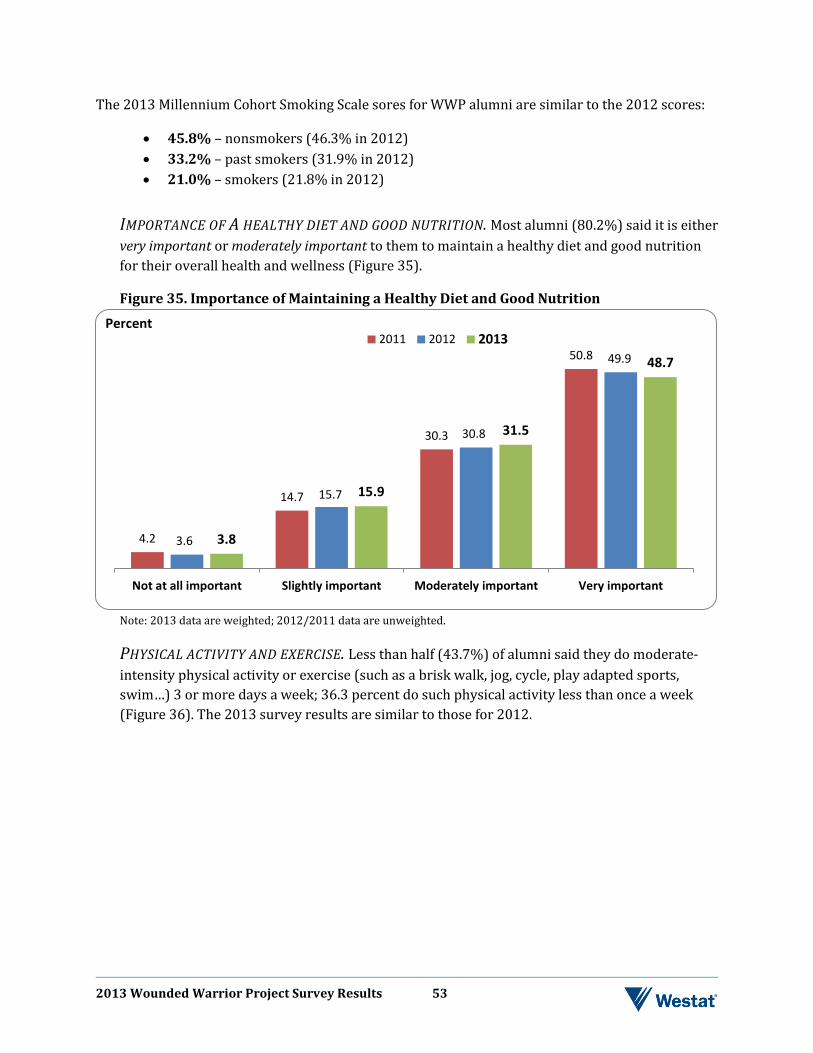
2013 Wounded Warrior Project Survey Results 53
The 2013 Millennium Cohort Smoking Scale sores for WWP alumni are similar to the 2012 scores:
• 45.8% – nonsmokers (46.3% in 2012) • 33.2% – past smokers (31.9% in 2012) • 21.0% – smokers (21.8% in 2012)
IMPORTANCE OF A HEALTHY DIET AND GOOD NUTRITION. Most alumni (80.2%) said it is either very important or moderately important to them to maintain a healthy diet and good nutrition for their overall health and wellness (Figure 35).
Figure 35. Importance of Maintaining a Healthy Diet and Good Nutrition
Note: 2013 data are weighted; 2012/2011 data are unweighted.
PHYSICAL ACTIVITY AND EXERCISE. Less than half (43.7%) of alumni said they do moderate-intensity physical activity or exercise (such as a brisk walk, jog, cycle, play adapted sports, swim…) 3 or more days a week; 36.3 percent do such physical activity less than once a week (Figure 36). The 2013 survey results are similar to those for 2012.
4.2
14.7
30.3
50.8
3.6
15.7
30.8
49.9
3.8
15.9
31.5
48.7
Not at all important Slightly important Moderately important Very important
2011 2012 2013Percent
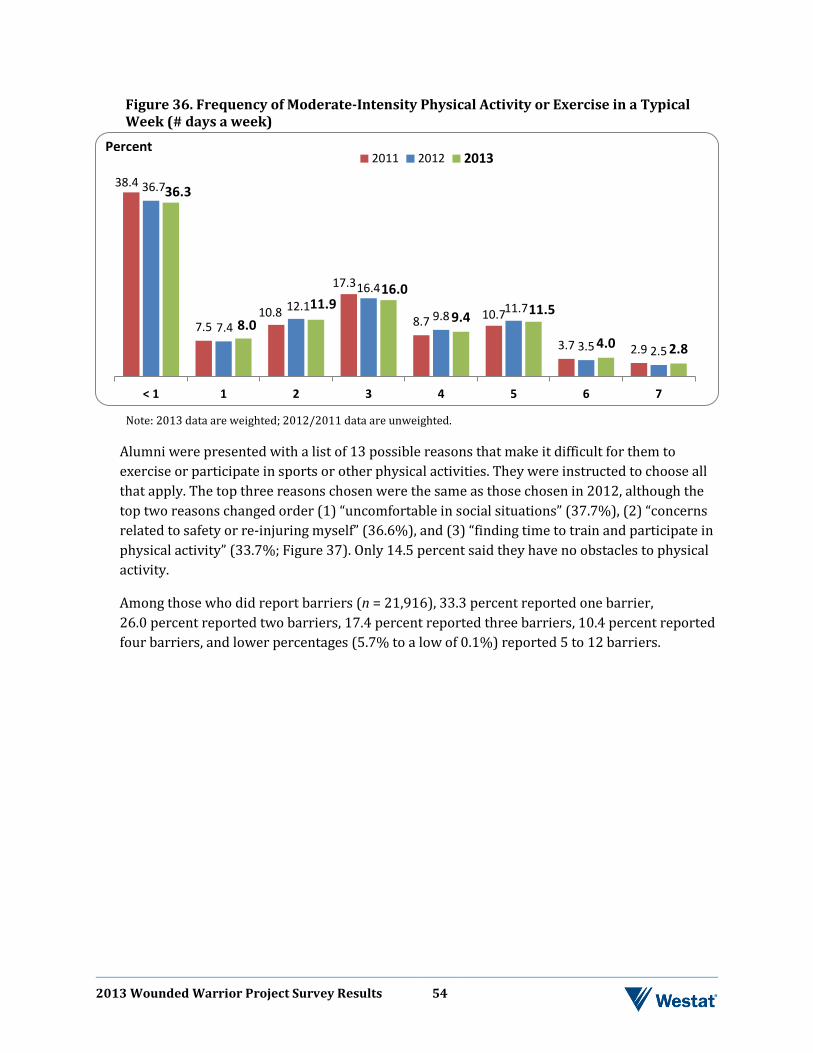
2013 Wounded Warrior Project Survey Results 54
Figure 36. Frequency of Moderate-Intensity Physical Activity or Exercise in a Typical Week (# days a week)
Note: 2013 data are weighted; 2012/2011 data are unweighted.
Alumni were presented with a list of 13 possible reasons that make it difficult for them to exercise or participate in sports or other physical activities. They were instructed to choose all that apply. The top three reasons chosen were the same as those chosen in 2012, although the top two reasons changed order (1) “uncomfortable in social situations” (37.7%), (2) “concerns related to safety or re-injuring myself” (36.6%), and (3) “finding time to train and participate in physical activity” (33.7%; Figure 37). Only 14.5 percent said they have no obstacles to physical activity.
Among those who did report barriers (n = 21,916), 33.3 percent reported one barrier, 26.0 percent reported two barriers, 17.4 percent reported three barriers, 10.4 percent reported four barriers, and lower percentages (5.7% to a low of 0.1%) reported 5 to 12 barriers.
38.4
7.5 10.8
17.3
8.7 10.7
3.7 2.9
36.7
7.4
12.1 16.4
9.8 11.7
3.5 2.5
36.3
8.0 11.9
16.0
9.4 11.5
4.0 2.8
< 1 1 2 3 4 5 6 7
2011 2012 2013Percent
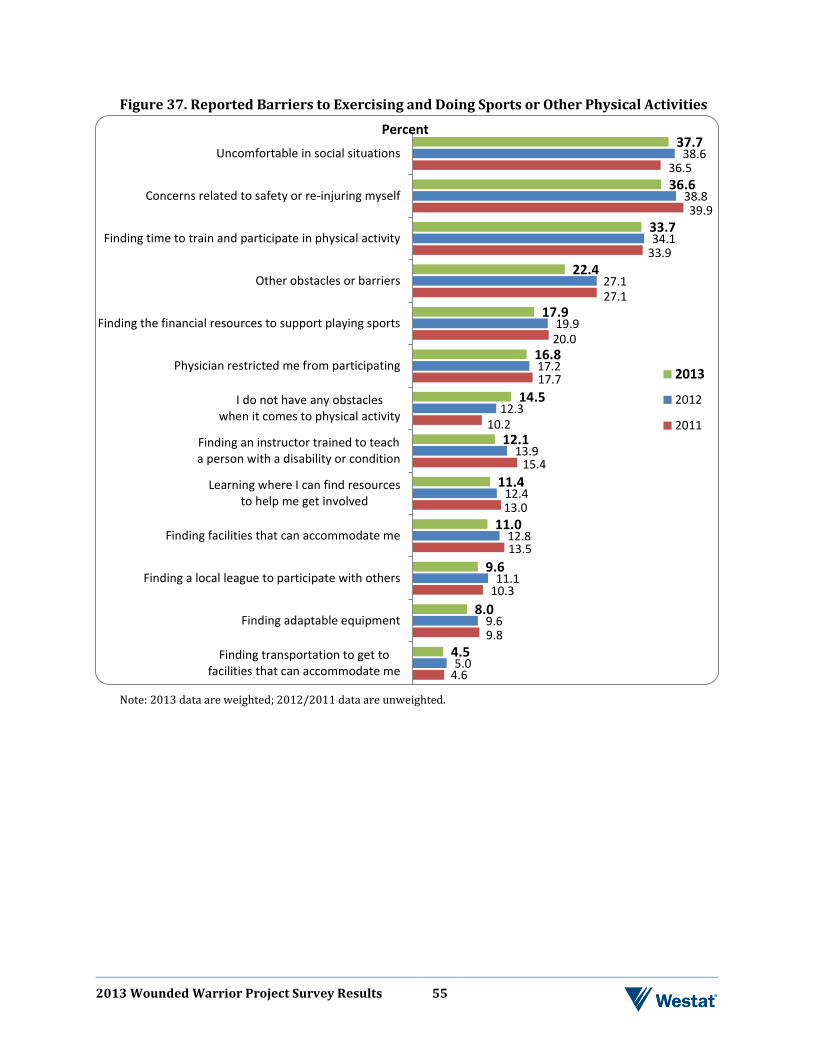
2013 Wounded Warrior Project Survey Results 55
Figure 37. Reported Barriers to Exercising and Doing Sports or Other Physical Activities
Note: 2013 data are weighted; 2012/2011 data are unweighted.
4.6
9.8
10.3
13.5
13.0
15.4
10.2
17.7
20.0
27.1
33.9
39.9
36.5
5.0
9.6
11.1
12.8
12.4
13.9
12.3
17.2
19.9
27.1
34.1
38.8
38.6
4.5
8.0
9.6
11.0
11.4
12.1
14.5
16.8
17.9
22.4
33.7
36.6
37.7
Finding transportation to get tofacilities that can accommodate me
Finding adaptable equipment
Finding a local league to participate with others
Finding facilities that can accommodate me
Learning where I can find resourcesto help me get involved
Finding an instructor trained to teacha person with a disability or condition
I do not have any obstacleswhen it comes to physical activity
Physician restricted me from participating
Finding the financial resources to support playing sports
Other obstacles or barriers
Finding time to train and participate in physical activity
Concerns related to safety or re-injuring myself
Uncomfortable in social situations
2013
2012
2011
Percent
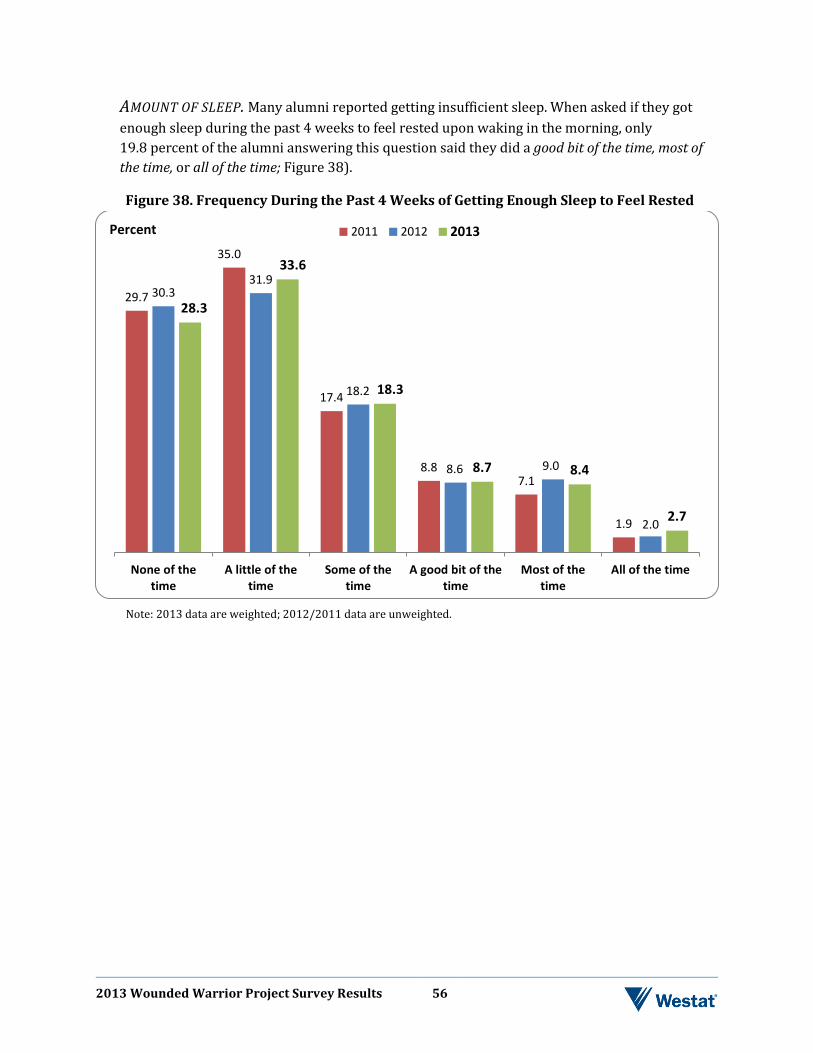
2013 Wounded Warrior Project Survey Results 56
AMOUNT OF SLEEP. Many alumni reported getting insufficient sleep. When asked if they got enough sleep during the past 4 weeks to feel rested upon waking in the morning, only 19.8 percent of the alumni answering this question said they did a good bit of the time, most of the time, or all of the time; Figure 38).
Figure 38. Frequency During the Past 4 Weeks of Getting Enough Sleep to Feel Rested
Note: 2013 data are weighted; 2012/2011 data are unweighted.
29.7
35.0
17.4
8.8 7.1
1.9
30.3 31.9
18.2
8.6 9.0
2.0
28.3
33.6
18.3
8.7 8.4
2.7
None of thetime
A little of thetime
Some of thetime
A good bit of thetime
Most of thetime
All of the time
2011 2012 2013Percent
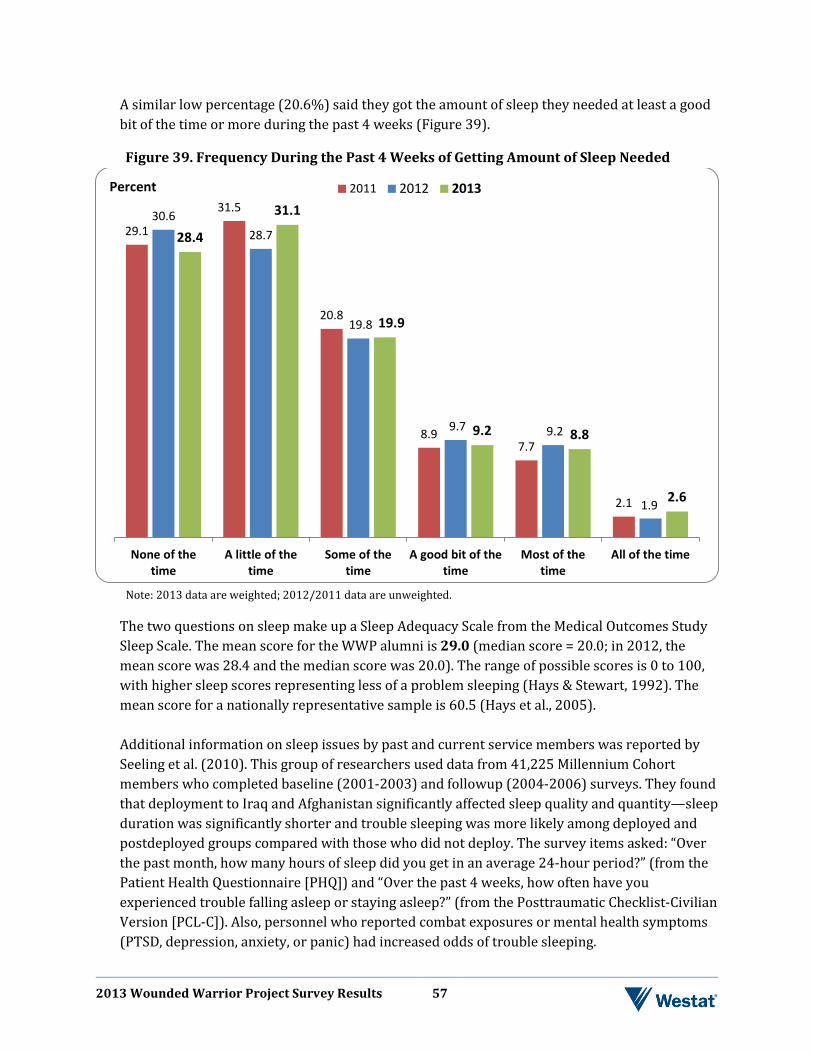
2013 Wounded Warrior Project Survey Results 57
A similar low percentage (20.6%) said they got the amount of sleep they needed at least a good bit of the time or more during the past 4 weeks (Figure 39).
Figure 39. Frequency During the Past 4 Weeks of Getting Amount of Sleep Needed
Note: 2013 data are weighted; 2012/2011 data are unweighted.
The two questions on sleep make up a Sleep Adequacy Scale from the Medical Outcomes Study Sleep Scale. The mean score for the WWP alumni is 29.0 (median score = 20.0; in 2012, the mean score was 28.4 and the median score was 20.0). The range of possible scores is 0 to 100, with higher sleep scores representing less of a problem sleeping (Hays & Stewart, 1992). The mean score for a nationally representative sample is 60.5 (Hays et al., 2005). Additional information on sleep issues by past and current service members was reported by Seeling et al. (2010). This group of researchers used data from 41,225 Millennium Cohort members who completed baseline (2001-2003) and followup (2004-2006) surveys. They found that deployment to Iraq and Afghanistan significantly affected sleep quality and quantity—sleep duration was significantly shorter and trouble sleeping was more likely among deployed and postdeployed groups compared with those who did not deploy. The survey items asked: “Over the past month, how many hours of sleep did you get in an average 24-hour period?” (from the Patient Health Questionnaire [PHQ]) and “Over the past 4 weeks, how often have you experienced trouble falling asleep or staying asleep?” (from the Posttraumatic Checklist-Civilian Version [PCL-C]). Also, personnel who reported combat exposures or mental health symptoms (PTSD, depression, anxiety, or panic) had increased odds of trouble sleeping.
29.1
31.5
20.8
8.9 7.7
2.1
30.6 28.7
19.8
9.7 9.2
1.9
28.4
31.1
19.9
9.2 8.8
2.6
None of thetime
A little of thetime
Some of thetime
A good bit of thetime
Most of thetime
All of the time
2011 2012 2013Percent
2013 Wounded Warrior Project Survey Results 58
HEIGHT AND WEIGHT. Results for mean height, weight, and body mass index (BMI) are the same as or similar to those in 2012 and 2011. The average (mean) height and weight among 2013 alumni are 5’10” and 204 pounds. The average BMI for alumni is 29.4, which is at the high end of the range for being overweight (BMI = 25 to 29.9). The BMI range for obesity is 30 or greater; 40.8 percent of WWP respondents fall in the obesity range, and another 42.0 percent are overweight. According to age-adjusted data from the National Health and Nutrition Examination Survey (NHANES), 35.7 percent of U.S. adults age 20 and older were obese in 2009-2010 (Ogden, Carroll, Kit, & Flegal, 2012).
In a new study (with Millennium Cohort participants) that examined possible reasons for weight gain after discharge from military service (Littman et al., 2013), researchers found that an increased weight gain at the time of discharge may help to explain reports of high rates of obesity among veterans. They documented weight gain that increased before and around the time of discharge over the course of 6 years and a near tripling of obesity from 12 percent to 31 percent. They also identified various subgroups at higher risk for weight gain after discharge, including younger age, less educated, overweight/obese at time of discharge, active duty versus National Guard/Reserve, women, and deployers with combat experience. They speculate that while in the military the need to meet body weight standards may be stronger than service members’ internal motivation to maintain a healthy weight. As they approach discharge, service members may disregard the weight requirements and start gaining weight. Then, when discharged, they continue to eat as they did in the military even though they may be less physically active.
Littman et al. cited a qualitative study conducted with veterans, mostly veterans from earlier wars (Smith, Klosterbuer, & Levine, 2009), in which the findings seem to reinforce their speculations. The veterans spoke of eating a large amount quickly during military service and continued to do so in civilian life even though they were less active physically. The veterans also spoke of using food to cope with stress and anxiety. Littman and his co-researchers concluded that more information is needed to understand the behaviors that lead to weight gain in this population. They suggest that discharge “presents a window of risk and opportunity to prevent unhealthy weight gain in military personnel and veterans.” In the WWP population, injuries that limit physical activity before and after discharge and stress from emotional problems and the transition to civilian life as wounded warriors are likely to be contributing factors to weight gain.
HEALTH CARE SERVICES
WWP alumni were asked questions about the kinds of medical and mental health services they have received.
HEALTH CARE VISITS FOR SELF. Alumni were asked to report how many times they went to a doctor’s office or clinic to get health care for themselves (not counting times they went to emergency rooms) during the past 3 months. About one-third of alumni reported one to three
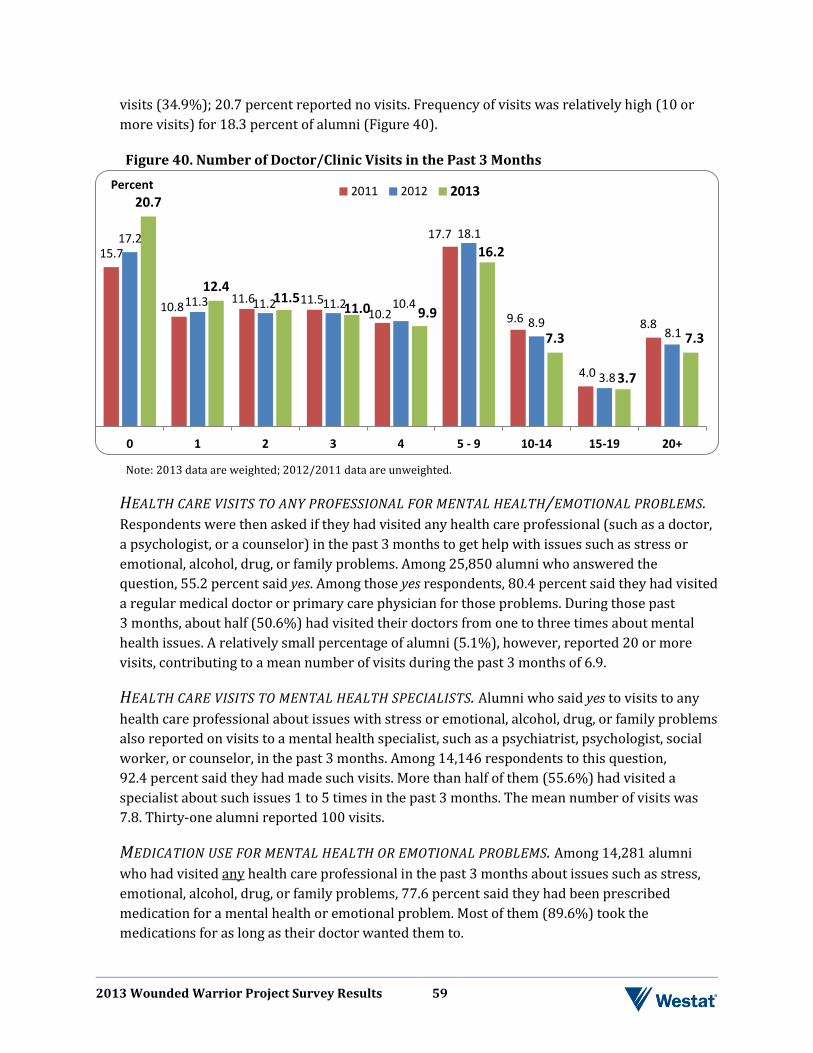
2013 Wounded Warrior Project Survey Results 59
visits (34.9%); 20.7 percent reported no visits. Frequency of visits was relatively high (10 or more visits) for 18.3 percent of alumni (Figure 40).
Figure 40. Number of Doctor/Clinic Visits in the Past 3 Months
Note: 2013 data are weighted; 2012/2011 data are unweighted.
HEALTH CARE VISITS TO ANY PROFESSIONAL FOR MENTAL HEALTH/EMOTIONAL PROBLEMS. Respondents were then asked if they had visited any health care professional (such as a doctor, a psychologist, or a counselor) in the past 3 months to get help with issues such as stress or emotional, alcohol, drug, or family problems. Among 25,850 alumni who answered the question, 55.2 percent said yes. Among those yes respondents, 80.4 percent said they had visited a regular medical doctor or primary care physician for those problems. During those past 3 months, about half (50.6%) had visited their doctors from one to three times about mental health issues. A relatively small percentage of alumni (5.1%), however, reported 20 or more visits, contributing to a mean number of visits during the past 3 months of 6.9.
HEALTH CARE VISITS TO MENTAL HEALTH SPECIALISTS. Alumni who said yes to visits to any health care professional about issues with stress or emotional, alcohol, drug, or family problems also reported on visits to a mental health specialist, such as a psychiatrist, psychologist, social worker, or counselor, in the past 3 months. Among 14,146 respondents to this question, 92.4 percent said they had made such visits. More than half of them (55.6%) had visited a specialist about such issues 1 to 5 times in the past 3 months. The mean number of visits was 7.8. Thirty-one alumni reported 100 visits.
MEDICATION USE FOR MENTAL HEALTH OR EMOTIONAL PROBLEMS. Among 14,281 alumni who had visited any health care professional in the past 3 months about issues such as stress, emotional, alcohol, drug, or family problems, 77.6 percent said they had been prescribed medication for a mental health or emotional problem. Most of them (89.6%) took the medications for as long as their doctor wanted them to.
15.7
10.8 11.6 11.5
10.2
17.7
9.6
4.0
8.8
17.2
11.3 11.2 11.2 10.4
18.1
8.9
3.8
8.1
20.7
12.4 11.5
11.0 9.9
16.2
7.3
3.7
7.3
0 1 2 3 4 5 - 9 10-14 15-19 20+
2011 2012 2013Percent
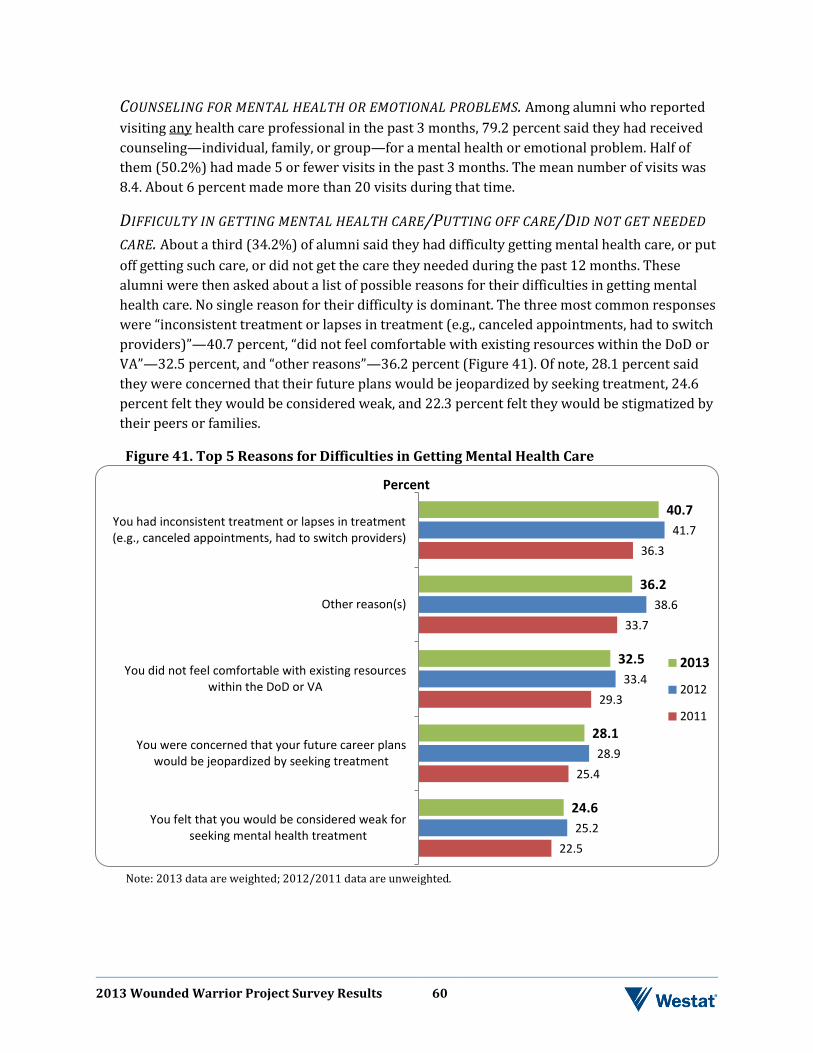
2013 Wounded Warrior Project Survey Results 60
COUNSELING FOR MENTAL HEALTH OR EMOTIONAL PROBLEMS. Among alumni who reported visiting any health care professional in the past 3 months, 79.2 percent said they had received counseling—individual, family, or group—for a mental health or emotional problem. Half of them (50.2%) had made 5 or fewer visits in the past 3 months. The mean number of visits was 8.4. About 6 percent made more than 20 visits during that time.
DIFFICULTY IN GETTING MENTAL HEALTH CARE/PUTTING OFF CARE/DID NOT GET NEEDED
CARE. About a third (34.2%) of alumni said they had difficulty getting mental health care, or put off getting such care, or did not get the care they needed during the past 12 months. These alumni were then asked about a list of possible reasons for their difficulties in getting mental health care. No single reason for their difficulty is dominant. The three most common responses were “inconsistent treatment or lapses in treatment (e.g., canceled appointments, had to switch providers)”—40.7 percent, “did not feel comfortable with existing resources within the DoD or VA”—32.5 percent, and “other reasons”—36.2 percent (Figure 41). Of note, 28.1 percent said they were concerned that their future plans would be jeopardized by seeking treatment, 24.6 percent felt they would be considered weak, and 22.3 percent felt they would be stigmatized by their peers or families.
Figure 41. Top 5 Reasons for Difficulties in Getting Mental Health Care
Note: 2013 data are weighted; 2012/2011 data are unweighted.
22.5
25.4
29.3
33.7
36.3
25.2
28.9
33.4
38.6
41.7
24.6
28.1
32.5
36.2
40.7
You felt that you would be considered weak forseeking mental health treatment
You were concerned that your future career planswould be jeopardized by seeking treatment
You did not feel comfortable with existing resourceswithin the DoD or VA
Other reason(s)
You had inconsistent treatment or lapses in treatment(e.g., canceled appointments, had to switch providers)
2013
2012
2011
Percent
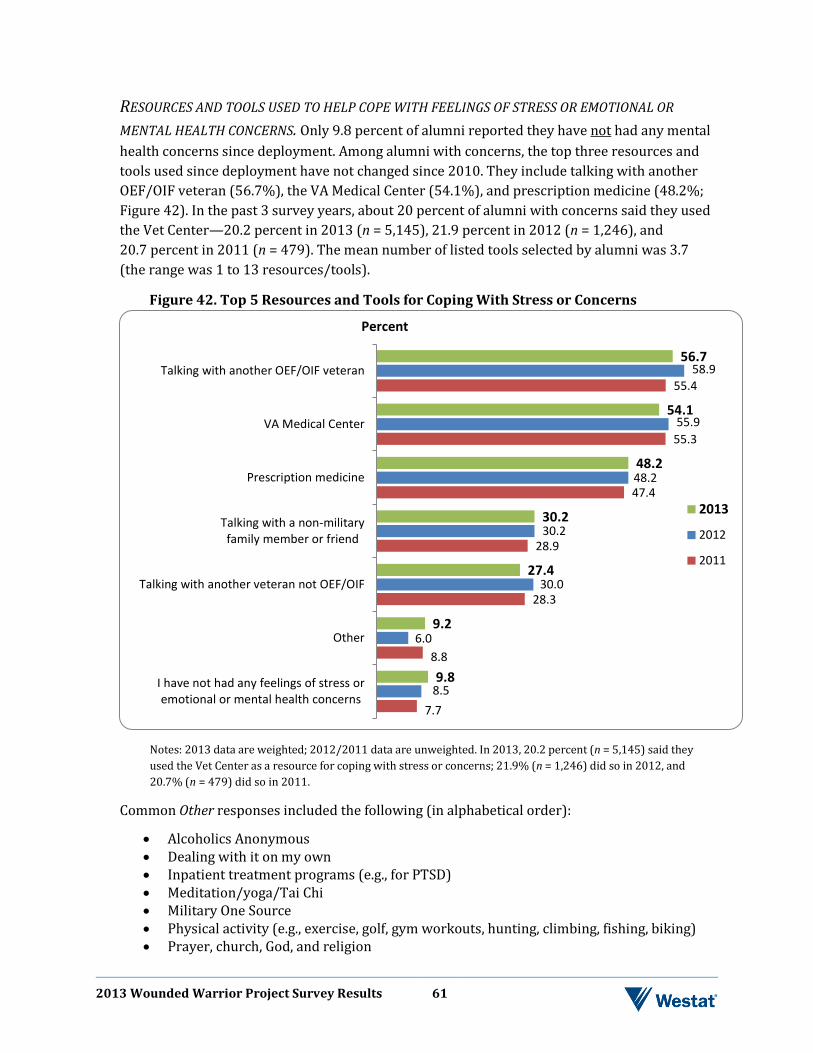
2013 Wounded Warrior Project Survey Results 61
RESOURCES AND TOOLS USED TO HELP COPE WITH FEELINGS OF STRESS OR EMOTIONAL OR
MENTAL HEALTH CONCERNS. Only 9.8 percent of alumni reported they have not had any mental health concerns since deployment. Among alumni with concerns, the top three resources and tools used since deployment have not changed since 2010. They include talking with another OEF/OIF veteran (56.7%), the VA Medical Center (54.1%), and prescription medicine (48.2%; Figure 42). In the past 3 survey years, about 20 percent of alumni with concerns said they used the Vet Center—20.2 percent in 2013 (n = 5,145), 21.9 percent in 2012 (n = 1,246), and 20.7 percent in 2011 (n = 479). The mean number of listed tools selected by alumni was 3.7 (the range was 1 to 13 resources/tools).
Figure 42. Top 5 Resources and Tools for Coping With Stress or Concerns
Notes: 2013 data are weighted; 2012/2011 data are unweighted. In 2013, 20.2 percent (n = 5,145) said they used the Vet Center as a resource for coping with stress or concerns; 21.9% (n = 1,246) did so in 2012, and 20.7% (n = 479) did so in 2011.
Common Other responses included the following (in alphabetical order):
• Alcoholics Anonymous • Dealing with it on my own • Inpatient treatment programs (e.g., for PTSD) • Meditation/yoga/Tai Chi • Military One Source • Physical activity (e.g., exercise, golf, gym workouts, hunting, climbing, fishing, biking) • Prayer, church, God, and religion
7.7
8.8
28.3
28.9
47.4
55.3
55.4
8.5
6.0
30.0
30.2
48.2
55.9
58.9
9.8
9.2
27.4
30.2
48.2
54.1
56.7
I have not had any feelings of stress oremotional or mental health concerns
Other
Talking with another veteran not OEF/OIF
Talking with a non-militaryfamily member or friend
Prescription medicine
VA Medical Center
Talking with another OEF/OIF veteran
Percent
2013
2012
2011
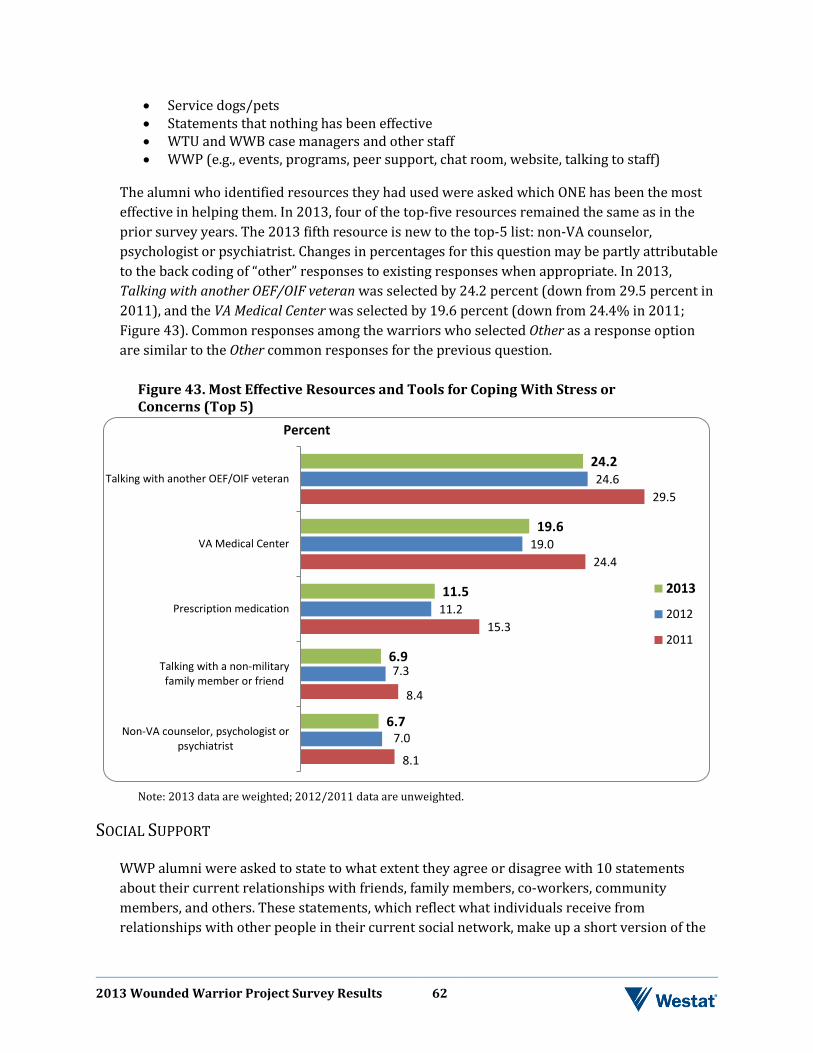
2013 Wounded Warrior Project Survey Results 62
• Service dogs/pets • Statements that nothing has been effective • WTU and WWB case managers and other staff • WWP (e.g., events, programs, peer support, chat room, website, talking to staff)
The alumni who identified resources they had used were asked which ONE has been the most effective in helping them. In 2013, four of the top-five resources remained the same as in the prior survey years. The 2013 fifth resource is new to the top-5 list: non-VA counselor, psychologist or psychiatrist. Changes in percentages for this question may be partly attributable to the back coding of “other” responses to existing responses when appropriate. In 2013, Talking with another OEF/OIF veteran was selected by 24.2 percent (down from 29.5 percent in 2011), and the VA Medical Center was selected by 19.6 percent (down from 24.4% in 2011; Figure 43). Common responses among the warriors who selected Other as a response option are similar to the Other common responses for the previous question.
Figure 43. Most Effective Resources and Tools for Coping With Stress or Concerns (Top 5)
Note: 2013 data are weighted; 2012/2011 data are unweighted.
SOCIAL SUPPORT
WWP alumni were asked to state to what extent they agree or disagree with 10 statements about their current relationships with friends, family members, co-workers, community members, and others. These statements, which reflect what individuals receive from relationships with other people in their current social network, make up a short version of the
8.1
8.4
15.3
24.4
29.5
7.0
7.3
11.2
19.0
24.6
6.7
6.9
11.5
19.6
24.2
Non-VA counselor, psychologist orpsychiatrist
Talking with a non-militaryfamily member or friend
Prescription medication
VA Medical Center
Talking with another OEF/OIF veteran
Percent
2013
2012
2011
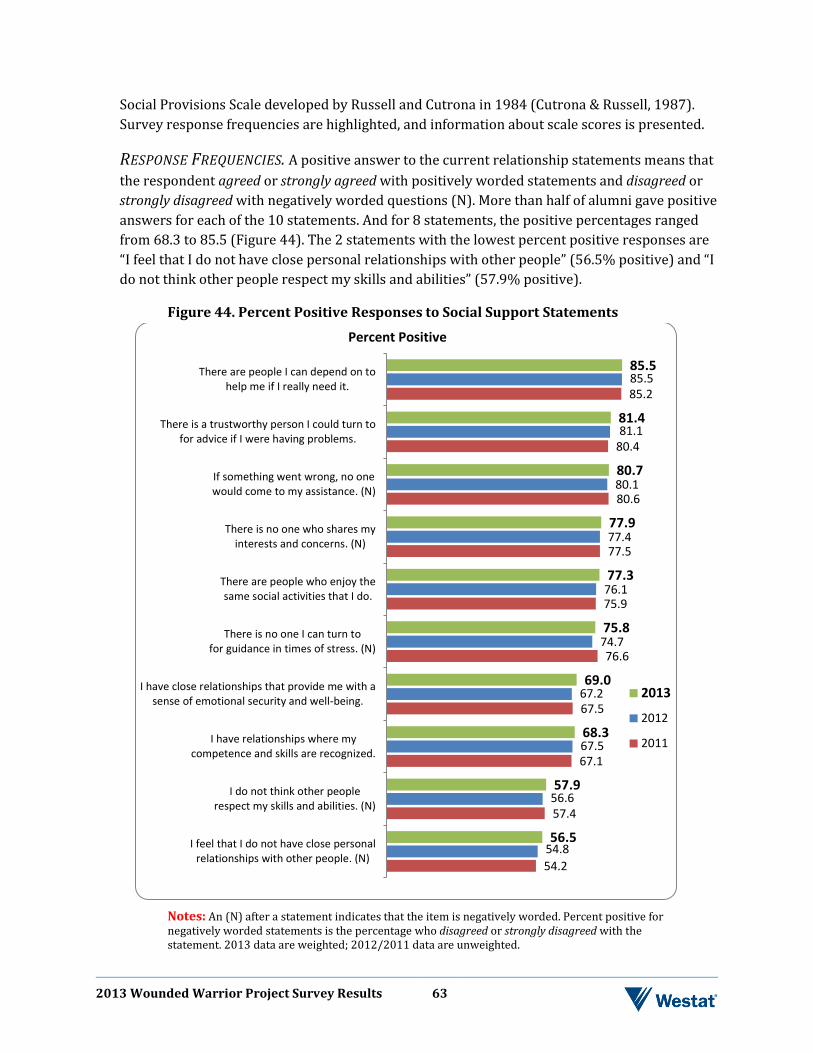
2013 Wounded Warrior Project Survey Results 63
Social Provisions Scale developed by Russell and Cutrona in 1984 (Cutrona & Russell, 1987). Survey response frequencies are highlighted, and information about scale scores is presented.
RESPONSE FREQUENCIES. A positive answer to the current relationship statements means that the respondent agreed or strongly agreed with positively worded statements and disagreed or strongly disagreed with negatively worded questions (N). More than half of alumni gave positive answers for each of the 10 statements. And for 8 statements, the positive percentages ranged from 68.3 to 85.5 (Figure 44). The 2 statements with the lowest percent positive responses are “I feel that I do not have close personal relationships with other people” (56.5% positive) and “I do not think other people respect my skills and abilities” (57.9% positive).
Figure 44. Percent Positive Responses to Social Support Statements
Notes: An (N) after a statement indicates that the item is negatively worded. Percent positive for negatively worded statements is the percentage who disagreed or strongly disagreed with the statement. 2013 data are weighted; 2012/2011 data are unweighted.
54.2
57.4
67.1
67.5
76.6
75.9
77.5
80.6
80.4
85.2
54.8
56.6
67.5
67.2
74.7
76.1
77.4
80.1
81.1
85.5
56.5
57.9
68.3
69.0
75.8
77.3
77.9
80.7
81.4
85.5
I feel that I do not have close personalrelationships with other people. (N)
I do not think other peoplerespect my skills and abilities. (N)
I have relationships where mycompetence and skills are recognized.
I have close relationships that provide me with asense of emotional security and well-being.
There is no one I can turn tofor guidance in times of stress. (N)
There are people who enjoy thesame social activities that I do.
There is no one who shares myinterests and concerns. (N)
If something went wrong, no onewould come to my assistance. (N)
There is a trustworthy person I could turn tofor advice if I were having problems.
There are people I can depend on tohelp me if I really need it.
2013
2012
2011
Percent Positive
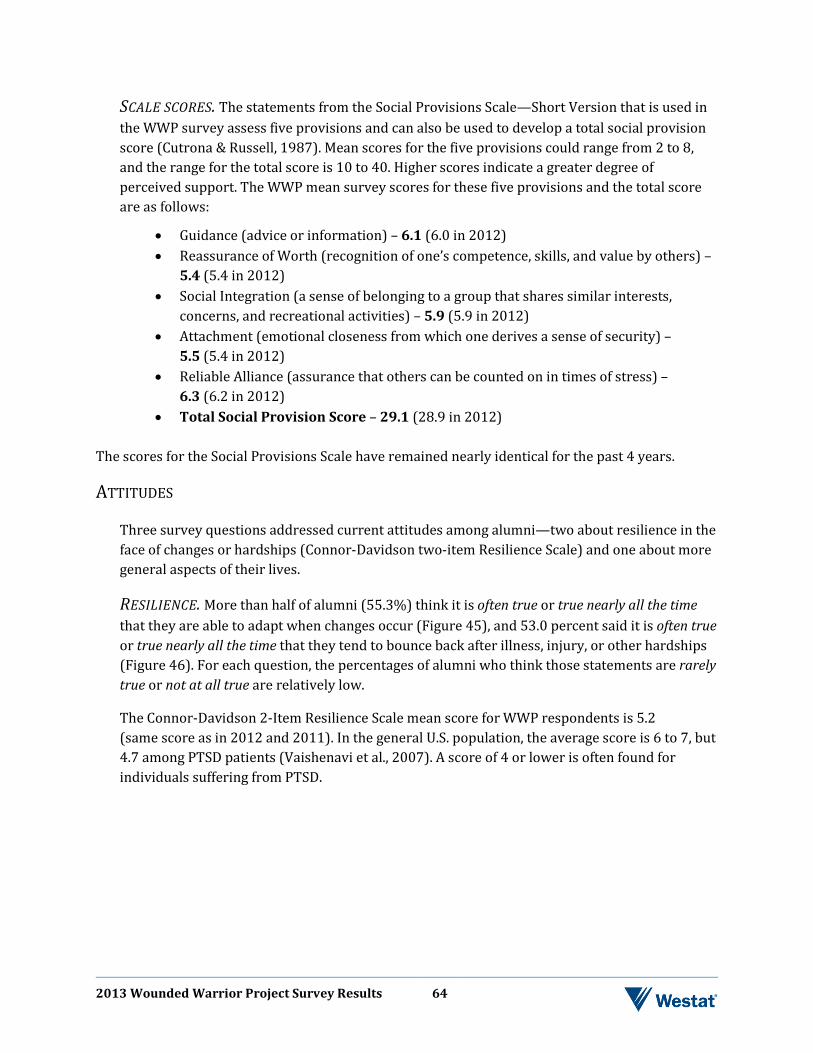
2013 Wounded Warrior Project Survey Results 64
SCALE SCORES. The statements from the Social Provisions Scale—Short Version that is used in the WWP survey assess five provisions and can also be used to develop a total social provision score (Cutrona & Russell, 1987). Mean scores for the five provisions could range from 2 to 8, and the range for the total score is 10 to 40. Higher scores indicate a greater degree of perceived support. The WWP mean survey scores for these five provisions and the total score are as follows:
• Guidance (advice or information) – 6.1 (6.0 in 2012) • Reassurance of Worth (recognition of one’s competence, skills, and value by others) –
5.4 (5.4 in 2012) • Social Integration (a sense of belonging to a group that shares similar interests,
concerns, and recreational activities) – 5.9 (5.9 in 2012) • Attachment (emotional closeness from which one derives a sense of security) –
5.5 (5.4 in 2012) • Reliable Alliance (assurance that others can be counted on in times of stress) –
6.3 (6.2 in 2012) • Total Social Provision Score – 29.1 (28.9 in 2012)
The scores for the Social Provisions Scale have remained nearly identical for the past 4 years.
ATTITUDES
Three survey questions addressed current attitudes among alumni—two about resilience in the face of changes or hardships (Connor-Davidson two-item Resilience Scale) and one about more general aspects of their lives.
RESILIENCE. More than half of alumni (55.3%) think it is often true or true nearly all the time that they are able to adapt when changes occur (Figure 45), and 53.0 percent said it is often true or true nearly all the time that they tend to bounce back after illness, injury, or other hardships (Figure 46). For each question, the percentages of alumni who think those statements are rarely true or not at all true are relatively low.
The Connor-Davidson 2-Item Resilience Scale mean score for WWP respondents is 5.2 (same score as in 2012 and 2011). In the general U.S. population, the average score is 6 to 7, but 4.7 among PTSD patients (Vaishenavi et al., 2007). A score of 4 or lower is often found for individuals suffering from PTSD.
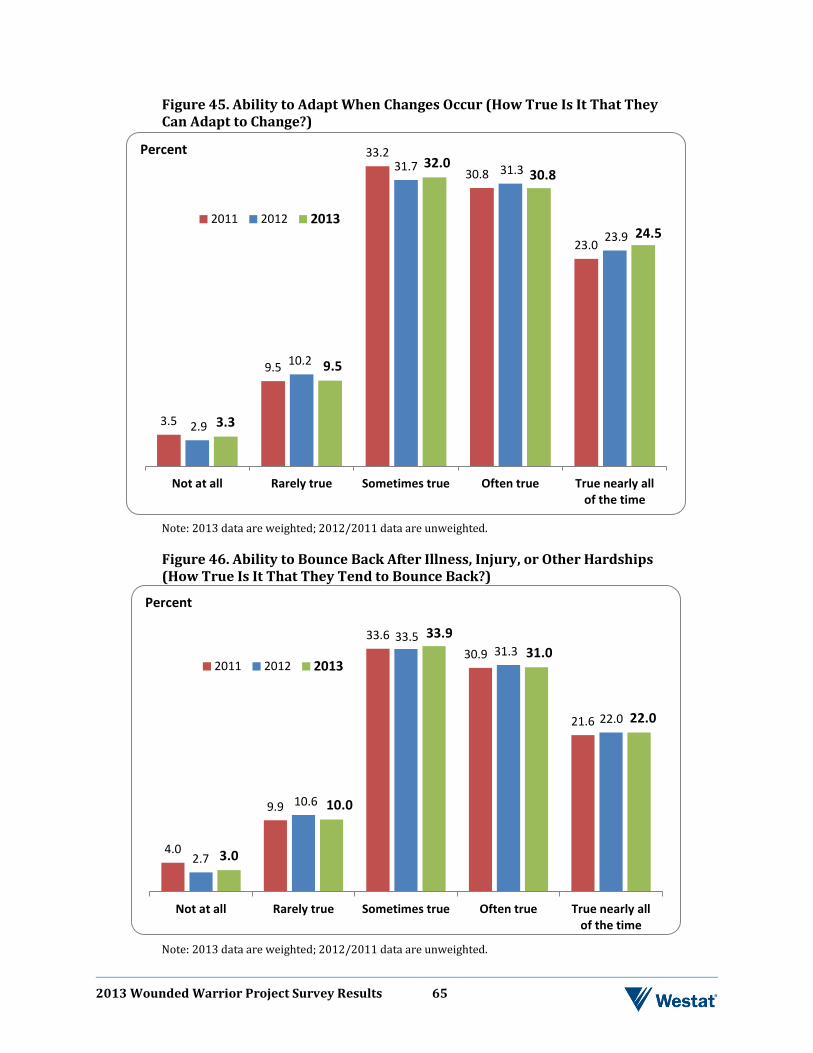
2013 Wounded Warrior Project Survey Results 65
Figure 45. Ability to Adapt When Changes Occur (How True Is It That They Can Adapt to Change?)
Note: 2013 data are weighted; 2012/2011 data are unweighted.
Figure 46. Ability to Bounce Back After Illness, Injury, or Other Hardships (How True Is It That They Tend to Bounce Back?)
Note: 2013 data are weighted; 2012/2011 data are unweighted.
3.5
9.5
33.2
30.8
23.0
2.9
10.2
31.7 31.3
23.9
3.3
9.5
32.0 30.8
24.5
Not at all Rarely true Sometimes true Often true True nearly allof the time
2011 2012 2013
Percent
4.0
9.9
33.6 30.9
21.6
2.7
10.6
33.5 31.3
22.0
3.0
10.0
33.9 31.0
22.0
Not at all Rarely true Sometimes true Often true True nearly allof the time
2011 2012 2013
Percent
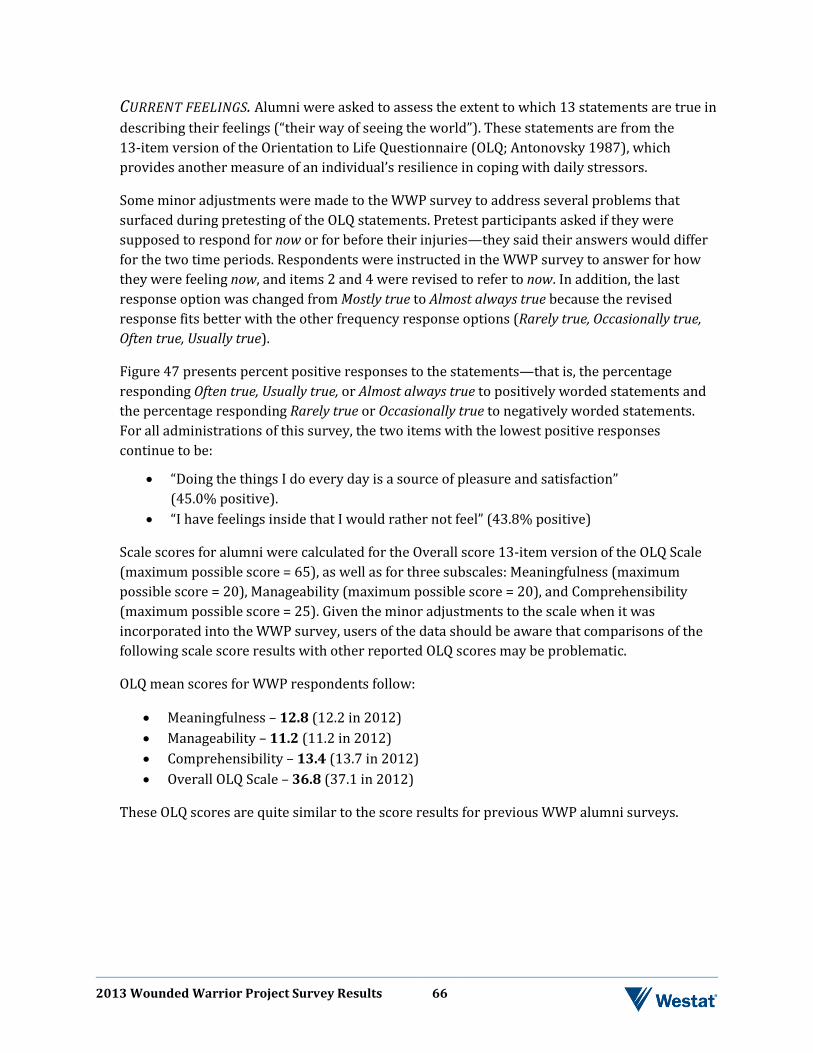
2013 Wounded Warrior Project Survey Results 66
CURRENT FEELINGS. Alumni were asked to assess the extent to which 13 statements are true in describing their feelings (“their way of seeing the world”). These statements are from the 13-item version of the Orientation to Life Questionnaire (OLQ; Antonovsky 1987), which provides another measure of an individual’s resilience in coping with daily stressors.
Some minor adjustments were made to the WWP survey to address several problems that surfaced during pretesting of the OLQ statements. Pretest participants asked if they were supposed to respond for now or for before their injuries—they said their answers would differ for the two time periods. Respondents were instructed in the WWP survey to answer for how they were feeling now, and items 2 and 4 were revised to refer to now. In addition, the last response option was changed from Mostly true to Almost always true because the revised response fits better with the other frequency response options (Rarely true, Occasionally true, Often true, Usually true).
Figure 47 presents percent positive responses to the statements—that is, the percentage responding Often true, Usually true, or Almost always true to positively worded statements and the percentage responding Rarely true or Occasionally true to negatively worded statements. For all administrations of this survey, the two items with the lowest positive responses continue to be:
• “Doing the things I do every day is a source of pleasure and satisfaction” (45.0% positive).
• “I have feelings inside that I would rather not feel” (43.8% positive)
Scale scores for alumni were calculated for the Overall score 13-item version of the OLQ Scale (maximum possible score = 65), as well as for three subscales: Meaningfulness (maximum possible score = 20), Manageability (maximum possible score = 20), and Comprehensibility (maximum possible score = 25). Given the minor adjustments to the scale when it was incorporated into the WWP survey, users of the data should be aware that comparisons of the following scale score results with other reported OLQ scores may be problematic.
OLQ mean scores for WWP respondents follow:
• Meaningfulness – 12.8 (12.2 in 2012) • Manageability – 11.2 (11.2 in 2012) • Comprehensibility – 13.4 (13.7 in 2012) • Overall OLQ Scale – 36.8 (37.1 in 2012)
These OLQ scores are quite similar to the score results for previous WWP alumni surveys.
2013 Wounded Warrior Project Survey Results 67
Figure 47. Percent Positive Responses to Descriptions of Feelings
Notes: An (N) after the statement indicates that the item is negatively worded. Percent positive for negatively worded statements is the percentage who answered Rarely true or Occasionally true to the statement. 2013 data are weighted; 2012/2011 data are unweighted.
40.7
42.7
46.8
50.1
57.3
58.8
55.0
58.8
58.9
61.3
65.6
66.0
70.5
40.6
43.6
48.0
52.0
56.2
56.9
57.0
58.3
59.2
62.6
64.9
65.8
69.9
43.8
45.0
50.5
54.2
57.4
58.2
58.7
60.7
61.2
63.1
66.4
67.4
71.0
I have feelings inside that I wouldrather not feel. (N)
Doing the things I do every day is asource of pleasure and satisfaction.
I have very mixed feelings and ideas. (N)
My life has very clear goals and purposes.
People whom I’ve counted on have disappointed me. (N)
I am surprised by the behavior of peoplewhom I thought I knew well. (N)
Many people, even those with strong character, sometimes feel like losers in certain situations. I’ve felt like a “loser” in certain situations. (N)
I have the feeling that I don’t really care about what goes on around me. (N)
I have the feeling that there’s little meaning in the things I do in my daily life. (N)
When something happens, I have generallyfound that I overestimate its importance. (N)
I have feelings that I’m not sure I can keep under control. (N)
I have the feeling that I’m in an unfamiliar situation and don’t know what to do. (N)
I have the feeling that I’m being treated unfairly. (N)
2013
2012
2011
Percent
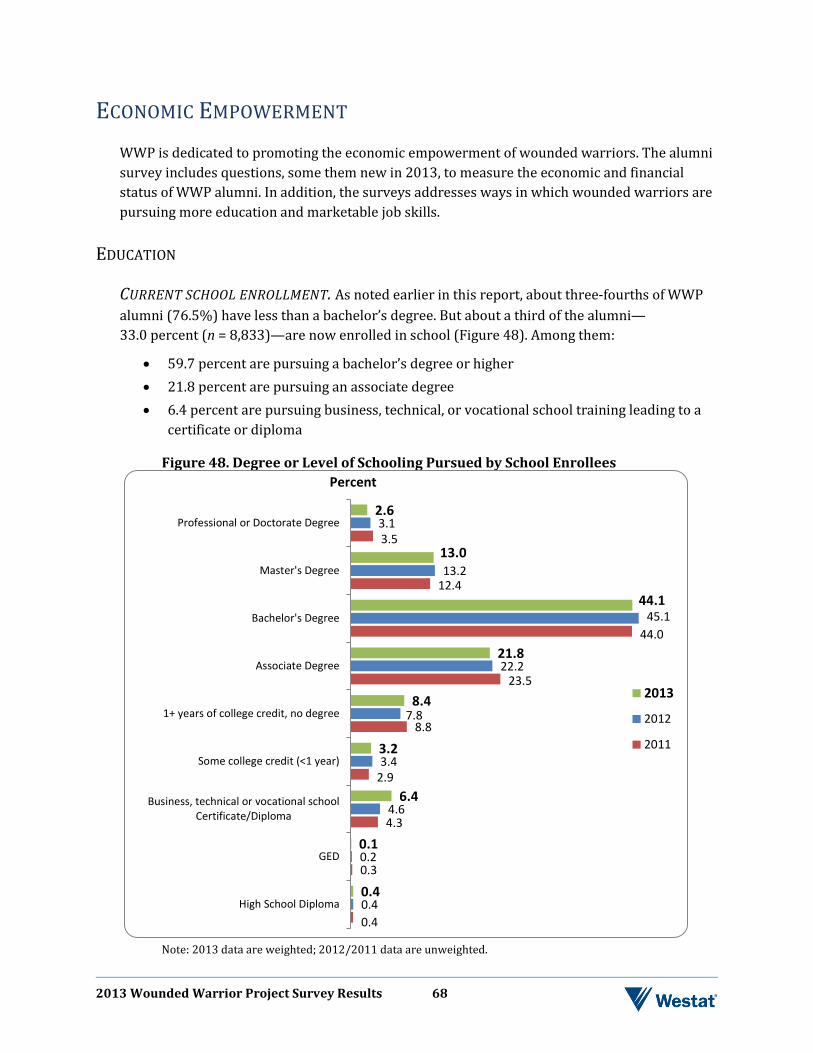
2013 Wounded Warrior Project Survey Results 68
ECONOMIC EMPOWERMENT WWP is dedicated to promoting the economic empowerment of wounded warriors. The alumni survey includes questions, some them new in 2013, to measure the economic and financial status of WWP alumni. In addition, the surveys addresses ways in which wounded warriors are pursuing more education and marketable job skills.
EDUCATION
CURRENT SCHOOL ENROLLMENT. As noted earlier in this report, about three-fourths of WWP alumni (76.5%) have less than a bachelor’s degree. But about a third of the alumni—33.0 percent (n = 8,833)—are now enrolled in school (Figure 48). Among them:
• 59.7 percent are pursuing a bachelor’s degree or higher • 21.8 percent are pursuing an associate degree • 6.4 percent are pursuing business, technical, or vocational school training leading to a
certificate or diploma
Figure 48. Degree or Level of Schooling Pursued by School Enrollees
Note: 2013 data are weighted; 2012/2011 data are unweighted.
0.4
0.3
4.3
2.9
8.8
23.5
44.0
12.4
3.5
0.4
0.2
4.6
3.4
7.8
22.2
45.1
13.2
3.1
0.4
0.1
6.4
3.2
8.4
21.8
44.1
13.0
2.6
High School Diploma
GED
Business, technical or vocational schoolCertificate/Diploma
Some college credit (<1 year)
1+ years of college credit, no degree
Associate Degree
Bachelor's Degree
Master's Degree
Professional or Doctorate Degree
Percent
2013
2012
2011
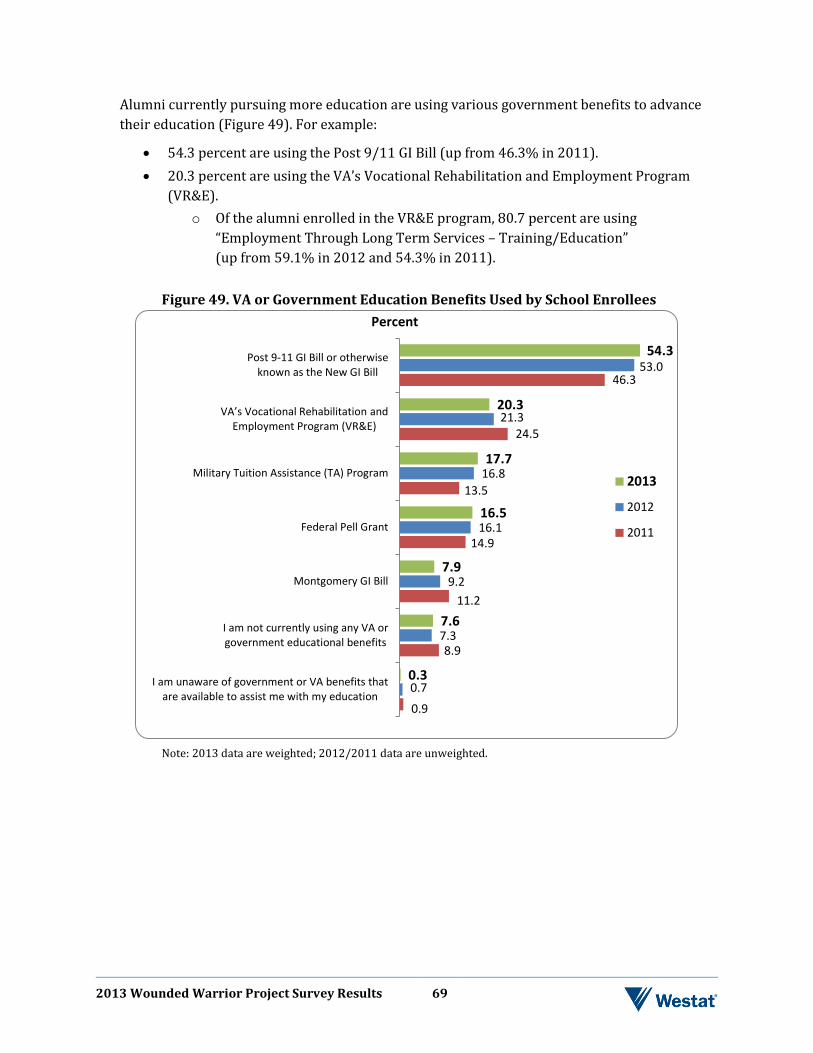
2013 Wounded Warrior Project Survey Results 69
Alumni currently pursuing more education are using various government benefits to advance their education (Figure 49). For example:
• 54.3 percent are using the Post 9/11 GI Bill (up from 46.3% in 2011). • 20.3 percent are using the VA’s Vocational Rehabilitation and Employment Program
(VR&E). o Of the alumni enrolled in the VR&E program, 80.7 percent are using
“Employment Through Long Term Services – Training/Education” (up from 59.1% in 2012 and 54.3% in 2011).
Figure 49. VA or Government Education Benefits Used by School Enrollees
Note: 2013 data are weighted; 2012/2011 data are unweighted.
0.9
8.9
11.2
14.9
13.5
24.5
46.3
0.7
7.3
9.2
16.1
16.8
21.3
53.0
0.3
7.6
7.9
16.5
17.7
20.3
54.3
I am unaware of government or VA benefits thatare available to assist me with my education
I am not currently using any VA orgovernment educational benefits
Montgomery GI Bill
Federal Pell Grant
Military Tuition Assistance (TA) Program
VA’s Vocational Rehabilitation and Employment Program (VR&E)
Post 9-11 GI Bill or otherwiseknown as the New GI Bill
Percent
2013
2012
2011
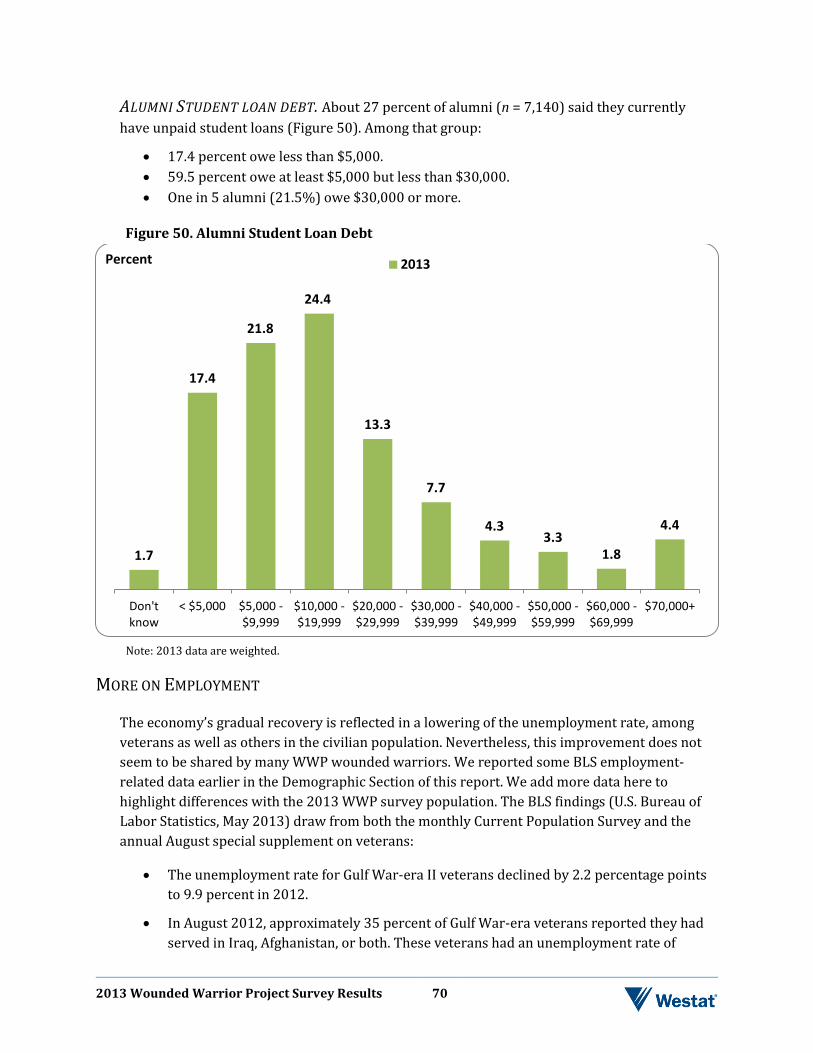
2013 Wounded Warrior Project Survey Results 70
ALUMNI STUDENT LOAN DEBT. About 27 percent of alumni (n = 7,140) said they currently have unpaid student loans (Figure 50). Among that group:
• 17.4 percent owe less than $5,000. • 59.5 percent owe at least $5,000 but less than $30,000. • One in 5 alumni (21.5%) owe $30,000 or more.
Figure 50. Alumni Student Loan Debt
Note: 2013 data are weighted.
MORE ON EMPLOYMENT
The economy’s gradual recovery is reflected in a lowering of the unemployment rate, among veterans as well as others in the civilian population. Nevertheless, this improvement does not seem to be shared by many WWP wounded warriors. We reported some BLS employment-related data earlier in the Demographic Section of this report. We add more data here to highlight differences with the 2013 WWP survey population. The BLS findings (U.S. Bureau of Labor Statistics, May 2013) draw from both the monthly Current Population Survey and the annual August special supplement on veterans:
• The unemployment rate for Gulf War-era II veterans declined by 2.2 percentage points to 9.9 percent in 2012.
• In August 2012, approximately 35 percent of Gulf War-era veterans reported they had served in Iraq, Afghanistan, or both. These veterans had an unemployment rate of
1.7
17.4
21.8
24.4
13.3
7.7
4.3 3.3
1.8
4.4
Don'tknow
< $5,000 $5,000 -$9,999
$10,000 -$19,999
$20,000 -$29,999
$30,000 -$39,999
$40,000 -$49,999
$50,000 -$59,999
$60,000 -$69,999
$70,000+
2013Percent
2013 Wounded Warrior Project Survey Results 71
10.9 percent in August 2012 (similar to the rate for those serving elsewhere—11.3 percent).
• Gulf War-era veterans who were current or past members of the National Guard or Reserve had an unemployment rate of 7.2 percent, in contrast to a rate of 13.7 percent for those veterans who had not been members of the National Guard or Reserve.
• Twenty-eight percent of Gulf War-era II veterans reported having a service-connected disability in August 2012.
UNEMPLOYED. As noted earlier in this report, 17.4 percent of alumni are unemployed, a much higher rate than the 9.9 percent rate reported by the BLS for Gulf War-era II veterans overall and the 10.9 rate reported for those deployed to Iraq, Afghanistan, or both. Differences are likely due in great part to the fact that to be an eligible WWP alumni, you had to have incurred a physical or mental injury, illness, or wound (not due to misconduct) during military service since September 11. Thus, WWP alumni are not representative of all service members deployed to Iraq or Afghanistan during that time. The health problems of WWP alumni create additional employment challenges.
WWP alumni classified as unemployed reported they have been looking for work for an average of 26.6 weeks. More than half the unemployed (55.3%) reported they looked for a job 16 weeks or less. Almost a third of unemployed WWP alumni (32.0%) meet the Bureau of Labor Statistics definition of long-term unemployed (persons who were jobless for 27 weeks or longer), including 7.1 percent of alumni who reported they spent more than 98 weeks looking for work. Although high, the percentage of long-term unemployed among alumni is actually a little lower than the 37.4 percent of unemployed in the civilian population in April 2013 (U.S. Bureau of Labor Statistics, May 2013). The recent recession hurt many nonveteran civilians, particularly prime-age workers, many of whom are still struggling to get back on track with jobs and income.
EMPLOYED. Among alumni working either full time or part time, 4.8 percent are self-employed. Figure 51 shows the distribution of employed wounded warriors by industry. The most common “industries” are the Military (36.9%) and the federal government (18.2%). A total of 26.4 percent work in the public sector (federal, state, and local government).
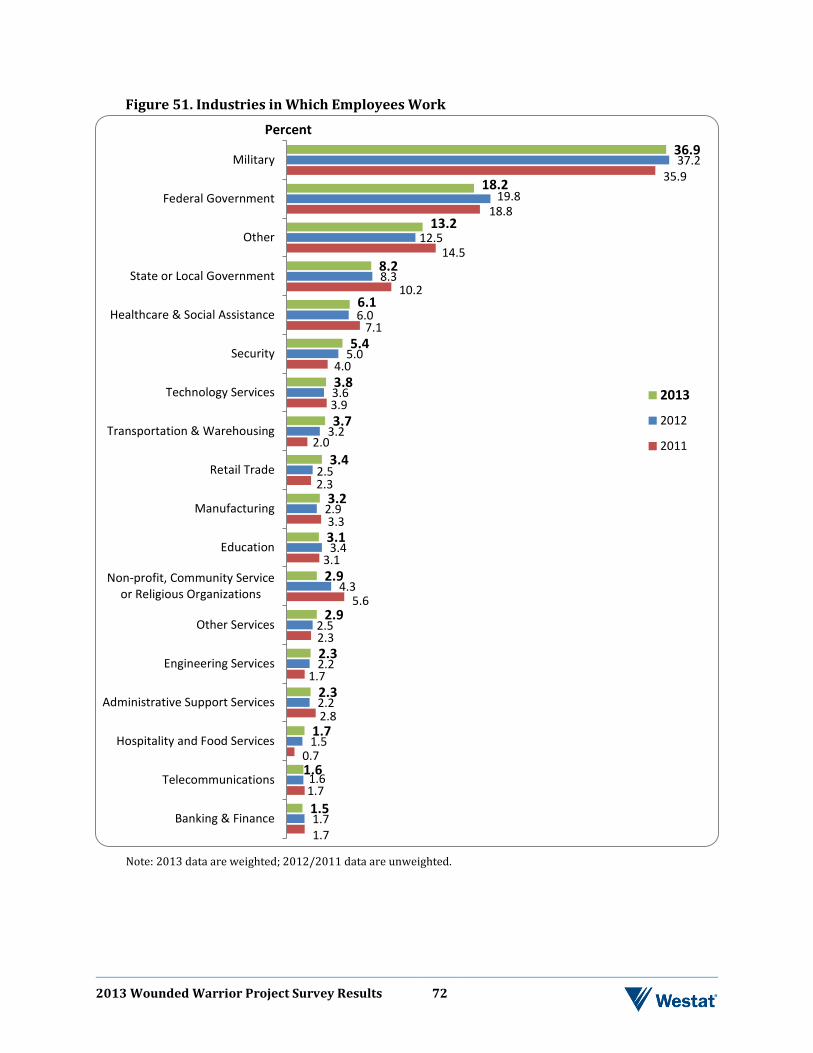
2013 Wounded Warrior Project Survey Results 72
Figure 51. Industries in Which Employees Work
Note: 2013 data are weighted; 2012/2011 data are unweighted.
1.7
1.7
0.7
2.8
1.7
2.3
5.6
3.1
3.3
2.3
2.0
3.9
4.0
7.1
10.2
14.5
18.8
35.9
1.7
1.6
1.5
2.2
2.2
2.5
4.3
3.4
2.9
2.5
3.2
3.6
5.0
6.0
8.3
12.5
19.8
37.2
1.5
1.6
1.7
2.3
2.3
2.9
2.9
3.1
3.2
3.4
3.7
3.8
5.4
6.1
8.2
13.2
18.2
36.9
Banking & Finance
Telecommunications
Hospitality and Food Services
Administrative Support Services
Engineering Services
Other Services
Non-profit, Community Serviceor Religious Organizations
Education
Manufacturing
Retail Trade
Transportation & Warehousing
Technology Services
Security
Healthcare & Social Assistance
State or Local Government
Other
Federal Government
Military
Percent
2013
2012
2011
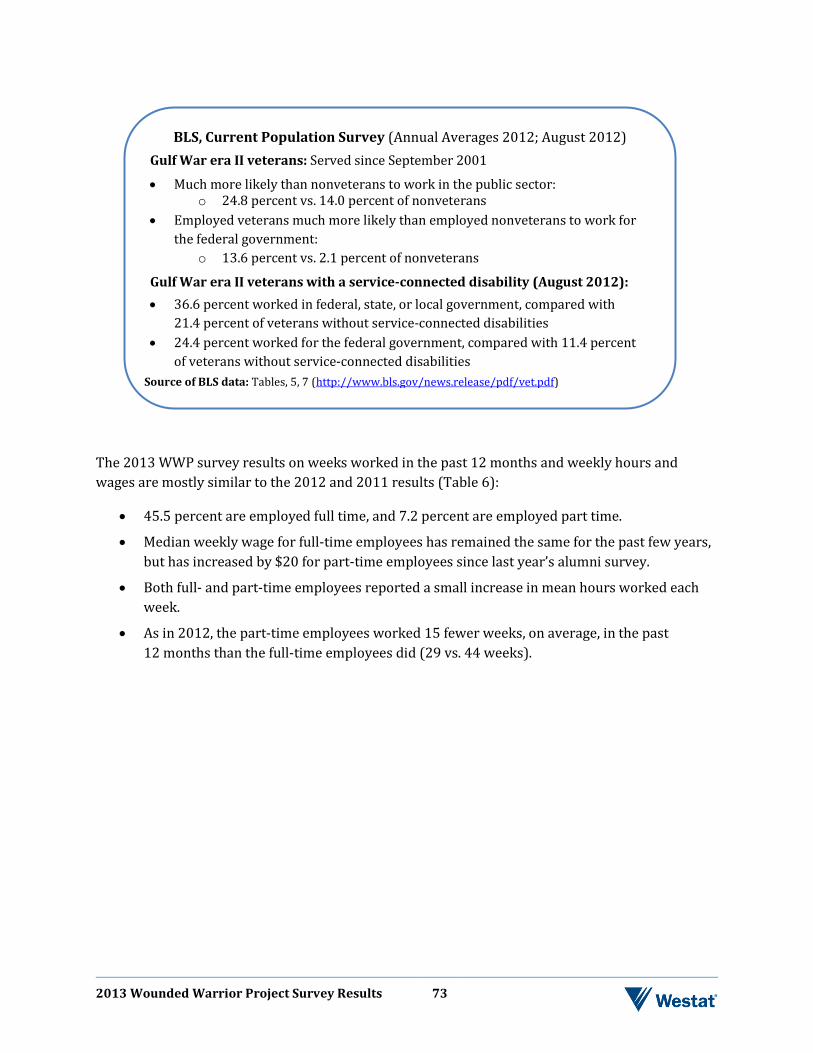
2013 Wounded Warrior Project Survey Results 73
The 2013 WWP survey results on weeks worked in the past 12 months and weekly hours and wages are mostly similar to the 2012 and 2011 results (Table 6):
• 45.5 percent are employed full time, and 7.2 percent are employed part time.
• Median weekly wage for full-time employees has remained the same for the past few years, but has increased by $20 for part-time employees since last year’s alumni survey.
• Both full- and part-time employees reported a small increase in mean hours worked each week.
• As in 2012, the part-time employees worked 15 fewer weeks, on average, in the past 12 months than the full-time employees did (29 vs. 44 weeks).
BLS, Current Population Survey (Annual Averages 2012; August 2012) Gulf War era II veterans: Served since September 2001
• Much more likely than nonveterans to work in the public sector: o 24.8 percent vs. 14.0 percent of nonveterans
• Employed veterans much more likely than employed nonveterans to work for the federal government:
o 13.6 percent vs. 2.1 percent of nonveterans
Gulf War era II veterans with a service-connected disability (August 2012): • 36.6 percent worked in federal, state, or local government, compared with
21.4 percent of veterans without service-connected disabilities • 24.4 percent worked for the federal government, compared with 11.4 percent
of veterans without service-connected disabilities Source of BLS data: Tables, 5, 7 (http://www.bls.gov/news.release/pdf/vet.pdf)
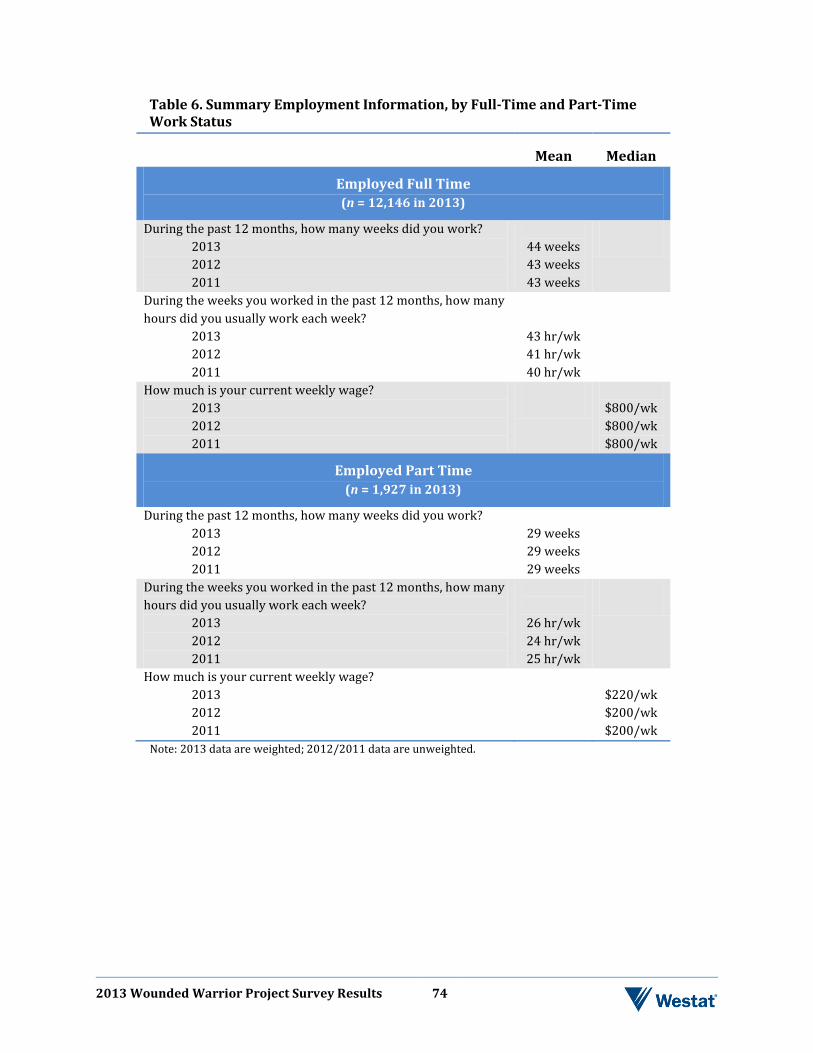
2013 Wounded Warrior Project Survey Results 74
Table 6. Summary Employment Information, by Full-Time and Part-Time Work Status
Mean Median
Employed Full Time (n = 12,146 in 2013)
During the past 12 months, how many weeks did you work? 2013 2012 2011
44 weeks 43 weeks 43 weeks
During the weeks you worked in the past 12 months, how many hours did you usually work each week? 2013 2012 2011
43 hr/wk 41 hr/wk 40 hr/wk
How much is your current weekly wage? 2013 2012 2011
$800/wk $800/wk $800/wk
Employed Part Time (n = 1,927 in 2013)
During the past 12 months, how many weeks did you work? 2013 2012 2011
29 weeks 29 weeks 29 weeks
During the weeks you worked in the past 12 months, how many hours did you usually work each week? 2013 2012 2011
26 hr/wk 24 hr/wk 25 hr/wk
How much is your current weekly wage? 2013 2012 2011
$220/wk $200/wk $200/wk
Note: 2013 data are weighted; 2012/2011 data are unweighted.
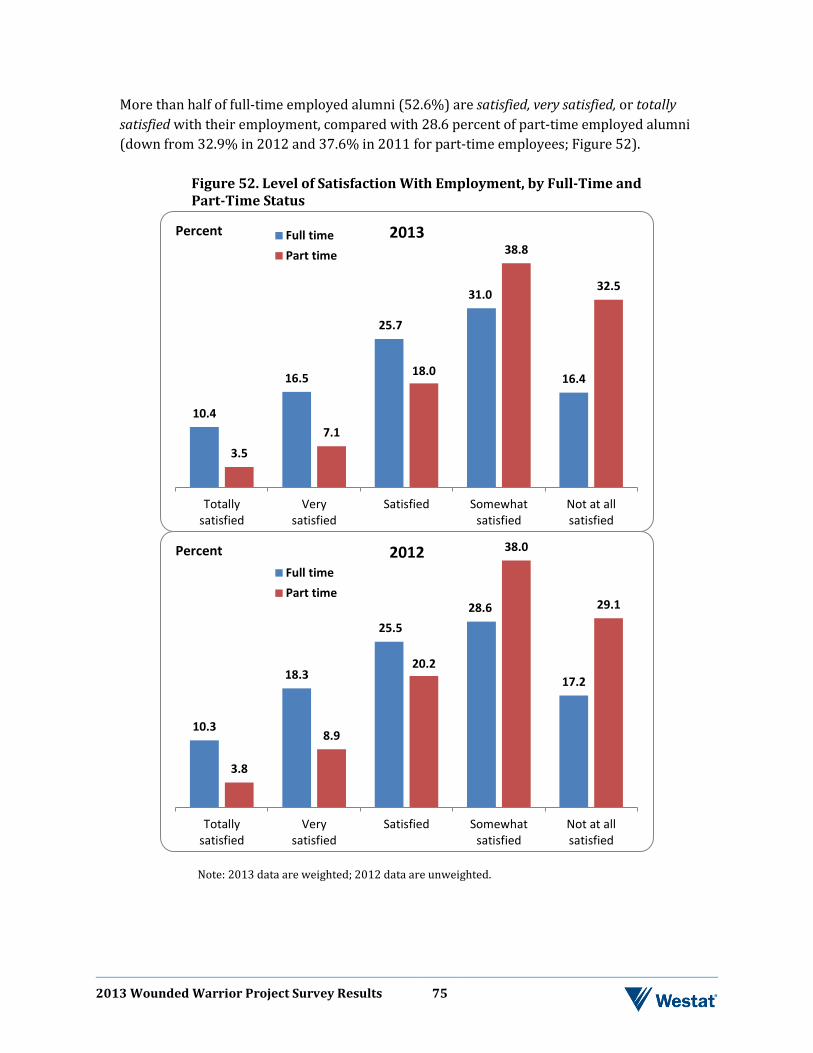
2013 Wounded Warrior Project Survey Results 75
More than half of full-time employed alumni (52.6%) are satisfied, very satisfied, or totally satisfied with their employment, compared with 28.6 percent of part-time employed alumni (down from 32.9% in 2012 and 37.6% in 2011 for part-time employees; Figure 52).
Figure 52. Level of Satisfaction With Employment, by Full-Time and Part-Time Status
Note: 2013 data are weighted; 2012 data are unweighted.
10.4
16.5
25.7
31.0
16.4
3.5 7.1
18.0
38.8
32.5
Totallysatisfied
Verysatisfied
Satisfied Somewhatsatisfied
Not at allsatisfied
2013 Full timePart time
Percent
10.3
18.3
25.5 28.6
17.2
3.8
8.9
20.2
38.0
29.1
Totallysatisfied
Verysatisfied
Satisfied Somewhatsatisfied
Not at allsatisfied
2012 Full timePart time
Percent
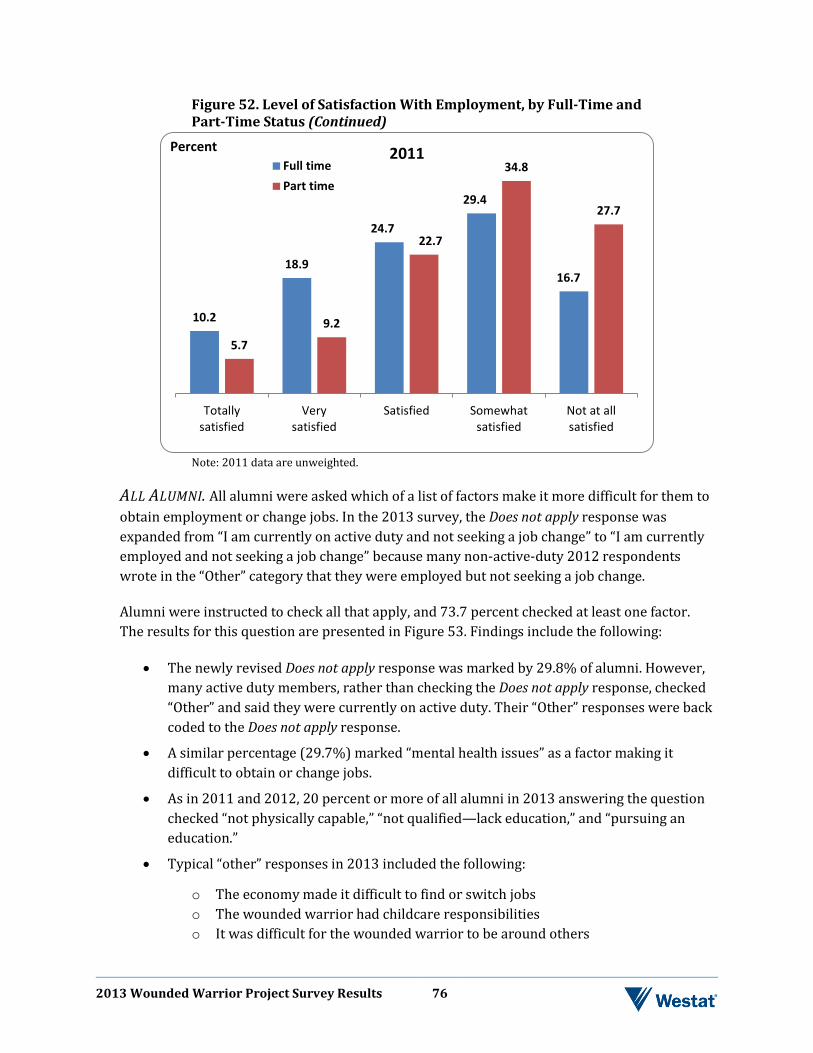
2013 Wounded Warrior Project Survey Results 76
Figure 52. Level of Satisfaction With Employment, by Full-Time and Part-Time Status (Continued)
Note: 2011 data are unweighted.
ALL ALUMNI. All alumni were asked which of a list of factors make it more difficult for them to obtain employment or change jobs. In the 2013 survey, the Does not apply response was expanded from “I am currently on active duty and not seeking a job change” to “I am currently employed and not seeking a job change” because many non-active-duty 2012 respondents wrote in the “Other” category that they were employed but not seeking a job change.
Alumni were instructed to check all that apply, and 73.7 percent checked at least one factor. The results for this question are presented in Figure 53. Findings include the following:
• The newly revised Does not apply response was marked by 29.8% of alumni. However, many active duty members, rather than checking the Does not apply response, checked “Other” and said they were currently on active duty. Their “Other” responses were back coded to the Does not apply response.
• A similar percentage (29.7%) marked “mental health issues” as a factor making it difficult to obtain or change jobs.
• As in 2011 and 2012, 20 percent or more of all alumni in 2013 answering the question checked “not physically capable,” “not qualified—lack education,” and “pursuing an education.”
• Typical “other” responses in 2013 included the following:
o The economy made it difficult to find or switch jobs o The wounded warrior had childcare responsibilities o It was difficult for the wounded warrior to be around others
10.2
18.9
24.7
29.4
16.7
5.7
9.2
22.7
34.8
27.7
Totallysatisfied
Verysatisfied
Satisfied Somewhatsatisfied
Not at allsatisfied
2011 Full timePart time
Percent
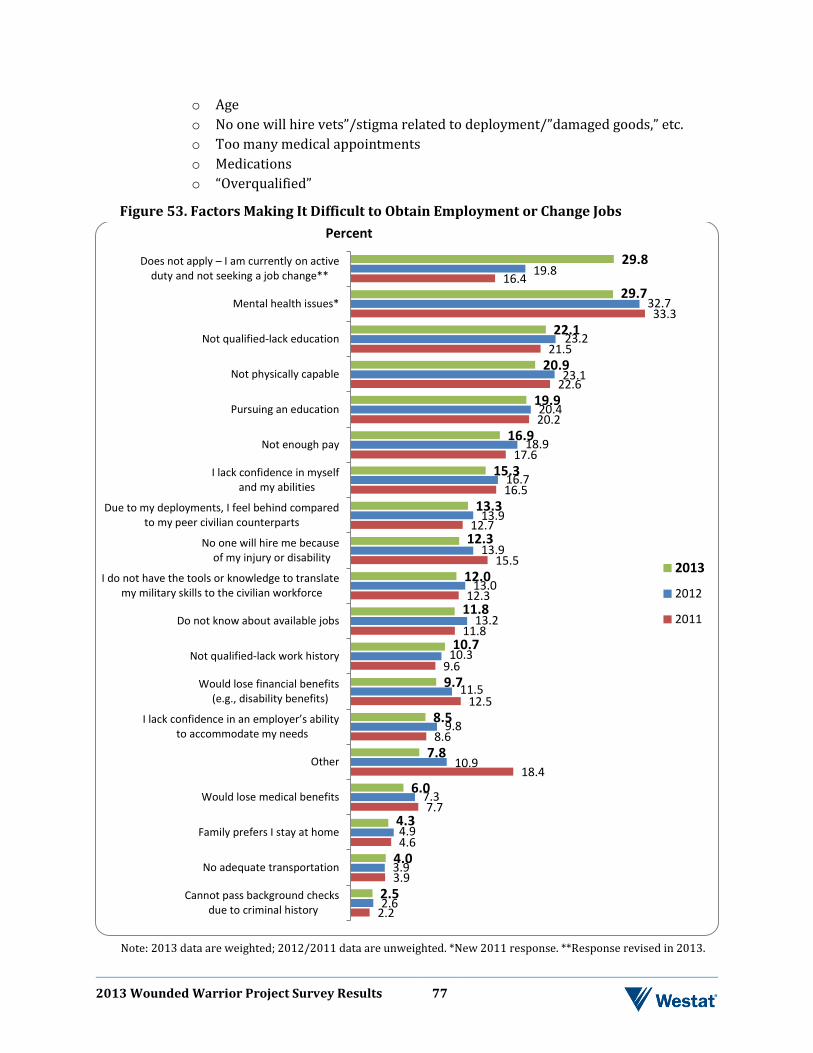
2013 Wounded Warrior Project Survey Results 77
o Age o No one will hire vets”/stigma related to deployment/”damaged goods,” etc. o Too many medical appointments o Medications o “Overqualified”
Figure 53. Factors Making It Difficult to Obtain Employment or Change Jobs
Note: 2013 data are weighted; 2012/2011 data are unweighted. *New 2011 response. **Response revised in 2013.
2.2
3.9
4.6
7.7
18.4
8.6
12.5
9.6
11.8
12.3
15.5
12.7
16.5
17.6
20.2
22.6
21.5
33.3
16.4
2.6
3.9
4.9
7.3
10.9
9.8
11.5
10.3
13.2
13.0
13.9
13.9
16.7
18.9
20.4
23.1
23.2
32.7
19.8
2.5
4.0
4.3
6.0
7.8
8.5
9.7
10.7
11.8
12.0
12.3
13.3
15.3
16.9
19.9
20.9
22.1
29.7
29.8
Cannot pass background checks due to criminal history
No adequate transportation
Family prefers I stay at home
Would lose medical benefits
Other
I lack confidence in an employer’s ability to accommodate my needs
Would lose financial benefits (e.g., disability benefits)
Not qualified-lack work history
Do not know about available jobs
I do not have the tools or knowledge to translate my military skills to the civilian workforce
No one will hire me because of my injury or disability
Due to my deployments, I feel behind comparedto my peer civilian counterparts
I lack confidence in myself and my abilities
Not enough pay
Pursuing an education
Not physically capable
Not qualified-lack education
Mental health issues*
Does not apply – I am currently on active duty and not seeking a job change**
Percent
2013
2012
2011
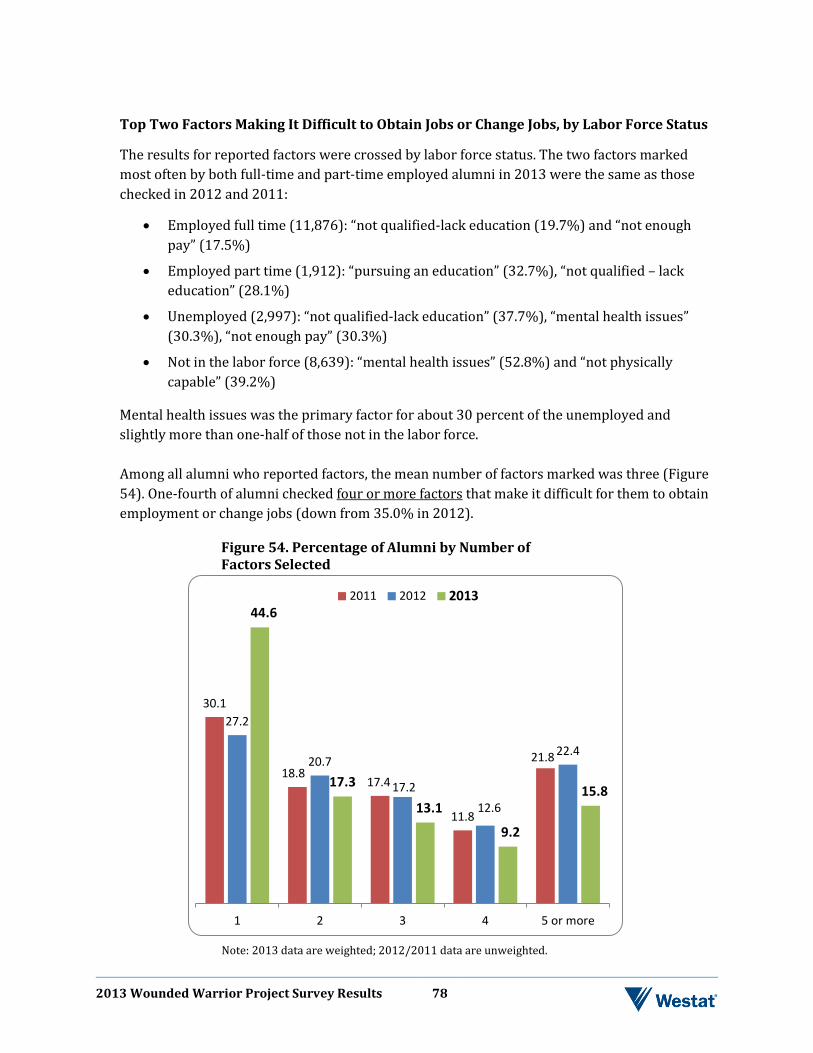
2013 Wounded Warrior Project Survey Results 78
Top Two Factors Making It Difficult to Obtain Jobs or Change Jobs, by Labor Force Status
The results for reported factors were crossed by labor force status. The two factors marked most often by both full-time and part-time employed alumni in 2013 were the same as those checked in 2012 and 2011:
• Employed full time (11,876): “not qualified-lack education (19.7%) and “not enough pay” (17.5%)
• Employed part time (1,912): “pursuing an education” (32.7%), “not qualified – lack education” (28.1%)
• Unemployed (2,997): “not qualified-lack education” (37.7%), “mental health issues” (30.3%), “not enough pay” (30.3%)
• Not in the labor force (8,639): “mental health issues” (52.8%) and “not physically capable” (39.2%)
Mental health issues was the primary factor for about 30 percent of the unemployed and slightly more than one-half of those not in the labor force. Among all alumni who reported factors, the mean number of factors marked was three (Figure 54). One-fourth of alumni checked four or more factors that make it difficult for them to obtain employment or change jobs (down from 35.0% in 2012).
Figure 54. Percentage of Alumni by Number of Factors Selected
Note: 2013 data are weighted; 2012/2011 data are unweighted.
30.1
18.8 17.4
11.8
21.8
27.2
20.7
17.2 12.6
22.4
44.6
17.3
13.1
9.2
15.8
1 2 3 4 5 or more
2011 2012 2013
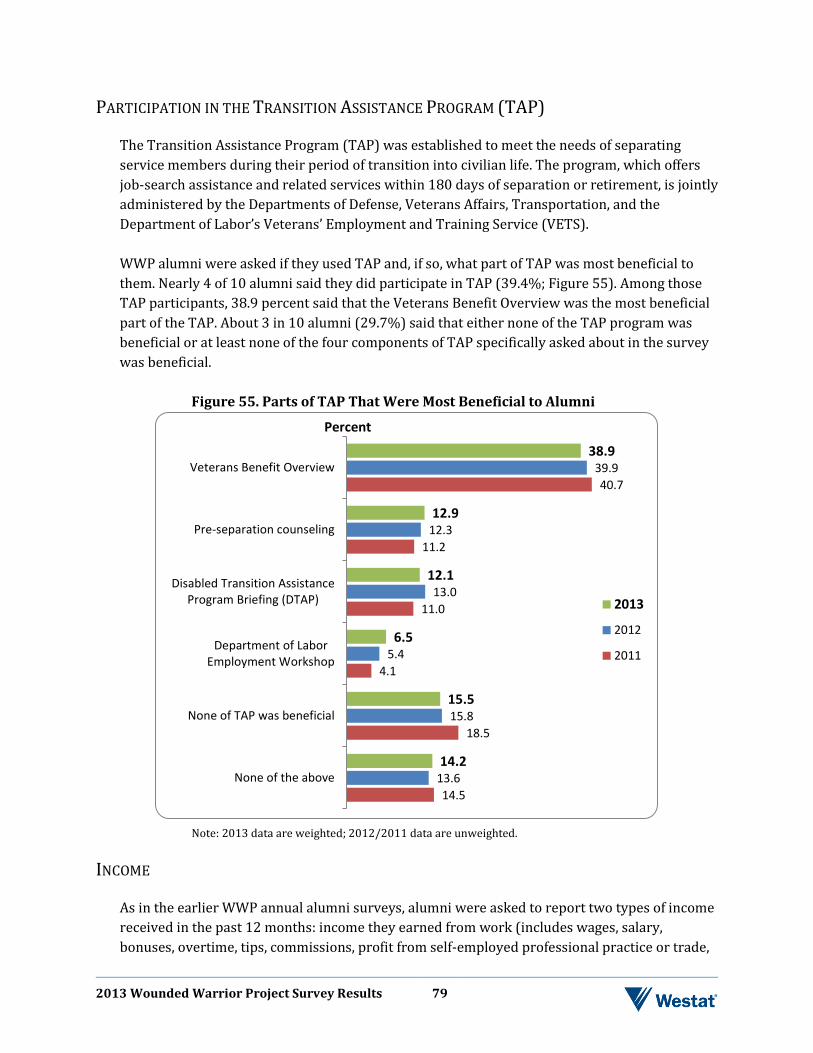
2013 Wounded Warrior Project Survey Results 79
PARTICIPATION IN THE TRANSITION ASSISTANCE PROGRAM (TAP)
The Transition Assistance Program (TAP) was established to meet the needs of separating service members during their period of transition into civilian life. The program, which offers job-search assistance and related services within 180 days of separation or retirement, is jointly administered by the Departments of Defense, Veterans Affairs, Transportation, and the Department of Labor’s Veterans’ Employment and Training Service (VETS). WWP alumni were asked if they used TAP and, if so, what part of TAP was most beneficial to them. Nearly 4 of 10 alumni said they did participate in TAP (39.4%; Figure 55). Among those TAP participants, 38.9 percent said that the Veterans Benefit Overview was the most beneficial part of the TAP. About 3 in 10 alumni (29.7%) said that either none of the TAP program was beneficial or at least none of the four components of TAP specifically asked about in the survey was beneficial.
Figure 55. Parts of TAP That Were Most Beneficial to Alumni
Note: 2013 data are weighted; 2012/2011 data are unweighted.
INCOME
As in the earlier WWP annual alumni surveys, alumni were asked to report two types of income received in the past 12 months: income they earned from work (includes wages, salary, bonuses, overtime, tips, commissions, profit from self-employed professional practice or trade,
14.5
18.5
4.1
11.0
11.2
40.7
13.6
15.8
5.4
13.0
12.3
39.9
14.2
15.5
6.5
12.1
12.9
38.9
None of the above
None of TAP was beneficial
Department of LaborEmployment Workshop
Disabled Transition AssistanceProgram Briefing (DTAP)
Pre-separation counseling
Veterans Benefit Overview
Percent
2013
2012
2011
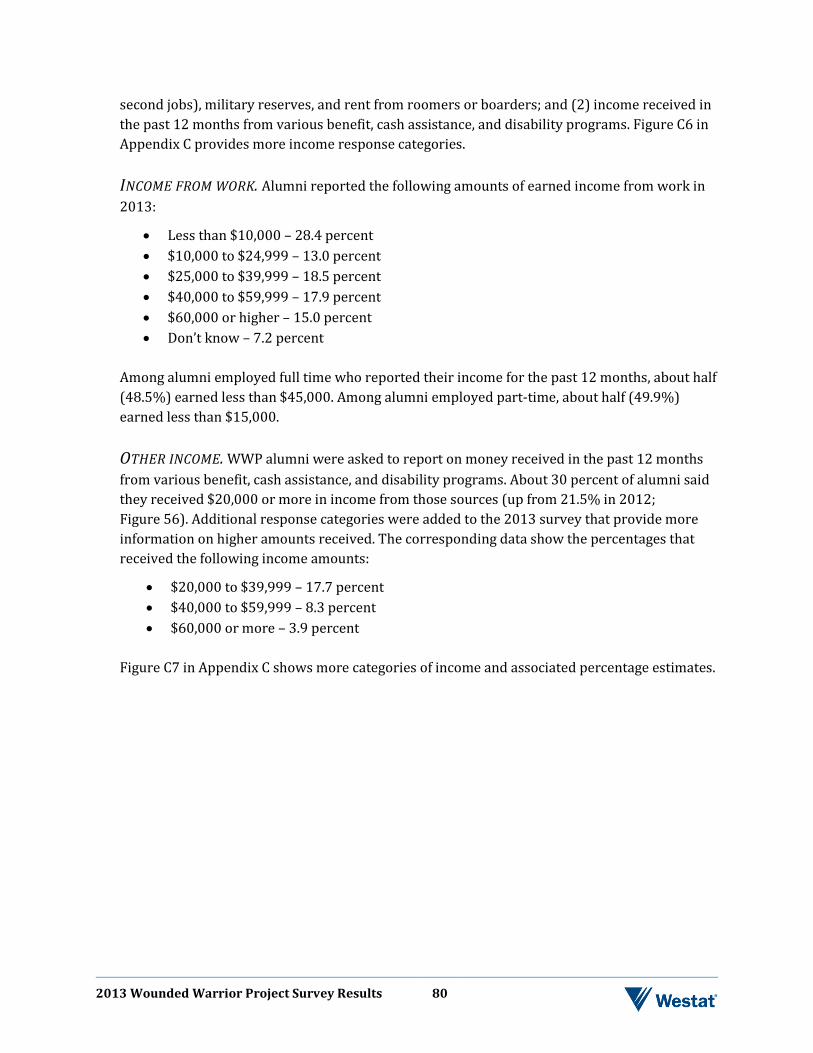
2013 Wounded Warrior Project Survey Results 80
second jobs), military reserves, and rent from roomers or boarders; and (2) income received in the past 12 months from various benefit, cash assistance, and disability programs. Figure C6 in Appendix C provides more income response categories. INCOME FROM WORK. Alumni reported the following amounts of earned income from work in 2013:
• Less than $10,000 – 28.4 percent • $10,000 to $24,999 – 13.0 percent • $25,000 to $39,999 – 18.5 percent • $40,000 to $59,999 – 17.9 percent • $60,000 or higher – 15.0 percent • Don’t know – 7.2 percent
Among alumni employed full time who reported their income for the past 12 months, about half (48.5%) earned less than $45,000. Among alumni employed part-time, about half (49.9%) earned less than $15,000. OTHER INCOME. WWP alumni were asked to report on money received in the past 12 months from various benefit, cash assistance, and disability programs. About 30 percent of alumni said they received $20,000 or more in income from those sources (up from 21.5% in 2012; Figure 56). Additional response categories were added to the 2013 survey that provide more information on higher amounts received. The corresponding data show the percentages that received the following income amounts:
• $20,000 to $39,999 – 17.7 percent • $40,000 to $59,999 – 8.3 percent • $60,000 or more – 3.9 percent
Figure C7 in Appendix C shows more categories of income and associated percentage estimates.
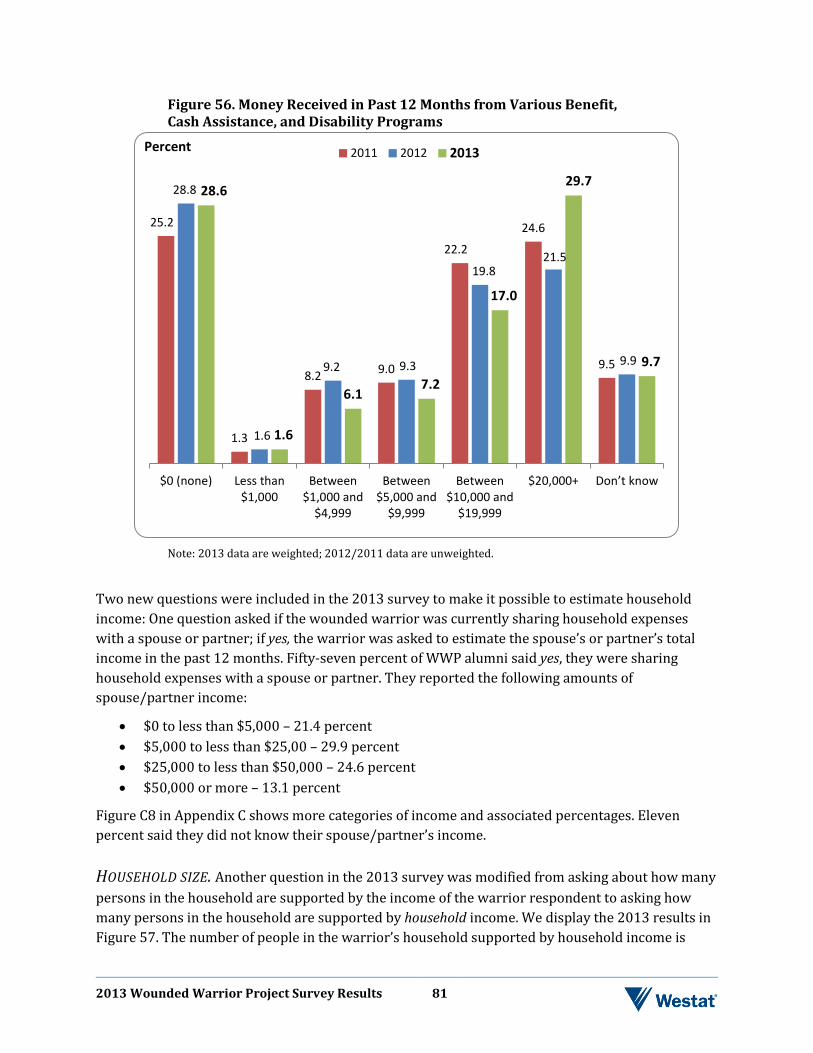
2013 Wounded Warrior Project Survey Results 81
Figure 56. Money Received in Past 12 Months from Various Benefit, Cash Assistance, and Disability Programs
Note: 2013 data are weighted; 2012/2011 data are unweighted.
Two new questions were included in the 2013 survey to make it possible to estimate household income: One question asked if the wounded warrior was currently sharing household expenses with a spouse or partner; if yes, the warrior was asked to estimate the spouse’s or partner’s total income in the past 12 months. Fifty-seven percent of WWP alumni said yes, they were sharing household expenses with a spouse or partner. They reported the following amounts of spouse/partner income:
• $0 to less than $5,000 – 21.4 percent • $5,000 to less than $25,00 – 29.9 percent • $25,000 to less than $50,000 – 24.6 percent • $50,000 or more – 13.1 percent
Figure C8 in Appendix C shows more categories of income and associated percentages. Eleven percent said they did not know their spouse/partner’s income. HOUSEHOLD SIZE. Another question in the 2013 survey was modified from asking about how many persons in the household are supported by the income of the warrior respondent to asking how many persons in the household are supported by household income. We display the 2013 results in Figure 57. The number of people in the warrior’s household supported by household income is
25.2
1.3
8.2 9.0
22.2
24.6
9.5
28.8
1.6
9.2 9.3
19.8 21.5
9.9
28.6
1.6
6.1 7.2
17.0
29.7
9.7
$0 (none) Less than$1,000
Between$1,000 and
$4,999
Between$5,000 and
$9,999
Between$10,000 and
$19,999
$20,000+ Don’t know
2011 2012 2013Percent
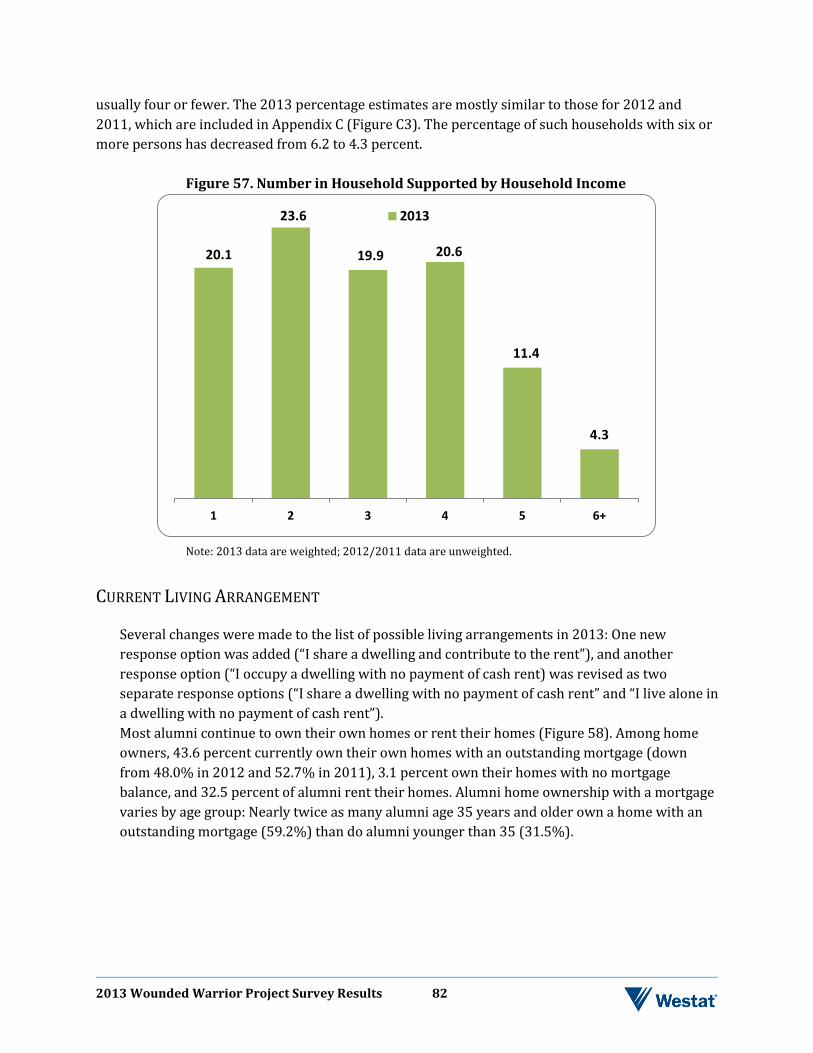
2013 Wounded Warrior Project Survey Results 82
usually four or fewer. The 2013 percentage estimates are mostly similar to those for 2012 and 2011, which are included in Appendix C (Figure C3). The percentage of such households with six or more persons has decreased from 6.2 to 4.3 percent.
Figure 57. Number in Household Supported by Household Income
Note: 2013 data are weighted; 2012/2011 data are unweighted.
CURRENT LIVING ARRANGEMENT
Several changes were made to the list of possible living arrangements in 2013: One new response option was added (“I share a dwelling and contribute to the rent”), and another response option (“I occupy a dwelling with no payment of cash rent) was revised as two separate response options (“I share a dwelling with no payment of cash rent” and “I live alone in a dwelling with no payment of cash rent”). Most alumni continue to own their own homes or rent their homes (Figure 58). Among home owners, 43.6 percent currently own their own homes with an outstanding mortgage (down from 48.0% in 2012 and 52.7% in 2011), 3.1 percent own their homes with no mortgage balance, and 32.5 percent of alumni rent their homes. Alumni home ownership with a mortgage varies by age group: Nearly twice as many alumni age 35 years and older own a home with an outstanding mortgage (59.2%) than do alumni younger than 35 (31.5%).
20.1
23.6
19.9 20.6
11.4
4.3
1 2 3 4 5 6+
2013
2013 Wounded Warrior Project Survey Results 83
Figure 58. Current Living Arrangement
Note: 2013 data are weighted; 2012/2011 data are unweighted. *New or revised response option in 2013.
The decline in home ownership with a mortgage may be partly attributable to stricter mortgage lending requirements in response to the recent collapse of the housing market as well as the contraction in the general economy. Among Americans generally, 58 percent are homeowners, and 65 percent of the homeowners have a mortgage or home equity loan (FINRA Investor Education Foundation, 2013). Also, the finding that home ownership is lower among younger alumni is true as well among the general population. A recently released report from the Pew Research Center indicates that from 2007 to 2010, the share of households headed by adults younger than 35 who own their primary residence declined from 40 percent to 34 percent (Fry, 2013). This decline was part of an overall finding that from 2007 to 2010 younger adults were shedding debt, mainly by owning fewer homes and cars.
0.0
0.2
3.8
0.3
0.7
0.9
3.3
4.4
33.8
52.7
0.1
0.2
4.4
0.6
0.6
0.7
3.0
6.3
36.1
48.0
0.1
0.2
0.3
0.4
0.4
0.6
3.1
3.3
6.7
8.7
32.5
43.6
I live in an assisted living facility or nursing home
I live in a supported housing program (i.e., housing forindividuals with disabilities or special needs)
I live alone in a dwelling with no payment of cash rent*
I live in transitional housing (i.e., temporary housing)
I am homeless or living in a shelter
I live in Section 8 or other subsidized housing
Own my home – no mortgage balance
I share a dwelling with no payment of cash rent*
Live in military housing
I share a dwelling and contribute to the rent*
Rent my home
Own my home - with an outstanding mortgage
Percent
2013
2012
2011
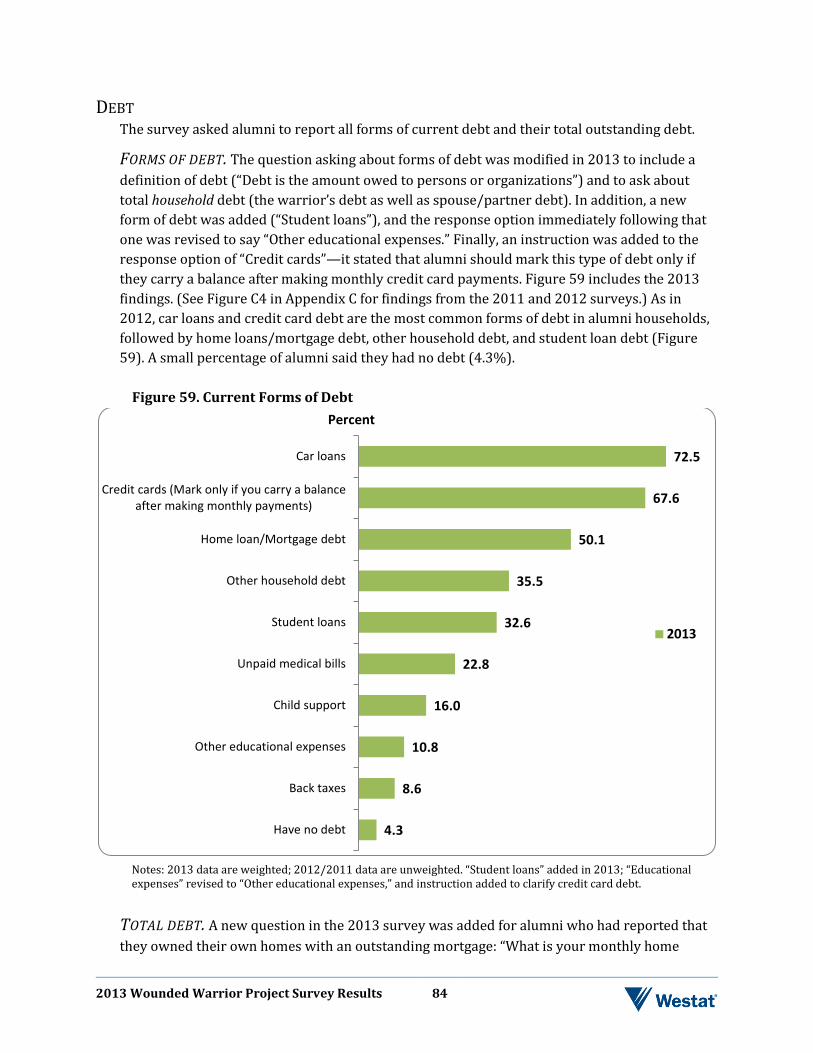
2013 Wounded Warrior Project Survey Results 84
DEBT The survey asked alumni to report all forms of current debt and their total outstanding debt.
FORMS OF DEBT. The question asking about forms of debt was modified in 2013 to include a definition of debt (“Debt is the amount owed to persons or organizations”) and to ask about total household debt (the warrior’s debt as well as spouse/partner debt). In addition, a new form of debt was added (“Student loans”), and the response option immediately following that one was revised to say “Other educational expenses.” Finally, an instruction was added to the response option of “Credit cards”—it stated that alumni should mark this type of debt only if they carry a balance after making monthly credit card payments. Figure 59 includes the 2013 findings. (See Figure C4 in Appendix C for findings from the 2011 and 2012 surveys.) As in 2012, car loans and credit card debt are the most common forms of debt in alumni households, followed by home loans/mortgage debt, other household debt, and student loan debt (Figure 59). A small percentage of alumni said they had no debt (4.3%).
Figure 59. Current Forms of Debt
Notes: 2013 data are weighted; 2012/2011 data are unweighted. “Student loans” added in 2013; “Educational expenses” revised to “Other educational expenses,” and instruction added to clarify credit card debt.
TOTAL DEBT. A new question in the 2013 survey was added for alumni who had reported that they owned their own homes with an outstanding mortgage: “What is your monthly home
4.3
8.6
10.8
16.0
22.8
32.6
35.5
50.1
67.6
72.5
Have no debt
Back taxes
Other educational expenses
Child support
Unpaid medical bills
Student loans
Other household debt
Home loan/Mortgage debt
Credit cards (Mark only if you carry a balanceafter making monthly payments)
Car loans
Percent
2013
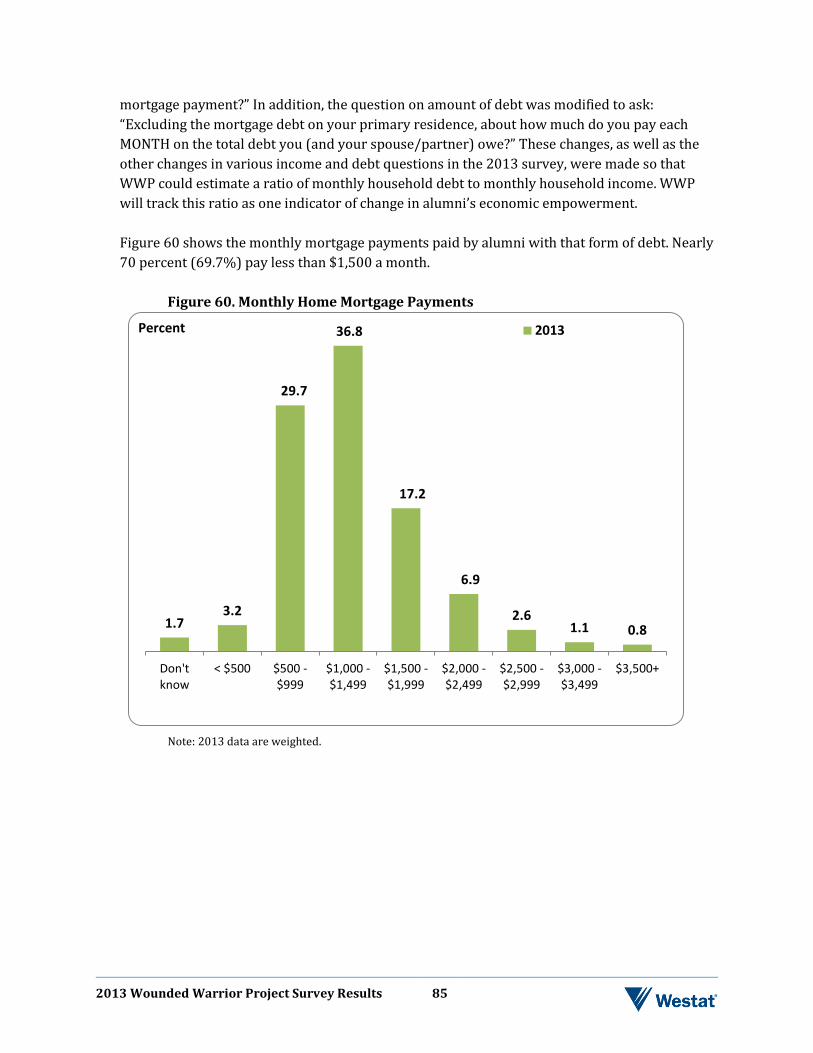
2013 Wounded Warrior Project Survey Results 85
mortgage payment?” In addition, the question on amount of debt was modified to ask: “Excluding the mortgage debt on your primary residence, about how much do you pay each MONTH on the total debt you (and your spouse/partner) owe?” These changes, as well as the other changes in various income and debt questions in the 2013 survey, were made so that WWP could estimate a ratio of monthly household debt to monthly household income. WWP will track this ratio as one indicator of change in alumni’s economic empowerment. Figure 60 shows the monthly mortgage payments paid by alumni with that form of debt. Nearly 70 percent (69.7%) pay less than $1,500 a month.
Figure 60. Monthly Home Mortgage Payments
Note: 2013 data are weighted.
1.7 3.2
29.7
36.8
17.2
6.9
2.6 1.1 0.8
Don'tknow
< $500 $500 -$999
$1,000 -$1,499
$1,500 -$1,999
$2,000 -$2,499
$2,500 -$2,999
$3,000 -$3,499
$3,500+
2013Percent
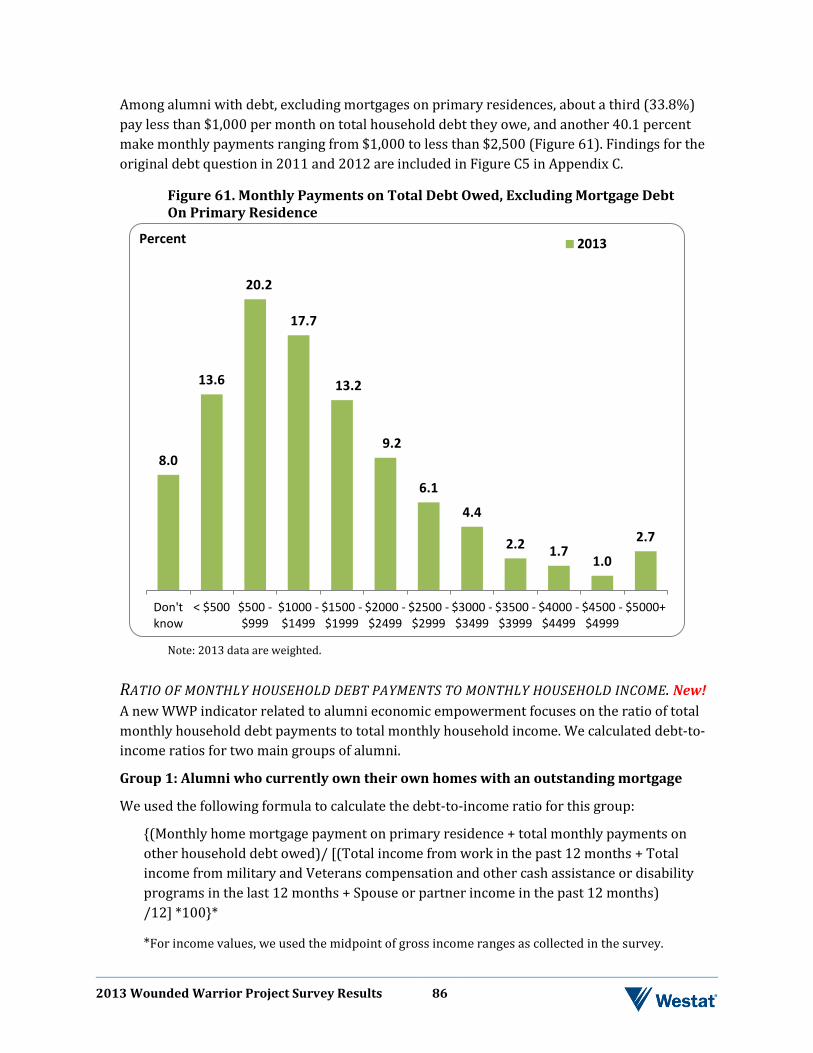
2013 Wounded Warrior Project Survey Results 86
Among alumni with debt, excluding mortgages on primary residences, about a third (33.8%) pay less than $1,000 per month on total household debt they owe, and another 40.1 percent make monthly payments ranging from $1,000 to less than $2,500 (Figure 61). Findings for the original debt question in 2011 and 2012 are included in Figure C5 in Appendix C.
Figure 61. Monthly Payments on Total Debt Owed, Excluding Mortgage Debt On Primary Residence
Note: 2013 data are weighted.
RATIO OF MONTHLY HOUSEHOLD DEBT PAYMENTS TO MONTHLY HOUSEHOLD INCOME. New! A new WWP indicator related to alumni economic empowerment focuses on the ratio of total monthly household debt payments to total monthly household income. We calculated debt-to-income ratios for two main groups of alumni.
Group 1: Alumni who currently own their own homes with an outstanding mortgage
We used the following formula to calculate the debt-to-income ratio for this group:
{(Monthly home mortgage payment on primary residence + total monthly payments on other household debt owed)/ [(Total income from work in the past 12 months + Total income from military and Veterans compensation and other cash assistance or disability programs in the last 12 months + Spouse or partner income in the past 12 months) /12] *100}*
*For income values, we used the midpoint of gross income ranges as collected in the survey.
8.0
13.6
20.2
17.7
13.2
9.2
6.1
4.4
2.2 1.7 1.0
2.7
Don'tknow
< $500 $500 -$999
$1000 -$1499
$1500 -$1999
$2000 -$2499
$2500 -$2999
$3000 -$3499
$3500 -$3999
$4000 -$4499
$4500 -$4999
$5000+
2013Percent
2013 Wounded Warrior Project Survey Results 87
As indicated in the formula, this ratio was estimated only for alumni who own their homes with an outstanding mortgage who also provided responses about their income, or lack of income, from the sources specified in the formula (46.1% of alumni).
We then estimated the percentage of alumni within this group whose debt-to-income ratio exceeds the general VA mortgage qualification ratio of 41 percent or less:
• Among all alumni with an outstanding mortgage who also provided responses about their household income, 62.1 percent have a debt-to-income ratio > 41 percent.
o Among the subgroup of alumni with an outstanding mortgage who answered the question about spouse/partner income, 55.0 percent have a debt-to-income ratio > 41 percent.
o Among the subgroup of alumni with an outstanding mortgage with no spouse/partner (or did not answer the question about spouse/partner income), 73.6 percent have a debt-to-income ratio > 41 percent.
The monthly debt payments for these alumni homeowners are likely burdensome for many of them. For those considering whether to sell their homes, it may be difficult for them to qualify for a new VA loan unless their new mortgage payments are significantly lower than what they are paying now. Group 2 - Alumni who currently do not own their own homes
Many non-VA mortgage financing organizations separate the debt-to-income ratio into two parts—the front-end ratio and the back-end ratio, such as 28/36 or 33/45. The 28 represents the percentage of income that goes toward housing costs, and the 36 represents the percentage of income that goes toward paying all recurring debt payments, including front-end housing payments. The difference between the two ratios represents “non-housing-related” household debt payments, or other monthly household debt payments. Thus, for the first example, other monthly household debt payments should not exceed approximately 8 percent of monthly income if their front-end housing costs are 28 percent of income, and for the second example, other debt payments should not exceed approximately 12 percent of income if housing costs are about 33 percent. We used these two benchmarks of 8 percent and 12 percent to assess the debt-to-income ratio for alumni who reported they do not currently own their home and who answered the income questions (49.4% of alumni). The results follow:
• 90.1% of this group of alumni have a “nonhousing” debt-to-income ratio > 8 percent. • 82.8% of this group have a “nonhousing” debt-to-income ratio > 12 percent.
Alumni who would like to buy a home may find it difficult to qualify for a mortgage if their nonhousing debt-to-income ratios exceed 8 percent, especially if they have limited savings.
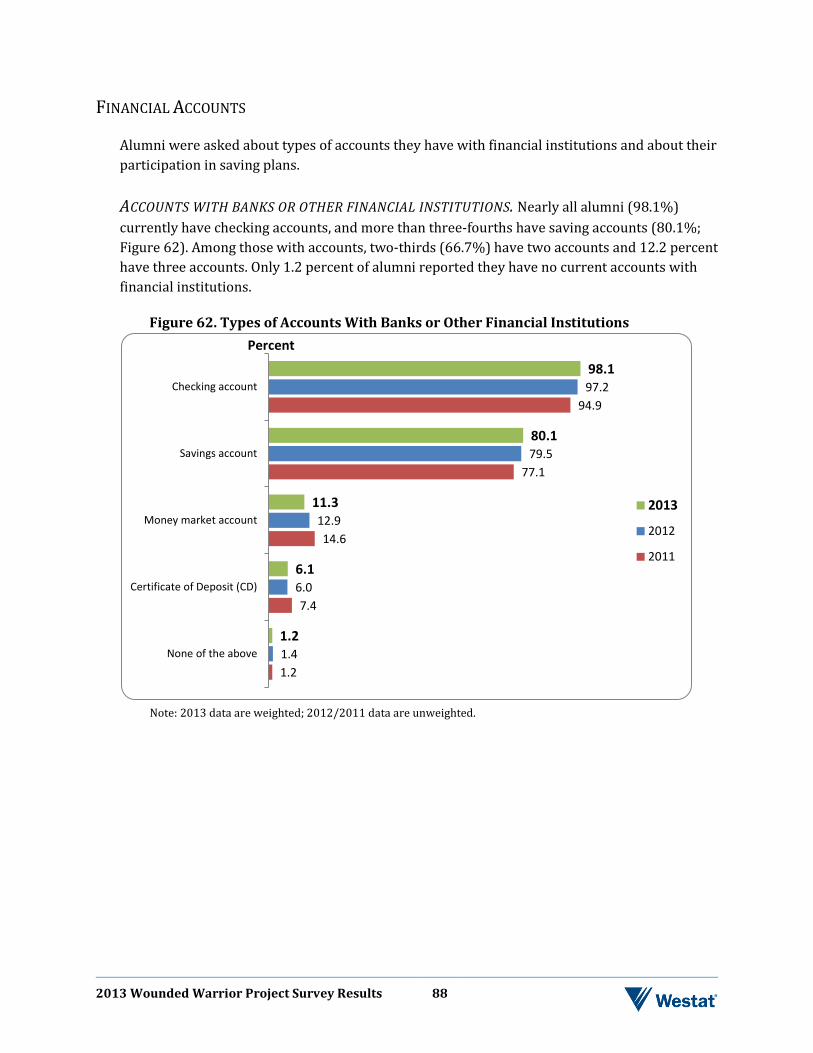
2013 Wounded Warrior Project Survey Results 88
FINANCIAL ACCOUNTS
Alumni were asked about types of accounts they have with financial institutions and about their participation in saving plans. ACCOUNTS WITH BANKS OR OTHER FINANCIAL INSTITUTIONS. Nearly all alumni (98.1%) currently have checking accounts, and more than three-fourths have saving accounts (80.1%; Figure 62). Among those with accounts, two-thirds (66.7%) have two accounts and 12.2 percent have three accounts. Only 1.2 percent of alumni reported they have no current accounts with financial institutions.
Figure 62. Types of Accounts With Banks or Other Financial Institutions
Note: 2013 data are weighted; 2012/2011 data are unweighted.
1.2
7.4
14.6
77.1
94.9
1.4
6.0
12.9
79.5
97.2
1.2
6.1
11.3
80.1
98.1
None of the above
Certificate of Deposit (CD)
Money market account
Savings account
Checking account
Percent
2013
2012
2011
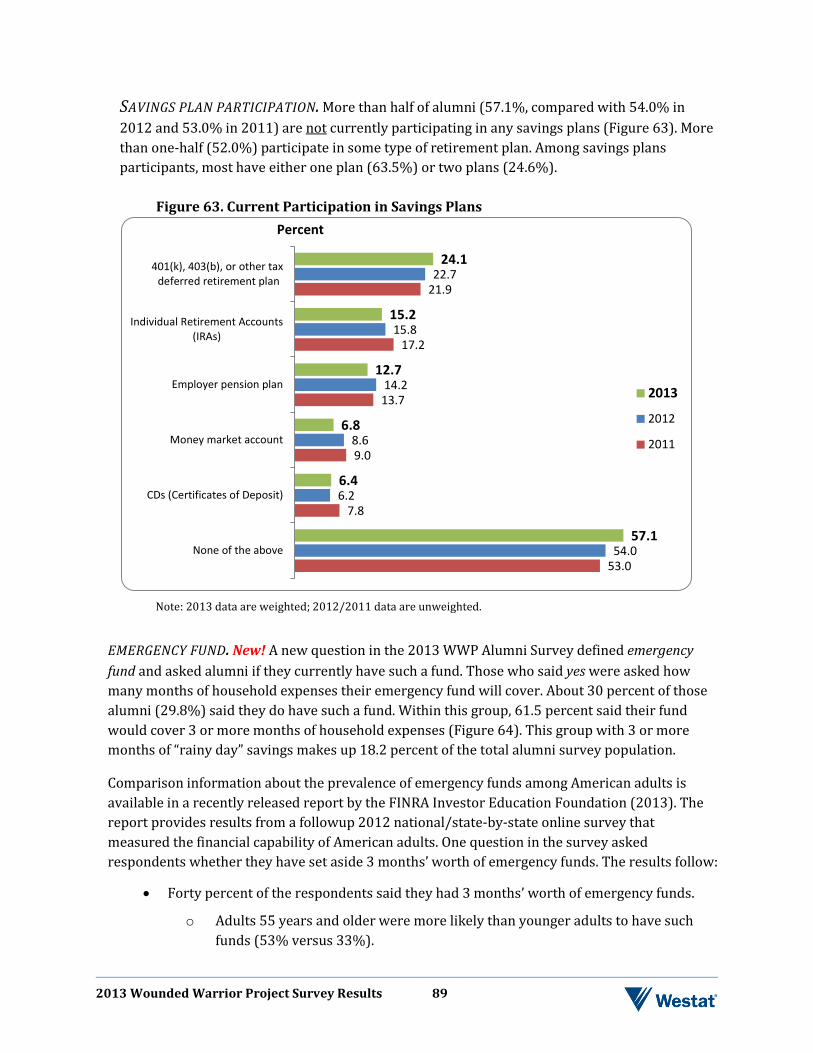
2013 Wounded Warrior Project Survey Results 89
SAVINGS PLAN PARTICIPATION. More than half of alumni (57.1%, compared with 54.0% in 2012 and 53.0% in 2011) are not currently participating in any savings plans (Figure 63). More than one-half (52.0%) participate in some type of retirement plan. Among savings plans participants, most have either one plan (63.5%) or two plans (24.6%).
Figure 63. Current Participation in Savings Plans
Note: 2013 data are weighted; 2012/2011 data are unweighted.
EMERGENCY FUND. New! A new question in the 2013 WWP Alumni Survey defined emergency fund and asked alumni if they currently have such a fund. Those who said yes were asked how many months of household expenses their emergency fund will cover. About 30 percent of those alumni (29.8%) said they do have such a fund. Within this group, 61.5 percent said their fund would cover 3 or more months of household expenses (Figure 64). This group with 3 or more months of “rainy day” savings makes up 18.2 percent of the total alumni survey population.
Comparison information about the prevalence of emergency funds among American adults is available in a recently released report by the FINRA Investor Education Foundation (2013). The report provides results from a followup 2012 national/state-by-state online survey that measured the financial capability of American adults. One question in the survey asked respondents whether they have set aside 3 months’ worth of emergency funds. The results follow:
• Forty percent of the respondents said they had 3 months’ worth of emergency funds.
o Adults 55 years and older were more likely than younger adults to have such funds (53% versus 33%).
53.0
7.8
9.0
13.7
17.2
21.9
54.0
6.2
8.6
14.2
15.8
22.7
57.1
6.4
6.8
12.7
15.2
24.1
None of the above
CDs (Certificates of Deposit)
Money market account
Employer pension plan
Individual Retirement Accounts(IRAs)
401(k), 403(b), or other tax deferred retirement plan
Percent
2013
2012
2011
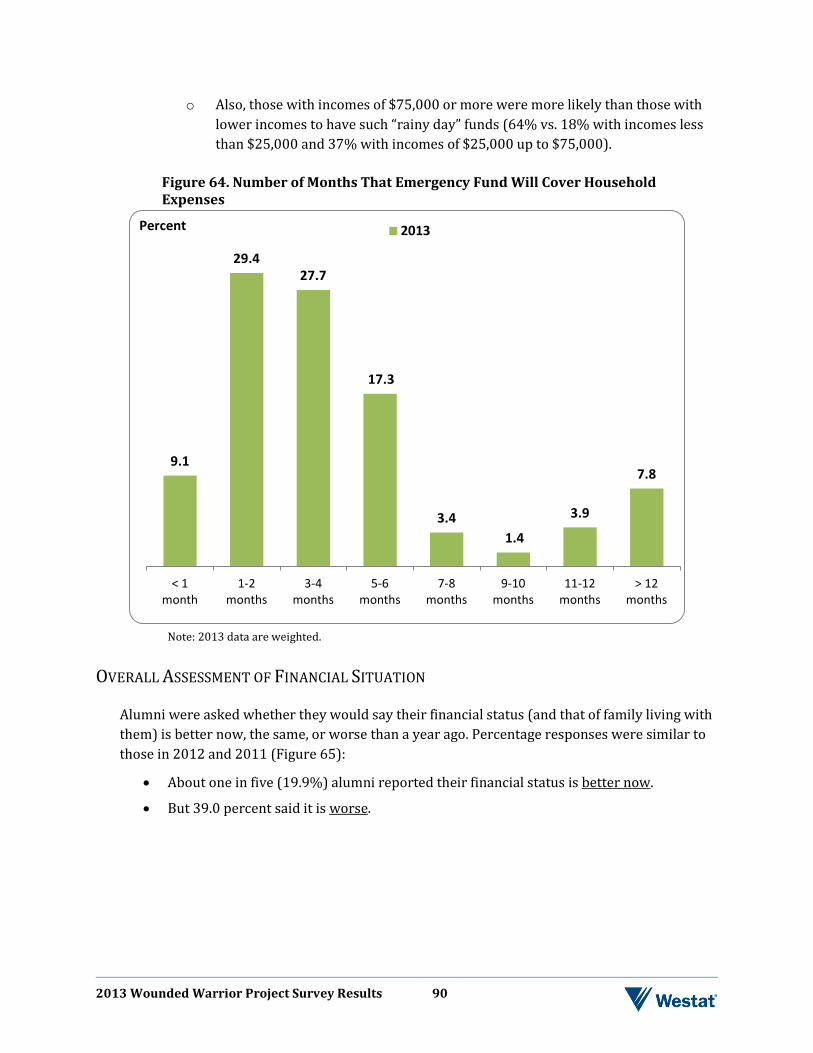
2013 Wounded Warrior Project Survey Results 90
o Also, those with incomes of $75,000 or more were more likely than those with lower incomes to have such “rainy day” funds (64% vs. 18% with incomes less than $25,000 and 37% with incomes of $25,000 up to $75,000).
Figure 64. Number of Months That Emergency Fund Will Cover Household Expenses
Note: 2013 data are weighted.
OVERALL ASSESSMENT OF FINANCIAL SITUATION
Alumni were asked whether they would say their financial status (and that of family living with them) is better now, the same, or worse than a year ago. Percentage responses were similar to those in 2012 and 2011 (Figure 65):
• About one in five (19.9%) alumni reported their financial status is better now.
• But 39.0 percent said it is worse.
9.1
29.4 27.7
17.3
3.4 1.4
3.9
7.8
< 1month
1-2months
3-4months
5-6months
7-8months
9-10months
11-12months
> 12months
2013Percent
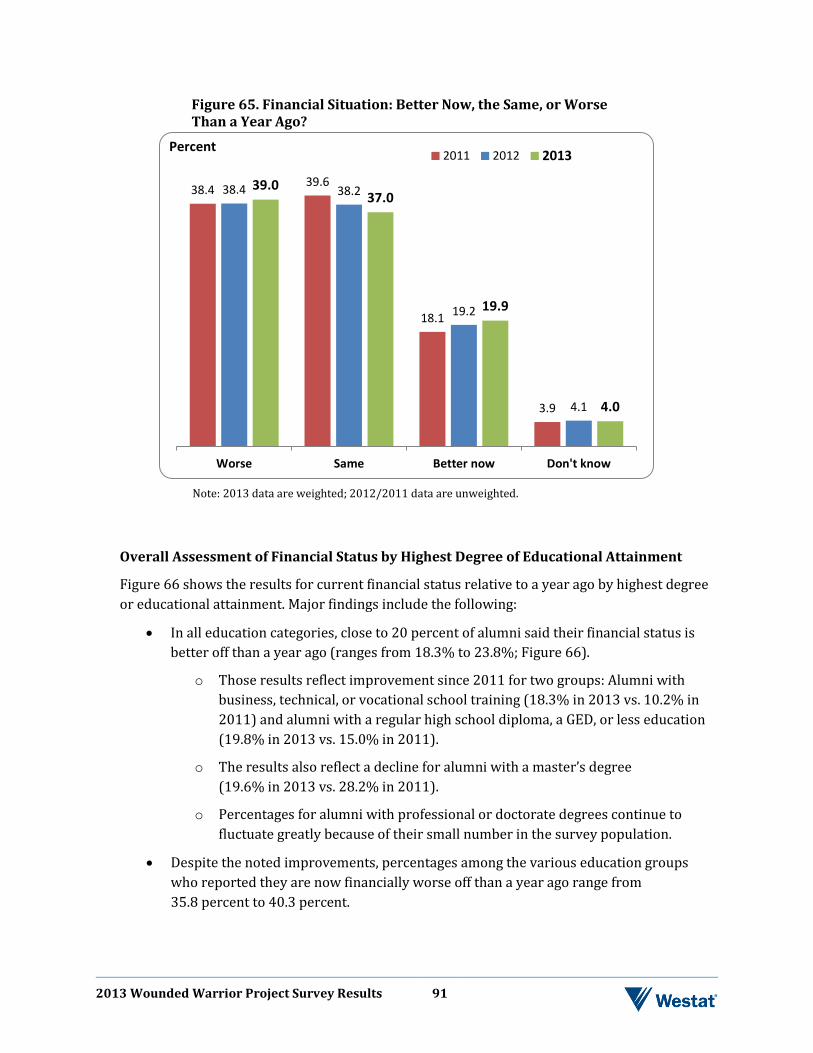
2013 Wounded Warrior Project Survey Results 91
Figure 65. Financial Situation: Better Now, the Same, or Worse Than a Year Ago?
Note: 2013 data are weighted; 2012/2011 data are unweighted.
Overall Assessment of Financial Status by Highest Degree of Educational Attainment
Figure 66 shows the results for current financial status relative to a year ago by highest degree or educational attainment. Major findings include the following:
• In all education categories, close to 20 percent of alumni said their financial status is better off than a year ago (ranges from 18.3% to 23.8%; Figure 66).
o Those results reflect improvement since 2011 for two groups: Alumni with business, technical, or vocational school training (18.3% in 2013 vs. 10.2% in 2011) and alumni with a regular high school diploma, a GED, or less education (19.8% in 2013 vs. 15.0% in 2011).
o The results also reflect a decline for alumni with a master’s degree (19.6% in 2013 vs. 28.2% in 2011).
o Percentages for alumni with professional or doctorate degrees continue to fluctuate greatly because of their small number in the survey population.
• Despite the noted improvements, percentages among the various education groups who reported they are now financially worse off than a year ago range from 35.8 percent to 40.3 percent.
38.4 39.6
18.1
3.9
38.4 38.2
19.2
4.1
39.0 37.0
19.9
4.0
Worse Same Better now Don't know
2011 2012 2013Percent
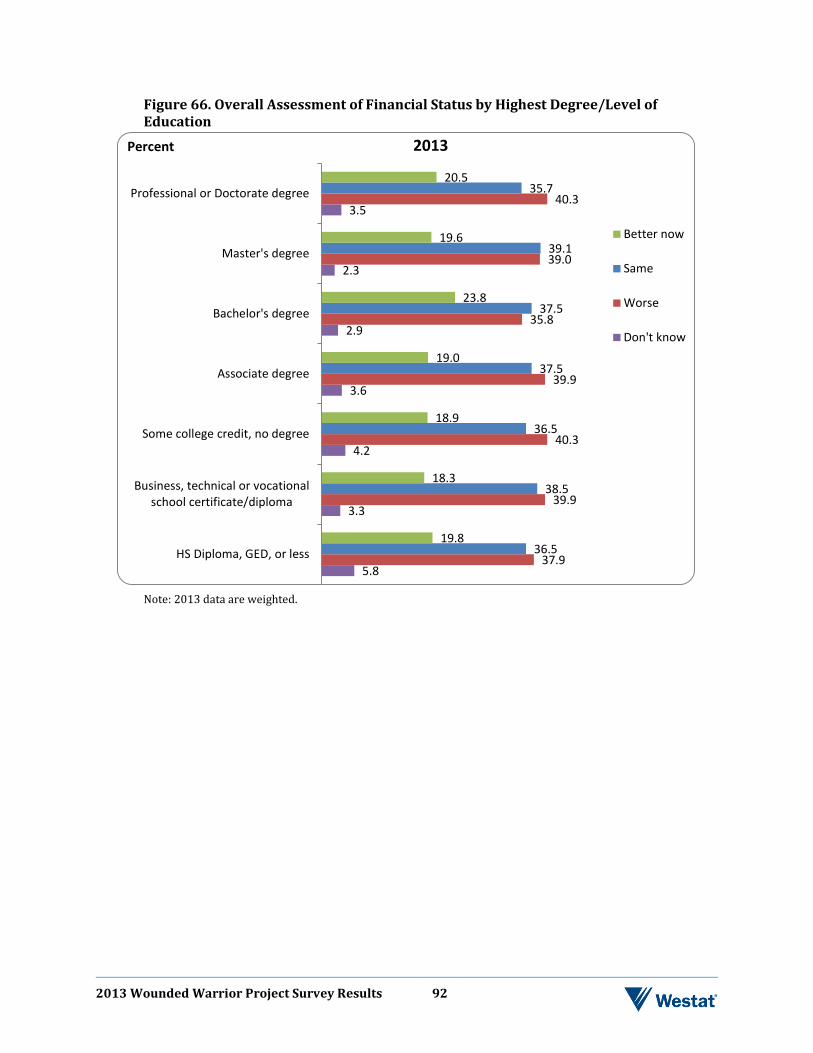
2013 Wounded Warrior Project Survey Results 92
Figure 66. Overall Assessment of Financial Status by Highest Degree/Level of Education
Note: 2013 data are weighted.
5.8
3.3
4.2
3.6
2.9
2.3
3.5
37.9
39.9
40.3
39.9
35.8
39.0
40.3
36.5
38.5
36.5
37.5
37.5
39.1
35.7
19.8
18.3
18.9
19.0
23.8
19.6
20.5
HS Diploma, GED, or less
Business, technical or vocationalschool certificate/diploma
Some college credit, no degree
Associate degree
Bachelor's degree
Master's degree
Professional or Doctorate degree
2013
Better now
Same
Worse
Don't know
Percent
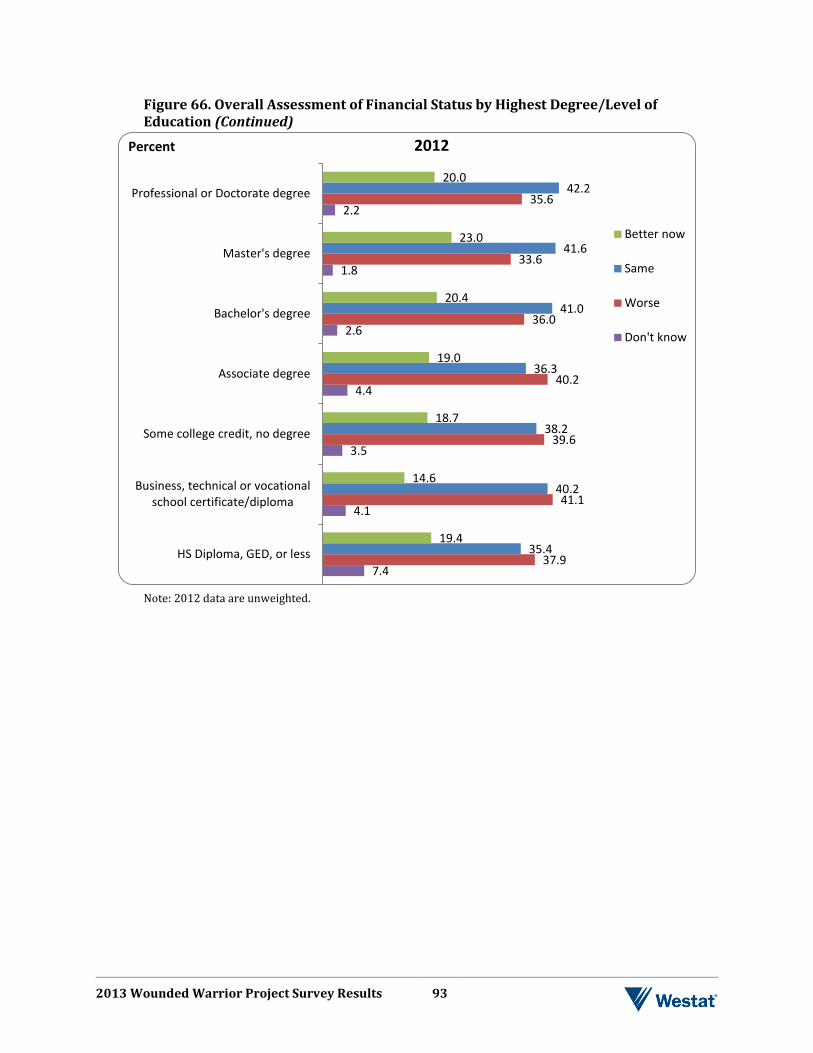
2013 Wounded Warrior Project Survey Results 93
Figure 66. Overall Assessment of Financial Status by Highest Degree/Level of Education (Continued)
Note: 2012 data are unweighted.
7.4
4.1
3.5
4.4
2.6
1.8
2.2
37.9
41.1
39.6
40.2
36.0
33.6
35.6
35.4
40.2
38.2
36.3
41.0
41.6
42.2
19.4
14.6
18.7
19.0
20.4
23.0
20.0
HS Diploma, GED, or less
Business, technical or vocationalschool certificate/diploma
Some college credit, no degree
Associate degree
Bachelor's degree
Master's degree
Professional or Doctorate degree
2012
Better now
Same
Worse
Don't know
Percent
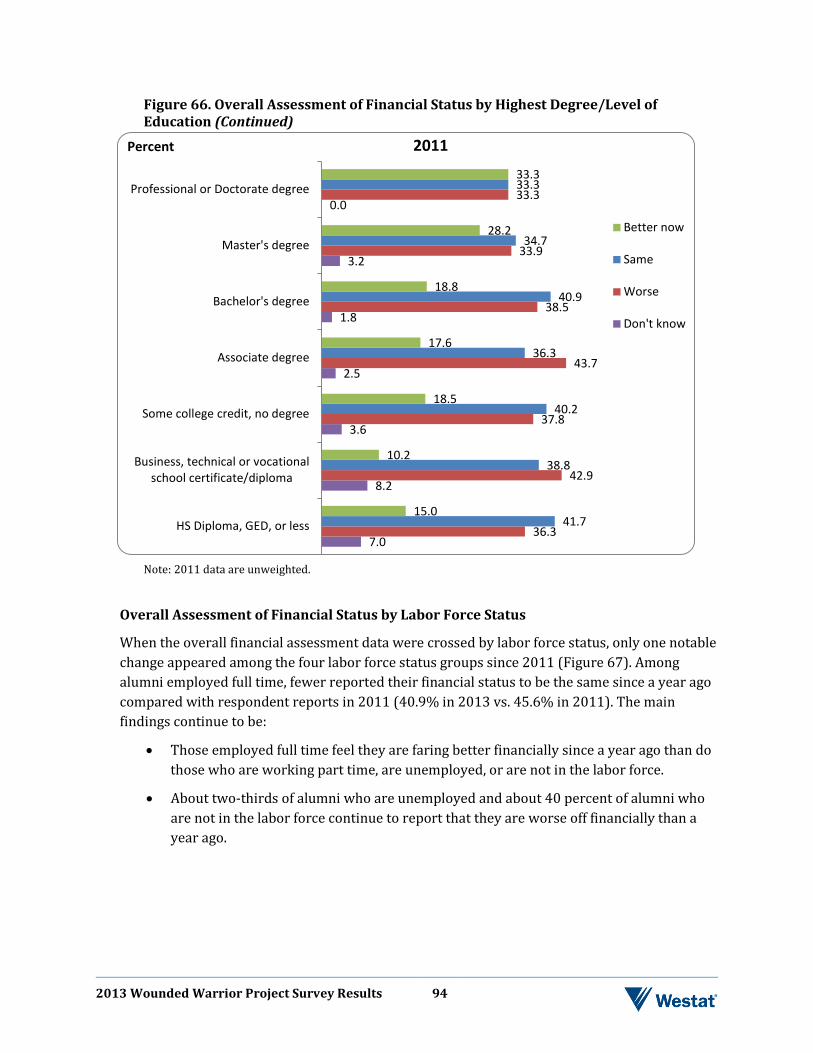
2013 Wounded Warrior Project Survey Results 94
Figure 66. Overall Assessment of Financial Status by Highest Degree/Level of Education (Continued)
Note: 2011 data are unweighted.
Overall Assessment of Financial Status by Labor Force Status
When the overall financial assessment data were crossed by labor force status, only one notable change appeared among the four labor force status groups since 2011 (Figure 67). Among alumni employed full time, fewer reported their financial status to be the same since a year ago compared with respondent reports in 2011 (40.9% in 2013 vs. 45.6% in 2011). The main findings continue to be:
• Those employed full time feel they are faring better financially since a year ago than do those who are working part time, are unemployed, or are not in the labor force.
• About two-thirds of alumni who are unemployed and about 40 percent of alumni who are not in the labor force continue to report that they are worse off financially than a year ago.
7.0
8.2
3.6
2.5
1.8
3.2
0.0
36.3
42.9
37.8
43.7
38.5
33.9
33.3
41.7
38.8
40.2
36.3
40.9
34.7
33.3
15.0
10.2
18.5
17.6
18.8
28.2
33.3
HS Diploma, GED, or less
Business, technical or vocationalschool certificate/diploma
Some college credit, no degree
Associate degree
Bachelor's degree
Master's degree
Professional or Doctorate degree
2011
Better now
Same
Worse
Don't know
Percent
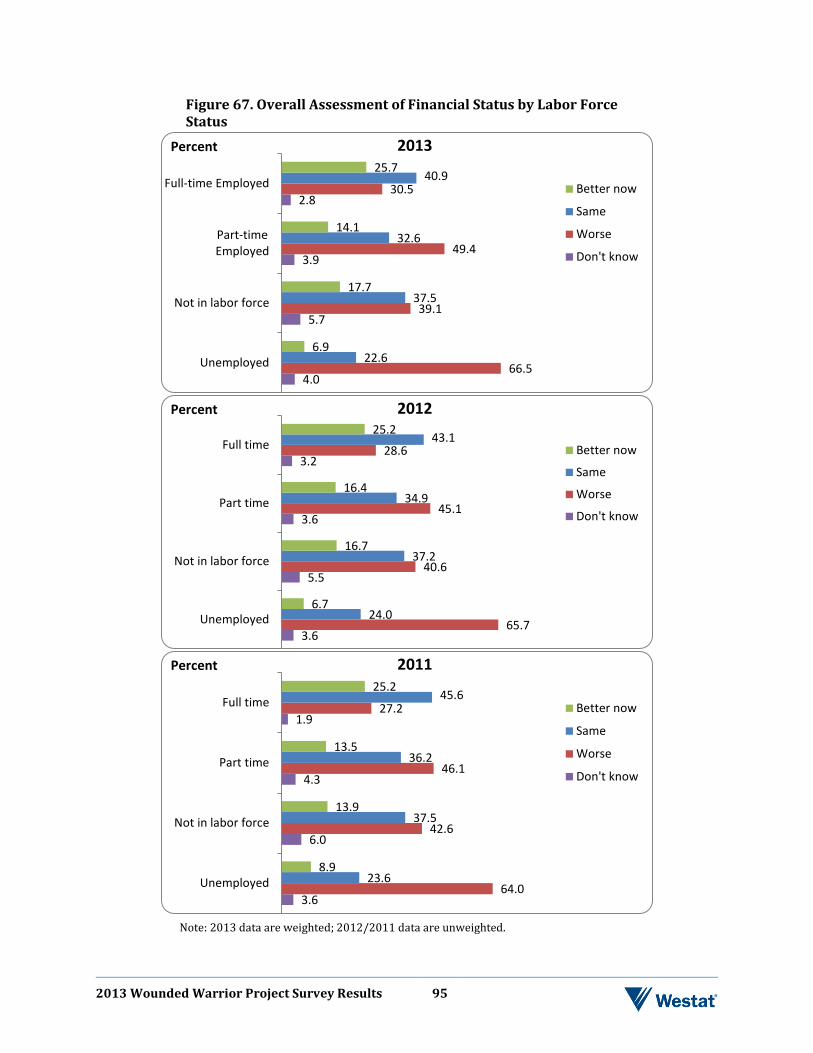
2013 Wounded Warrior Project Survey Results 95
Figure 67. Overall Assessment of Financial Status by Labor Force Status
Note: 2013 data are weighted; 2012/2011 data are unweighted.
4.0
5.7
3.9
2.8
66.5
39.1
49.4
30.5
22.6
37.5
32.6
40.9
6.9
17.7
14.1
25.7
Unemployed
Not in labor force
Part-timeEmployed
Full-time Employed
2013
Better now
Same
Worse
Don't know
Percent
3.6
5.5
3.6
3.2
65.7
40.6
45.1
28.6
24.0
37.2
34.9
43.1
6.7
16.7
16.4
25.2
Unemployed
Not in labor force
Part time
Full time
2012
Better now
Same
Worse
Don't know
Percent
3.6
6.0
4.3
1.9
64.0
42.6
46.1
27.2
23.6
37.5
36.2
45.6
8.9
13.9
13.5
25.2
Unemployed
Not in labor force
Part time
Full time
2011
Better now
Same
Worse
Don't know
Percent
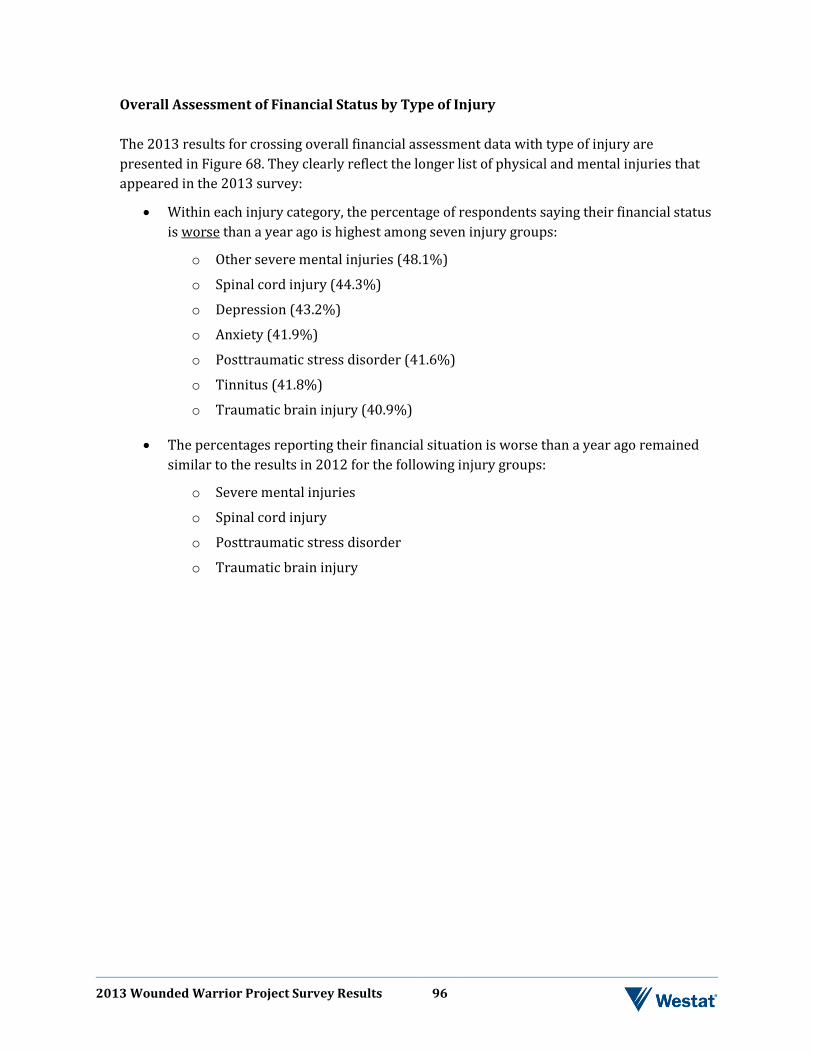
2013 Wounded Warrior Project Survey Results 96
Overall Assessment of Financial Status by Type of Injury The 2013 results for crossing overall financial assessment data with type of injury are presented in Figure 68. They clearly reflect the longer list of physical and mental injuries that appeared in the 2013 survey:
• Within each injury category, the percentage of respondents saying their financial status is worse than a year ago is highest among seven injury groups:
o Other severe mental injuries (48.1%)
o Spinal cord injury (44.3%)
o Depression (43.2%)
o Anxiety (41.9%)
o Posttraumatic stress disorder (41.6%)
o Tinnitus (41.8%)
o Traumatic brain injury (40.9%)
• The percentages reporting their financial situation is worse than a year ago remained similar to the results in 2012 for the following injury groups:
o Severe mental injuries
o Spinal cord injury
o Posttraumatic stress disorder
o Traumatic brain injury
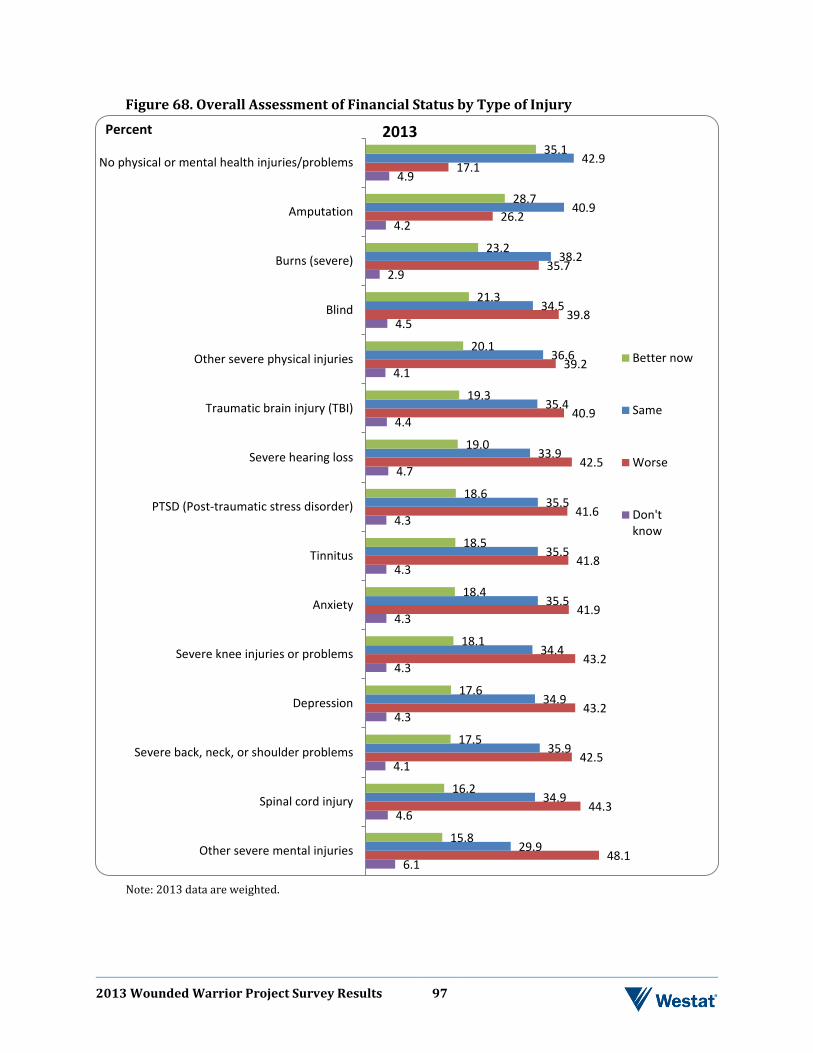
2013 Wounded Warrior Project Survey Results 97
Figure 68. Overall Assessment of Financial Status by Type of Injury
Note: 2013 data are weighted.
6.1
4.6
4.1
4.3
4.3
4.3
4.3
4.3
4.7
4.4
4.1
4.5
2.9
4.2
4.9
48.1
44.3
42.5
43.2
43.2
41.9
41.8
41.6
42.5
40.9
39.2
39.8
35.7
26.2
17.1
29.9
34.9
35.9
34.9
34.4
35.5
35.5
35.5
33.9
35.4
36.6
34.5
38.2
40.9
42.9
15.8
16.2
17.5
17.6
18.1
18.4
18.5
18.6
19.0
19.3
20.1
21.3
23.2
28.7
35.1
Other severe mental injuries
Spinal cord injury
Severe back, neck, or shoulder problems
Depression
Severe knee injuries or problems
Anxiety
Tinnitus
PTSD (Post-traumatic stress disorder)
Severe hearing loss
Traumatic brain injury (TBI)
Other severe physical injuries
Blind
Burns (severe)
Amputation
No physical or mental health injuries/problems
2013
Better now
Same
Worse
Don'tknow
Percent
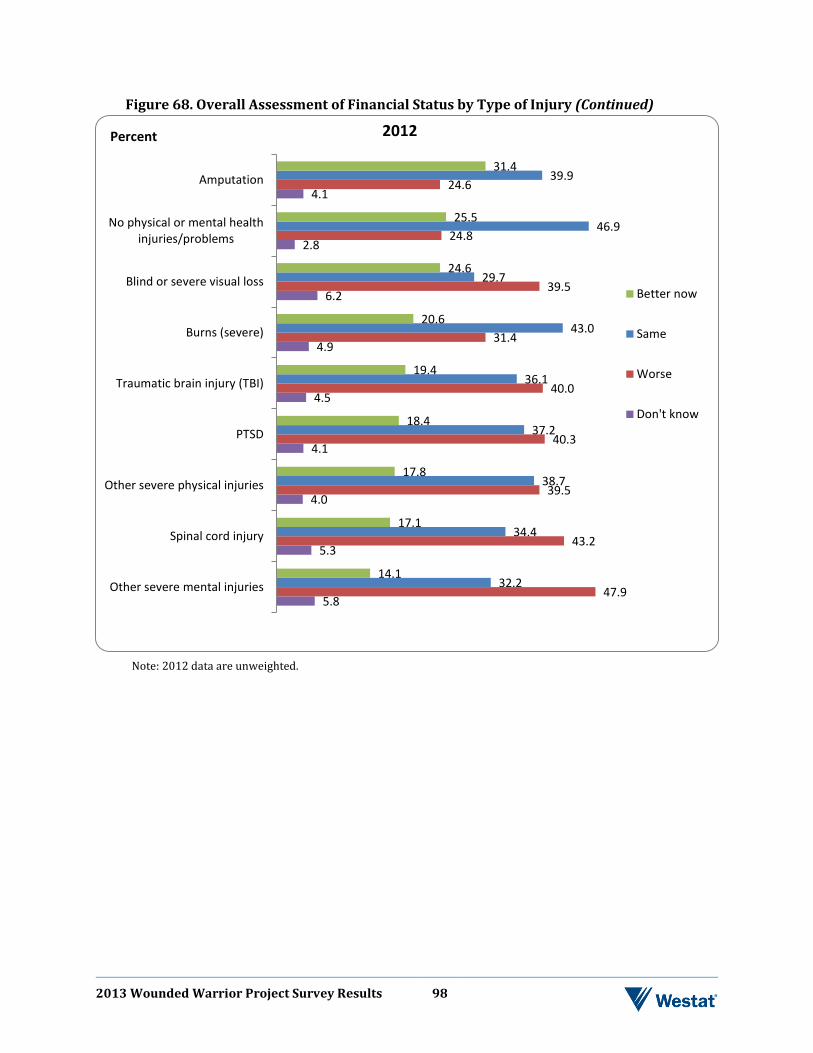
2013 Wounded Warrior Project Survey Results 98
Figure 68. Overall Assessment of Financial Status by Type of Injury (Continued)
Note: 2012 data are unweighted.
5.8
5.3
4.0
4.1
4.5
4.9
6.2
2.8
4.1
47.9
43.2
39.5
40.3
40.0
31.4
39.5
24.8
24.6
32.2
34.4
38.7
37.2
36.1
43.0
29.7
46.9
39.9
14.1
17.1
17.8
18.4
19.4
20.6
24.6
25.5
31.4
Other severe mental injuries
Spinal cord injury
Other severe physical injuries
PTSD
Traumatic brain injury (TBI)
Burns (severe)
Blind or severe visual loss
No physical or mental healthinjuries/problems
Amputation
2012
Better now
Same
Worse
Don't know
Percent
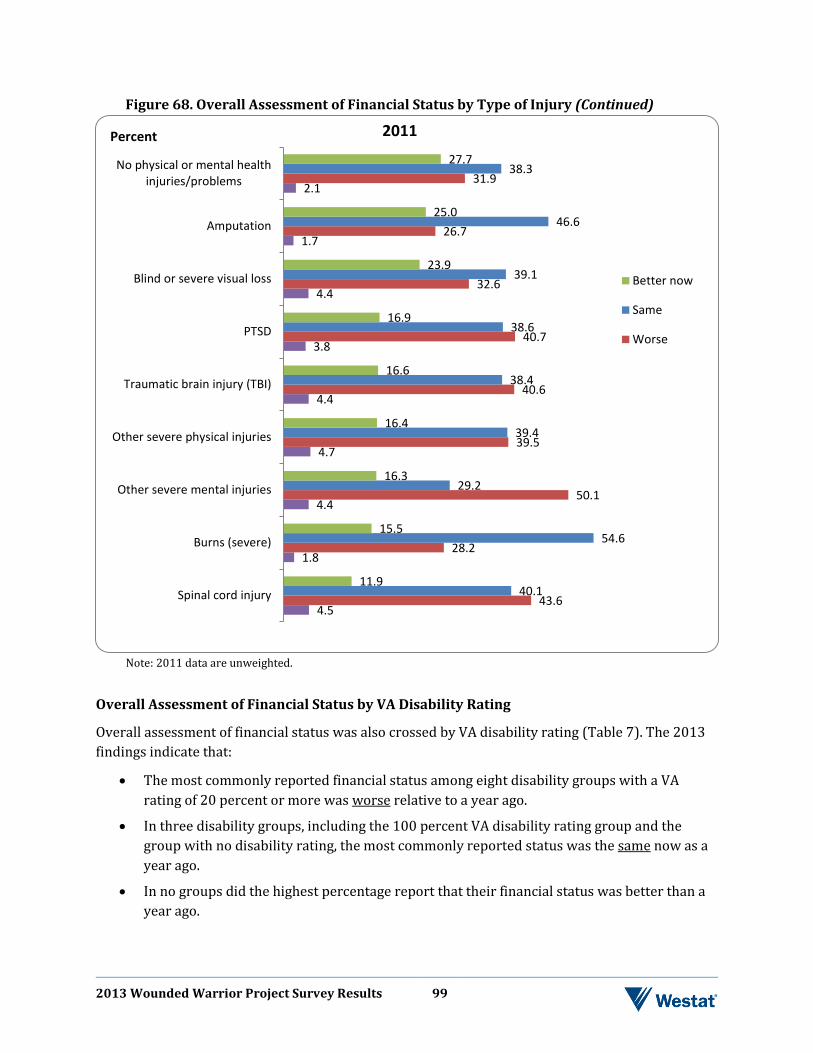
2013 Wounded Warrior Project Survey Results 99
Figure 68. Overall Assessment of Financial Status by Type of Injury (Continued)
Note: 2011 data are unweighted.
Overall Assessment of Financial Status by VA Disability Rating
Overall assessment of financial status was also crossed by VA disability rating (Table 7). The 2013 findings indicate that:
• The most commonly reported financial status among eight disability groups with a VA rating of 20 percent or more was worse relative to a year ago.
• In three disability groups, including the 100 percent VA disability rating group and the group with no disability rating, the most commonly reported status was the same now as a year ago.
• In no groups did the highest percentage report that their financial status was better than a year ago.
4.5
1.8
4.4
4.7
4.4
3.8
4.4
1.7
2.1
43.6
28.2
50.1
39.5
40.6
40.7
32.6
26.7
31.9
40.1
54.6
29.2
39.4
38.4
38.6
39.1
46.6
38.3
11.9
15.5
16.3
16.4
16.6
16.9
23.9
25.0
27.7
Spinal cord injury
Burns (severe)
Other severe mental injuries
Other severe physical injuries
Traumatic brain injury (TBI)
PTSD
Blind or severe visual loss
Amputation
No physical or mental healthinjuries/problems
2011
Better now
Same
Worse
Percent
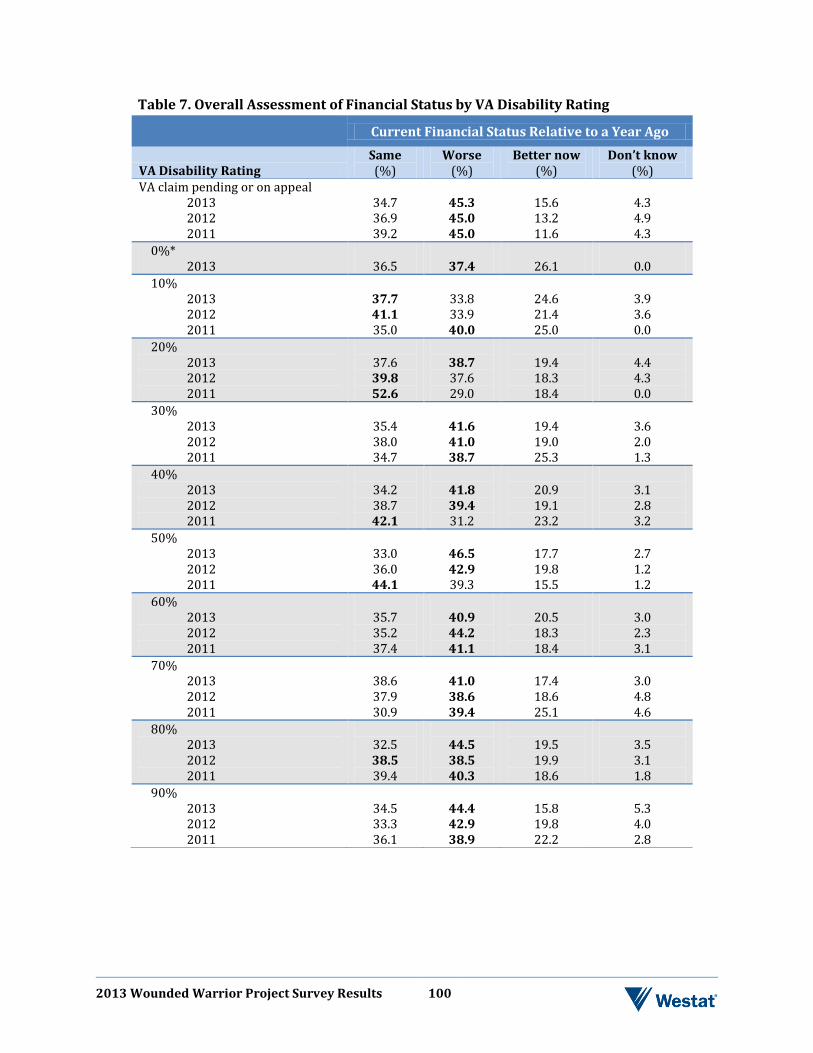
2013 Wounded Warrior Project Survey Results 100
Table 7. Overall Assessment of Financial Status by VA Disability Rating Current Financial Status Relative to a Year Ago
VA Disability Rating Same (%)
Worse (%)
Better now (%)
Don’t know (%)
VA claim pending or on appeal 2013 2012 2011
34.7 36.9 39.2
45.3 45.0 45.0
15.6 13.2 11.6
4.3 4.9 4.3
0%* 2013
36.5
37.4
26.1
0.0
10% 2013 2012 2011
37.7 41.1 35.0
33.8 33.9 40.0
24.6 21.4 25.0
3.9 3.6 0.0
20% 2013 2012 2011
37.6 39.8 52.6
38.7 37.6 29.0
19.4 18.3 18.4
4.4 4.3 0.0
30% 2013 2012 2011
35.4 38.0 34.7
41.6 41.0 38.7
19.4 19.0 25.3
3.6 2.0 1.3
40% 2013 2012 2011
34.2 38.7 42.1
41.8 39.4 31.2
20.9 19.1 23.2
3.1 2.8 3.2
50% 2013 2012 2011
33.0 36.0 44.1
46.5 42.9 39.3
17.7 19.8 15.5
2.7 1.2 1.2
60% 2013 2012 2011
35.7 35.2 37.4
40.9 44.2 41.1
20.5 18.3 18.4
3.0 2.3 3.1
70% 2013 2012 2011
38.6 37.9 30.9
41.0 38.6 39.4
17.4 18.6 25.1
3.0 4.8 4.6
80% 2013 2012 2011
32.5 38.5 39.4
44.5 38.5 40.3
19.5 19.9 18.6
3.5 3.1 1.8
90% 2013 2012 2011
34.5 33.3 36.1
44.4 42.9 38.9
15.8 19.8 22.2
5.3 4.0 2.8
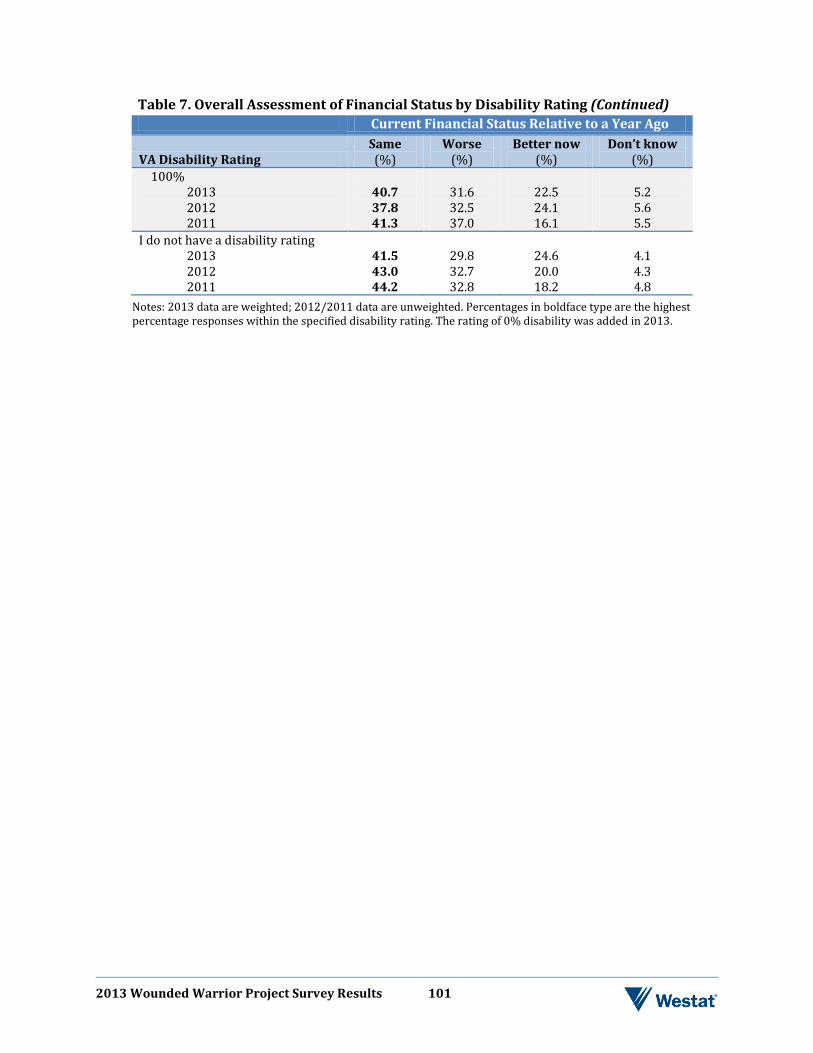
2013 Wounded Warrior Project Survey Results 101
Table 7. Overall Assessment of Financial Status by Disability Rating (Continued) Current Financial Status Relative to a Year Ago
VA Disability Rating Same (%)
Worse (%)
Better now (%)
Don’t know (%)
100% 2013 2012 2011
40.7 37.8 41.3
31.6 32.5 37.0
22.5 24.1 16.1
5.2 5.6 5.5
I do not have a disability rating 2013 2012 2011
41.5 43.0 44.2
29.8 32.7 32.8
24.6 20.0 18.2
4.1 4.3 4.8
Notes: 2013 data are weighted; 2012/2011 data are unweighted. Percentages in boldface type are the highest percentage responses within the specified disability rating. The rating of 0% disability was added in 2013.
2013 Wounded Warrior Project Survey Results 102
MAJOR THEMES IN SURVEY COMMENTS The following question appeared at the end of the survey:
If you have time, please feel free to tell us your opinion of the most challenging aspect of transitioning back into civilian life and how the Wounded Warrior Project or other Veterans service organizations can help in alleviating this challenge. In 2011 we analyzed all responses to this question. In 2012, because of the much larger survey population and number of competed surveys, we selected a random sample of 1,000 comments from a total of 2,249 comments to analyze. In 2013, we also selected a random sample of 1,000 comments from a total of 5,434 comments to analyze. Although the sample was selected randomly, we cannot confirm that it was representative of all comments. As an introduction to the major themes, we list notable differences in the 2013 survey comments that reflect different topics or changing topic emphasis from those observed in the surveys of previous years.
• There was a much more prevalent sense of uncertainty about what lies ahead and how long it will take to get through various stages of the disability process, transitioning, medical/mental health treatment, the job search process, etc.
• The recognition of multiple co-occurring medical and mental health issues was much more prevalent in alumni comments , although alumni’s comments on mental health problems far exceed the number of comments on physical health problems.
• There was increased expression of lack of confidence in those they depend on for treatment and benefits management.
• There is greater mention of problems specific to female veterans, such as military sexual trauma (MST), the stigma of being a female officer, and the assumption that female warriors are not exposed to the same combat horrors as their male counterparts.
• There are overwhelming concerns about the overall difficulty with finding employment, and the weaknesses of federal and state programs that theoretically assist veterans in obtaining jobs.
• There is a decrease in the mention of problems related to specific physical, mental, and emotional problems, PTSD, and TBI. This is, perhaps, because alumni are asked to list those elsewhere in the survey.
• Increased frustration was evident with difficulty in adapting to civilian life and a lack of appreciation from fellow citizens for their service.
• Differing opinions are expressed on whether those recognized for their service should include all who served or just those with significant/visible wounds.
2013 Wounded Warrior Project Survey Results 103
• Alumni report continuing difficulty figuring out whom to ask for help, especially within the military and VA health care systems and service organizations for veterans.
• The mention of a lack of benefits for dependents after wounded warriors transition from military service was a new theme.
• The louder cry for greater public awareness of issues related to the military, veterans, and the challenges they face when they return from service remains strong.
• The increased number of thoughtful suggestions about what might help solve the problems cited by alumni is also a continuing trend.
The number of comments received per theme on the following pages is provided in parentheses following the theme topic. Open bullets represent quoted material as written on the surveys. We deleted some words to shorten the comments or to remove information that could possibly be used to identify the respondent. Those changes are represented by ellipses (. . .) or by words in brackets indicating the type of information we removed.
Overarching Theme: Difficulty Adapting to Life at Home (317 comments)
Problems adapting to civilians/civilian life (converse problem – leaving structure of the military)
o also coming home is like a foreign country o There is no place for me in civilian life o the lessons I learned to survive in Iraq haven't worked in transitioning back to civilian life o I have a problem transitioning from military to civillian i dont know where to start o The most challenging thing has been adapting from military to civilian life, civilians tend
to not have the need for teamwork like the military o Civilian life is also tough because most people don't have the discipline and respect that
we get from the military. o Feeling stuck in between - not belonging in either realm - Military, VA, or Civilian.
Bridging the gap - laying planks - resources to build those bridges, confidence, normalization, encouragement and challenges to push beyond the limits.
o almost everyone in the civilian world has no sense of mission. It's a "me-me-me" world out there.
Need for public awareness around issues of those in military and returning vets o Most people in theis country have and never will see what we as Solodiers have seen.
Now that I have to deal with it on a daily basis i see how uninformed the general population is on matters concerning the war, world and our own country. makes me wonder if I am really seeing this differently….
2013 Wounded Warrior Project Survey Results 104
o Nobody understands what we did exactly. The media is worthless and forces non-military to create assumptions about what soldiers have done or have not done…
o I feel that it is hard to leave a family that has had your back for your whole career and leading troops to going to a job where people think they are above you, then learning about civilians that have no respect for what we have done for their freedom
o Most of them have no clue as to why they are able to live the way they do, or what we sacrificed to make it happen for them thinking they are entitled to what they have because they are in America.
o The public is fickle and emotionally reactive and cannot think rationally. People have no idea what is really going on outside or even inside their borders in the U.S.
Specific (Mental Health and Medical) Diagnoses (81 comments)
PTSD/TBI o Getting family to understand my PTSD o …because of PTSD all I could see was that I was going to fail and I'd lose everything
around me…. o I don't know what will happen when if people at school were to find out that I have
PTSD. o IS TOUGHT TO GET A JOB ANY WHERE WNEN YOU GET DIAGNOZED WIHT CHRONIC
PTSD o PTSD....Coming home a realizing I will never be this awesome again! Hyper-vigilance
and sense of impending doom or harm to family and friends. Driving, especially at night. Anexity control, understanding the "Warrior" mentality and comprehending what you are experiencing with PTSD/re-integration in a "Healthy" way.
o the commander said get over PTSD, I tried suicide 1 hour later o The symptoms of my PTSD seem sporadic, even unpredictable. There are days that are
ok, and days that are very bad. o My biggest challenge right now is dealing with the stigma people have of me because
PTSD. They see it as a weakness and very debilitating. o For me it has been dealing with my PTSD and tbi o Alot of the forms are very difficult to fill out for wounded veterans that have traumatic
brain injuries with blurred vision. more assistance needs to be given to help them fill out the form and explain it to them.
o Getting proper diagnosis and treatment options for TBI related symptoms.
Mental/emotional health/cognition issues o Very hard to learn and take crowds. Scared of being stupid. o My memory and focus are horrible but do not receive treatment that addresses it and
have been told the VA requires too much red tape to attempt medicine for it. It really takes away from my quality of life as it is hard on my family to see me have so much trouble with pain and the focus.
2013 Wounded Warrior Project Survey Results 105
o I have an extreme difficulty planning my days and I feel no one takes me seriously. I can't concentrate on anything
o Being unproductive, unable to maintain my house and area, losing all future plans, losing mental and physical abilities, losing ability to concentrate
o I think the hardest thing is my memory is shot and makes school extremely difficult. o I want help but can't focus or actually complete a task to get the help i need. It's a
miracle i got thru this survey.
Mental Health/Emotions/Attitude (481 comments)
Feelings of Loneliness/Depression/Hopelessness/Stress/Anxiety o Ever since I returned back from Iraq this last time, my anxiety is through the roof, my
bad dreams are more intense, my anger is horrible, and my depresseion depresses me. o anxiety, stress and inability to relate to this world anymore o I have problems with anxiety and depression and residual PTSD. I have issues with
communicating with other people. o I m nervous and scared about the whole transition
Apathy/Lack of Purpose/Lack of Motivation
o I just felt lost and I still feel lost. o not knowing what to do with yourself-you feel like you are in a foreign country-alone,
helpless, lost feeling o I don't feel real anymore. I don't know who I am and can't See my purpose if I have one. o For me the most difficult part is finding purpose. Never really had to think about my
purpose when i was in the Corps. o I don't feel real anymore. I don't know who I am and can't See my purpose if I have one.
Difficulty Coping
o Felt like I didn't have anyone to turn to that could show me the ropes of being a civilian again and coping with the new feelings I was dealing with.
o I think the most challenging is learning or finding the ways to cope with my personal disabilities the best that i can. Come to reality, be ok with, and except what i was handed to me and keep moving forward. It's tough…..
o well coping with stress and controlling outbursts.. have lost sever jobs due to behavior...
o The frustration of trying to cope with the feelings inside, but surrounded by others who aren't willing to understand that you're different now.
2013 Wounded Warrior Project Survey Results 106
Feelings of rage/anger o Anger control. I am frustrated with those around me, especially when driving. I expect
everyone around me to move with the same sense of purpose I exhibit, even though I understand rationally that's not true. I have road rage. Specific counseling and training about mitigating this would help, as I understand many experience this specific thing after returning from downrange.
o Just two nights ago I was ready to explode and drive to… from…due to their incompentencies.
o I feel at times like a ticking time bomb about to go off and when I do it's like I have a lot of stuff fueling me at one time.
o I need some Anger management help also. o I tend to avoid places because of the civilian mentality because it makes me mad at
times and on occasion I get to the point of rage and it never turns out well. o I trust no one! Im alone and have been screwed and let down so many times I feel why
even bother... Sorry for the rants but I have had almost as much as I can take.
I have changed or lost part of myself o The biggest challenge is accepting the new me after deployment and the expectations
others have of me who knew me before deployment. I'm not the same person and never will be... It is very hard to explain this to family and friends.
o Relating and missing what you were before injury o All people focus on is how you changed and from that you immediatly feel like what you
were was better. o My wife has stayed with me even though, I am much different than the man/boy that
she fell in love with. o Realizing that I am not the same person mentally and Physically that I was before
deployment. Trying to get Others to understand my views and experiences o you feel like time has passed you by and you dont belong, i think the families need to
know this and how to deal with it o Feeling lost, losing what made me, me….Not being able to run 5 miles anymore.
Trust Issues
o basically trusting people. o the hardest with transitioning back to civilian life would have to be the loss of the
brotherhood and trust you have for the people around you. not sure how to fix thisbeing able to trust some one and open up again towards people after being hurt while in the process of doing that.
o Trusting people that have never been through what I've been through. o Trusting people that are not veterans, and even some veterans. o The hardest thing about transitioning back into civilian life is realizing that not everyone
stateside is a possible threat. Trusting those around you.
2013 Wounded Warrior Project Survey Results 107
Military members/families not feeling cared for/taken care of (refers to society in general as well as to service providers—especially military and VA)
o I feel that more needs to be done to help people who rely on their spouse to do and deal with the hardships of having a Wounded Warrior. I am not sure what can be done. But at times it is almost like we are an addtional burden placed on our spouses, on top of everything that they already do for us and our Families.
o (Need for) Free marriage and family counseling o …a phone call inquiry into how we doing could be beneficial to ascertaining how we are. o Having a seamless transition from having all military doctors to now having VA and
civilian doctors should be better prepared and planned. Having more family involved programs and events that include the whole family. Often times a warrior is not willing to leave his caregiver spouse or children for a period of time.
o Felt like I didn't have anyone to turn to that could show me the ropes of being a civilian again and coping with the new feelings I was dealing with.
o I have been extremly frustrated with all Federal Government and Veteran's Service organizations in their lack of compassion for addressing issues….
o I can home in 2004 as a reservist. There was nothing in place and i was the first female oif vet to go to my va. Detailed out as a primary gunner in iraq, i had a hard time convincing drs that i did what i did.
o civilians do not understand veterans issues when you get out...your just a face in the crowd...nobody really cares about your story
Transition Process, General (617 comments)
Financial issues o it was that I had no time or didn't make time, now it's that I lost my job & limited to the
money I have for transportation. The VA has an error with my record and doesn't have my current dd214 & has sent bills. that error wasn't there before deployment and it is such a hassle…
o There are many financial areas that I need help with.. I don't know of or where that's available.
o And now, my credit sucks because I took such a big paycut, its hard to pay my bills now, so my credit has taken a big hit for now.
o I think…and finance is the hardest part. Every warrior I know has had some kind of short tem finance problem which usually leads to problems with their marriage.
o I had to take college loans to help offset living expenses and make important home repairs; which is currently in deferment. I am down on luck, but not out!!
o It's been harder making ends meet since being medically retired. My spouse retired from active duty last year too and is 80% disabled. There is little in our small town that he can physically do for employment. Just before I was notified of my PEB, we bought our current home. Our last home was flooded and we could not physically rebuild so we were forced to move and sell the property at a loss. It took a huge chunk out of our
2013 Wounded Warrior Project Survey Results 108
savings/retirement(TSP) paying for that home loss and living expenses while awaiting VA benefits which took 8 months for my husband and 4 months for me.
o the most challenging aspect for me and my family is the change in income and insurance for my family.
o Waiting the 19 months it took the military to complete all my paperwork we had to deplete our savings, retirement accounts and max out our credit cards just to make ends meet…. We kept one car and cut out all non- essentials. We are just now starting to see some relief but if anything happens we are without resources. Tried to get our mortgage refinanced but since we had been late by a few days a couple of times, we did not qualify. The financial strain has affected all aspects of our lives. I went from a 740 credit rating to something in the 400's due to 19 months of 1/2 pay.
Timing/Uncertainty around discharge and transition o The fact that I had no job and did not know my end date until the very last moment and
that put me into financial uncertainty. o My only issue is the dwell time between returning home and returning back to work. o It took me about a year to get back on my feet because I finally got my Disability rating.
If there was a way to speed that up, or give people leaving the military transitional pay that would be very helpful.
o Fear of unknown as to what I can do to earn a living after active duty and fear I may never be able to live at home again. I am presently living in barracks due to my problems and how it is affecting the family
o Now that I am being medically retired, how am I going to take care of my family with less money than I used to make. I m nervous and scared about the whole transition, but mainly it is financially based fear.
o i am having difficulty in the transition because i can no longer be in the army and i can no longer do my civilian job.
o The unknown after twenty years of Service and having everything I needed in front of me, and then having to go and look for I needed it was kind of difficult. In the military I knew the territory and whas was expected of me as an NCO, in the civilian sector no one was telling me what to do and I had to find out on my own what was expected of me.
o I am currently in CBWTU still waiting for them to let me get the health care I need, I have no job when I transition from active duty to national guard. I am concerned about schooling, I dont know when I will be getting surgery and I dont want it to interfere with my program.
o The most challenging aspect was being MEDEVAC'd to Landstuhl, Germany for surgery then sent home after 14 days thinking I was being sent back to (state deleted) for surgery. Instead I was sent to a WTB (base deleted) and didn't see a doctor for a month while I did transition paperwork. I think what would be helpful is giving soldiers a timeline and instructions on what is going to happen to them when they are MEDEVAC'd out of country to the states. I think the WTB needs to reassess it's program and give care first, then provide transitional information during a soldiers recovery.
o Time, feels like My life has been put on hold, I feel like if your going to kick me out then do it, or let me go back to work.
o The uncertainty of how long I will take to transition or how I will respond to my surrounding due to me being in a WTU for quite some time. Having a transition
2013 Wounded Warrior Project Survey Results 109
program where I am able to stay, like a half way house just not a bad place, to gradually work my way into my normal activities.
o The BIGGEST problem is the inability to PLAN on my transition. I feel I can speak on behalf of many service members going through the same thing during this process. I am constantly told by numerous different personnel involved in the IDES process numerous different timelines for transition. These range from currently 2-12 months. My ability to plan on my transition stops at knowing a reasonable DATE that I will transition. Sadly, I will find out near the end of the process and because of this will have to quickly adjust and hopefully have employment in place to continue my pay and support my family.
o … but there's other factors that need to be fixed in the DOD and VA system that would help to limit the stress of transiting. Waiting game for benefits to start adds 100% more pressure financially, and if there's something not correct with the VA system there's more time lost
Need more transition assistance for families, as well as military member or Vet o The most challenging part was preparing not only ourselves but our families as well.
They have no clue on how to handel us or what to expect; and frankly neither do we..... o The military does nit train us to be civilans, a longer TAPS program with a lot more
resources is needed. o The hardest part was starting over and trying to take care of my family also. It's hard to
believe but the military shelters us from the real world and it makes it challenging during the transition.
o The most challenging aspect to me during the transition was applying the discipline and self-control that I had been taught while I was in the Marines. Having someone there as a type of mentor would have been beneficial.
o At the time I transitioned not much was known to Me so finding the resources to get help and other veterans who I could talk to was the challenge. Transition difficulties specifically because of disabilities
o When I was injured I came home and my unit just left me to find my own doctor and deal with my injuries on my own. I was very frustrated and did not know where to turn. As a result I did not get my TSGLI or my continued pay for active duty I was thrown back to reserve status and to deal with all the medical issues I had. I am still trying to get my house adapted and to get my TSGLI payment. After 8 years I am still trying to survive without any help.
o We as veterans should be able to rely on these counselors to help us find what is our best options from transitioning out the military to civilian life. I have exhausted all options and resources that i have had. Which wasn't much by the way. My concern is this. I will not be the first nor last veteran with TBI or other disabilities that will best suit them if they went through a self employment track. … I feel there is importance for all veterans to be aware of any kind of help thats available to assist or advocate for them through their process of self employment or any issues with VA Voc Rehab so they can move on with their lives in a timely manner.
2013 Wounded Warrior Project Survey Results 110
Difficulty finding/keeping job
o The biggest obsticle I had wa finding a job. It was because, its hard to tell employers about the stress and ptsds. They act like it doesnt matter but naturally it does. If they can hire someone without those problems compared to having them they will always pick the person without.
o Also, trying to get a law enforcement job when you have a disability rating from the VA over 50%. They do not tell you that is why they are not hiring you but it is an assumption based on their criticism of why you have the rating and the risk of hiring you rather than someone who is perfectly fine.
o Finding suitable employment, o Finding gainful employment full/part-time. o The biggest issue I face is trying to find well paying employment without a college
degree in my area. I feel behind many of my peers in this aspect as a direct result of military service as I never felt I had adequate time during my career to make civilian education a high priority due to operational tempo of my units. I have been relying on these organizations to help me develop and educational goal/plan and use my veteran's benefits to take advantage of educational opportunities.
o The inability to maintain a schedule, and then trying to find employment with that inability.
o Locating and securing meaningful employment and employment that pays a fair wage or salary.
o Perhaps I could benefit from some good resume tips and advice. o I have applied for jobs that are supposedly Veteran friendly and yet I get no reply/no
job. I am a Veteran and my husband is 90% disabled, he cannot find a job either. o finding work in my area. it took me six months to find a job, and it is a terrible job with
terrible pay and no insurance of any kind o I find that looking for work is hard because I havr no college education & Im nervous
about going to school with people Ive never met. o I wanted to be a police officer but that went out the window bc of the diagnosis I carry. o The multiple rejections from employers, which leaves me feeling like a failure as a
husband and father. o well coping with stress and controlling outbursts.. have lost sever jobs due to
behavior...
Difficulty translating military training/experience to civilian world o Transferring military skills to civilian work is very difficult. o Finding a place to fit into the world that will provide the same satisfaction military
service has and applying the skills that have been acquired and adapting them to civilian life.
2013 Wounded Warrior Project Survey Results 111
o The most challenging aspect for me as well as most people I know is being the go to guy for the country. Being responsible for millions of dollar of equipment, peoples lives and well-being. Were we (soldiers) are a priority and on the job market we are not qualified.
o A big challenge is having somebody to translate your military career in to civilian language. Also having somebody that can physically do your private sector and government resumes would be beyond helpful and a stress reliever.
o Transitioning from female soldier to a lady has been very difficult. I still struggle with leadership skills. I lack motivation and drive to make things happen.
o Helping us adapt our military skills and experiences is a huge challenge, and it really takes personal assistance to do this.
o The hardest part of transitioning is translating the leadership skills of an NCO to corporate America. Just because I do not possess a B.S. or B.A. degree does not mean I am not competent enough to lead an organization or fill a position. As a SSG I have lead clinics and have been a property book holder of close to a half a million dollars, but the civilian sector does not acknowledge that kind of experience. Those types of core intangibles cannot be taught the way the Army has taught me and I think getting that translated is the hardest part.
o Get Federal and Private Sector HR Specialists that reveiw resumes to actually learn what the military is about, how we operate, and the general duties and responsibilities of certain ranks, and the difference between ranks and billets (and what duties/responsibilities come with what billets) so that they might further understand what a veteran applying for a job is capable of/qualified for. Get more hiring officials in the government that actually know about, and how to utilize, all the Special Hiring/Direct Hiring Authorities for veterans.
o The biggest issue I had was the lack of documented educaton. I had the skills needed to preform the tasks needed based of my military service and service school but without a degree from a college it was hard to find employment.
Difficulty finding a local support system, especially in states with no military base o Felt like I didn't have anyone to turn to that could show me the ropes of being a civilian
again and coping with the new feelings I was dealing with. o Have resources closer to where I live. o It is hard for me as I moved back to my home town and there is no military base around
here, and the general population does not understand or have a lot of experience with the military.
o All my injuries are under clothes and hidden so I look "normal" to everyone when really I have pain on a daily basis and no one really knows or understands. Connecting with others like that would help
o I'm very isolated o I thought moving back to the (base and city omitted) would make all my problems go
away. I thought the community here was more supportive, but I feel more alone than ever. I do not talk to my old buddies that are here like I thought I was going to. I am
2013 Wounded Warrior Project Survey Results 112
desperate for help but don't know or nor want to bother anyone, I tend to deal with all my issues on my own.
o In (base and city omitted)...there are literally NO activities for veterans, especially disabled. I feel cut off from the community of veterans and I actually feel jealous when I see events that are in NY or somewhere far away that I can't participate in.
o It would be nice to have a support group in my area where we can just sit around and shoot the bull.
o Feeling disconnected due to geographic area. Missing the support of the warrior transition unit.
o Being in the NG in a state without an active duty base has caused a lack of resources
Transition Process, Military/VA (202 comments )
Difficulty getting information on programs, benefits, services o Need more information about VA benefits. o Insurance for dependants and everything that could be entailed including costs o letting the troops know what they are entitled to from the V.A. or any other source
when they get home and are ready to get back to life. o I feel a complete disconnect when it comes to the VA system, which I find infinitely
confusing. While I would love to use the VA system for service related health issues, I find the multitude of phone numbers and run arounds to be intimidating, so I give it up. I find it easier to do research for a 50 page master's thesis than to navigate a VA site looking for information how to make a doctor's appointment.
o My biggest obstacles are in my home; cleaning and cooking. I have no help. I have looked into state and VA help. There is none. The programs are either full or there is no funding.
o it stinks Im lost out here feel hopeless of recieving my rating for VA Benefits have no insurance except VA cant find no one to help with federal resume tried with VA for Vets that was a joke after explaining to the girl on the phone I dont know anything about how to do a resume she didnt help I tried calling humane resources at the…(name omitted) for help left multiple messages and never got a call back VA says they will help and I feel its a lie
o I do not have one place to go to find out about what pay and services I will have when I get out.
o The biggest challenge I faced was due to my being a Guardsmen who was mobilized for active duty, then after our return we were demobilized and returned back to our unit. But my enlistment in the Guard was up. So I was immediately discharged (honorably) and thrown back in to civilian world without any guidance from my unit, the VA, the state Dept of Military Affairs, or DOD.
o The main problem is that various organization in relationship to helping the soldier or wounded warrior are noit familiar with the many programs as they relate to their
2013 Wounded Warrior Project Survey Results 113
organization. I very seldom got a yes or no answer, only to look on the internet and "I might find something there".
Difficulty negotiating systems, especially military and VA disability process o Feeling victim of the long VA rating and military medical separation process. o The VA/Disability procedures are a joke. Deferring serious injuries, such as TBI, and
compensating for routine disabilities is seriously misguided and skewed. o The biggest challenges I face are the uncertainty of the PEB process and not knowing
when I will actuall be transitioning out of the military, the second biggest challenge is the inaccuracy that has taken place during my MEB/PEB process.
o The most challenging aspect of my transition so far has been the inability for the system to recognize that I have been injured in the line of duty.
o I'm still on med con orders. The most stressful thing is I'm still in the recovery process and everything I have to have my orders renewed (every 1.5-2 months) they always tell me that the orders may not be renewed. I did not do this to myself. The Military did. The stress on myself and family is completely unwarranted. I can't imagine what it does to the lower ranking service personnel. The military should make a commitment to have you complete the healing process, without threatening to take you off orders every couple of months.
o Also, I still have not filed for disabilities due to the anxiety of lining up the dominoes. o CONCERNED ABOUT DISABILITY PERCENTAGES o lack of belief from providers about the extent of my injuries and how they occurred
because of lack of medical records and other records from combat. o retirement process is a…joke, was on a med hold for MEB and was retired without being
told, I just stopped getting paid so I stopped going to work. I was never outprocessed prior to retirement date.
o Most of my issues with the Army and VA disability process. It's not about proving my case on my medical records reflect my issues, my problem is both the Army and the VA refused to acknowledge these injuries and no one is help me fix this problem
o The people where I transitioned did not complete my MEB, so my rating was not available. I had to contact the VA chief himself to get it remedied, and I am not sure if it actually is. There have been many hurdles, most of which I still haven't overcome.
o The VA and the DoD tell you they are going to take care of you when you are wounded and get out. Yet as a SSgt with 11 years in the [Service branch] who's got a Purple Heart with 4 combat tours gets 90 percent disability for his CRSC which is 120 a month. …and i'm picking up scrap metal on the side of the road to try to put food on the table for my family. The system is so messed up but i guess i didn't realize i was signing up for an organization that i could die for and because i didn't i will struggle for the rest of my life finanacially…
o I am waiting over 2 years for a favorable Social Security ruling that I probably would have received right away if the VA rated me correctly and on time.
2013 Wounded Warrior Project Survey Results 114
o Time, feels like My life has been put on hold, I feel like if your going to kick me out then do it, or let me go back to work.
o make things go faster and correctly ie treatment... rating reprocess
Services delivered by others with military experience would be helpful/Advocates/Mentors needed
o I feel it would be easier if there were veterans (battle buddies) willing to mentor or help with the transition from military to civilian life. I feel it would be easier because we would be able to relate to them and they would be able to guide us in the right direction because they have already gone through it. For example in the Marine Corps we have Marines that already knew the ropes and were tasked to help out the new Marines with their transitioning… I feel many veterans would be able to benefit from some kind of program that would be able to ease this transition.
o Connecting with others with the same struggles makes me feel less crazy. o Also talking with older veterans is very helpful. o Having more events where Veterans from different eras can get together and share
their experiences. o WWP or other Veterans organizations can help by continuing to facilitate social
activities that bring veterans together to make connections with others with similar experiences or challenges and expand existing individual support networks.
o …coming home is like a foreign country maybe if there was a Facebook page for wounded warriors to connect...
o I think the greatest challenge for me has been being so far from others who experienced similar situations.
o The most challenging aspect of transitioning to civilian life for me was finding friends and other Veterans who I share similar interests with and finding people I can trust
Sources of Help (52 comments)
WWP o I was thrilled to get a call from WWP around Christmas since I have no family nearby.
Thank you. o WWP and the fed gov set me up with Operation Warfighter, where i was able to use my
clearances to gain an internship within the IC and eventually prove myself worthy of attaining a full time job as a GS-11.
o WWP has gotten me included in activetiys and has help with info o Wounded Warrior Project and Veterans service organization have been a great source. o I am very pleased with all the information the wwp has provided o Wounded Warrior Project has helped me get some of my self confidence back, I am so
thankful for this program… o The wwp and va helped me find people that struggled just like me. The world didn't
seem so empty anymore.
2013 Wounded Warrior Project Survey Results 115
Military and Veteran Buddies o I am a member of the IAVA-COV (online), go to my local DAV meetings, and the
American Legion rep, very much helped me before retirement. o Talking to fellow Veterans helps…
VA and Vet Centers
o through the VA mental health…and 2 yrs of work I was able to get some of my life back and they have been a great help with all my physical problems mostly
o The other saving grace was the VET CENTER, which stuck with me through all of this VA…and now supports my work in AA and I can focus on my combat trauma's. I really like what you guys do and someday will give back to you.
o VA, WWP has helps us a lot.. o I started new medication and am feeling somewhat better, so I have the VA to thank for
that. o for the most part the VA was helpful in helping me to understand what was going on
with me mentally o The wwp…helped me find people that struggled just like me. The world didn't seem so
empty anymore. o I was prepared to the best of my ability for what I was to expect in combat but my body
was not and tha V.A. was able to assist me in recognizing that and prescribing help measure to cope with it.
o My theropy at the VA…has also been a big factor in my recovery. o va counselars helped and the rest just took time. o I have found the most help by a supportive family, the Vet Center counselor, surfing,
and a shift in focus to positive things.
Some specific individuals/programs in military and community settings Individuals and programs mentioned were in a variety of public and private settings and roles.
Barriers and Roadblocks Encountered (166 comments)
Department of Veterans Affairs (red tape, lack of information on benefits, denial of benefits) o well im not getting the care from the va that i should be receiving o My memory and focus are horrible but do not receive treatment that addresses it and
have been told the VA requires too much red tape to attempt medicine for it. o I have been ill for 6 months and the VA blew me off saying it was PTSD. I used Tricare
and was diagnosed with SLE: a serious auto-immune disease. o Everything in va takes forever o The most challenging issues tend to be the VA and difficulty navigating their
bureaucracy from medical appointments and adaptive equipment. Another one is the continual increase of out of pocket costs to TRICARE users.
2013 Wounded Warrior Project Survey Results 116
o Another big challenge is the VA, too many soldiers have suffered to "this war at home". I have personally lost friends that I served with to suicide because of lack of attention from the 1 organization we were supposed to really be able to lean on when we got home.
o Need help with VA claims. Appealed one two years ago and still no decision. o there's other factors that need to be fixed in the DOD and VA system that would help to
limit the stress of transiting. Waiting game for benefits to start adds 100% more pressure financially, and if there's something not correct with the VA system there's more time lost
Problems With the Military o I used a couple of different military services to help me transition back into civilian life.
Overall they are just a smoke screen to make it seem like they will help. They talk to you for a bit then you are on your own to figure out everything and try and get what you need on your own. Programs need to be done to where they will actualy help the people get what they need and not just look good on the outside.
o The military should make a commitment to have you complete the healing process, without threatening to take you off orders every couple of months.
o My discharge did not meet regulation. No resources on fixing the problem. After 7 years, I'm finally getting a packet together to send to military board of corrections because another veteran told me about VSOs.
o Everything was a struggle. The military made me feel like I was unprepared. It says difficult to get the GI Bill started. The military did not give me any tools to work with and it was overwhelming. Even getting my W2 the following year was challenging. Once the military was done with me, they were done.
o The biggest challenge I faced was due to my being a Guardsmen who was mobilized for active duty, then after our return we were demobilized and returned back to our unit. But my enlistment in the Guard was up. So I was immediately discharged (honorably) and thrown back in to civilian world without any guidance from my unit, the VA, the state Dept of Military Affairs, or DOD. I was lost for quite awhile and if I was not in a position to independently explore the resources available to me and self advocate (which many veterans are not) then I would probably still be lost.
Military/VA disability process (slow, questions about fairness) o i've never been in a worse financial situation in my life. The VA and the DoD tell you
they are going to take care of you when you are wounded and get out. Yet as a SSgt with 11 years in the Marines who's got a Purple Heart with 4 combat tours gets 90 percent disability for his CRSC which is 120 a month.
o The VA…in delaying my disability award. When I got it, it was wrong. o Im lost out here feel hopeless of recieving my rating for VA Benefits have no insurance
except VA
2013 Wounded Warrior Project Survey Results 117
Federal employment o Getting a federal format resume completed took a lot of work, much longer than a
civilian standard format resume. Understanding the federal hiring process. o I HAVE BEEN LOOKING FOR A JOB NOW FOR 28 WEEKS, MOSTLY GOVERNMENT JOBS,
EVEN WITH MY 10 POINTS VETERAN PREFERENCE, OUT OF MORE THAN 100 GOVERNMENT JOBS I APPLIED FOR, I ONLY HAD A FEW INTERVIEWS AND NO OFFERS. THE US GOVERNMENT SHOULD HAVE TRAINING PROGRAMS FOR VETERANS WITH COLLEGE DEGREES.
o I left the military with goals to become a Border Patrol Agent and because of our federal budget problems, they have no money to put people through academy. So instead of becoming a Border Patrol agent in the time frame that I needed, I was forced to go back to school. I am still able to get the job when they get money, but someone really needs to help veterans to transition to other federal service without hardship.
o Getting Resume done converting military experience to civilian and the lengthy process of applying for GS positions.
WWP (these tended to be about lack of WWP services/activities in respondent’s locality, lack of return calls to alumni, and need for more timely information about WWP events)
2013 Wounded Warrior Project Survey Results 118
CONCLUSIONS Despite a large increase in the number of WWP alumni over the past several years, the demographic profile and annual survey responses from WWP alumni have remained noticeably consistent. WWP continues to attract and serve veterans and service members who sustained serious physical and mental injuries and emotional problems during their military service since September 11, 2001. It is not surprising that this special “wounded warrior” population reports disproportionate challenges in successfully transitioning to civilian life. In this closing section of the report, we highlight and discuss survey findings that reflect those challenges.
PHYSICAL AND MENTAL HEALTH
About half of alumni assess their current health as being fair or poor. The 2013 findings for the mean scale scores from the RAND-36 Health Status Inventory continue to indicate relatively low quality-of-life scores for WWP alumni in various health functional areas: physical functioning, role limitations due to physical health, role limitations due to emotional problems, pain, energy/fatigue, emotional well-being, and general health assessment. Scores range from 34.5 for energy/fatigue to 60.3 for physical functioning on a 100.0 point scale, with higher scores representing a better health status. More than half of alumni (54.2%) said they are limited a lot in engaging in vigorous activities, and 3 in 10 said they are limited a lot in walking more than a mile or climbing several flights of stairs.
Many alumni marked new response options for physical injuries that were added to the question about severe physical and mental injuries they sustained during military service since September 11, 2001. For example, 57.4 percent reported severe back, neck, or shoulder problems; 37.3 percent reported severe knee injuries or problems; 17.1 percent reported severe hearing loss; and 52.1 percent reported tinnitus. In addition, in response to a new open-ended question asking alumni to describe severe physical problems that were not listed as response options, many alumni (30.1%) described a wide range of external and internal physical health problems that cause pain and limitations in their daily activities. Physical problems reported most were injuries to the ankle, foot, hip, hand, head, and lung as well as fractured bones. When appropriate treatment is not available or not received, many physical health problems are likely to worsen over time and may adversely affect future employability because of increased disability. It is important that warriors with such health issues enroll with VA and report their health problems during the VA eligibility period that applies to them.
The survey results indicate that for many alumni, the effects of mental and emotional health problems are even more serious than the effects of physical health problems. The 2013 survey findings indicate that three-fourths of WWP respondents screened positive for posttraumatic stress disorder (PTSD), as measured by self-reported responses to the Primary Care PTSD scale included in the survey. This incidence of self-screened PTSD is much higher than the incidence reported elsewhere for service members who were deployed to Iraq and Afghanistan (Ramchand, Schell, Karney, et al., 2010). But studies also indicate that PTSD may be underreported by some veterans because they feel disclosure may have adverse impacts on
2013 Wounded Warrior Project Survey Results 119
their careers or they fear being stigmatized (Bagalman, 2013), and by DoD if it relies primarily on an initial screening immediately after return from deployment and does not screen again several months later (Milliken, Auchterlonie, & Hoge, 2007).
Many alumni marked two new response options related to mental and emotional health in the survey question asking about injuries and problems experienced during military service since September 11, 2001. About 7 of 10 alumni (68.8%) reported they suffered from depression, and 73.9 reported anxiety. These results are not surprising. Studies show a relationship between depression and posttraumatic stress disorder. Also, anxiety, particularly in crowds, is often reported by service members who have deployed to combat areas. For the new open-ended question asking about other severe mental injuries alumni have experienced, many described nervousness, sleep-related problems, nightmares, memory loss, and anger.
The percentage of alumni reporting traumatic brain injury (TBI) has declined over the past 3 years. In 2013, 44.6 percent reported they experienced TBI during their military service, compared with 48.8 percent in 2012 and 51.0 percent in 2011. This condition continues to seriously affect both physical and mental functioning in many wounded warriors.
How do their physical and mental health problems affect the daily lives of WWP wounded warriors? For many activities, mental and emotional problems interfere more than physical health problems with their activities. For example:
• When asked separately about the extent to which physical health/emotional problems interfered with normal social activities with family, friends, and other support during the past 4 weeks, 59.0 percent of alumni said emotional problems and 49.7 percent said physical health had interfered extremely, quite a bit, or moderately.
• In response to the followup question about how much of the time during the past 4 weeks those health problems interfered with their social activities, one-third (33.9%) of alumni said their mental health had interfered with their social activities all the time or most of the time. In comparison, about one-fourth of alumni (24.1%) reported that physical health had interfered with their social activities all the time or most of the time.
• In addition, 55.7 percent of alumni said emotional problems and 48.5 percent said physical health problems had contributed to cutting down on time spent on work and regular activities during the past 4 weeks.
Among employed alumni, however, the mean numbers of work days missed in the past 4 weeks was about the same for those answering about the effects of physical health problems (6.5 work days missed) as for those answering about the effects of mental health problems on work attendance (6.9 work days missed).
The reports of sleep problems earlier in this section are reinforced by other 2013 survey findings. The alumni score on the Medical Outcomes Study Sleep Adequacy Scale is 29 out of a maximum score of 100.
2013 Wounded Warrior Project Survey Results 120
The 2013 survey results also indicate continuing behavioral health problems for some alumni, such as use of tobacco products and at-risk drinking. Many alumni will benefit from losing weight. Four of 10 alumni (40.8%) are obese, and about another 4 of 10 alumni (42.0%) are overweight. These behavioral health problems likely continue for various reasons, including both insufficient internal motivation to adopt healthy behaviors and related health conditions that affect such motivation, such as PTSD, depression, anxiety, pain, fatigue, and limited physical mobility. Many alumni may benefit from specialized counseling designed to improve their motivation to change their health-related behaviors. Some alumni, in their open-ended comments at the end of the 2013 survey, spoke well of the assistance they were receiving at Vet Centers for substance abuse and other health problems:
“The other saving grace was the VET CENTER, which stuck with me through all of this VA…and now supports my work in AA and I can focus on my combat trauma’s.”
Also, many alumni need more access to the types of adaptive sporting events sponsored by WWP and to exercise facilities with staff trained to accommodate the needs of wounded warriors.
Despite many recent actions and pledges by the Department of Veterans Affairs (VA) and the Department of Defense (DoD) to improve access to and the quality and timeliness of care for wounded warriors, the need for improvement is still great (U.S. Government Accounting Office, 2012). As in 2012, just over a third of alumni (34.2% in 2013) said they had difficulty in getting mental health care, put off getting such care, or did not get needed care. About forty percent said one of the difficulties was that they had inconsistent treatment or lapses in treatment (e.g., canceled appointments and switches in providers). Also, despite efforts by the Services to encourage service members to seek health care for their problems, 28.1 percent of alumni said they are concerned their career plans would be jeopardized if they seek care and 24.6 percent said they felt they would be considered weak for seeking help.
Alumni rely on a variety of resources and tools to cope with feelings of stress or emotional health concerns. The three resources most commonly reported include “Talking with another OEF/OIF veteran” (56.7%), “VA Medical Center” (54.1%), and “prescription medicine” (48.2%). The two resources they said have been most effective in helping them cope have been “Talking with another OIF/OEF veteran” (24.2%) and “VA Medical Center” (19.6%).
ECONOMIC EMPOWERMENT
Data from the U.S. Bureau of Labor Statistics (BLS) make it clear that, although the unemployment rate is going down and the economy is improving, not everyone is sharing in the growth. As noted earlier in this report, the employment situation is especially challenging for wounded warriors. And employment problems usually create or exacerbate financial problems.
Only 45.5 percent of alumni are currently employed full time. Thirty-two percent of unemployed alumni have been actively seeking work for 27 weeks or longer. About three-fourths have less than a bachelor’s degree or higher.
2013 Wounded Warrior Project Survey Results 121
Concern and anxiety about the transition to civilian life weigh heavily on many wounded warriors. Alumni reported many factors that make it difficult for them to obtain employment or change jobs. The top 3 of 18 factors were mental health issues (29.7%), insufficient education (22.1%), and not physically capable (20.9%). A recently published study (part of the Millennium Cohort research series) assessed the impact of prior deployment experience on civilian employment after military service (Horton, Jacobson, Wong, et al., 2013). The researchers concluded that mental disorders such as depression and panic/anxiety and poor physical health may affect the ability to find or maintain employment after discharge or separation more adversely than prior deployment experiences or PTSD do.
Other transition difficulties were also described in alumni comments to the open-ended question about the greatest challenges during transition to civilian life. Many comments addressed health issues, particularly mental health issues; problems with various aspects of the DoD/VA Integrated Disability Evaluation System process; lack of support for Reserve and Guard members when they are discharged; problems in translating military skills to the civilian workforce; and differences in military culture and civilian workplace cultures.
“The biggest challenges I face are the uncertainty of the PEB process and not knowing when I will actual be transitioning out of the military, the second biggest challenge is the inaccuracy that has taken place during my MEB/PEB process.”
“The biggest challenge I faced was due to my being a Guardsmen who was mobilized for active duty, then after our return we were demobilized and returned back to our unit. But my enlistment in the Guard was up. So I was immediately discharged (honorably) and thrown back in to civilian world without any guidance from my unit, the VA, the state Dept. of Military Affairs, or DOD.”
Many of the job barriers reported by WWP alumni and their comments about their greatest transition challenges are echoed in a recent study (Veterans’ Employment Challenges) conducted by Prudential Financial, Inc. (2012). A survey of veterans and soon-to-be veterans was conducted, with a heavy weight on Gulf War-era II veterans. Two-thirds of the veterans said health problems related to their military service made their transition more difficult. When asked about greatest challenges in transitioning to civilian life, two-thirds of the veterans indicated that finding a job was the greatest challenge (primarily because of the economy and difficulty in translating military skills to civilian work). Navigating the benefit and support system for veterans was the number two challenge, reported by 53 percent. Veterans in both the WWP and Prudential surveys also reported other similar transition challenges, including much concern about “what comes next.”
Financial issues continue to be a concern also for many WWP alumni. The survey findings provide some details on important measures of their financial status. About half of alumni employed full time received less than $45,000 in work-related income, and about half of those working part-time received less than $15,000 in the past 12 months. That income was supplemented in some households by spouse/partner income. In addition, 71.4 percent of alumni received income from various benefit, cash, and disability programs. About one-third of
2013 Wounded Warrior Project Survey Results 122
alumni received $20,000 or more from the benefit, cash, and disability programs in the past 12 months.
As with other civilian adults, the most common forms of debt among WWP alumni include car loans, credit card debt (unpaid balances), and home loan/mortgage debt. Home ownership with an outstanding mortgage has been steadily declining among alumni since 2011—currently, 43.6 percent own their homes with an outstanding mortgage, down from 52.7 percent in 2011. Among alumni younger than 35, only 31.5 percent own their homes with a mortgage. As noted earlier, the Pew Research Center recently reported that adults younger than 35 were shedding debt, primarily car and mortgage debt, from 2007 to 2010.
A new WWP indicator related to alumni economic empowerment focuses on the ratio of total monthly debt payments to total monthly income. Among alumni who reported they currently own their own homes with an outstanding mortgage and who answered the income questions in the survey, 62.1% have a debt-to-income ratio greater than the general VA mortgage guideline of a ratio of 41 percent or less. For the subgroup of alumni in households with no reported spouse/partner income, 73.6 percent exceed the general VA guideline. For alumni who do not own a home and who answered the income questions in the survey, 90.1 percent had a “nonhousing” debt-to-income ratio exceeding 8 percent, a typical percentage used by some mortgage lenders to assess a person’s financial qualifications for a mortgage. Clearly, many alumni could have problems qualifying for a mortgage today with their current debt loads.
Nearly all alumni have checking accounts (98.1%). More than half of alumni (57.1%), however, are not participating in any savings plans.
About 30 percent of alumni (29.8%) said they have an emergency fund. Within this group, 61.5 percent said their fund would cover 3 or more months of household expenses. This group with 3 or more months of “rainy day” savings makes up 18.2 percent of the total alumni survey population.
Only 19.0 percent of alumni said their financial status is better than a year ago, 37.0 percent said it was the same, and 39.0 percent said it was worse. Unemployment, no college credits, severe mental or physical injuries, and VA disability ratings of 20 percent or higher are associated with responses of worse.
To acquire competitive labor market and job search skills, about a third of WWP alumni are pursuing more education (33.0%). Alumni are also participating in programs, such as WWP’s Track, Transition Training Academy, and Warriors to Work program, to improve their job prospects. Many are using the Post 9-11 GI Bill and the VA’s Vocational Rehabilitation and Employment Program to reach their goals. For those unable to participate currently in the labor force because of ongoing medical problems, better access to care and fair compensation for disabilities related to military service will be essential to financial security.
2013 Wounded Warrior Project Survey Results 123
SOCIAL SUPPORT AND PERSONAL RESILIENCY
As in previous years, a majority of alumni continue to perceive their current relationships with family and friends to be strong. Most alumni feel there are people they can depend on to help them when needed (85.5%), and 81.4 percent said there is a trustworthy person they can turn to for advice about problems. At the same, more than half (56.5%) feel they don’t have close personal relationships with other people.
Many warriors continue to rely on their veteran peers for support during stressful times in their lives. One-fourth of alumni (24.2%) said talking with another OEF/OIF veteran was the most effective resource they have used for coping with stress and concerns. Clearly, WWP’s efforts to keep alumni in touch with other wounded warriors remain important in promoting emotional well-being.
Despite all the challenges they face in their daily lives, a majority of WWP alumni rate themselves high on personal resiliency. More than half of alumni (55.3%) said it is often true or true nearly all the time that they can adapt to change. And 53 percent said the same about being able to bounce back after illness, injury, or other hardships. But that leaves many other alumni who could use more support and optimism about their personal situations.
Closing Comments
The study findings present a detailed picture of the many challenges facing wounded warriors as they transition to civilian life; work to achieve physical and mental well-being; and acquire jobs, education, training, and support in navigating the disability system to become economically empowered. The survey findings have been noticeably similar over the past 3 years, indicating that for many alumni progress will take patience and persistence. We list here some of the most notable findings from the 2013 results:
• Many alumni struggle with mental and emotional health problems that adversely affect mental well-being and their daily activities. This is true as well of those with severe physical injuries, but mental health problems seem to interfere somewhat more than physical injuries with social and other daily activities. Both types of injuries have a similar effect on missed days of work among employed alumni.
• Weight issues are a serious problem for many alumni: More than 80 percent are obese or overweight.
• Alumni need more support for job placement.
• Many alumni are struggling financially with burdensome debt and low savings.
• Wounded warriors will continue to need the support of organizations such as WWP while they persevere in getting the care and skills they need. WWP alumni speak appreciatively of the opportunities and support provided by WWP.
2013 Wounded Warrior Project Survey Results 124
REFERENCES Bagalman, E. (2013). Mental health disorders among OEF/OIF veterans using VA health care: Facts and Figures. Congressional Research Service (7-5700; R41921). Retrieved from: http://www.fas.org/sgp/crs/misc/R41921.pdf.
Barlas, F. M., Higgins W. B., Pflieger, J. C., & Diecker, K. (2013). 2011 Department of Defense Health Related Behaviors Survey of active duty military personnel (Final Report). Fairfax, VA: ICF International.
Burnett-Zeigler, I., Valenstein, M., IIgen, M., Blow, A., Gorman, L., & Zivin, K. (2011). Civilian employment among recently returning Afghanistan and Iraq National Guard Veterans. Military Medicine, 176(6), 639-646.
Cutrona, C. E., & Russell, D. W. (1987). The provisions of social relationships and adaptation to stress. Advances in Personal Relationships, 1, 37–67. Information about Cutrona’s and Russell’s 1987 article also retrieved from: http://www.iprc.unc.edu/longscan/pages/measures/Ages5to11/ Social%20Provisions%20Scale.pdf.
Dawson, D. A., Grant, B. F., Stinson, F. S., & Zhou, Y. (2005). Effectiveness of the Derived Alcohol Use Disorders Identification Test (AUDIT-C) in screening for alcohol use disorders and risk drinking in the U.S. general population. Alcoholism: Clinical and Experimental Research, 29(5), 844–854.
FINRA Investor Education Foundation. (2013). Financial capability in the United States: Report of findings form the 2012 National Financial Capability Study. Retrieved from: http://www.usfinancialcapability.org/downloads/NFCS_2012_Report_Natl_Findings.pdf.
Fry, R. (2013). Young adults after the recession: Fewer homes, fewer cars, less debt. Washington, DC: Pew Research Center. Retrieved from: http://www.pewsocialtrends.org/2013/02/21/young-adults-after-the-recession-fewer-homes-fewer-cars-less-debt/
Hays, R. (2008). RAND-36 Health Status Inventory. San Antonio, TX: Psychological Corporation. Introduction retrieved from: http://gim.med.ucla.edu/FacultyPages/Hays/R-36%20HSI%20Hays/Title%20page%20-%20Table%20of%20contents%20-%20Introduction.pdf.
Hays, R. D., & Stewart A. L. (1992). Sleep measures. In A. Stewart & J. Ware, Jr. (Eds.), Measuring functioning and well-being: The medical outcomes study approach (pp. 235–259). Durham, NC: Duke University Press.
Hoge, C., Auchterlonie, J., & Milliken, C. (2006). Mental health problems, use of mental health services, and attrition from military service after returning from deployment to Iraq or Afghanistan. Journal of the American Medical Association, 295, 1023–1032. Retrieved from: http://jama.ama-assn.org/cgi/content/full/295/9/1023.
2013 Wounded Warrior Project Survey Results 125
Horton, J. L., Jacobson, I. G, Wong, C. A., Wells, T. S., Boyko, E. I., et al. (2013). The impact of prior deployment experience on civilian employment after military service. Occup Environ Med 70, 408-417. doi: 10.1136/oemed-2012-101073.
Kroenke, K., et al. (2009). The PHQ-8 as a measure of current depression in the general population. Journal of Affective Disorders, 114(1-3): 163–173. Epub 2008 Aug 27. Abstract retrieved from: http://www.jad-journal.com/article/S0165-0327(08)00282-6/abstract.
Littman, A. J., Jacobson, I. G., Boyko, E. J., Powell, T. M., & Smith, T. C. (2013). Weight change following US military service. International Journal of Obesity 37, 244-253.
Milliken, C., Auchterlonie, J., & Hoge, C. (2007). Longitudinal assessment of mental health problems among active and reserve component soldiers returning from the Iraq War. Journal of the American Medical Association, 298, 2141–2148. Retrieved online: http://jama.ama-assn.org/cgi/content/full/ 298/18/2141.
Ogden, C. L., Carroll, M. D., Kit, B. K., & Flegal, K. M. (2012). Prevalence of obesity in the United States, 2009–2010. NCHS Data Brief, No. 82.
Prins, A., Quimette, P., Kimerling, R., Cameron, R., Hugelshofer, D., Shaw-Hegwer, J., Thraikill, A., Gusman, F., & Sheikh, J. (2003). The primary care PTSD Screen (PTSD). Information on this work was retrieved from the U.S. Department of Veterans Affairs, National Center for PTSD Assessment World website: http://www.ptsd.va.gov/professional/pages/assessments/pc-ptsd.asp.
Prudential Financial, Inc. (2012. Veterans’ Employment Challenges: Perceptions and experiences of transitioning from military to civilian life. Retrieved from: http://www.prudential.com/documents/ public/VeteransEmploymentChallenges.pdf.
Ramchand, R., Schell, T. L., Karney, B. R. Osilla, K. C., Burns, R. M., & Calderone, L. B. (2010). Disparate prevalence estimates of PTSD among service members who served in Iraq and Afghanistan: Possible explanations. Journal of Trauma Stress 23(1), 59-68. doi:10.1002/jts.20486.
RAND. (2008). Invisible wounds: Mental health and cognitive care needs of America’s returning veterans (Research Highlights). Santa Monica, CA: RAND Center for Military Health Policy Research. Retrieved from: http://www.rand.org/pubs/research_briefs/2008/RAND_RB9336.pdf.
Ryan, M. Tyler, C., Smith, B., Amorosa, P. Boyko, E., Gray, G. Gackstetter, G., Riddle, J. , Wells, T., Gumbs, G., Corbeil, T., & Hooper, T. (2007). Millennium Cohort: Enrollment begins a 21-year contribution to understanding the impact of military service. Journal of Clinical Epidemiology 60, 181–191.
Schell, T., & Marshall, G. (2008). Survey of individuals previously deployed for OEF/OIF. In T. Tanielian &. L. Jaycox (Eds.), Invisible wounds of war: Psychological and cognitive injuries, their consequences, and services to assist recovery (pp. 87–115). Santa Monica, CA: RAND Corporation.
2013 Wounded Warrior Project Survey Results 126
Seeling, A., Jacobson, I., Smith, B., Hooper, T., Boyko, E., Gackstetter, G., Gehrman, P., Macera, C., Smith, T. (2010). Sleep patterns before, during, and after deployment to Iraq and Afghanistan. SLEEP, 33(12), 1615–1622. Retrieved from: http://www.ncbi.nlm.nih.gov/pubmed/21120123.
Smith, C., Klosterbuer, A., & Levine, A. S. (2009). Military experience strongly influences post-service eating behavior and BMI status in American veterans. Appetite 52, 280-289.
U.S. Bureau of Labor Statistics. (2013). The employment situation—April 2013 (News Release USDL-13-0785, May 3, 2013). http://www.bls.gov/news.release/archives/empsit_05032013.pdf.
U.S. Bureau of Labor Statistics. (2013). Employment situation of veterans—2012 (News Release USDL-12-0493, March 20, 2013). Includes Tables 1-9. Retrieved from: http://www.bls.gov/news.release/pdf/vet.pdf.
U.S. Government Accountability Office. (2012). Military disability system: Preliminary observations on efforts to improve performance (GAO Publication No. 12-718T). Retrieved from: http://www.gao.gov/assets/600/591061.pdf.
U.S. Government Accountability Office. (2012). VA mental health: Number of Veterans receiving care, barriers faced, and efforts to increase access (GAO Publication No. 12-12). Retrieved from: http://www.gao.gov/assets/590/585743.pdf.
Vaishnavi, S., Connor, K., & Davidson, J. (2007). An abbreviated version of the Connor-Davidson Resilience Scale (CD-RSIC), the CD-RISC2: Psychometric properties and applications in psychopharmacological trials. Psychiatry Research, 152, 293–297. Retrieved from PubMed Central: http://www.ncbi.nlm.nih.gov/pmc/articles/PMC2041449.
Appendix A
Copies of Survey Communications
2013 Wounded Warrior Project Survey Results A-1
APPENDIX A: COPIES OF SURVEY COMMUNICATIONS Prenote: 26,892 Emails
2/28/13
Subject: Coming Next Week: 2013 WWP Annual Alumni Survey
2013 Wounded Warrior Project Survey Results A-2
Survey Invite: 26,889 Emails
3/5/13
Subject: Take the WWP Annual Alumni Survey & Get Free Gear
2013 Wounded Warrior Project Survey Results A-3
Reminder #1: 21,166 Emails
3/13/13
Subject: Help WWP Better Serve Alumni and Get a FREE WWP Alumni Under Armour Sackpack
2013 Wounded Warrior Project Survey Results A-4
Reminder #2: 18,924 Emails
3/21/13
Subject: Reminder: Take the Alumni Survey and Get FREE WWP Gear
2013 Wounded Warrior Project Survey Results A-5
Reminder #3: 17,627 Emails
3/26/13
Subject: Help Your Fellow Alumni and Get A FREE WWP Alumni Under Armour Sackpack
2013 Wounded Warrior Project Survey Results A-6
Postal Reminder: 13,191 Letters
3/27/13 and 3/28/13
Postal Reminder Letter – First Page
2013 Wounded Warrior Project Survey Results A-7
Postal Reminder: 13,191 Letters
3/27/13 and 3/28/13
Postal Reminder Letter – Second Page

2013 Wounded Warrior Project Survey Results A-8
Reminder #4: 16,070 Emails
4/3/13
Subject: Please Participate in the WWP Annual Alumni Survey!
2013 Wounded Warrior Project Survey Results A-9
Reminder #5: 15,032 Emails
4/11/13
Subject: Help WWP Improve Our Programs – The WWP Alumni Survey Ends in 6 Days
2013 Wounded Warrior Project Survey Results A-10
Reminder #6: 14,602 Emails
4/15/13
Subject: Last Chance to Get Your FREE WWP Alumni Under Armour Sackpack
Appendix B
Survey Methods and Administration Details
2013 Wounded Warrior Project Survey Results B-1
APPENDIX B: SURVEY METHODS AND ADMINISTRATION DETAILS
SURVEY POPULATION WWP delivered a database containing alumni names, email addresses, and telephone numbers to Westat. Westat removed duplicate alumni listings, names of alumni who had requested that they not receive email from WWP, and fake email addresses. The resulting survey population included 26,892 wounded warriors registered as Wounded Warrior Project (WWP) alumni.
QUESTIONNAIRE The survey was designed to address the following broad topics:
• Overall Alumni Background Information • Physical and Mental Well-Being • Economic Empowerment The final version of the 2013 survey included more than 125 closed-ended questions, but not all questions were administered to all alumni as a result of automatic skips for questions that did not apply given answers to previous questions. Also, because many of the questions in the survey included sub-items, many wounded warriors were asked to provide more than 125 responses to the questions/sub-items. In addition, the survey included one open-ended question: “If you have time, please feel free to tell us your opinion of the most challenging aspect of transitioning back into civilian life and how the Wounded Warrior Project or other Veterans service organizations can help in alleviating this challenge.” Several revisions that were made to the 2010, 2011, and 2012 surveys are described in Tables B1a, B1b, and B1c.
The web instrument was pretested across two platforms (Windows and Mac OSX), multiple browsers (Internet Explorer, Firefox, Safari, Opera, and Chrome—all five on Windows and the first three on Mac OSX), and popular screen resolution settings.
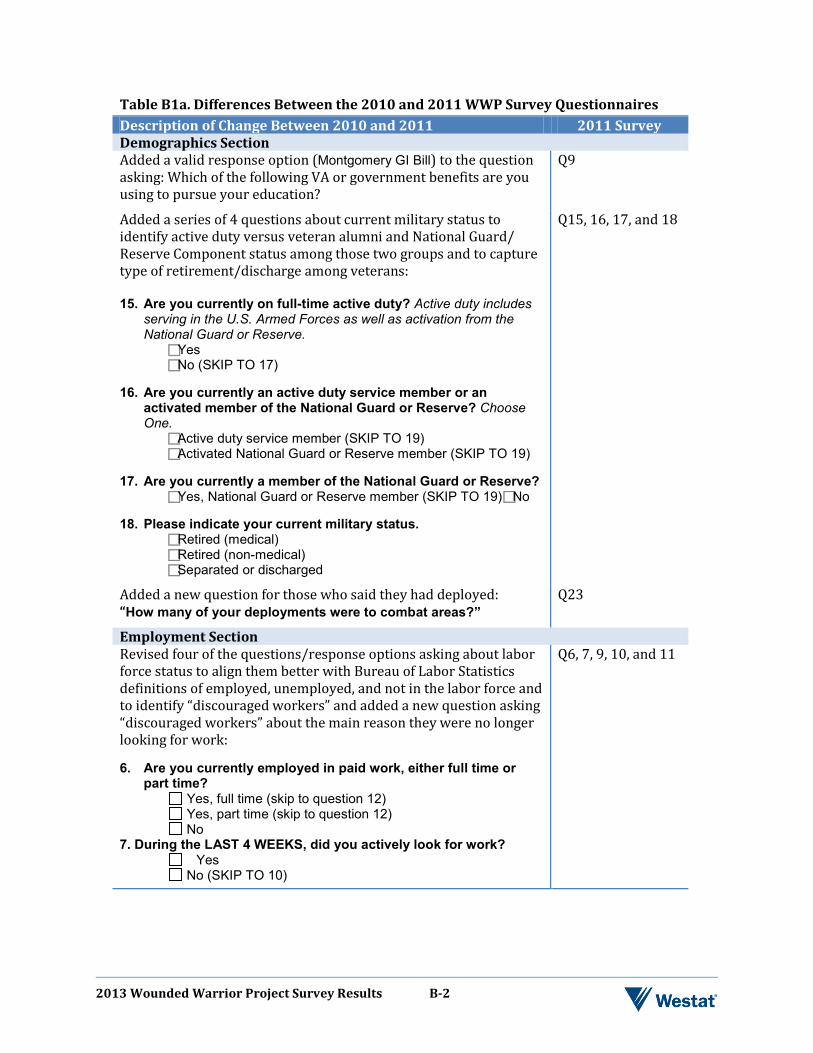
2013 Wounded Warrior Project Survey Results B-2
Table B1a. Differences Between the 2010 and 2011 WWP Survey Questionnaires Description of Change Between 2010 and 2011 2011 Survey Demographics Section Added a valid response option (Montgomery GI Bill) to the question asking: Which of the following VA or government benefits are you using to pursue your education?
Q9
Added a series of 4 questions about current military status to identify active duty versus veteran alumni and National Guard/ Reserve Component status among those two groups and to capture type of retirement/discharge among veterans: 15. Are you currently on full-time active duty? Active duty includes
serving in the U.S. Armed Forces as well as activation from the National Guard or Reserve.
Yes No (SKIP TO 17)
16. Are you currently an active duty service member or an
activated member of the National Guard or Reserve? Choose One. Active duty service member (SKIP TO 19) Activated National Guard or Reserve member (SKIP TO 19)
17. Are you currently a member of the National Guard or Reserve?
Yes, National Guard or Reserve member (SKIP TO 19) No
18. Please indicate your current military status. Retired (medical)
Retired (non-medical) Separated or discharged
Q15, 16, 17, and 18
Added a new question for those who said they had deployed: “How many of your deployments were to combat areas?”
Q23
Employment Section Revised four of the questions/response options asking about labor force status to align them better with Bureau of Labor Statistics definitions of employed, unemployed, and not in the labor force and to identify “discouraged workers” and added a new question asking “discouraged workers” about the main reason they were no longer looking for work: 6. Are you currently employed in paid work, either full time or
part time? Yes, full time (skip to question 12)
Yes, part time (skip to question 12) No
7. During the LAST 4 WEEKS, did you actively look for work? Yes No (SKIP TO 10)
Q6, 7, 9, 10, and 11
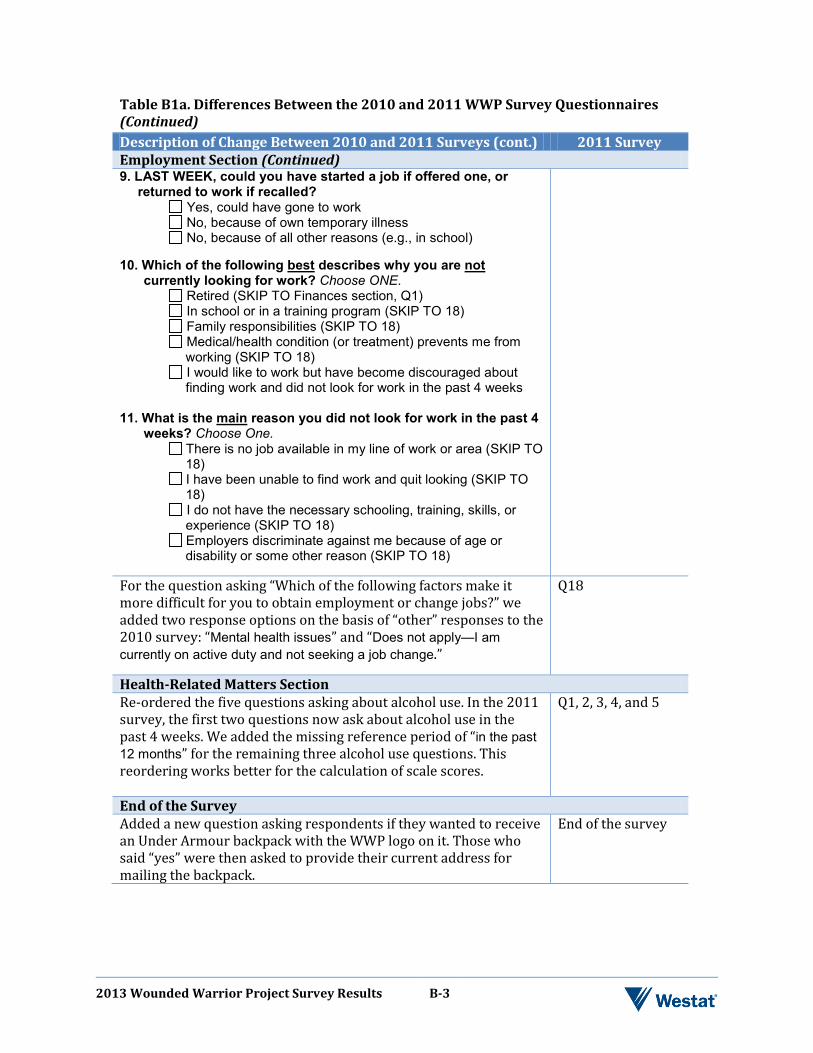
2013 Wounded Warrior Project Survey Results B-3
Table B1a. Differences Between the 2010 and 2011 WWP Survey Questionnaires (Continued) Description of Change Between 2010 and 2011 Surveys (cont.) 2011 Survey Employment Section (Continued) 9. LAST WEEK, could you have started a job if offered one, or
returned to work if recalled? Yes, could have gone to work No, because of own temporary illness No, because of all other reasons (e.g., in school)
10. Which of the following best describes why you are not
currently looking for work? Choose ONE. Retired (SKIP TO Finances section, Q1) In school or in a training program (SKIP TO 18) Family responsibilities (SKIP TO 18) Medical/health condition (or treatment) prevents me from working (SKIP TO 18) I would like to work but have become discouraged about finding work and did not look for work in the past 4 weeks
11. What is the main reason you did not look for work in the past 4
weeks? Choose One. There is no job available in my line of work or area (SKIP TO 18) I have been unable to find work and quit looking (SKIP TO 18) I do not have the necessary schooling, training, skills, or experience (SKIP TO 18) Employers discriminate against me because of age or disability or some other reason (SKIP TO 18)
For the question asking “Which of the following factors make it more difficult for you to obtain employment or change jobs?” we added two response options on the basis of “other” responses to the 2010 survey: “Mental health issues” and “Does not apply—I am currently on active duty and not seeking a job change.”
Q18
Health-Related Matters Section Re-ordered the five questions asking about alcohol use. In the 2011 survey, the first two questions now ask about alcohol use in the past 4 weeks. We added the missing reference period of “in the past 12 months” for the remaining three alcohol use questions. This reordering works better for the calculation of scale scores.
Q1, 2, 3, 4, and 5
End of the Survey Added a new question asking respondents if they wanted to receive an Under Armour backpack with the WWP logo on it. Those who said “yes” were then asked to provide their current address for mailing the backpack.
End of the survey
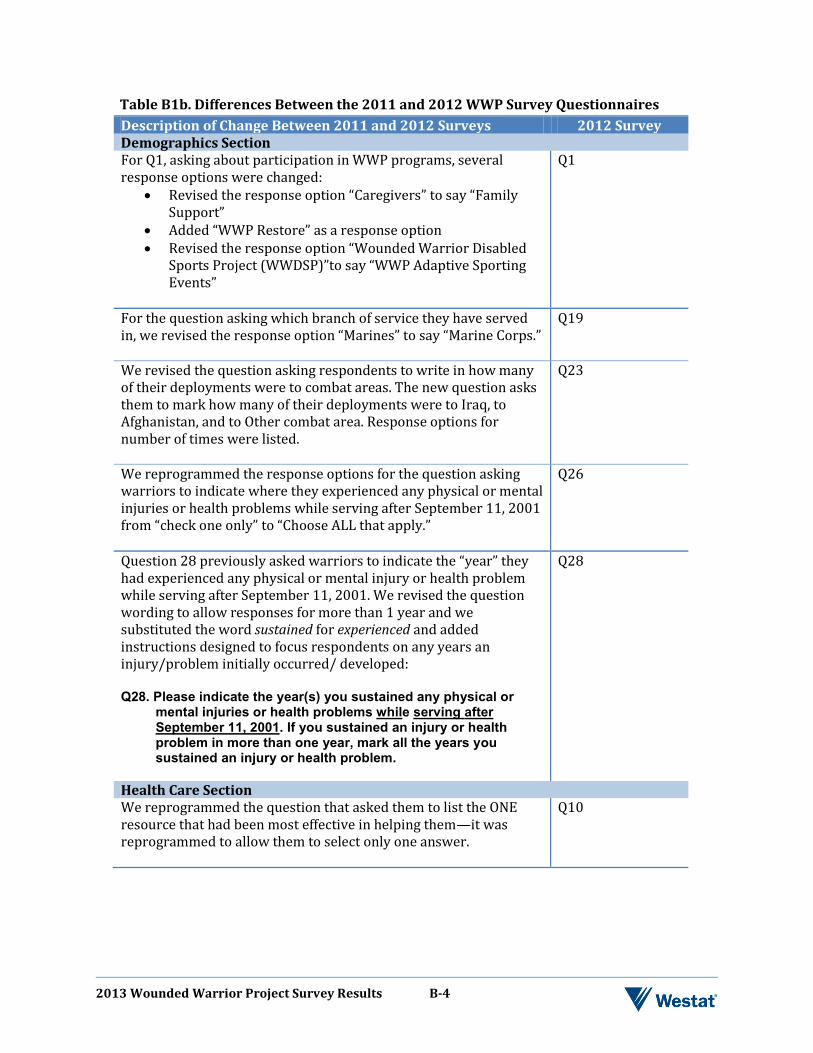
2013 Wounded Warrior Project Survey Results B-4
Table B1b. Differences Between the 2011 and 2012 WWP Survey Questionnaires Description of Change Between 2011 and 2012 Surveys 2012 Survey Demographics Section For Q1, asking about participation in WWP programs, several response options were changed:
• Revised the response option “Caregivers” to say “Family Support”
• Added “WWP Restore” as a response option • Revised the response option “Wounded Warrior Disabled
Sports Project (WWDSP)”to say “WWP Adaptive Sporting Events”
Q1
For the question asking which branch of service they have served in, we revised the response option “Marines” to say “Marine Corps.”
Q19
We revised the question asking respondents to write in how many of their deployments were to combat areas. The new question asks them to mark how many of their deployments were to Iraq, to Afghanistan, and to Other combat area. Response options for number of times were listed.
Q23
We reprogrammed the response options for the question asking warriors to indicate where they experienced any physical or mental injuries or health problems while serving after September 11, 2001 from “check one only” to “Choose ALL that apply.”
Q26
Question 28 previously asked warriors to indicate the “year” they had experienced any physical or mental injury or health problem while serving after September 11, 2001. We revised the question wording to allow responses for more than 1 year and we substituted the word sustained for experienced and added instructions designed to focus respondents on any years an injury/problem initially occurred/ developed: Q28. Please indicate the year(s) you sustained any physical or
mental injuries or health problems while serving after September 11, 2001. If you sustained an injury or health problem in more than one year, mark all the years you sustained an injury or health problem.
Q28
Health Care Section We reprogrammed the question that asked them to list the ONE resource that had been most effective in helping them—it was reprogrammed to allow them to select only one answer.
Q10
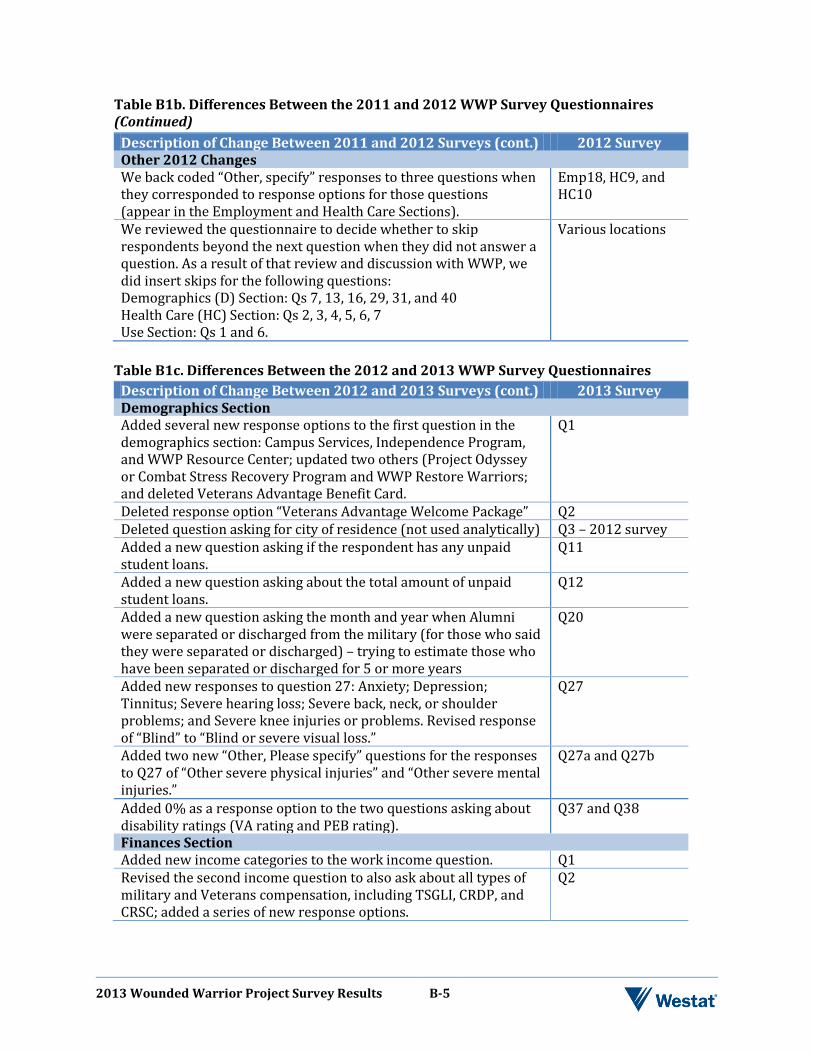
2013 Wounded Warrior Project Survey Results B-5
Table B1b. Differences Between the 2011 and 2012 WWP Survey Questionnaires (Continued)
Description of Change Between 2011 and 2012 Surveys (cont.) 2012 Survey Other 2012 Changes We back coded “Other, specify” responses to three questions when they corresponded to response options for those questions (appear in the Employment and Health Care Sections).
Emp18, HC9, and HC10
We reviewed the questionnaire to decide whether to skip respondents beyond the next question when they did not answer a question. As a result of that review and discussion with WWP, we did insert skips for the following questions: Demographics (D) Section: Qs 7, 13, 16, 29, 31, and 40 Health Care (HC) Section: Qs 2, 3, 4, 5, 6, 7 Use Section: Qs 1 and 6.
Various locations
Table B1c. Differences Between the 2012 and 2013 WWP Survey Questionnaires
Description of Change Between 2012 and 2013 Surveys (cont.) 2013 Survey Demographics Section Added several new response options to the first question in the demographics section: Campus Services, Independence Program, and WWP Resource Center; updated two others (Project Odyssey or Combat Stress Recovery Program and WWP Restore Warriors; and deleted Veterans Advantage Benefit Card.
Q1
Deleted response option “Veterans Advantage Welcome Package” Q2 Deleted question asking for city of residence (not used analytically) Q3 – 2012 survey Added a new question asking if the respondent has any unpaid student loans.
Q11
Added a new question asking about the total amount of unpaid student loans.
Q12
Added a new question asking the month and year when Alumni were separated or discharged from the military (for those who said they were separated or discharged) – trying to estimate those who have been separated or discharged for 5 or more years
Q20
Added new responses to question 27: Anxiety; Depression; Tinnitus; Severe hearing loss; Severe back, neck, or shoulder problems; and Severe knee injuries or problems. Revised response of “Blind” to “Blind or severe visual loss.”
Q27
Added two new “Other, Please specify” questions for the responses to Q27 of “Other severe physical injuries” and “Other severe mental injuries.”
Q27a and Q27b
Added 0% as a response option to the two questions asking about disability ratings (VA rating and PEB rating).
Q37 and Q38
Finances Section Added new income categories to the work income question. Q1 Revised the second income question to also ask about all types of military and Veterans compensation, including TSGLI, CRDP, and CRSC; added a series of new response options.
Q2
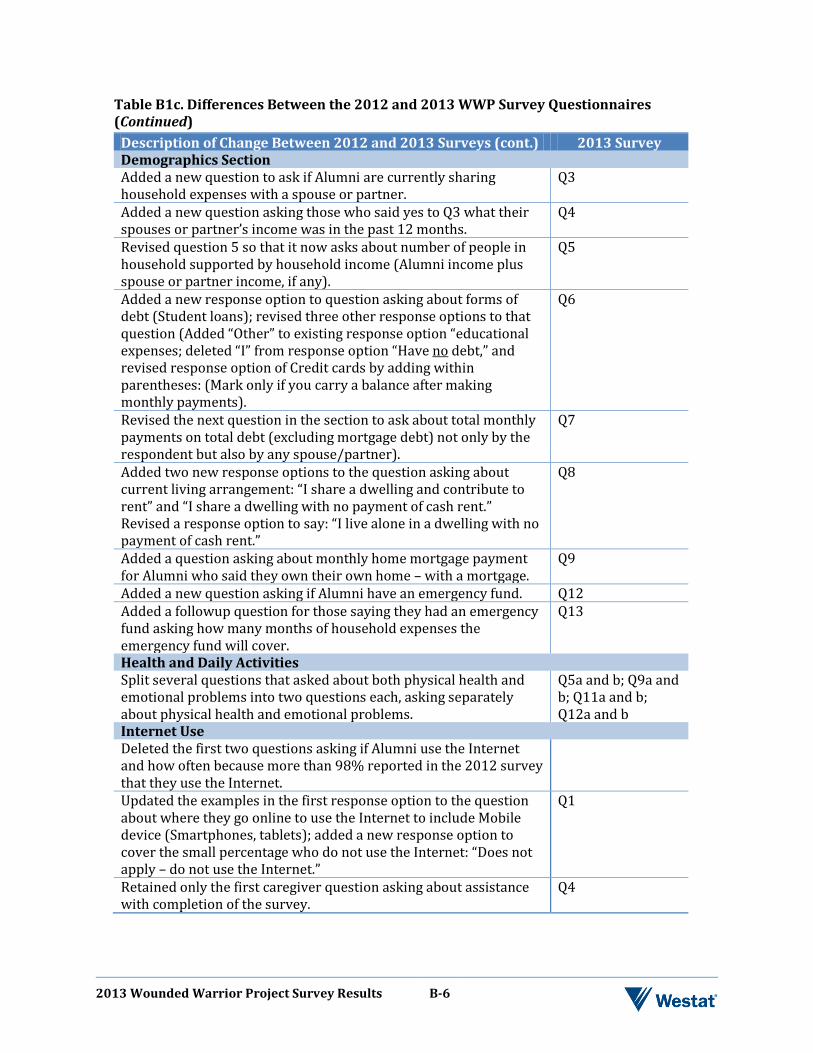
2013 Wounded Warrior Project Survey Results B-6
Table B1c. Differences Between the 2012 and 2013 WWP Survey Questionnaires (Continued)
Description of Change Between 2012 and 2013 Surveys (cont.) 2013 Survey Demographics Section Added a new question to ask if Alumni are currently sharing household expenses with a spouse or partner.
Q3
Added a new question asking those who said yes to Q3 what their spouses or partner’s income was in the past 12 months.
Q4
Revised question 5 so that it now asks about number of people in household supported by household income (Alumni income plus spouse or partner income, if any).
Q5
Added a new response option to question asking about forms of debt (Student loans); revised three other response options to that question (Added “Other” to existing response option “educational expenses; deleted “I” from response option “Have no debt,” and revised response option of Credit cards by adding within parentheses: (Mark only if you carry a balance after making monthly payments).
Q6
Revised the next question in the section to ask about total monthly payments on total debt (excluding mortgage debt) not only by the respondent but also by any spouse/partner).
Q7
Added two new response options to the question asking about current living arrangement: “I share a dwelling and contribute to rent” and “I share a dwelling with no payment of cash rent.” Revised a response option to say: “I live alone in a dwelling with no payment of cash rent.”
Q8
Added a question asking about monthly home mortgage payment for Alumni who said they own their own home – with a mortgage.
Q9
Added a new question asking if Alumni have an emergency fund. Q12 Added a followup question for those saying they had an emergency fund asking how many months of household expenses the emergency fund will cover.
Q13
Health and Daily Activities Split several questions that asked about both physical health and emotional problems into two questions each, asking separately about physical health and emotional problems.
Q5a and b; Q9a and b; Q11a and b; Q12a and b
Internet Use Deleted the first two questions asking if Alumni use the Internet and how often because more than 98% reported in the 2012 survey that they use the Internet.
Updated the examples in the first response option to the question about where they go online to use the Internet to include Mobile device (Smartphones, tablets); added a new response option to cover the small percentage who do not use the Internet: “Does not apply – do not use the Internet.”
Q1
Retained only the first caregiver question asking about assistance with completion of the survey.
Q4
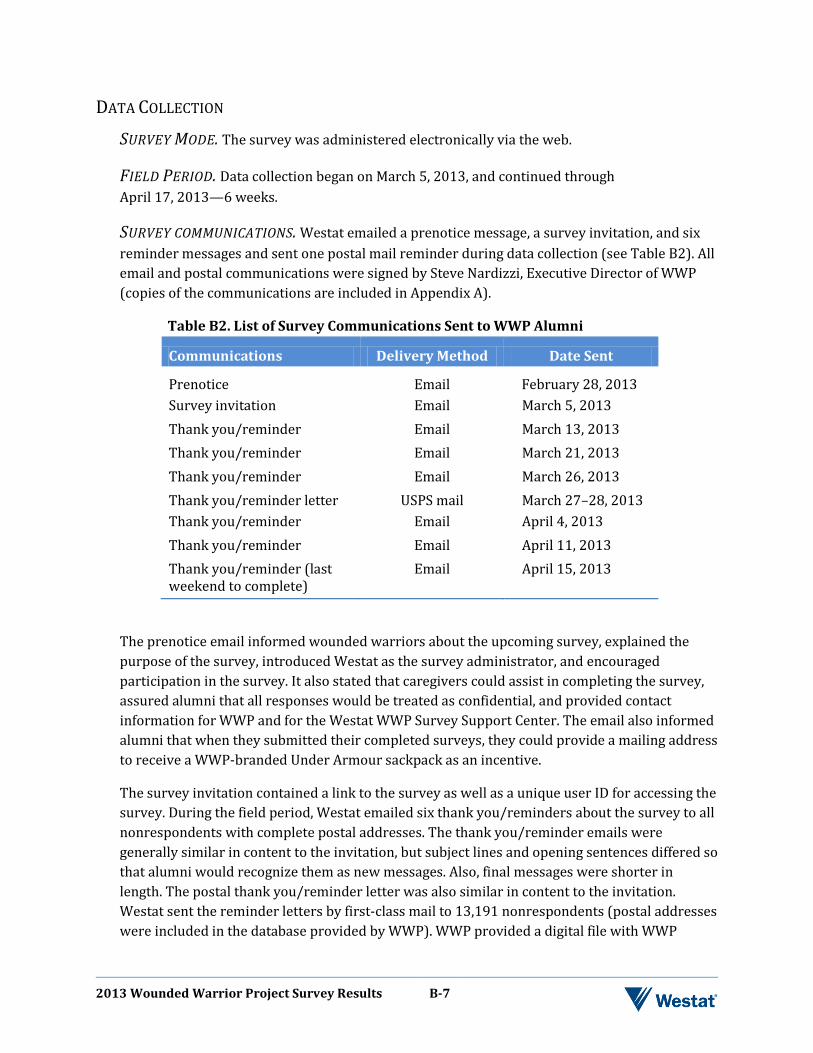
2013 Wounded Warrior Project Survey Results B-7
DATA COLLECTION
SURVEY MODE. The survey was administered electronically via the web.
FIELD PERIOD. Data collection began on March 5, 2013, and continued through April 17, 2013—6 weeks.
SURVEY COMMUNICATIONS. Westat emailed a prenotice message, a survey invitation, and six reminder messages and sent one postal mail reminder during data collection (see Table B2). All email and postal communications were signed by Steve Nardizzi, Executive Director of WWP (copies of the communications are included in Appendix A).
Table B2. List of Survey Communications Sent to WWP Alumni
Communications Delivery Method Date Sent
Prenotice Email February 28, 2013 Survey invitation Email March 5, 2013 Thank you/reminder Email March 13, 2013 Thank you/reminder Email March 21, 2013 Thank you/reminder Email March 26, 2013 Thank you/reminder letter USPS mail March 27–28, 2013 Thank you/reminder Email April 4, 2013 Thank you/reminder Email April 11, 2013 Thank you/reminder (last weekend to complete)
Email April 15, 2013
The prenotice email informed wounded warriors about the upcoming survey, explained the purpose of the survey, introduced Westat as the survey administrator, and encouraged participation in the survey. It also stated that caregivers could assist in completing the survey, assured alumni that all responses would be treated as confidential, and provided contact information for WWP and for the Westat WWP Survey Support Center. The email also informed alumni that when they submitted their completed surveys, they could provide a mailing address to receive a WWP-branded Under Armour sackpack as an incentive.
The survey invitation contained a link to the survey as well as a unique user ID for accessing the survey. During the field period, Westat emailed six thank you/reminders about the survey to all nonrespondents with complete postal addresses. The thank you/reminder emails were generally similar in content to the invitation, but subject lines and opening sentences differed so that alumni would recognize them as new messages. Also, final messages were shorter in length. The postal thank you/reminder letter was also similar in content to the invitation. Westat sent the reminder letters by first-class mail to 13,191 nonrespondents (postal addresses were included in the database provided by WWP). WWP provided a digital file with WWP
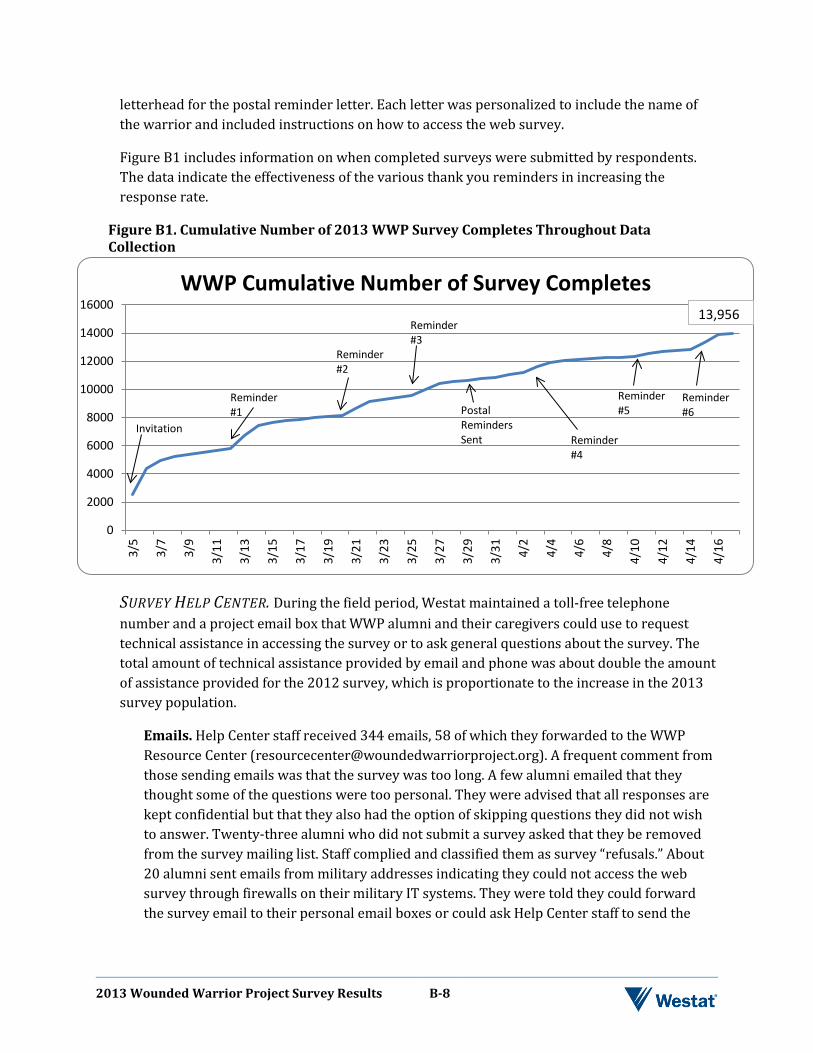
2013 Wounded Warrior Project Survey Results B-8
letterhead for the postal reminder letter. Each letter was personalized to include the name of the warrior and included instructions on how to access the web survey.
Figure B1 includes information on when completed surveys were submitted by respondents. The data indicate the effectiveness of the various thank you reminders in increasing the response rate.
Figure B1. Cumulative Number of 2013 WWP Survey Completes Throughout Data Collection
SURVEY HELP CENTER. During the field period, Westat maintained a toll-free telephone number and a project email box that WWP alumni and their caregivers could use to request technical assistance in accessing the survey or to ask general questions about the survey. The total amount of technical assistance provided by email and phone was about double the amount of assistance provided for the 2012 survey, which is proportionate to the increase in the 2013 survey population.
Emails. Help Center staff received 344 emails, 58 of which they forwarded to the WWP Resource Center ([email protected]). A frequent comment from those sending emails was that the survey was too long. A few alumni emailed that they thought some of the questions were too personal. They were advised that all responses are kept confidential but that they also had the option of skipping questions they did not wish to answer. Twenty-three alumni who did not submit a survey asked that they be removed from the survey mailing list. Staff complied and classified them as survey “refusals.” About 20 alumni sent emails from military addresses indicating they could not access the web survey through firewalls on their military IT systems. They were told they could forward the survey email to their personal email boxes or could ask Help Center staff to send the
0
2000
4000
6000
8000
10000
12000
14000
16000
3/5
3/7
3/9
3/11
3/13
3/15
3/17
3/19
3/21
3/23
3/25
3/27
3/29
3/31 4/
2
4/4
4/6
4/8
4/10
4/12
4/14
4/16
WWP Cumulative Number of Survey Completes
Reminder #4
Invitation
Reminder #1
Reminder #2
Reminder #3
Reminder #5
Reminder #6
Postal Reminders Sent
13,956
2013 Wounded Warrior Project Survey Results B-9
emails directly to their personal email boxes. (There were 2,568 military email addresses in the WWP database.)
Connectivity issues were often vaguely described in emails to the Help Center. Unless their emails had an obvious military account extension, which usually indicated the connectivity problem was a firewall block, Help Center staff were generally able to resolve the issues by sending an individual survey web site link with an embedded password to each respondent.
Last, there were many inquiries about when respondents could expect to receive their sackpacks. They were informed that their sackpacks would be delivered 6-8 weeks after they submitted their surveys.
Toll-free hotline. The hotline number rang directly at the Survey Help Center and was answered by a staff member during weekday business hours (9:00 a.m. to 5:00 p.m., ET). Voicemail was available to anyone calling after business hours or on weekends, and messages were answered within 1 business day. During the field period, 62 voicemail messages were received at the Help Center. About half of the callers (33) said they were having problems accessing the survey, and five callers said they lost their connection to the survey while completing it. Help Center staff resolved those issues over the phone or by emailing a direct link to the web survey. Five callers asked Help Center staff to confirm the completed status on their surveys. Three callers asked for guidance with a question in the web survey—two were having difficulties answering the height and weight questions, and one asked about the survey question about convictions. Two respondents reported they were uncomfortable with some of the questions, and five other respondents called to update their contact information.
Several alumni let the Survey Help Center know by phone or email that they did not have Internet connections at their home, and one requested that the survey be administered to them over the phone. They were sent information about how to call and schedule a telephone interview if they could not access the survey online. None, however, called to schedule a telephone interview.
CASE DISPOSITION. At the end of data collection, Westat cleaned the data and assigned final disposition codes to each warrior in the sample, indicating eligibility or ineligibility for the survey, completes, partial completes, refusals, and nonresponse (Table B3). The final data set does not include any data from surveys designated as partial completes.
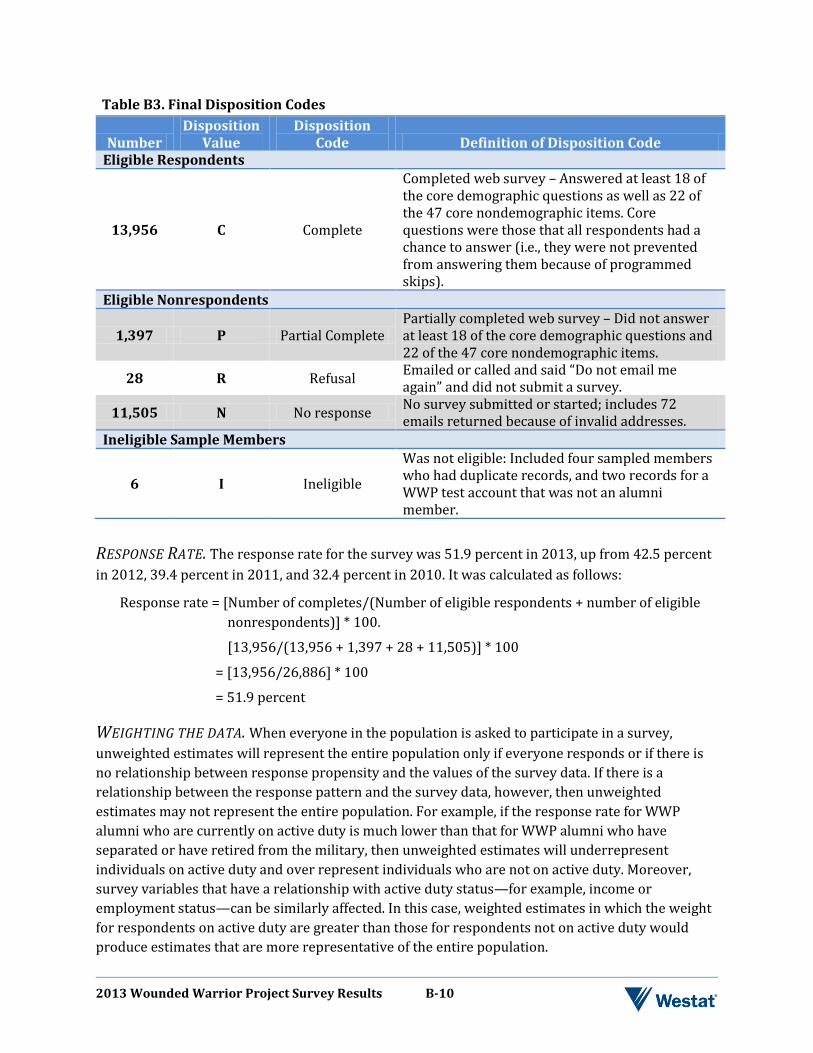
2013 Wounded Warrior Project Survey Results B-10
Table B3. Final Disposition Codes
Number Disposition
Value Disposition
Code Definition of Disposition Code Eligible Respondents
13,956 C Complete
Completed web survey – Answered at least 18 of the core demographic questions as well as 22 of the 47 core nondemographic items. Core questions were those that all respondents had a chance to answer (i.e., they were not prevented from answering them because of programmed skips).
Eligible Nonrespondents
1,397 P Partial Complete Partially completed web survey – Did not answer at least 18 of the core demographic questions and 22 of the 47 core nondemographic items.
28 R Refusal Emailed or called and said “Do not email me again” and did not submit a survey.
11,505 N No response No survey submitted or started; includes 72 emails returned because of invalid addresses.
Ineligible Sample Members
6 I Ineligible
Was not eligible: Included four sampled members who had duplicate records, and two records for a WWP test account that was not an alumni member.
RESPONSE RATE. The response rate for the survey was 51.9 percent in 2013, up from 42.5 percent in 2012, 39.4 percent in 2011, and 32.4 percent in 2010. It was calculated as follows:
Response rate = [Number of completes/(Number of eligible respondents + number of eligible nonrespondents)] * 100.
[13,956/(13,956 + 1,397 + 28 + 11,505)] * 100
= [13,956/26,886] * 100
= 51.9 percent
WEIGHTING THE DATA. When everyone in the population is asked to participate in a survey, unweighted estimates will represent the entire population only if everyone responds or if there is no relationship between response propensity and the values of the survey data. If there is a relationship between the response pattern and the survey data, however, then unweighted estimates may not represent the entire population. For example, if the response rate for WWP alumni who are currently on active duty is much lower than that for WWP alumni who have separated or have retired from the military, then unweighted estimates will underrepresent individuals on active duty and over represent individuals who are not on active duty. Moreover, survey variables that have a relationship with active duty status—for example, income or employment status—can be similarly affected. In this case, weighted estimates in which the weight for respondents on active duty are greater than those for respondents not on active duty would produce estimates that are more representative of the entire population.
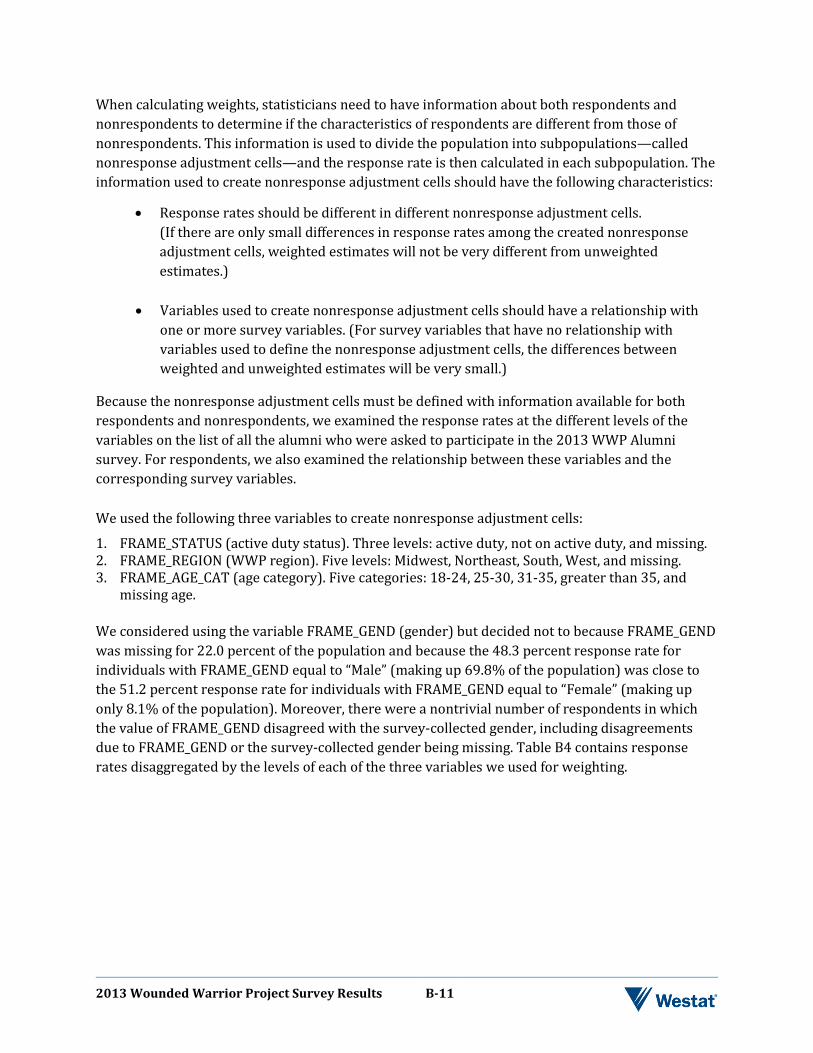
2013 Wounded Warrior Project Survey Results B-11
When calculating weights, statisticians need to have information about both respondents and nonrespondents to determine if the characteristics of respondents are different from those of nonrespondents. This information is used to divide the population into subpopulations—called nonresponse adjustment cells—and the response rate is then calculated in each subpopulation. The information used to create nonresponse adjustment cells should have the following characteristics:
• Response rates should be different in different nonresponse adjustment cells. (If there are only small differences in response rates among the created nonresponse adjustment cells, weighted estimates will not be very different from unweighted estimates.)
• Variables used to create nonresponse adjustment cells should have a relationship with
one or more survey variables. (For survey variables that have no relationship with variables used to define the nonresponse adjustment cells, the differences between weighted and unweighted estimates will be very small.)
Because the nonresponse adjustment cells must be defined with information available for both respondents and nonrespondents, we examined the response rates at the different levels of the variables on the list of all the alumni who were asked to participate in the 2013 WWP Alumni survey. For respondents, we also examined the relationship between these variables and the corresponding survey variables.
We used the following three variables to create nonresponse adjustment cells:
1. FRAME_STATUS (active duty status). Three levels: active duty, not on active duty, and missing. 2. FRAME_REGION (WWP region). Five levels: Midwest, Northeast, South, West, and missing. 3. FRAME_AGE_CAT (age category). Five categories: 18-24, 25-30, 31-35, greater than 35, and
missing age. We considered using the variable FRAME_GEND (gender) but decided not to because FRAME_GEND was missing for 22.0 percent of the population and because the 48.3 percent response rate for individuals with FRAME_GEND equal to “Male” (making up 69.8% of the population) was close to the 51.2 percent response rate for individuals with FRAME_GEND equal to “Female” (making up only 8.1% of the population). Moreover, there were a nontrivial number of respondents in which the value of FRAME_GEND disagreed with the survey-collected gender, including disagreements due to FRAME_GEND or the survey-collected gender being missing. Table B4 contains response rates disaggregated by the levels of each of the three variables we used for weighting.
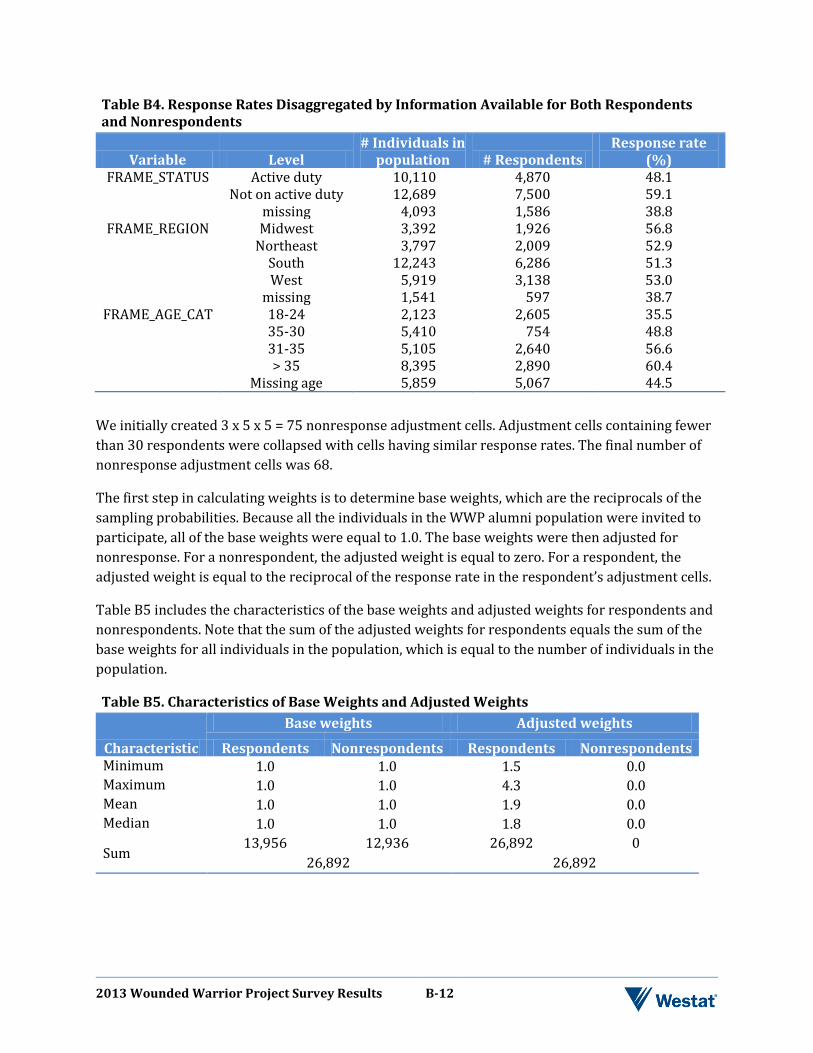
2013 Wounded Warrior Project Survey Results B-12
Table B4. Response Rates Disaggregated by Information Available for Both Respondents and Nonrespondents
Variable Level # Individuals in
population # Respondents Response rate
(%) FRAME_STATUS Active duty
Not on active duty missing
10,110 12,689
4,093
4,870 7,500 1,586
48.1 59.1 38.8
FRAME_REGION Midwest Northeast
South West
missing
3,392 3,797
12,243 5,919 1,541
1,926 2,009 6,286 3,138
597
56.8 52.9 51.3 53.0 38.7
FRAME_AGE_CAT 18-24 35-30 31-35 > 35
Missing age
2,123 5,410 5,105 8,395 5,859
2,605 754
2,640 2,890 5,067
35.5 48.8 56.6 60.4 44.5
We initially created 3 x 5 x 5 = 75 nonresponse adjustment cells. Adjustment cells containing fewer than 30 respondents were collapsed with cells having similar response rates. The final number of nonresponse adjustment cells was 68.
The first step in calculating weights is to determine base weights, which are the reciprocals of the sampling probabilities. Because all the individuals in the WWP alumni population were invited to participate, all of the base weights were equal to 1.0. The base weights were then adjusted for nonresponse. For a nonrespondent, the adjusted weight is equal to zero. For a respondent, the adjusted weight is equal to the reciprocal of the response rate in the respondent’s adjustment cells.
Table B5 includes the characteristics of the base weights and adjusted weights for respondents and nonrespondents. Note that the sum of the adjusted weights for respondents equals the sum of the base weights for all individuals in the population, which is equal to the number of individuals in the population.
Table B5. Characteristics of Base Weights and Adjusted Weights
Characteristic
Base weights Adjusted weights
Respondents Nonrespondents Respondents Nonrespondents Minimum 1.0 1.0 1.5 0.0 Maximum 1.0 1.0 4.3 0.0 Mean 1.0 1.0 1.9 0.0 Median 1.0 1.0 1.8 0.0
Sum 13,956 12,936 26,892 0
26,892 26,892
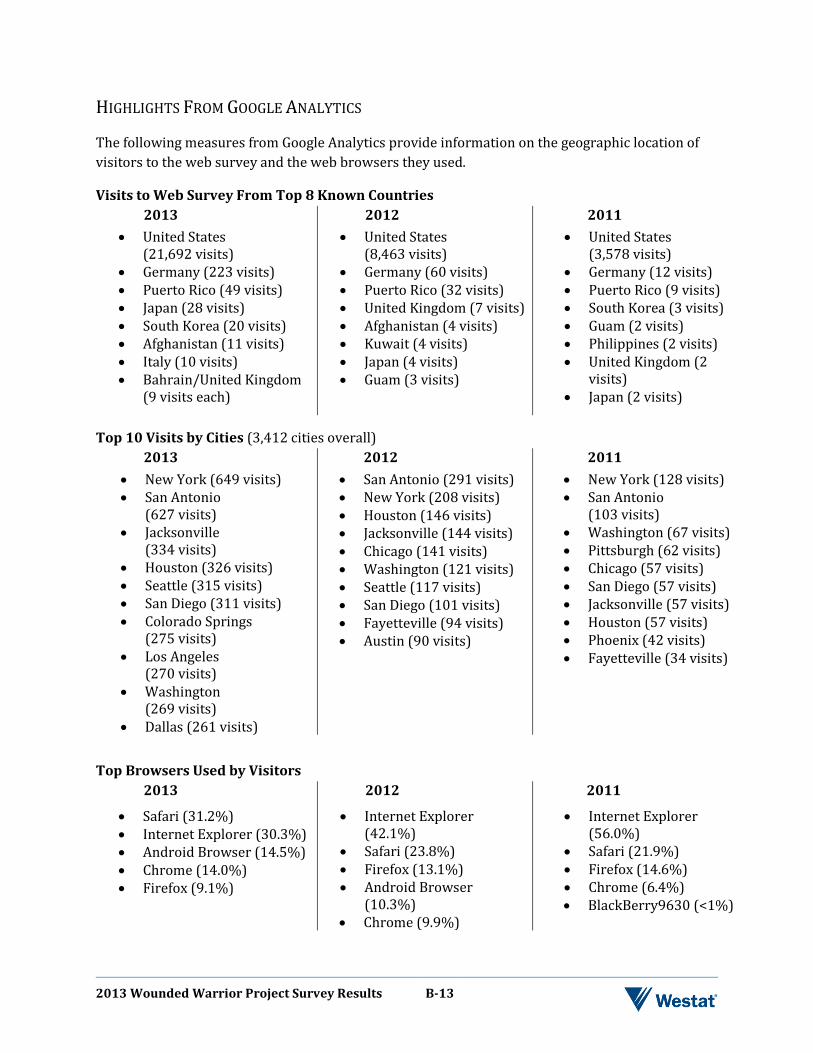
2013 Wounded Warrior Project Survey Results B-13
HIGHLIGHTS FROM GOOGLE ANALYTICS
The following measures from Google Analytics provide information on the geographic location of visitors to the web survey and the web browsers they used.
Visits to Web Survey From Top 8 Known Countries 2013
• United States (21,692 visits)
• Germany (223 visits) • Puerto Rico (49 visits) • Japan (28 visits) • South Korea (20 visits) • Afghanistan (11 visits) • Italy (10 visits) • Bahrain/United Kingdom
(9 visits each)
2012 • United States
(8,463 visits) • Germany (60 visits) • Puerto Rico (32 visits) • United Kingdom (7 visits) • Afghanistan (4 visits) • Kuwait (4 visits) • Japan (4 visits) • Guam (3 visits)
2011 • United States
(3,578 visits) • Germany (12 visits) • Puerto Rico (9 visits) • South Korea (3 visits) • Guam (2 visits) • Philippines (2 visits) • United Kingdom (2
visits) • Japan (2 visits)
Top 10 Visits by Cities (3,412 cities overall) 2013
• New York (649 visits) • San Antonio
(627 visits) • Jacksonville
(334 visits) • Houston (326 visits) • Seattle (315 visits) • San Diego (311 visits) • Colorado Springs
(275 visits) • Los Angeles
(270 visits) • Washington
(269 visits) • Dallas (261 visits)
2012 • San Antonio (291 visits) • New York (208 visits) • Houston (146 visits) • Jacksonville (144 visits) • Chicago (141 visits) • Washington (121 visits) • Seattle (117 visits) • San Diego (101 visits) • Fayetteville (94 visits) • Austin (90 visits)
2011 • New York (128 visits) • San Antonio
(103 visits) • Washington (67 visits) • Pittsburgh (62 visits) • Chicago (57 visits) • San Diego (57 visits) • Jacksonville (57 visits) • Houston (57 visits) • Phoenix (42 visits) • Fayetteville (34 visits)
Top Browsers Used by Visitors 2013
• Safari (31.2%) • Internet Explorer (30.3%) • Android Browser (14.5%) • Chrome (14.0%) • Firefox (9.1%)
2012
• Internet Explorer (42.1%)
• Safari (23.8%) • Firefox (13.1%) • Android Browser
(10.3%) • Chrome (9.9%)
2011
• Internet Explorer (56.0%)
• Safari (21.9%) • Firefox (14.6%) • Chrome (6.4%) • BlackBerry9630 (<1%)
Appendix C
Additional Figures
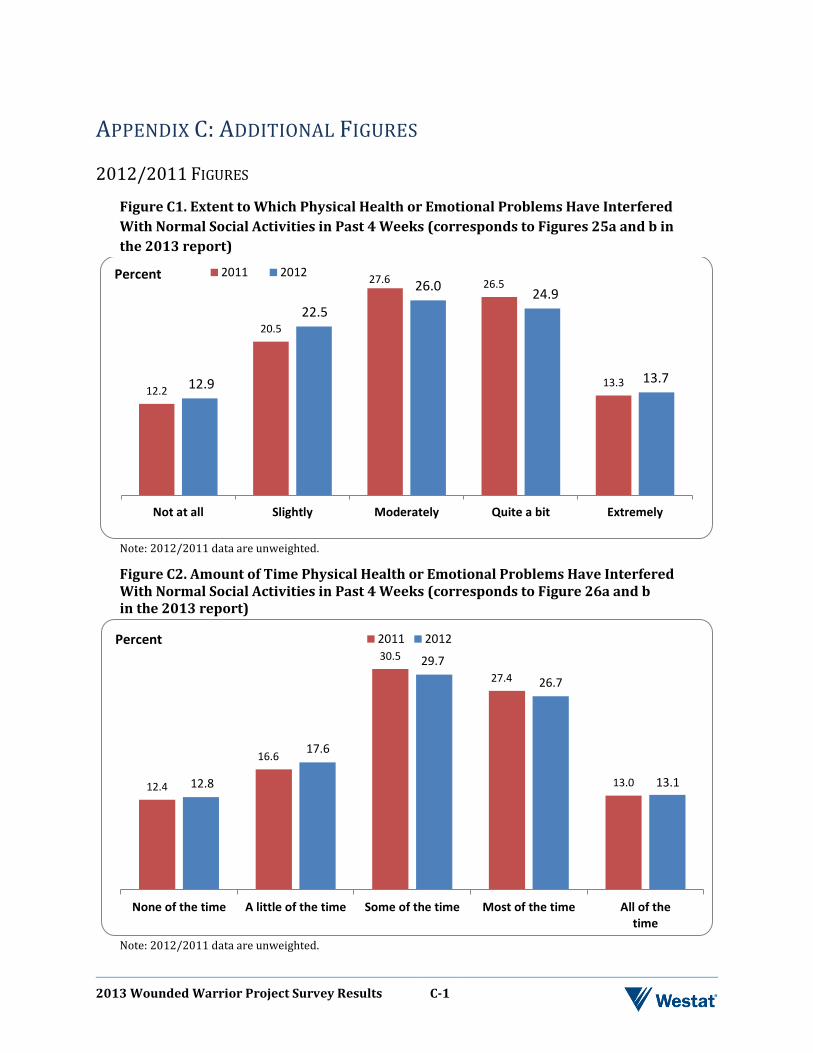
2013 Wounded Warrior Project Survey Results C-1
APPENDIX C: ADDITIONAL FIGURES
2012/2011 FIGURES
Figure C1. Extent to Which Physical Health or Emotional Problems Have Interfered With Normal Social Activities in Past 4 Weeks (corresponds to Figures 25a and b in the 2013 report)
Note: 2012/2011 data are unweighted.
Figure C2. Amount of Time Physical Health or Emotional Problems Have Interfered With Normal Social Activities in Past 4 Weeks (corresponds to Figure 26a and b in the 2013 report)
Note: 2012/2011 data are unweighted.
12.2
20.5
27.6 26.5
13.3 12.9
22.5
26.0 24.9
13.7
Not at all Slightly Moderately Quite a bit Extremely
2011 2012Percent
12.4
16.6
30.5
27.4
13.0 12.8
17.6
29.7
26.7
13.1
None of the time A little of the time Some of the time Most of the time All of thetime
2011 2012Percent
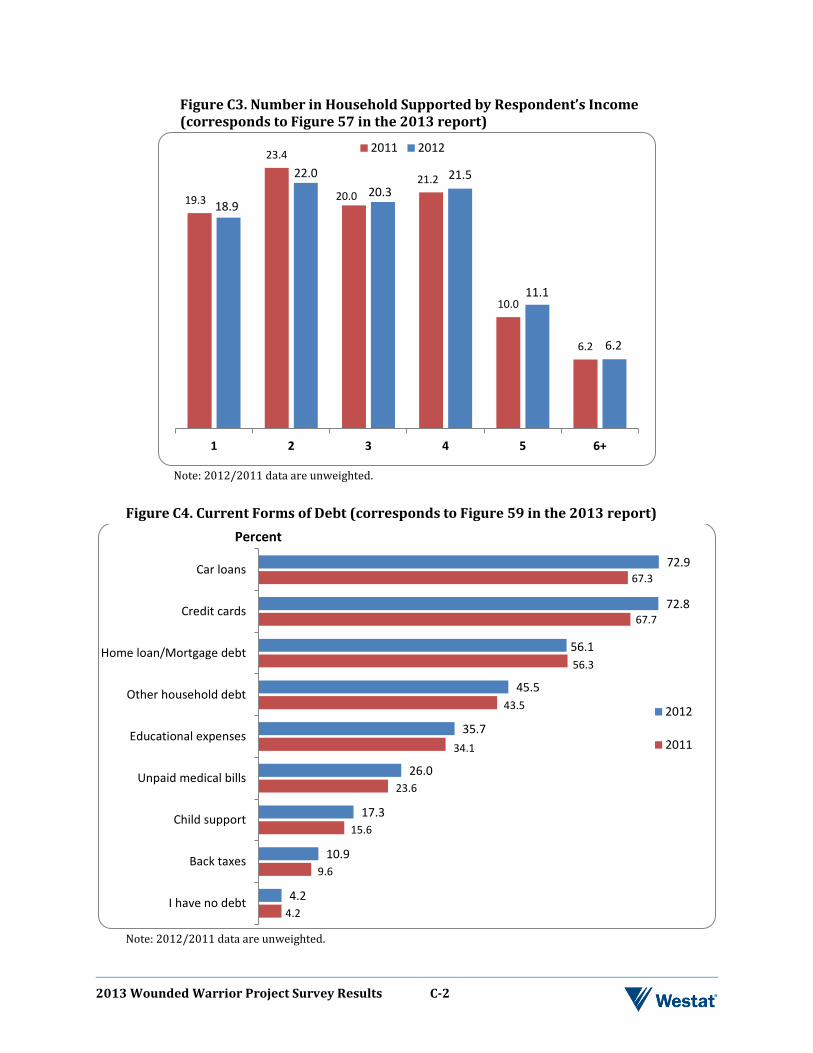
2013 Wounded Warrior Project Survey Results C-2
Figure C3. Number in Household Supported by Respondent’s Income (corresponds to Figure 57 in the 2013 report)
Note: 2012/2011 data are unweighted.
Figure C4. Current Forms of Debt (corresponds to Figure 59 in the 2013 report)
Note: 2012/2011 data are unweighted.
19.3
23.4
20.0 21.2
10.0
6.2
18.9
22.0 20.3
21.5
11.1
6.2
1 2 3 4 5 6+
2011 2012
4.2
9.6
15.6
23.6
34.1
43.5
56.3
67.7
67.3
4.2
10.9
17.3
26.0
35.7
45.5
56.1
72.8
72.9
I have no debt
Back taxes
Child support
Unpaid medical bills
Educational expenses
Other household debt
Home loan/Mortgage debt
Credit cards
Car loans
Percent
2012
2011
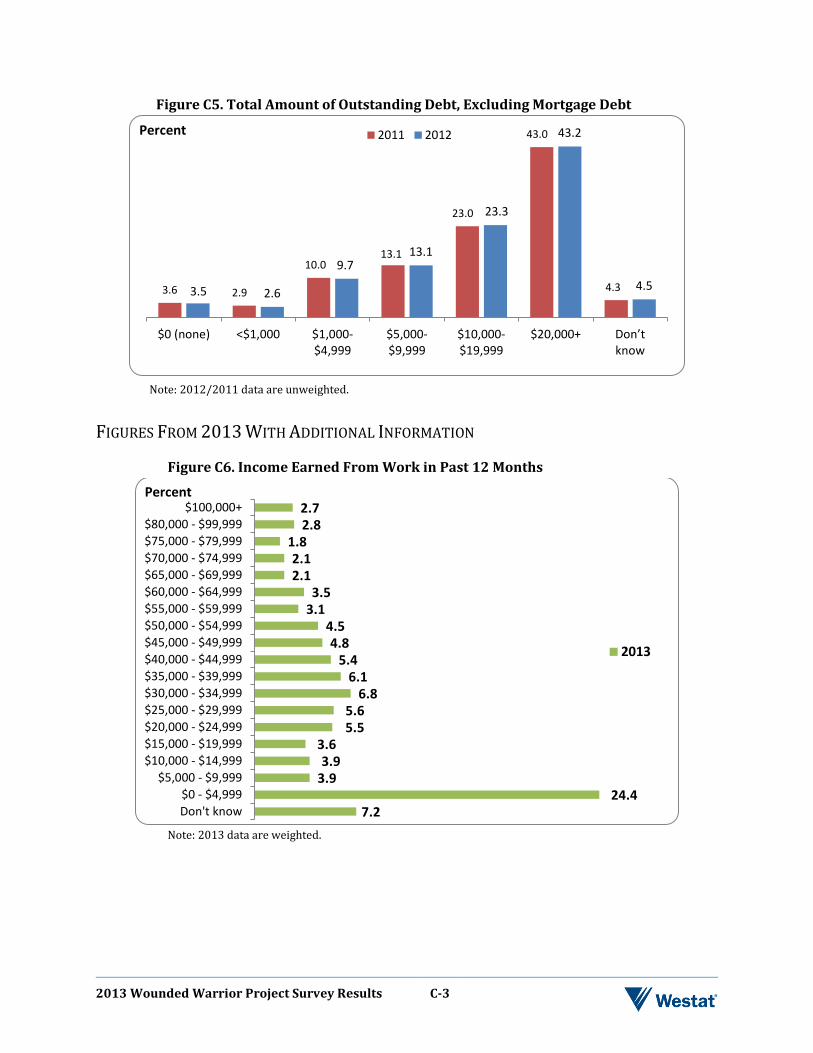
2013 Wounded Warrior Project Survey Results C-3
Figure C5. Total Amount of Outstanding Debt, Excluding Mortgage Debt
Note: 2012/2011 data are unweighted.
FIGURES FROM 2013 WITH ADDITIONAL INFORMATION
Figure C6. Income Earned From Work in Past 12 Months
Note: 2013 data are weighted.
3.6 2.9
10.0 13.1
23.0
43.0
4.3 3.5 2.6
9.7 13.1
23.3
43.2
4.5
$0 (none) <$1,000 $1,000-$4,999
$5,000-$9,999
$10,000-$19,999
$20,000+ Don’t know
2011 2012Percent
7.2 24.4
3.9 3.9
3.6 5.5 5.6
6.8 6.1
5.4 4.8
4.5 3.1 3.5
2.1 2.1
1.8 2.8 2.7
Don't know$0 - $4,999
$5,000 - $9,999$10,000 - $14,999$15,000 - $19,999$20,000 - $24,999$25,000 - $29,999$30,000 - $34,999$35,000 - $39,999$40,000 - $44,999$45,000 - $49,999$50,000 - $54,999$55,000 - $59,999$60,000 - $64,999$65,000 - $69,999$70,000 - $74,999$75,000 - $79,999$80,000 - $99,999
$100,000+
2013
Percent
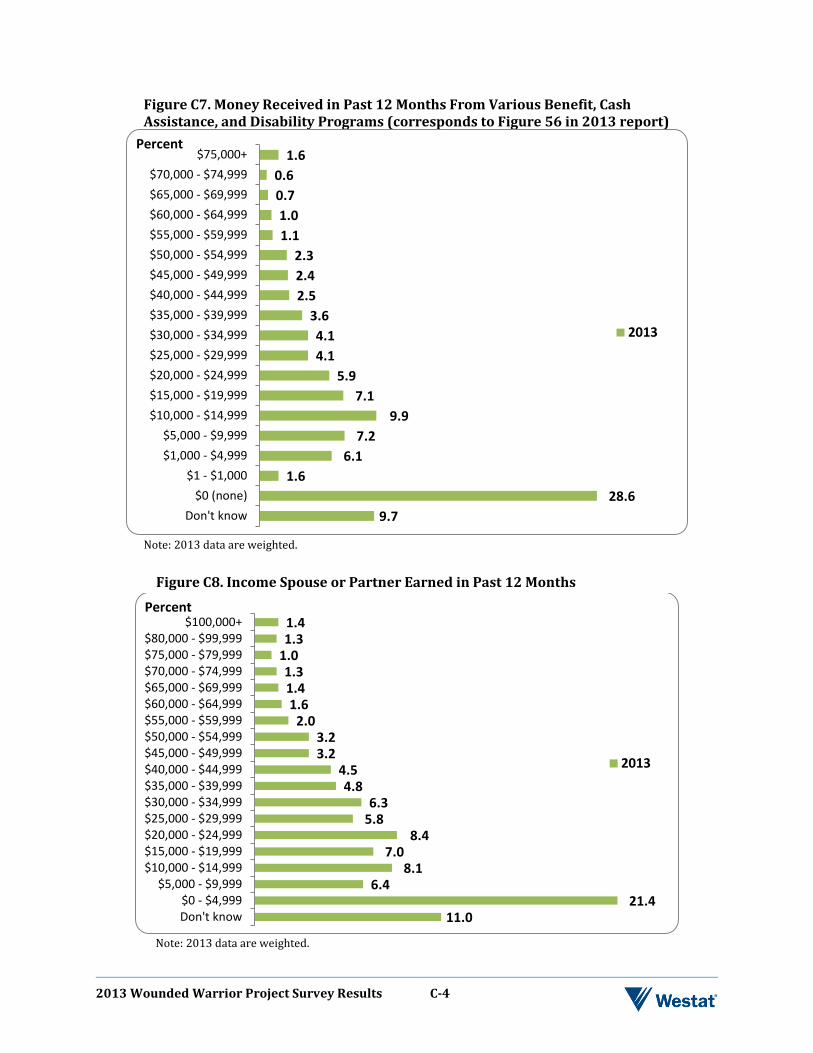
2013 Wounded Warrior Project Survey Results C-4
Figure C7. Money Received in Past 12 Months From Various Benefit, Cash Assistance, and Disability Programs (corresponds to Figure 56 in 2013 report)
Note: 2013 data are weighted.
Figure C8. Income Spouse or Partner Earned in Past 12 Months
Note: 2013 data are weighted.
9.7 28.6
1.6 6.1
7.2 9.9
7.1 5.9
4.1 4.1
3.6 2.5 2.4 2.3
1.1 1.0
0.7 0.6
1.6
Don't know$0 (none)
$1 - $1,000$1,000 - $4,999$5,000 - $9,999
$10,000 - $14,999$15,000 - $19,999$20,000 - $24,999$25,000 - $29,999$30,000 - $34,999$35,000 - $39,999$40,000 - $44,999$45,000 - $49,999$50,000 - $54,999$55,000 - $59,999$60,000 - $64,999$65,000 - $69,999$70,000 - $74,999
$75,000+
2013
Percent
11.0 21.4
6.4 8.1
7.0 8.4
5.8 6.3
4.8 4.5
3.2 3.2
2.0 1.6
1.4 1.3
1.0 1.3 1.4
Don't know$0 - $4,999
$5,000 - $9,999$10,000 - $14,999$15,000 - $19,999$20,000 - $24,999$25,000 - $29,999$30,000 - $34,999$35,000 - $39,999$40,000 - $44,999$45,000 - $49,999$50,000 - $54,999$55,000 - $59,999$60,000 - $64,999$65,000 - $69,999$70,000 - $74,999$75,000 - $79,999$80,000 - $99,999
$100,000+
2013
Percent